Zip Codes with the Highest Percentage of Population Employed in Food Preparation & Serving in Peoria, IL
RELATED REPORTS & OPTIONS
Food Preparation & Serving
Peoria
Compare Zip Codes
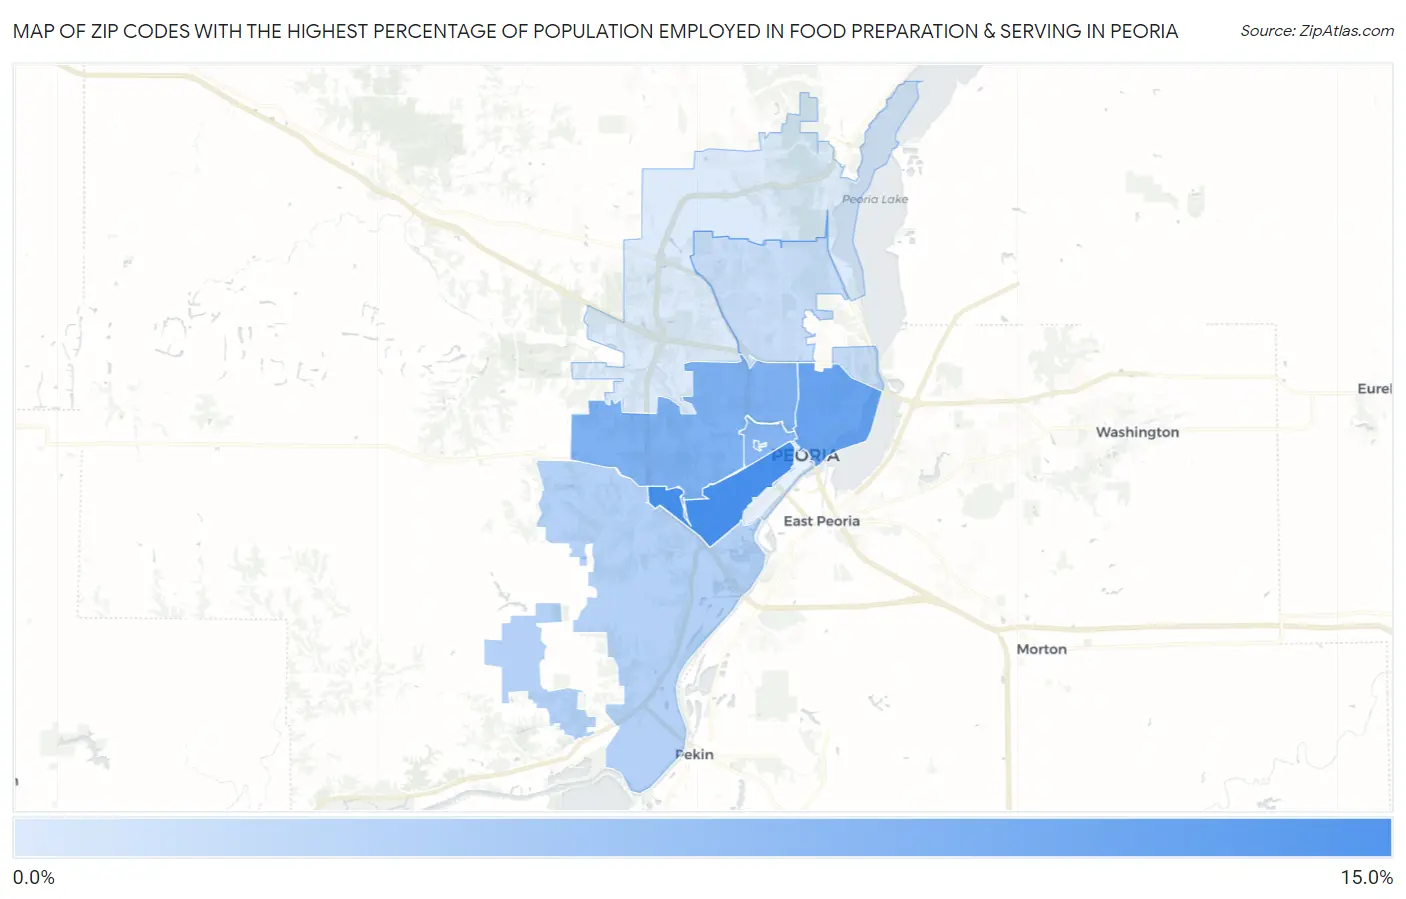
Map of Zip Codes with the Highest Percentage of Population Employed in Food Preparation & Serving in Peoria
3.1%
14.3%
Zip Codes with the Highest Percentage of Population Employed in Food Preparation & Serving in Peoria, IL
| Zip Code | % Employed | vs State | vs National | |
| 1. | 61605 | 14.3% | 5.0%(+9.23)#38 | 5.3%(+8.98)#1,109 |
| 2. | 61603 | 11.6% | 5.0%(+6.60)#73 | 5.3%(+6.35)#1,803 |
| 3. | 61604 | 10.0% | 5.0%(+4.92)#104 | 5.3%(+4.67)#2,666 |
| 4. | 61606 | 9.5% | 5.0%(+4.46)#124 | 5.3%(+4.21)#3,054 |
| 5. | 61625 | 8.6% | 5.0%(+3.57)#163 | 5.3%(+3.32)#3,955 |
| 6. | 61607 | 6.1% | 5.0%(+1.02)#383 | 5.3%(+0.770)#9,157 |
| 7. | 61614 | 4.5% | 5.0%(-0.509)#644 | 5.3%(-0.760)#14,915 |
| 8. | 61615 | 3.1% | 5.0%(-1.98)#918 | 5.3%(-2.24)#21,060 |
1
Common Questions
What are the Top 5 Zip Codes with the Highest Percentage of Population Employed in Food Preparation & Serving in Peoria, IL?
Top 5 Zip Codes with the Highest Percentage of Population Employed in Food Preparation & Serving in Peoria, IL are:
What zip code has the Highest Percentage of Population Employed in Food Preparation & Serving in Peoria, IL?
61605 has the Highest Percentage of Population Employed in Food Preparation & Serving in Peoria, IL with 14.3%.
What is the Percentage of Population Employed in Food Preparation & Serving in Peoria, IL?
Percentage of Population Employed in Food Preparation & Serving in Peoria is 6.9%.
What is the Percentage of Population Employed in Food Preparation & Serving in Illinois?
Percentage of Population Employed in Food Preparation & Serving in Illinois is 5.0%.
What is the Percentage of Population Employed in Food Preparation & Serving in the United States?
Percentage of Population Employed in Food Preparation & Serving in the United States is 5.3%.