Zip Codes with the Highest Percentage of Population with a Degree in Arts and Humanities in Peoria, IL
RELATED REPORTS & OPTIONS
Arts and Humanities
Peoria
Compare Zip Codes
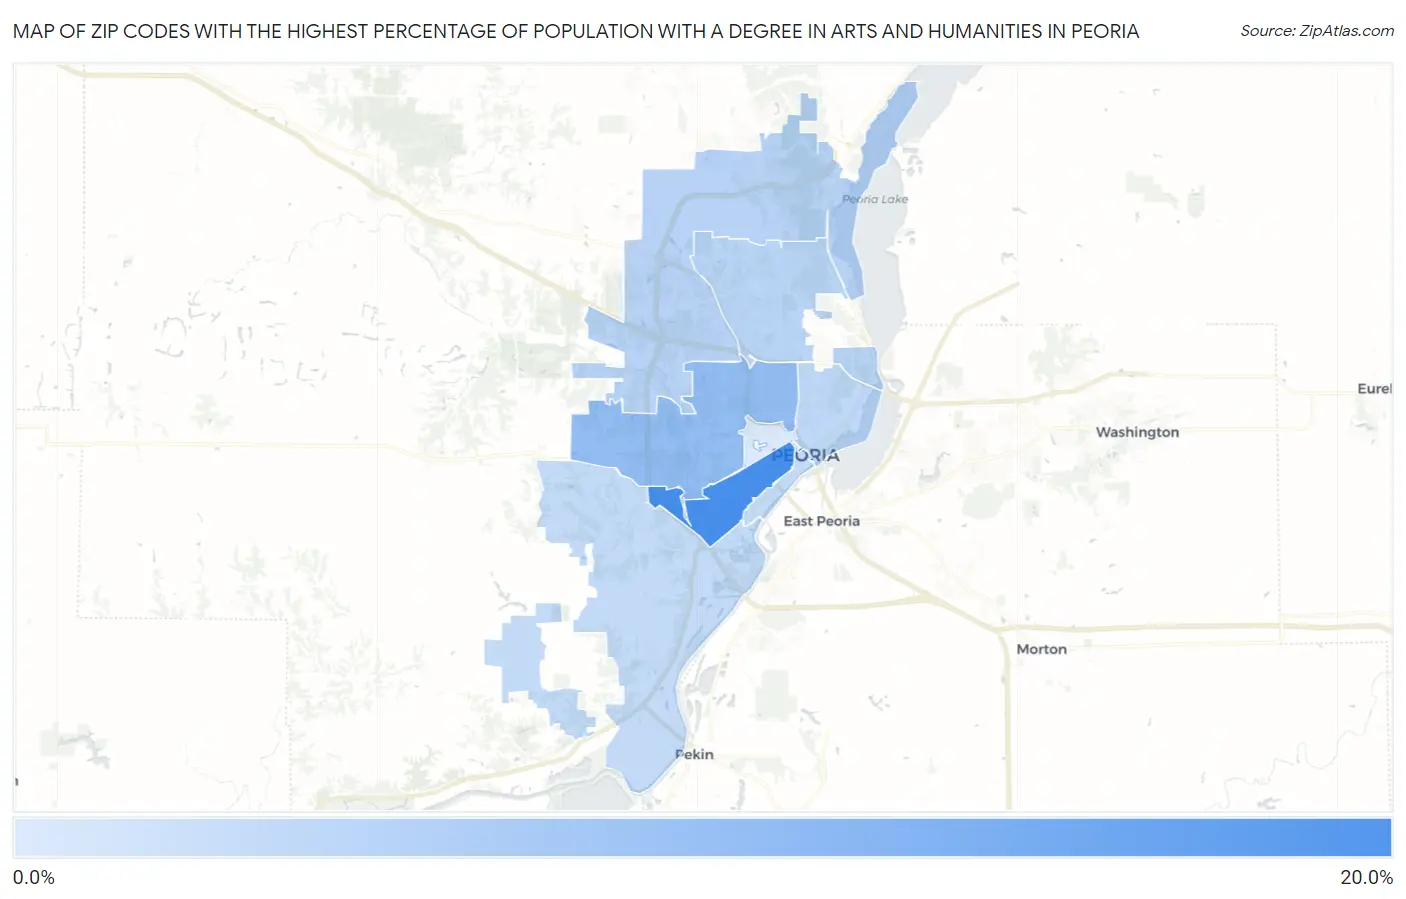
Map of Zip Codes with the Highest Percentage of Population with a Degree in Arts and Humanities in Peoria
1.5%
16.6%
Zip Codes with the Highest Percentage of Population with a Degree in Arts and Humanities in Peoria, IL
| Zip Code | % Graduates | vs State | vs National | |
| 1. | 61605 | 16.6% | 5.5%(+11.1)#115 | 6.0%(+10.6)#2,188 |
| 2. | 61604 | 8.6% | 5.5%(+3.08)#405 | 6.0%(+2.58)#8,475 |
| 3. | 61615 | 5.1% | 5.5%(-0.411)#729 | 6.0%(-0.913)#17,349 |
| 4. | 61614 | 4.9% | 5.5%(-0.596)#754 | 6.0%(-1.10)#17,900 |
| 5. | 61603 | 4.3% | 5.5%(-1.20)#823 | 6.0%(-1.70)#19,575 |
| 6. | 61602 | 3.9% | 5.5%(-1.58)#874 | 6.0%(-2.09)#20,581 |
| 7. | 61607 | 3.9% | 5.5%(-1.63)#883 | 6.0%(-2.14)#20,686 |
| 8. | 61606 | 1.5% | 5.5%(-3.99)#1,075 | 6.0%(-4.49)#24,954 |
1
Common Questions
What are the Top 5 Zip Codes with the Highest Percentage of Population with a Degree in Arts and Humanities in Peoria, IL?
Top 5 Zip Codes with the Highest Percentage of Population with a Degree in Arts and Humanities in Peoria, IL are:
What zip code has the Highest Percentage of Population with a Degree in Arts and Humanities in Peoria, IL?
61605 has the Highest Percentage of Population with a Degree in Arts and Humanities in Peoria, IL with 16.6%.
What is the Percentage of Population with a Degree in Arts and Humanities in Peoria, IL?
Percentage of Population with a Degree in Arts and Humanities in Peoria is 4.6%.
What is the Percentage of Population with a Degree in Arts and Humanities in Illinois?
Percentage of Population with a Degree in Arts and Humanities in Illinois is 5.5%.
What is the Percentage of Population with a Degree in Arts and Humanities in the United States?
Percentage of Population with a Degree in Arts and Humanities in the United States is 6.0%.