Zip Codes with the Highest Percentage of Population Employed in Security & Protection in Peoria, IL
RELATED REPORTS & OPTIONS
Security & Protection
Peoria
Compare Zip Codes
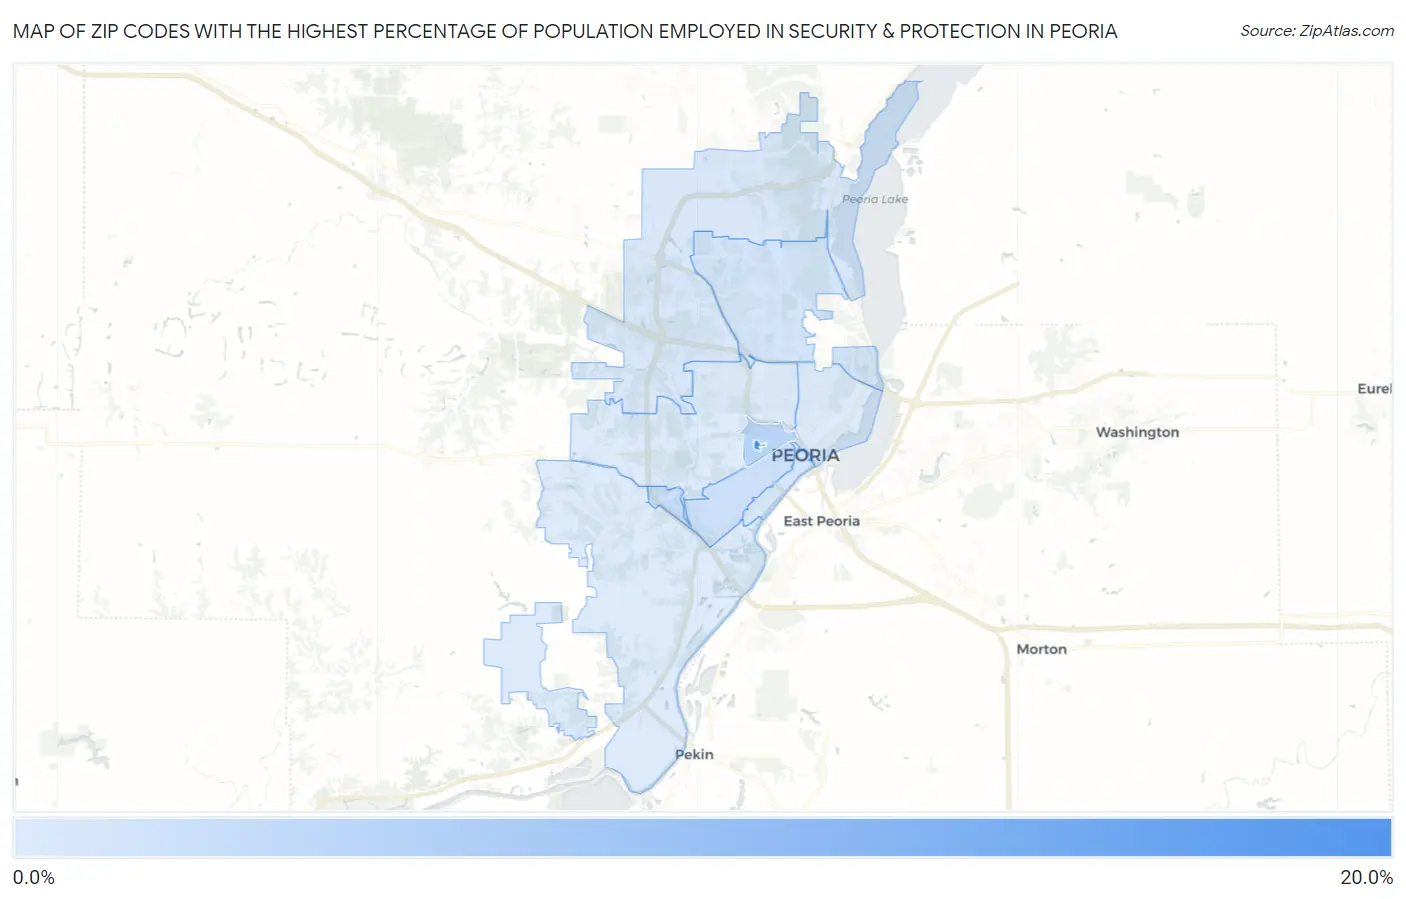
Map of Zip Codes with the Highest Percentage of Population Employed in Security & Protection in Peoria
1.5%
15.2%
Zip Codes with the Highest Percentage of Population Employed in Security & Protection in Peoria, IL
| Zip Code | % Employed | vs State | vs National | |
| 1. | 61625 | 15.2% | 2.2%(+13.0)#8 | 2.1%(+13.1)#352 |
| 2. | 61606 | 4.6% | 2.2%(+2.37)#142 | 2.1%(+2.41)#3,507 |
| 3. | 61605 | 2.8% | 2.2%(+0.638)#337 | 2.1%(+0.681)#7,976 |
| 4. | 61614 | 2.3% | 2.2%(+0.115)#448 | 2.1%(+0.159)#10,608 |
| 5. | 61602 | 2.1% | 2.2%(-0.134)#518 | 2.1%(-0.091)#12,198 |
| 6. | 61615 | 1.8% | 2.2%(-0.346)#583 | 2.1%(-0.303)#13,594 |
| 7. | 61604 | 1.6% | 2.2%(-0.599)#664 | 2.1%(-0.556)#15,467 |
| 8. | 61607 | 1.5% | 2.2%(-0.678)#695 | 2.1%(-0.634)#16,083 |
| 9. | 61603 | 1.5% | 2.2%(-0.680)#697 | 2.1%(-0.636)#16,095 |
1
Common Questions
What are the Top 5 Zip Codes with the Highest Percentage of Population Employed in Security & Protection in Peoria, IL?
Top 5 Zip Codes with the Highest Percentage of Population Employed in Security & Protection in Peoria, IL are:
What zip code has the Highest Percentage of Population Employed in Security & Protection in Peoria, IL?
61625 has the Highest Percentage of Population Employed in Security & Protection in Peoria, IL with 15.2%.
What is the Percentage of Population Employed in Security & Protection in Peoria, IL?
Percentage of Population Employed in Security & Protection in Peoria is 2.1%.
What is the Percentage of Population Employed in Security & Protection in Illinois?
Percentage of Population Employed in Security & Protection in Illinois is 2.2%.
What is the Percentage of Population Employed in Security & Protection in the United States?
Percentage of Population Employed in Security & Protection in the United States is 2.1%.