Zip Codes with the Highest Percentage of Local Government Employees in Peoria, IL
RELATED REPORTS & OPTIONS
Local Government Employees
Peoria
Compare Zip Codes
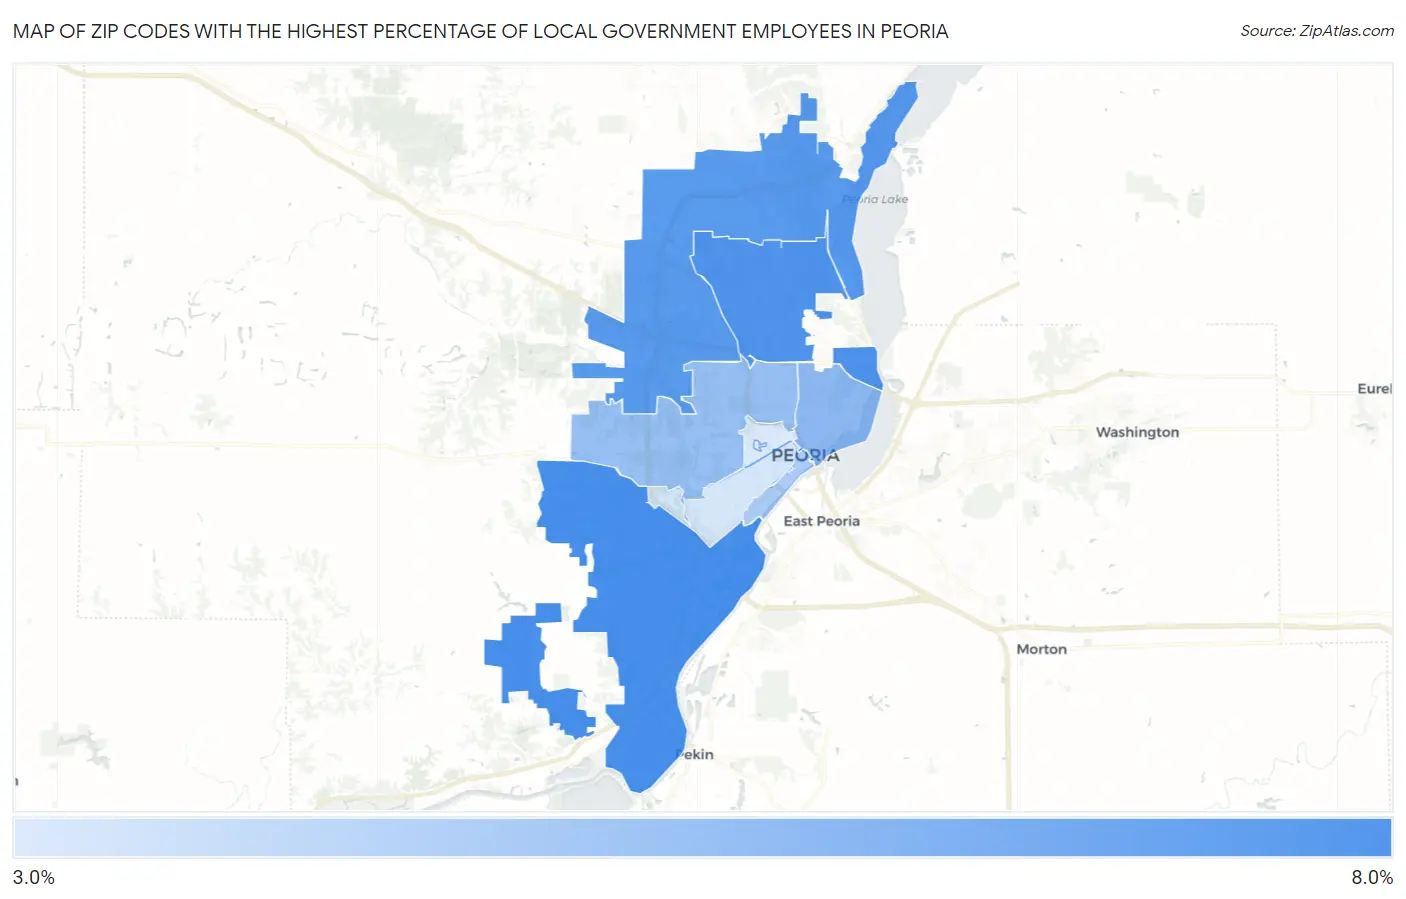
Map of Zip Codes with the Highest Percentage of Local Government Employees in Peoria
3.9%
6.9%
Zip Codes with the Highest Percentage of Local Government Employees in Peoria, IL
| Zip Code | % Local Government Employees | vs State | vs National | |
| 1. | 61607 | 6.9% | 7.4%(-0.454)#699 | 7.2%(-0.311)#16,644 |
| 2. | 61614 | 6.8% | 7.4%(-0.591)#718 | 7.2%(-0.449)#17,135 |
| 3. | 61615 | 6.6% | 7.4%(-0.776)#749 | 7.2%(-0.634)#17,784 |
| 4. | 61603 | 5.5% | 7.4%(-1.88)#914 | 7.2%(-1.74)#21,532 |
| 5. | 61604 | 5.2% | 7.4%(-2.12)#954 | 7.2%(-1.98)#22,285 |
| 6. | 61602 | 4.9% | 7.4%(-2.50)#1,010 | 7.2%(-2.36)#23,430 |
| 7. | 61605 | 4.0% | 7.4%(-3.37)#1,113 | 7.2%(-3.23)#25,703 |
| 8. | 61606 | 3.9% | 7.4%(-3.50)#1,127 | 7.2%(-3.36)#25,999 |
1
Common Questions
What are the Top 5 Zip Codes with the Highest Percentage of Local Government Employees in Peoria, IL?
Top 5 Zip Codes with the Highest Percentage of Local Government Employees in Peoria, IL are:
What zip code has the Highest Percentage of Local Government Employees in Peoria, IL?
61607 has the Highest Percentage of Local Government Employees in Peoria, IL with 6.9%.
What is the Percentage of Local Government Employees in Peoria, IL?
Percentage of Local Government Employees in Peoria is 5.6%.
What is the Percentage of Local Government Employees in Illinois?
Percentage of Local Government Employees in Illinois is 7.4%.
What is the Percentage of Local Government Employees in the United States?
Percentage of Local Government Employees in the United States is 7.2%.