Zip Codes with the Highest Percentage of Population Employed in Architecture & Engineering in Peoria, IL
RELATED REPORTS & OPTIONS
Architecture & Engineering
Peoria
Compare Zip Codes
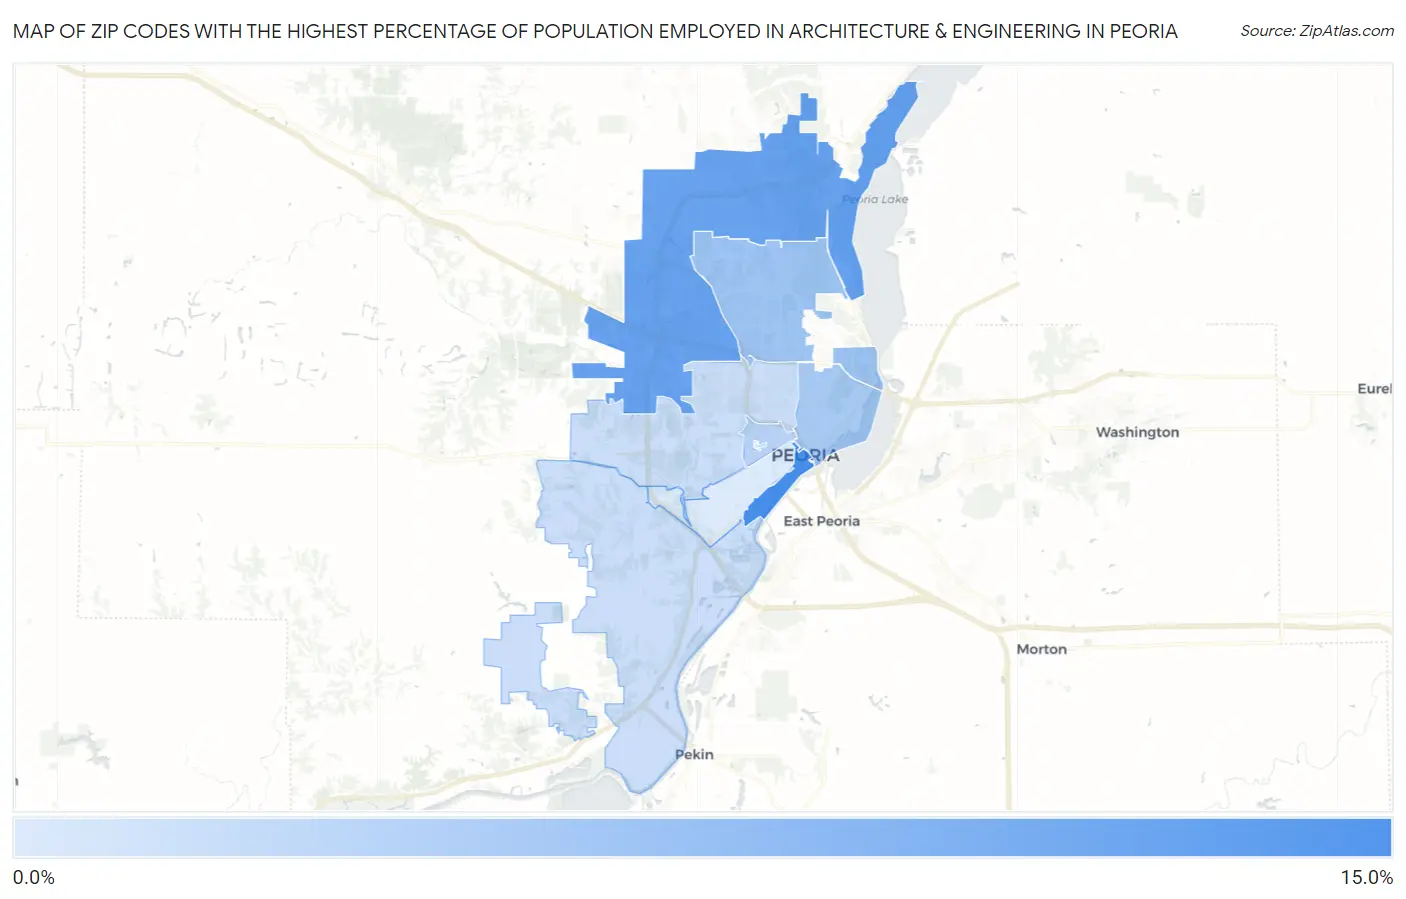
Map of Zip Codes with the Highest Percentage of Population Employed in Architecture & Engineering in Peoria
0.17%
10.3%
Zip Codes with the Highest Percentage of Population Employed in Architecture & Engineering in Peoria, IL
| Zip Code | % Employed | vs State | vs National | |
| 1. | 61602 | 10.3% | 1.9%(+8.39)#12 | 2.1%(+8.14)#324 |
| 2. | 61615 | 8.1% | 1.9%(+6.17)#17 | 2.1%(+5.91)#562 |
| 3. | 61614 | 4.2% | 1.9%(+2.34)#81 | 2.1%(+2.08)#2,458 |
| 4. | 61603 | 3.6% | 1.9%(+1.67)#125 | 2.1%(+1.42)#3,579 |
| 5. | 61606 | 2.5% | 1.9%(+0.642)#266 | 2.1%(+0.387)#6,850 |
| 6. | 61604 | 1.4% | 1.9%(-0.528)#581 | 2.1%(-0.783)#13,836 |
| 7. | 61607 | 1.3% | 1.9%(-0.572)#595 | 2.1%(-0.827)#14,170 |
| 8. | 61605 | 0.17% | 1.9%(-1.72)#979 | 2.1%(-1.98)#22,169 |
1
Common Questions
What are the Top 5 Zip Codes with the Highest Percentage of Population Employed in Architecture & Engineering in Peoria, IL?
Top 5 Zip Codes with the Highest Percentage of Population Employed in Architecture & Engineering in Peoria, IL are:
What zip code has the Highest Percentage of Population Employed in Architecture & Engineering in Peoria, IL?
61602 has the Highest Percentage of Population Employed in Architecture & Engineering in Peoria, IL with 10.3%.
What is the Percentage of Population Employed in Architecture & Engineering in Peoria, IL?
Percentage of Population Employed in Architecture & Engineering in Peoria is 5.3%.
What is the Percentage of Population Employed in Architecture & Engineering in Illinois?
Percentage of Population Employed in Architecture & Engineering in Illinois is 1.9%.
What is the Percentage of Population Employed in Architecture & Engineering in the United States?
Percentage of Population Employed in Architecture & Engineering in the United States is 2.1%.