Zip Codes with the Highest Percentage of Population Employed in Architecture & Engineering in Skokie, IL
RELATED REPORTS & OPTIONS
Architecture & Engineering
Skokie
Compare Zip Codes
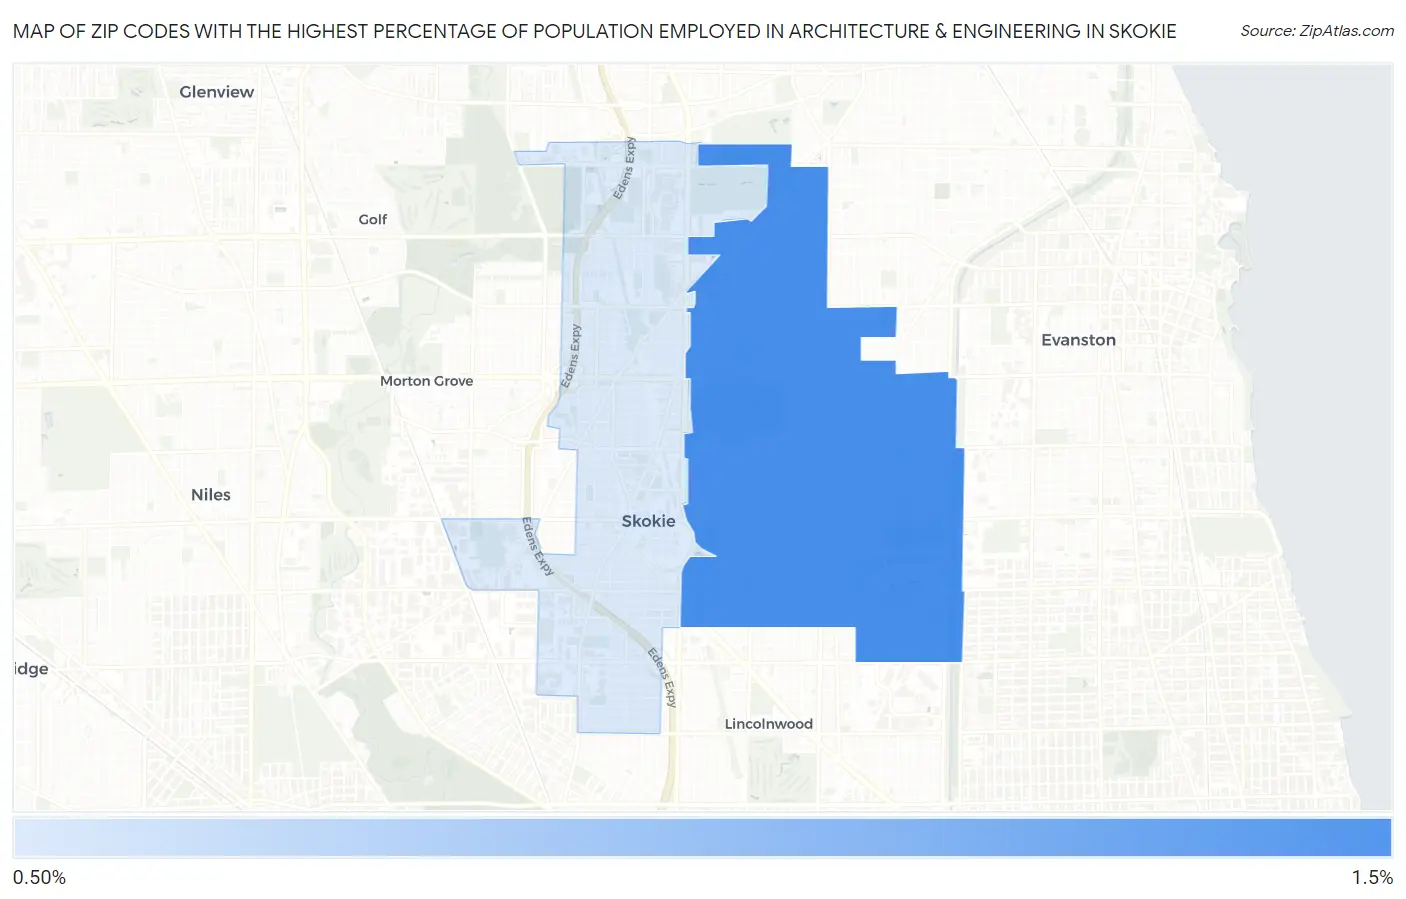
Map of Zip Codes with the Highest Percentage of Population Employed in Architecture & Engineering in Skokie
1.1%
1.3%
Zip Codes with the Highest Percentage of Population Employed in Architecture & Engineering in Skokie, IL
| Zip Code | % Employed | vs State | vs National | |
| 1. | 60076 | 1.3% | 1.9%(-0.550)#585 | 2.1%(-0.805)#13,996 |
| 2. | 60077 | 1.1% | 1.9%(-0.811)#669 | 2.1%(-1.07)#16,005 |
1
Common Questions
What are the Top Zip Codes with the Highest Percentage of Population Employed in Architecture & Engineering in Skokie, IL?
Top Zip Codes with the Highest Percentage of Population Employed in Architecture & Engineering in Skokie, IL are:
What zip code has the Highest Percentage of Population Employed in Architecture & Engineering in Skokie, IL?
60076 has the Highest Percentage of Population Employed in Architecture & Engineering in Skokie, IL with 1.3%.
What is the Percentage of Population Employed in Architecture & Engineering in Skokie, IL?
Percentage of Population Employed in Architecture & Engineering in Skokie is 1.2%.
What is the Percentage of Population Employed in Architecture & Engineering in Illinois?
Percentage of Population Employed in Architecture & Engineering in Illinois is 1.9%.
What is the Percentage of Population Employed in Architecture & Engineering in the United States?
Percentage of Population Employed in Architecture & Engineering in the United States is 2.1%.