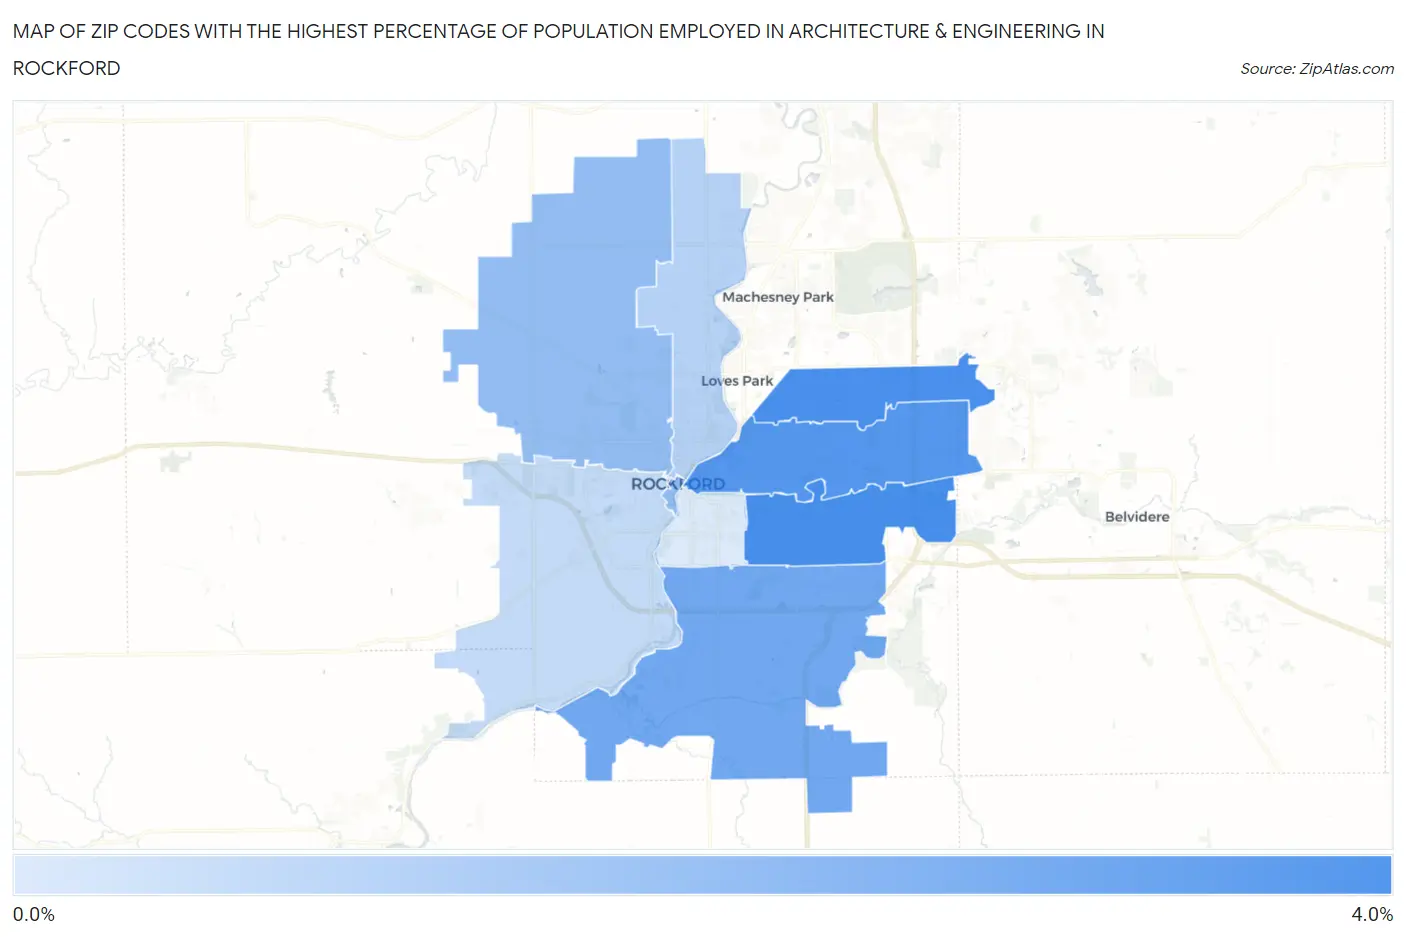
Zip Codes with the Highest Percentage of Population Employed in Architecture & Engineering in Rockford, IL
RELATED REPORTS & OPTIONS
Architecture & Engineering
Rockford
Compare Zip Codes
Map of Zip Codes with the Highest Percentage of Population Employed in Architecture & Engineering in Rockford
0.28%
3.3%
Zip Codes with the Highest Percentage of Population Employed in Architecture & Engineering in Rockford, IL
| Zip Code | % Employed | vs State | vs National | |
| 1. | 61108 | 3.3% | 1.9%(+1.44)#150 | 2.1%(+1.18)#4,113 |
| 2. | 61114 | 3.3% | 1.9%(+1.37)#158 | 2.1%(+1.12)#4,279 |
| 3. | 61107 | 3.0% | 1.9%(+1.14)#186 | 2.1%(+0.883)#4,952 |
| 4. | 61109 | 2.5% | 1.9%(+0.592)#270 | 2.1%(+0.337)#7,062 |
| 5. | 61101 | 1.8% | 1.9%(-0.126)#464 | 2.1%(-0.381)#11,016 |
| 6. | 61103 | 1.1% | 1.9%(-0.836)#684 | 2.1%(-1.09)#16,187 |
| 7. | 61102 | 0.79% | 1.9%(-1.10)#785 | 2.1%(-1.36)#18,200 |
| 8. | 61104 | 0.28% | 1.9%(-1.62)#953 | 2.1%(-1.87)#21,674 |
1
Common Questions
What are the Top 5 Zip Codes with the Highest Percentage of Population Employed in Architecture & Engineering in Rockford, IL?
Top 5 Zip Codes with the Highest Percentage of Population Employed in Architecture & Engineering in Rockford, IL are:
What zip code has the Highest Percentage of Population Employed in Architecture & Engineering in Rockford, IL?
61108 has the Highest Percentage of Population Employed in Architecture & Engineering in Rockford, IL with 3.3%.
What is the Percentage of Population Employed in Architecture & Engineering in Rockford, IL?
Percentage of Population Employed in Architecture & Engineering in Rockford is 1.9%.
What is the Percentage of Population Employed in Architecture & Engineering in Illinois?
Percentage of Population Employed in Architecture & Engineering in Illinois is 1.9%.
What is the Percentage of Population Employed in Architecture & Engineering in the United States?
Percentage of Population Employed in Architecture & Engineering in the United States is 2.1%.