Zip Codes with the Highest Percentage of Population Employed in Architecture & Engineering in Crystal Lake, IL
RELATED REPORTS & OPTIONS
Architecture & Engineering
Crystal Lake
Compare Zip Codes
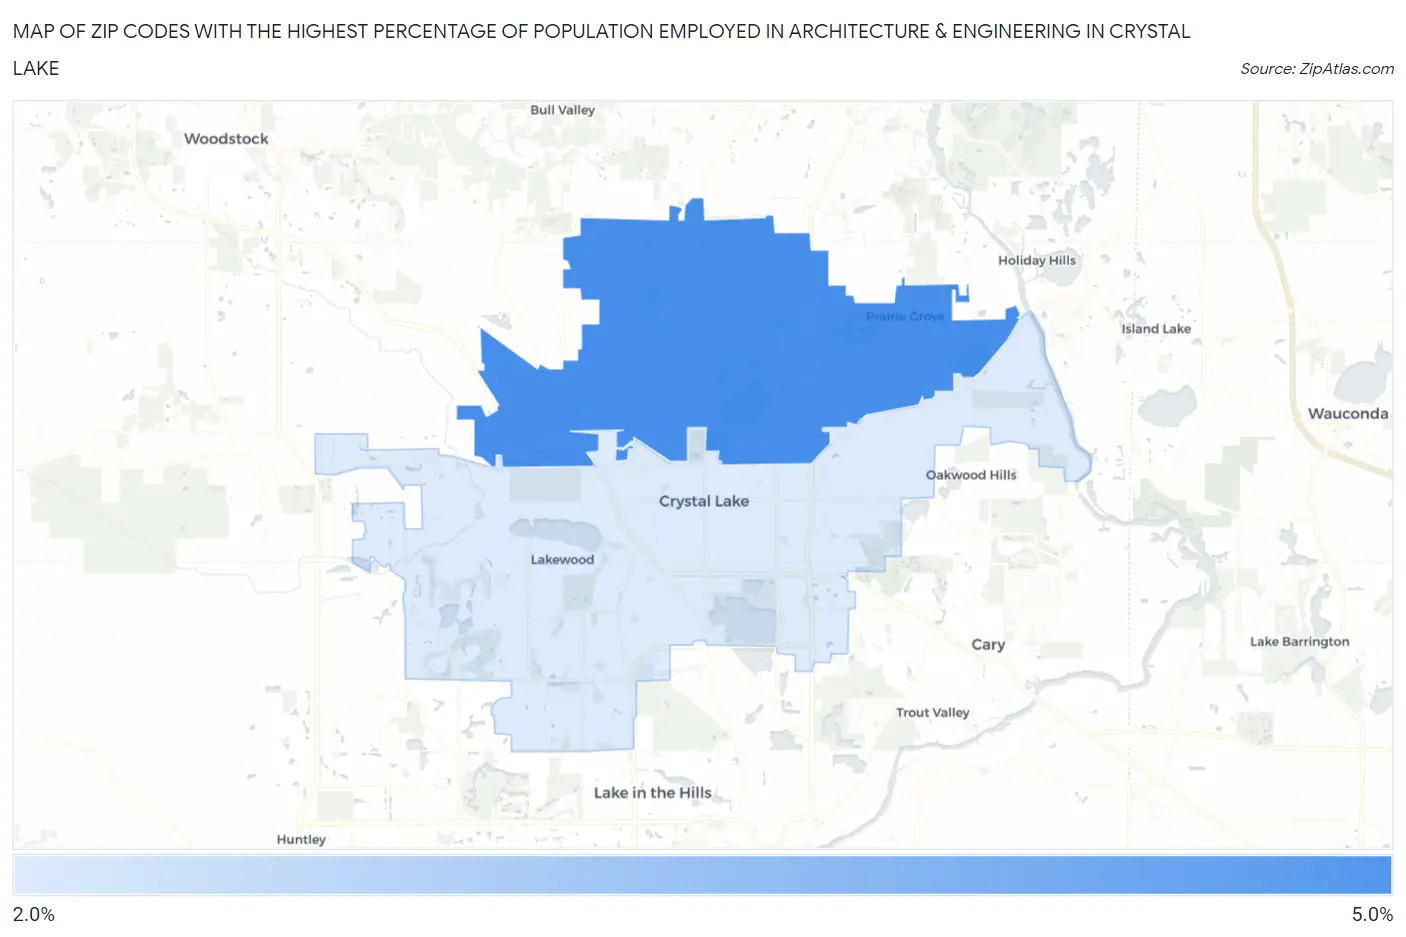
Map of Zip Codes with the Highest Percentage of Population Employed in Architecture & Engineering in Crystal Lake
2.2%
4.8%
Zip Codes with the Highest Percentage of Population Employed in Architecture & Engineering in Crystal Lake, IL
| Zip Code | % Employed | vs State | vs National | |
| 1. | 60012 | 4.8% | 1.9%(+2.86)#62 | 2.1%(+2.60)#1,875 |
| 2. | 60014 | 2.2% | 1.9%(+0.272)#341 | 2.1%(+0.017)#8,675 |
1
Common Questions
What are the Top Zip Codes with the Highest Percentage of Population Employed in Architecture & Engineering in Crystal Lake, IL?
Top Zip Codes with the Highest Percentage of Population Employed in Architecture & Engineering in Crystal Lake, IL are:
What zip code has the Highest Percentage of Population Employed in Architecture & Engineering in Crystal Lake, IL?
60012 has the Highest Percentage of Population Employed in Architecture & Engineering in Crystal Lake, IL with 4.8%.
What is the Percentage of Population Employed in Architecture & Engineering in Crystal Lake, IL?
Percentage of Population Employed in Architecture & Engineering in Crystal Lake is 1.6%.
What is the Percentage of Population Employed in Architecture & Engineering in Illinois?
Percentage of Population Employed in Architecture & Engineering in Illinois is 1.9%.
What is the Percentage of Population Employed in Architecture & Engineering in the United States?
Percentage of Population Employed in Architecture & Engineering in the United States is 2.1%.