Zip Codes with the Highest Percentage of Population Employed in Architecture & Engineering in Bolingbrook, IL
RELATED REPORTS & OPTIONS
Architecture & Engineering
Bolingbrook
Compare Zip Codes
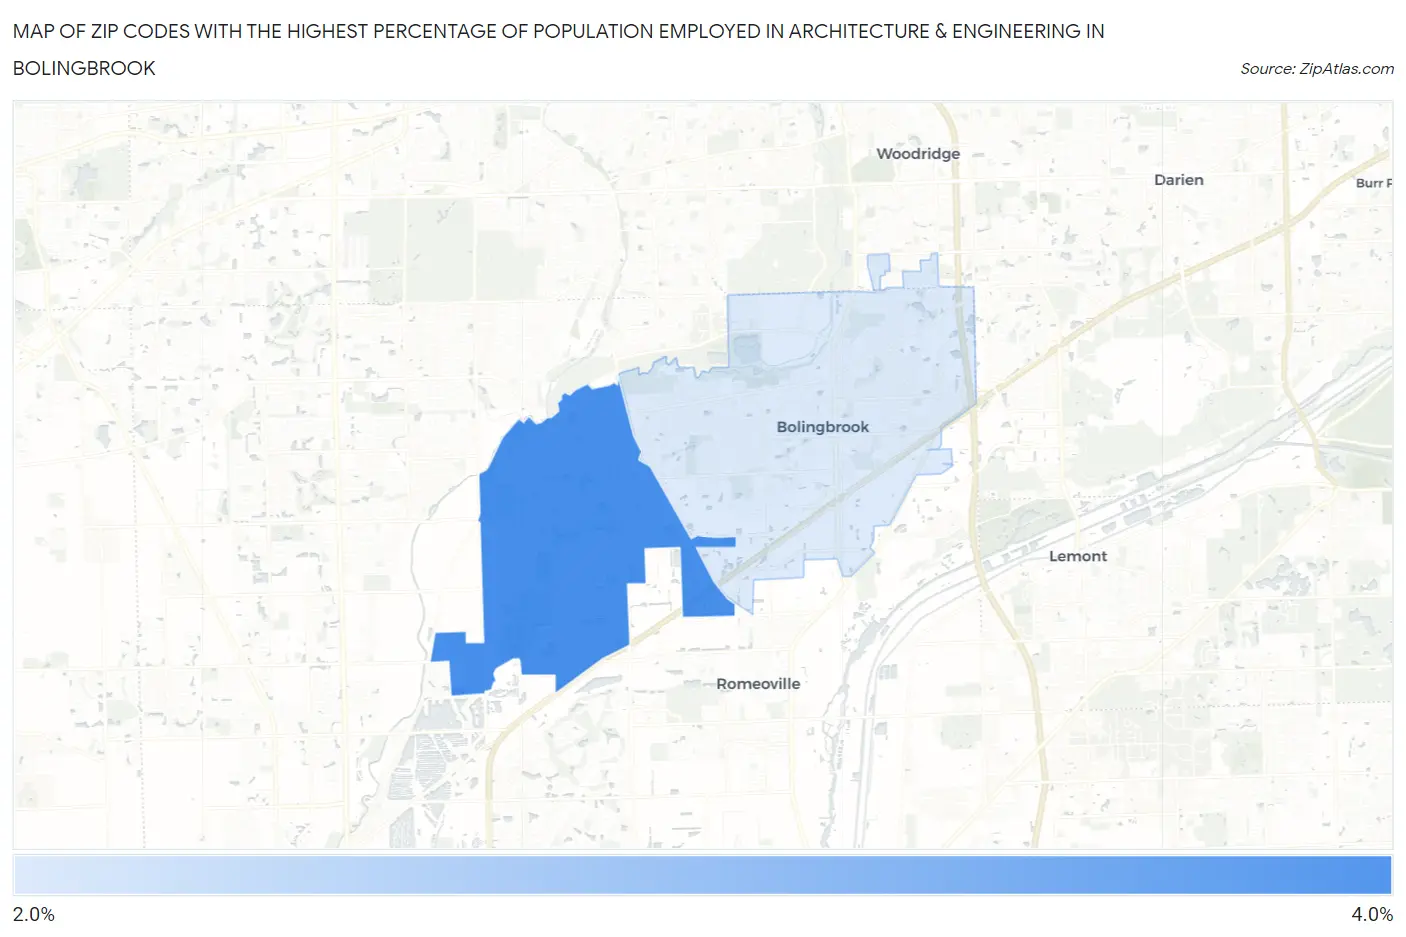
Map of Zip Codes with the Highest Percentage of Population Employed in Architecture & Engineering in Bolingbrook
2.1%
3.1%
Zip Codes with the Highest Percentage of Population Employed in Architecture & Engineering in Bolingbrook, IL
| Zip Code | % Employed | vs State | vs National | |
| 1. | 60490 | 3.1% | 1.9%(+1.17)#175 | 2.1%(+0.916)#4,829 |
| 2. | 60440 | 2.1% | 1.9%(+0.211)#361 | 2.1%(-0.044)#9,023 |
1
Common Questions
What are the Top Zip Codes with the Highest Percentage of Population Employed in Architecture & Engineering in Bolingbrook, IL?
Top Zip Codes with the Highest Percentage of Population Employed in Architecture & Engineering in Bolingbrook, IL are:
What zip code has the Highest Percentage of Population Employed in Architecture & Engineering in Bolingbrook, IL?
60490 has the Highest Percentage of Population Employed in Architecture & Engineering in Bolingbrook, IL with 3.1%.
What is the Percentage of Population Employed in Architecture & Engineering in Bolingbrook, IL?
Percentage of Population Employed in Architecture & Engineering in Bolingbrook is 2.4%.
What is the Percentage of Population Employed in Architecture & Engineering in Illinois?
Percentage of Population Employed in Architecture & Engineering in Illinois is 1.9%.
What is the Percentage of Population Employed in Architecture & Engineering in the United States?
Percentage of Population Employed in Architecture & Engineering in the United States is 2.1%.