Zip Codes with the Highest Percentage of Population Employed in Architecture & Engineering in Decatur, IL
RELATED REPORTS & OPTIONS
Architecture & Engineering
Decatur
Compare Zip Codes
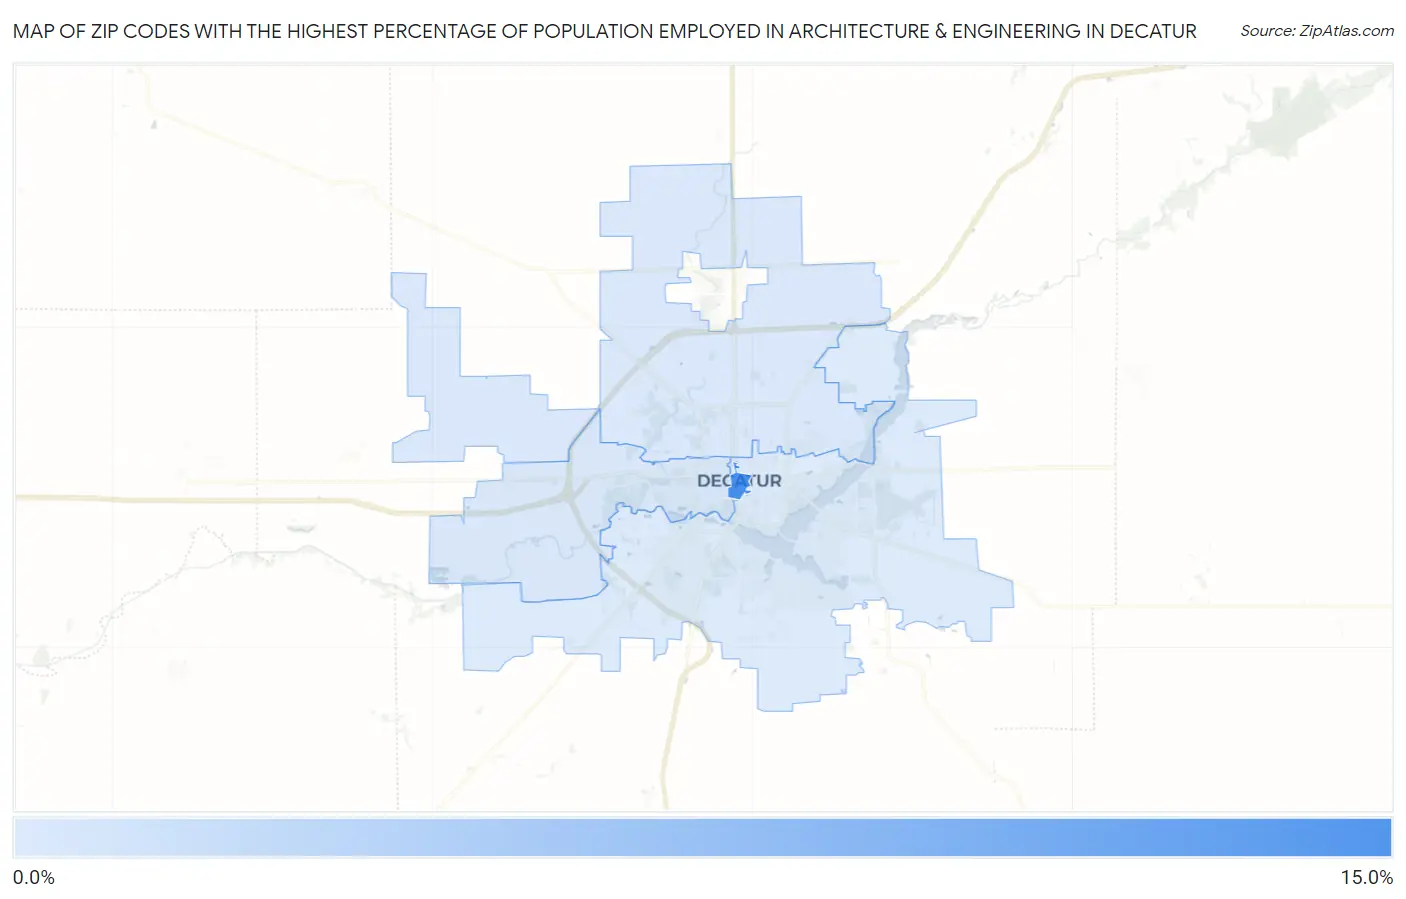
Map of Zip Codes with the Highest Percentage of Population Employed in Architecture & Engineering in Decatur
1.4%
14.3%
Zip Codes with the Highest Percentage of Population Employed in Architecture & Engineering in Decatur, IL
| Zip Code | % Employed | vs State | vs National | |
| 1. | 62523 | 14.3% | 1.9%(+12.4)#8 | 2.1%(+12.1)#163 |
| 2. | 62522 | 1.8% | 1.9%(-0.045)#436 | 2.1%(-0.300)#10,545 |
| 3. | 62526 | 1.7% | 1.9%(-0.235)#501 | 2.1%(-0.490)#11,772 |
| 4. | 62521 | 1.4% | 1.9%(-0.466)#567 | 2.1%(-0.720)#13,360 |
1
Common Questions
What are the Top 3 Zip Codes with the Highest Percentage of Population Employed in Architecture & Engineering in Decatur, IL?
Top 3 Zip Codes with the Highest Percentage of Population Employed in Architecture & Engineering in Decatur, IL are:
What zip code has the Highest Percentage of Population Employed in Architecture & Engineering in Decatur, IL?
62523 has the Highest Percentage of Population Employed in Architecture & Engineering in Decatur, IL with 14.3%.
What is the Percentage of Population Employed in Architecture & Engineering in Decatur, IL?
Percentage of Population Employed in Architecture & Engineering in Decatur is 1.5%.
What is the Percentage of Population Employed in Architecture & Engineering in Illinois?
Percentage of Population Employed in Architecture & Engineering in Illinois is 1.9%.
What is the Percentage of Population Employed in Architecture & Engineering in the United States?
Percentage of Population Employed in Architecture & Engineering in the United States is 2.1%.