Zip Codes with the Highest Percentage of Population Employed in Architecture & Engineering in Evanston, IL
RELATED REPORTS & OPTIONS
Architecture & Engineering
Evanston
Compare Zip Codes
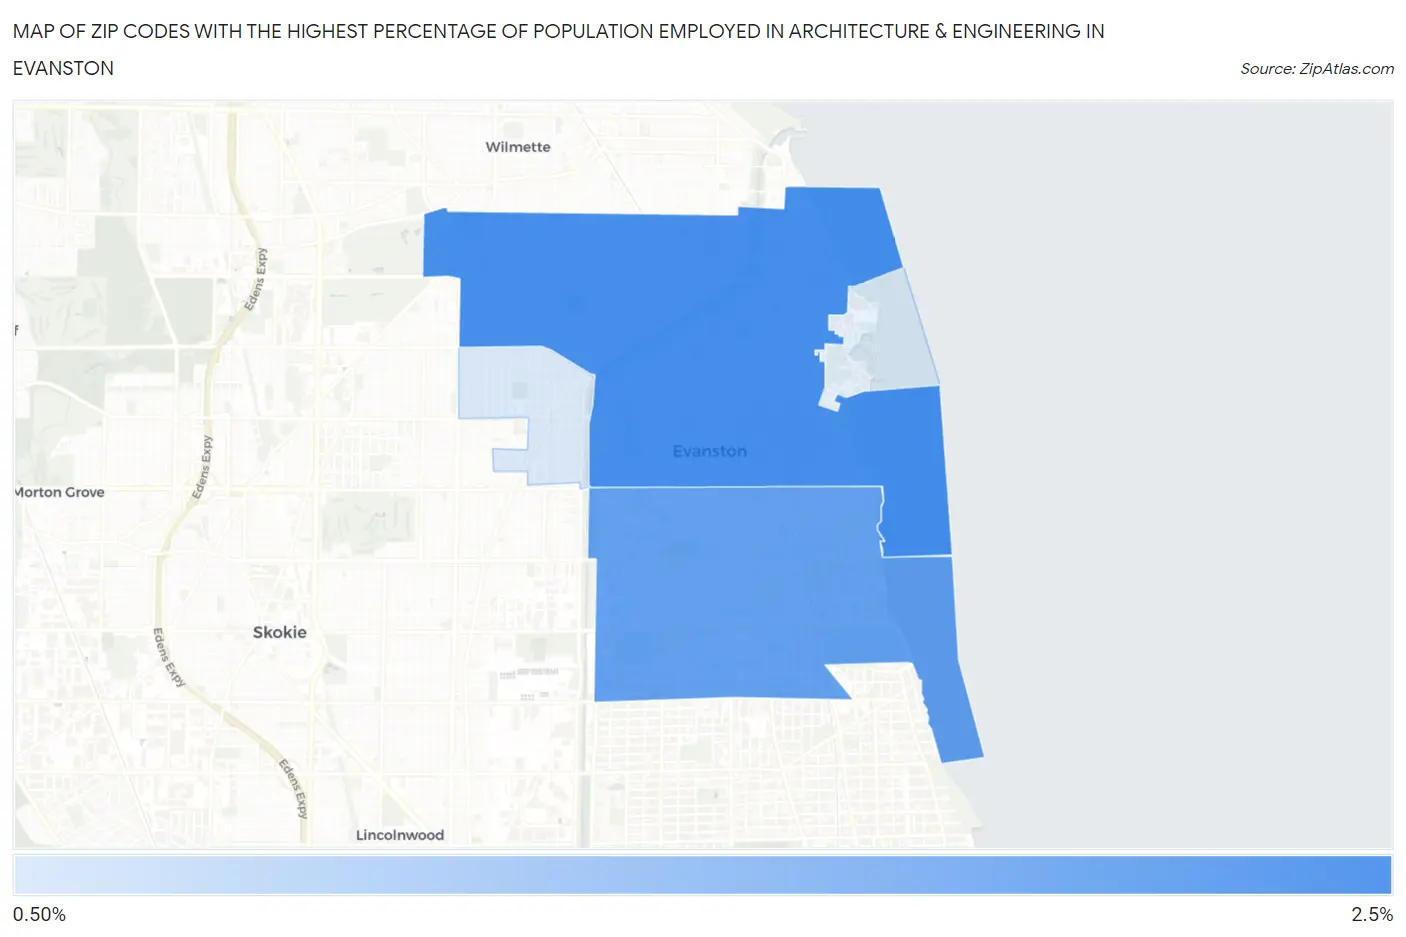
Map of Zip Codes with the Highest Percentage of Population Employed in Architecture & Engineering in Evanston
1.3%
2.1%
Zip Codes with the Highest Percentage of Population Employed in Architecture & Engineering in Evanston, IL
| Zip Code | % Employed | vs State | vs National | |
| 1. | 60201 | 2.1% | 1.9%(+0.179)#370 | 2.1%(-0.076)#9,187 |
| 2. | 60202 | 1.9% | 1.9%(+0.041)#405 | 2.1%(-0.214)#10,010 |
| 3. | 60203 | 1.3% | 1.9%(-0.545)#584 | 2.1%(-0.800)#13,963 |
1
Common Questions
What are the Top 3 Zip Codes with the Highest Percentage of Population Employed in Architecture & Engineering in Evanston, IL?
Top 3 Zip Codes with the Highest Percentage of Population Employed in Architecture & Engineering in Evanston, IL are:
What zip code has the Highest Percentage of Population Employed in Architecture & Engineering in Evanston, IL?
60201 has the Highest Percentage of Population Employed in Architecture & Engineering in Evanston, IL with 2.1%.
What is the Percentage of Population Employed in Architecture & Engineering in Evanston, IL?
Percentage of Population Employed in Architecture & Engineering in Evanston is 2.0%.
What is the Percentage of Population Employed in Architecture & Engineering in Illinois?
Percentage of Population Employed in Architecture & Engineering in Illinois is 1.9%.
What is the Percentage of Population Employed in Architecture & Engineering in the United States?
Percentage of Population Employed in Architecture & Engineering in the United States is 2.1%.