Payson, IL Map & Demographics
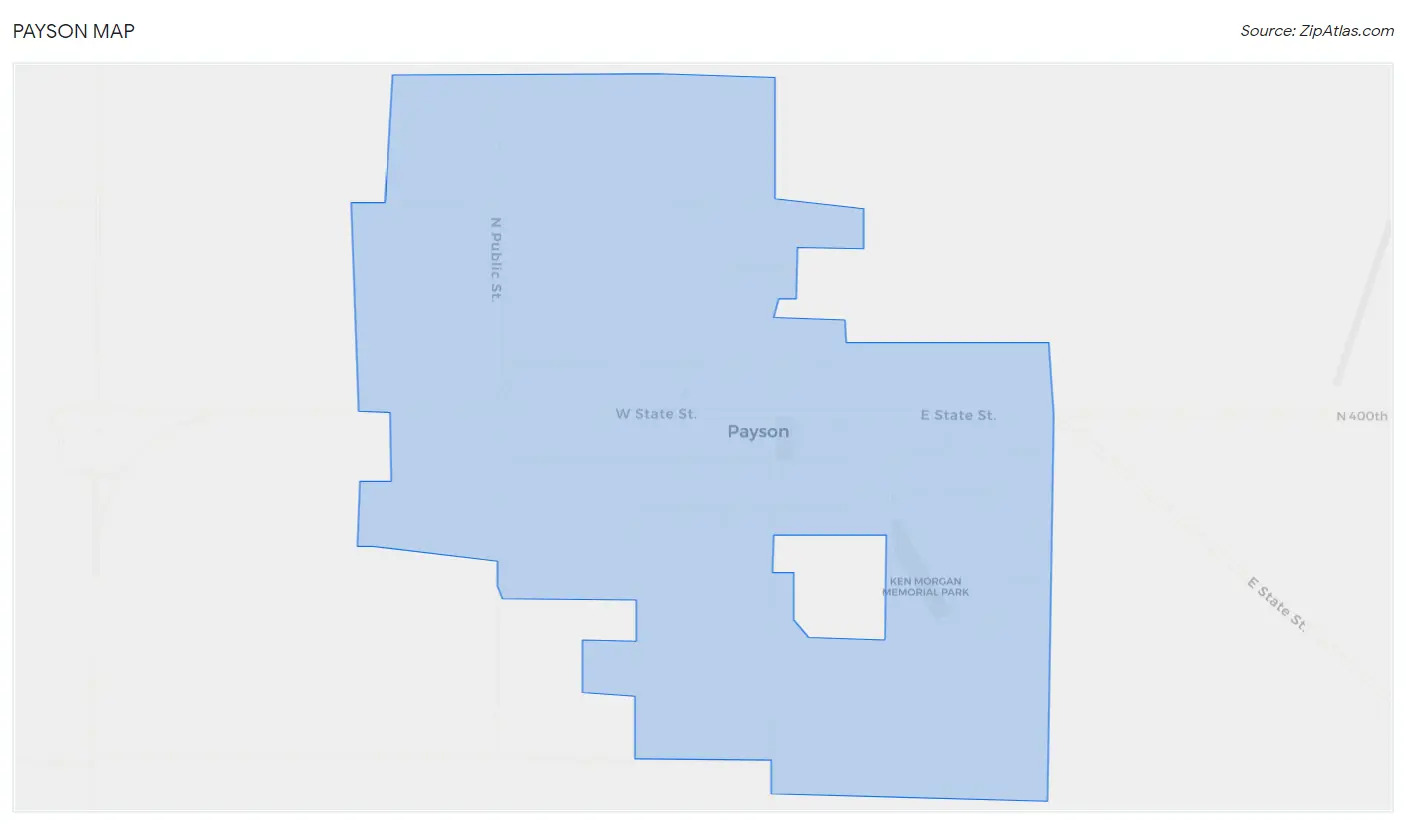
Payson Map
Payson Overview
$25,229
PER CAPITA INCOME
$68,833
AVG FAMILY INCOME
$64,313
AVG HOUSEHOLD INCOME
27.8%
WAGE / INCOME GAP [ % ]
72.2¢/ $1
WAGE / INCOME GAP [ $ ]
0.38
INEQUALITY / GINI INDEX
1,276
TOTAL POPULATION
628
MALE POPULATION
648
FEMALE POPULATION
96.91
MALES / 100 FEMALES
103.18
FEMALES / 100 MALES
26.8
MEDIAN AGE
3.8
AVG FAMILY SIZE
3.3
AVG HOUSEHOLD SIZE
626
LABOR FORCE [ PEOPLE ]
76.7%
PERCENT IN LABOR FORCE
0.6%
UNEMPLOYMENT RATE
Payson Zip Codes
Payson Area Codes
Income in Payson
Income Overview in Payson
Per Capita Income in Payson is $25,229, while median incomes of families and households are $68,833 and $64,313 respectively.
| Characteristic | Number | Measure |
| Per Capita Income | 1,276 | $25,229 |
| Median Family Income | 292 | $68,833 |
| Mean Family Income | 292 | $88,226 |
| Median Household Income | 391 | $64,313 |
| Mean Household Income | 391 | $80,587 |
| Income Deficit | 292 | $0 |
| Wage / Income Gap (%) | 1,276 | 27.83% |
| Wage / Income Gap ($) | 1,276 | 72.17¢ per $1 |
| Gini / Inequality Index | 1,276 | 0.38 |
Earnings by Sex in Payson
Average Earnings in Payson are $36,655, $42,500 for men and $30,673 for women, a difference of 27.8%.
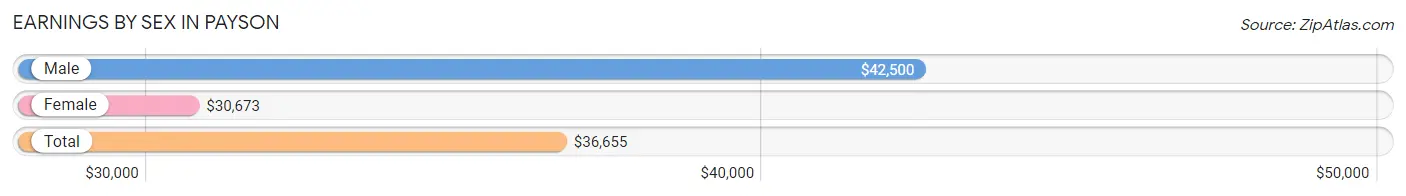
| Sex | Number | Average Earnings |
| Male | 340 (53.7%) | $42,500 |
| Female | 293 (46.3%) | $30,673 |
| Total | 633 (100.0%) | $36,655 |
Earnings by Sex by Income Bracket in Payson
The most common earnings brackets in Payson are $55,000 to $64,999 for men (47 | 13.8%) and $35,000 to $39,999 for women (32 | 10.9%).
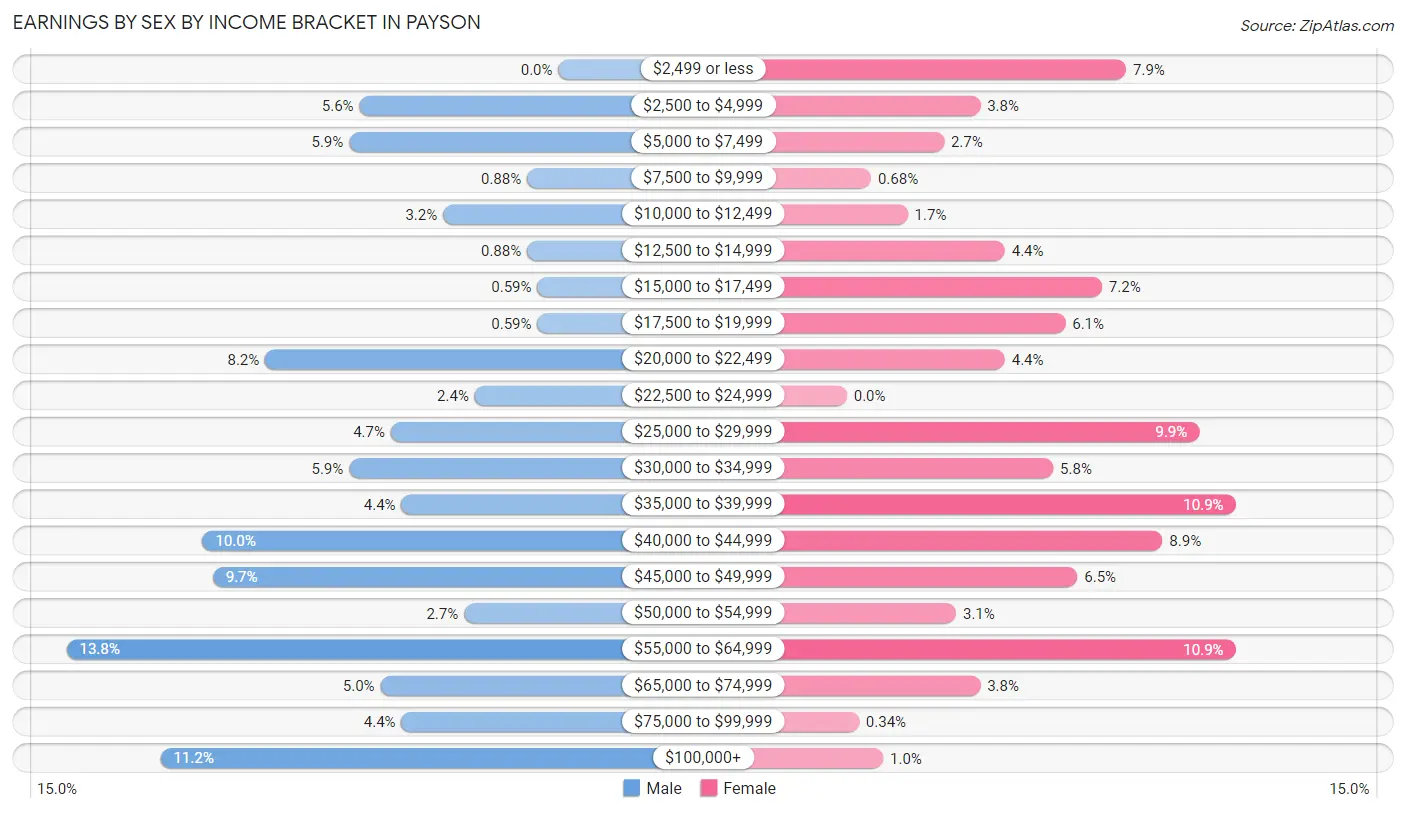
| Income | Male | Female |
| $2,499 or less | 0 (0.0%) | 23 (7.9%) |
| $2,500 to $4,999 | 19 (5.6%) | 11 (3.7%) |
| $5,000 to $7,499 | 20 (5.9%) | 8 (2.7%) |
| $7,500 to $9,999 | 3 (0.9%) | 2 (0.7%) |
| $10,000 to $12,499 | 11 (3.2%) | 5 (1.7%) |
| $12,500 to $14,999 | 3 (0.9%) | 13 (4.4%) |
| $15,000 to $17,499 | 2 (0.6%) | 21 (7.2%) |
| $17,500 to $19,999 | 2 (0.6%) | 18 (6.1%) |
| $20,000 to $22,499 | 28 (8.2%) | 13 (4.4%) |
| $22,500 to $24,999 | 8 (2.4%) | 0 (0.0%) |
| $25,000 to $29,999 | 16 (4.7%) | 29 (9.9%) |
| $30,000 to $34,999 | 20 (5.9%) | 17 (5.8%) |
| $35,000 to $39,999 | 15 (4.4%) | 32 (10.9%) |
| $40,000 to $44,999 | 34 (10.0%) | 26 (8.9%) |
| $45,000 to $49,999 | 33 (9.7%) | 19 (6.5%) |
| $50,000 to $54,999 | 9 (2.6%) | 9 (3.1%) |
| $55,000 to $64,999 | 47 (13.8%) | 32 (10.9%) |
| $65,000 to $74,999 | 17 (5.0%) | 11 (3.7%) |
| $75,000 to $99,999 | 15 (4.4%) | 1 (0.3%) |
| $100,000+ | 38 (11.2%) | 3 (1.0%) |
| Total | 340 (100.0%) | 293 (100.0%) |
Earnings by Sex by Educational Attainment in Payson
Average earnings in Payson are $45,263 for men and $35,489 for women, a difference of 21.6%. Men with an educational attainment of college or associate's degree enjoy the highest average annual earnings of $54,375, while those with high school diploma education earn the least with $40,956. Women with an educational attainment of college or associate's degree earn the most with the average annual earnings of $41,250, while those with high school diploma education have the smallest earnings of $25,074.
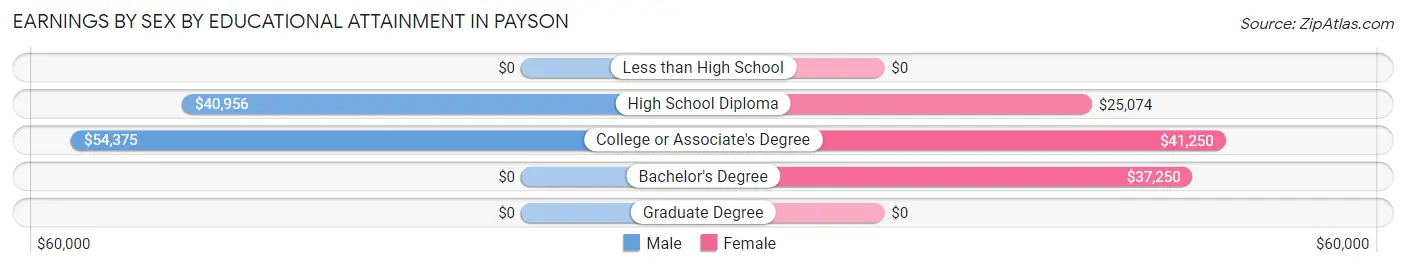
| Educational Attainment | Male Income | Female Income |
| Less than High School | - | - |
| High School Diploma | $40,956 | $25,074 |
| College or Associate's Degree | $54,375 | $41,250 |
| Bachelor's Degree | - | - |
| Graduate Degree | - | - |
| Total | $45,263 | $35,489 |
Family Income in Payson
Family Income Brackets in Payson
According to the Payson family income data, there are 85 families falling into the $50,000 to $74,999 income range, which is the most common income bracket and makes up 29.1% of all families.
| Income Bracket | # Families | % Families |
| Less than $10,000 | 3 | 1.0% |
| $10,000 to $14,999 | 0 | 0.0% |
| $15,000 to $24,999 | 23 | 7.9% |
| $25,000 to $34,999 | 9 | 3.1% |
| $35,000 to $49,999 | 41 | 14.0% |
| $50,000 to $74,999 | 85 | 29.1% |
| $75,000 to $99,999 | 48 | 16.4% |
| $100,000 to $149,999 | 45 | 15.4% |
| $150,000 to $199,999 | 36 | 12.3% |
| $200,000+ | 2 | 0.7% |
Family Income by Famaliy Size in Payson
3-person families (45 | 15.4%) account for the highest median family income in Payson with $133,036 per family, while 3-person families (45 | 15.4%) have the highest median income of $44,345 per family member.
| Income Bracket | # Families | Median Income |
| 2-Person Families | 142 (48.6%) | $62,778 |
| 3-Person Families | 45 (15.4%) | $133,036 |
| 4-Person Families | 48 (16.4%) | $85,833 |
| 5-Person Families | 30 (10.3%) | $56,667 |
| 6-Person Families | 14 (4.8%) | $0 |
| 7+ Person Families | 13 (4.4%) | $0 |
| Total | 292 (100.0%) | $68,833 |
Family Income by Number of Earners in Payson
The median family income in Payson is $68,833, with families comprising 2 earners (122) having the highest median family income of $100,000, while families with no earners (31) have the lowest median family income of $38,250, accounting for 41.8% and 10.6% of families, respectively.
| Number of Earners | # Families | Median Income |
| No Earners | 31 (10.6%) | $38,250 |
| 1 Earner | 97 (33.2%) | $55,368 |
| 2 Earners | 122 (41.8%) | $100,000 |
| 3+ Earners | 42 (14.4%) | $99,531 |
| Total | 292 (100.0%) | $68,833 |
Household Income in Payson
Household Income Brackets in Payson
With 98 households falling in the category, the $50,000 to $74,999 income range is the most frequent in Payson, accounting for 25.1% of all households. In contrast, only 5 households (1.3%) fall into the less than $10,000 income bracket, making it the least populous group.
| Income Bracket | # Households | % Households |
| Less than $10,000 | 5 | 1.3% |
| $10,000 to $14,999 | 8 | 2.0% |
| $15,000 to $24,999 | 34 | 8.7% |
| $25,000 to $34,999 | 30 | 7.7% |
| $35,000 to $49,999 | 61 | 15.6% |
| $50,000 to $74,999 | 98 | 25.1% |
| $75,000 to $99,999 | 60 | 15.3% |
| $100,000 to $149,999 | 52 | 13.3% |
| $150,000 to $199,999 | 36 | 9.2% |
| $200,000+ | 7 | 1.8% |
Household Income by Householder Age in Payson
The median household income in Payson is $64,313, with the highest median household income of $88,295 found in the 15 to 24 years age bracket for the primary householder. A total of 21 households (5.4%) fall into this category. Meanwhile, the 65+ years age bracket for the primary householder has the lowest median household income of $40,000, with 84 households (21.5%) in this group.
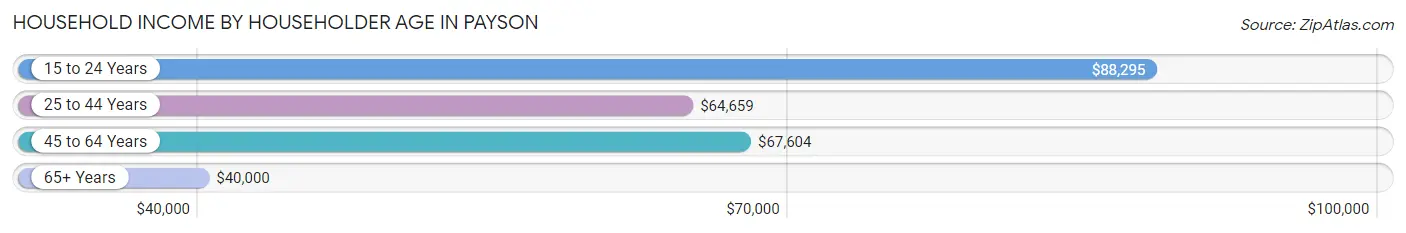
| Income Bracket | # Households | Median Income |
| 15 to 24 Years | 21 (5.4%) | $88,295 |
| 25 to 44 Years | 165 (42.2%) | $64,659 |
| 45 to 64 Years | 121 (30.9%) | $67,604 |
| 65+ Years | 84 (21.5%) | $40,000 |
| Total | 391 (100.0%) | $64,313 |
Poverty in Payson
Income Below Poverty by Sex and Age in Payson
With 4.9% poverty level for males and 16.7% for females among the residents of Payson, 65 to 74 year old males and under 5 year old females are the most vulnerable to poverty, with 6 males (16.7%) and 20 females (83.3%) in their respective age groups living below the poverty level.
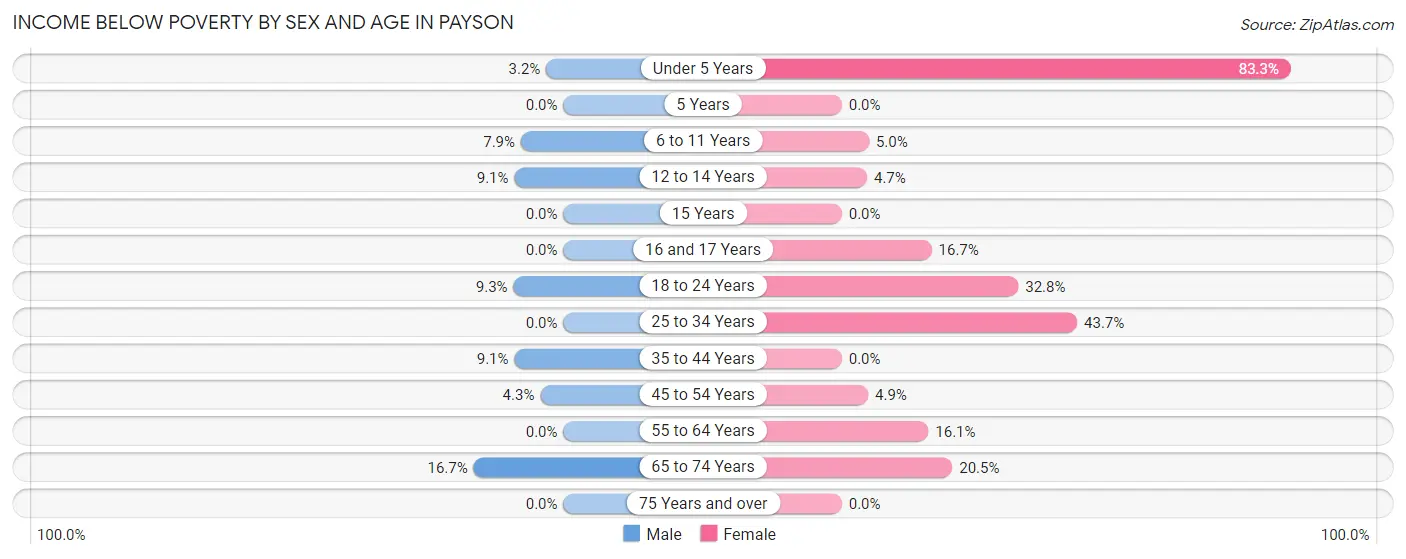
| Age Bracket | Male | Female |
| Under 5 Years | 3 (3.2%) | 20 (83.3%) |
| 5 Years | 0 (0.0%) | 0 (0.0%) |
| 6 to 11 Years | 6 (7.9%) | 7 (5.0%) |
| 12 to 14 Years | 2 (9.1%) | 3 (4.7%) |
| 15 Years | 0 (0.0%) | 0 (0.0%) |
| 16 and 17 Years | 0 (0.0%) | 2 (16.7%) |
| 18 to 24 Years | 5 (9.3%) | 19 (32.8%) |
| 25 to 34 Years | 0 (0.0%) | 38 (43.7%) |
| 35 to 44 Years | 6 (9.1%) | 0 (0.0%) |
| 45 to 54 Years | 3 (4.3%) | 2 (4.9%) |
| 55 to 64 Years | 0 (0.0%) | 9 (16.1%) |
| 65 to 74 Years | 6 (16.7%) | 8 (20.5%) |
| 75 Years and over | 0 (0.0%) | 0 (0.0%) |
| Total | 31 (4.9%) | 108 (16.7%) |
Income Above Poverty by Sex and Age in Payson
According to the poverty statistics in Payson, males aged 5 years and females aged 5 years are the age groups that are most secure financially, with 100.0% of males and 100.0% of females in these age groups living above the poverty line.
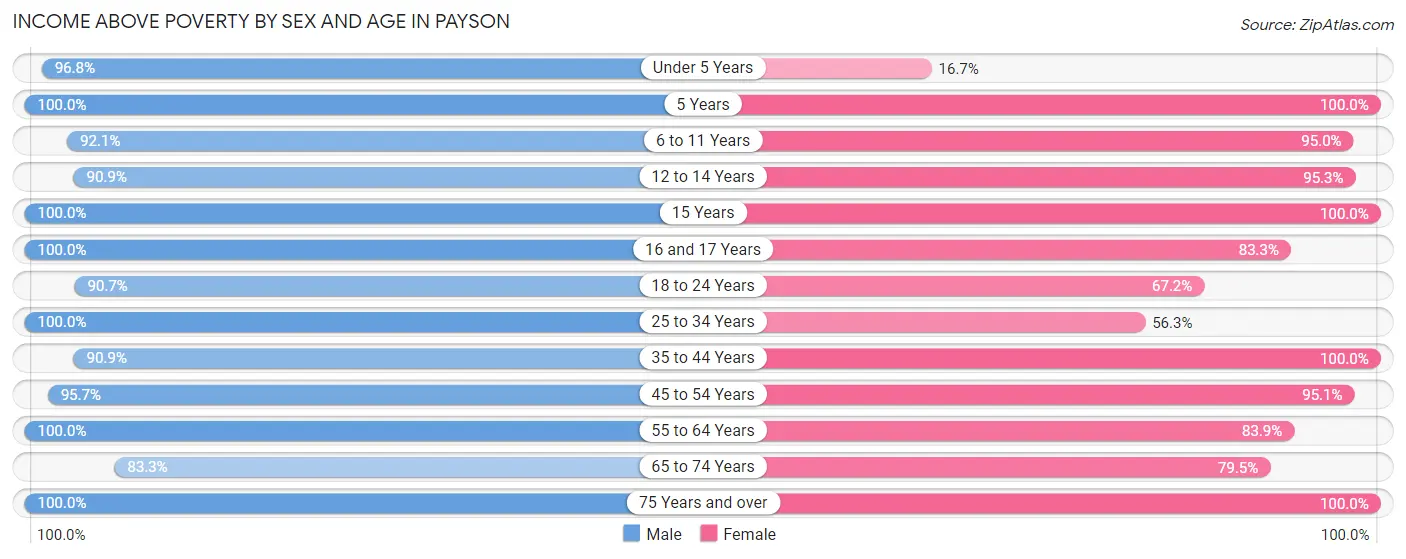
| Age Bracket | Male | Female |
| Under 5 Years | 91 (96.8%) | 4 (16.7%) |
| 5 Years | 18 (100.0%) | 4 (100.0%) |
| 6 to 11 Years | 70 (92.1%) | 132 (95.0%) |
| 12 to 14 Years | 20 (90.9%) | 61 (95.3%) |
| 15 Years | 15 (100.0%) | 4 (100.0%) |
| 16 and 17 Years | 7 (100.0%) | 10 (83.3%) |
| 18 to 24 Years | 49 (90.7%) | 39 (67.2%) |
| 25 to 34 Years | 89 (100.0%) | 49 (56.3%) |
| 35 to 44 Years | 60 (90.9%) | 83 (100.0%) |
| 45 to 54 Years | 67 (95.7%) | 39 (95.1%) |
| 55 to 64 Years | 66 (100.0%) | 47 (83.9%) |
| 65 to 74 Years | 30 (83.3%) | 31 (79.5%) |
| 75 Years and over | 15 (100.0%) | 37 (100.0%) |
| Total | 597 (95.1%) | 540 (83.3%) |
Income Below Poverty Among Married-Couple Families in Payson
The poverty statistics for married-couple families in Payson show that 3.0% or 6 of the total 203 families live below the poverty line. Families with 1 or 2 children have the highest poverty rate of 8.3%, comprising of 6 families. On the other hand, families with no children have the lowest poverty rate of 0.0%, which includes 0 families.
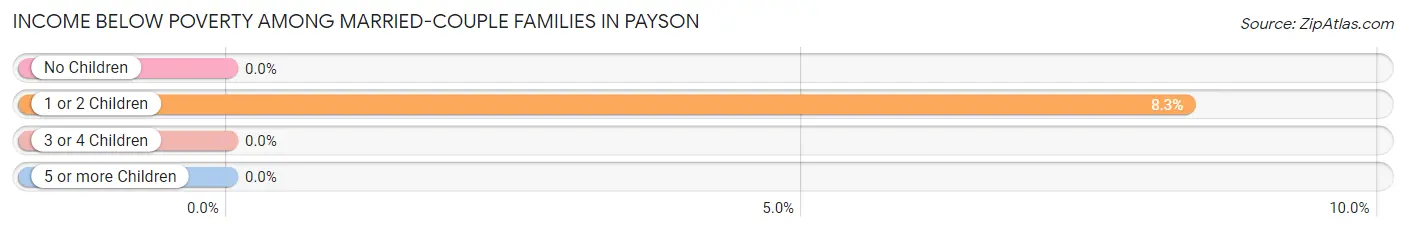
| Children | Above Poverty | Below Poverty |
| No Children | 94 (100.0%) | 0 (0.0%) |
| 1 or 2 Children | 66 (91.7%) | 6 (8.3%) |
| 3 or 4 Children | 24 (100.0%) | 0 (0.0%) |
| 5 or more Children | 13 (100.0%) | 0 (0.0%) |
| Total | 197 (97.0%) | 6 (3.0%) |
Income Below Poverty Among Single-Parent Households in Payson
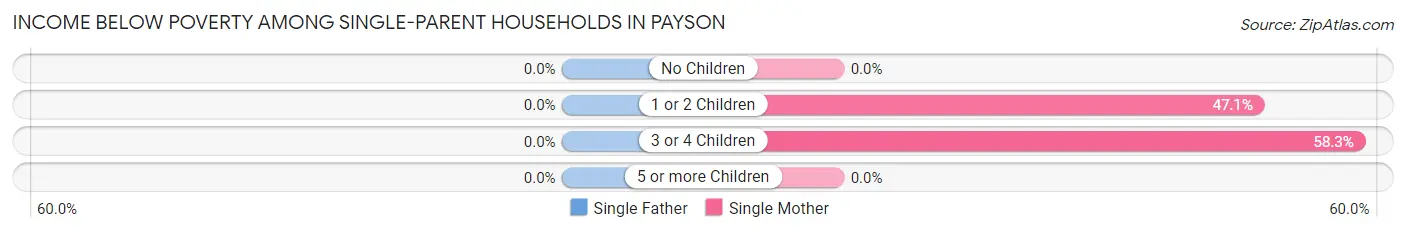
| Children | Single Father | Single Mother |
| No Children | 0 (0.0%) | 0 (0.0%) |
| 1 or 2 Children | 0 (0.0%) | 8 (47.1%) |
| 3 or 4 Children | 0 (0.0%) | 7 (58.3%) |
| 5 or more Children | 0 (0.0%) | 0 (0.0%) |
| Total | 0 (0.0%) | 15 (31.9%) |
Income Below Poverty Among Married-Couple vs Single-Parent Households in Payson
The poverty data for Payson shows that 6 of the married-couple family households (3.0%) and 15 of the single-parent households (16.9%) are living below the poverty level. Within the married-couple family households, those with 1 or 2 children have the highest poverty rate, with 6 households (8.3%) falling below the poverty line. Among the single-parent households, those with 3 or 4 children have the highest poverty rate, with 7 household (58.3%) living below poverty.
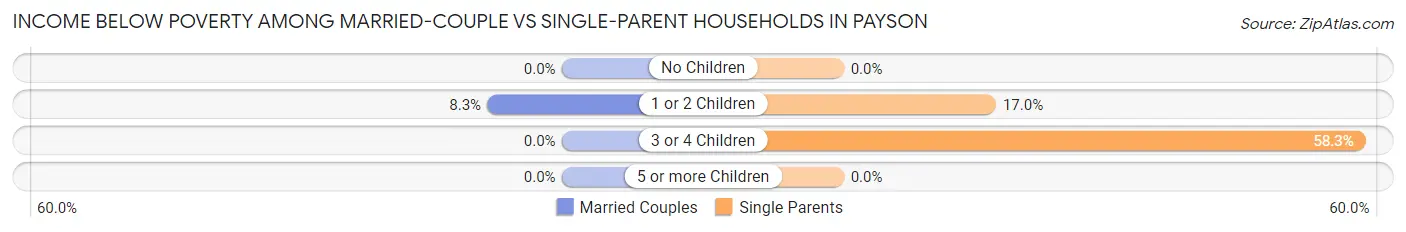
| Children | Married-Couple Families | Single-Parent Households |
| No Children | 0 (0.0%) | 0 (0.0%) |
| 1 or 2 Children | 6 (8.3%) | 8 (17.0%) |
| 3 or 4 Children | 0 (0.0%) | 7 (58.3%) |
| 5 or more Children | 0 (0.0%) | 0 (0.0%) |
| Total | 6 (3.0%) | 15 (16.9%) |
Race in Payson
The most populous races in Payson are White / Caucasian (1,225 | 96.0%), Asian (28 | 2.2%), and Two or more Races (23 | 1.8%).
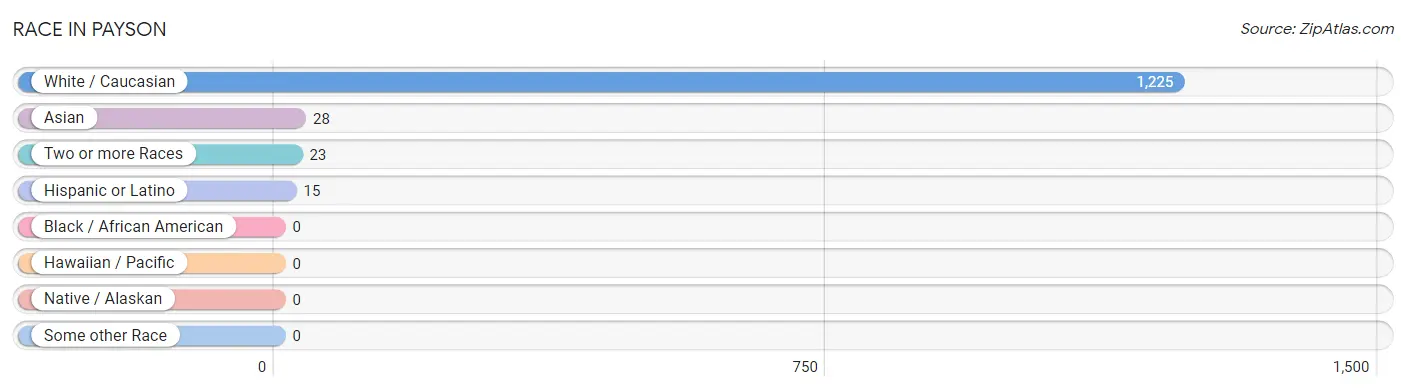
| Race | # Population | % Population |
| Asian | 28 | 2.2% |
| Black / African American | 0 | 0.0% |
| Hawaiian / Pacific | 0 | 0.0% |
| Hispanic or Latino | 15 | 1.2% |
| Native / Alaskan | 0 | 0.0% |
| White / Caucasian | 1,225 | 96.0% |
| Two or more Races | 23 | 1.8% |
| Some other Race | 0 | 0.0% |
| Total | 1,276 | 100.0% |
Ancestry in Payson
The most populous ancestries reported in Payson are German (335 | 26.3%), English (68 | 5.3%), Irish (64 | 5.0%), American (55 | 4.3%), and Indian (Asian) (28 | 2.2%), together accounting for 43.1% of all Payson residents.
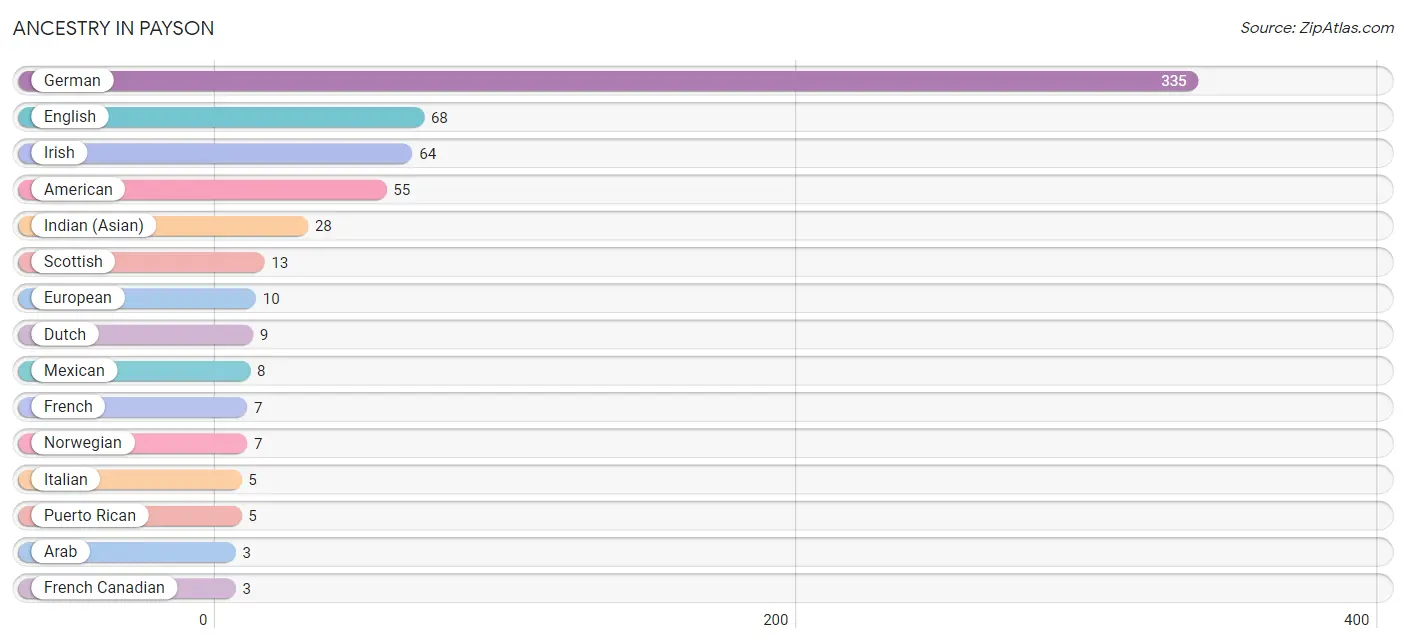
| Ancestry | # Population | % Population |
| American | 55 | 4.3% |
| Arab | 3 | 0.2% |
| Dutch | 9 | 0.7% |
| English | 68 | 5.3% |
| European | 10 | 0.8% |
| French | 7 | 0.5% |
| French Canadian | 3 | 0.2% |
| German | 335 | 26.3% |
| Hungarian | 2 | 0.2% |
| Indian (Asian) | 28 | 2.2% |
| Irish | 64 | 5.0% |
| Italian | 5 | 0.4% |
| Mexican | 8 | 0.6% |
| Norwegian | 7 | 0.5% |
| Polish | 2 | 0.2% |
| Puerto Rican | 5 | 0.4% |
| Scotch-Irish | 3 | 0.2% |
| Scottish | 13 | 1.0% |
| Spaniard | 2 | 0.2% |
| Swedish | 2 | 0.2% |
| Syrian | 3 | 0.2% | View All 21 Rows |
Immigrants in Payson
The most numerous immigrant groups reported in Payson came from Europe (2 | 0.2%), Southern Europe (2 | 0.2%), Spain (2 | 0.2%), Central America (1 | 0.1%), and Latin America (1 | 0.1%), together accounting for 0.6% of all Payson residents.
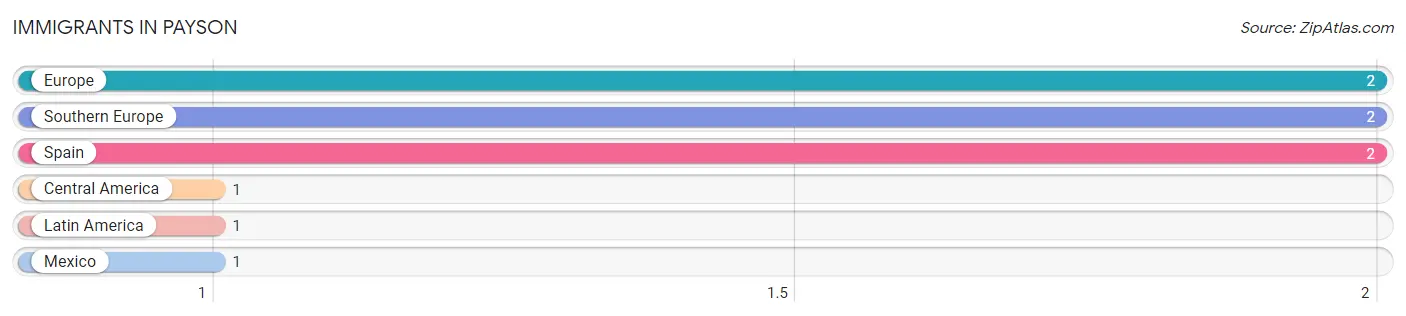
| Immigration Origin | # Population | % Population |
| Central America | 1 | 0.1% |
| Europe | 2 | 0.2% |
| Latin America | 1 | 0.1% |
| Mexico | 1 | 0.1% |
| Southern Europe | 2 | 0.2% |
| Spain | 2 | 0.2% | View All 6 Rows |
Sex and Age in Payson
Sex and Age in Payson
The most populous age groups in Payson are Under 5 Years (94 | 15.0%) for men and 10 to 14 Years (119 | 18.4%) for women.
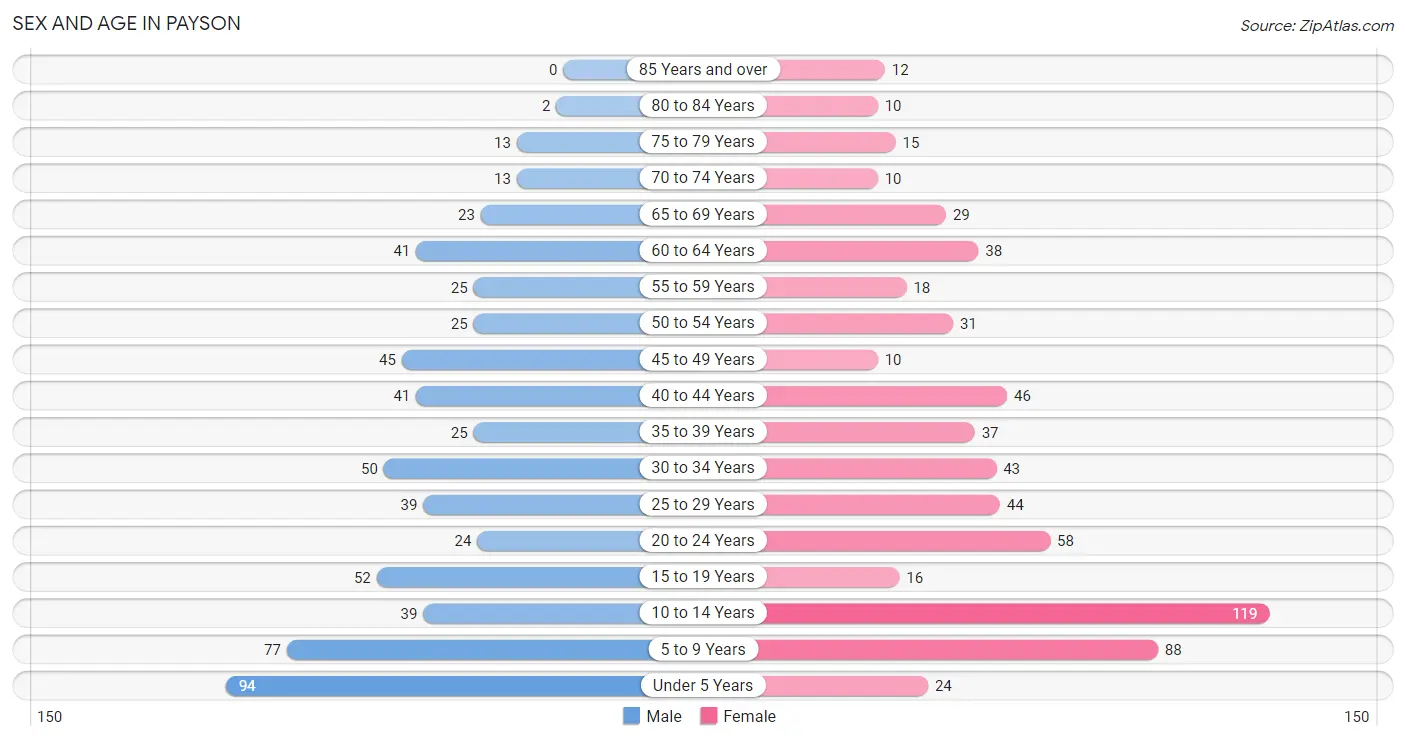
| Age Bracket | Male | Female |
| Under 5 Years | 94 (15.0%) | 24 (3.7%) |
| 5 to 9 Years | 77 (12.3%) | 88 (13.6%) |
| 10 to 14 Years | 39 (6.2%) | 119 (18.4%) |
| 15 to 19 Years | 52 (8.3%) | 16 (2.5%) |
| 20 to 24 Years | 24 (3.8%) | 58 (8.9%) |
| 25 to 29 Years | 39 (6.2%) | 44 (6.8%) |
| 30 to 34 Years | 50 (8.0%) | 43 (6.6%) |
| 35 to 39 Years | 25 (4.0%) | 37 (5.7%) |
| 40 to 44 Years | 41 (6.5%) | 46 (7.1%) |
| 45 to 49 Years | 45 (7.2%) | 10 (1.5%) |
| 50 to 54 Years | 25 (4.0%) | 31 (4.8%) |
| 55 to 59 Years | 25 (4.0%) | 18 (2.8%) |
| 60 to 64 Years | 41 (6.5%) | 38 (5.9%) |
| 65 to 69 Years | 23 (3.7%) | 29 (4.5%) |
| 70 to 74 Years | 13 (2.1%) | 10 (1.5%) |
| 75 to 79 Years | 13 (2.1%) | 15 (2.3%) |
| 80 to 84 Years | 2 (0.3%) | 10 (1.5%) |
| 85 Years and over | 0 (0.0%) | 12 (1.8%) |
| Total | 628 (100.0%) | 648 (100.0%) |
Families and Households in Payson
Median Family Size in Payson
The median family size in Payson is 3.78 persons per family, with married-couple families (203 | 69.5%) accounting for the largest median family size of 4.28 persons per family. On the other hand, single male/father families (42 | 14.4%) represent the smallest median family size with 2.36 persons per family.
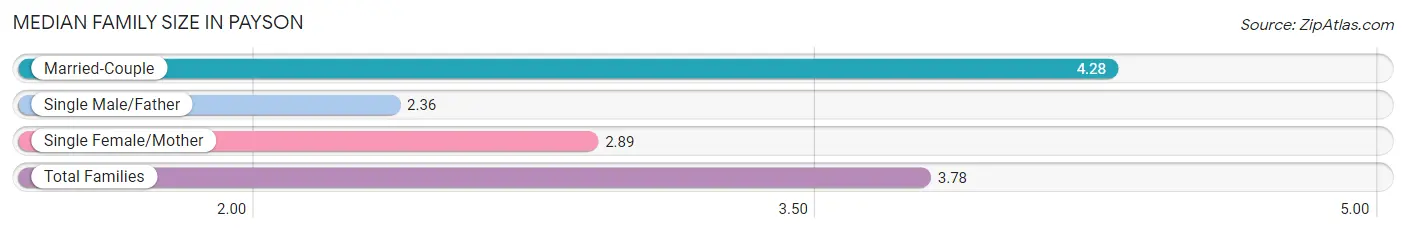
| Family Type | # Families | Family Size |
| Married-Couple | 203 (69.5%) | 4.28 |
| Single Male/Father | 42 (14.4%) | 2.36 |
| Single Female/Mother | 47 (16.1%) | 2.89 |
| Total Families | 292 (100.0%) | 3.78 |
Median Household Size in Payson
The median household size in Payson is 3.26 persons per household, with married-couple households (203 | 51.9%) accounting for the largest median household size of 4.32 persons per household. non-family households (99 | 25.3%) represent the smallest median household size with 1.20 persons per household.
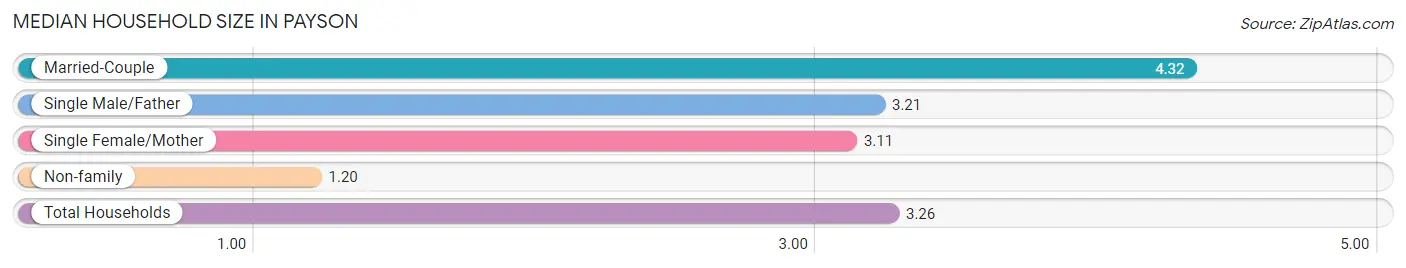
| Household Type | # Households | Household Size |
| Married-Couple | 203 (51.9%) | 4.32 |
| Single Male/Father | 42 (10.7%) | 3.21 |
| Single Female/Mother | 47 (12.0%) | 3.11 |
| Non-family | 99 (25.3%) | 1.20 |
| Total Households | 391 (100.0%) | 3.26 |
Household Size by Marriage Status in Payson
Out of a total of 391 households in Payson, 292 (74.7%) are family households, while 99 (25.3%) are nonfamily households. The most numerous type of family households are 2-person households, comprising 111, and the most common type of nonfamily households are 1-person households, comprising 82.
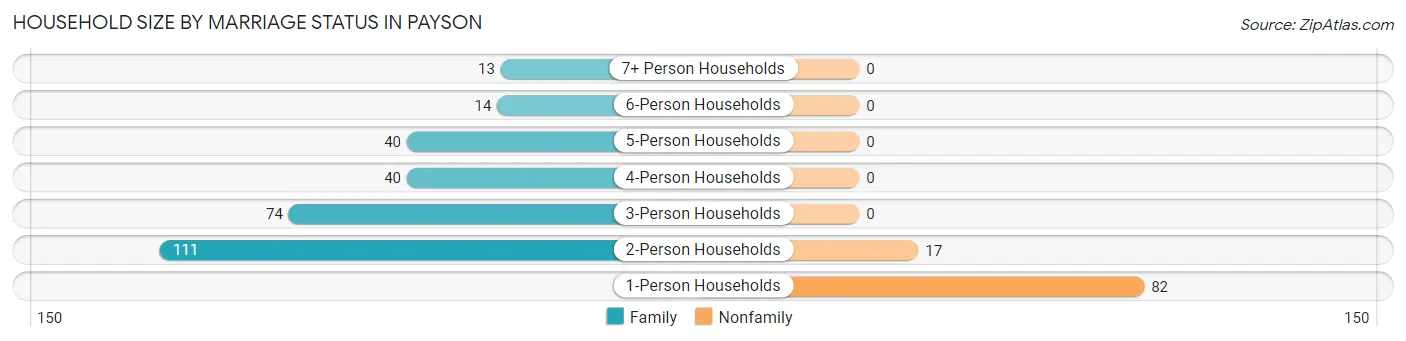
| Household Size | Family Households | Nonfamily Households |
| 1-Person Households | - | 82 (21.0%) |
| 2-Person Households | 111 (28.4%) | 17 (4.3%) |
| 3-Person Households | 74 (18.9%) | 0 (0.0%) |
| 4-Person Households | 40 (10.2%) | 0 (0.0%) |
| 5-Person Households | 40 (10.2%) | 0 (0.0%) |
| 6-Person Households | 14 (3.6%) | 0 (0.0%) |
| 7+ Person Households | 13 (3.3%) | 0 (0.0%) |
| Total | 292 (74.7%) | 99 (25.3%) |
Female Fertility in Payson
Fertility by Age in Payson
Average fertility rate in Payson is 12.0 births per 1,000 women. Women in the age bracket of 20 to 34 years have the highest fertility rate with 21.0 births per 1,000 women. Women in the age bracket of 20 to 34 years acount for 100.0% of all women with births.
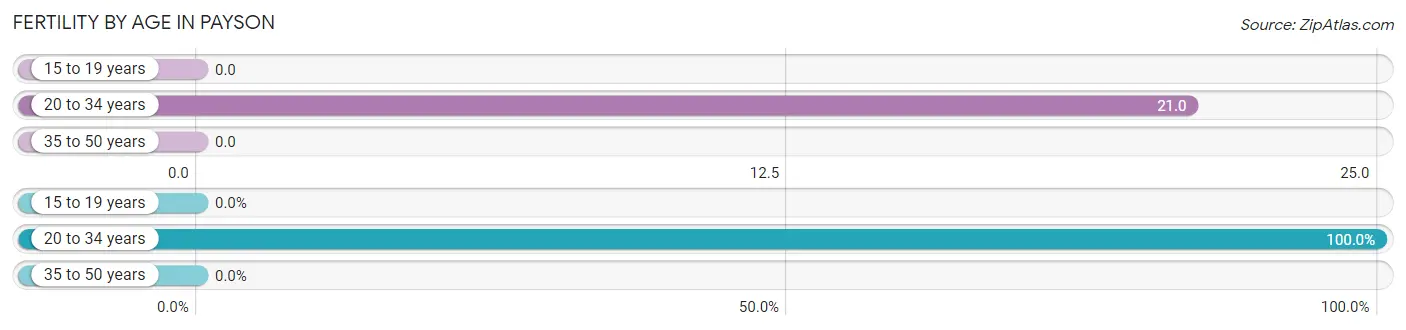
| Age Bracket | Women with Births | Births / 1,000 Women |
| 15 to 19 years | 0 (0.0%) | 0.0 |
| 20 to 34 years | 3 (100.0%) | 21.0 |
| 35 to 50 years | 0 (0.0%) | 0.0 |
| Total | 3 (100.0%) | 12.0 |
Fertility by Age by Marriage Status in Payson
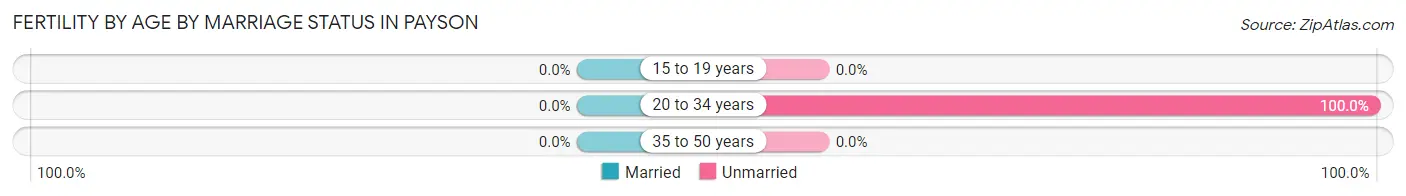
| Age Bracket | Married | Unmarried |
| 15 to 19 years | 0 (0.0%) | 0 (0.0%) |
| 20 to 34 years | 0 (0.0%) | 3 (100.0%) |
| 35 to 50 years | 0 (0.0%) | 0 (0.0%) |
| Total | 0 (0.0%) | 3 (100.0%) |
Fertility by Education in Payson
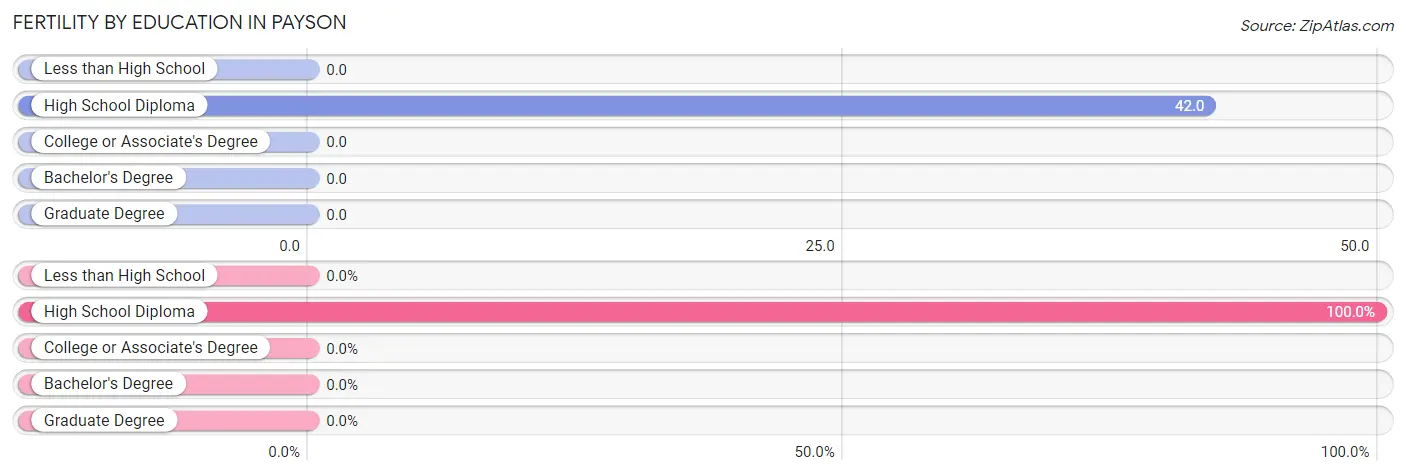
| Educational Attainment | Women with Births | Births / 1,000 Women |
| Less than High School | 0 (0.0%) | 0.0 |
| High School Diploma | 3 (100.0%) | 42.0 |
| College or Associate's Degree | 0 (0.0%) | 0.0 |
| Bachelor's Degree | 0 (0.0%) | 0.0 |
| Graduate Degree | 0 (0.0%) | 0.0 |
| Total | 3 (100.0%) | 12.0 |
Fertility by Education by Marriage Status in Payson
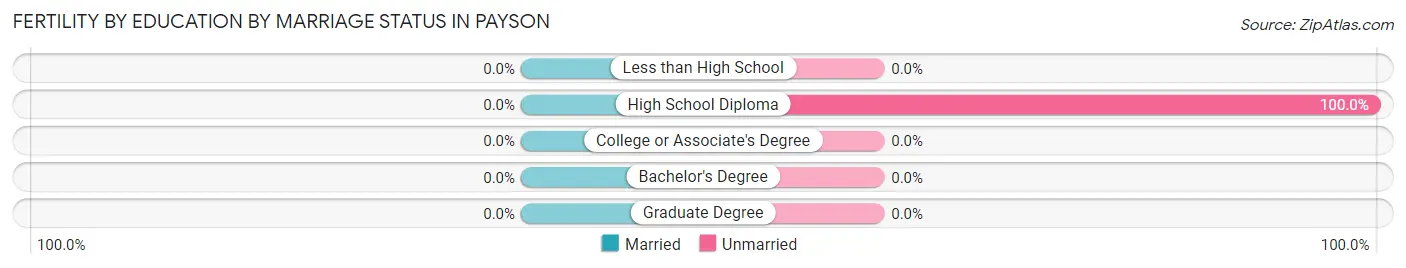
| Educational Attainment | Married | Unmarried |
| Less than High School | 0 (0.0%) | 0 (0.0%) |
| High School Diploma | 0 (0.0%) | 3 (100.0%) |
| College or Associate's Degree | 0 (0.0%) | 0 (0.0%) |
| Bachelor's Degree | 0 (0.0%) | 0 (0.0%) |
| Graduate Degree | 0 (0.0%) | 0 (0.0%) |
| Total | 0 (0.0%) | 3 (100.0%) |
Employment Characteristics in Payson
Employment by Class of Employer in Payson
Among the 620 employed individuals in Payson, private company employees (453 | 73.1%), not-for-profit organizations (69 | 11.1%), and local government employees (42 | 6.8%) make up the most common classes of employment.
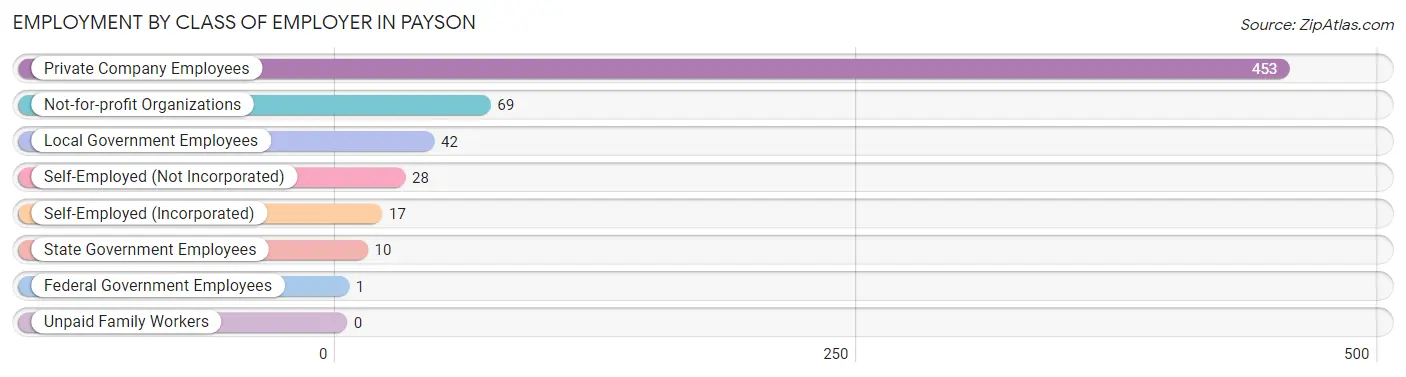
| Employer Class | # Employees | % Employees |
| Private Company Employees | 453 | 73.1% |
| Self-Employed (Incorporated) | 17 | 2.7% |
| Self-Employed (Not Incorporated) | 28 | 4.5% |
| Not-for-profit Organizations | 69 | 11.1% |
| Local Government Employees | 42 | 6.8% |
| State Government Employees | 10 | 1.6% |
| Federal Government Employees | 1 | 0.2% |
| Unpaid Family Workers | 0 | 0.0% |
| Total | 620 | 100.0% |
Employment Status by Age in Payson
According to the labor force statistics for Payson, out of the total population over 16 years of age (816), 76.7% or 626 individuals are in the labor force, with 0.6% or 4 of them unemployed. The age group with the highest labor force participation rate is 30 to 34 years, with 97.8% or 91 individuals in the labor force. Within the labor force, the 16 to 19 years age range has the highest percentage of unemployed individuals, with 9.1% or 4 of them being unemployed.
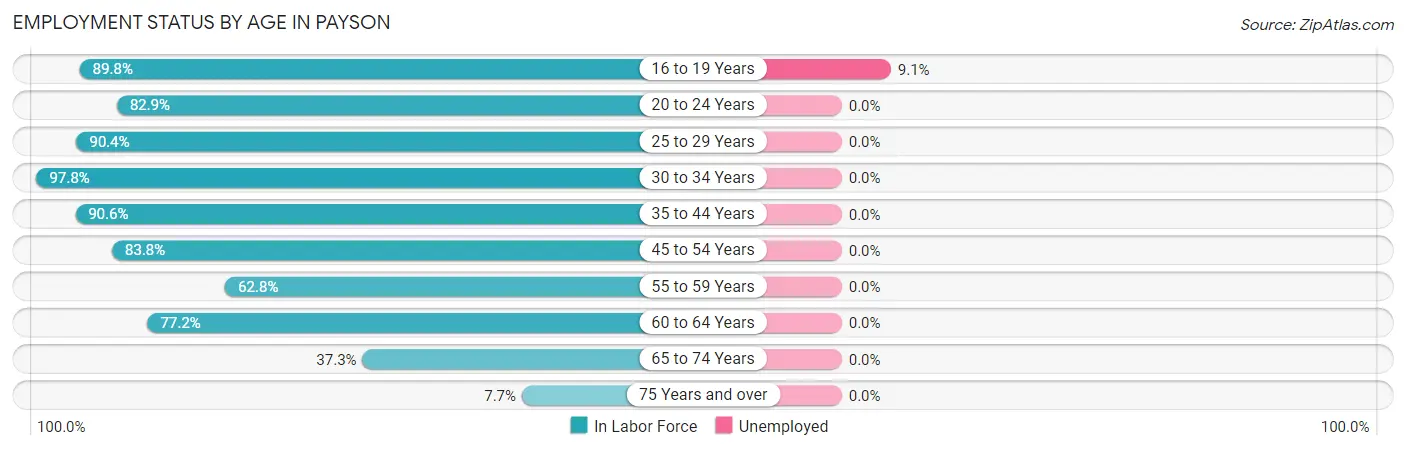
| Age Bracket | In Labor Force | Unemployed |
| 16 to 19 Years | 44 (89.8%) | 4 (9.1%) |
| 20 to 24 Years | 68 (82.9%) | 0 (0.0%) |
| 25 to 29 Years | 75 (90.4%) | 0 (0.0%) |
| 30 to 34 Years | 91 (97.8%) | 0 (0.0%) |
| 35 to 44 Years | 135 (90.6%) | 0 (0.0%) |
| 45 to 54 Years | 93 (83.8%) | 0 (0.0%) |
| 55 to 59 Years | 27 (62.8%) | 0 (0.0%) |
| 60 to 64 Years | 61 (77.2%) | 0 (0.0%) |
| 65 to 74 Years | 28 (37.3%) | 0 (0.0%) |
| 75 Years and over | 4 (7.7%) | 0 (0.0%) |
| Total | 626 (76.7%) | 4 (0.6%) |
Employment Status by Educational Attainment in Payson
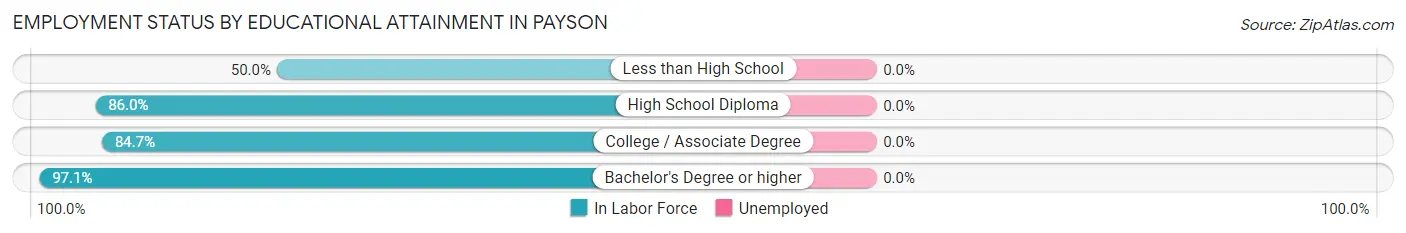
| Educational Attainment | In Labor Force | Unemployed |
| Less than High School | 9 (50.0%) | 0 (0.0%) |
| High School Diploma | 190 (86.0%) | 0 (0.0%) |
| College / Associate Degree | 183 (84.7%) | 0 (0.0%) |
| Bachelor's Degree or higher | 100 (97.1%) | 0 (0.0%) |
| Total | 482 (86.4%) | 0 (0.0%) |
Employment Occupations by Sex in Payson
Management, Business, Science and Arts Occupations
The most common Management, Business, Science and Arts occupations in Payson are Community & Social Service (51 | 8.2%), Health Diagnosing & Treating (38 | 6.1%), Health Technologists (38 | 6.1%), Education Instruction & Library (31 | 5.0%), and Management (20 | 3.2%).
Management, Business, Science and Arts Occupations by Sex
Within the Management, Business, Science and Arts occupations in Payson, the most male-oriented occupations are Computers, Engineering & Science (100.0%), Computers & Mathematics (100.0%), and Architecture & Engineering (100.0%), while the most female-oriented occupations are Education, Arts & Media (100.0%), Health Diagnosing & Treating (100.0%), and Health Technologists (100.0%).
| Occupation | Male | Female |
| Management | 16 (80.0%) | 4 (20.0%) |
| Business & Financial | 14 (87.5%) | 2 (12.5%) |
| Computers, Engineering & Science | 7 (100.0%) | 0 (0.0%) |
| Computers & Mathematics | 4 (100.0%) | 0 (0.0%) |
| Architecture & Engineering | 3 (100.0%) | 0 (0.0%) |
| Life, Physical & Social Science | 0 (0.0%) | 0 (0.0%) |
| Community & Social Service | 12 (23.5%) | 39 (76.5%) |
| Education, Arts & Media | 0 (0.0%) | 2 (100.0%) |
| Legal Services & Support | 0 (0.0%) | 0 (0.0%) |
| Education Instruction & Library | 6 (19.4%) | 25 (80.6%) |
| Arts, Media & Entertainment | 6 (33.3%) | 12 (66.7%) |
| Health Diagnosing & Treating | 0 (0.0%) | 38 (100.0%) |
| Health Technologists | 0 (0.0%) | 38 (100.0%) |
| Total (Category) | 49 (37.1%) | 83 (62.9%) |
| Total (Overall) | 336 (54.0%) | 286 (46.0%) |
Services Occupations
The most common Services occupations in Payson are Food Preparation & Serving (59 | 9.5%), Cleaning & Maintenance (43 | 6.9%), Healthcare Support (20 | 3.2%), Security & Protection (13 | 2.1%), and Firefighting & Prevention (11 | 1.8%).
Services Occupations by Sex
Within the Services occupations in Payson, the most male-oriented occupations are Security & Protection (100.0%), Firefighting & Prevention (100.0%), and Law Enforcement (100.0%), while the most female-oriented occupations are Healthcare Support (100.0%), Personal Care & Service (100.0%), and Food Preparation & Serving (47.5%).
| Occupation | Male | Female |
| Healthcare Support | 0 (0.0%) | 20 (100.0%) |
| Security & Protection | 13 (100.0%) | 0 (0.0%) |
| Firefighting & Prevention | 11 (100.0%) | 0 (0.0%) |
| Law Enforcement | 2 (100.0%) | 0 (0.0%) |
| Food Preparation & Serving | 31 (52.5%) | 28 (47.5%) |
| Cleaning & Maintenance | 35 (81.4%) | 8 (18.6%) |
| Personal Care & Service | 0 (0.0%) | 11 (100.0%) |
| Total (Category) | 79 (54.1%) | 67 (45.9%) |
| Total (Overall) | 336 (54.0%) | 286 (46.0%) |
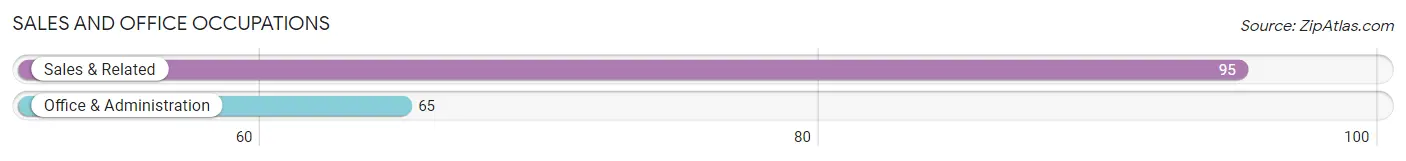
Sales and Office Occupations
The most common Sales and Office occupations in Payson are Sales & Related (95 | 15.3%), and Office & Administration (65 | 10.4%).
Sales and Office Occupations by Sex
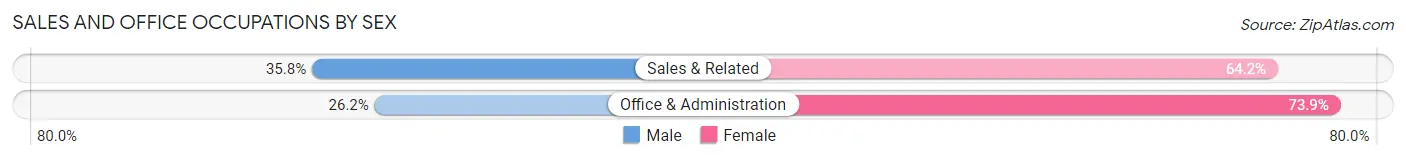
| Occupation | Male | Female |
| Sales & Related | 34 (35.8%) | 61 (64.2%) |
| Office & Administration | 17 (26.2%) | 48 (73.9%) |
| Total (Category) | 51 (31.9%) | 109 (68.1%) |
| Total (Overall) | 336 (54.0%) | 286 (46.0%) |
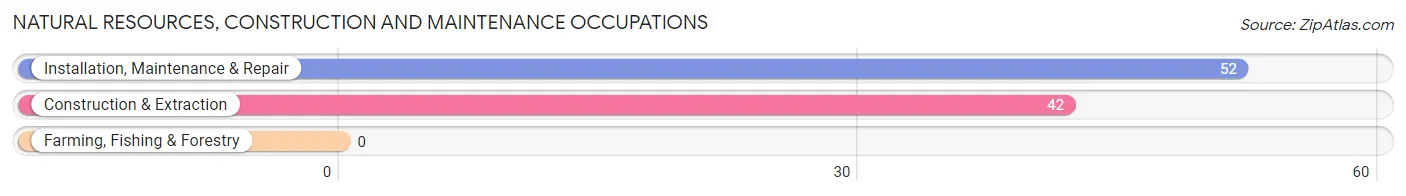
Natural Resources, Construction and Maintenance Occupations
The most common Natural Resources, Construction and Maintenance occupations in Payson are Installation, Maintenance & Repair (52 | 8.4%), and Construction & Extraction (42 | 6.8%).
Natural Resources, Construction and Maintenance Occupations by Sex
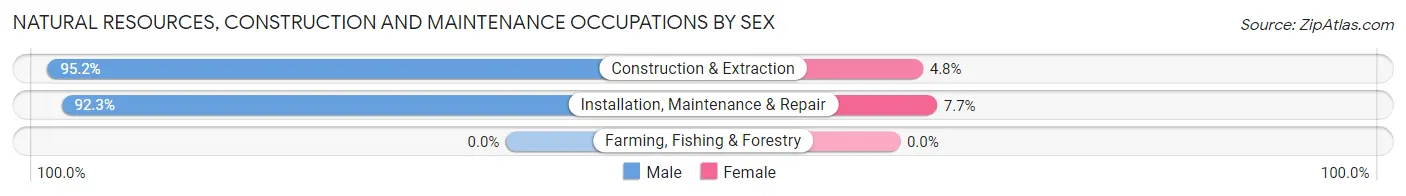
| Occupation | Male | Female |
| Farming, Fishing & Forestry | 0 (0.0%) | 0 (0.0%) |
| Construction & Extraction | 40 (95.2%) | 2 (4.8%) |
| Installation, Maintenance & Repair | 48 (92.3%) | 4 (7.7%) |
| Total (Category) | 88 (93.6%) | 6 (6.4%) |
| Total (Overall) | 336 (54.0%) | 286 (46.0%) |
Production, Transportation and Moving Occupations
The most common Production, Transportation and Moving occupations in Payson are Production (54 | 8.7%), Material Moving (23 | 3.7%), and Transportation (13 | 2.1%).
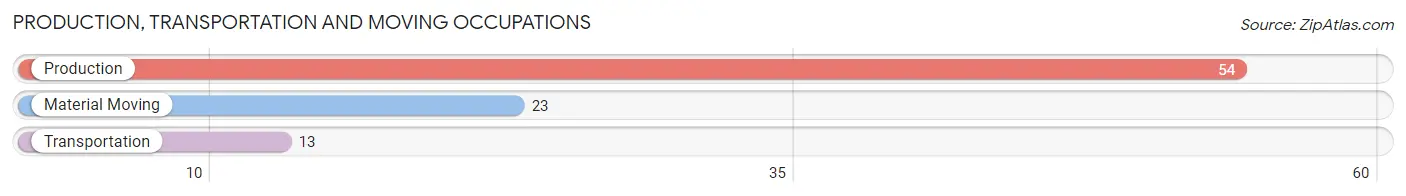
Production, Transportation and Moving Occupations by Sex
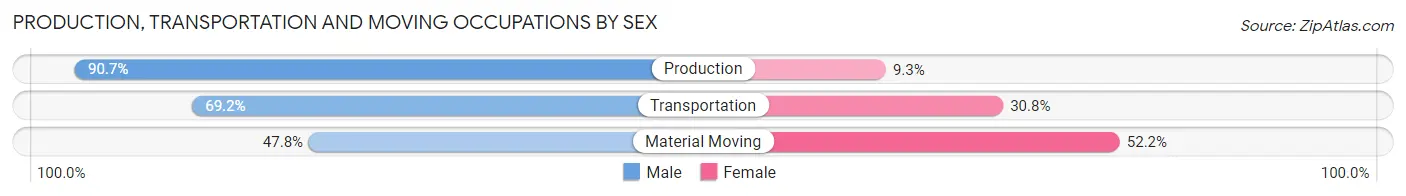
| Occupation | Male | Female |
| Production | 49 (90.7%) | 5 (9.3%) |
| Transportation | 9 (69.2%) | 4 (30.8%) |
| Material Moving | 11 (47.8%) | 12 (52.2%) |
| Total (Category) | 69 (76.7%) | 21 (23.3%) |
| Total (Overall) | 336 (54.0%) | 286 (46.0%) |
Employment Industries by Sex in Payson
Employment Industries in Payson
The major employment industries in Payson include Manufacturing (112 | 18.0%), Retail Trade (108 | 17.4%), Health Care & Social Assistance (72 | 11.6%), Educational Services (67 | 10.8%), and Accommodation & Food Services (54 | 8.7%).
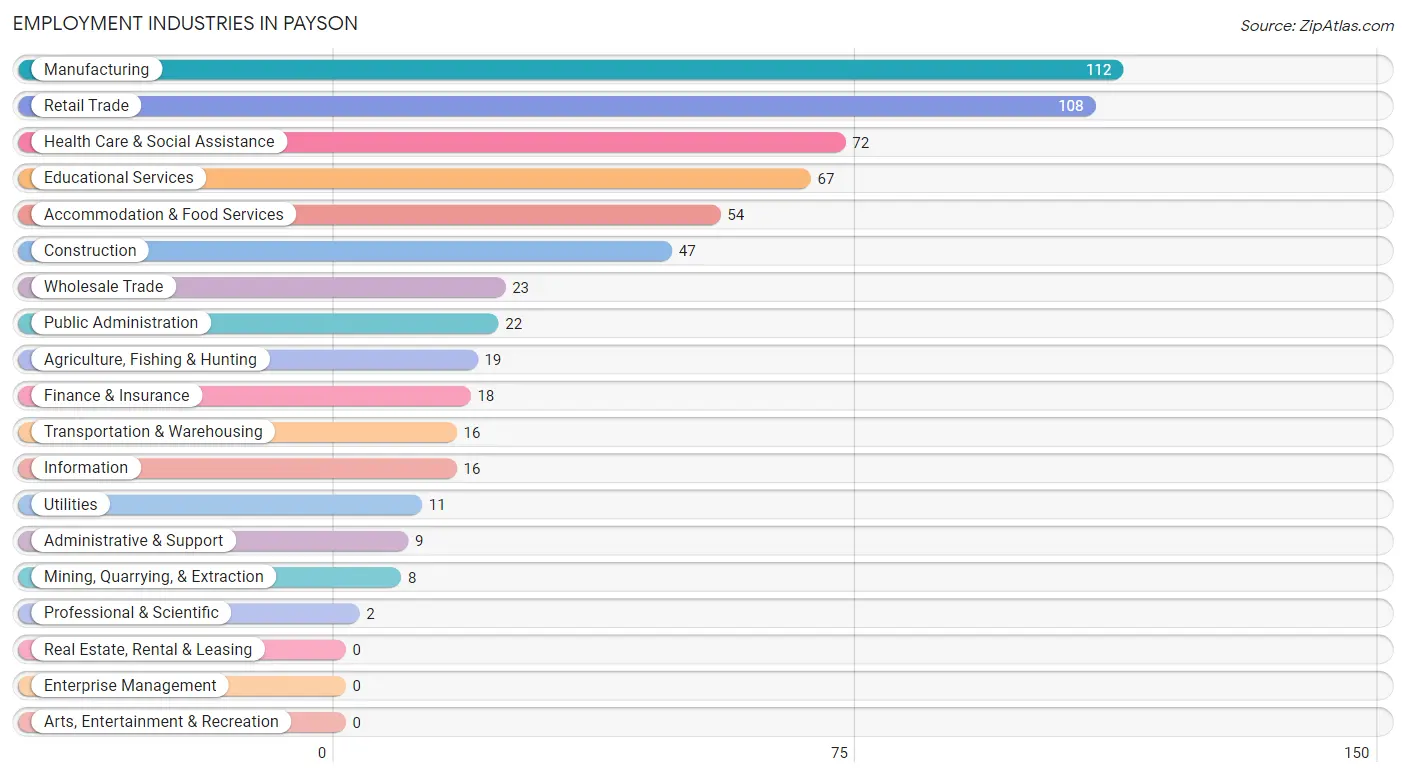
Employment Industries by Sex in Payson
The Payson industries that see more men than women are Mining, Quarrying, & Extraction (100.0%), Administrative & Support (100.0%), and Public Administration (100.0%), whereas the industries that tend to have a higher number of women are Professional & Scientific (100.0%), Health Care & Social Assistance (100.0%), and Finance & Insurance (83.3%).
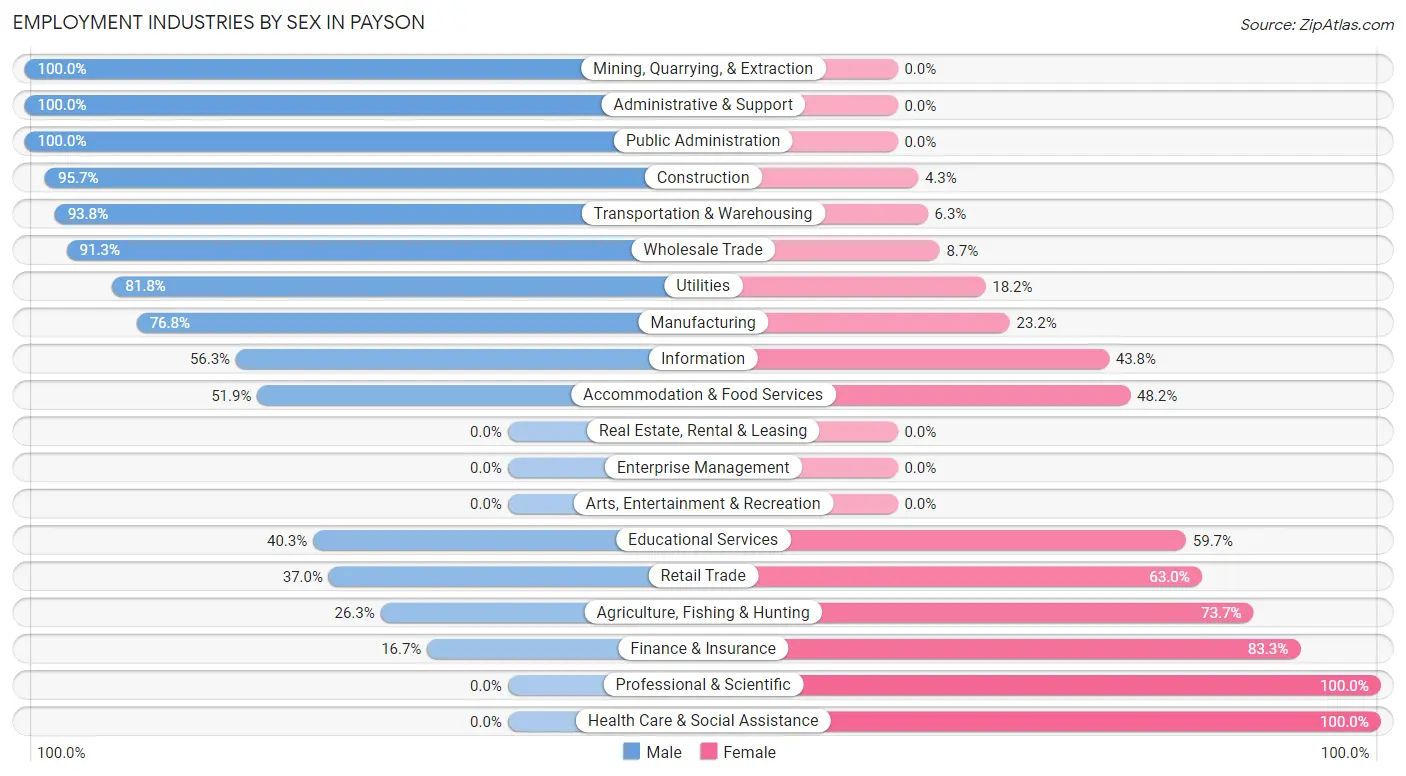
| Industry | Male | Female |
| Agriculture, Fishing & Hunting | 5 (26.3%) | 14 (73.7%) |
| Mining, Quarrying, & Extraction | 8 (100.0%) | 0 (0.0%) |
| Construction | 45 (95.7%) | 2 (4.3%) |
| Manufacturing | 86 (76.8%) | 26 (23.2%) |
| Wholesale Trade | 21 (91.3%) | 2 (8.7%) |
| Retail Trade | 40 (37.0%) | 68 (63.0%) |
| Transportation & Warehousing | 15 (93.8%) | 1 (6.2%) |
| Utilities | 9 (81.8%) | 2 (18.2%) |
| Information | 9 (56.2%) | 7 (43.8%) |
| Finance & Insurance | 3 (16.7%) | 15 (83.3%) |
| Real Estate, Rental & Leasing | 0 (0.0%) | 0 (0.0%) |
| Professional & Scientific | 0 (0.0%) | 2 (100.0%) |
| Enterprise Management | 0 (0.0%) | 0 (0.0%) |
| Administrative & Support | 9 (100.0%) | 0 (0.0%) |
| Educational Services | 27 (40.3%) | 40 (59.7%) |
| Health Care & Social Assistance | 0 (0.0%) | 72 (100.0%) |
| Arts, Entertainment & Recreation | 0 (0.0%) | 0 (0.0%) |
| Accommodation & Food Services | 28 (51.8%) | 26 (48.1%) |
| Public Administration | 22 (100.0%) | 0 (0.0%) |
| Total | 336 (54.0%) | 286 (46.0%) |
Education in Payson
School Enrollment in Payson
The most common levels of schooling among the 417 students in Payson are middle school (111 | 26.6%), high school (109 | 26.1%), and elementary school (103 | 24.7%).
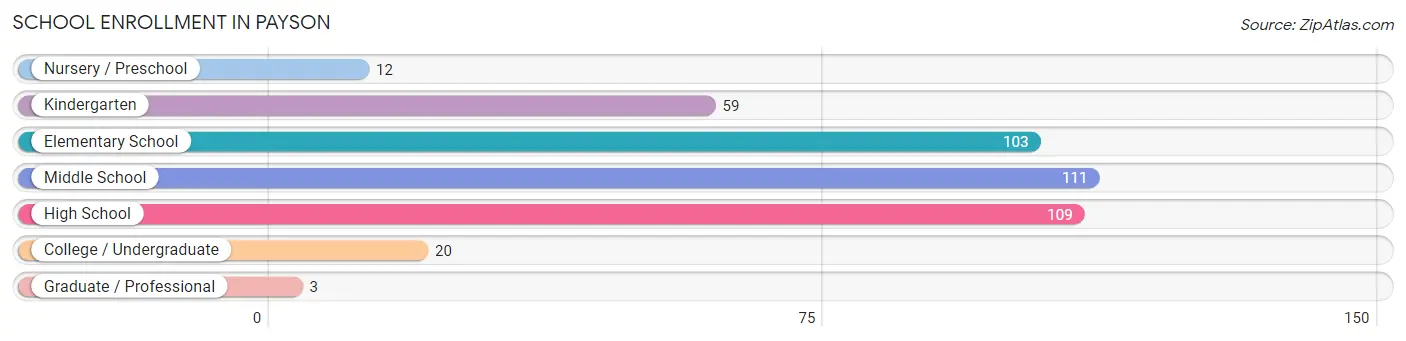
| School Level | # Students | % Students |
| Nursery / Preschool | 12 | 2.9% |
| Kindergarten | 59 | 14.1% |
| Elementary School | 103 | 24.7% |
| Middle School | 111 | 26.6% |
| High School | 109 | 26.1% |
| College / Undergraduate | 20 | 4.8% |
| Graduate / Professional | 3 | 0.7% |
| Total | 417 | 100.0% |
School Enrollment by Age by Funding Source in Payson
Out of a total of 417 students who are enrolled in schools in Payson, 6 (1.4%) attend a private institution, while the remaining 411 (98.6%) are enrolled in public schools. The age group of 25 to 34 year olds has the highest likelihood of being enrolled in private schools, with 2 (40.0% in the age bracket) enrolled. Conversely, the age group of 3 to 4 year olds has the lowest likelihood of being enrolled in a private school, with 9 (100.0% in the age bracket) attending a public institution.
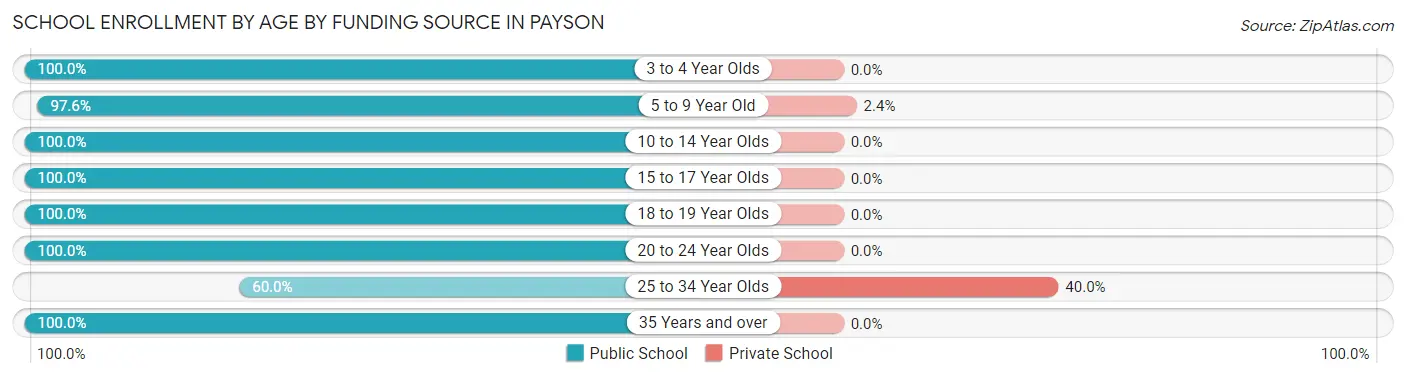
| Age Bracket | Public School | Private School |
| 3 to 4 Year Olds | 9 (100.0%) | 0 (0.0%) |
| 5 to 9 Year Old | 161 (97.6%) | 4 (2.4%) |
| 10 to 14 Year Olds | 158 (100.0%) | 0 (0.0%) |
| 15 to 17 Year Olds | 35 (100.0%) | 0 (0.0%) |
| 18 to 19 Year Olds | 30 (100.0%) | 0 (0.0%) |
| 20 to 24 Year Olds | 10 (100.0%) | 0 (0.0%) |
| 25 to 34 Year Olds | 3 (60.0%) | 2 (40.0%) |
| 35 Years and over | 5 (100.0%) | 0 (0.0%) |
| Total | 411 (98.6%) | 6 (1.4%) |
Educational Attainment by Field of Study in Payson
Education (60 | 46.9%), business (16 | 12.5%), bio, nature & agricultural (14 | 10.9%), science & technology (9 | 7.0%), and visual & performing arts (9 | 7.0%) are the most common fields of study among 128 individuals in Payson who have obtained a bachelor's degree or higher.
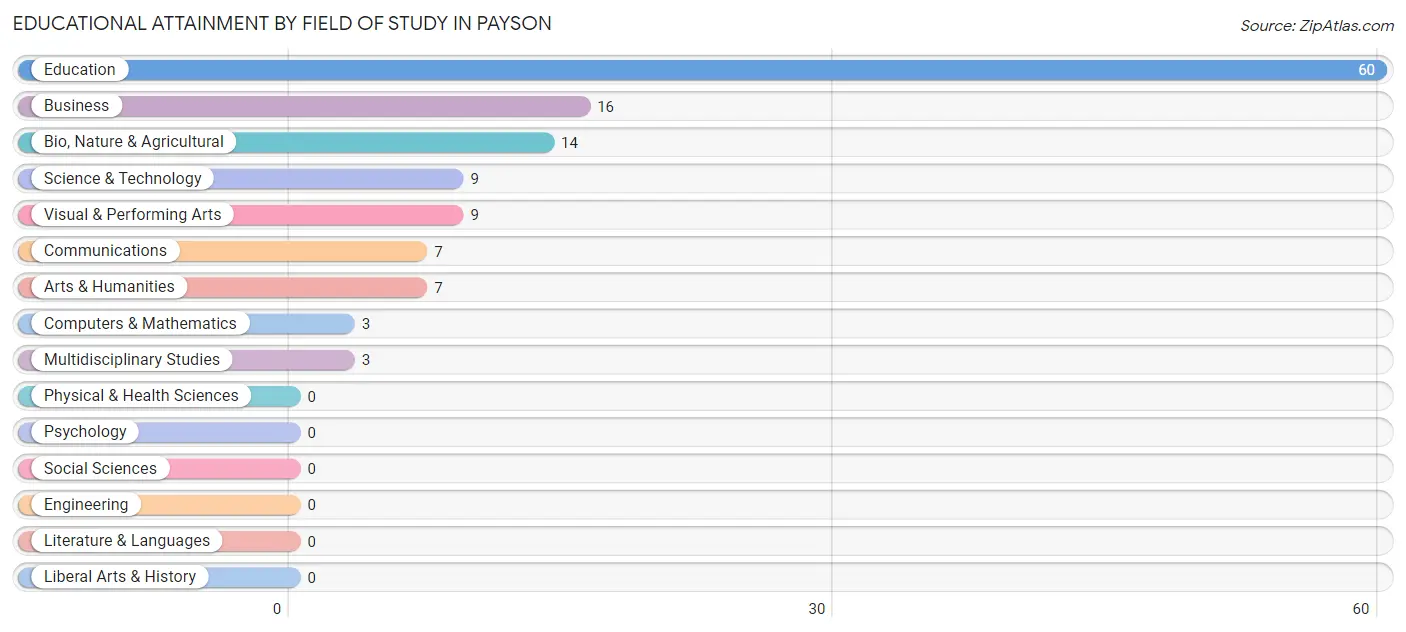
| Field of Study | # Graduates | % Graduates |
| Computers & Mathematics | 3 | 2.3% |
| Bio, Nature & Agricultural | 14 | 10.9% |
| Physical & Health Sciences | 0 | 0.0% |
| Psychology | 0 | 0.0% |
| Social Sciences | 0 | 0.0% |
| Engineering | 0 | 0.0% |
| Multidisciplinary Studies | 3 | 2.3% |
| Science & Technology | 9 | 7.0% |
| Business | 16 | 12.5% |
| Education | 60 | 46.9% |
| Literature & Languages | 0 | 0.0% |
| Liberal Arts & History | 0 | 0.0% |
| Visual & Performing Arts | 9 | 7.0% |
| Communications | 7 | 5.5% |
| Arts & Humanities | 7 | 5.5% |
| Total | 128 | 100.0% |
Transportation & Commute in Payson
Vehicle Availability by Sex in Payson
The most prevalent vehicle ownership categories in Payson are males with 2 vehicles (133, accounting for 39.8%) and females with 2 vehicles (116, making up 46.5%).
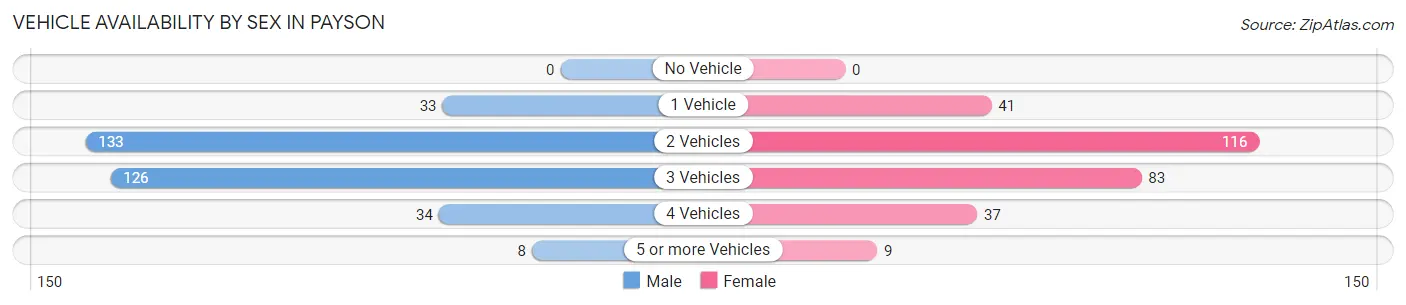
| Vehicles Available | Male | Female |
| No Vehicle | 0 (0.0%) | 0 (0.0%) |
| 1 Vehicle | 33 (9.9%) | 41 (14.3%) |
| 2 Vehicles | 133 (39.8%) | 116 (40.6%) |
| 3 Vehicles | 126 (37.7%) | 83 (29.0%) |
| 4 Vehicles | 34 (10.2%) | 37 (12.9%) |
| 5 or more Vehicles | 8 (2.4%) | 9 (3.2%) |
| Total | 334 (100.0%) | 286 (100.0%) |
Commute Time in Payson
The most frequently occuring commute durations in Payson are 20 to 24 minutes (143 commuters, 24.0%), 30 to 34 minutes (124 commuters, 20.8%), and 15 to 19 minutes (89 commuters, 14.9%).
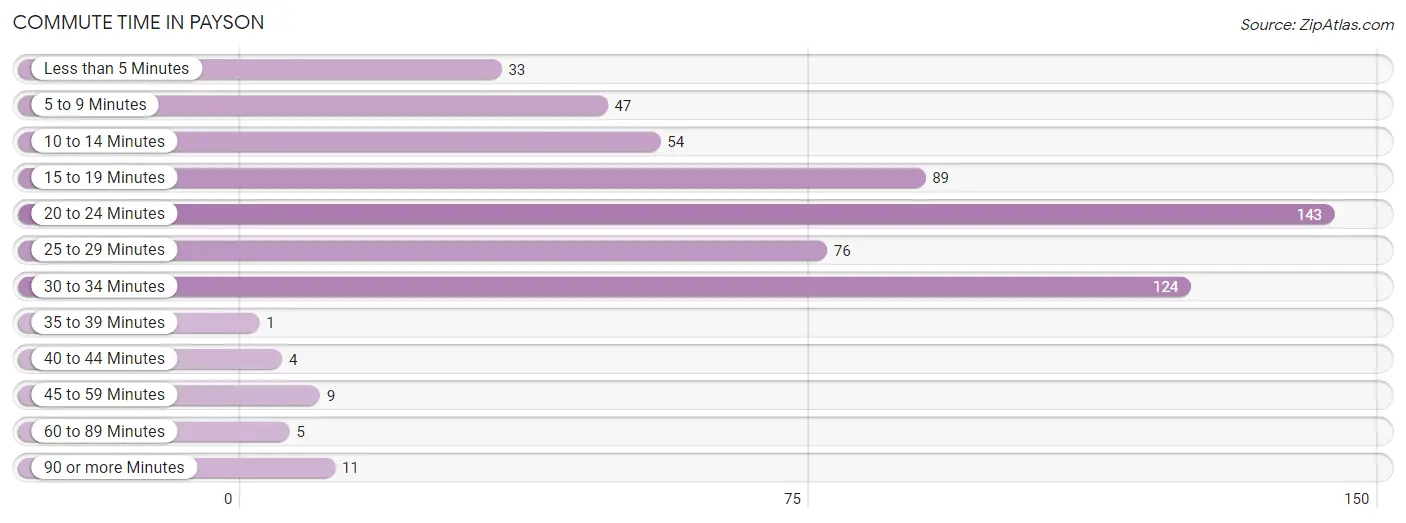
| Commute Time | # Commuters | % Commuters |
| Less than 5 Minutes | 33 | 5.5% |
| 5 to 9 Minutes | 47 | 7.9% |
| 10 to 14 Minutes | 54 | 9.1% |
| 15 to 19 Minutes | 89 | 14.9% |
| 20 to 24 Minutes | 143 | 24.0% |
| 25 to 29 Minutes | 76 | 12.8% |
| 30 to 34 Minutes | 124 | 20.8% |
| 35 to 39 Minutes | 1 | 0.2% |
| 40 to 44 Minutes | 4 | 0.7% |
| 45 to 59 Minutes | 9 | 1.5% |
| 60 to 89 Minutes | 5 | 0.8% |
| 90 or more Minutes | 11 | 1.8% |
Commute Time by Sex in Payson
The most common commute times in Payson are 30 to 34 minutes (92 commuters, 28.7%) for males and 20 to 24 minutes (71 commuters, 25.7%) for females.
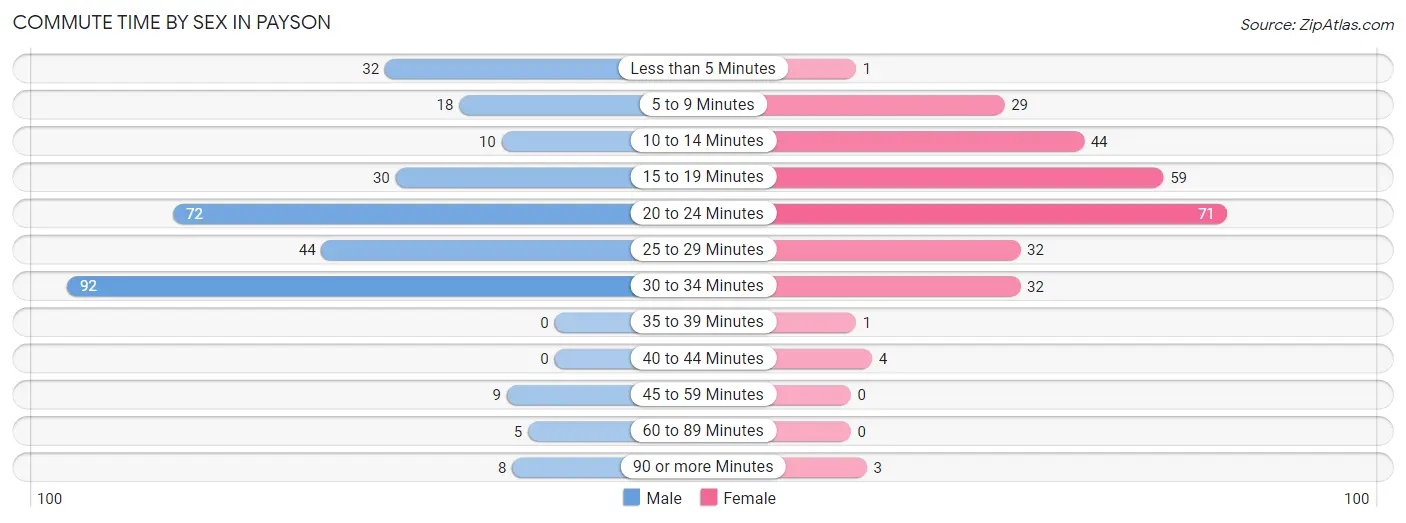
| Commute Time | Male | Female |
| Less than 5 Minutes | 32 (10.0%) | 1 (0.4%) |
| 5 to 9 Minutes | 18 (5.6%) | 29 (10.5%) |
| 10 to 14 Minutes | 10 (3.1%) | 44 (15.9%) |
| 15 to 19 Minutes | 30 (9.4%) | 59 (21.4%) |
| 20 to 24 Minutes | 72 (22.5%) | 71 (25.7%) |
| 25 to 29 Minutes | 44 (13.8%) | 32 (11.6%) |
| 30 to 34 Minutes | 92 (28.7%) | 32 (11.6%) |
| 35 to 39 Minutes | 0 (0.0%) | 1 (0.4%) |
| 40 to 44 Minutes | 0 (0.0%) | 4 (1.5%) |
| 45 to 59 Minutes | 9 (2.8%) | 0 (0.0%) |
| 60 to 89 Minutes | 5 (1.6%) | 0 (0.0%) |
| 90 or more Minutes | 8 (2.5%) | 3 (1.1%) |
Time of Departure to Work by Sex in Payson
The most frequent times of departure to work in Payson are 6:00 AM to 6:29 AM (93, 29.1%) for males and 7:00 AM to 7:29 AM (77, 27.9%) for females.
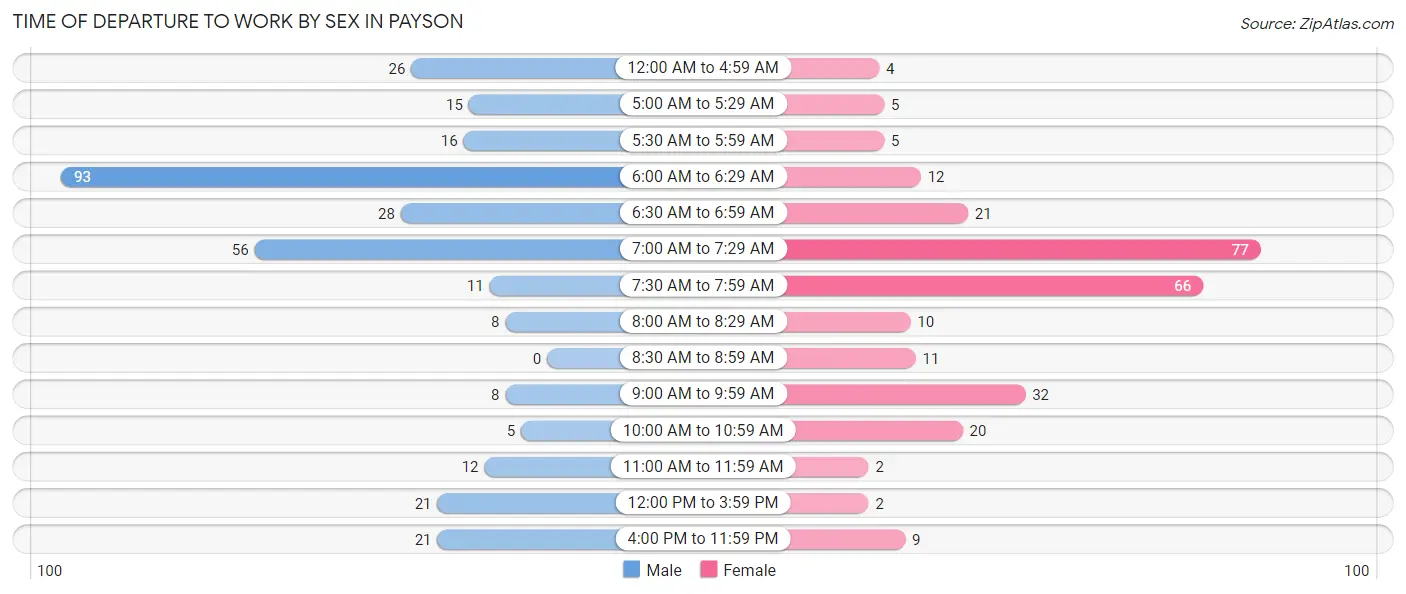
| Time of Departure | Male | Female |
| 12:00 AM to 4:59 AM | 26 (8.1%) | 4 (1.5%) |
| 5:00 AM to 5:29 AM | 15 (4.7%) | 5 (1.8%) |
| 5:30 AM to 5:59 AM | 16 (5.0%) | 5 (1.8%) |
| 6:00 AM to 6:29 AM | 93 (29.1%) | 12 (4.3%) |
| 6:30 AM to 6:59 AM | 28 (8.7%) | 21 (7.6%) |
| 7:00 AM to 7:29 AM | 56 (17.5%) | 77 (27.9%) |
| 7:30 AM to 7:59 AM | 11 (3.4%) | 66 (23.9%) |
| 8:00 AM to 8:29 AM | 8 (2.5%) | 10 (3.6%) |
| 8:30 AM to 8:59 AM | 0 (0.0%) | 11 (4.0%) |
| 9:00 AM to 9:59 AM | 8 (2.5%) | 32 (11.6%) |
| 10:00 AM to 10:59 AM | 5 (1.6%) | 20 (7.2%) |
| 11:00 AM to 11:59 AM | 12 (3.7%) | 2 (0.7%) |
| 12:00 PM to 3:59 PM | 21 (6.6%) | 2 (0.7%) |
| 4:00 PM to 11:59 PM | 21 (6.6%) | 9 (3.3%) |
| Total | 320 (100.0%) | 276 (100.0%) |
Housing Occupancy in Payson
Occupancy by Ownership in Payson
Of the total 391 dwellings in Payson, owner-occupied units account for 325 (83.1%), while renter-occupied units make up 66 (16.9%).
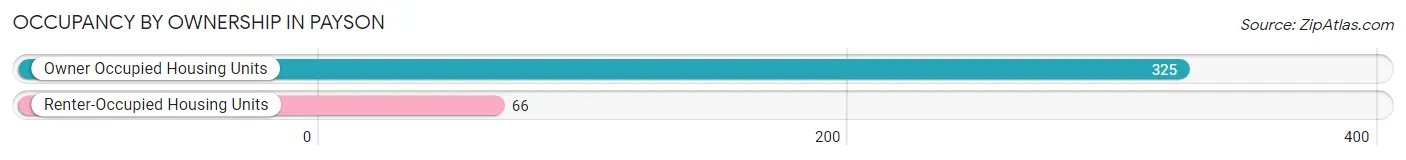
| Occupancy | # Housing Units | % Housing Units |
| Owner Occupied Housing Units | 325 | 83.1% |
| Renter-Occupied Housing Units | 66 | 16.9% |
| Total Occupied Housing Units | 391 | 100.0% |
Occupancy by Household Size in Payson
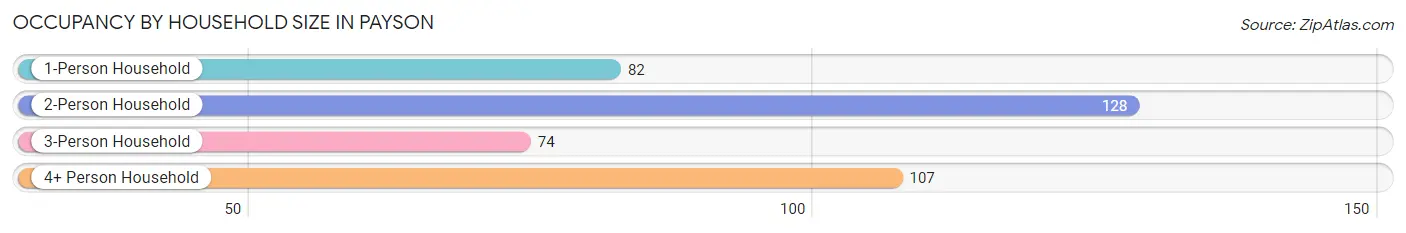
| Household Size | # Housing Units | % Housing Units |
| 1-Person Household | 82 | 21.0% |
| 2-Person Household | 128 | 32.7% |
| 3-Person Household | 74 | 18.9% |
| 4+ Person Household | 107 | 27.4% |
| Total Housing Units | 391 | 100.0% |
Occupancy by Ownership by Household Size in Payson
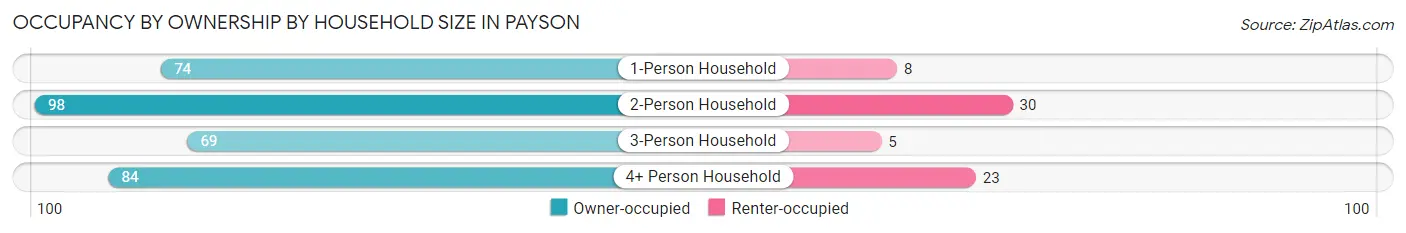
| Household Size | Owner-occupied | Renter-occupied |
| 1-Person Household | 74 (90.2%) | 8 (9.8%) |
| 2-Person Household | 98 (76.6%) | 30 (23.4%) |
| 3-Person Household | 69 (93.2%) | 5 (6.8%) |
| 4+ Person Household | 84 (78.5%) | 23 (21.5%) |
| Total Housing Units | 325 (83.1%) | 66 (16.9%) |
Occupancy by Educational Attainment in Payson
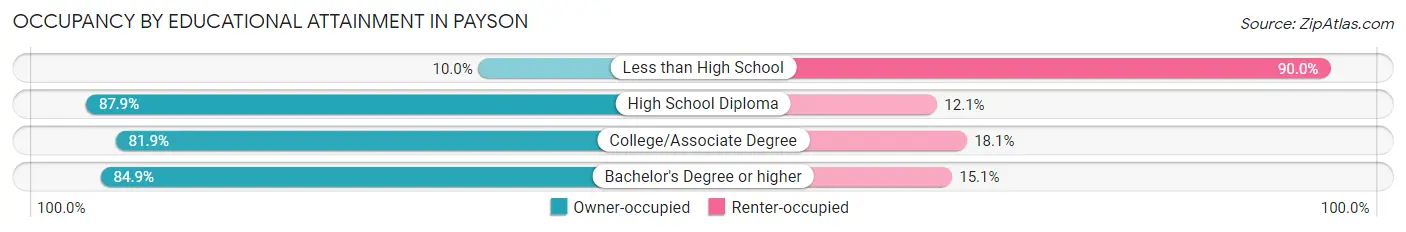
| Household Size | Owner-occupied | Renter-occupied |
| Less than High School | 1 (10.0%) | 9 (90.0%) |
| High School Diploma | 152 (87.9%) | 21 (12.1%) |
| College/Associate Degree | 127 (81.9%) | 28 (18.1%) |
| Bachelor's Degree or higher | 45 (84.9%) | 8 (15.1%) |
Occupancy by Age of Householder in Payson
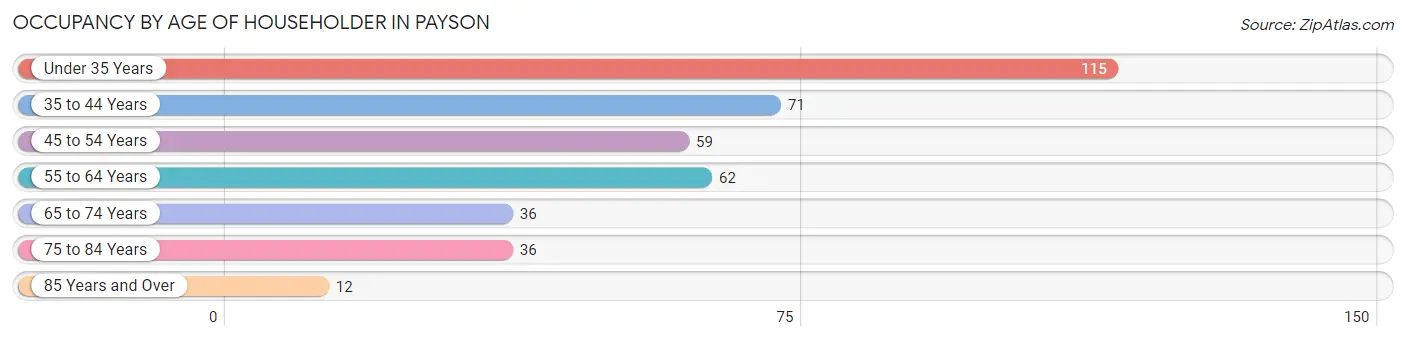
| Age Bracket | # Households | % Households |
| Under 35 Years | 115 | 29.4% |
| 35 to 44 Years | 71 | 18.2% |
| 45 to 54 Years | 59 | 15.1% |
| 55 to 64 Years | 62 | 15.9% |
| 65 to 74 Years | 36 | 9.2% |
| 75 to 84 Years | 36 | 9.2% |
| 85 Years and Over | 12 | 3.1% |
| Total | 391 | 100.0% |
Housing Finances in Payson
Median Income by Occupancy in Payson
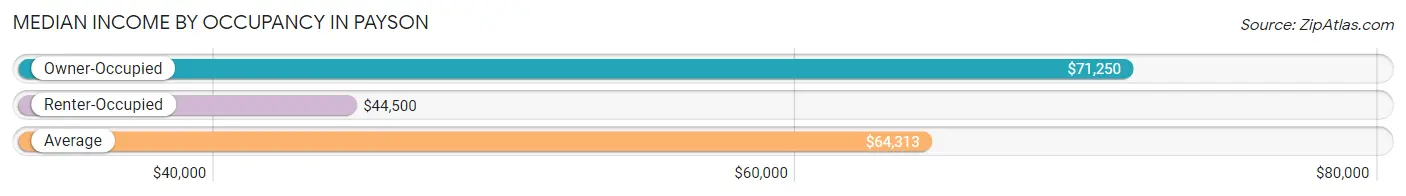
| Occupancy Type | # Households | Median Income |
| Owner-Occupied | 325 (83.1%) | $71,250 |
| Renter-Occupied | 66 (16.9%) | $44,500 |
| Average | 391 (100.0%) | $64,313 |
Occupancy by Householder Income Bracket in Payson
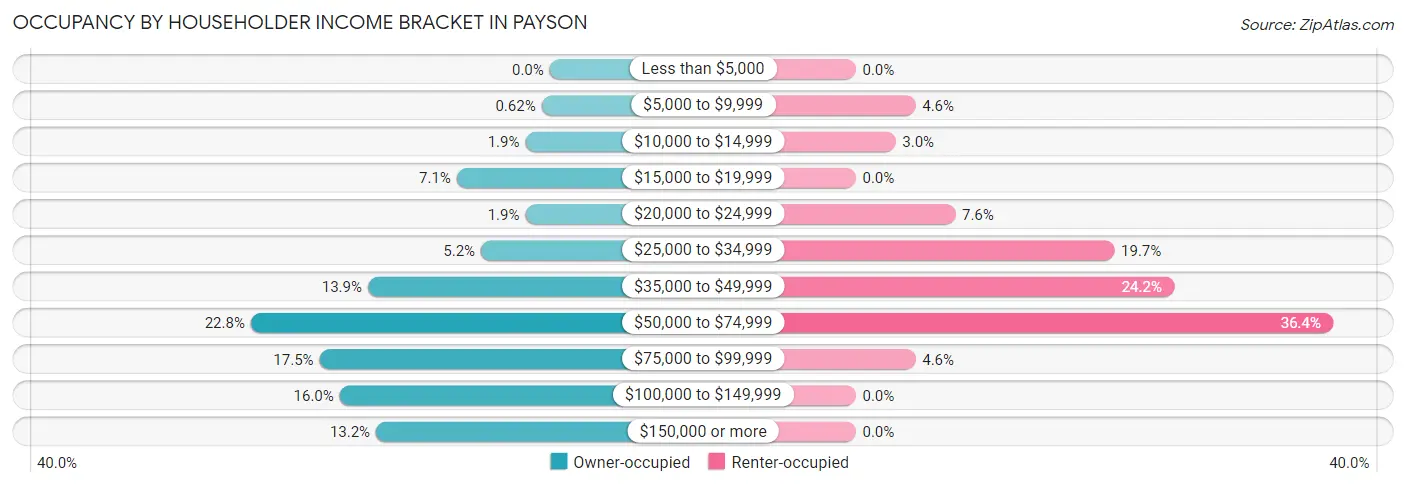
| Income Bracket | Owner-occupied | Renter-occupied |
| Less than $5,000 | 0 (0.0%) | 0 (0.0%) |
| $5,000 to $9,999 | 2 (0.6%) | 3 (4.5%) |
| $10,000 to $14,999 | 6 (1.8%) | 2 (3.0%) |
| $15,000 to $19,999 | 23 (7.1%) | 0 (0.0%) |
| $20,000 to $24,999 | 6 (1.8%) | 5 (7.6%) |
| $25,000 to $34,999 | 17 (5.2%) | 13 (19.7%) |
| $35,000 to $49,999 | 45 (13.9%) | 16 (24.2%) |
| $50,000 to $74,999 | 74 (22.8%) | 24 (36.4%) |
| $75,000 to $99,999 | 57 (17.5%) | 3 (4.5%) |
| $100,000 to $149,999 | 52 (16.0%) | 0 (0.0%) |
| $150,000 or more | 43 (13.2%) | 0 (0.0%) |
| Total | 325 (100.0%) | 66 (100.0%) |
Monthly Housing Cost Tiers in Payson
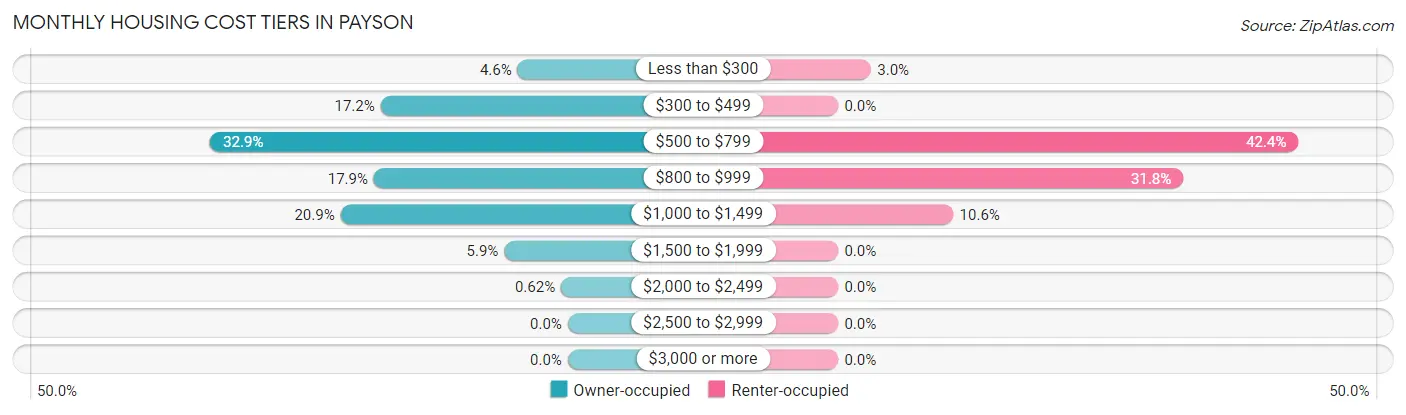
| Monthly Cost | Owner-occupied | Renter-occupied |
| Less than $300 | 15 (4.6%) | 2 (3.0%) |
| $300 to $499 | 56 (17.2%) | 0 (0.0%) |
| $500 to $799 | 107 (32.9%) | 28 (42.4%) |
| $800 to $999 | 58 (17.8%) | 21 (31.8%) |
| $1,000 to $1,499 | 68 (20.9%) | 7 (10.6%) |
| $1,500 to $1,999 | 19 (5.9%) | 0 (0.0%) |
| $2,000 to $2,499 | 2 (0.6%) | 0 (0.0%) |
| $2,500 to $2,999 | 0 (0.0%) | 0 (0.0%) |
| $3,000 or more | 0 (0.0%) | 0 (0.0%) |
| Total | 325 (100.0%) | 66 (100.0%) |
Physical Housing Characteristics in Payson
Housing Structures in Payson
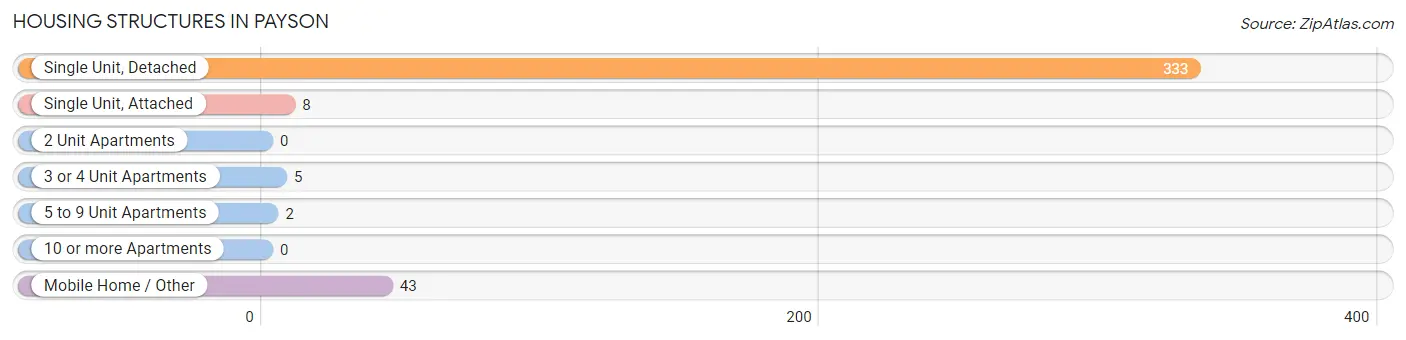
| Structure Type | # Housing Units | % Housing Units |
| Single Unit, Detached | 333 | 85.2% |
| Single Unit, Attached | 8 | 2.1% |
| 2 Unit Apartments | 0 | 0.0% |
| 3 or 4 Unit Apartments | 5 | 1.3% |
| 5 to 9 Unit Apartments | 2 | 0.5% |
| 10 or more Apartments | 0 | 0.0% |
| Mobile Home / Other | 43 | 11.0% |
| Total | 391 | 100.0% |
Housing Structures by Occupancy in Payson
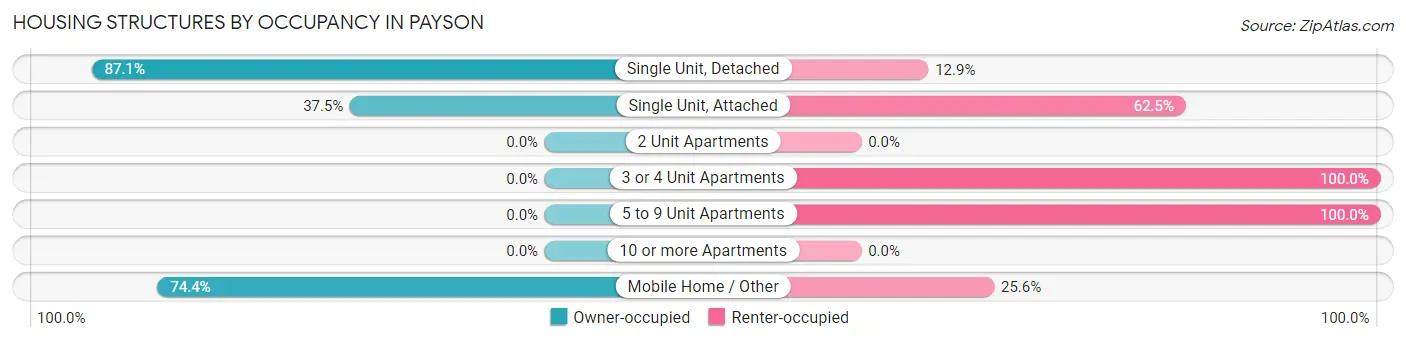
| Structure Type | Owner-occupied | Renter-occupied |
| Single Unit, Detached | 290 (87.1%) | 43 (12.9%) |
| Single Unit, Attached | 3 (37.5%) | 5 (62.5%) |
| 2 Unit Apartments | 0 (0.0%) | 0 (0.0%) |
| 3 or 4 Unit Apartments | 0 (0.0%) | 5 (100.0%) |
| 5 to 9 Unit Apartments | 0 (0.0%) | 2 (100.0%) |
| 10 or more Apartments | 0 (0.0%) | 0 (0.0%) |
| Mobile Home / Other | 32 (74.4%) | 11 (25.6%) |
| Total | 325 (83.1%) | 66 (16.9%) |
Housing Structures by Number of Rooms in Payson
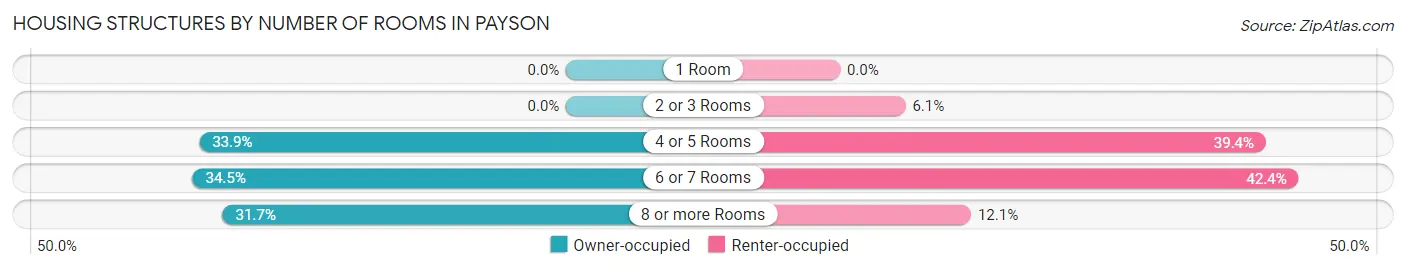
| Number of Rooms | Owner-occupied | Renter-occupied |
| 1 Room | 0 (0.0%) | 0 (0.0%) |
| 2 or 3 Rooms | 0 (0.0%) | 4 (6.1%) |
| 4 or 5 Rooms | 110 (33.9%) | 26 (39.4%) |
| 6 or 7 Rooms | 112 (34.5%) | 28 (42.4%) |
| 8 or more Rooms | 103 (31.7%) | 8 (12.1%) |
| Total | 325 (100.0%) | 66 (100.0%) |
Housing Structure by Heating Type in Payson
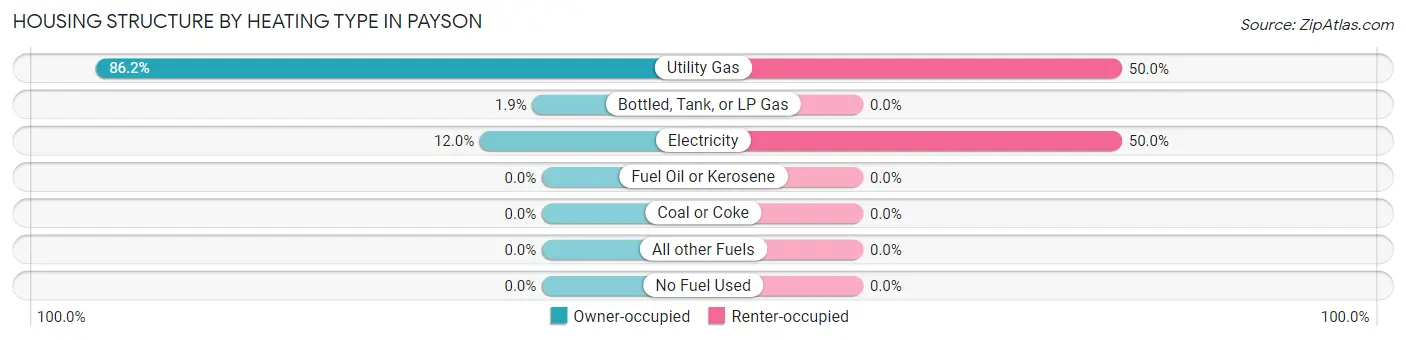
| Heating Type | Owner-occupied | Renter-occupied |
| Utility Gas | 280 (86.2%) | 33 (50.0%) |
| Bottled, Tank, or LP Gas | 6 (1.8%) | 0 (0.0%) |
| Electricity | 39 (12.0%) | 33 (50.0%) |
| Fuel Oil or Kerosene | 0 (0.0%) | 0 (0.0%) |
| Coal or Coke | 0 (0.0%) | 0 (0.0%) |
| All other Fuels | 0 (0.0%) | 0 (0.0%) |
| No Fuel Used | 0 (0.0%) | 0 (0.0%) |
| Total | 325 (100.0%) | 66 (100.0%) |
Household Vehicle Usage in Payson
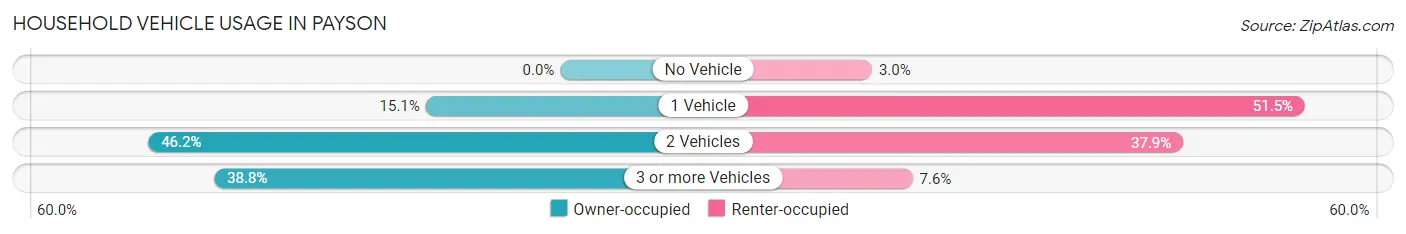
| Vehicles per Household | Owner-occupied | Renter-occupied |
| No Vehicle | 0 (0.0%) | 2 (3.0%) |
| 1 Vehicle | 49 (15.1%) | 34 (51.5%) |
| 2 Vehicles | 150 (46.2%) | 25 (37.9%) |
| 3 or more Vehicles | 126 (38.8%) | 5 (7.6%) |
| Total | 325 (100.0%) | 66 (100.0%) |
Real Estate & Mortgages in Payson
Real Estate and Mortgage Overview in Payson
| Characteristic | Without Mortgage | With Mortgage |
| Housing Units | 121 | 204 |
| Median Property Value | $125,500 | $111,700 |
| Median Household Income | $64,028 | $39 |
| Monthly Housing Costs | $488 | $0 |
| Real Estate Taxes | $2,368 | $3 |
Property Value by Mortgage Status in Payson
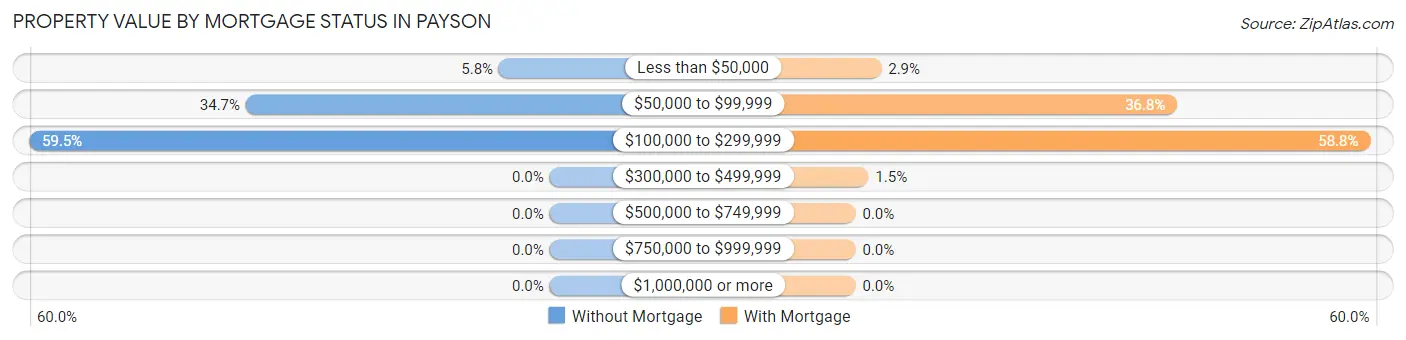
| Property Value | Without Mortgage | With Mortgage |
| Less than $50,000 | 7 (5.8%) | 6 (2.9%) |
| $50,000 to $99,999 | 42 (34.7%) | 75 (36.8%) |
| $100,000 to $299,999 | 72 (59.5%) | 120 (58.8%) |
| $300,000 to $499,999 | 0 (0.0%) | 3 (1.5%) |
| $500,000 to $749,999 | 0 (0.0%) | 0 (0.0%) |
| $750,000 to $999,999 | 0 (0.0%) | 0 (0.0%) |
| $1,000,000 or more | 0 (0.0%) | 0 (0.0%) |
| Total | 121 (100.0%) | 204 (100.0%) |
Household Income by Mortgage Status in Payson
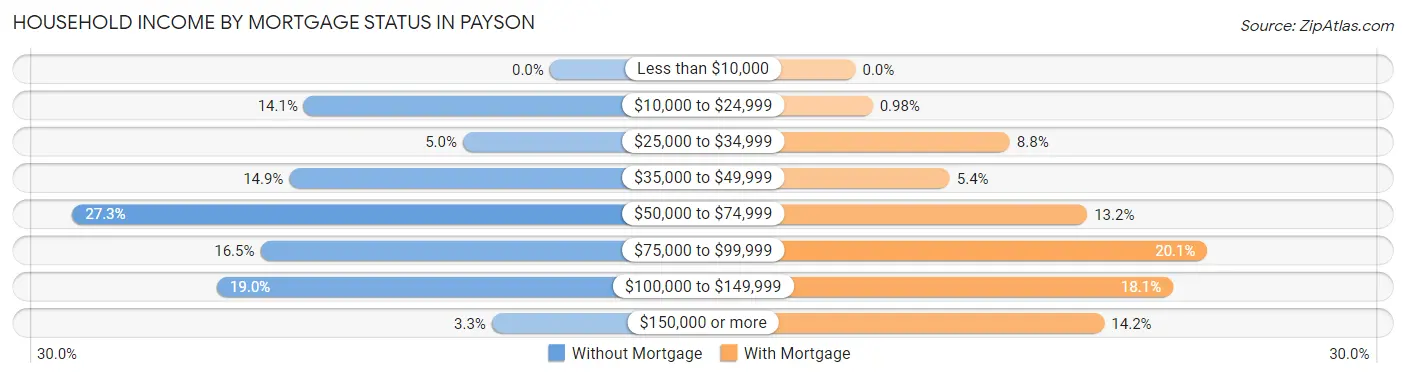
| Household Income | Without Mortgage | With Mortgage |
| Less than $10,000 | 0 (0.0%) | 0 (0.0%) |
| $10,000 to $24,999 | 17 (14.1%) | 2 (1.0%) |
| $25,000 to $34,999 | 6 (5.0%) | 18 (8.8%) |
| $35,000 to $49,999 | 18 (14.9%) | 11 (5.4%) |
| $50,000 to $74,999 | 33 (27.3%) | 27 (13.2%) |
| $75,000 to $99,999 | 20 (16.5%) | 41 (20.1%) |
| $100,000 to $149,999 | 23 (19.0%) | 37 (18.1%) |
| $150,000 or more | 4 (3.3%) | 29 (14.2%) |
| Total | 121 (100.0%) | 204 (100.0%) |
Property Value to Household Income Ratio in Payson
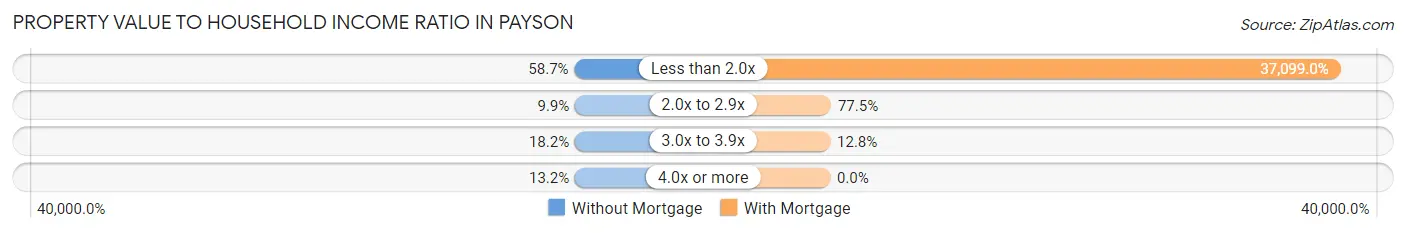
| Value-to-Income Ratio | Without Mortgage | With Mortgage |
| Less than 2.0x | 71 (58.7%) | 75,682 (37,099.0%) |
| 2.0x to 2.9x | 12 (9.9%) | 158 (77.4%) |
| 3.0x to 3.9x | 22 (18.2%) | 26 (12.8%) |
| 4.0x or more | 16 (13.2%) | 0 (0.0%) |
| Total | 121 (100.0%) | 204 (100.0%) |
Real Estate Taxes by Mortgage Status in Payson
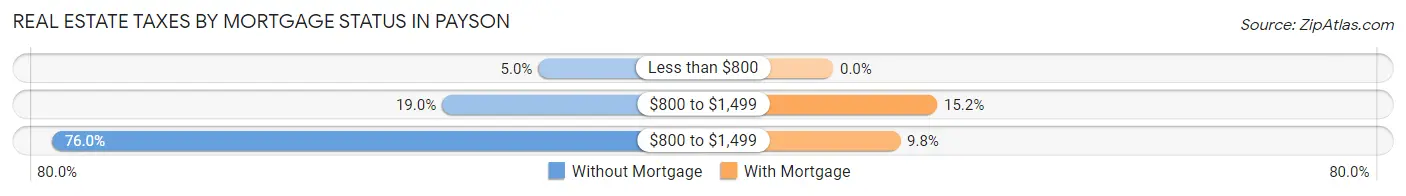
| Property Taxes | Without Mortgage | With Mortgage |
| Less than $800 | 6 (5.0%) | 0 (0.0%) |
| $800 to $1,499 | 23 (19.0%) | 31 (15.2%) |
| $800 to $1,499 | 92 (76.0%) | 20 (9.8%) |
| Total | 121 (100.0%) | 204 (100.0%) |
Health & Disability in Payson
Health Insurance Coverage by Age in Payson
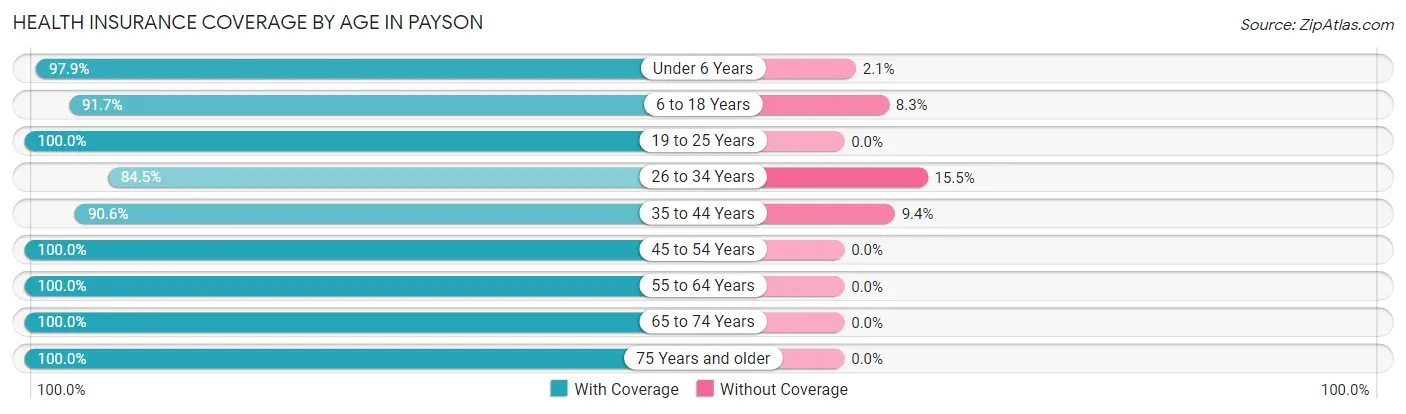
| Age Bracket | With Coverage | Without Coverage |
| Under 6 Years | 137 (97.9%) | 3 (2.1%) |
| 6 to 18 Years | 320 (91.7%) | 29 (8.3%) |
| 19 to 25 Years | 117 (100.0%) | 0 (0.0%) |
| 26 to 34 Years | 136 (84.5%) | 25 (15.5%) |
| 35 to 44 Years | 135 (90.6%) | 14 (9.4%) |
| 45 to 54 Years | 111 (100.0%) | 0 (0.0%) |
| 55 to 64 Years | 122 (100.0%) | 0 (0.0%) |
| 65 to 74 Years | 75 (100.0%) | 0 (0.0%) |
| 75 Years and older | 52 (100.0%) | 0 (0.0%) |
| Total | 1,205 (94.4%) | 71 (5.6%) |
Health Insurance Coverage by Citizenship Status in Payson
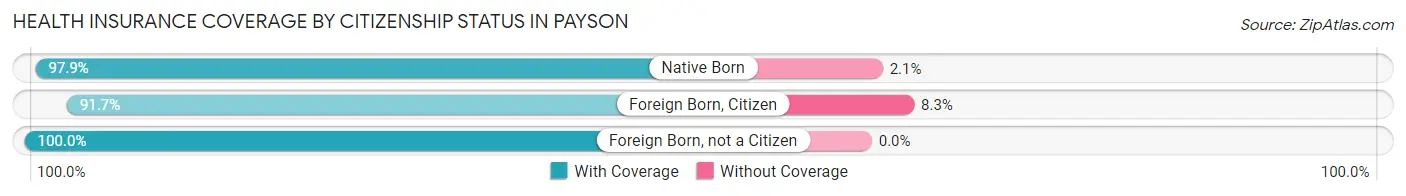
| Citizenship Status | With Coverage | Without Coverage |
| Native Born | 137 (97.9%) | 3 (2.1%) |
| Foreign Born, Citizen | 320 (91.7%) | 29 (8.3%) |
| Foreign Born, not a Citizen | 117 (100.0%) | 0 (0.0%) |
Health Insurance Coverage by Household Income in Payson
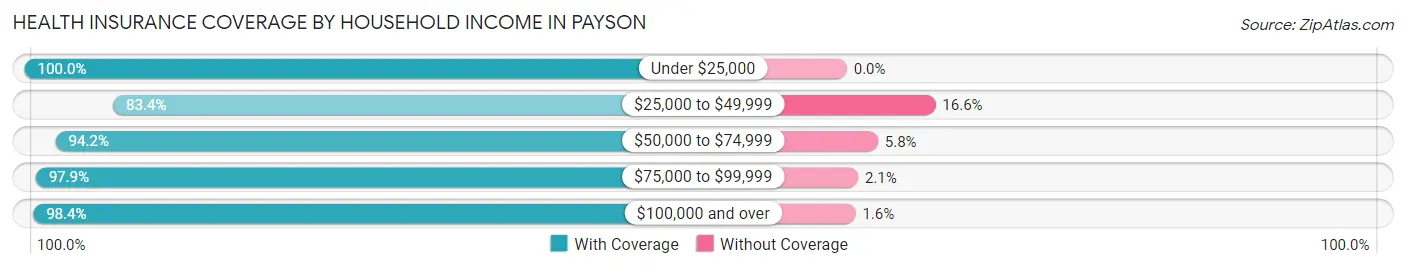
| Household Income | With Coverage | Without Coverage |
| Under $25,000 | 84 (100.0%) | 0 (0.0%) |
| $25,000 to $49,999 | 196 (83.4%) | 39 (16.6%) |
| $50,000 to $74,999 | 340 (94.2%) | 21 (5.8%) |
| $75,000 to $99,999 | 281 (97.9%) | 6 (2.1%) |
| $100,000 and over | 304 (98.4%) | 5 (1.6%) |
Public vs Private Health Insurance Coverage by Age in Payson
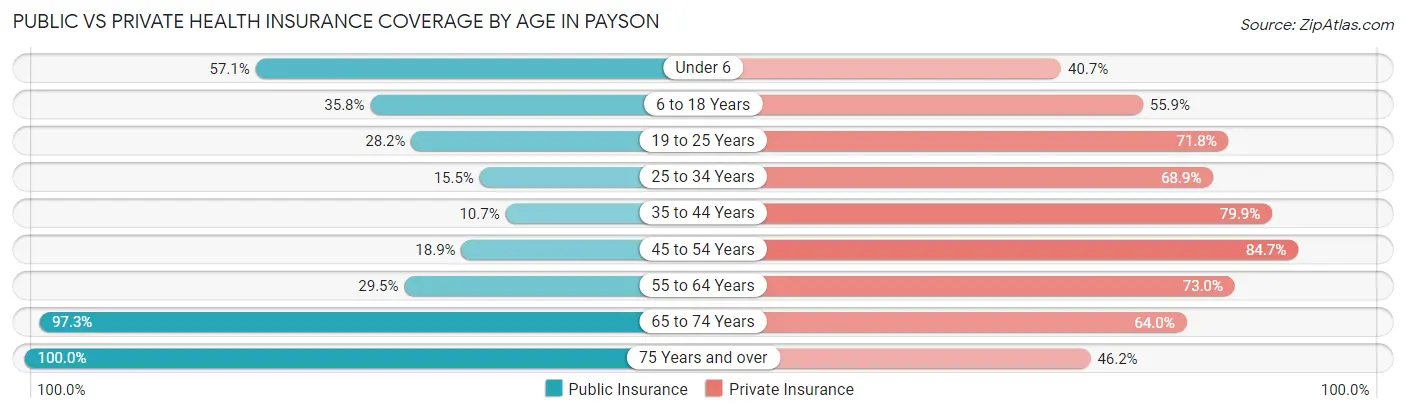
| Age Bracket | Public Insurance | Private Insurance |
| Under 6 | 80 (57.1%) | 57 (40.7%) |
| 6 to 18 Years | 125 (35.8%) | 195 (55.9%) |
| 19 to 25 Years | 33 (28.2%) | 84 (71.8%) |
| 25 to 34 Years | 25 (15.5%) | 111 (68.9%) |
| 35 to 44 Years | 16 (10.7%) | 119 (79.9%) |
| 45 to 54 Years | 21 (18.9%) | 94 (84.7%) |
| 55 to 64 Years | 36 (29.5%) | 89 (73.0%) |
| 65 to 74 Years | 73 (97.3%) | 48 (64.0%) |
| 75 Years and over | 52 (100.0%) | 24 (46.2%) |
| Total | 461 (36.1%) | 821 (64.3%) |
Disability Status by Sex by Age in Payson
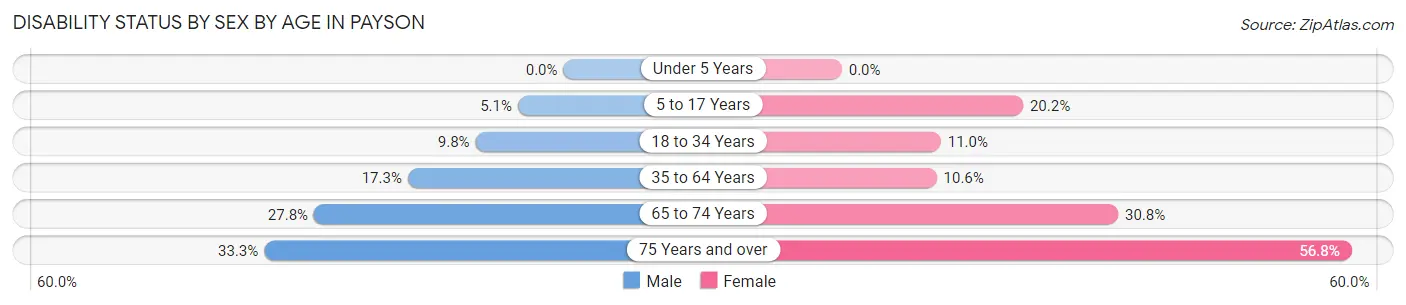
| Age Bracket | Male | Female |
| Under 5 Years | 0 (0.0%) | 0 (0.0%) |
| 5 to 17 Years | 7 (5.1%) | 45 (20.2%) |
| 18 to 34 Years | 14 (9.8%) | 16 (11.0%) |
| 35 to 64 Years | 35 (17.3%) | 19 (10.6%) |
| 65 to 74 Years | 10 (27.8%) | 12 (30.8%) |
| 75 Years and over | 5 (33.3%) | 21 (56.8%) |
Disability Class by Sex by Age in Payson
Disability Class: Hearing Difficulty
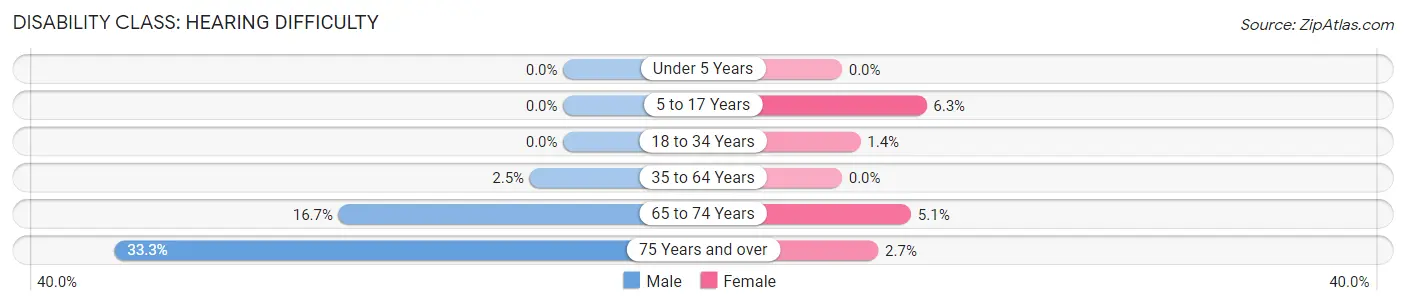
| Age Bracket | Male | Female |
| Under 5 Years | 0 (0.0%) | 0 (0.0%) |
| 5 to 17 Years | 0 (0.0%) | 14 (6.3%) |
| 18 to 34 Years | 0 (0.0%) | 2 (1.4%) |
| 35 to 64 Years | 5 (2.5%) | 0 (0.0%) |
| 65 to 74 Years | 6 (16.7%) | 2 (5.1%) |
| 75 Years and over | 5 (33.3%) | 1 (2.7%) |
Disability Class: Vision Difficulty
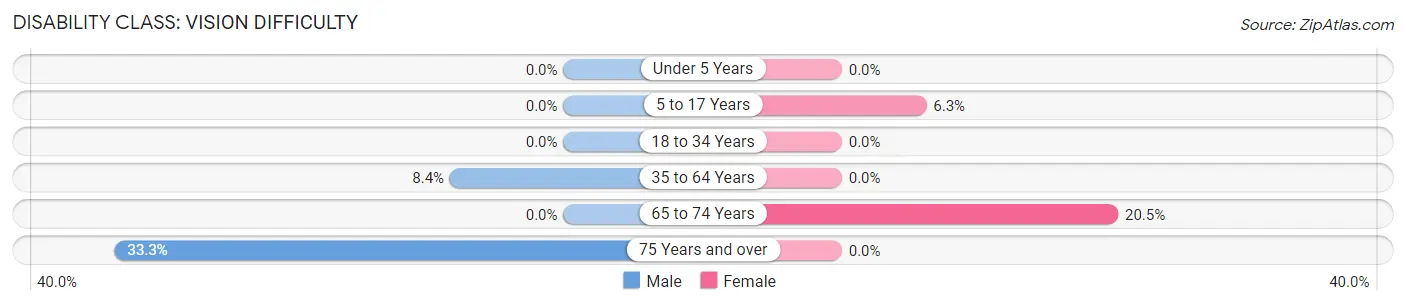
| Age Bracket | Male | Female |
| Under 5 Years | 0 (0.0%) | 0 (0.0%) |
| 5 to 17 Years | 0 (0.0%) | 14 (6.3%) |
| 18 to 34 Years | 0 (0.0%) | 0 (0.0%) |
| 35 to 64 Years | 17 (8.4%) | 0 (0.0%) |
| 65 to 74 Years | 0 (0.0%) | 8 (20.5%) |
| 75 Years and over | 5 (33.3%) | 0 (0.0%) |
Disability Class: Cognitive Difficulty
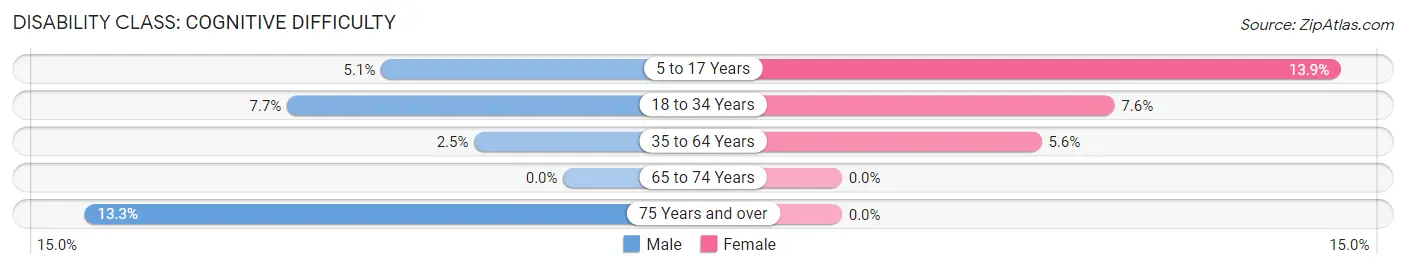
| Age Bracket | Male | Female |
| 5 to 17 Years | 7 (5.1%) | 31 (13.9%) |
| 18 to 34 Years | 11 (7.7%) | 11 (7.6%) |
| 35 to 64 Years | 5 (2.5%) | 10 (5.6%) |
| 65 to 74 Years | 0 (0.0%) | 0 (0.0%) |
| 75 Years and over | 2 (13.3%) | 0 (0.0%) |
Disability Class: Ambulatory Difficulty
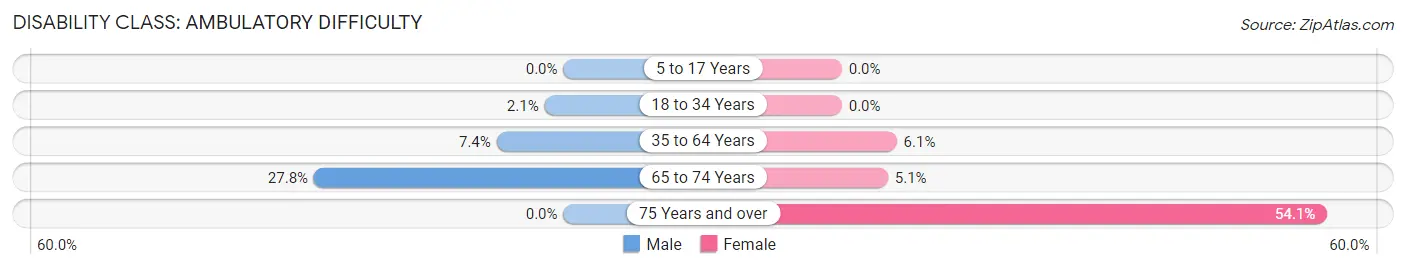
| Age Bracket | Male | Female |
| 5 to 17 Years | 0 (0.0%) | 0 (0.0%) |
| 18 to 34 Years | 3 (2.1%) | 0 (0.0%) |
| 35 to 64 Years | 15 (7.4%) | 11 (6.1%) |
| 65 to 74 Years | 10 (27.8%) | 2 (5.1%) |
| 75 Years and over | 0 (0.0%) | 20 (54.0%) |
Disability Class: Self-Care Difficulty
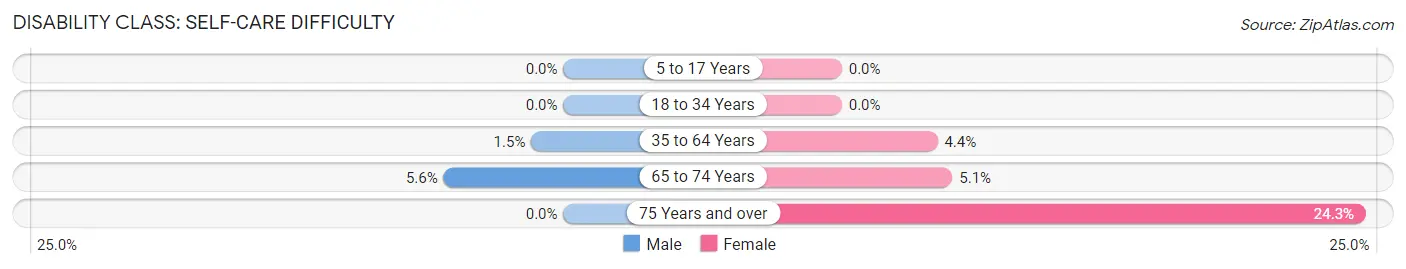
| Age Bracket | Male | Female |
| 5 to 17 Years | 0 (0.0%) | 0 (0.0%) |
| 18 to 34 Years | 0 (0.0%) | 0 (0.0%) |
| 35 to 64 Years | 3 (1.5%) | 8 (4.4%) |
| 65 to 74 Years | 2 (5.6%) | 2 (5.1%) |
| 75 Years and over | 0 (0.0%) | 9 (24.3%) |
Technology Access in Payson
Computing Device Access in Payson
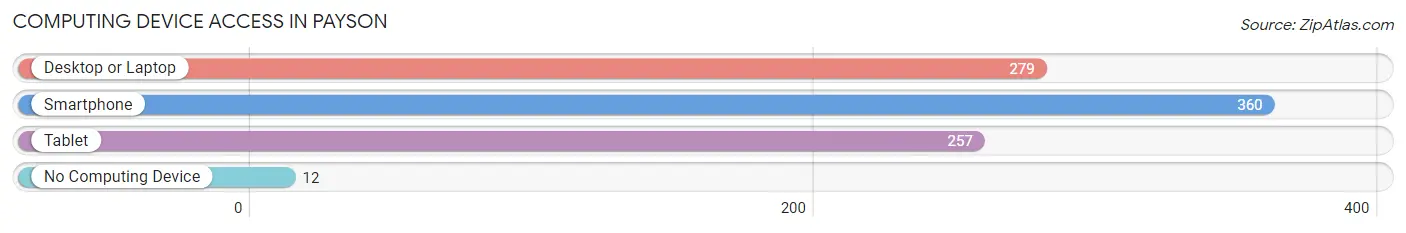
| Device Type | # Households | % Households |
| Desktop or Laptop | 279 | 71.4% |
| Smartphone | 360 | 92.1% |
| Tablet | 257 | 65.7% |
| No Computing Device | 12 | 3.1% |
| Total | 391 | 100.0% |
Internet Access in Payson
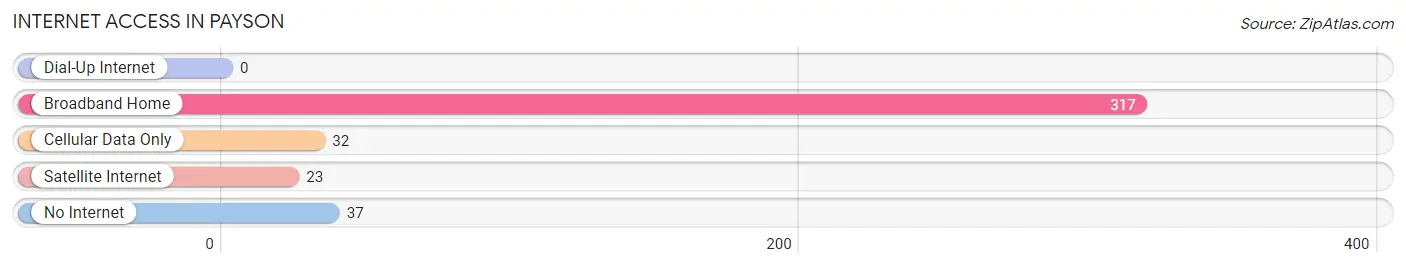
| Internet Type | # Households | % Households |
| Dial-Up Internet | 0 | 0.0% |
| Broadband Home | 317 | 81.1% |
| Cellular Data Only | 32 | 8.2% |
| Satellite Internet | 23 | 5.9% |
| No Internet | 37 | 9.5% |
| Total | 391 | 100.0% |
Payson Summary
Payson, Illinois is a small village located in Adams County, Illinois. It is situated on the banks of the Mississippi River, approximately 25 miles south of Quincy. The village has a population of 1,845 people, according to the 2010 census.
History
Payson was founded in 1837 by a group of settlers from New York. The village was named after Payson, New York, the hometown of the settlers. The village was incorporated in 1854.
In the late 19th century, Payson was a thriving river port. The village was home to several businesses, including a sawmill, a grist mill, a brickyard, and a general store. The village also had a post office, a school, and a church.
In the early 20th century, the village began to decline. The sawmill and grist mill closed, and the brickyard moved away. The population of the village decreased, and by the 1950s, the village was nearly abandoned.
In the late 20th century, the village began to experience a resurgence. The population began to increase, and new businesses opened in the village. Today, Payson is a small but vibrant community.
Geography
Payson is located in Adams County, Illinois. The village is situated on the banks of the Mississippi River, approximately 25 miles south of Quincy. The village is surrounded by rolling hills and farmland.
The climate in Payson is humid continental, with hot summers and cold winters. The average annual temperature is 54°F (12°C). The average annual precipitation is 37 inches (94 cm).
Economy
The economy of Payson is largely based on agriculture. The village is home to several farms, which produce corn, soybeans, and other crops. The village also has several small businesses, including a grocery store, a hardware store, and a restaurant.
Demographics
According to the 2010 census, the population of Payson is 1,845 people. The racial makeup of the village is 97.3% White, 0.7% African American, 0.3% Native American, 0.2% Asian, and 1.5% from other races.
The median household income in Payson is $45,000, and the median family income is $50,000. The per capita income is $20,000. The unemployment rate is 4.2%.
Conclusion
Payson, Illinois is a small village located in Adams County, Illinois. It is situated on the banks of the Mississippi River, approximately 25 miles south of Quincy. The village has a population of 1,845 people, according to the 2010 census. The economy of Payson is largely based on agriculture, and the village is home to several small businesses. The racial makeup of the village is 97.3% White, 0.7% African American, 0.3% Native American, 0.2% Asian, and 1.5% from other races. The median household income in Payson is $45,000, and the median family income is $50,000. The per capita income is $20,000. The unemployment rate is 4.2%.
Common Questions
What is Per Capita Income in Payson?
Per Capita income in Payson is $25,229.
What is the Median Family Income in Payson?
Median Family Income in Payson is $68,833.
What is the Median Household income in Payson?
Median Household Income in Payson is $64,313.
What is Income or Wage Gap in Payson?
Income or Wage Gap in Payson is 27.8%.
Women in Payson earn 72.2 cents for every dollar earned by a man.
What is Inequality or Gini Index in Payson?
Inequality or Gini Index in Payson is 0.38.
What is the Total Population of Payson?
Total Population of Payson is 1,276.
What is the Total Male Population of Payson?
Total Male Population of Payson is 628.
What is the Total Female Population of Payson?
Total Female Population of Payson is 648.
What is the Ratio of Males per 100 Females in Payson?
There are 96.91 Males per 100 Females in Payson.
What is the Ratio of Females per 100 Males in Payson?
There are 103.18 Females per 100 Males in Payson.
What is the Median Population Age in Payson?
Median Population Age in Payson is 26.8 Years.
What is the Average Family Size in Payson
Average Family Size in Payson is 3.8 People.
What is the Average Household Size in Payson
Average Household Size in Payson is 3.3 People.
How Large is the Labor Force in Payson?
There are 626 People in the Labor Forcein in Payson.
What is the Percentage of People in the Labor Force in Payson?
76.7% of People are in the Labor Force in Payson.
What is the Unemployment Rate in Payson?
Unemployment Rate in Payson is 0.6%.