Paxton, IL Map & Demographics
Paxton Map
Paxton Overview
$31,489
PER CAPITA INCOME
$81,462
AVG FAMILY INCOME
$59,040
AVG HOUSEHOLD INCOME
14.6%
WAGE / INCOME GAP [ % ]
85.4¢/ $1
WAGE / INCOME GAP [ $ ]
0.43
INEQUALITY / GINI INDEX
4,225
TOTAL POPULATION
2,209
MALE POPULATION
2,016
FEMALE POPULATION
109.57
MALES / 100 FEMALES
91.26
FEMALES / 100 MALES
40.5
MEDIAN AGE
3.1
AVG FAMILY SIZE
2.3
AVG HOUSEHOLD SIZE
1,997
LABOR FORCE [ PEOPLE ]
60.0%
PERCENT IN LABOR FORCE
1.5%
UNEMPLOYMENT RATE
Paxton Zip Codes
Paxton Area Codes
Income in Paxton
Income Overview in Paxton
Per Capita Income in Paxton is $31,489, while median incomes of families and households are $81,462 and $59,040 respectively.
| Characteristic | Number | Measure |
| Per Capita Income | 4,225 | $31,489 |
| Median Family Income | 1,002 | $81,462 |
| Mean Family Income | 1,002 | $99,314 |
| Median Household Income | 1,735 | $59,040 |
| Mean Household Income | 1,735 | $74,285 |
| Income Deficit | 1,002 | $0 |
| Wage / Income Gap (%) | 4,225 | 14.62% |
| Wage / Income Gap ($) | 4,225 | 85.38¢ per $1 |
| Gini / Inequality Index | 4,225 | 0.43 |
Earnings by Sex in Paxton
Average Earnings in Paxton are $42,545, $43,634 for men and $37,256 for women, a difference of 14.6%.
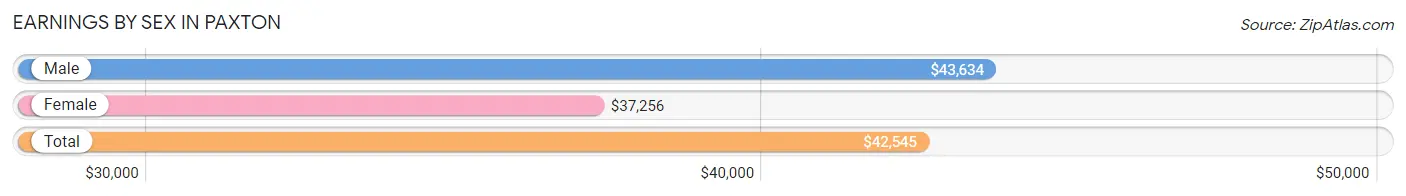
| Sex | Number | Average Earnings |
| Male | 1,121 (53.9%) | $43,634 |
| Female | 958 (46.1%) | $37,256 |
| Total | 2,079 (100.0%) | $42,545 |
Earnings by Sex by Income Bracket in Paxton
The most common earnings brackets in Paxton are $55,000 to $64,999 for men (162 | 14.4%) and $65,000 to $74,999 for women (112 | 11.7%).
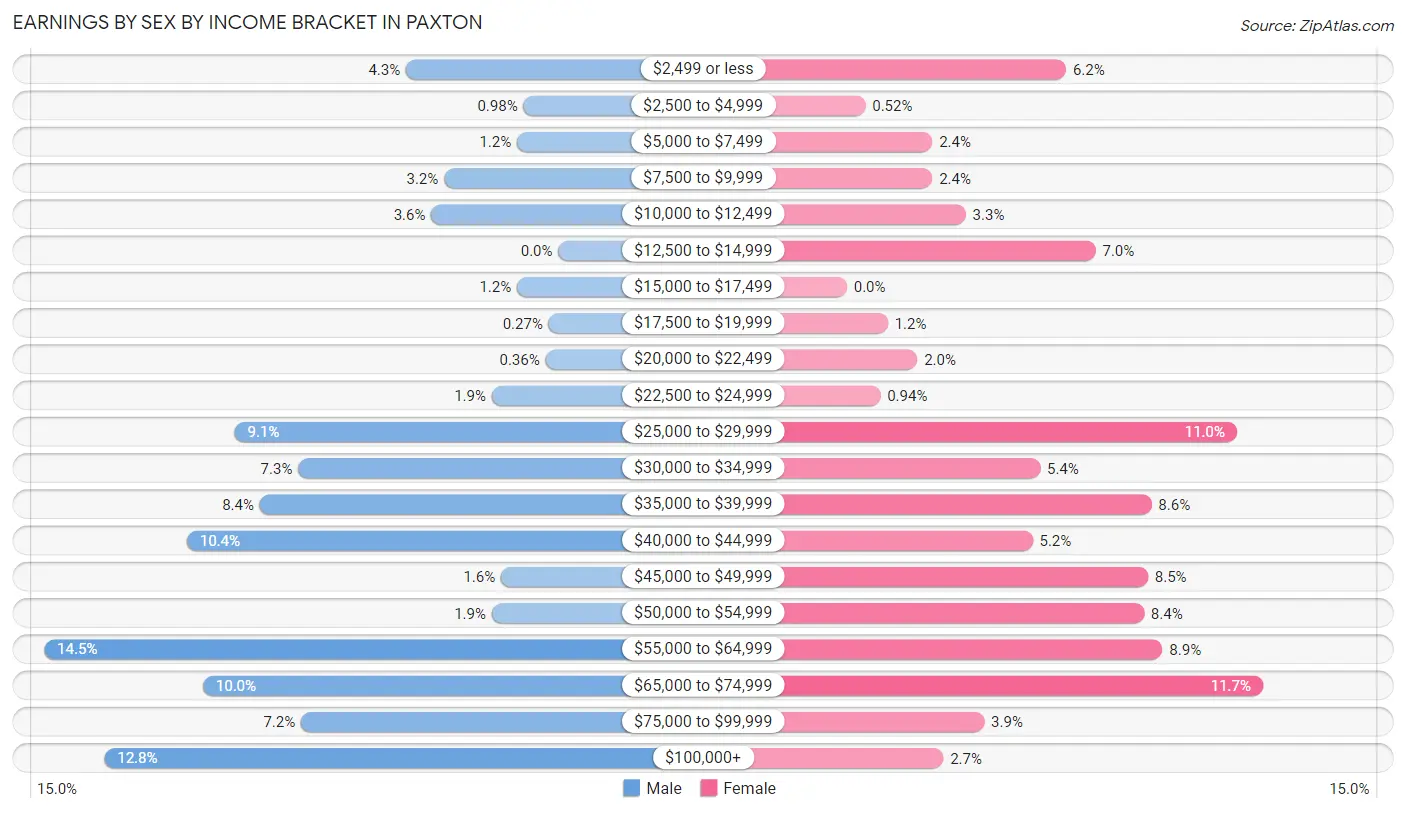
| Income | Male | Female |
| $2,499 or less | 48 (4.3%) | 59 (6.2%) |
| $2,500 to $4,999 | 11 (1.0%) | 5 (0.5%) |
| $5,000 to $7,499 | 13 (1.2%) | 23 (2.4%) |
| $7,500 to $9,999 | 36 (3.2%) | 23 (2.4%) |
| $10,000 to $12,499 | 40 (3.6%) | 32 (3.3%) |
| $12,500 to $14,999 | 0 (0.0%) | 67 (7.0%) |
| $15,000 to $17,499 | 13 (1.2%) | 0 (0.0%) |
| $17,500 to $19,999 | 3 (0.3%) | 11 (1.1%) |
| $20,000 to $22,499 | 4 (0.4%) | 19 (2.0%) |
| $22,500 to $24,999 | 21 (1.9%) | 9 (0.9%) |
| $25,000 to $29,999 | 102 (9.1%) | 105 (11.0%) |
| $30,000 to $34,999 | 82 (7.3%) | 52 (5.4%) |
| $35,000 to $39,999 | 94 (8.4%) | 82 (8.6%) |
| $40,000 to $44,999 | 117 (10.4%) | 50 (5.2%) |
| $45,000 to $49,999 | 18 (1.6%) | 81 (8.5%) |
| $50,000 to $54,999 | 21 (1.9%) | 80 (8.4%) |
| $55,000 to $64,999 | 162 (14.4%) | 85 (8.9%) |
| $65,000 to $74,999 | 112 (10.0%) | 112 (11.7%) |
| $75,000 to $99,999 | 81 (7.2%) | 37 (3.9%) |
| $100,000+ | 143 (12.8%) | 26 (2.7%) |
| Total | 1,121 (100.0%) | 958 (100.0%) |
Earnings by Sex by Educational Attainment in Paxton
Average earnings in Paxton are $55,750 for men and $43,313 for women, a difference of 22.3%. Men with an educational attainment of graduate degree enjoy the highest average annual earnings of $116,435, while those with less than high school education earn the least with $33,063. Women with an educational attainment of graduate degree earn the most with the average annual earnings of $63,106, while those with high school diploma education have the smallest earnings of $26,771.
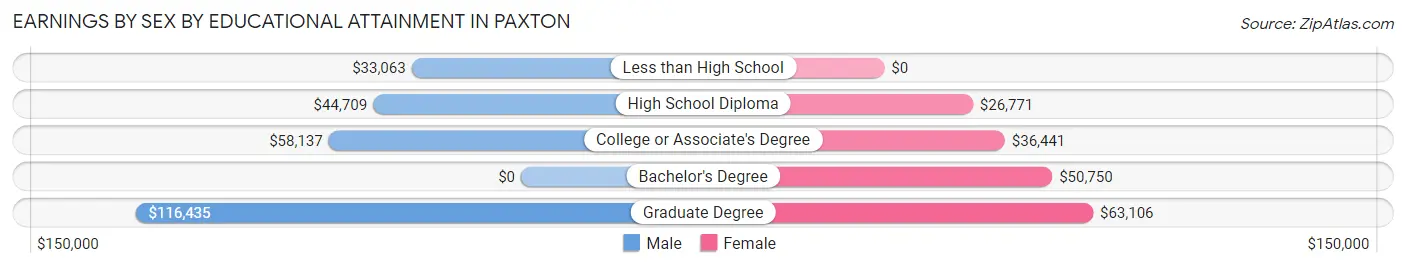
| Educational Attainment | Male Income | Female Income |
| Less than High School | $33,063 | $0 |
| High School Diploma | $44,709 | $26,771 |
| College or Associate's Degree | $58,137 | $36,441 |
| Bachelor's Degree | - | - |
| Graduate Degree | $116,435 | $63,106 |
| Total | $55,750 | $43,313 |
Family Income in Paxton
Family Income Brackets in Paxton
According to the Paxton family income data, there are 221 families falling into the $50,000 to $74,999 income range, which is the most common income bracket and makes up 22.1% of all families.
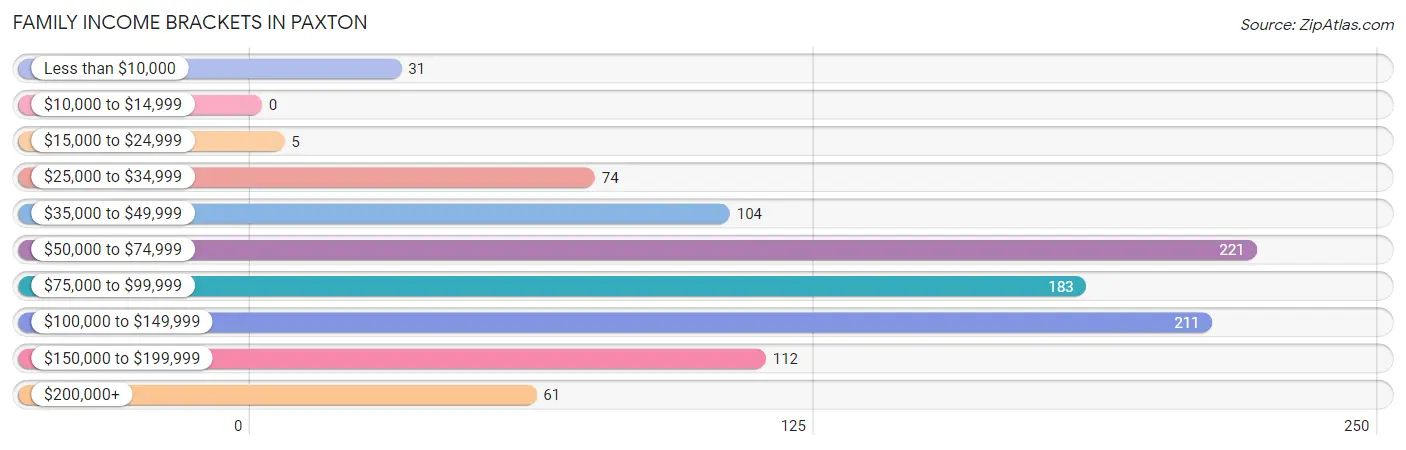
| Income Bracket | # Families | % Families |
| Less than $10,000 | 31 | 3.1% |
| $10,000 to $14,999 | 0 | 0.0% |
| $15,000 to $24,999 | 5 | 0.5% |
| $25,000 to $34,999 | 74 | 7.4% |
| $35,000 to $49,999 | 104 | 10.4% |
| $50,000 to $74,999 | 221 | 22.1% |
| $75,000 to $99,999 | 183 | 18.3% |
| $100,000 to $149,999 | 211 | 21.1% |
| $150,000 to $199,999 | 112 | 11.2% |
| $200,000+ | 61 | 6.1% |
Family Income by Famaliy Size in Paxton
3-person families (241 | 24.0%) account for the highest median family income in Paxton with $83,964 per family, while 2-person families (418 | 41.7%) have the highest median income of $39,038 per family member.
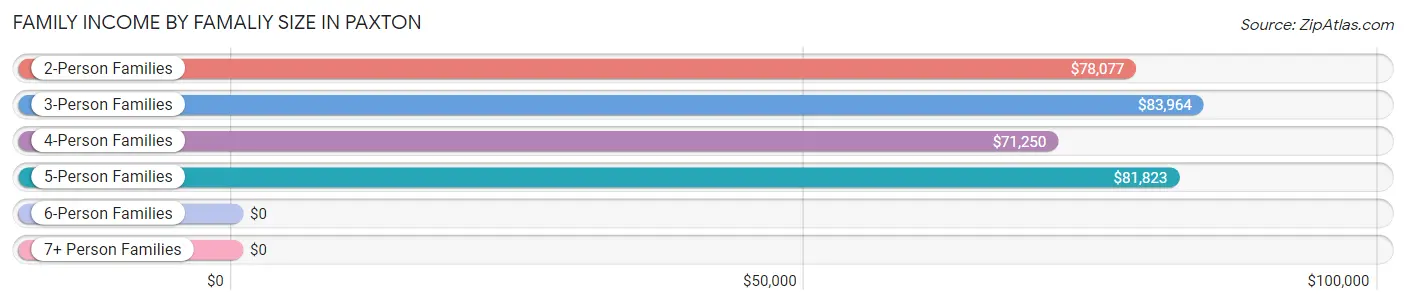
| Income Bracket | # Families | Median Income |
| 2-Person Families | 418 (41.7%) | $78,077 |
| 3-Person Families | 241 (24.0%) | $83,964 |
| 4-Person Families | 175 (17.5%) | $71,250 |
| 5-Person Families | 142 (14.2%) | $81,823 |
| 6-Person Families | 26 (2.6%) | $0 |
| 7+ Person Families | 0 (0.0%) | $0 |
| Total | 1,002 (100.0%) | $81,462 |
Family Income by Number of Earners in Paxton
The median family income in Paxton is $81,462, with families comprising 3+ earners (156) having the highest median family income of $159,000, while families with no earners (149) have the lowest median family income of $39,250, accounting for 15.6% and 14.9% of families, respectively.
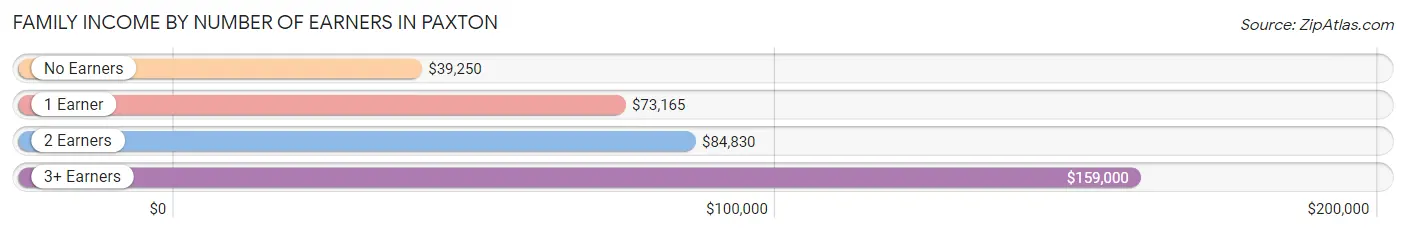
| Number of Earners | # Families | Median Income |
| No Earners | 149 (14.9%) | $39,250 |
| 1 Earner | 269 (26.9%) | $73,165 |
| 2 Earners | 428 (42.7%) | $84,830 |
| 3+ Earners | 156 (15.6%) | $159,000 |
| Total | 1,002 (100.0%) | $81,462 |
Household Income in Paxton
Household Income Brackets in Paxton
With 344 households falling in the category, the $50,000 to $74,999 income range is the most frequent in Paxton, accounting for 19.8% of all households. In contrast, only 62 households (3.6%) fall into the less than $10,000 income bracket, making it the least populous group.
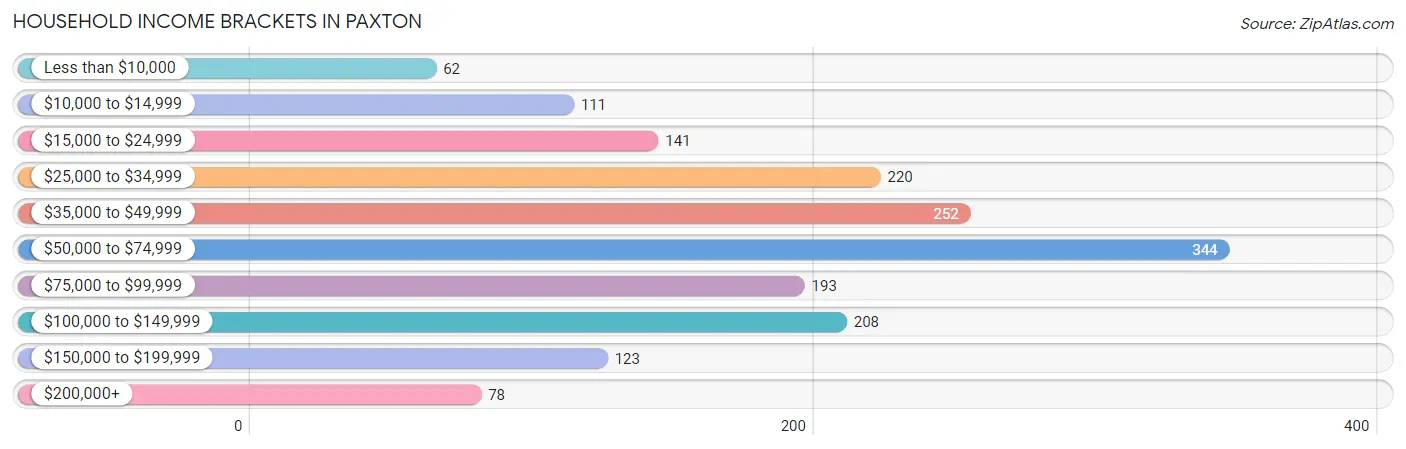
| Income Bracket | # Households | % Households |
| Less than $10,000 | 62 | 3.6% |
| $10,000 to $14,999 | 111 | 6.4% |
| $15,000 to $24,999 | 141 | 8.1% |
| $25,000 to $34,999 | 220 | 12.7% |
| $35,000 to $49,999 | 252 | 14.5% |
| $50,000 to $74,999 | 344 | 19.8% |
| $75,000 to $99,999 | 193 | 11.1% |
| $100,000 to $149,999 | 208 | 12.0% |
| $150,000 to $199,999 | 123 | 7.1% |
| $200,000+ | 78 | 4.5% |
Household Income by Householder Age in Paxton
The median household income in Paxton is $59,040, with the highest median household income of $73,625 found in the 25 to 44 years age bracket for the primary householder. A total of 635 households (36.6%) fall into this category. Meanwhile, the 15 to 24 years age bracket for the primary householder has the lowest median household income of $0, with 46 households (2.6%) in this group.
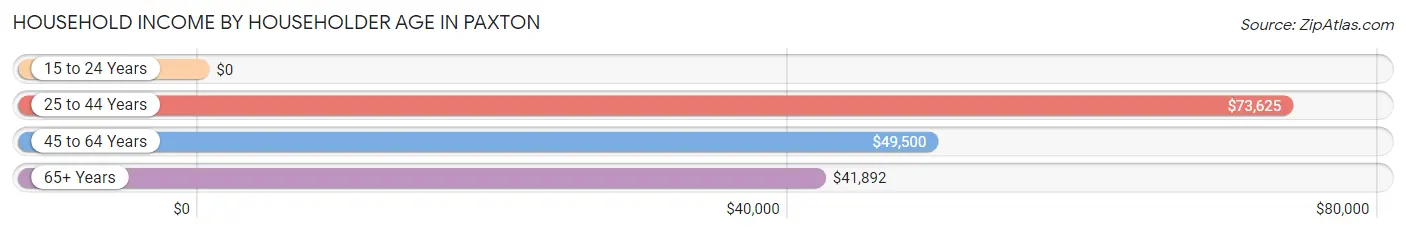
| Income Bracket | # Households | Median Income |
| 15 to 24 Years | 46 (2.6%) | $0 |
| 25 to 44 Years | 635 (36.6%) | $73,625 |
| 45 to 64 Years | 526 (30.3%) | $49,500 |
| 65+ Years | 528 (30.4%) | $41,892 |
| Total | 1,735 (100.0%) | $59,040 |
Poverty in Paxton
Income Below Poverty by Sex and Age in Paxton
With 8.9% poverty level for males and 9.8% for females among the residents of Paxton, 15 year old males and 18 to 24 year old females are the most vulnerable to poverty, with 26 males (48.1%) and 28 females (50.9%) in their respective age groups living below the poverty level.
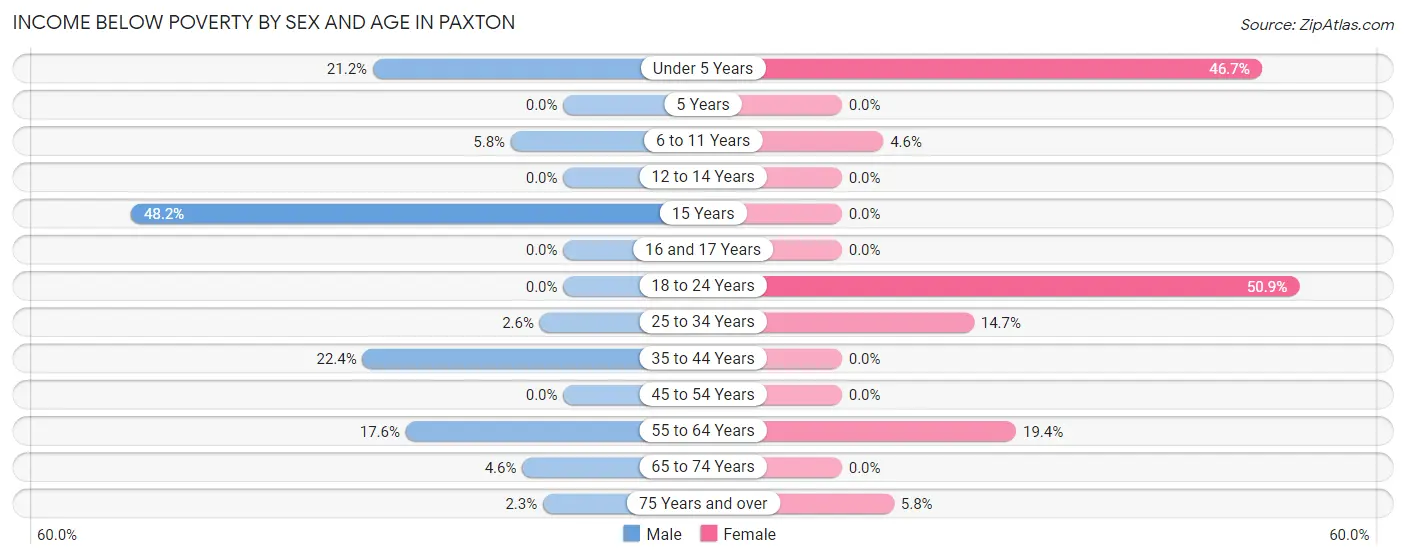
| Age Bracket | Male | Female |
| Under 5 Years | 14 (21.2%) | 43 (46.7%) |
| 5 Years | 0 (0.0%) | 0 (0.0%) |
| 6 to 11 Years | 17 (5.8%) | 7 (4.6%) |
| 12 to 14 Years | 0 (0.0%) | 0 (0.0%) |
| 15 Years | 26 (48.1%) | 0 (0.0%) |
| 16 and 17 Years | 0 (0.0%) | 0 (0.0%) |
| 18 to 24 Years | 0 (0.0%) | 28 (50.9%) |
| 25 to 34 Years | 7 (2.6%) | 41 (14.7%) |
| 35 to 44 Years | 55 (22.4%) | 0 (0.0%) |
| 45 to 54 Years | 0 (0.0%) | 0 (0.0%) |
| 55 to 64 Years | 56 (17.5%) | 53 (19.4%) |
| 65 to 74 Years | 9 (4.6%) | 0 (0.0%) |
| 75 Years and over | 3 (2.3%) | 12 (5.8%) |
| Total | 187 (8.9%) | 184 (9.8%) |
Income Above Poverty by Sex and Age in Paxton
According to the poverty statistics in Paxton, males aged 5 years and females aged 5 years are the age groups that are most secure financially, with 100.0% of males and 100.0% of females in these age groups living above the poverty line.
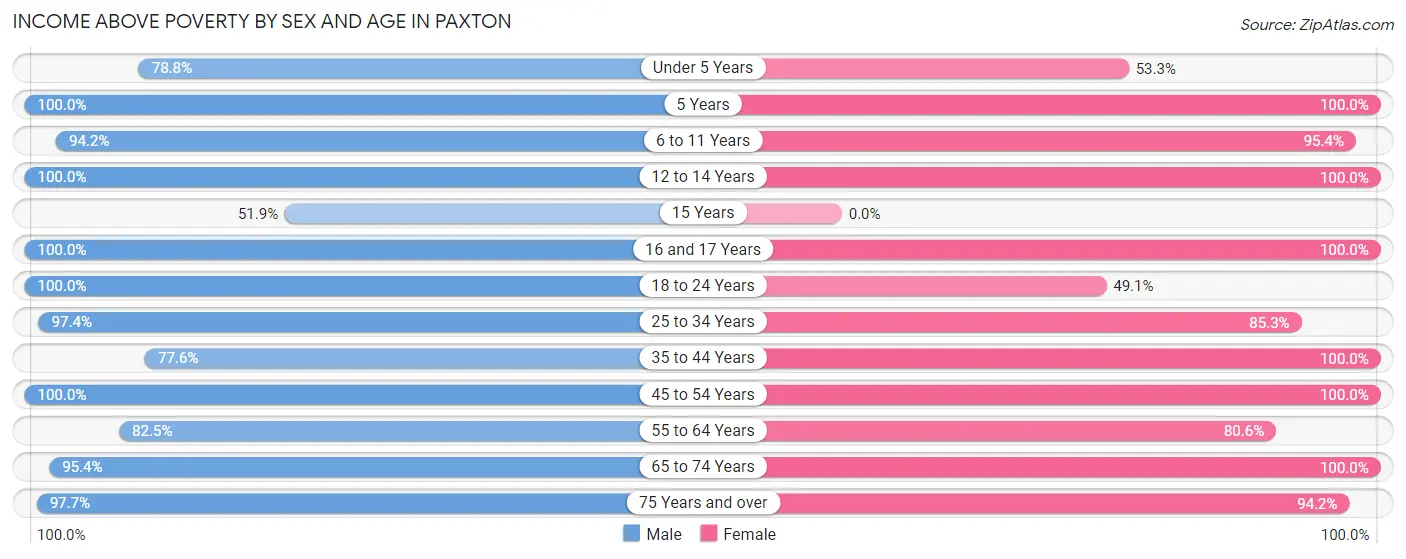
| Age Bracket | Male | Female |
| Under 5 Years | 52 (78.8%) | 49 (53.3%) |
| 5 Years | 29 (100.0%) | 22 (100.0%) |
| 6 to 11 Years | 274 (94.2%) | 145 (95.4%) |
| 12 to 14 Years | 43 (100.0%) | 93 (100.0%) |
| 15 Years | 28 (51.8%) | 0 (0.0%) |
| 16 and 17 Years | 21 (100.0%) | 61 (100.0%) |
| 18 to 24 Years | 186 (100.0%) | 27 (49.1%) |
| 25 to 34 Years | 260 (97.4%) | 238 (85.3%) |
| 35 to 44 Years | 191 (77.6%) | 245 (100.0%) |
| 45 to 54 Years | 253 (100.0%) | 216 (100.0%) |
| 55 to 64 Years | 263 (82.5%) | 220 (80.6%) |
| 65 to 74 Years | 188 (95.4%) | 191 (100.0%) |
| 75 Years and over | 130 (97.7%) | 195 (94.2%) |
| Total | 1,918 (91.1%) | 1,702 (90.2%) |
Income Below Poverty Among Married-Couple Families in Paxton
The poverty statistics for married-couple families in Paxton show that 2.7% or 22 of the total 824 families live below the poverty line. Families with 3 or 4 children have the highest poverty rate of 15.9%, comprising of 14 families. On the other hand, families with no children have the lowest poverty rate of 0.6%, which includes 3 families.
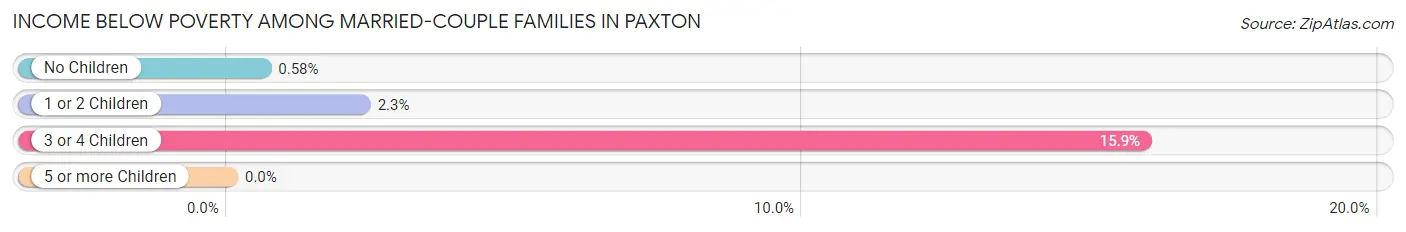
| Children | Above Poverty | Below Poverty |
| No Children | 517 (99.4%) | 3 (0.6%) |
| 1 or 2 Children | 211 (97.7%) | 5 (2.3%) |
| 3 or 4 Children | 74 (84.1%) | 14 (15.9%) |
| 5 or more Children | 0 (0.0%) | 0 (0.0%) |
| Total | 802 (97.3%) | 22 (2.7%) |
Income Below Poverty Among Single-Parent Households in Paxton
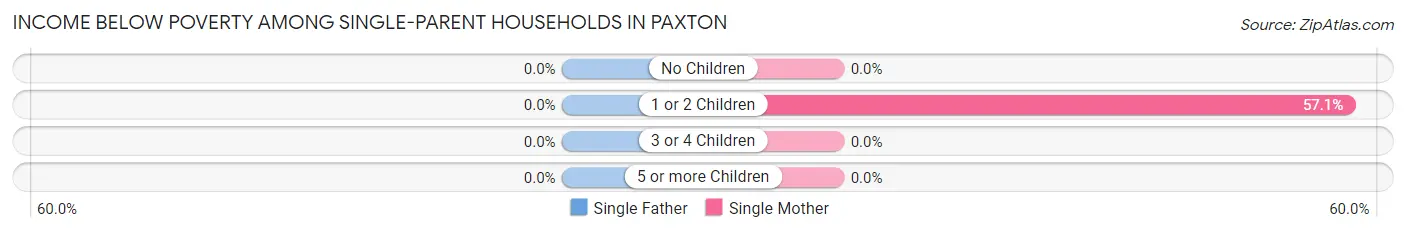
| Children | Single Father | Single Mother |
| No Children | 0 (0.0%) | 0 (0.0%) |
| 1 or 2 Children | 0 (0.0%) | 28 (57.1%) |
| 3 or 4 Children | 0 (0.0%) | 0 (0.0%) |
| 5 or more Children | 0 (0.0%) | 0 (0.0%) |
| Total | 0 (0.0%) | 28 (17.9%) |
Income Below Poverty Among Married-Couple vs Single-Parent Households in Paxton
The poverty data for Paxton shows that 22 of the married-couple family households (2.7%) and 28 of the single-parent households (15.7%) are living below the poverty level. Within the married-couple family households, those with 3 or 4 children have the highest poverty rate, with 14 households (15.9%) falling below the poverty line. Among the single-parent households, those with 1 or 2 children have the highest poverty rate, with 28 household (41.2%) living below poverty.
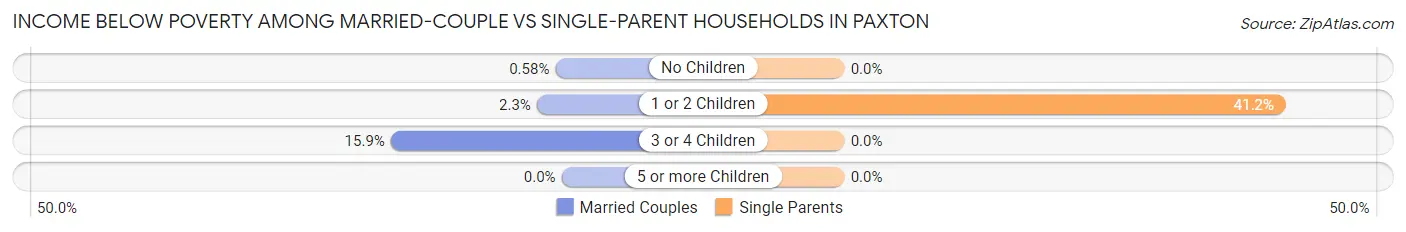
| Children | Married-Couple Families | Single-Parent Households |
| No Children | 3 (0.6%) | 0 (0.0%) |
| 1 or 2 Children | 5 (2.3%) | 28 (41.2%) |
| 3 or 4 Children | 14 (15.9%) | 0 (0.0%) |
| 5 or more Children | 0 (0.0%) | 0 (0.0%) |
| Total | 22 (2.7%) | 28 (15.7%) |
Race in Paxton
The most populous races in Paxton are White / Caucasian (3,885 | 91.9%), Hispanic or Latino (215 | 5.1%), and Two or more Races (130 | 3.1%).
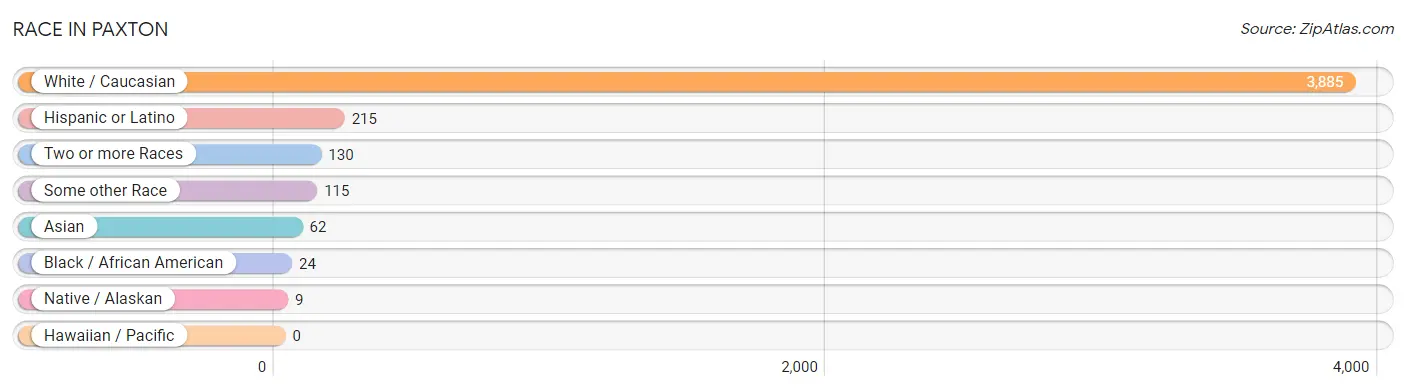
| Race | # Population | % Population |
| Asian | 62 | 1.5% |
| Black / African American | 24 | 0.6% |
| Hawaiian / Pacific | 0 | 0.0% |
| Hispanic or Latino | 215 | 5.1% |
| Native / Alaskan | 9 | 0.2% |
| White / Caucasian | 3,885 | 91.9% |
| Two or more Races | 130 | 3.1% |
| Some other Race | 115 | 2.7% |
| Total | 4,225 | 100.0% |
Ancestry in Paxton
The most populous ancestries reported in Paxton are German (921 | 21.8%), Irish (455 | 10.8%), American (439 | 10.4%), English (294 | 7.0%), and Mexican (169 | 4.0%), together accounting for 53.9% of all Paxton residents.
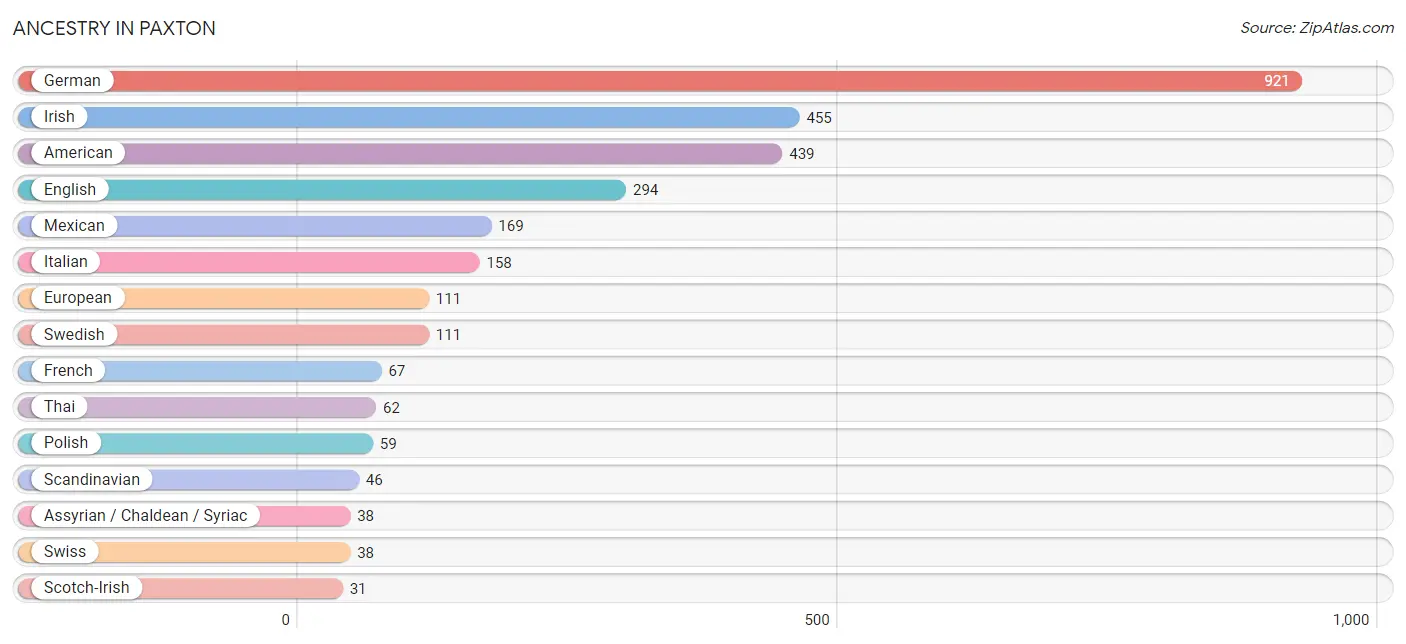
| Ancestry | # Population | % Population |
| American | 439 | 10.4% |
| Assyrian / Chaldean / Syriac | 38 | 0.9% |
| Belgian | 12 | 0.3% |
| Cherokee | 18 | 0.4% |
| Choctaw | 2 | 0.1% |
| Dutch | 23 | 0.5% |
| Ecuadorian | 8 | 0.2% |
| English | 294 | 7.0% |
| European | 111 | 2.6% |
| French | 67 | 1.6% |
| German | 921 | 21.8% |
| Hungarian | 12 | 0.3% |
| Irish | 455 | 10.8% |
| Italian | 158 | 3.7% |
| Luxembourger | 14 | 0.3% |
| Mexican | 169 | 4.0% |
| Northern European | 6 | 0.1% |
| Norwegian | 14 | 0.3% |
| Polish | 59 | 1.4% |
| Puerto Rican | 7 | 0.2% |
| Scandinavian | 46 | 1.1% |
| Scotch-Irish | 31 | 0.7% |
| Scottish | 30 | 0.7% |
| Sioux | 12 | 0.3% |
| Slovak | 8 | 0.2% |
| South American | 8 | 0.2% |
| Spaniard | 18 | 0.4% |
| Swedish | 111 | 2.6% |
| Swiss | 38 | 0.9% |
| Thai | 62 | 1.5% |
| Welsh | 2 | 0.1% | View All 31 Rows |
Immigrants in Paxton
The most numerous immigrant groups reported in Paxton came from Central America (36 | 0.9%), Latin America (36 | 0.9%), Mexico (36 | 0.9%), Eastern Europe (6 | 0.1%), and Europe (6 | 0.1%), together accounting for 2.8% of all Paxton residents.
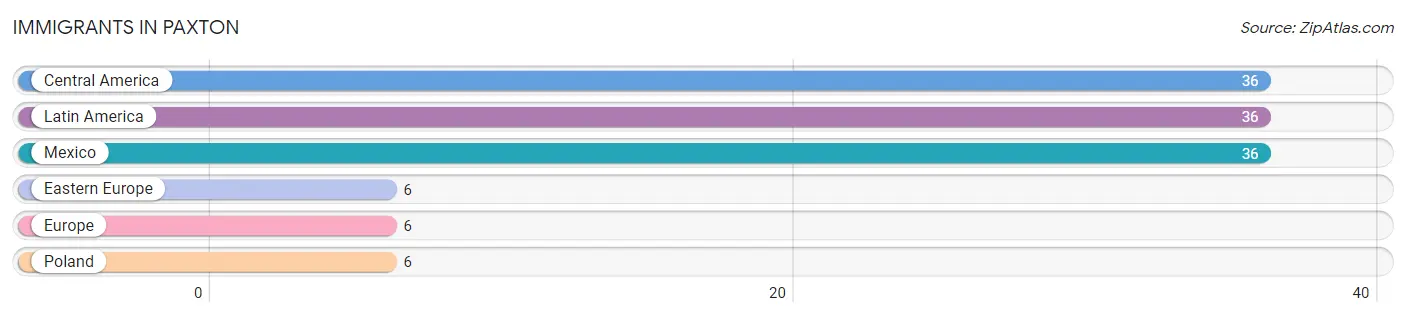
| Immigration Origin | # Population | % Population |
| Central America | 36 | 0.9% |
| Eastern Europe | 6 | 0.1% |
| Europe | 6 | 0.1% |
| Latin America | 36 | 0.9% |
| Mexico | 36 | 0.9% |
| Poland | 6 | 0.1% | View All 6 Rows |
Sex and Age in Paxton
Sex and Age in Paxton
The most populous age groups in Paxton are 60 to 64 Years (242 | 11.0%) for men and 60 to 64 Years (181 | 9.0%) for women.
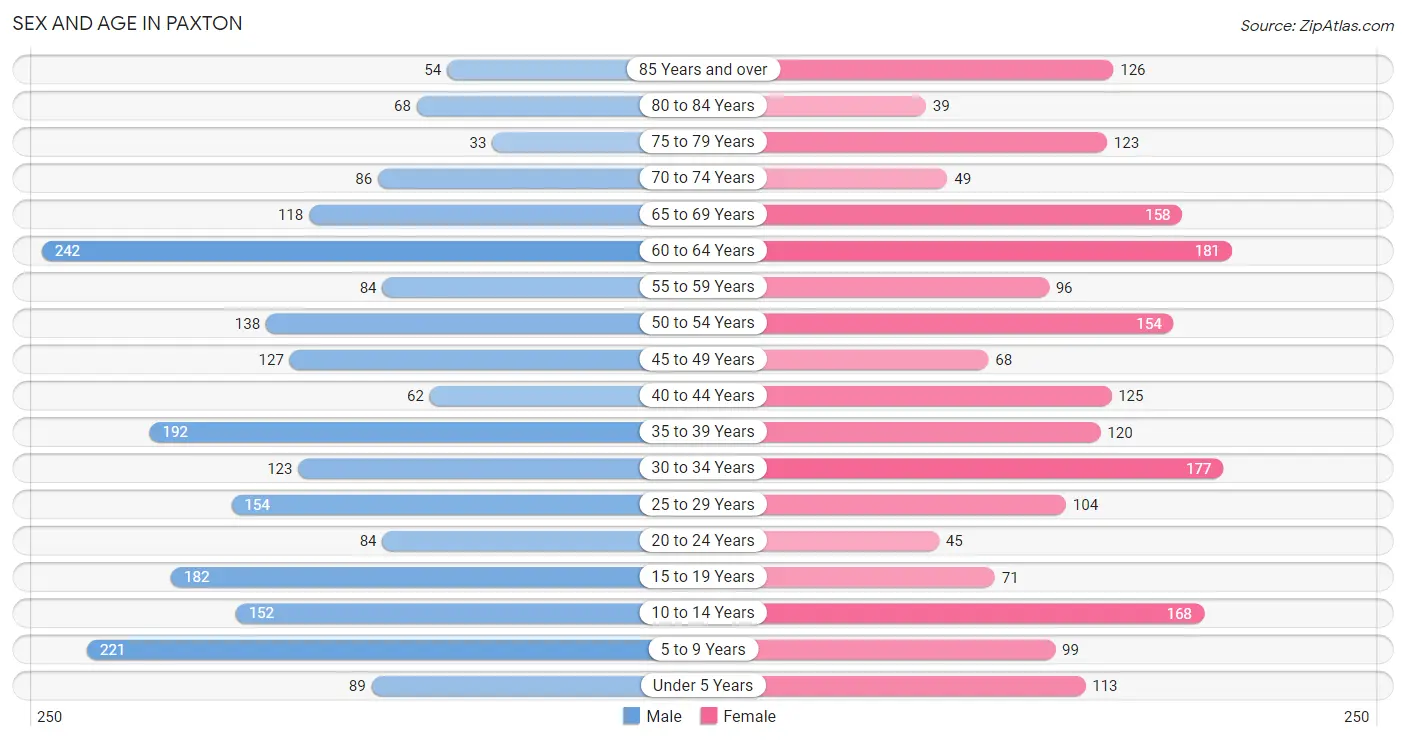
| Age Bracket | Male | Female |
| Under 5 Years | 89 (4.0%) | 113 (5.6%) |
| 5 to 9 Years | 221 (10.0%) | 99 (4.9%) |
| 10 to 14 Years | 152 (6.9%) | 168 (8.3%) |
| 15 to 19 Years | 182 (8.2%) | 71 (3.5%) |
| 20 to 24 Years | 84 (3.8%) | 45 (2.2%) |
| 25 to 29 Years | 154 (7.0%) | 104 (5.2%) |
| 30 to 34 Years | 123 (5.6%) | 177 (8.8%) |
| 35 to 39 Years | 192 (8.7%) | 120 (5.9%) |
| 40 to 44 Years | 62 (2.8%) | 125 (6.2%) |
| 45 to 49 Years | 127 (5.8%) | 68 (3.4%) |
| 50 to 54 Years | 138 (6.2%) | 154 (7.6%) |
| 55 to 59 Years | 84 (3.8%) | 96 (4.8%) |
| 60 to 64 Years | 242 (11.0%) | 181 (9.0%) |
| 65 to 69 Years | 118 (5.3%) | 158 (7.8%) |
| 70 to 74 Years | 86 (3.9%) | 49 (2.4%) |
| 75 to 79 Years | 33 (1.5%) | 123 (6.1%) |
| 80 to 84 Years | 68 (3.1%) | 39 (1.9%) |
| 85 Years and over | 54 (2.4%) | 126 (6.2%) |
| Total | 2,209 (100.0%) | 2,016 (100.0%) |
Families and Households in Paxton
Median Family Size in Paxton
The median family size in Paxton is 3.09 persons per family, with single female/mother families (156 | 15.6%) accounting for the largest median family size of 3.45 persons per family. On the other hand, single male/father families (22 | 2.2%) represent the smallest median family size with 2.41 persons per family.
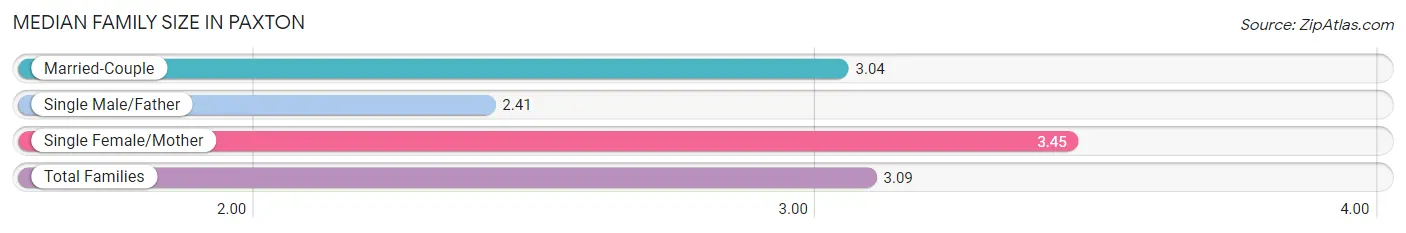
| Family Type | # Families | Family Size |
| Married-Couple | 824 (82.2%) | 3.04 |
| Single Male/Father | 22 (2.2%) | 2.41 |
| Single Female/Mother | 156 (15.6%) | 3.45 |
| Total Families | 1,002 (100.0%) | 3.09 |
Median Household Size in Paxton
The median household size in Paxton is 2.33 persons per household, with single female/mother households (156 | 9.0%) accounting for the largest median household size of 3.63 persons per household. non-family households (733 | 42.2%) represent the smallest median household size with 1.09 persons per household.
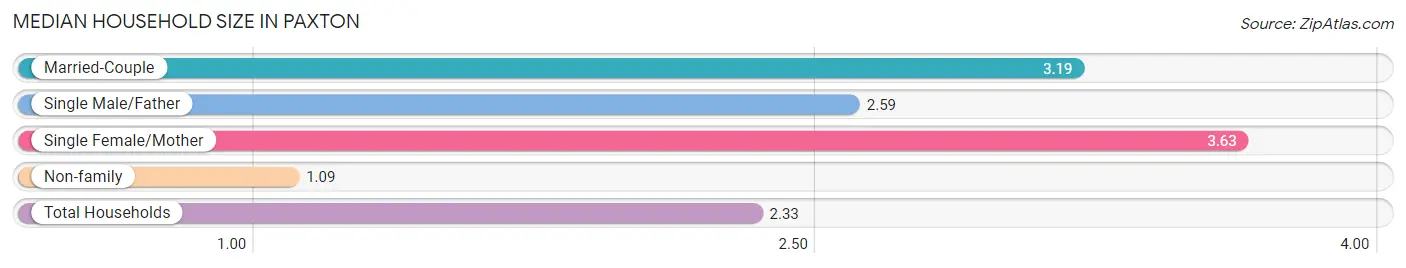
| Household Type | # Households | Household Size |
| Married-Couple | 824 (47.5%) | 3.19 |
| Single Male/Father | 22 (1.3%) | 2.59 |
| Single Female/Mother | 156 (9.0%) | 3.63 |
| Non-family | 733 (42.2%) | 1.09 |
| Total Households | 1,735 (100.0%) | 2.33 |
Household Size by Marriage Status in Paxton
Out of a total of 1,735 households in Paxton, 1,002 (57.8%) are family households, while 733 (42.2%) are nonfamily households. The most numerous type of family households are 2-person households, comprising 378, and the most common type of nonfamily households are 1-person households, comprising 687.
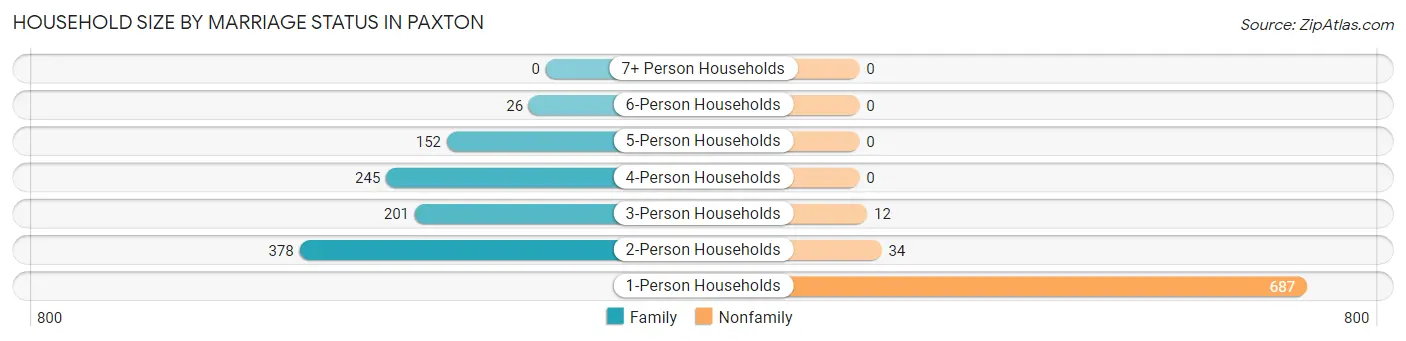
| Household Size | Family Households | Nonfamily Households |
| 1-Person Households | - | 687 (39.6%) |
| 2-Person Households | 378 (21.8%) | 34 (2.0%) |
| 3-Person Households | 201 (11.6%) | 12 (0.7%) |
| 4-Person Households | 245 (14.1%) | 0 (0.0%) |
| 5-Person Households | 152 (8.8%) | 0 (0.0%) |
| 6-Person Households | 26 (1.5%) | 0 (0.0%) |
| 7+ Person Households | 0 (0.0%) | 0 (0.0%) |
| Total | 1,002 (57.8%) | 733 (42.2%) |
Female Fertility in Paxton
Fertility by Age in Paxton
Average fertility rate in Paxton is 31.0 births per 1,000 women. Women in the age bracket of 20 to 34 years have the highest fertility rate with 67.0 births per 1,000 women. Women in the age bracket of 20 to 34 years acount for 100.0% of all women with births.
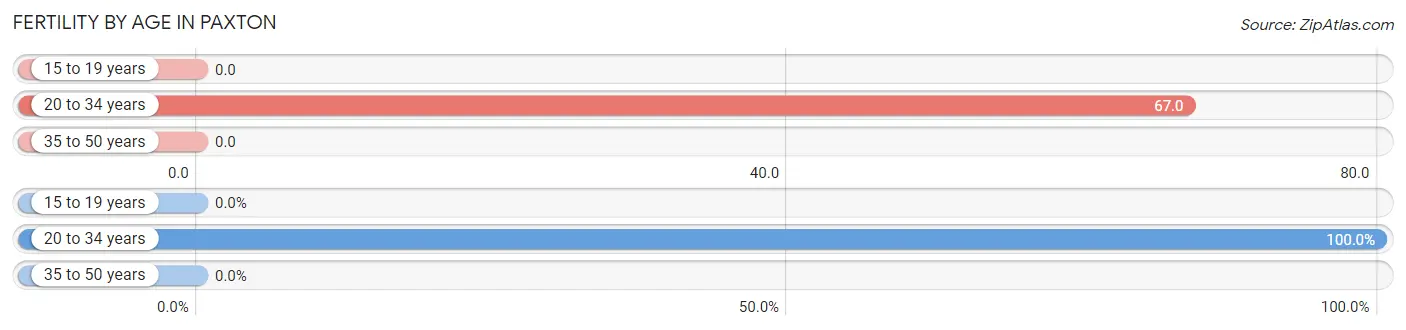
| Age Bracket | Women with Births | Births / 1,000 Women |
| 15 to 19 years | 0 (0.0%) | 0.0 |
| 20 to 34 years | 22 (100.0%) | 67.0 |
| 35 to 50 years | 0 (0.0%) | 0.0 |
| Total | 22 (100.0%) | 31.0 |
Fertility by Age by Marriage Status in Paxton
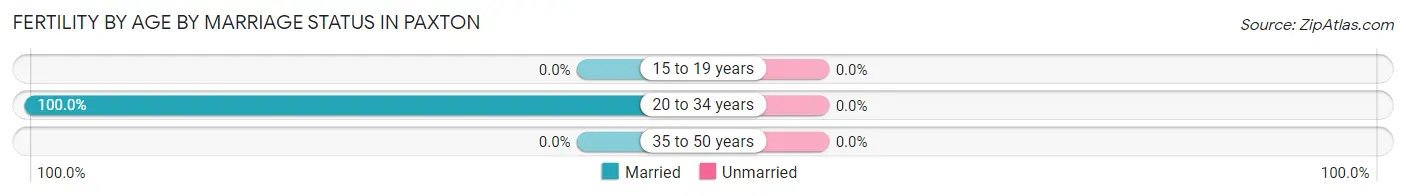
| Age Bracket | Married | Unmarried |
| 15 to 19 years | 0 (0.0%) | 0 (0.0%) |
| 20 to 34 years | 22 (100.0%) | 0 (0.0%) |
| 35 to 50 years | 0 (0.0%) | 0 (0.0%) |
| Total | 22 (100.0%) | 0 (0.0%) |
Fertility by Education in Paxton
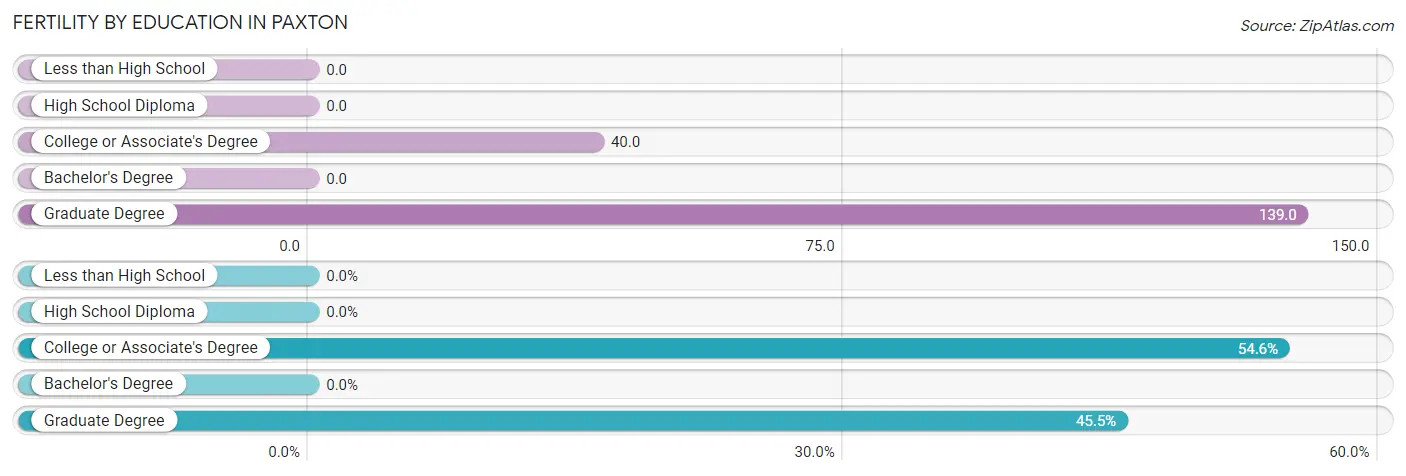
| Educational Attainment | Women with Births | Births / 1,000 Women |
| Less than High School | 0 (0.0%) | 0.0 |
| High School Diploma | 0 (0.0%) | 0.0 |
| College or Associate's Degree | 12 (54.5%) | 40.0 |
| Bachelor's Degree | 0 (0.0%) | 0.0 |
| Graduate Degree | 10 (45.5%) | 139.0 |
| Total | 22 (100.0%) | 31.0 |
Fertility by Education by Marriage Status in Paxton
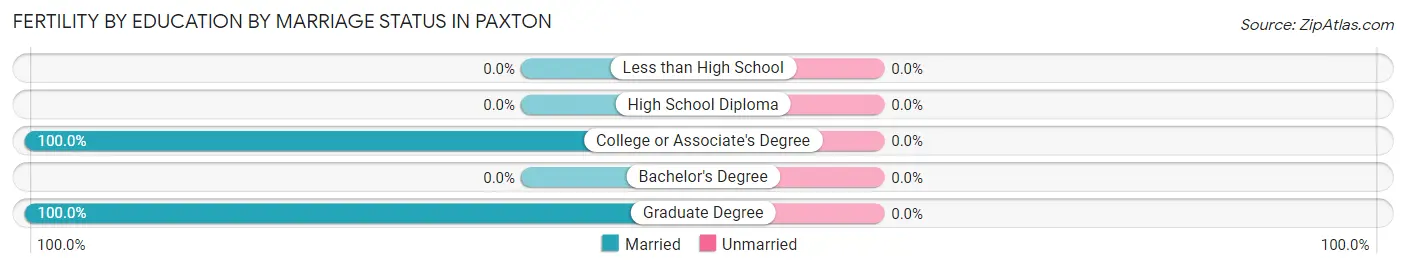
| Educational Attainment | Married | Unmarried |
| Less than High School | 0 (0.0%) | 0 (0.0%) |
| High School Diploma | 0 (0.0%) | 0 (0.0%) |
| College or Associate's Degree | 12 (100.0%) | 0 (0.0%) |
| Bachelor's Degree | 0 (0.0%) | 0 (0.0%) |
| Graduate Degree | 10 (100.0%) | 0 (0.0%) |
| Total | 22 (100.0%) | 0 (0.0%) |
Employment Characteristics in Paxton
Employment by Class of Employer in Paxton
Among the 1,967 employed individuals in Paxton, private company employees (1,378 | 70.1%), not-for-profit organizations (193 | 9.8%), and self-employed (not incorporated) (168 | 8.5%) make up the most common classes of employment.
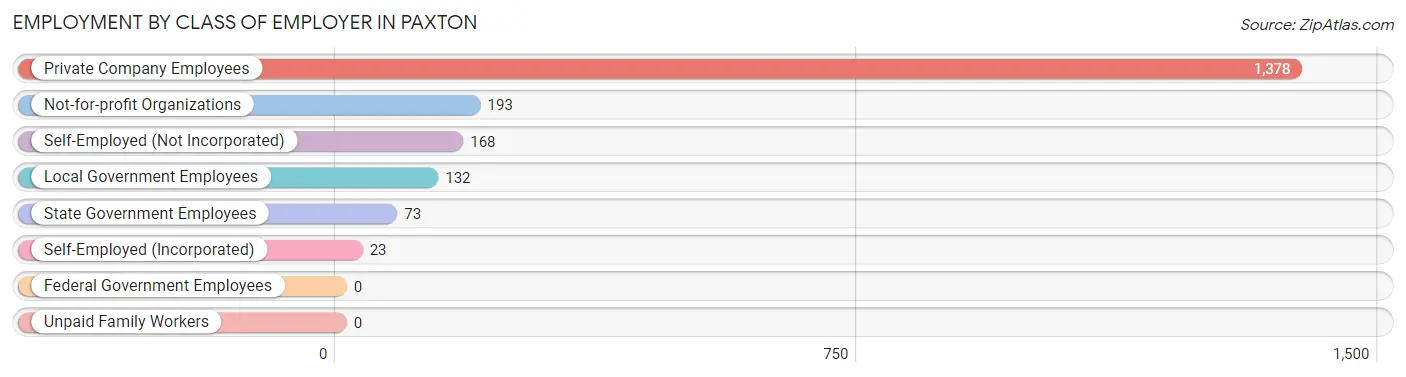
| Employer Class | # Employees | % Employees |
| Private Company Employees | 1,378 | 70.1% |
| Self-Employed (Incorporated) | 23 | 1.2% |
| Self-Employed (Not Incorporated) | 168 | 8.5% |
| Not-for-profit Organizations | 193 | 9.8% |
| Local Government Employees | 132 | 6.7% |
| State Government Employees | 73 | 3.7% |
| Federal Government Employees | 0 | 0.0% |
| Unpaid Family Workers | 0 | 0.0% |
| Total | 1,967 | 100.0% |
Employment Status by Age in Paxton
According to the labor force statistics for Paxton, out of the total population over 16 years of age (3,329), 60.0% or 1,997 individuals are in the labor force, with 1.5% or 30 of them unemployed. The age group with the highest labor force participation rate is 30 to 34 years, with 94.3% or 283 individuals in the labor force. Within the labor force, the 60 to 64 years age range has the highest percentage of unemployed individuals, with 8.3% or 15 of them being unemployed.
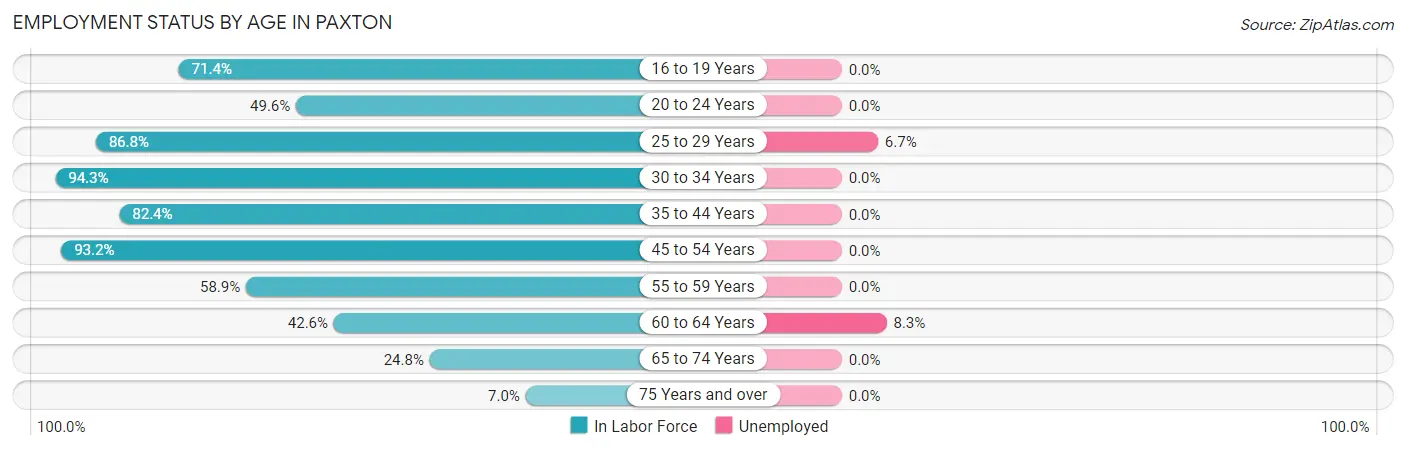
| Age Bracket | In Labor Force | Unemployed |
| 16 to 19 Years | 142 (71.4%) | 0 (0.0%) |
| 20 to 24 Years | 64 (49.6%) | 0 (0.0%) |
| 25 to 29 Years | 224 (86.8%) | 15 (6.7%) |
| 30 to 34 Years | 283 (94.3%) | 0 (0.0%) |
| 35 to 44 Years | 411 (82.4%) | 0 (0.0%) |
| 45 to 54 Years | 454 (93.2%) | 0 (0.0%) |
| 55 to 59 Years | 106 (58.9%) | 0 (0.0%) |
| 60 to 64 Years | 180 (42.6%) | 15 (8.3%) |
| 65 to 74 Years | 102 (24.8%) | 0 (0.0%) |
| 75 Years and over | 31 (7.0%) | 0 (0.0%) |
| Total | 1,997 (60.0%) | 30 (1.5%) |
Employment Status by Educational Attainment in Paxton
According to labor force statistics for Paxton, 77.2% of individuals (1,657) out of the total population between 25 and 64 years of age (2,147) are in the labor force, with 1.8% or 30 of them being unemployed. The group with the highest labor force participation rate are those with the educational attainment of bachelor's degree or higher, with 86.3% or 384 individuals in the labor force. Within the labor force, individuals with high school diploma education have the highest percentage of unemployment, with 6.7% or 30 of them being unemployed.
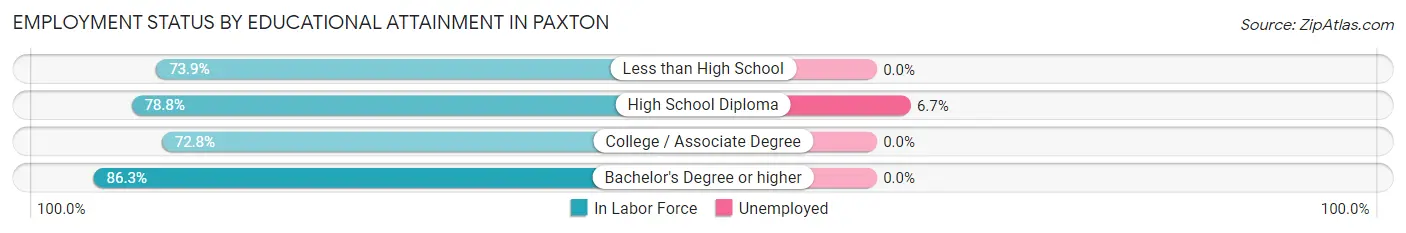
| Educational Attainment | In Labor Force | Unemployed |
| Less than High School | 65 (73.9%) | 0 (0.0%) |
| High School Diploma | 447 (78.8%) | 38 (6.7%) |
| College / Associate Degree | 762 (72.8%) | 0 (0.0%) |
| Bachelor's Degree or higher | 384 (86.3%) | 0 (0.0%) |
| Total | 1,657 (77.2%) | 39 (1.8%) |
Employment Occupations by Sex in Paxton
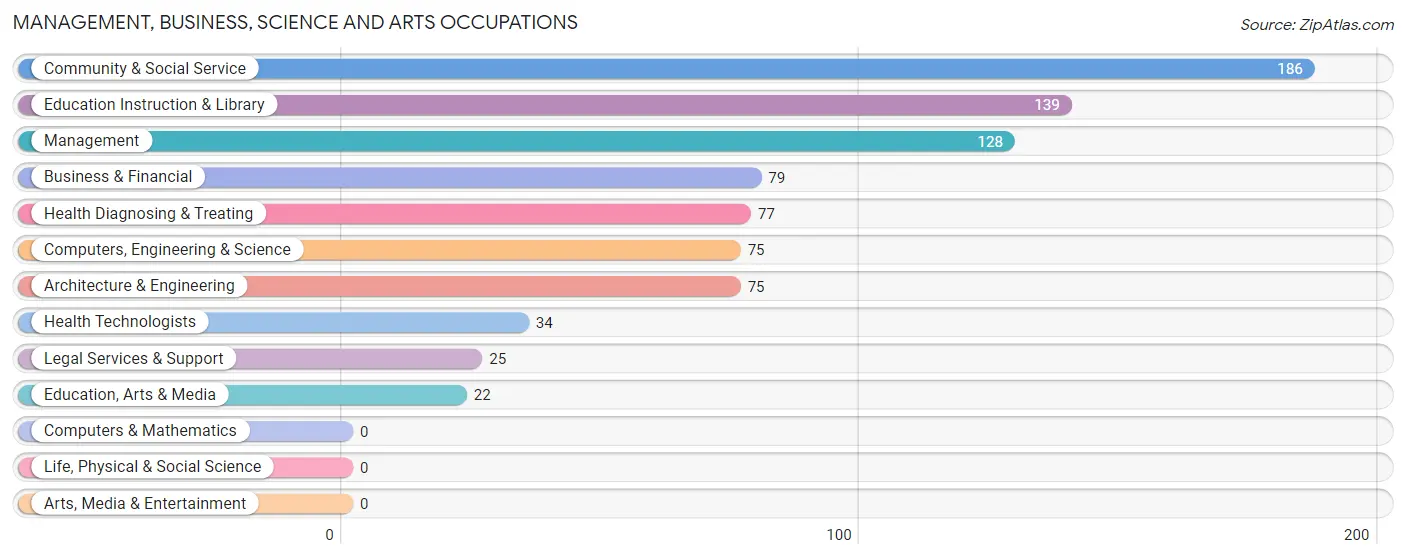
Management, Business, Science and Arts Occupations
The most common Management, Business, Science and Arts occupations in Paxton are Community & Social Service (186 | 9.5%), Education Instruction & Library (139 | 7.1%), Management (128 | 6.5%), Business & Financial (79 | 4.0%), and Health Diagnosing & Treating (77 | 3.9%).
Management, Business, Science and Arts Occupations by Sex
Within the Management, Business, Science and Arts occupations in Paxton, the most male-oriented occupations are Computers, Engineering & Science (100.0%), Architecture & Engineering (100.0%), and Business & Financial (73.4%), while the most female-oriented occupations are Education, Arts & Media (100.0%), Legal Services & Support (100.0%), and Health Diagnosing & Treating (100.0%).
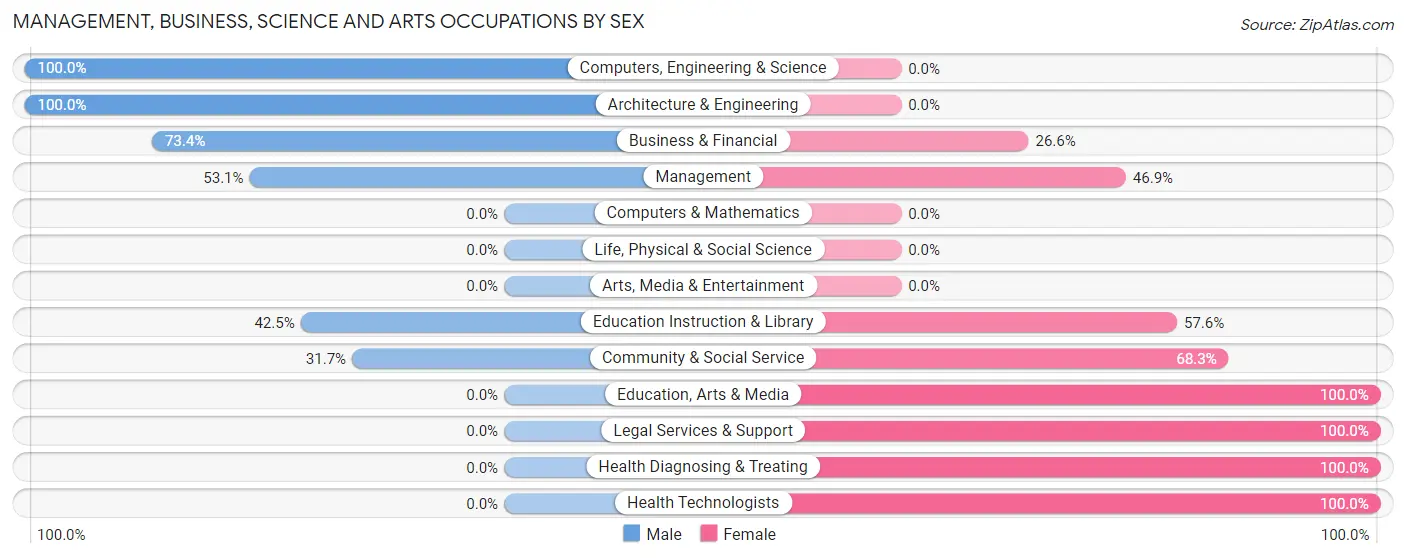
| Occupation | Male | Female |
| Management | 68 (53.1%) | 60 (46.9%) |
| Business & Financial | 58 (73.4%) | 21 (26.6%) |
| Computers, Engineering & Science | 75 (100.0%) | 0 (0.0%) |
| Computers & Mathematics | 0 (0.0%) | 0 (0.0%) |
| Architecture & Engineering | 75 (100.0%) | 0 (0.0%) |
| Life, Physical & Social Science | 0 (0.0%) | 0 (0.0%) |
| Community & Social Service | 59 (31.7%) | 127 (68.3%) |
| Education, Arts & Media | 0 (0.0%) | 22 (100.0%) |
| Legal Services & Support | 0 (0.0%) | 25 (100.0%) |
| Education Instruction & Library | 59 (42.4%) | 80 (57.6%) |
| Arts, Media & Entertainment | 0 (0.0%) | 0 (0.0%) |
| Health Diagnosing & Treating | 0 (0.0%) | 77 (100.0%) |
| Health Technologists | 0 (0.0%) | 34 (100.0%) |
| Total (Category) | 260 (47.7%) | 285 (52.3%) |
| Total (Overall) | 1,049 (53.3%) | 918 (46.7%) |
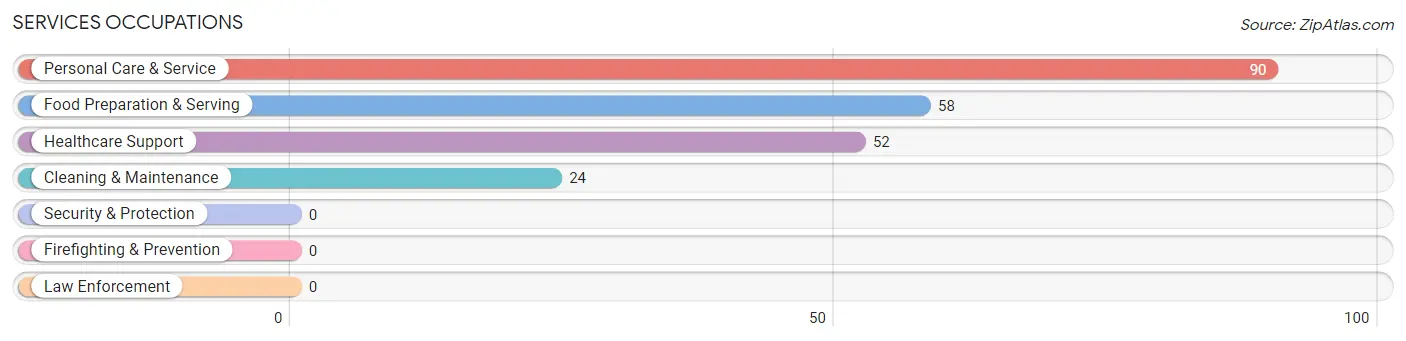
Services Occupations
The most common Services occupations in Paxton are Personal Care & Service (90 | 4.6%), Food Preparation & Serving (58 | 2.9%), Healthcare Support (52 | 2.6%), and Cleaning & Maintenance (24 | 1.2%).
Services Occupations by Sex
Within the Services occupations in Paxton, the most male-oriented occupations are Food Preparation & Serving (74.1%), Cleaning & Maintenance (45.8%), and Healthcare Support (17.3%), while the most female-oriented occupations are Personal Care & Service (100.0%), Healthcare Support (82.7%), and Cleaning & Maintenance (54.2%).
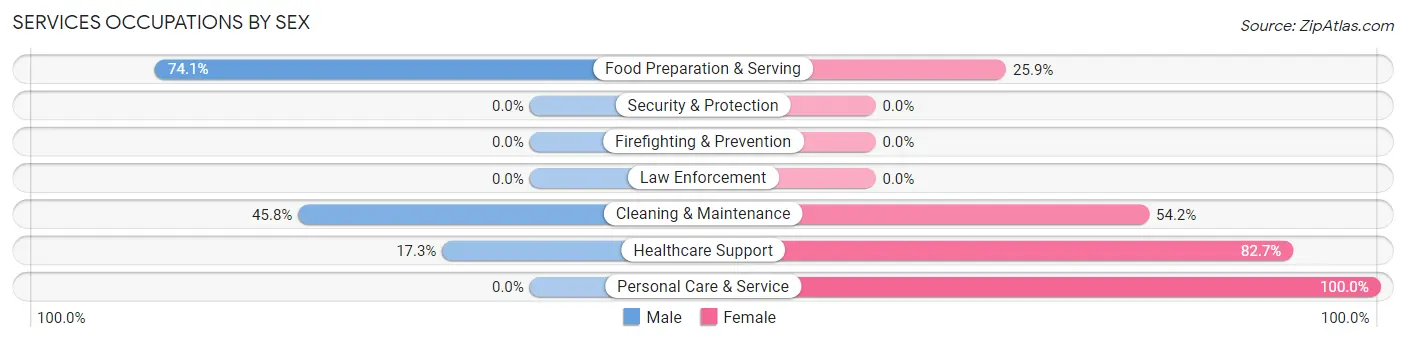
| Occupation | Male | Female |
| Healthcare Support | 9 (17.3%) | 43 (82.7%) |
| Security & Protection | 0 (0.0%) | 0 (0.0%) |
| Firefighting & Prevention | 0 (0.0%) | 0 (0.0%) |
| Law Enforcement | 0 (0.0%) | 0 (0.0%) |
| Food Preparation & Serving | 43 (74.1%) | 15 (25.9%) |
| Cleaning & Maintenance | 11 (45.8%) | 13 (54.2%) |
| Personal Care & Service | 0 (0.0%) | 90 (100.0%) |
| Total (Category) | 63 (28.1%) | 161 (71.9%) |
| Total (Overall) | 1,049 (53.3%) | 918 (46.7%) |
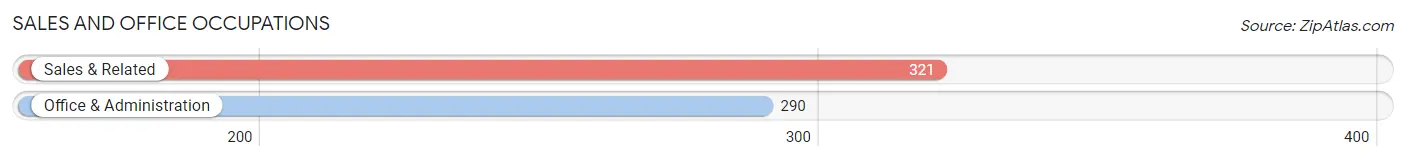
Sales and Office Occupations
The most common Sales and Office occupations in Paxton are Sales & Related (321 | 16.3%), and Office & Administration (290 | 14.7%).
Sales and Office Occupations by Sex
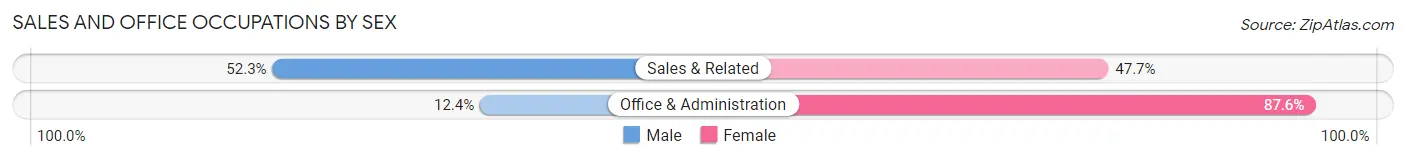
| Occupation | Male | Female |
| Sales & Related | 168 (52.3%) | 153 (47.7%) |
| Office & Administration | 36 (12.4%) | 254 (87.6%) |
| Total (Category) | 204 (33.4%) | 407 (66.6%) |
| Total (Overall) | 1,049 (53.3%) | 918 (46.7%) |
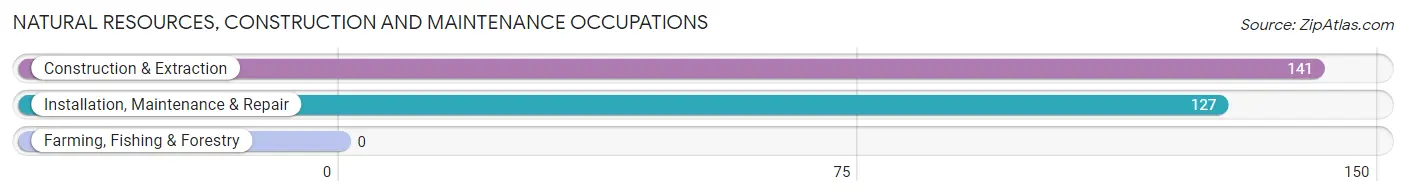
Natural Resources, Construction and Maintenance Occupations
The most common Natural Resources, Construction and Maintenance occupations in Paxton are Construction & Extraction (141 | 7.2%), and Installation, Maintenance & Repair (127 | 6.5%).
Natural Resources, Construction and Maintenance Occupations by Sex
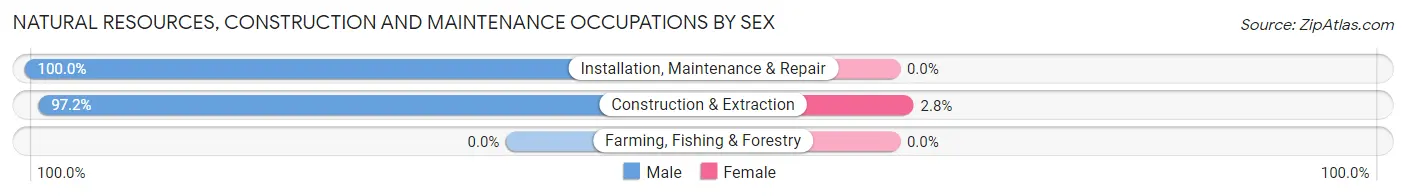
| Occupation | Male | Female |
| Farming, Fishing & Forestry | 0 (0.0%) | 0 (0.0%) |
| Construction & Extraction | 137 (97.2%) | 4 (2.8%) |
| Installation, Maintenance & Repair | 127 (100.0%) | 0 (0.0%) |
| Total (Category) | 264 (98.5%) | 4 (1.5%) |
| Total (Overall) | 1,049 (53.3%) | 918 (46.7%) |
Production, Transportation and Moving Occupations
The most common Production, Transportation and Moving occupations in Paxton are Production (150 | 7.6%), Material Moving (127 | 6.5%), and Transportation (42 | 2.1%).
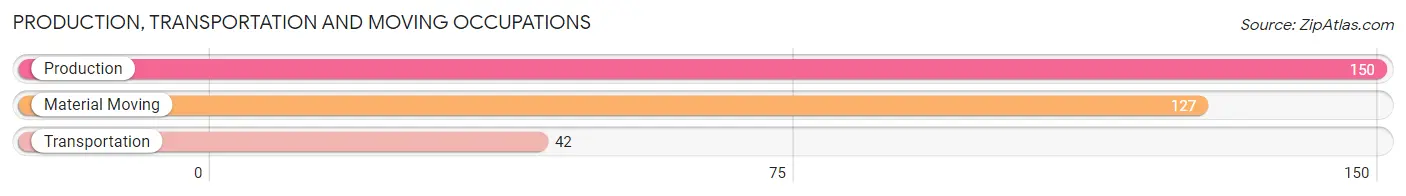
Production, Transportation and Moving Occupations by Sex
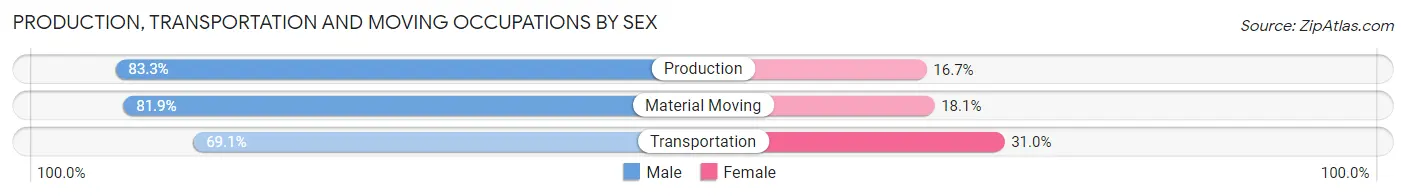
| Occupation | Male | Female |
| Production | 125 (83.3%) | 25 (16.7%) |
| Transportation | 29 (69.1%) | 13 (30.9%) |
| Material Moving | 104 (81.9%) | 23 (18.1%) |
| Total (Category) | 258 (80.9%) | 61 (19.1%) |
| Total (Overall) | 1,049 (53.3%) | 918 (46.7%) |
Employment Industries by Sex in Paxton
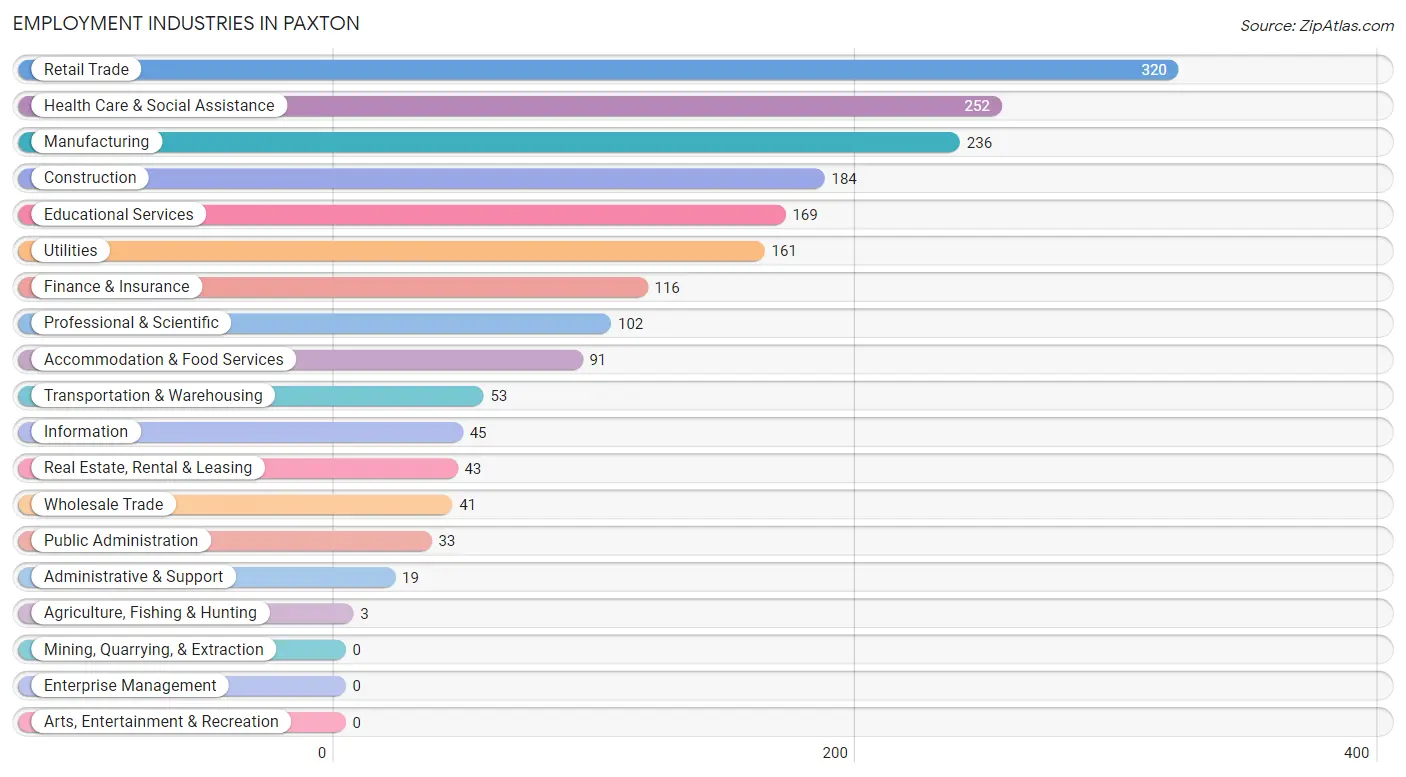
Employment Industries in Paxton
The major employment industries in Paxton include Retail Trade (320 | 16.3%), Health Care & Social Assistance (252 | 12.8%), Manufacturing (236 | 12.0%), Construction (184 | 9.3%), and Educational Services (169 | 8.6%).
Employment Industries by Sex in Paxton
The Paxton industries that see more men than women are Agriculture, Fishing & Hunting (100.0%), Wholesale Trade (100.0%), and Construction (97.8%), whereas the industries that tend to have a higher number of women are Administrative & Support (100.0%), Public Administration (100.0%), and Health Care & Social Assistance (89.3%).
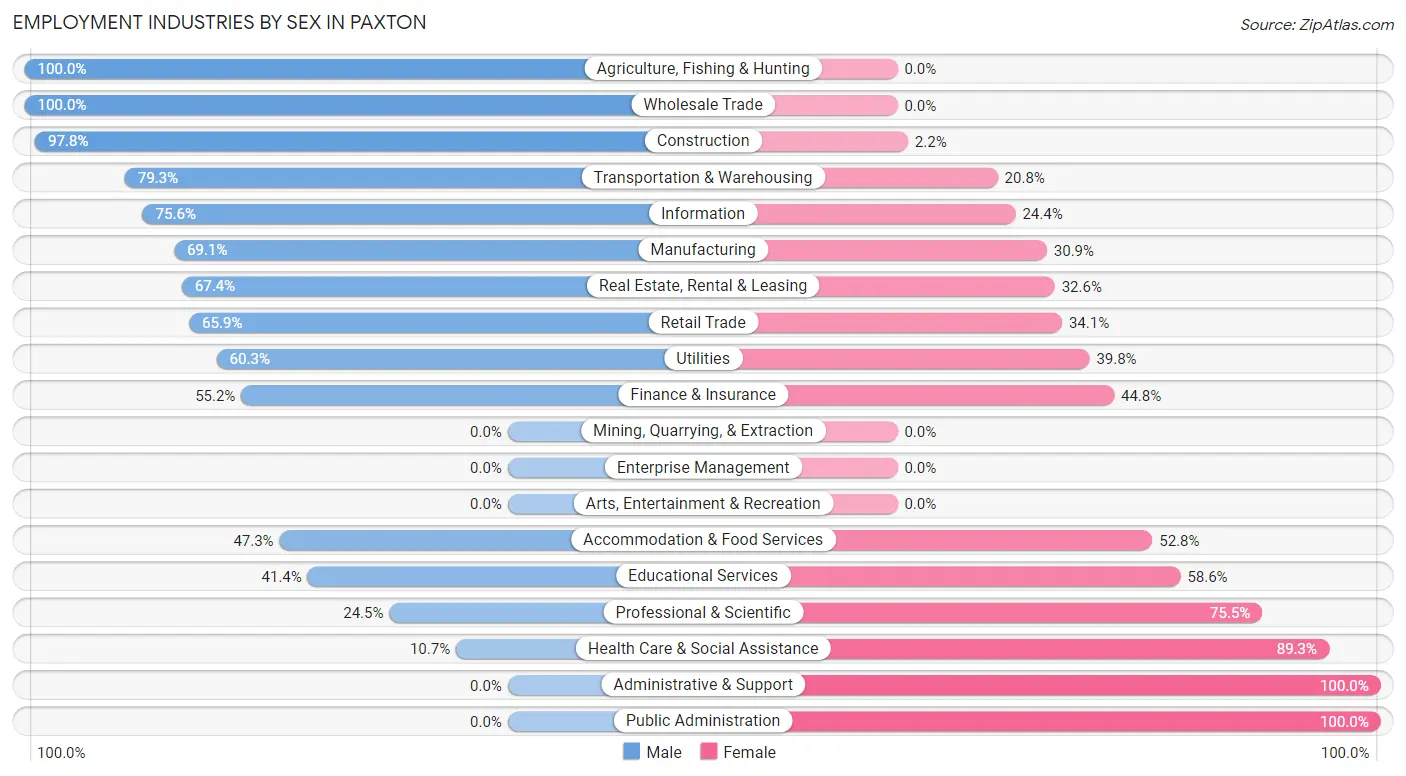
| Industry | Male | Female |
| Agriculture, Fishing & Hunting | 3 (100.0%) | 0 (0.0%) |
| Mining, Quarrying, & Extraction | 0 (0.0%) | 0 (0.0%) |
| Construction | 180 (97.8%) | 4 (2.2%) |
| Manufacturing | 163 (69.1%) | 73 (30.9%) |
| Wholesale Trade | 41 (100.0%) | 0 (0.0%) |
| Retail Trade | 211 (65.9%) | 109 (34.1%) |
| Transportation & Warehousing | 42 (79.2%) | 11 (20.7%) |
| Utilities | 97 (60.3%) | 64 (39.8%) |
| Information | 34 (75.6%) | 11 (24.4%) |
| Finance & Insurance | 64 (55.2%) | 52 (44.8%) |
| Real Estate, Rental & Leasing | 29 (67.4%) | 14 (32.6%) |
| Professional & Scientific | 25 (24.5%) | 77 (75.5%) |
| Enterprise Management | 0 (0.0%) | 0 (0.0%) |
| Administrative & Support | 0 (0.0%) | 19 (100.0%) |
| Educational Services | 70 (41.4%) | 99 (58.6%) |
| Health Care & Social Assistance | 27 (10.7%) | 225 (89.3%) |
| Arts, Entertainment & Recreation | 0 (0.0%) | 0 (0.0%) |
| Accommodation & Food Services | 43 (47.2%) | 48 (52.7%) |
| Public Administration | 0 (0.0%) | 33 (100.0%) |
| Total | 1,049 (53.3%) | 918 (46.7%) |
Education in Paxton
School Enrollment in Paxton
The most common levels of schooling among the 908 students in Paxton are elementary school (294 | 32.4%), high school (234 | 25.8%), and middle school (219 | 24.1%).
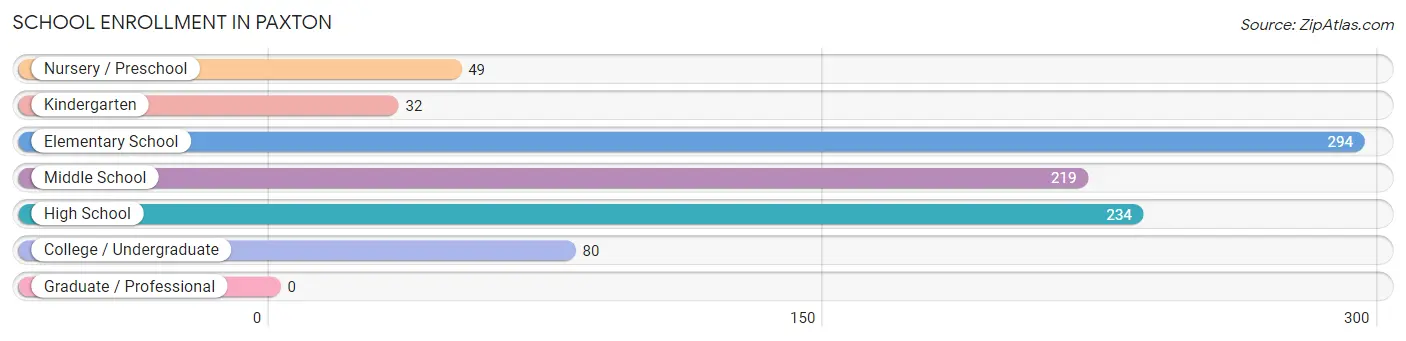
| School Level | # Students | % Students |
| Nursery / Preschool | 49 | 5.4% |
| Kindergarten | 32 | 3.5% |
| Elementary School | 294 | 32.4% |
| Middle School | 219 | 24.1% |
| High School | 234 | 25.8% |
| College / Undergraduate | 80 | 8.8% |
| Graduate / Professional | 0 | 0.0% |
| Total | 908 | 100.0% |
School Enrollment by Age by Funding Source in Paxton
Out of a total of 908 students who are enrolled in schools in Paxton, 62 (6.8%) attend a private institution, while the remaining 846 (93.2%) are enrolled in public schools. The age group of 3 to 4 year olds has the highest likelihood of being enrolled in private schools, with 17 (34.7% in the age bracket) enrolled. Conversely, the age group of 10 to 14 year olds has the lowest likelihood of being enrolled in a private school, with 320 (100.0% in the age bracket) attending a public institution.
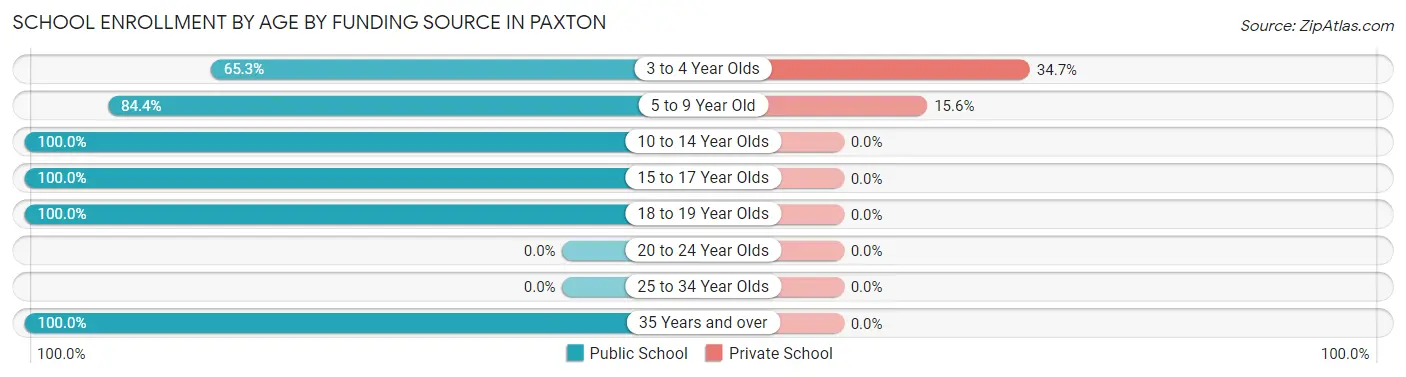
| Age Bracket | Public School | Private School |
| 3 to 4 Year Olds | 32 (65.3%) | 17 (34.7%) |
| 5 to 9 Year Old | 244 (84.4%) | 45 (15.6%) |
| 10 to 14 Year Olds | 320 (100.0%) | 0 (0.0%) |
| 15 to 17 Year Olds | 136 (100.0%) | 0 (0.0%) |
| 18 to 19 Year Olds | 93 (100.0%) | 0 (0.0%) |
| 20 to 24 Year Olds | 0 (0.0%) | 0 (0.0%) |
| 25 to 34 Year Olds | 0 (0.0%) | 0 (0.0%) |
| 35 Years and over | 21 (100.0%) | 0 (0.0%) |
| Total | 846 (93.2%) | 62 (6.8%) |
Educational Attainment by Field of Study in Paxton
Business (127 | 20.3%), education (123 | 19.7%), bio, nature & agricultural (85 | 13.6%), science & technology (77 | 12.3%), and social sciences (66 | 10.6%) are the most common fields of study among 624 individuals in Paxton who have obtained a bachelor's degree or higher.
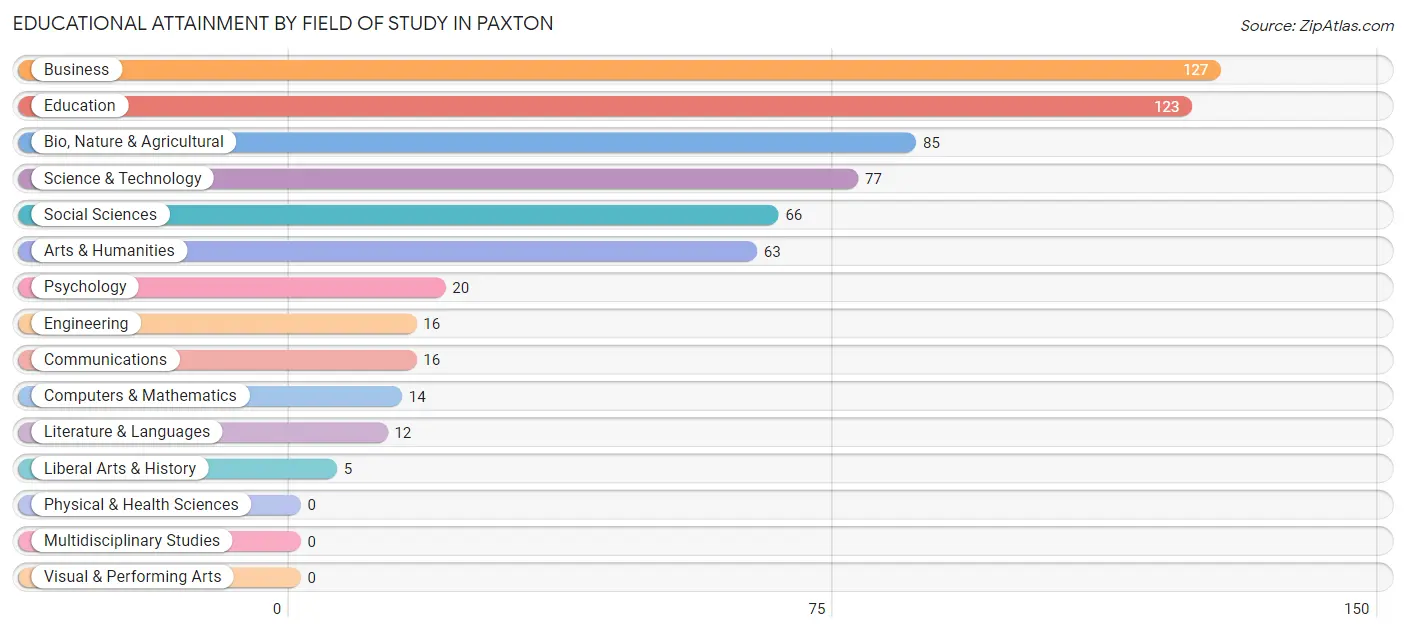
| Field of Study | # Graduates | % Graduates |
| Computers & Mathematics | 14 | 2.2% |
| Bio, Nature & Agricultural | 85 | 13.6% |
| Physical & Health Sciences | 0 | 0.0% |
| Psychology | 20 | 3.2% |
| Social Sciences | 66 | 10.6% |
| Engineering | 16 | 2.6% |
| Multidisciplinary Studies | 0 | 0.0% |
| Science & Technology | 77 | 12.3% |
| Business | 127 | 20.3% |
| Education | 123 | 19.7% |
| Literature & Languages | 12 | 1.9% |
| Liberal Arts & History | 5 | 0.8% |
| Visual & Performing Arts | 0 | 0.0% |
| Communications | 16 | 2.6% |
| Arts & Humanities | 63 | 10.1% |
| Total | 624 | 100.0% |
Transportation & Commute in Paxton
Vehicle Availability by Sex in Paxton
The most prevalent vehicle ownership categories in Paxton are males with 2 vehicles (396, accounting for 37.8%) and females with 2 vehicles (306, making up 43.1%).
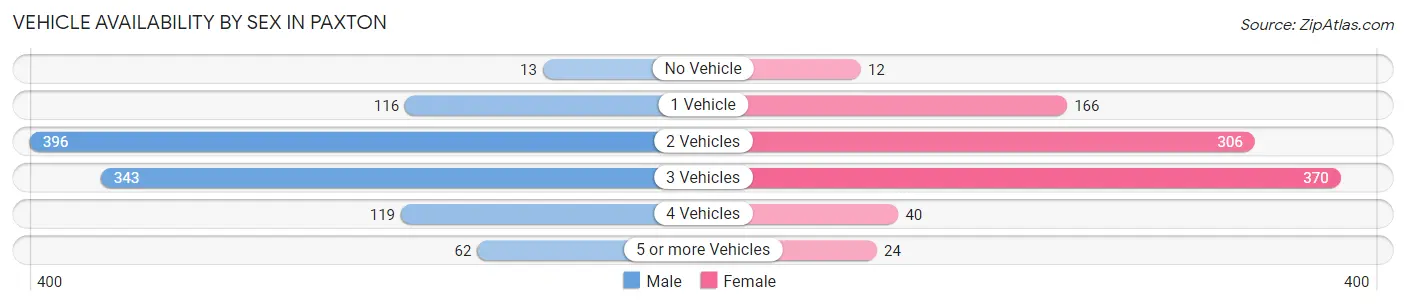
| Vehicles Available | Male | Female |
| No Vehicle | 13 (1.2%) | 12 (1.3%) |
| 1 Vehicle | 116 (11.1%) | 166 (18.1%) |
| 2 Vehicles | 396 (37.8%) | 306 (33.3%) |
| 3 Vehicles | 343 (32.7%) | 370 (40.3%) |
| 4 Vehicles | 119 (11.3%) | 40 (4.4%) |
| 5 or more Vehicles | 62 (5.9%) | 24 (2.6%) |
| Total | 1,049 (100.0%) | 918 (100.0%) |
Commute Time in Paxton
The most frequently occuring commute durations in Paxton are less than 5 minutes (334 commuters, 18.6%), 5 to 9 minutes (309 commuters, 17.2%), and 20 to 24 minutes (223 commuters, 12.4%).
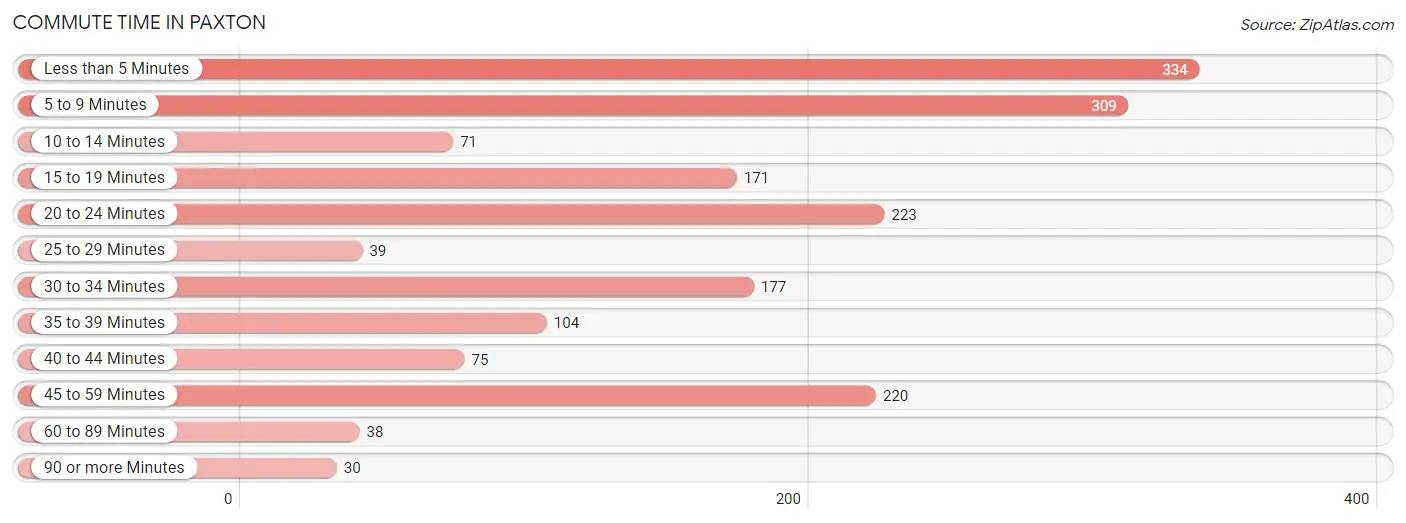
| Commute Time | # Commuters | % Commuters |
| Less than 5 Minutes | 334 | 18.6% |
| 5 to 9 Minutes | 309 | 17.2% |
| 10 to 14 Minutes | 71 | 4.0% |
| 15 to 19 Minutes | 171 | 9.6% |
| 20 to 24 Minutes | 223 | 12.4% |
| 25 to 29 Minutes | 39 | 2.2% |
| 30 to 34 Minutes | 177 | 9.9% |
| 35 to 39 Minutes | 104 | 5.8% |
| 40 to 44 Minutes | 75 | 4.2% |
| 45 to 59 Minutes | 220 | 12.3% |
| 60 to 89 Minutes | 38 | 2.1% |
| 90 or more Minutes | 30 | 1.7% |
Commute Time by Sex in Paxton
The most common commute times in Paxton are less than 5 minutes (165 commuters, 16.4%) for males and less than 5 minutes (169 commuters, 21.5%) for females.
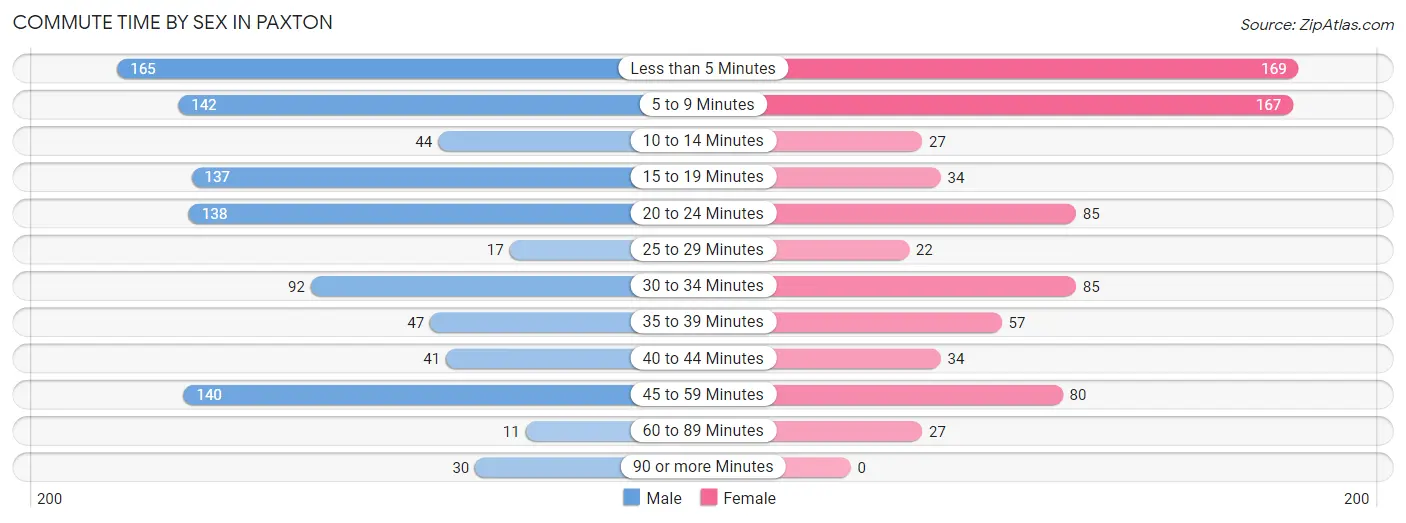
| Commute Time | Male | Female |
| Less than 5 Minutes | 165 (16.4%) | 169 (21.5%) |
| 5 to 9 Minutes | 142 (14.1%) | 167 (21.2%) |
| 10 to 14 Minutes | 44 (4.4%) | 27 (3.4%) |
| 15 to 19 Minutes | 137 (13.7%) | 34 (4.3%) |
| 20 to 24 Minutes | 138 (13.8%) | 85 (10.8%) |
| 25 to 29 Minutes | 17 (1.7%) | 22 (2.8%) |
| 30 to 34 Minutes | 92 (9.2%) | 85 (10.8%) |
| 35 to 39 Minutes | 47 (4.7%) | 57 (7.2%) |
| 40 to 44 Minutes | 41 (4.1%) | 34 (4.3%) |
| 45 to 59 Minutes | 140 (13.9%) | 80 (10.2%) |
| 60 to 89 Minutes | 11 (1.1%) | 27 (3.4%) |
| 90 or more Minutes | 30 (3.0%) | 0 (0.0%) |
Time of Departure to Work by Sex in Paxton
The most frequent times of departure to work in Paxton are 7:00 AM to 7:29 AM (188, 18.7%) for males and 6:30 AM to 6:59 AM (149, 18.9%) for females.
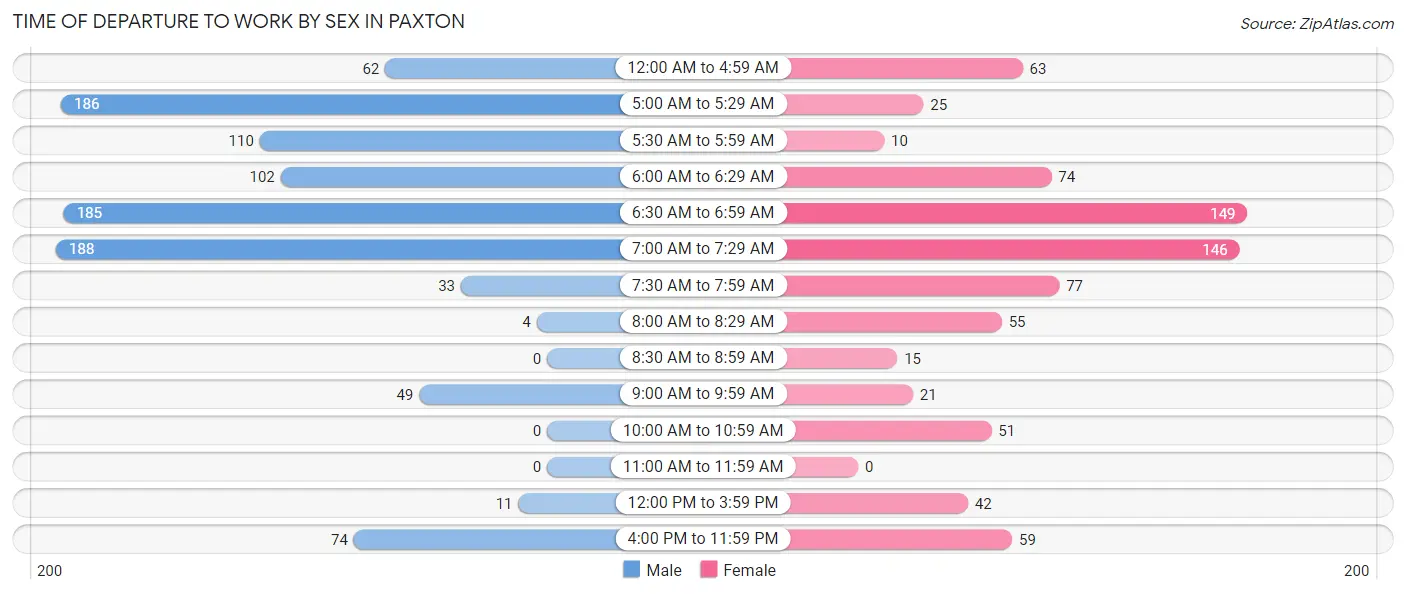
| Time of Departure | Male | Female |
| 12:00 AM to 4:59 AM | 62 (6.2%) | 63 (8.0%) |
| 5:00 AM to 5:29 AM | 186 (18.5%) | 25 (3.2%) |
| 5:30 AM to 5:59 AM | 110 (11.0%) | 10 (1.3%) |
| 6:00 AM to 6:29 AM | 102 (10.2%) | 74 (9.4%) |
| 6:30 AM to 6:59 AM | 185 (18.4%) | 149 (18.9%) |
| 7:00 AM to 7:29 AM | 188 (18.7%) | 146 (18.5%) |
| 7:30 AM to 7:59 AM | 33 (3.3%) | 77 (9.8%) |
| 8:00 AM to 8:29 AM | 4 (0.4%) | 55 (7.0%) |
| 8:30 AM to 8:59 AM | 0 (0.0%) | 15 (1.9%) |
| 9:00 AM to 9:59 AM | 49 (4.9%) | 21 (2.7%) |
| 10:00 AM to 10:59 AM | 0 (0.0%) | 51 (6.5%) |
| 11:00 AM to 11:59 AM | 0 (0.0%) | 0 (0.0%) |
| 12:00 PM to 3:59 PM | 11 (1.1%) | 42 (5.3%) |
| 4:00 PM to 11:59 PM | 74 (7.4%) | 59 (7.5%) |
| Total | 1,004 (100.0%) | 787 (100.0%) |
Housing Occupancy in Paxton
Occupancy by Ownership in Paxton
Of the total 1,735 dwellings in Paxton, owner-occupied units account for 1,328 (76.5%), while renter-occupied units make up 407 (23.5%).
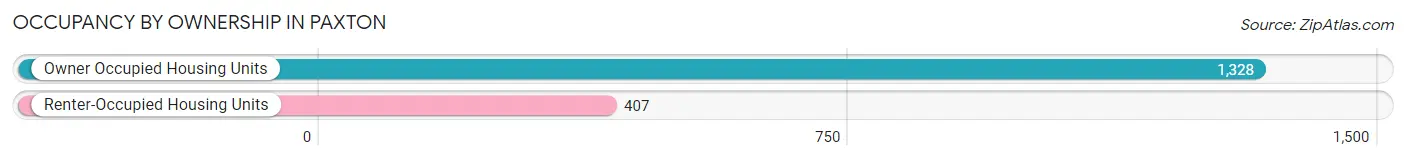
| Occupancy | # Housing Units | % Housing Units |
| Owner Occupied Housing Units | 1,328 | 76.5% |
| Renter-Occupied Housing Units | 407 | 23.5% |
| Total Occupied Housing Units | 1,735 | 100.0% |
Occupancy by Household Size in Paxton
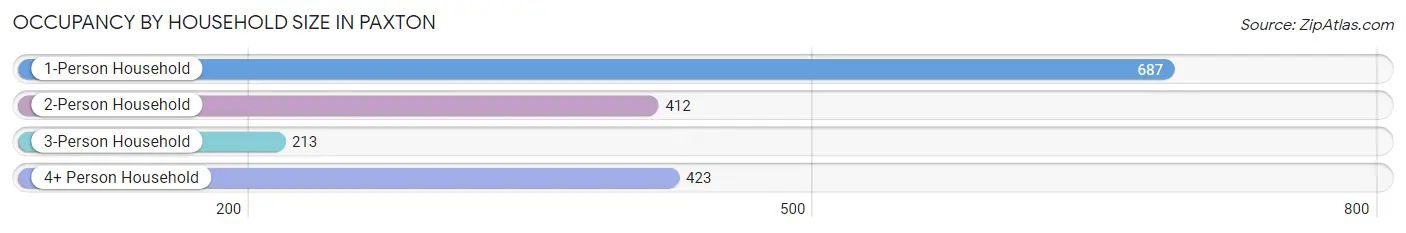
| Household Size | # Housing Units | % Housing Units |
| 1-Person Household | 687 | 39.6% |
| 2-Person Household | 412 | 23.7% |
| 3-Person Household | 213 | 12.3% |
| 4+ Person Household | 423 | 24.4% |
| Total Housing Units | 1,735 | 100.0% |
Occupancy by Ownership by Household Size in Paxton
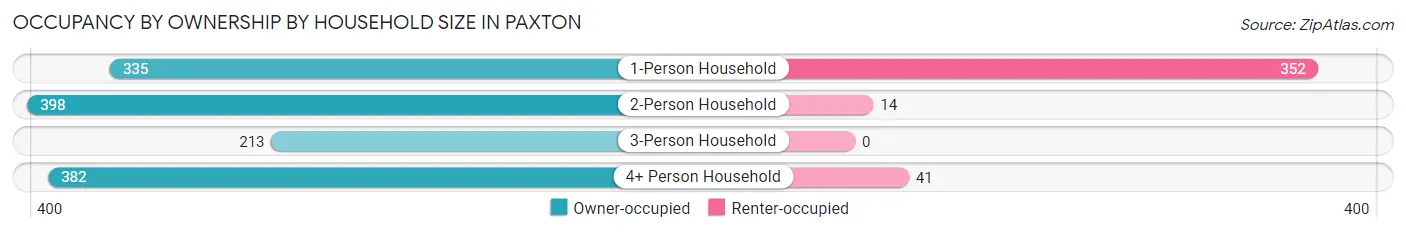
| Household Size | Owner-occupied | Renter-occupied |
| 1-Person Household | 335 (48.8%) | 352 (51.2%) |
| 2-Person Household | 398 (96.6%) | 14 (3.4%) |
| 3-Person Household | 213 (100.0%) | 0 (0.0%) |
| 4+ Person Household | 382 (90.3%) | 41 (9.7%) |
| Total Housing Units | 1,328 (76.5%) | 407 (23.5%) |
Occupancy by Educational Attainment in Paxton
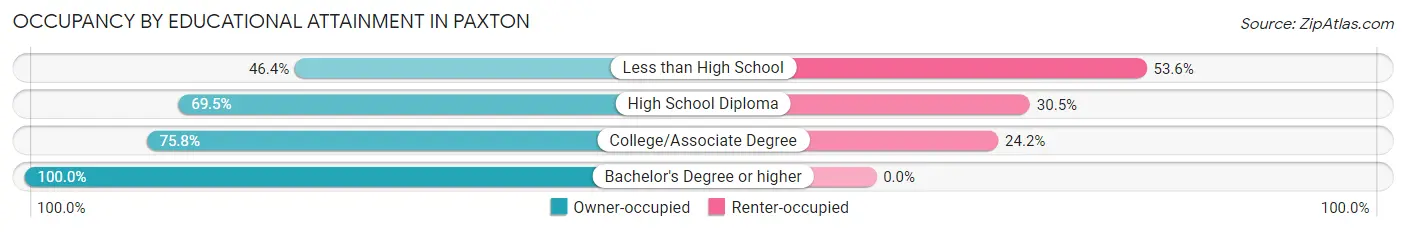
| Household Size | Owner-occupied | Renter-occupied |
| Less than High School | 45 (46.4%) | 52 (53.6%) |
| High School Diploma | 333 (69.5%) | 146 (30.5%) |
| College/Associate Degree | 655 (75.8%) | 209 (24.2%) |
| Bachelor's Degree or higher | 295 (100.0%) | 0 (0.0%) |
Occupancy by Age of Householder in Paxton
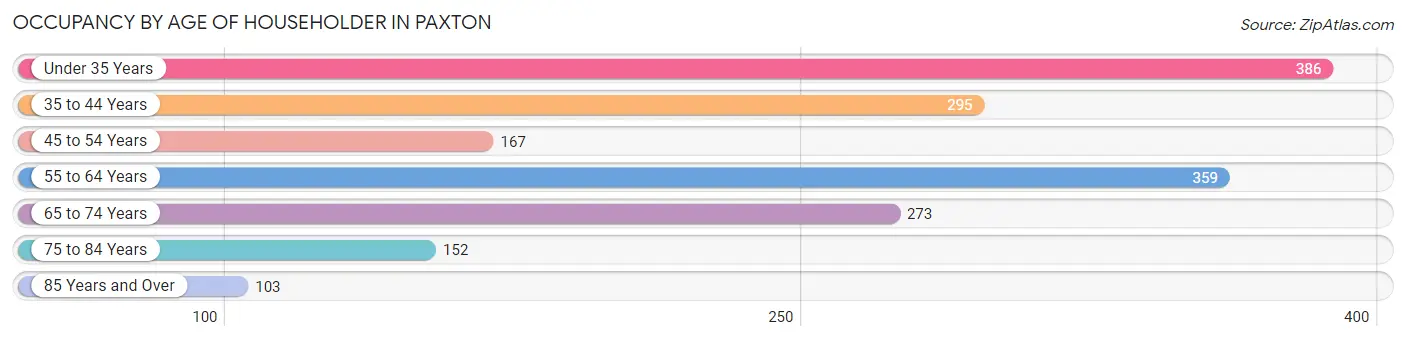
| Age Bracket | # Households | % Households |
| Under 35 Years | 386 | 22.3% |
| 35 to 44 Years | 295 | 17.0% |
| 45 to 54 Years | 167 | 9.6% |
| 55 to 64 Years | 359 | 20.7% |
| 65 to 74 Years | 273 | 15.7% |
| 75 to 84 Years | 152 | 8.8% |
| 85 Years and Over | 103 | 5.9% |
| Total | 1,735 | 100.0% |
Housing Finances in Paxton
Median Income by Occupancy in Paxton
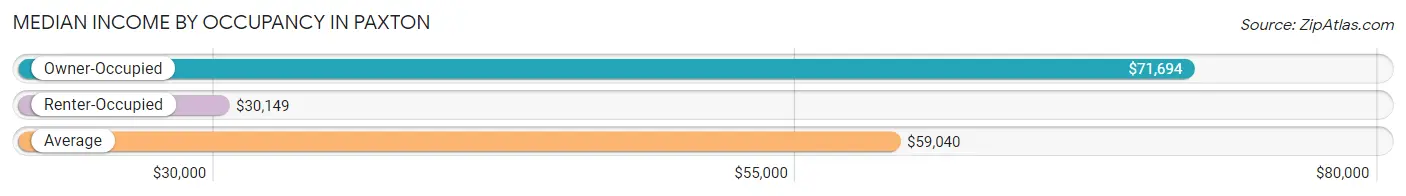
| Occupancy Type | # Households | Median Income |
| Owner-Occupied | 1,328 (76.5%) | $71,694 |
| Renter-Occupied | 407 (23.5%) | $30,149 |
| Average | 1,735 (100.0%) | $59,040 |
Occupancy by Householder Income Bracket in Paxton
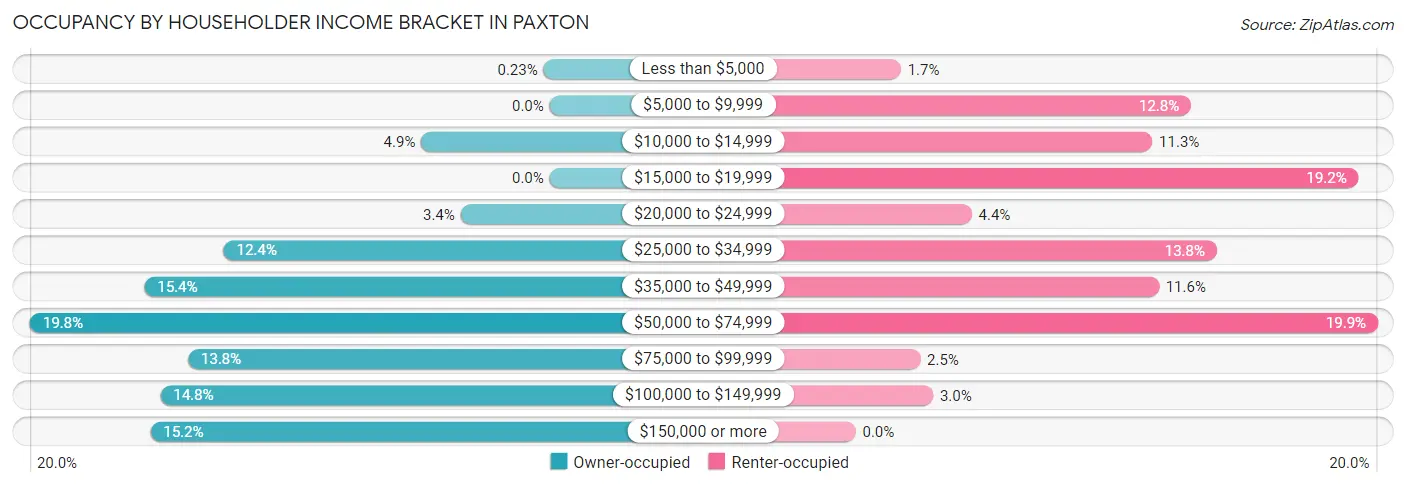
| Income Bracket | Owner-occupied | Renter-occupied |
| Less than $5,000 | 3 (0.2%) | 7 (1.7%) |
| $5,000 to $9,999 | 0 (0.0%) | 52 (12.8%) |
| $10,000 to $14,999 | 65 (4.9%) | 46 (11.3%) |
| $15,000 to $19,999 | 0 (0.0%) | 78 (19.2%) |
| $20,000 to $24,999 | 45 (3.4%) | 18 (4.4%) |
| $25,000 to $34,999 | 165 (12.4%) | 56 (13.8%) |
| $35,000 to $49,999 | 205 (15.4%) | 47 (11.6%) |
| $50,000 to $74,999 | 263 (19.8%) | 81 (19.9%) |
| $75,000 to $99,999 | 183 (13.8%) | 10 (2.5%) |
| $100,000 to $149,999 | 197 (14.8%) | 12 (2.9%) |
| $150,000 or more | 202 (15.2%) | 0 (0.0%) |
| Total | 1,328 (100.0%) | 407 (100.0%) |
Monthly Housing Cost Tiers in Paxton
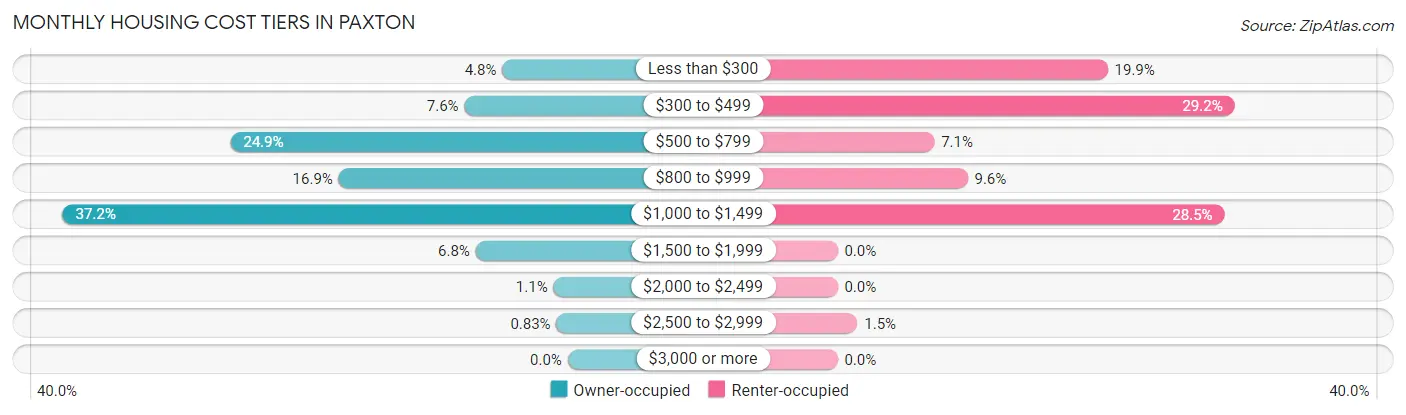
| Monthly Cost | Owner-occupied | Renter-occupied |
| Less than $300 | 64 (4.8%) | 81 (19.9%) |
| $300 to $499 | 101 (7.6%) | 119 (29.2%) |
| $500 to $799 | 330 (24.8%) | 29 (7.1%) |
| $800 to $999 | 224 (16.9%) | 39 (9.6%) |
| $1,000 to $1,499 | 494 (37.2%) | 116 (28.5%) |
| $1,500 to $1,999 | 90 (6.8%) | 0 (0.0%) |
| $2,000 to $2,499 | 14 (1.1%) | 0 (0.0%) |
| $2,500 to $2,999 | 11 (0.8%) | 6 (1.5%) |
| $3,000 or more | 0 (0.0%) | 0 (0.0%) |
| Total | 1,328 (100.0%) | 407 (100.0%) |
Physical Housing Characteristics in Paxton
Housing Structures in Paxton
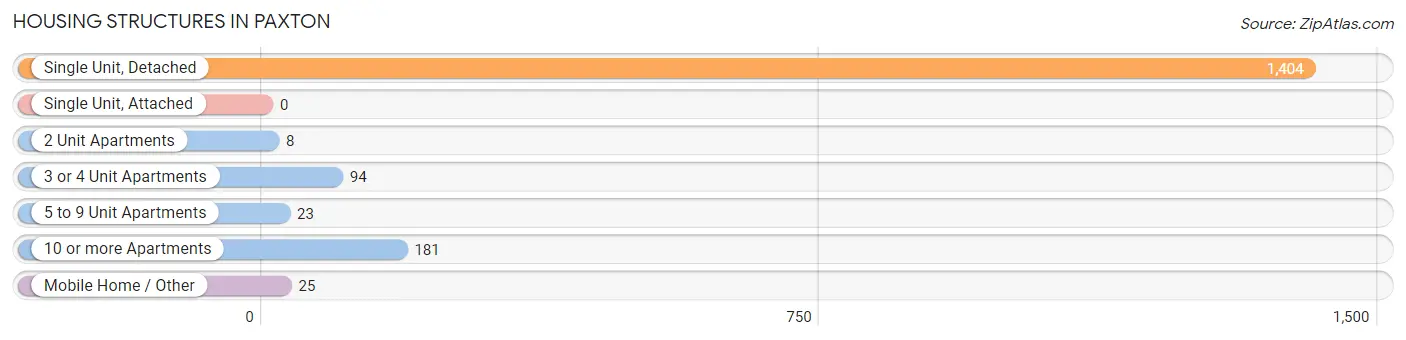
| Structure Type | # Housing Units | % Housing Units |
| Single Unit, Detached | 1,404 | 80.9% |
| Single Unit, Attached | 0 | 0.0% |
| 2 Unit Apartments | 8 | 0.5% |
| 3 or 4 Unit Apartments | 94 | 5.4% |
| 5 to 9 Unit Apartments | 23 | 1.3% |
| 10 or more Apartments | 181 | 10.4% |
| Mobile Home / Other | 25 | 1.4% |
| Total | 1,735 | 100.0% |
Housing Structures by Occupancy in Paxton
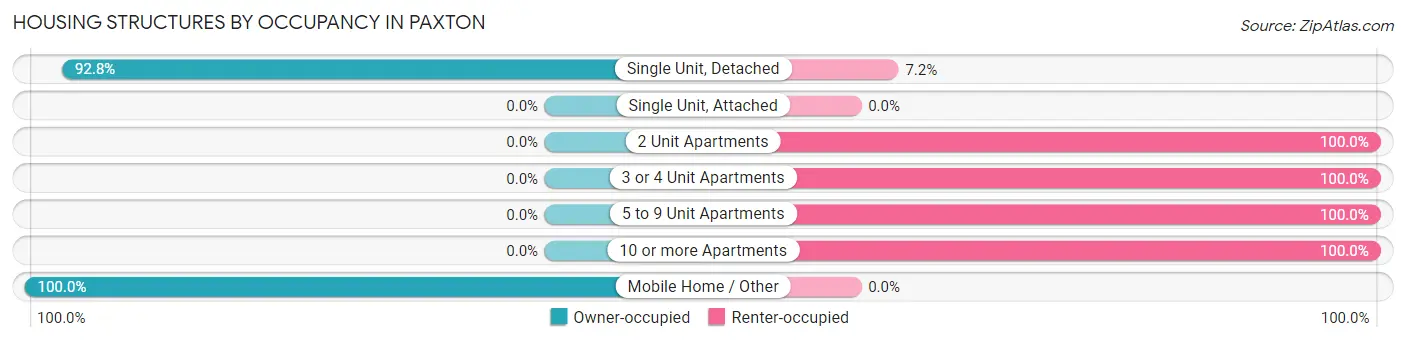
| Structure Type | Owner-occupied | Renter-occupied |
| Single Unit, Detached | 1,303 (92.8%) | 101 (7.2%) |
| Single Unit, Attached | 0 (0.0%) | 0 (0.0%) |
| 2 Unit Apartments | 0 (0.0%) | 8 (100.0%) |
| 3 or 4 Unit Apartments | 0 (0.0%) | 94 (100.0%) |
| 5 to 9 Unit Apartments | 0 (0.0%) | 23 (100.0%) |
| 10 or more Apartments | 0 (0.0%) | 181 (100.0%) |
| Mobile Home / Other | 25 (100.0%) | 0 (0.0%) |
| Total | 1,328 (76.5%) | 407 (23.5%) |
Housing Structures by Number of Rooms in Paxton
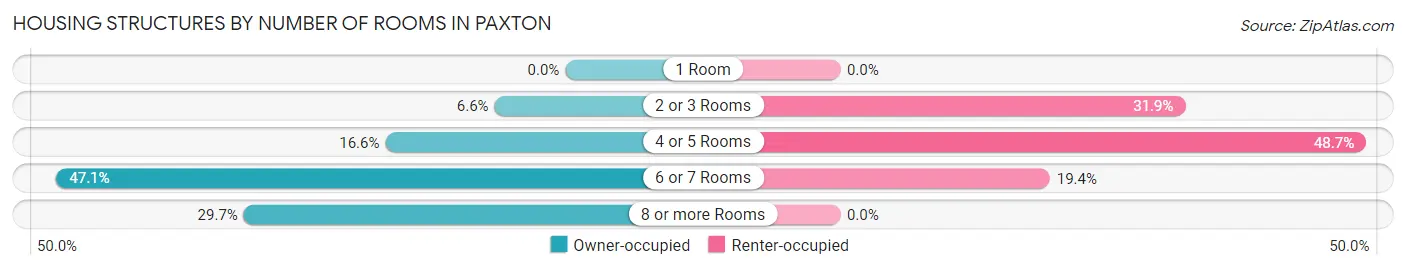
| Number of Rooms | Owner-occupied | Renter-occupied |
| 1 Room | 0 (0.0%) | 0 (0.0%) |
| 2 or 3 Rooms | 87 (6.6%) | 130 (31.9%) |
| 4 or 5 Rooms | 221 (16.6%) | 198 (48.6%) |
| 6 or 7 Rooms | 625 (47.1%) | 79 (19.4%) |
| 8 or more Rooms | 395 (29.7%) | 0 (0.0%) |
| Total | 1,328 (100.0%) | 407 (100.0%) |
Housing Structure by Heating Type in Paxton
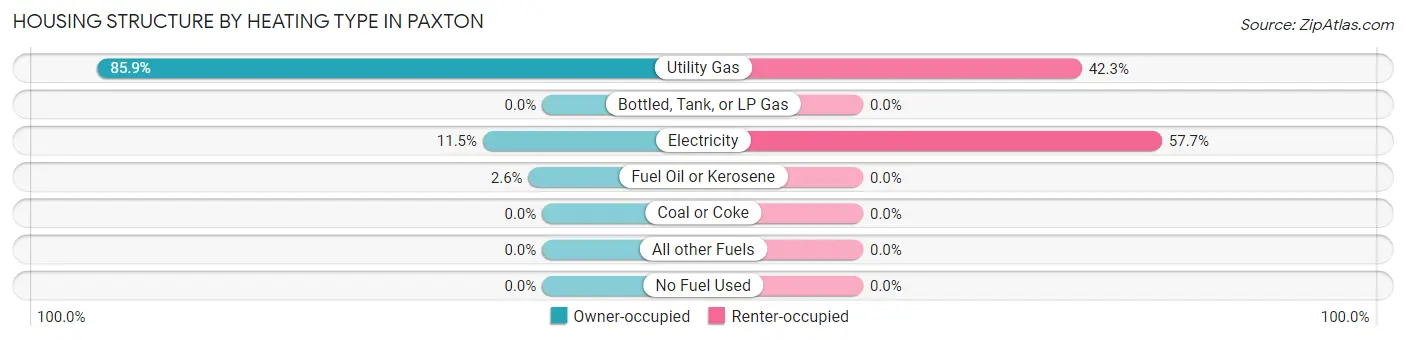
| Heating Type | Owner-occupied | Renter-occupied |
| Utility Gas | 1,141 (85.9%) | 172 (42.3%) |
| Bottled, Tank, or LP Gas | 0 (0.0%) | 0 (0.0%) |
| Electricity | 152 (11.5%) | 235 (57.7%) |
| Fuel Oil or Kerosene | 35 (2.6%) | 0 (0.0%) |
| Coal or Coke | 0 (0.0%) | 0 (0.0%) |
| All other Fuels | 0 (0.0%) | 0 (0.0%) |
| No Fuel Used | 0 (0.0%) | 0 (0.0%) |
| Total | 1,328 (100.0%) | 407 (100.0%) |
Household Vehicle Usage in Paxton
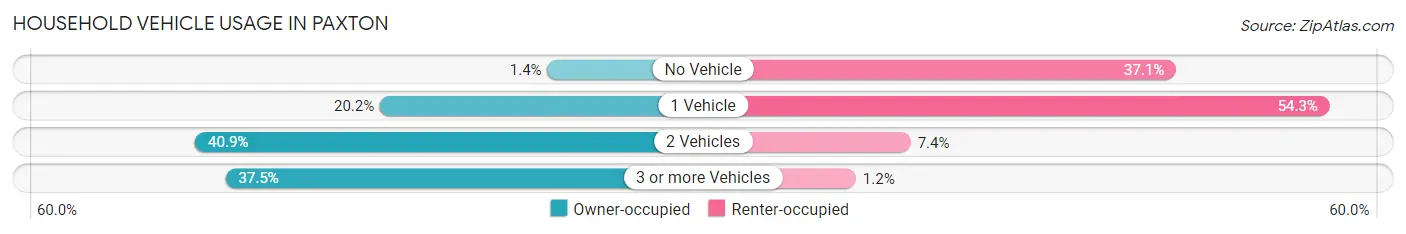
| Vehicles per Household | Owner-occupied | Renter-occupied |
| No Vehicle | 19 (1.4%) | 151 (37.1%) |
| 1 Vehicle | 268 (20.2%) | 221 (54.3%) |
| 2 Vehicles | 543 (40.9%) | 30 (7.4%) |
| 3 or more Vehicles | 498 (37.5%) | 5 (1.2%) |
| Total | 1,328 (100.0%) | 407 (100.0%) |
Real Estate & Mortgages in Paxton
Real Estate and Mortgage Overview in Paxton
| Characteristic | Without Mortgage | With Mortgage |
| Housing Units | 447 | 881 |
| Median Property Value | $116,200 | $113,100 |
| Median Household Income | $78,750 | $111 |
| Monthly Housing Costs | $560 | $0 |
| Real Estate Taxes | $2,816 | $0 |
Property Value by Mortgage Status in Paxton
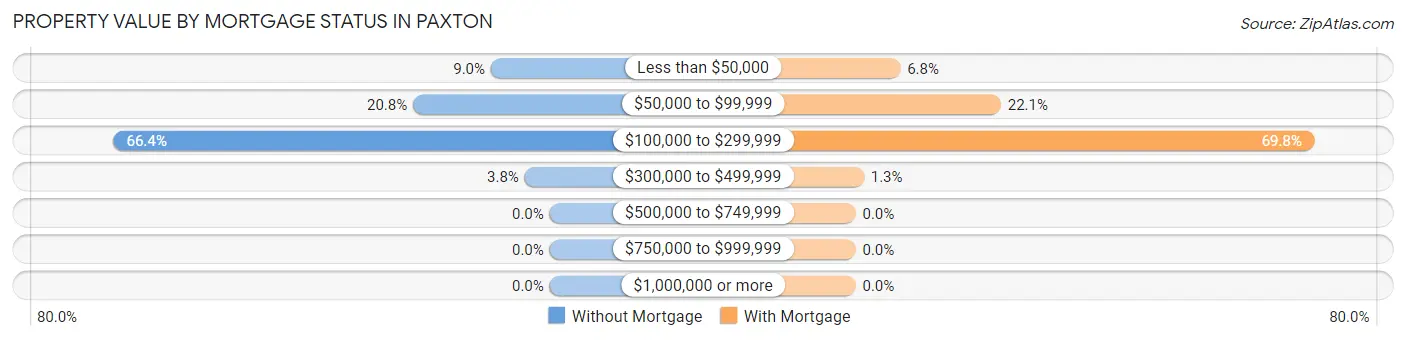
| Property Value | Without Mortgage | With Mortgage |
| Less than $50,000 | 40 (8.9%) | 60 (6.8%) |
| $50,000 to $99,999 | 93 (20.8%) | 195 (22.1%) |
| $100,000 to $299,999 | 297 (66.4%) | 615 (69.8%) |
| $300,000 to $499,999 | 17 (3.8%) | 11 (1.3%) |
| $500,000 to $749,999 | 0 (0.0%) | 0 (0.0%) |
| $750,000 to $999,999 | 0 (0.0%) | 0 (0.0%) |
| $1,000,000 or more | 0 (0.0%) | 0 (0.0%) |
| Total | 447 (100.0%) | 881 (100.0%) |
Household Income by Mortgage Status in Paxton
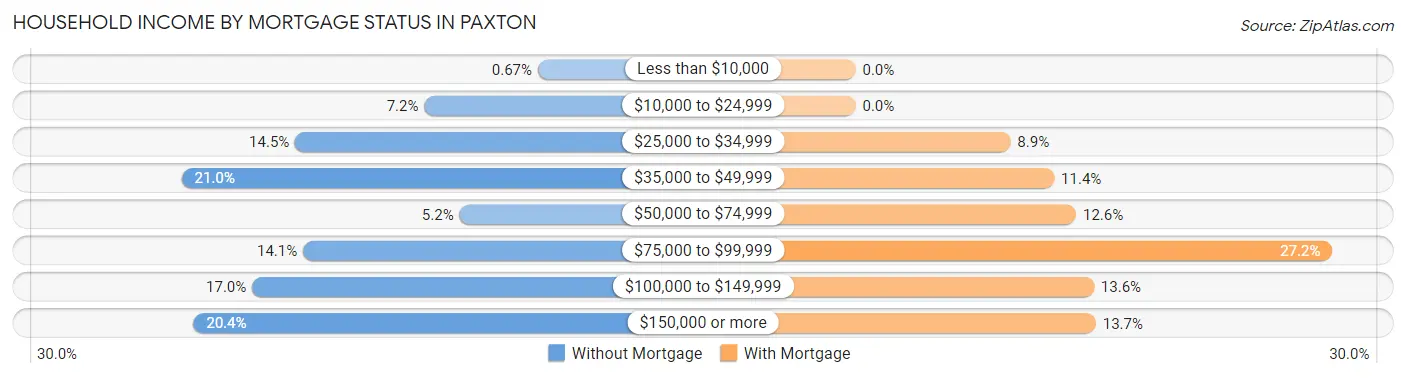
| Household Income | Without Mortgage | With Mortgage |
| Less than $10,000 | 3 (0.7%) | 0 (0.0%) |
| $10,000 to $24,999 | 32 (7.2%) | 0 (0.0%) |
| $25,000 to $34,999 | 65 (14.5%) | 78 (8.8%) |
| $35,000 to $49,999 | 94 (21.0%) | 100 (11.4%) |
| $50,000 to $74,999 | 23 (5.1%) | 111 (12.6%) |
| $75,000 to $99,999 | 63 (14.1%) | 240 (27.2%) |
| $100,000 to $149,999 | 76 (17.0%) | 120 (13.6%) |
| $150,000 or more | 91 (20.4%) | 121 (13.7%) |
| Total | 447 (100.0%) | 881 (100.0%) |
Property Value to Household Income Ratio in Paxton
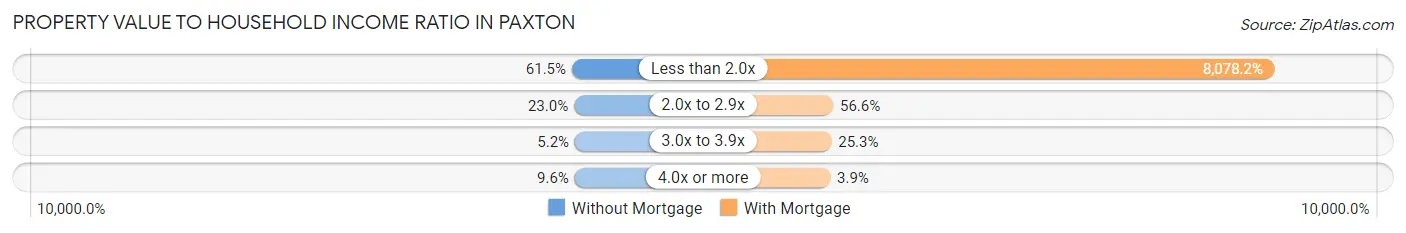
| Value-to-Income Ratio | Without Mortgage | With Mortgage |
| Less than 2.0x | 275 (61.5%) | 71,169 (8,078.2%) |
| 2.0x to 2.9x | 103 (23.0%) | 499 (56.6%) |
| 3.0x to 3.9x | 23 (5.1%) | 223 (25.3%) |
| 4.0x or more | 43 (9.6%) | 34 (3.9%) |
| Total | 447 (100.0%) | 881 (100.0%) |
Real Estate Taxes by Mortgage Status in Paxton
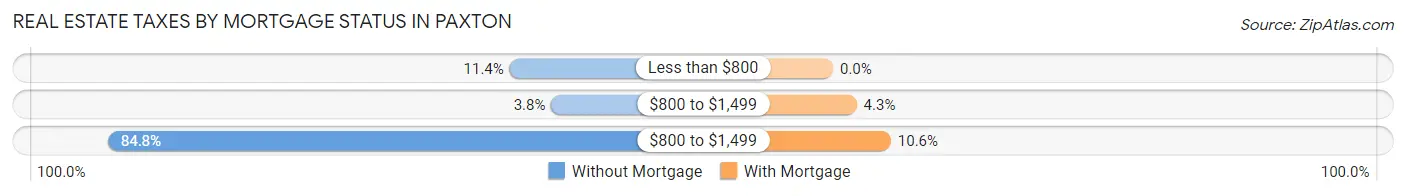
| Property Taxes | Without Mortgage | With Mortgage |
| Less than $800 | 51 (11.4%) | 0 (0.0%) |
| $800 to $1,499 | 17 (3.8%) | 38 (4.3%) |
| $800 to $1,499 | 379 (84.8%) | 93 (10.6%) |
| Total | 447 (100.0%) | 881 (100.0%) |
Health & Disability in Paxton
Health Insurance Coverage by Age in Paxton
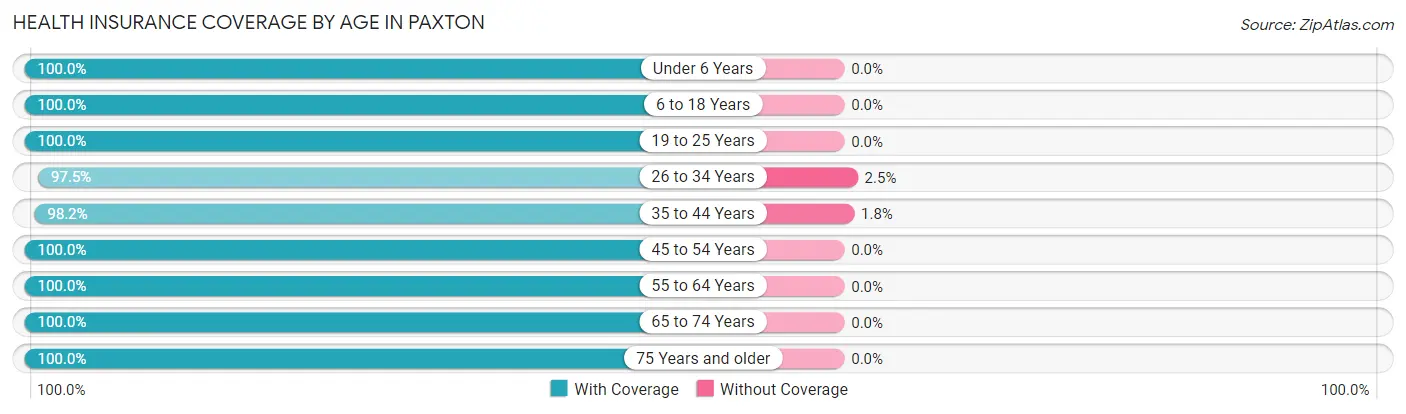
| Age Bracket | With Coverage | Without Coverage |
| Under 6 Years | 253 (100.0%) | 0 (0.0%) |
| 6 to 18 Years | 810 (100.0%) | 0 (0.0%) |
| 19 to 25 Years | 221 (100.0%) | 0 (0.0%) |
| 26 to 34 Years | 469 (97.5%) | 12 (2.5%) |
| 35 to 44 Years | 482 (98.2%) | 9 (1.8%) |
| 45 to 54 Years | 469 (100.0%) | 0 (0.0%) |
| 55 to 64 Years | 592 (100.0%) | 0 (0.0%) |
| 65 to 74 Years | 388 (100.0%) | 0 (0.0%) |
| 75 Years and older | 340 (100.0%) | 0 (0.0%) |
| Total | 4,024 (99.5%) | 21 (0.5%) |
Health Insurance Coverage by Citizenship Status in Paxton
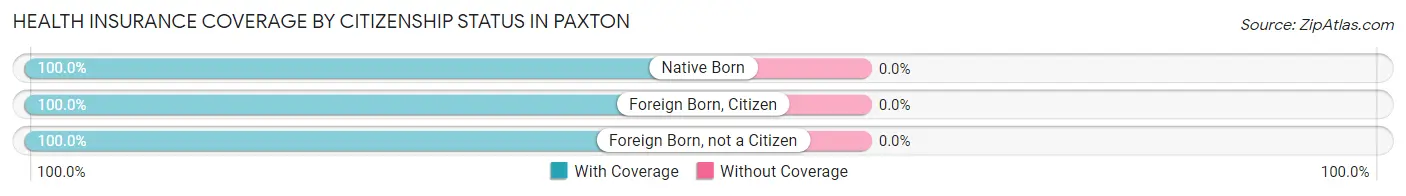
| Citizenship Status | With Coverage | Without Coverage |
| Native Born | 253 (100.0%) | 0 (0.0%) |
| Foreign Born, Citizen | 810 (100.0%) | 0 (0.0%) |
| Foreign Born, not a Citizen | 221 (100.0%) | 0 (0.0%) |
Health Insurance Coverage by Household Income in Paxton
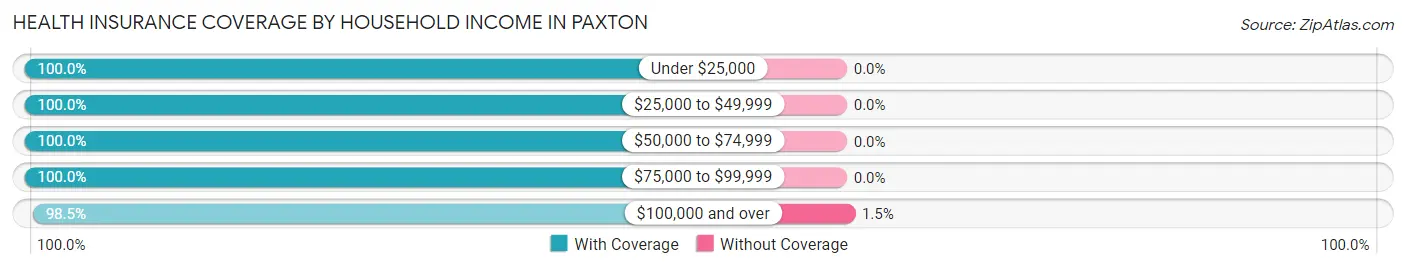
| Household Income | With Coverage | Without Coverage |
| Under $25,000 | 390 (100.0%) | 0 (0.0%) |
| $25,000 to $49,999 | 836 (100.0%) | 0 (0.0%) |
| $50,000 to $74,999 | 835 (100.0%) | 0 (0.0%) |
| $75,000 to $99,999 | 611 (100.0%) | 0 (0.0%) |
| $100,000 and over | 1,352 (98.5%) | 21 (1.5%) |
Public vs Private Health Insurance Coverage by Age in Paxton
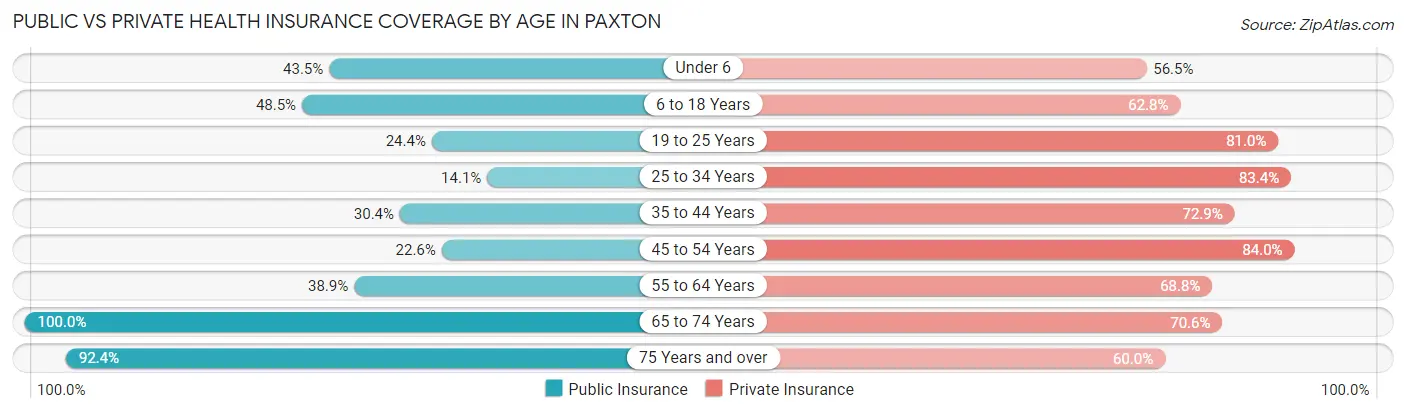
| Age Bracket | Public Insurance | Private Insurance |
| Under 6 | 110 (43.5%) | 143 (56.5%) |
| 6 to 18 Years | 393 (48.5%) | 509 (62.8%) |
| 19 to 25 Years | 54 (24.4%) | 179 (81.0%) |
| 25 to 34 Years | 68 (14.1%) | 401 (83.4%) |
| 35 to 44 Years | 149 (30.3%) | 358 (72.9%) |
| 45 to 54 Years | 106 (22.6%) | 394 (84.0%) |
| 55 to 64 Years | 230 (38.9%) | 407 (68.8%) |
| 65 to 74 Years | 388 (100.0%) | 274 (70.6%) |
| 75 Years and over | 314 (92.3%) | 204 (60.0%) |
| Total | 1,812 (44.8%) | 2,869 (70.9%) |
Disability Status by Sex by Age in Paxton
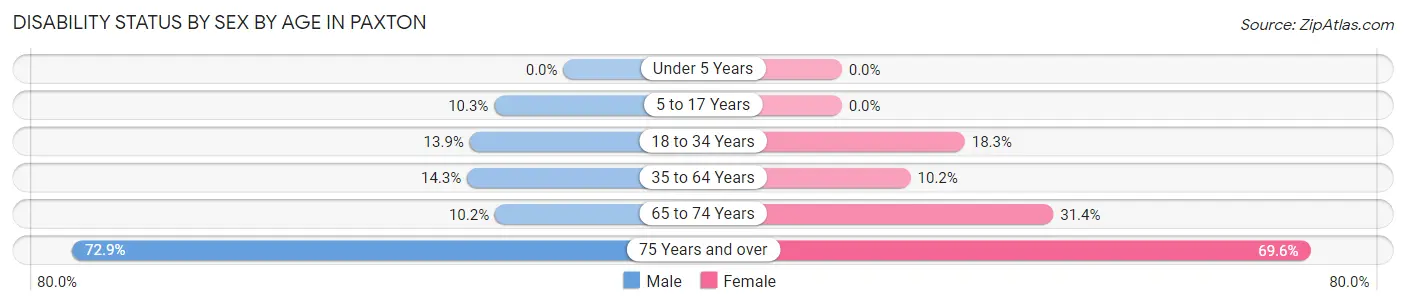
| Age Bracket | Male | Female |
| Under 5 Years | 0 (0.0%) | 0 (0.0%) |
| 5 to 17 Years | 46 (10.3%) | 0 (0.0%) |
| 18 to 34 Years | 63 (13.9%) | 61 (18.3%) |
| 35 to 64 Years | 117 (14.3%) | 75 (10.2%) |
| 65 to 74 Years | 20 (10.2%) | 60 (31.4%) |
| 75 Years and over | 97 (72.9%) | 144 (69.6%) |
Disability Class by Sex by Age in Paxton
Disability Class: Hearing Difficulty
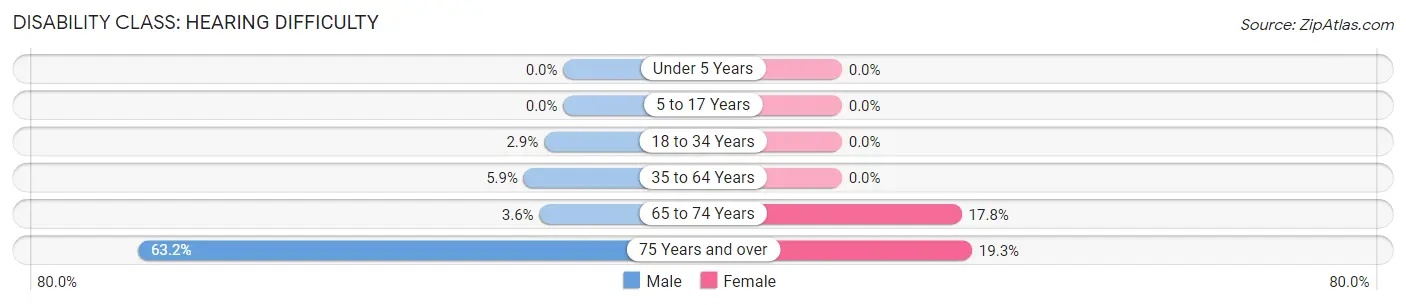
| Age Bracket | Male | Female |
| Under 5 Years | 0 (0.0%) | 0 (0.0%) |
| 5 to 17 Years | 0 (0.0%) | 0 (0.0%) |
| 18 to 34 Years | 13 (2.9%) | 0 (0.0%) |
| 35 to 64 Years | 48 (5.9%) | 0 (0.0%) |
| 65 to 74 Years | 7 (3.5%) | 34 (17.8%) |
| 75 Years and over | 84 (63.2%) | 40 (19.3%) |
Disability Class: Vision Difficulty
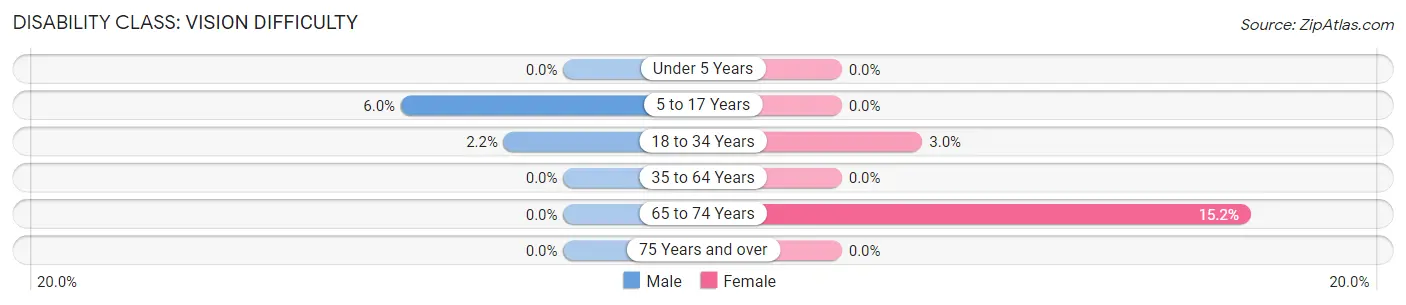
| Age Bracket | Male | Female |
| Under 5 Years | 0 (0.0%) | 0 (0.0%) |
| 5 to 17 Years | 27 (6.0%) | 0 (0.0%) |
| 18 to 34 Years | 10 (2.2%) | 10 (3.0%) |
| 35 to 64 Years | 0 (0.0%) | 0 (0.0%) |
| 65 to 74 Years | 0 (0.0%) | 29 (15.2%) |
| 75 Years and over | 0 (0.0%) | 0 (0.0%) |
Disability Class: Cognitive Difficulty
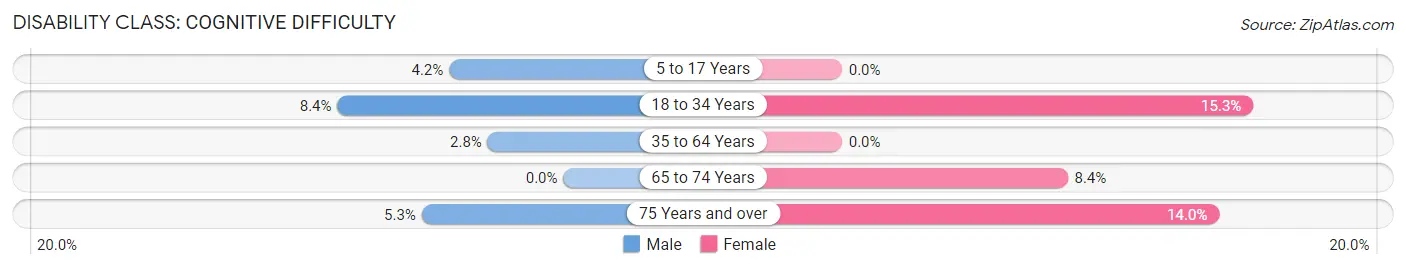
| Age Bracket | Male | Female |
| 5 to 17 Years | 19 (4.2%) | 0 (0.0%) |
| 18 to 34 Years | 38 (8.4%) | 51 (15.3%) |
| 35 to 64 Years | 23 (2.8%) | 0 (0.0%) |
| 65 to 74 Years | 0 (0.0%) | 16 (8.4%) |
| 75 Years and over | 7 (5.3%) | 29 (14.0%) |
Disability Class: Ambulatory Difficulty
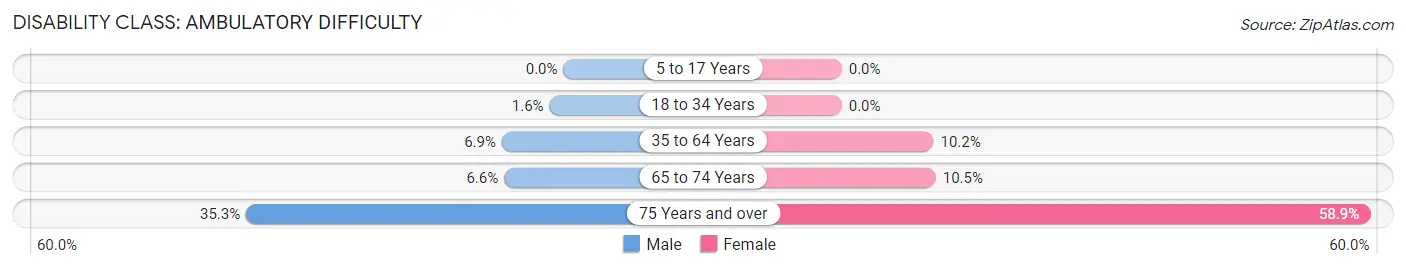
| Age Bracket | Male | Female |
| 5 to 17 Years | 0 (0.0%) | 0 (0.0%) |
| 18 to 34 Years | 7 (1.5%) | 0 (0.0%) |
| 35 to 64 Years | 56 (6.9%) | 75 (10.2%) |
| 65 to 74 Years | 13 (6.6%) | 20 (10.5%) |
| 75 Years and over | 47 (35.3%) | 122 (58.9%) |
Disability Class: Self-Care Difficulty
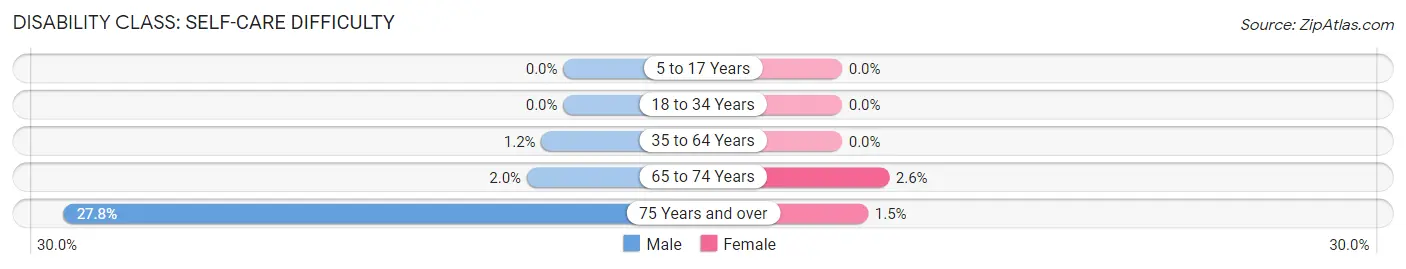
| Age Bracket | Male | Female |
| 5 to 17 Years | 0 (0.0%) | 0 (0.0%) |
| 18 to 34 Years | 0 (0.0%) | 0 (0.0%) |
| 35 to 64 Years | 10 (1.2%) | 0 (0.0%) |
| 65 to 74 Years | 4 (2.0%) | 5 (2.6%) |
| 75 Years and over | 37 (27.8%) | 3 (1.5%) |
Technology Access in Paxton
Computing Device Access in Paxton
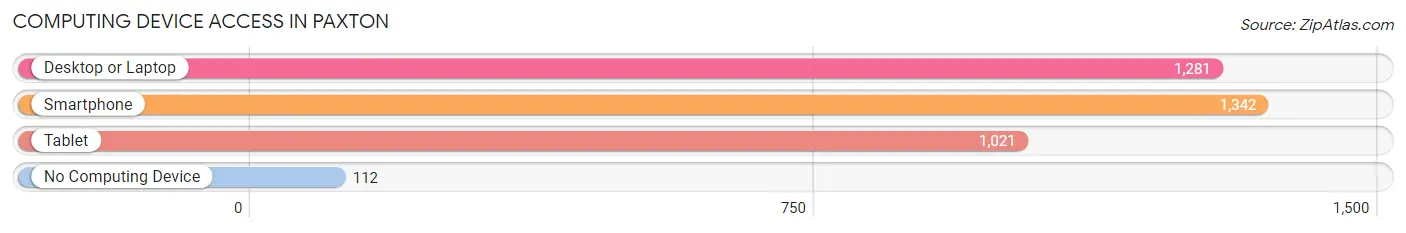
| Device Type | # Households | % Households |
| Desktop or Laptop | 1,281 | 73.8% |
| Smartphone | 1,342 | 77.3% |
| Tablet | 1,021 | 58.9% |
| No Computing Device | 112 | 6.5% |
| Total | 1,735 | 100.0% |
Internet Access in Paxton
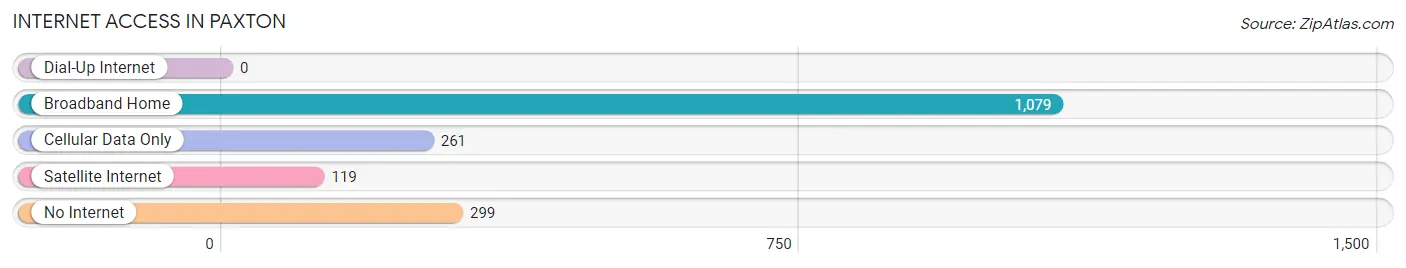
| Internet Type | # Households | % Households |
| Dial-Up Internet | 0 | 0.0% |
| Broadband Home | 1,079 | 62.2% |
| Cellular Data Only | 261 | 15.0% |
| Satellite Internet | 119 | 6.9% |
| No Internet | 299 | 17.2% |
| Total | 1,735 | 100.0% |
Paxton Summary
Paxton, Illinois is a small city located in Ford County, in the east-central part of the state. It is situated about 25 miles south of Champaign and about 40 miles north of Bloomington. The city has a population of 4,845 people, according to the 2010 census.
History
The area that is now Paxton was first settled in 1835 by a group of settlers from Pennsylvania. The town was originally called “Pax Town” after the Latin word for peace. In 1854, the name was changed to Paxton, after the nearby town of Paxton, Pennsylvania.
The town was officially incorporated in 1859. During the Civil War, Paxton was a major stop on the Underground Railroad, with many runaway slaves passing through the town on their way to freedom.
In the late 19th century, Paxton was a major center for the coal mining industry. The town was also home to several brickyards and other industries.
Geography
Paxton is located in east-central Illinois, in Ford County. It is situated about 25 miles south of Champaign and about 40 miles north of Bloomington. The city is located on the banks of the Vermilion River, which flows through the city.
The city has a total area of 2.3 square miles, all of which is land. The terrain is mostly flat, with some rolling hills in the northern part of the city.
Economy
The economy of Paxton is largely based on agriculture and manufacturing. The city is home to several large farms, as well as several small businesses.
The city is also home to several manufacturing companies, including a plastics manufacturer, a metal fabricator, and a food processing plant.
Demographics
According to the 2010 census, the population of Paxton was 4,845 people. The racial makeup of the city was 97.2% White, 0.7% African American, 0.3% Native American, 0.3% Asian, 0.2% from other races, and 1.5% from two or more races. Hispanic or Latino of any race were 1.2% of the population.
The median household income in Paxton was $41,944, and the median family income was $50,917. The per capita income for the city was $20,845. About 11.2% of families and 14.2% of the population were below the poverty line, including 19.2% of those under age 18 and 8.2% of those age 65 or over.
Paxton is served by the Paxton-Buckley-Loda Community Unit School District 10. The city is also home to several churches, including the First Presbyterian Church, the First United Methodist Church, and the St. Paul Lutheran Church.
Common Questions
What is Per Capita Income in Paxton?
Per Capita income in Paxton is $31,489.
What is the Median Family Income in Paxton?
Median Family Income in Paxton is $81,462.
What is the Median Household income in Paxton?
Median Household Income in Paxton is $59,040.
What is Income or Wage Gap in Paxton?
Income or Wage Gap in Paxton is 14.6%.
Women in Paxton earn 85.4 cents for every dollar earned by a man.
What is Inequality or Gini Index in Paxton?
Inequality or Gini Index in Paxton is 0.43.
What is the Total Population of Paxton?
Total Population of Paxton is 4,225.
What is the Total Male Population of Paxton?
Total Male Population of Paxton is 2,209.
What is the Total Female Population of Paxton?
Total Female Population of Paxton is 2,016.
What is the Ratio of Males per 100 Females in Paxton?
There are 109.57 Males per 100 Females in Paxton.
What is the Ratio of Females per 100 Males in Paxton?
There are 91.26 Females per 100 Males in Paxton.
What is the Median Population Age in Paxton?
Median Population Age in Paxton is 40.5 Years.
What is the Average Family Size in Paxton
Average Family Size in Paxton is 3.1 People.
What is the Average Household Size in Paxton
Average Household Size in Paxton is 2.3 People.
How Large is the Labor Force in Paxton?
There are 1,997 People in the Labor Forcein in Paxton.
What is the Percentage of People in the Labor Force in Paxton?
60.0% of People are in the Labor Force in Paxton.
What is the Unemployment Rate in Paxton?
Unemployment Rate in Paxton is 1.5%.