Owaneco, IL Map & Demographics
Owaneco Map
Owaneco Overview
$21,484
PER CAPITA INCOME
$73,631
AVG FAMILY INCOME
$67,273
AVG HOUSEHOLD INCOME
40.3%
WAGE / INCOME GAP [ % ]
59.7¢/ $1
WAGE / INCOME GAP [ $ ]
0.31
INEQUALITY / GINI INDEX
758
TOTAL POPULATION
311
MALE POPULATION
447
FEMALE POPULATION
69.57
MALES / 100 FEMALES
143.73
FEMALES / 100 MALES
34.3
MEDIAN AGE
4.5
AVG FAMILY SIZE
3.7
AVG HOUSEHOLD SIZE
327
LABOR FORCE [ PEOPLE ]
54.7%
PERCENT IN LABOR FORCE
4.0%
UNEMPLOYMENT RATE
Owaneco Zip Codes
Owaneco Area Codes
Income in Owaneco
Income Overview in Owaneco
Per Capita Income in Owaneco is $21,484, while median incomes of families and households are $73,631 and $67,273 respectively.
| Characteristic | Number | Measure |
| Per Capita Income | 758 | $21,484 |
| Median Family Income | 145 | $73,631 |
| Mean Family Income | 145 | $76,116 |
| Median Household Income | 204 | $67,273 |
| Mean Household Income | 204 | $69,690 |
| Income Deficit | 145 | $0 |
| Wage / Income Gap (%) | 758 | 40.28% |
| Wage / Income Gap ($) | 758 | 59.72¢ per $1 |
| Gini / Inequality Index | 758 | 0.31 |
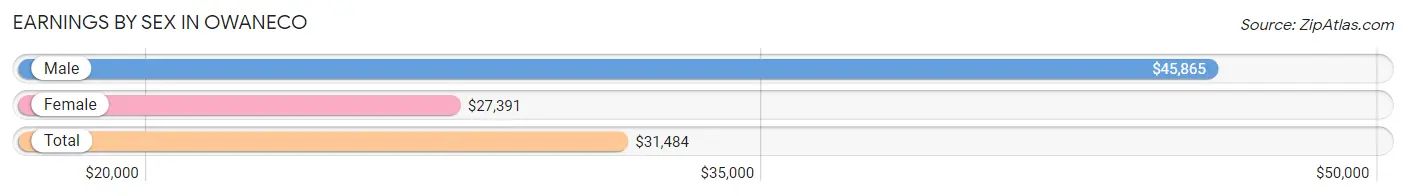
Earnings by Sex in Owaneco
Average Earnings in Owaneco are $31,484, $45,865 for men and $27,391 for women, a difference of 40.3%.
| Sex | Number | Average Earnings |
| Male | 174 (49.1%) | $45,865 |
| Female | 180 (50.8%) | $27,391 |
| Total | 354 (100.0%) | $31,484 |
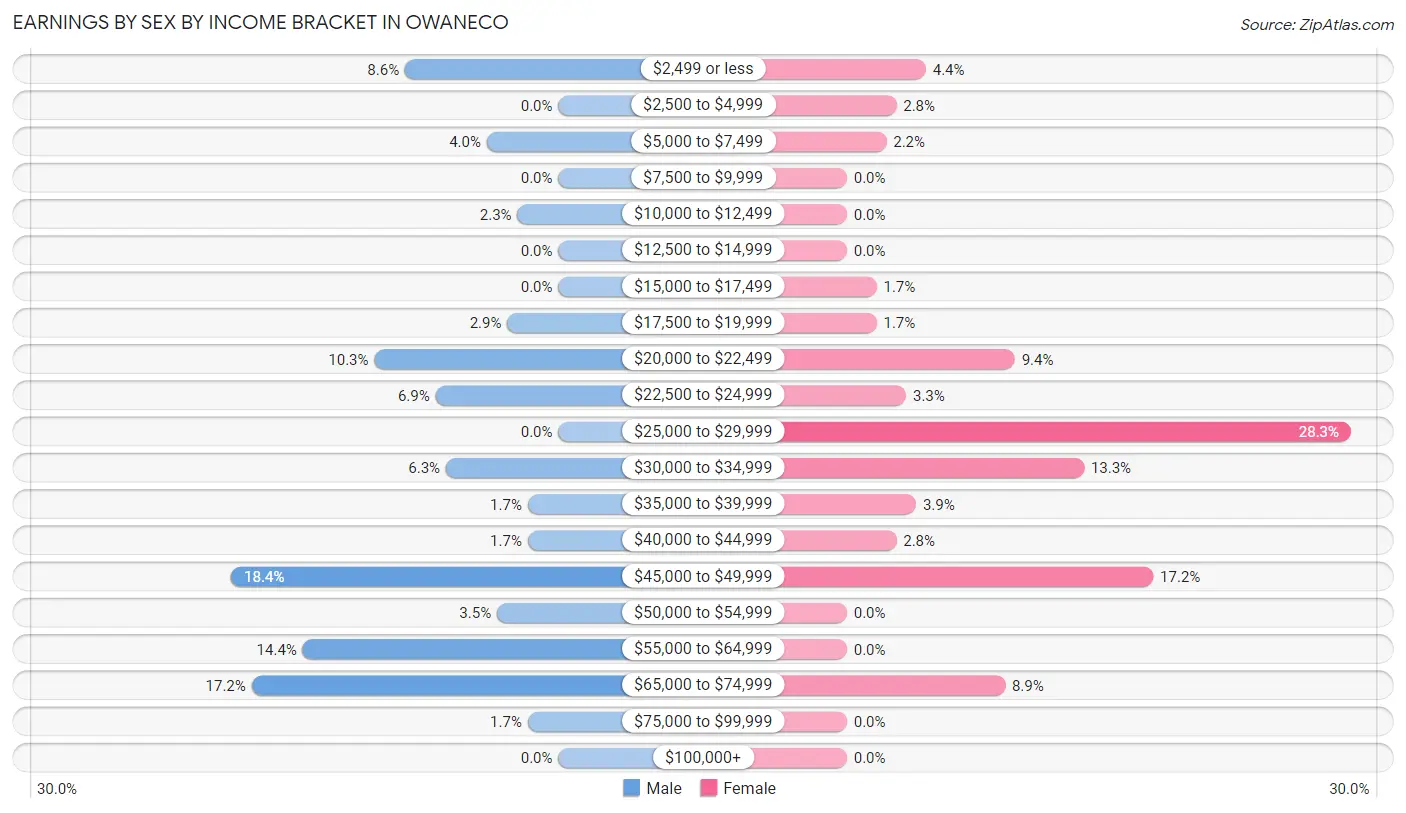
Earnings by Sex by Income Bracket in Owaneco
The most common earnings brackets in Owaneco are $45,000 to $49,999 for men (32 | 18.4%) and $25,000 to $29,999 for women (51 | 28.3%).
| Income | Male | Female |
| $2,499 or less | 15 (8.6%) | 8 (4.4%) |
| $2,500 to $4,999 | 0 (0.0%) | 5 (2.8%) |
| $5,000 to $7,499 | 7 (4.0%) | 4 (2.2%) |
| $7,500 to $9,999 | 0 (0.0%) | 0 (0.0%) |
| $10,000 to $12,499 | 4 (2.3%) | 0 (0.0%) |
| $12,500 to $14,999 | 0 (0.0%) | 0 (0.0%) |
| $15,000 to $17,499 | 0 (0.0%) | 3 (1.7%) |
| $17,500 to $19,999 | 5 (2.9%) | 3 (1.7%) |
| $20,000 to $22,499 | 18 (10.3%) | 17 (9.4%) |
| $22,500 to $24,999 | 12 (6.9%) | 6 (3.3%) |
| $25,000 to $29,999 | 0 (0.0%) | 51 (28.3%) |
| $30,000 to $34,999 | 11 (6.3%) | 24 (13.3%) |
| $35,000 to $39,999 | 3 (1.7%) | 7 (3.9%) |
| $40,000 to $44,999 | 3 (1.7%) | 5 (2.8%) |
| $45,000 to $49,999 | 32 (18.4%) | 31 (17.2%) |
| $50,000 to $54,999 | 6 (3.5%) | 0 (0.0%) |
| $55,000 to $64,999 | 25 (14.4%) | 0 (0.0%) |
| $65,000 to $74,999 | 30 (17.2%) | 16 (8.9%) |
| $75,000 to $99,999 | 3 (1.7%) | 0 (0.0%) |
| $100,000+ | 0 (0.0%) | 0 (0.0%) |
| Total | 174 (100.0%) | 180 (100.0%) |
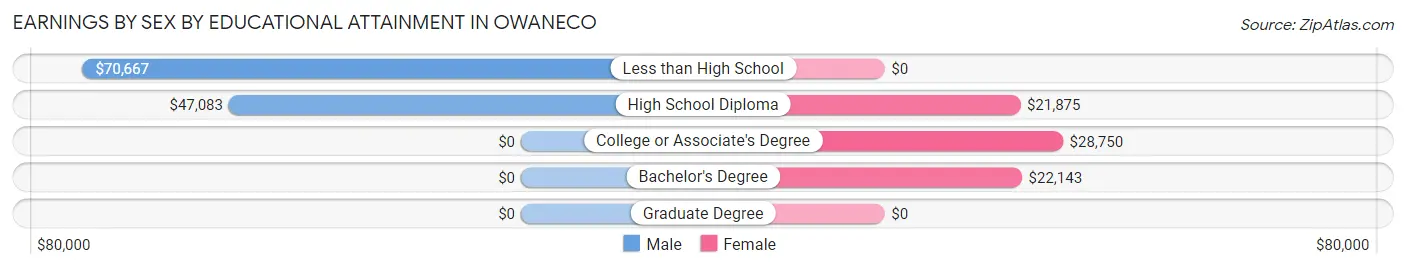
Earnings by Sex by Educational Attainment in Owaneco
Average earnings in Owaneco are $48,750 for men and $27,255 for women, a difference of 44.1%. Men with an educational attainment of less than high school enjoy the highest average annual earnings of $70,667, while those with high school diploma education earn the least with $47,083. Women with an educational attainment of college or associate's degree earn the most with the average annual earnings of $28,750, while those with high school diploma education have the smallest earnings of $21,875.
| Educational Attainment | Male Income | Female Income |
| Less than High School | $70,667 | $0 |
| High School Diploma | $47,083 | $21,875 |
| College or Associate's Degree | - | - |
| Bachelor's Degree | - | - |
| Graduate Degree | - | - |
| Total | $48,750 | $27,255 |
Family Income in Owaneco
Family Income Brackets in Owaneco
According to the Owaneco family income data, there are 47 families falling into the $100,000 to $149,999 income range, which is the most common income bracket and makes up 32.4% of all families.
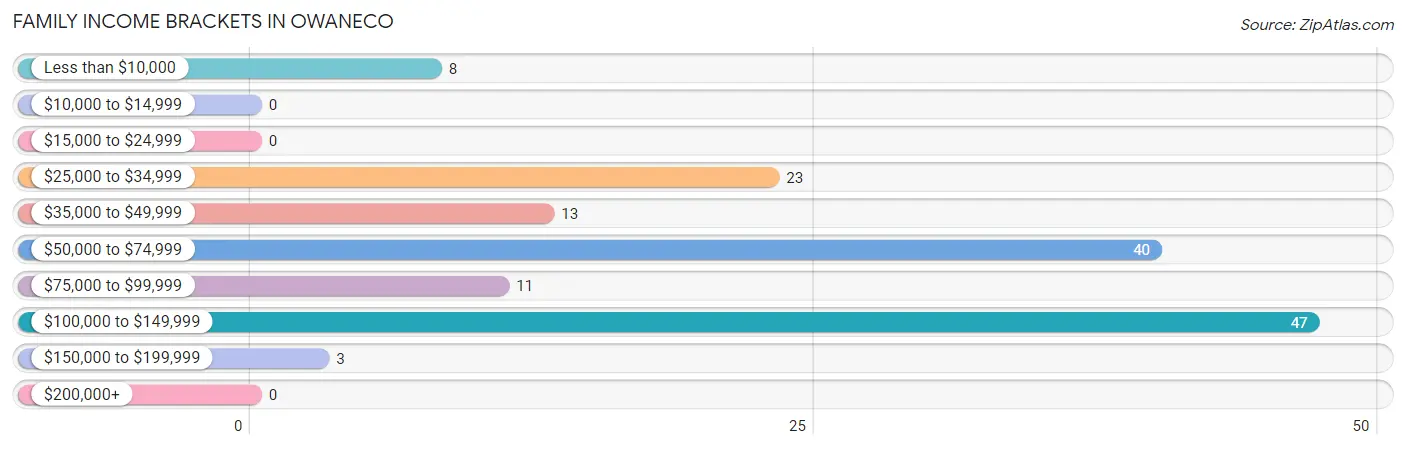
| Income Bracket | # Families | % Families |
| Less than $10,000 | 8 | 5.5% |
| $10,000 to $14,999 | 0 | 0.0% |
| $15,000 to $24,999 | 0 | 0.0% |
| $25,000 to $34,999 | 23 | 15.9% |
| $35,000 to $49,999 | 13 | 9.0% |
| $50,000 to $74,999 | 40 | 27.6% |
| $75,000 to $99,999 | 11 | 7.6% |
| $100,000 to $149,999 | 47 | 32.4% |
| $150,000 to $199,999 | 3 | 2.1% |
| $200,000+ | 0 | 0.0% |
Family Income by Famaliy Size in Owaneco
4-person families (15 | 10.3%) account for the highest median family income in Owaneco with $120,156 per family, while 4-person families (15 | 10.3%) have the highest median income of $30,039 per family member.
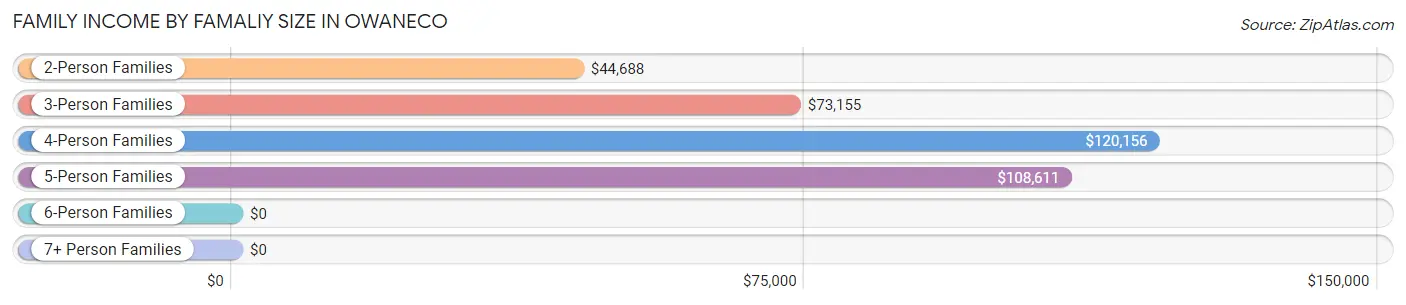
| Income Bracket | # Families | Median Income |
| 2-Person Families | 45 (31.0%) | $44,688 |
| 3-Person Families | 37 (25.5%) | $73,155 |
| 4-Person Families | 15 (10.3%) | $120,156 |
| 5-Person Families | 48 (33.1%) | $108,611 |
| 6-Person Families | 0 (0.0%) | $0 |
| 7+ Person Families | 0 (0.0%) | $0 |
| Total | 145 (100.0%) | $73,631 |
Family Income by Number of Earners in Owaneco
The median family income in Owaneco is $73,631, with families comprising 3+ earners (14) having the highest median family income of $121,250, while families with no earners (28) have the lowest median family income of $33,500, accounting for 9.7% and 19.3% of families, respectively.
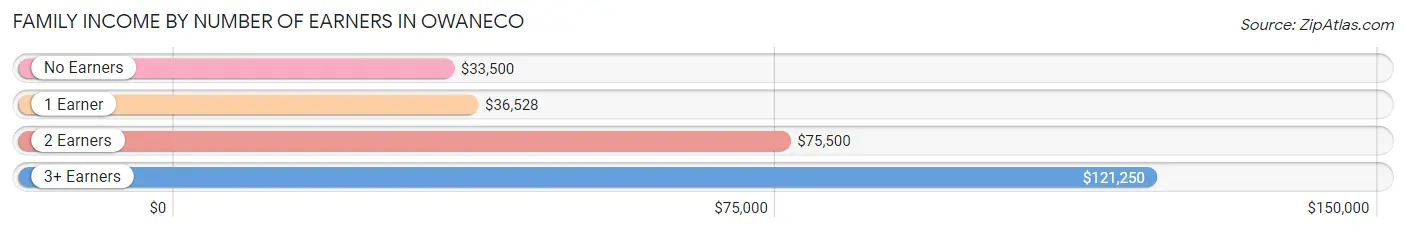
| Number of Earners | # Families | Median Income |
| No Earners | 28 (19.3%) | $33,500 |
| 1 Earner | 27 (18.6%) | $36,528 |
| 2 Earners | 76 (52.4%) | $75,500 |
| 3+ Earners | 14 (9.7%) | $121,250 |
| Total | 145 (100.0%) | $73,631 |
Household Income in Owaneco
Household Income Brackets in Owaneco
With 72 households falling in the category, the $50,000 to $74,999 income range is the most frequent in Owaneco, accounting for 35.3% of all households.
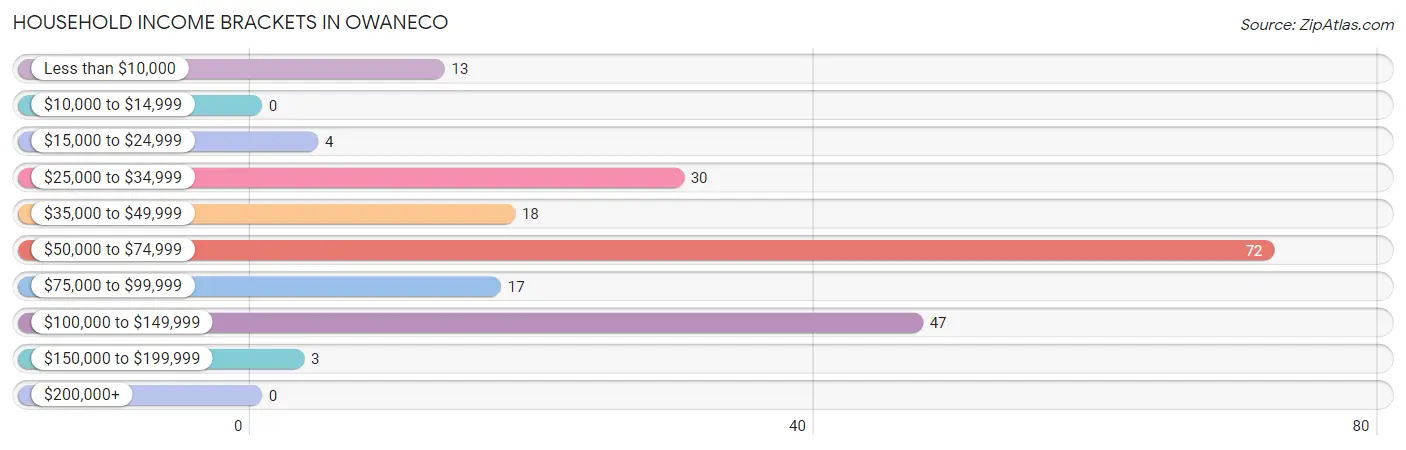
| Income Bracket | # Households | % Households |
| Less than $10,000 | 13 | 6.4% |
| $10,000 to $14,999 | 0 | 0.0% |
| $15,000 to $24,999 | 4 | 2.0% |
| $25,000 to $34,999 | 30 | 14.7% |
| $35,000 to $49,999 | 18 | 8.8% |
| $50,000 to $74,999 | 72 | 35.3% |
| $75,000 to $99,999 | 17 | 8.3% |
| $100,000 to $149,999 | 47 | 23.0% |
| $150,000 to $199,999 | 3 | 1.5% |
| $200,000+ | 0 | 0.0% |
Household Income by Householder Age in Owaneco
The median household income in Owaneco is $67,273, with the highest median household income of $74,650 found in the 25 to 44 years age bracket for the primary householder. A total of 77 households (37.8%) fall into this category.
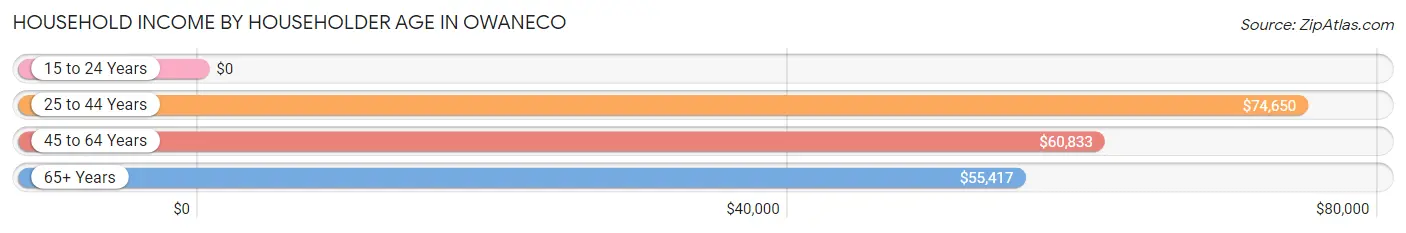
| Income Bracket | # Households | Median Income |
| 15 to 24 Years | 0 (0.0%) | $0 |
| 25 to 44 Years | 77 (37.8%) | $74,650 |
| 45 to 64 Years | 78 (38.2%) | $60,833 |
| 65+ Years | 49 (24.0%) | $55,417 |
| Total | 204 (100.0%) | $67,273 |
Poverty in Owaneco
Income Below Poverty by Sex and Age in Owaneco
With 21.2% poverty level for males and 15.0% for females among the residents of Owaneco, 16 and 17 year old males and 75 year old and over females are the most vulnerable to poverty, with 9 males (100.0%) and 20 females (57.1%) in their respective age groups living below the poverty level.
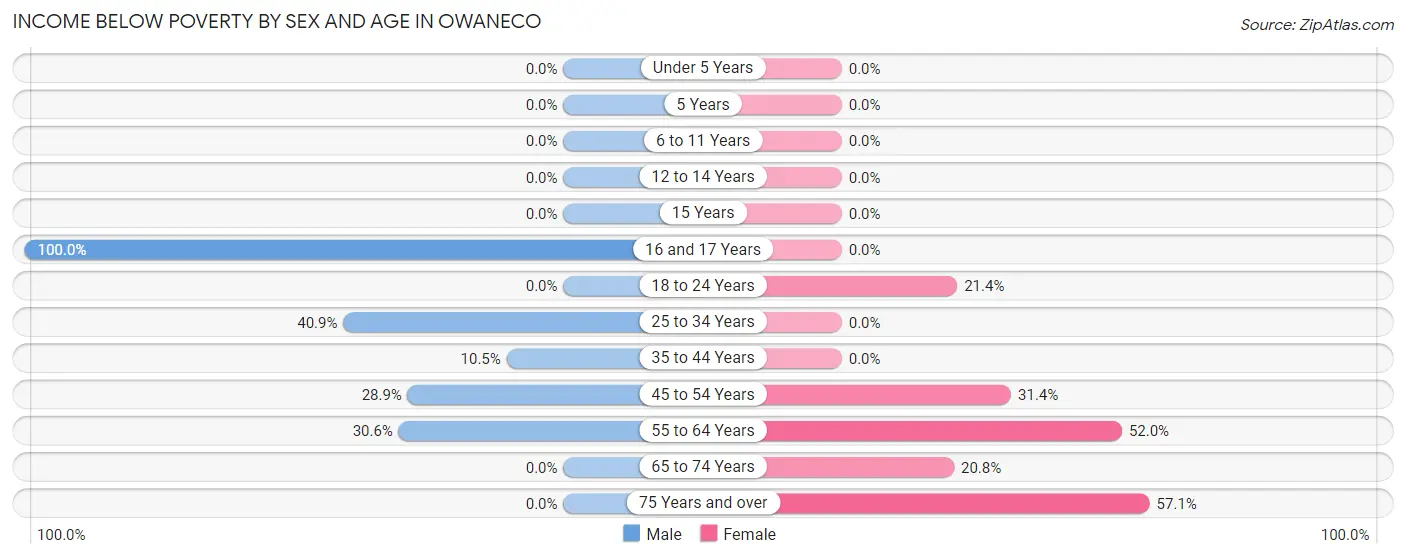
| Age Bracket | Male | Female |
| Under 5 Years | 0 (0.0%) | 0 (0.0%) |
| 5 Years | 0 (0.0%) | 0 (0.0%) |
| 6 to 11 Years | 0 (0.0%) | 0 (0.0%) |
| 12 to 14 Years | 0 (0.0%) | 0 (0.0%) |
| 15 Years | 0 (0.0%) | 0 (0.0%) |
| 16 and 17 Years | 9 (100.0%) | 0 (0.0%) |
| 18 to 24 Years | 0 (0.0%) | 18 (21.4%) |
| 25 to 34 Years | 29 (40.8%) | 0 (0.0%) |
| 35 to 44 Years | 4 (10.5%) | 0 (0.0%) |
| 45 to 54 Years | 13 (28.9%) | 11 (31.4%) |
| 55 to 64 Years | 11 (30.6%) | 13 (52.0%) |
| 65 to 74 Years | 0 (0.0%) | 5 (20.8%) |
| 75 Years and over | 0 (0.0%) | 20 (57.1%) |
| Total | 66 (21.2%) | 67 (15.0%) |
Income Above Poverty by Sex and Age in Owaneco
According to the poverty statistics in Owaneco, males aged under 5 years and females aged under 5 years are the age groups that are most secure financially, with 100.0% of males and 100.0% of females in these age groups living above the poverty line.
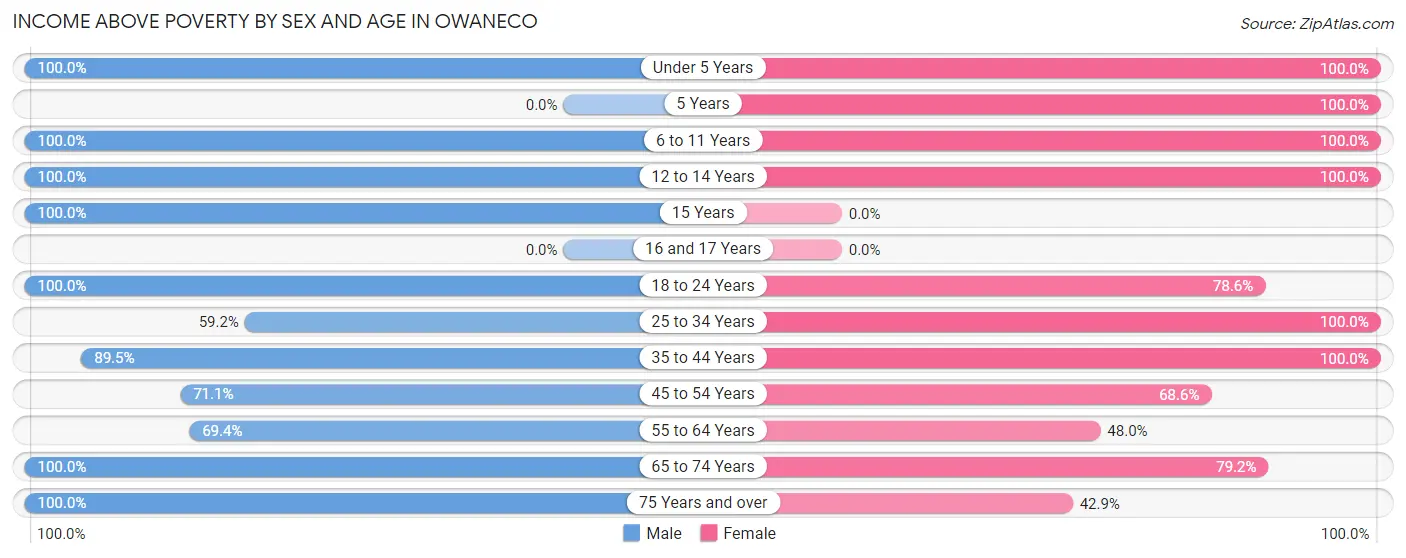
| Age Bracket | Male | Female |
| Under 5 Years | 4 (100.0%) | 28 (100.0%) |
| 5 Years | 0 (0.0%) | 4 (100.0%) |
| 6 to 11 Years | 22 (100.0%) | 62 (100.0%) |
| 12 to 14 Years | 10 (100.0%) | 25 (100.0%) |
| 15 Years | 5 (100.0%) | 0 (0.0%) |
| 16 and 17 Years | 0 (0.0%) | 0 (0.0%) |
| 18 to 24 Years | 31 (100.0%) | 66 (78.6%) |
| 25 to 34 Years | 42 (59.2%) | 46 (100.0%) |
| 35 to 44 Years | 34 (89.5%) | 79 (100.0%) |
| 45 to 54 Years | 32 (71.1%) | 24 (68.6%) |
| 55 to 64 Years | 25 (69.4%) | 12 (48.0%) |
| 65 to 74 Years | 20 (100.0%) | 19 (79.2%) |
| 75 Years and over | 20 (100.0%) | 15 (42.9%) |
| Total | 245 (78.8%) | 380 (85.0%) |
Income Below Poverty Among Married-Couple Families in Owaneco
The poverty statistics for married-couple families in Owaneco show that 14.8% or 19 of the total 128 families live below the poverty line. Families with no children have the highest poverty rate of 22.6%, comprising of 19 families. On the other hand, families with 1 or 2 children have the lowest poverty rate of 0.0%, which includes 0 families.
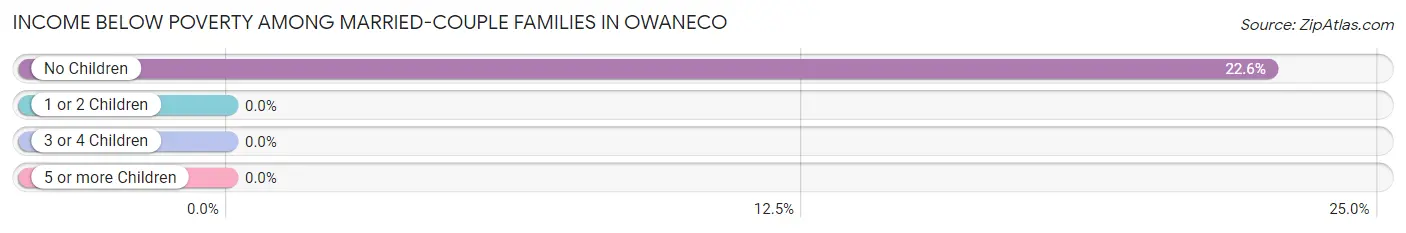
| Children | Above Poverty | Below Poverty |
| No Children | 65 (77.4%) | 19 (22.6%) |
| 1 or 2 Children | 15 (100.0%) | 0 (0.0%) |
| 3 or 4 Children | 29 (100.0%) | 0 (0.0%) |
| 5 or more Children | 0 (0.0%) | 0 (0.0%) |
| Total | 109 (85.2%) | 19 (14.8%) |
Income Below Poverty Among Single-Parent Households in Owaneco
| Children | Single Father | Single Mother |
| No Children | 0 (0.0%) | 0 (0.0%) |
| 1 or 2 Children | 0 (0.0%) | 0 (0.0%) |
| 3 or 4 Children | 0 (0.0%) | 0 (0.0%) |
| 5 or more Children | 0 (0.0%) | 0 (0.0%) |
| Total | 0 (0.0%) | 0 (0.0%) |
Income Below Poverty Among Married-Couple vs Single-Parent Households in Owaneco
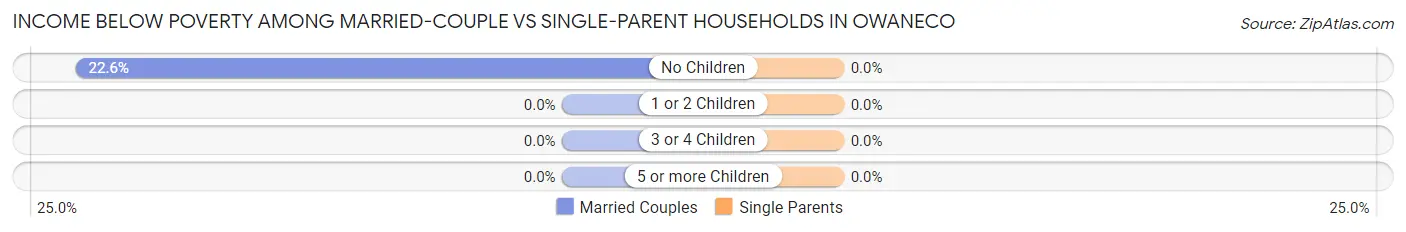
| Children | Married-Couple Families | Single-Parent Households |
| No Children | 19 (22.6%) | 0 (0.0%) |
| 1 or 2 Children | 0 (0.0%) | 0 (0.0%) |
| 3 or 4 Children | 0 (0.0%) | 0 (0.0%) |
| 5 or more Children | 0 (0.0%) | 0 (0.0%) |
| Total | 19 (14.8%) | 0 (0.0%) |
Race in Owaneco
The most populous races in Owaneco are White / Caucasian (739 | 97.5%), and Two or more Races (19 | 2.5%).

| Race | # Population | % Population |
| Asian | 0 | 0.0% |
| Black / African American | 0 | 0.0% |
| Hawaiian / Pacific | 0 | 0.0% |
| Hispanic or Latino | 0 | 0.0% |
| Native / Alaskan | 0 | 0.0% |
| White / Caucasian | 739 | 97.5% |
| Two or more Races | 19 | 2.5% |
| Some other Race | 0 | 0.0% |
| Total | 758 | 100.0% |
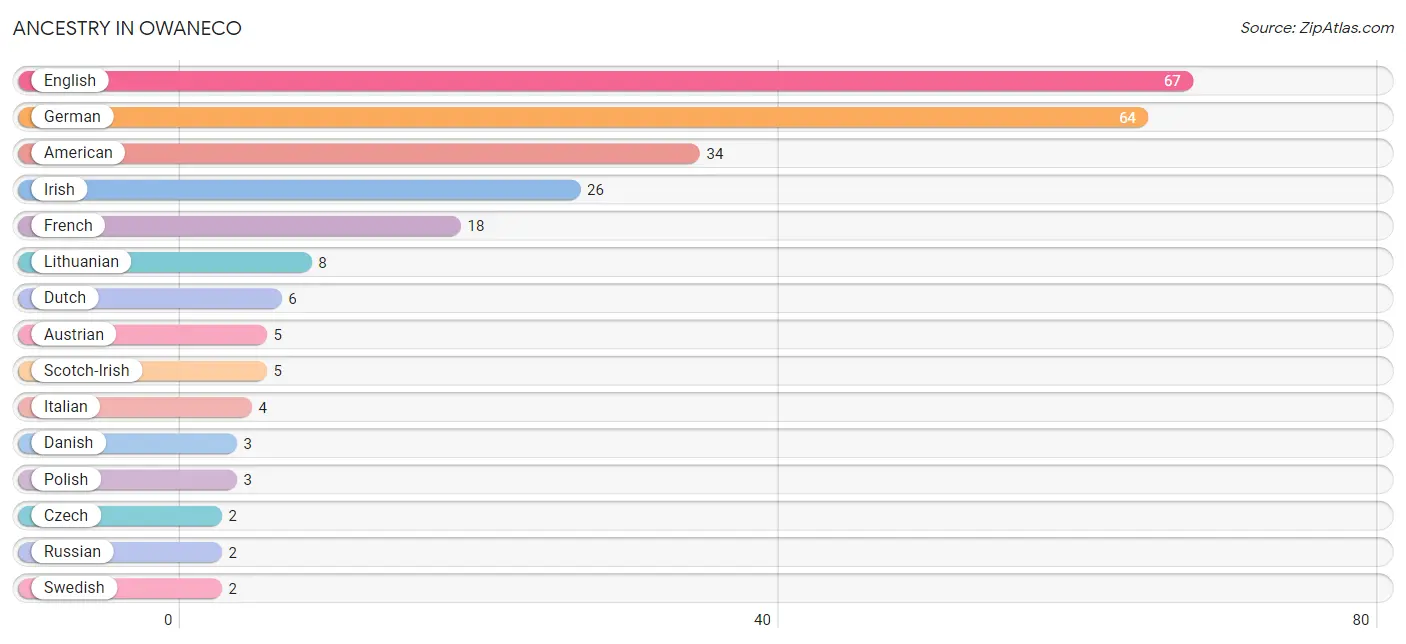
Ancestry in Owaneco
The most populous ancestries reported in Owaneco are English (67 | 8.8%), German (64 | 8.4%), American (34 | 4.5%), Irish (26 | 3.4%), and French (18 | 2.4%), together accounting for 27.6% of all Owaneco residents.
| Ancestry | # Population | % Population |
| American | 34 | 4.5% |
| Austrian | 5 | 0.7% |
| Czech | 2 | 0.3% |
| Danish | 3 | 0.4% |
| Dutch | 6 | 0.8% |
| English | 67 | 8.8% |
| French | 18 | 2.4% |
| German | 64 | 8.4% |
| Irish | 26 | 3.4% |
| Italian | 4 | 0.5% |
| Lithuanian | 8 | 1.1% |
| Polish | 3 | 0.4% |
| Russian | 2 | 0.3% |
| Scotch-Irish | 5 | 0.7% |
| Swedish | 2 | 0.3% |
| Swiss | 2 | 0.3% | View All 16 Rows |
Immigrants in Owaneco

| Immigration Origin | # Population | % Population | View All 0 Rows |
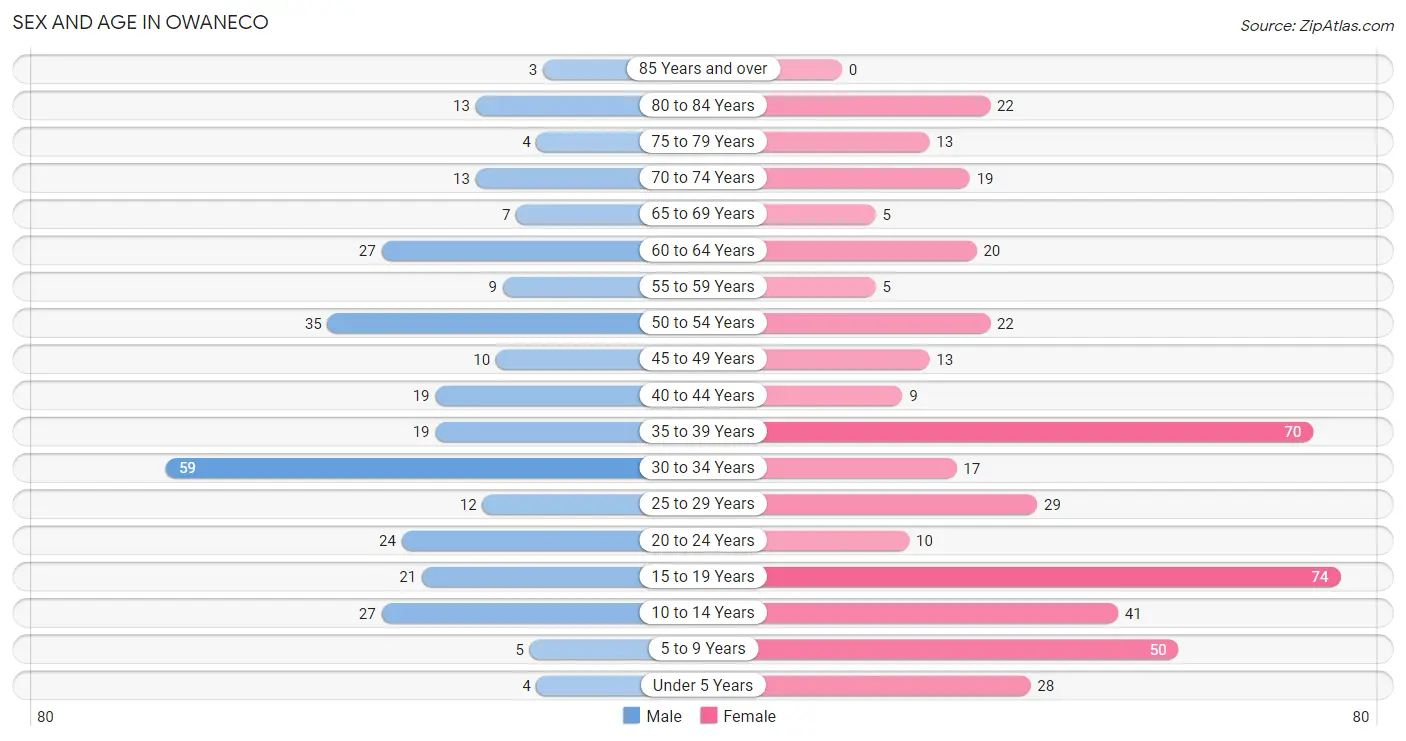
Sex and Age in Owaneco
Sex and Age in Owaneco
The most populous age groups in Owaneco are 30 to 34 Years (59 | 19.0%) for men and 15 to 19 Years (74 | 16.6%) for women.
| Age Bracket | Male | Female |
| Under 5 Years | 4 (1.3%) | 28 (6.3%) |
| 5 to 9 Years | 5 (1.6%) | 50 (11.2%) |
| 10 to 14 Years | 27 (8.7%) | 41 (9.2%) |
| 15 to 19 Years | 21 (6.8%) | 74 (16.6%) |
| 20 to 24 Years | 24 (7.7%) | 10 (2.2%) |
| 25 to 29 Years | 12 (3.9%) | 29 (6.5%) |
| 30 to 34 Years | 59 (19.0%) | 17 (3.8%) |
| 35 to 39 Years | 19 (6.1%) | 70 (15.7%) |
| 40 to 44 Years | 19 (6.1%) | 9 (2.0%) |
| 45 to 49 Years | 10 (3.2%) | 13 (2.9%) |
| 50 to 54 Years | 35 (11.3%) | 22 (4.9%) |
| 55 to 59 Years | 9 (2.9%) | 5 (1.1%) |
| 60 to 64 Years | 27 (8.7%) | 20 (4.5%) |
| 65 to 69 Years | 7 (2.2%) | 5 (1.1%) |
| 70 to 74 Years | 13 (4.2%) | 19 (4.3%) |
| 75 to 79 Years | 4 (1.3%) | 13 (2.9%) |
| 80 to 84 Years | 13 (4.2%) | 22 (4.9%) |
| 85 Years and over | 3 (1.0%) | 0 (0.0%) |
| Total | 311 (100.0%) | 447 (100.0%) |
Families and Households in Owaneco
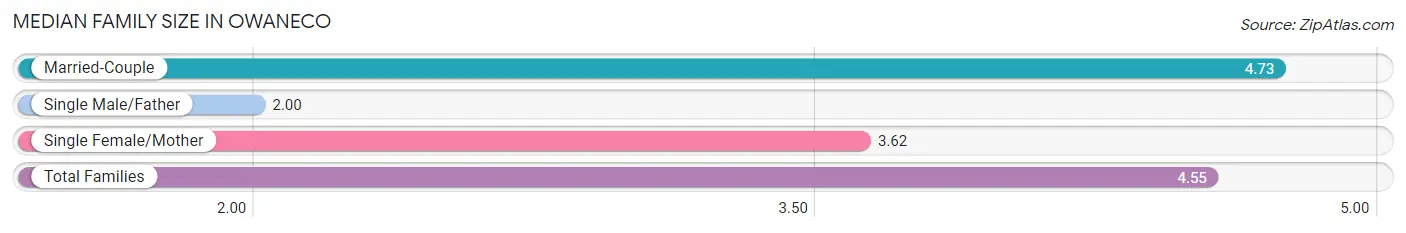
Median Family Size in Owaneco
The median family size in Owaneco is 4.55 persons per family, with married-couple families (128 | 88.3%) accounting for the largest median family size of 4.73 persons per family. On the other hand, single male/father families (4 | 2.8%) represent the smallest median family size with 2.00 persons per family.
| Family Type | # Families | Family Size |
| Married-Couple | 128 (88.3%) | 4.73 |
| Single Male/Father | 4 (2.8%) | 2.00 |
| Single Female/Mother | 13 (9.0%) | 3.62 |
| Total Families | 145 (100.0%) | 4.55 |
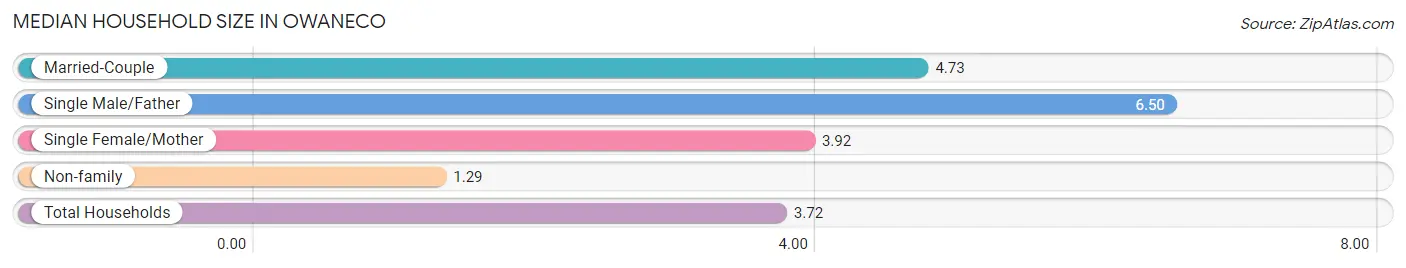
Median Household Size in Owaneco
The median household size in Owaneco is 3.72 persons per household, with single male/father households (4 | 2.0%) accounting for the largest median household size of 6.5 persons per household. non-family households (59 | 28.9%) represent the smallest median household size with 1.29 persons per household.
| Household Type | # Households | Household Size |
| Married-Couple | 128 (62.7%) | 4.73 |
| Single Male/Father | 4 (2.0%) | 6.50 |
| Single Female/Mother | 13 (6.4%) | 3.92 |
| Non-family | 59 (28.9%) | 1.29 |
| Total Households | 204 (100.0%) | 3.72 |
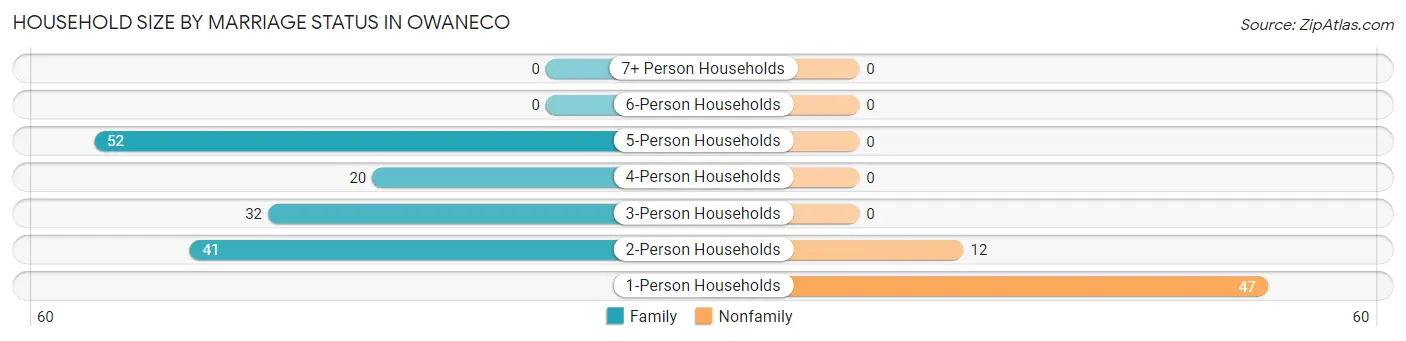
Household Size by Marriage Status in Owaneco
Out of a total of 204 households in Owaneco, 145 (71.1%) are family households, while 59 (28.9%) are nonfamily households. The most numerous type of family households are 5-person households, comprising 52, and the most common type of nonfamily households are 1-person households, comprising 47.
| Household Size | Family Households | Nonfamily Households |
| 1-Person Households | - | 47 (23.0%) |
| 2-Person Households | 41 (20.1%) | 12 (5.9%) |
| 3-Person Households | 32 (15.7%) | 0 (0.0%) |
| 4-Person Households | 20 (9.8%) | 0 (0.0%) |
| 5-Person Households | 52 (25.5%) | 0 (0.0%) |
| 6-Person Households | 0 (0.0%) | 0 (0.0%) |
| 7+ Person Households | 0 (0.0%) | 0 (0.0%) |
| Total | 145 (71.1%) | 59 (28.9%) |
Female Fertility in Owaneco
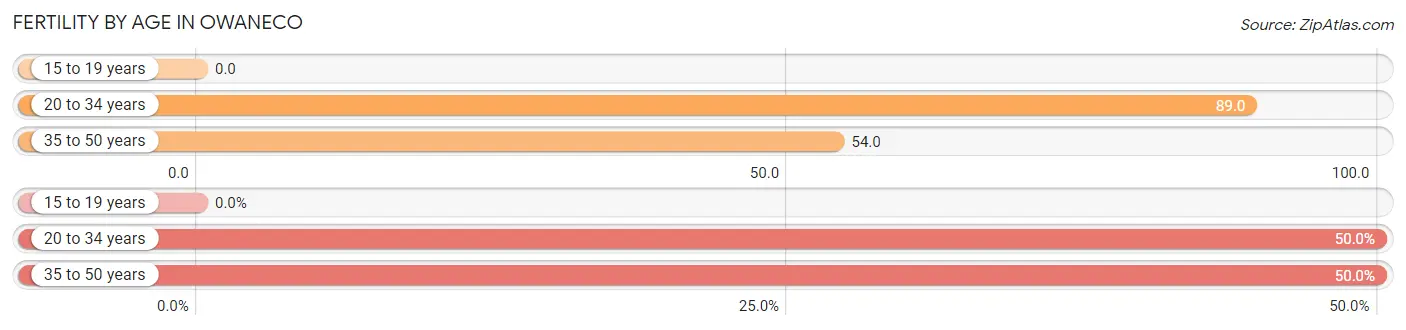
Fertility by Age in Owaneco
Average fertility rate in Owaneco is 45.0 births per 1,000 women. Women in the age bracket of 20 to 34 years have the highest fertility rate with 89.0 births per 1,000 women. Women in the age bracket of 20 to 34 years acount for 50.0% of all women with births.
| Age Bracket | Women with Births | Births / 1,000 Women |
| 15 to 19 years | 0 (0.0%) | 0.0 |
| 20 to 34 years | 5 (50.0%) | 89.0 |
| 35 to 50 years | 5 (50.0%) | 54.0 |
| Total | 10 (100.0%) | 45.0 |
Fertility by Age by Marriage Status in Owaneco
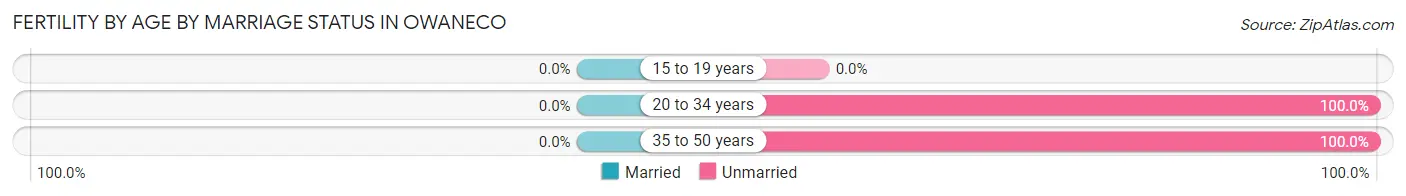
| Age Bracket | Married | Unmarried |
| 15 to 19 years | 0 (0.0%) | 0 (0.0%) |
| 20 to 34 years | 0 (0.0%) | 5 (100.0%) |
| 35 to 50 years | 0 (0.0%) | 5 (100.0%) |
| Total | 0 (0.0%) | 10 (100.0%) |
Fertility by Education in Owaneco
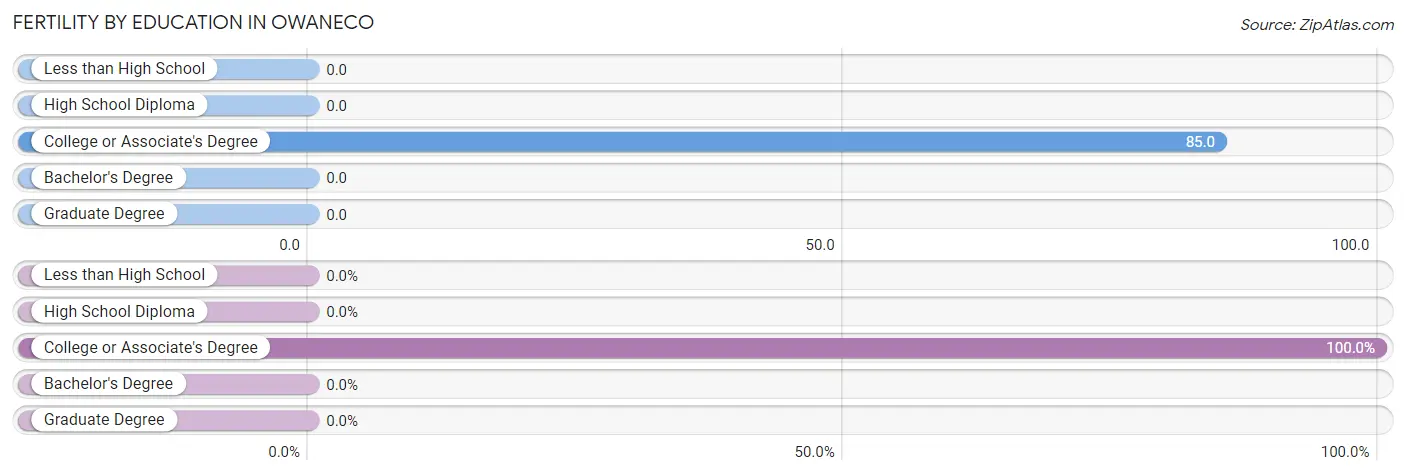
| Educational Attainment | Women with Births | Births / 1,000 Women |
| Less than High School | 0 (0.0%) | 0.0 |
| High School Diploma | 0 (0.0%) | 0.0 |
| College or Associate's Degree | 10 (100.0%) | 85.0 |
| Bachelor's Degree | 0 (0.0%) | 0.0 |
| Graduate Degree | 0 (0.0%) | 0.0 |
| Total | 10 (100.0%) | 45.0 |
Fertility by Education by Marriage Status in Owaneco
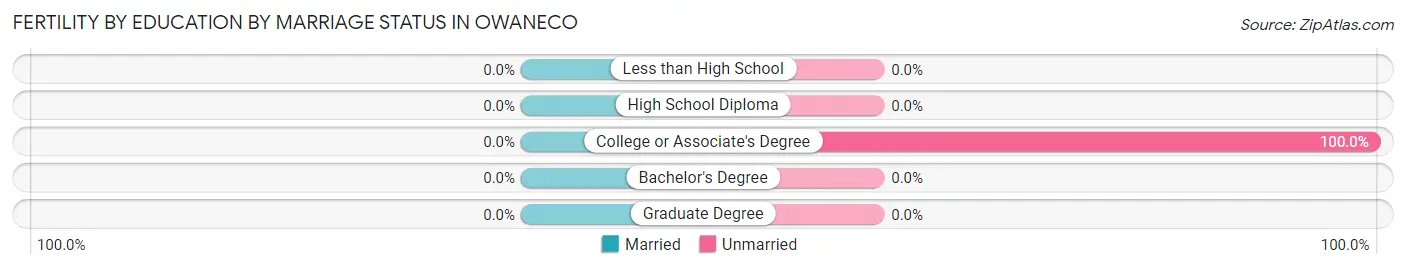
| Educational Attainment | Married | Unmarried |
| Less than High School | 0 (0.0%) | 0 (0.0%) |
| High School Diploma | 0 (0.0%) | 0 (0.0%) |
| College or Associate's Degree | 0 (0.0%) | 10 (100.0%) |
| Bachelor's Degree | 0 (0.0%) | 0 (0.0%) |
| Graduate Degree | 0 (0.0%) | 0 (0.0%) |
| Total | 0 (0.0%) | 10 (100.0%) |
Employment Characteristics in Owaneco
Employment by Class of Employer in Owaneco
Among the 306 employed individuals in Owaneco, private company employees (201 | 65.7%), state government employees (79 | 25.8%), and not-for-profit organizations (9 | 2.9%) make up the most common classes of employment.
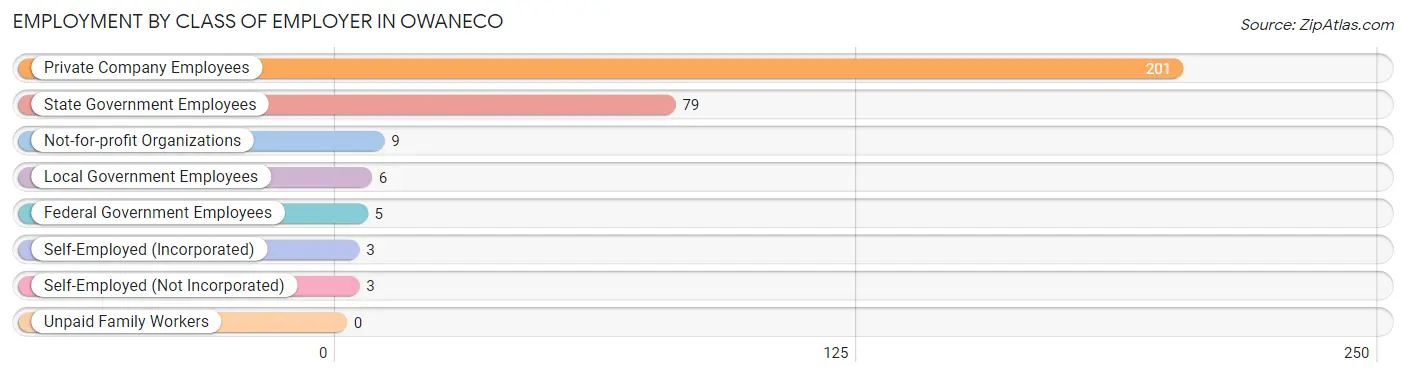
| Employer Class | # Employees | % Employees |
| Private Company Employees | 201 | 65.7% |
| Self-Employed (Incorporated) | 3 | 1.0% |
| Self-Employed (Not Incorporated) | 3 | 1.0% |
| Not-for-profit Organizations | 9 | 2.9% |
| Local Government Employees | 6 | 2.0% |
| State Government Employees | 79 | 25.8% |
| Federal Government Employees | 5 | 1.6% |
| Unpaid Family Workers | 0 | 0.0% |
| Total | 306 | 100.0% |
Employment Status by Age in Owaneco
According to the labor force statistics for Owaneco, out of the total population over 16 years of age (598), 54.7% or 327 individuals are in the labor force, with 4.0% or 13 of them unemployed. The age group with the highest labor force participation rate is 35 to 44 years, with 96.6% or 113 individuals in the labor force. Within the labor force, the 45 to 54 years age range has the highest percentage of unemployed individuals, with 24.5% or 13 of them being unemployed.
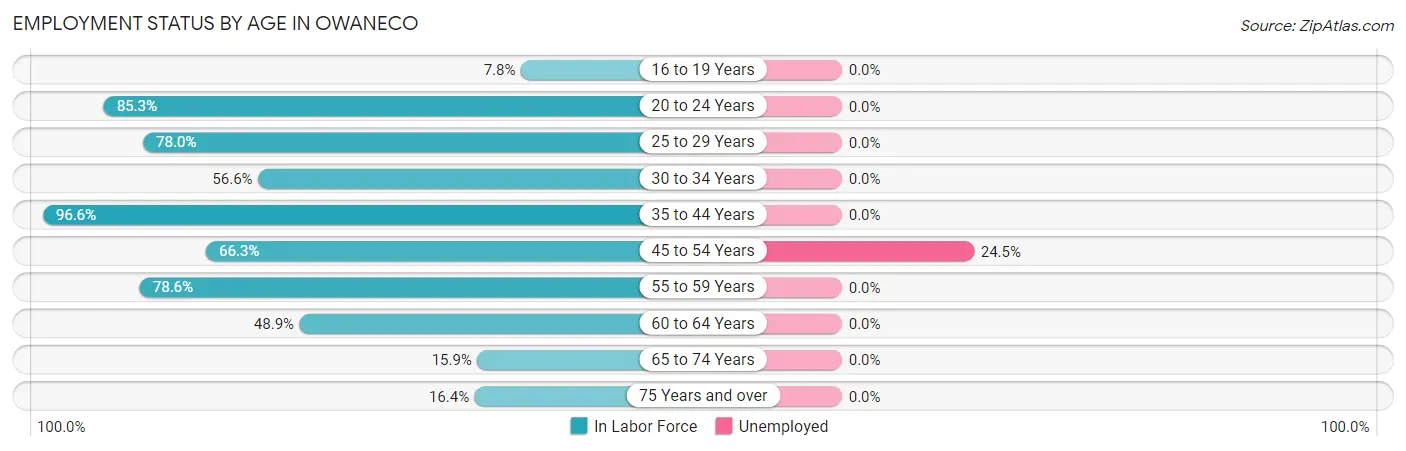
| Age Bracket | In Labor Force | Unemployed |
| 16 to 19 Years | 7 (7.8%) | 0 (0.0%) |
| 20 to 24 Years | 29 (85.3%) | 0 (0.0%) |
| 25 to 29 Years | 32 (78.0%) | 0 (0.0%) |
| 30 to 34 Years | 43 (56.6%) | 0 (0.0%) |
| 35 to 44 Years | 113 (96.6%) | 0 (0.0%) |
| 45 to 54 Years | 53 (66.3%) | 13 (24.5%) |
| 55 to 59 Years | 11 (78.6%) | 0 (0.0%) |
| 60 to 64 Years | 23 (48.9%) | 0 (0.0%) |
| 65 to 74 Years | 7 (15.9%) | 0 (0.0%) |
| 75 Years and over | 9 (16.4%) | 0 (0.0%) |
| Total | 327 (54.7%) | 13 (4.0%) |
Employment Status by Educational Attainment in Owaneco
According to labor force statistics for Owaneco, 73.3% of individuals (275) out of the total population between 25 and 64 years of age (375) are in the labor force, with 4.7% or 13 of them being unemployed. The group with the highest labor force participation rate are those with the educational attainment of less than high school, with 100.0% or 32 individuals in the labor force. Within the labor force, individuals with less than high school education have the highest percentage of unemployment, with 40.6% or 13 of them being unemployed.
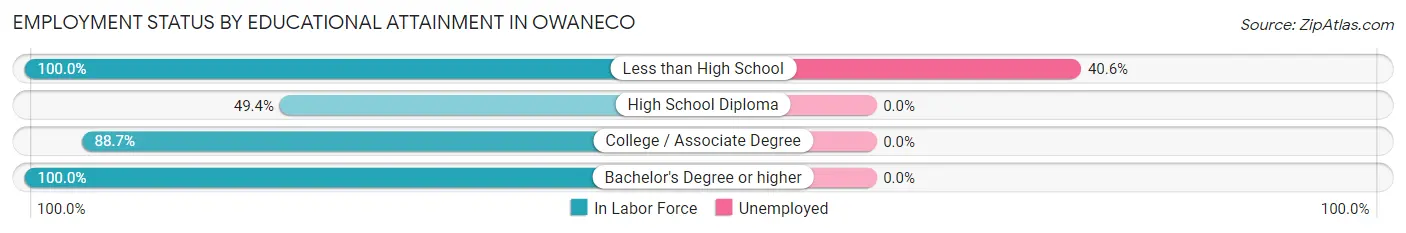
| Educational Attainment | In Labor Force | Unemployed |
| Less than High School | 32 (100.0%) | 13 (40.6%) |
| High School Diploma | 80 (49.4%) | 0 (0.0%) |
| College / Associate Degree | 141 (88.7%) | 0 (0.0%) |
| Bachelor's Degree or higher | 22 (100.0%) | 0 (0.0%) |
| Total | 275 (73.3%) | 18 (4.7%) |
Employment Occupations by Sex in Owaneco
Management, Business, Science and Arts Occupations
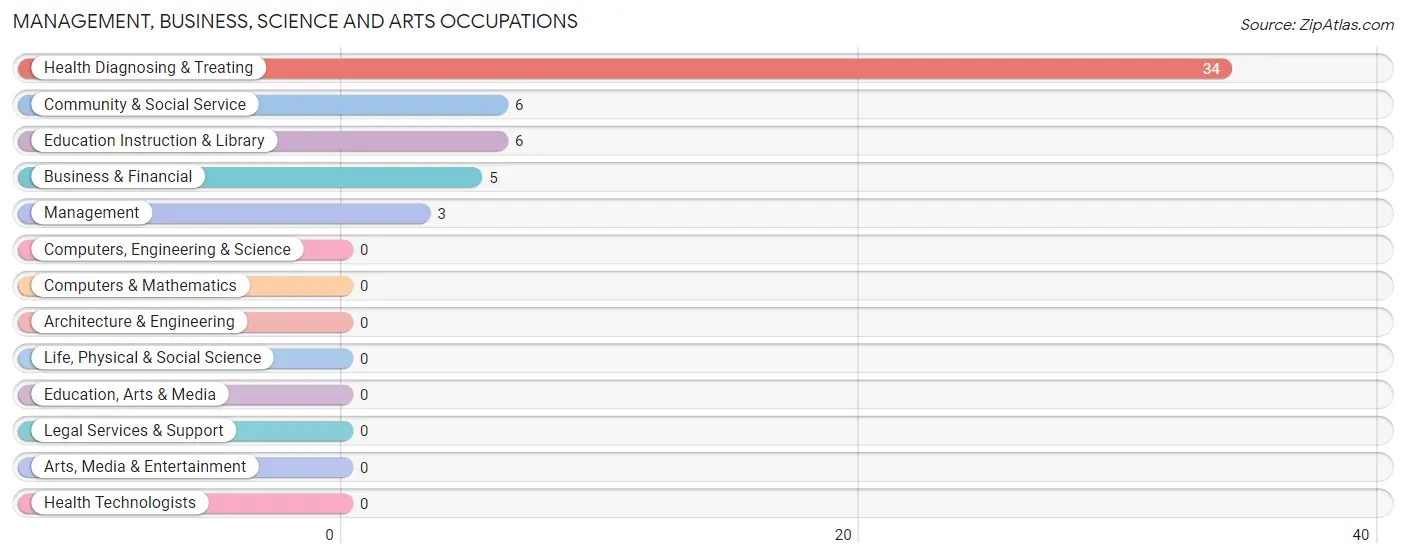
The most common Management, Business, Science and Arts occupations in Owaneco are Health Diagnosing & Treating (34 | 10.8%), Community & Social Service (6 | 1.9%), Education Instruction & Library (6 | 1.9%), Business & Financial (5 | 1.6%), and Management (3 | 1.0%).
Management, Business, Science and Arts Occupations by Sex
Within the Management, Business, Science and Arts occupations in Owaneco, the most male-oriented occupations are Management (100.0%), and Health Diagnosing & Treating (47.1%), while the most female-oriented occupations are Business & Financial (100.0%), Community & Social Service (100.0%), and Education Instruction & Library (100.0%).
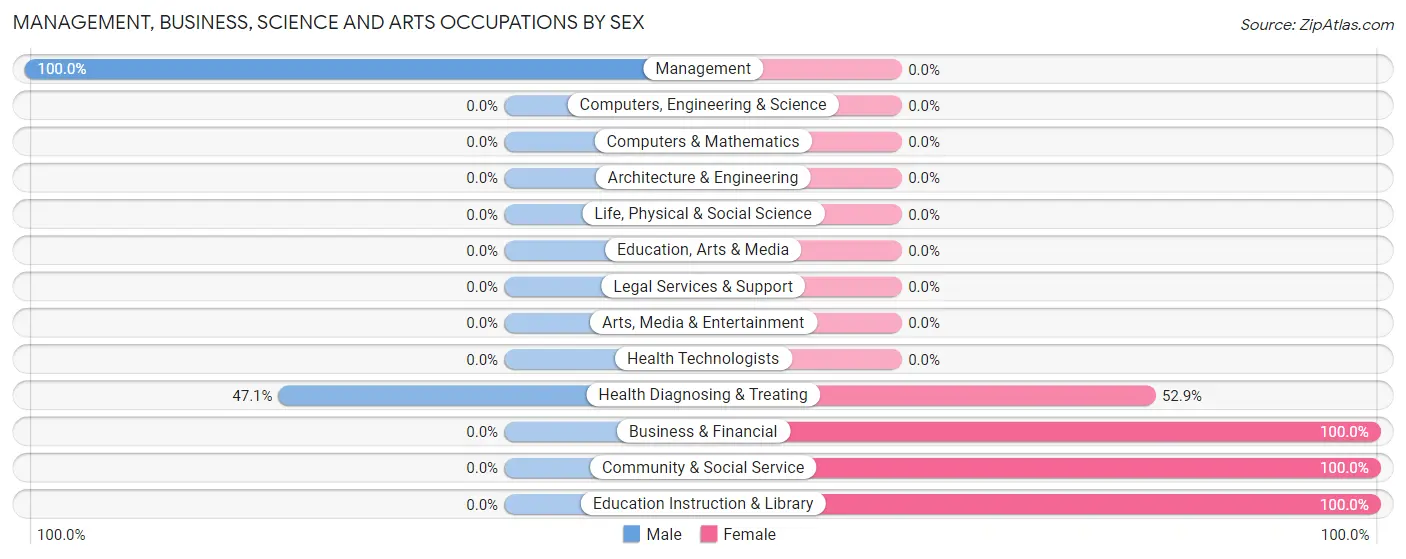
| Occupation | Male | Female |
| Management | 3 (100.0%) | 0 (0.0%) |
| Business & Financial | 0 (0.0%) | 5 (100.0%) |
| Computers, Engineering & Science | 0 (0.0%) | 0 (0.0%) |
| Computers & Mathematics | 0 (0.0%) | 0 (0.0%) |
| Architecture & Engineering | 0 (0.0%) | 0 (0.0%) |
| Life, Physical & Social Science | 0 (0.0%) | 0 (0.0%) |
| Community & Social Service | 0 (0.0%) | 6 (100.0%) |
| Education, Arts & Media | 0 (0.0%) | 0 (0.0%) |
| Legal Services & Support | 0 (0.0%) | 0 (0.0%) |
| Education Instruction & Library | 0 (0.0%) | 6 (100.0%) |
| Arts, Media & Entertainment | 0 (0.0%) | 0 (0.0%) |
| Health Diagnosing & Treating | 16 (47.1%) | 18 (52.9%) |
| Health Technologists | 0 (0.0%) | 0 (0.0%) |
| Total (Category) | 19 (39.6%) | 29 (60.4%) |
| Total (Overall) | 147 (46.8%) | 167 (53.2%) |
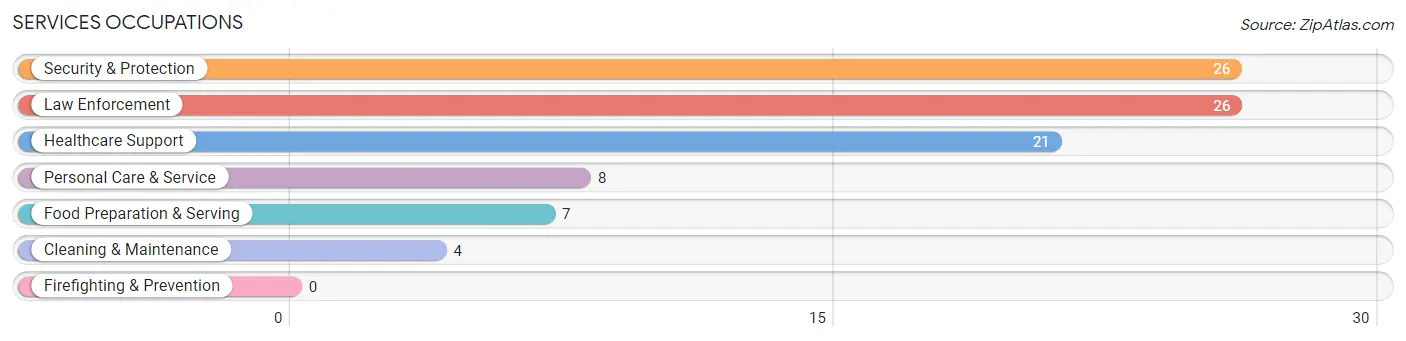
Services Occupations
The most common Services occupations in Owaneco are Security & Protection (26 | 8.3%), Law Enforcement (26 | 8.3%), Healthcare Support (21 | 6.7%), Personal Care & Service (8 | 2.5%), and Food Preparation & Serving (7 | 2.2%).
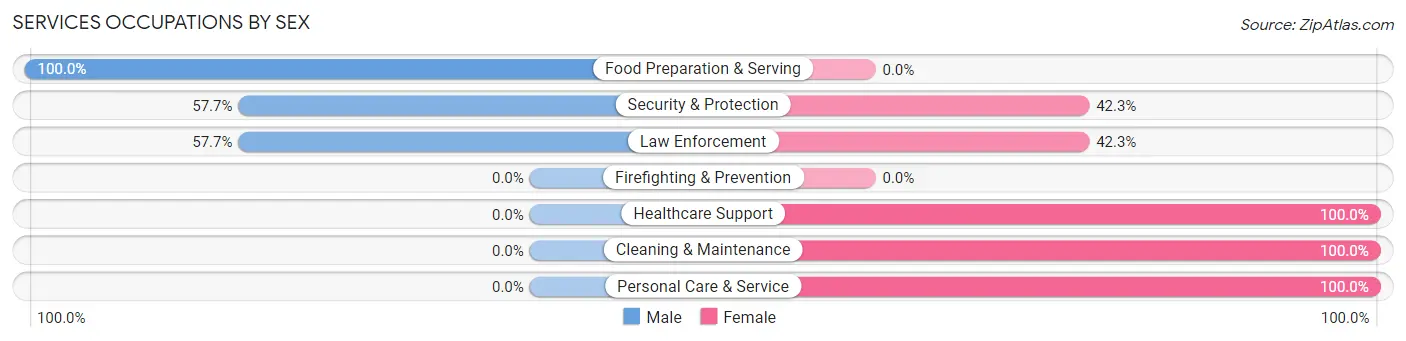
Services Occupations by Sex
Within the Services occupations in Owaneco, the most male-oriented occupations are Food Preparation & Serving (100.0%), Security & Protection (57.7%), and Law Enforcement (57.7%), while the most female-oriented occupations are Healthcare Support (100.0%), Cleaning & Maintenance (100.0%), and Personal Care & Service (100.0%).
| Occupation | Male | Female |
| Healthcare Support | 0 (0.0%) | 21 (100.0%) |
| Security & Protection | 15 (57.7%) | 11 (42.3%) |
| Firefighting & Prevention | 0 (0.0%) | 0 (0.0%) |
| Law Enforcement | 15 (57.7%) | 11 (42.3%) |
| Food Preparation & Serving | 7 (100.0%) | 0 (0.0%) |
| Cleaning & Maintenance | 0 (0.0%) | 4 (100.0%) |
| Personal Care & Service | 0 (0.0%) | 8 (100.0%) |
| Total (Category) | 22 (33.3%) | 44 (66.7%) |
| Total (Overall) | 147 (46.8%) | 167 (53.2%) |
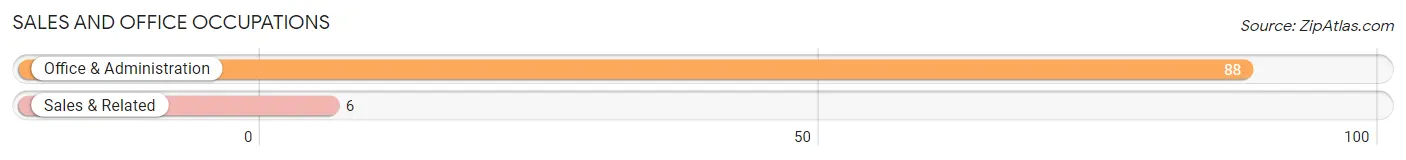
Sales and Office Occupations
The most common Sales and Office occupations in Owaneco are Office & Administration (88 | 28.0%), and Sales & Related (6 | 1.9%).
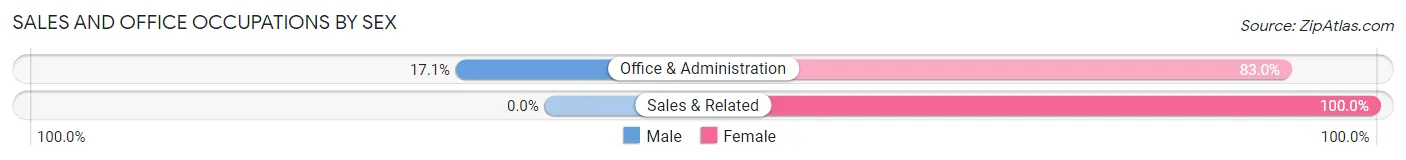
Sales and Office Occupations by Sex
| Occupation | Male | Female |
| Sales & Related | 0 (0.0%) | 6 (100.0%) |
| Office & Administration | 15 (17.1%) | 73 (83.0%) |
| Total (Category) | 15 (16.0%) | 79 (84.0%) |
| Total (Overall) | 147 (46.8%) | 167 (53.2%) |
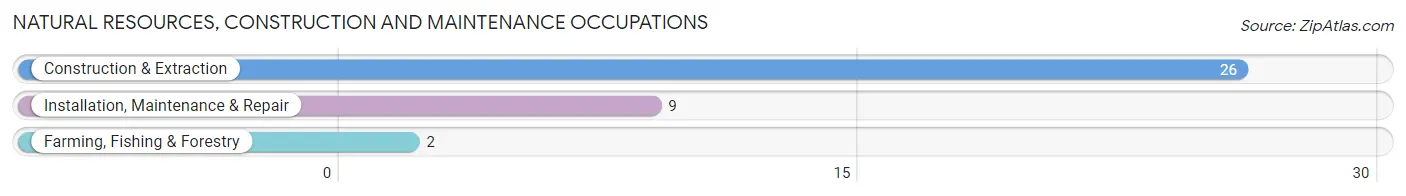
Natural Resources, Construction and Maintenance Occupations
The most common Natural Resources, Construction and Maintenance occupations in Owaneco are Construction & Extraction (26 | 8.3%), Installation, Maintenance & Repair (9 | 2.9%), and Farming, Fishing & Forestry (2 | 0.6%).
Natural Resources, Construction and Maintenance Occupations by Sex
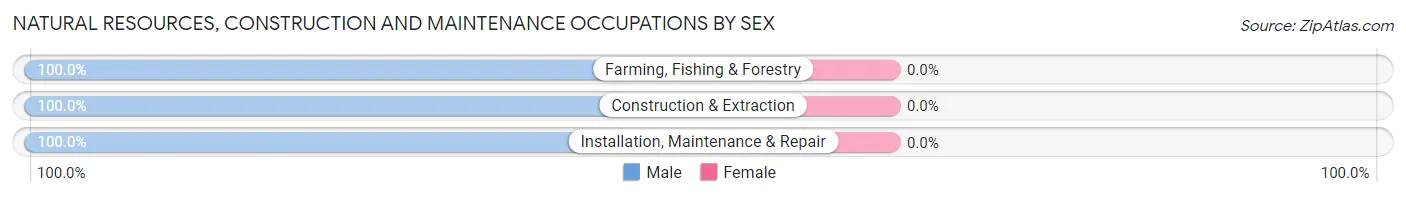
| Occupation | Male | Female |
| Farming, Fishing & Forestry | 2 (100.0%) | 0 (0.0%) |
| Construction & Extraction | 26 (100.0%) | 0 (0.0%) |
| Installation, Maintenance & Repair | 9 (100.0%) | 0 (0.0%) |
| Total (Category) | 37 (100.0%) | 0 (0.0%) |
| Total (Overall) | 147 (46.8%) | 167 (53.2%) |
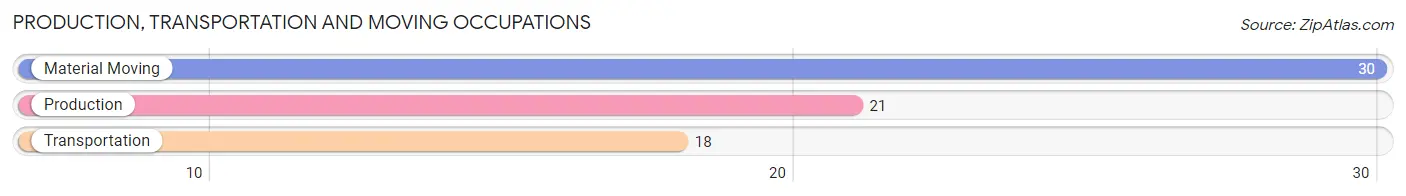
Production, Transportation and Moving Occupations
The most common Production, Transportation and Moving occupations in Owaneco are Material Moving (30 | 9.6%), Production (21 | 6.7%), and Transportation (18 | 5.7%).
Production, Transportation and Moving Occupations by Sex
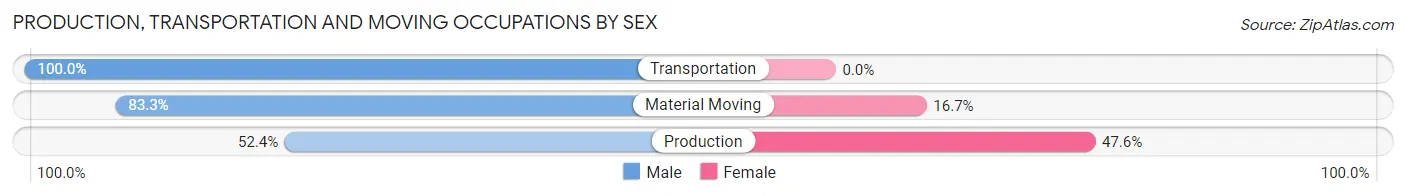
| Occupation | Male | Female |
| Production | 11 (52.4%) | 10 (47.6%) |
| Transportation | 18 (100.0%) | 0 (0.0%) |
| Material Moving | 25 (83.3%) | 5 (16.7%) |
| Total (Category) | 54 (78.3%) | 15 (21.7%) |
| Total (Overall) | 147 (46.8%) | 167 (53.2%) |
Employment Industries by Sex in Owaneco
Employment Industries in Owaneco
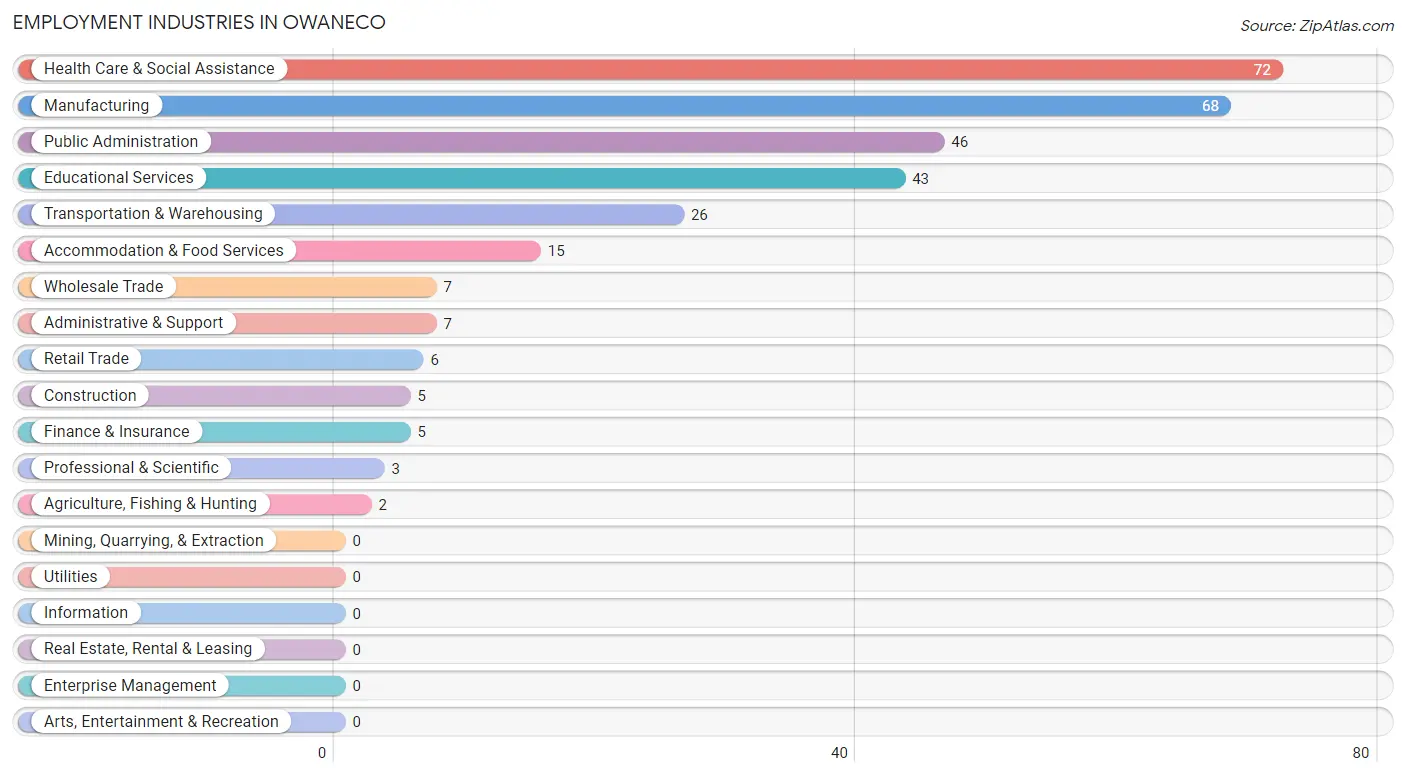
The major employment industries in Owaneco include Health Care & Social Assistance (72 | 22.9%), Manufacturing (68 | 21.7%), Public Administration (46 | 14.6%), Educational Services (43 | 13.7%), and Transportation & Warehousing (26 | 8.3%).
Employment Industries by Sex in Owaneco
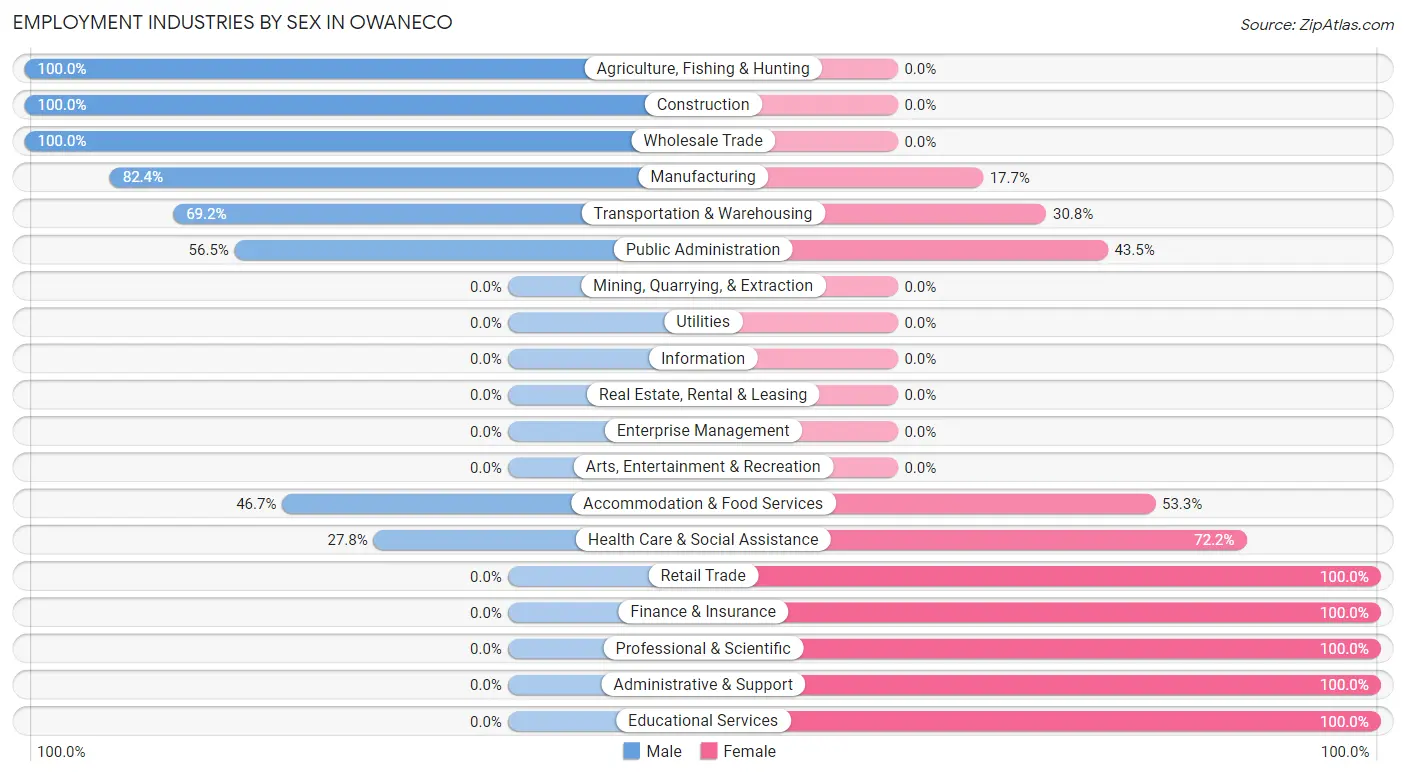
The Owaneco industries that see more men than women are Agriculture, Fishing & Hunting (100.0%), Construction (100.0%), and Wholesale Trade (100.0%), whereas the industries that tend to have a higher number of women are Retail Trade (100.0%), Finance & Insurance (100.0%), and Professional & Scientific (100.0%).
| Industry | Male | Female |
| Agriculture, Fishing & Hunting | 2 (100.0%) | 0 (0.0%) |
| Mining, Quarrying, & Extraction | 0 (0.0%) | 0 (0.0%) |
| Construction | 5 (100.0%) | 0 (0.0%) |
| Manufacturing | 56 (82.4%) | 12 (17.6%) |
| Wholesale Trade | 7 (100.0%) | 0 (0.0%) |
| Retail Trade | 0 (0.0%) | 6 (100.0%) |
| Transportation & Warehousing | 18 (69.2%) | 8 (30.8%) |
| Utilities | 0 (0.0%) | 0 (0.0%) |
| Information | 0 (0.0%) | 0 (0.0%) |
| Finance & Insurance | 0 (0.0%) | 5 (100.0%) |
| Real Estate, Rental & Leasing | 0 (0.0%) | 0 (0.0%) |
| Professional & Scientific | 0 (0.0%) | 3 (100.0%) |
| Enterprise Management | 0 (0.0%) | 0 (0.0%) |
| Administrative & Support | 0 (0.0%) | 7 (100.0%) |
| Educational Services | 0 (0.0%) | 43 (100.0%) |
| Health Care & Social Assistance | 20 (27.8%) | 52 (72.2%) |
| Arts, Entertainment & Recreation | 0 (0.0%) | 0 (0.0%) |
| Accommodation & Food Services | 7 (46.7%) | 8 (53.3%) |
| Public Administration | 26 (56.5%) | 20 (43.5%) |
| Total | 147 (46.8%) | 167 (53.2%) |
Education in Owaneco
School Enrollment in Owaneco
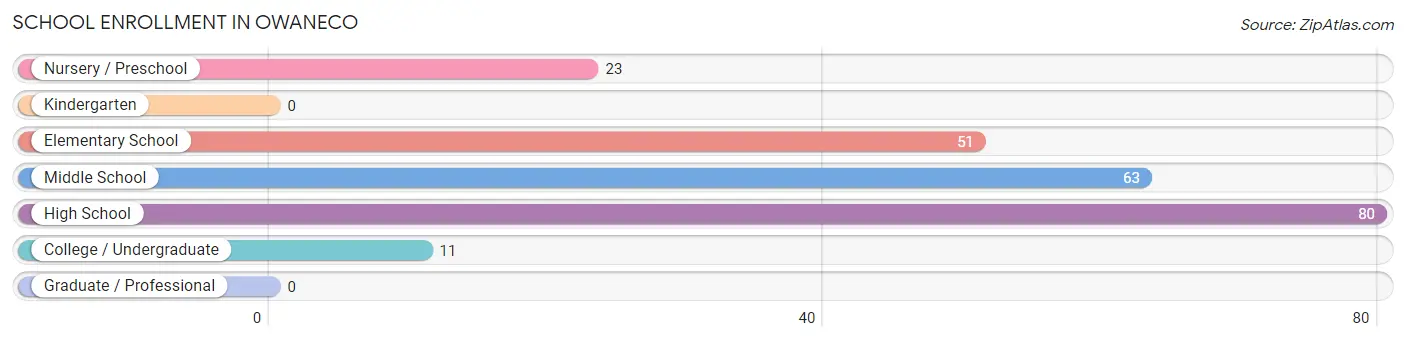
The most common levels of schooling among the 228 students in Owaneco are high school (80 | 35.1%), middle school (63 | 27.6%), and elementary school (51 | 22.4%).
| School Level | # Students | % Students |
| Nursery / Preschool | 23 | 10.1% |
| Kindergarten | 0 | 0.0% |
| Elementary School | 51 | 22.4% |
| Middle School | 63 | 27.6% |
| High School | 80 | 35.1% |
| College / Undergraduate | 11 | 4.8% |
| Graduate / Professional | 0 | 0.0% |
| Total | 228 | 100.0% |
School Enrollment by Age by Funding Source in Owaneco
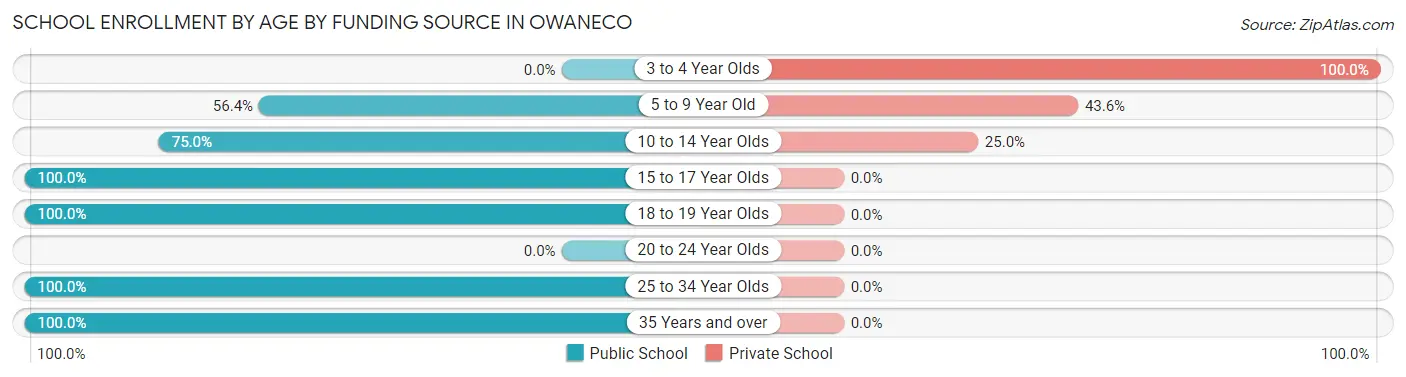
Out of a total of 228 students who are enrolled in schools in Owaneco, 60 (26.3%) attend a private institution, while the remaining 168 (73.7%) are enrolled in public schools. The age group of 3 to 4 year olds has the highest likelihood of being enrolled in private schools, with 19 (100.0% in the age bracket) enrolled. Conversely, the age group of 15 to 17 year olds has the lowest likelihood of being enrolled in a private school, with 14 (100.0% in the age bracket) attending a public institution.
| Age Bracket | Public School | Private School |
| 3 to 4 Year Olds | 0 (0.0%) | 19 (100.0%) |
| 5 to 9 Year Old | 31 (56.4%) | 24 (43.6%) |
| 10 to 14 Year Olds | 51 (75.0%) | 17 (25.0%) |
| 15 to 17 Year Olds | 14 (100.0%) | 0 (0.0%) |
| 18 to 19 Year Olds | 61 (100.0%) | 0 (0.0%) |
| 20 to 24 Year Olds | 0 (0.0%) | 0 (0.0%) |
| 25 to 34 Year Olds | 3 (100.0%) | 0 (0.0%) |
| 35 Years and over | 8 (100.0%) | 0 (0.0%) |
| Total | 168 (73.7%) | 60 (26.3%) |
Educational Attainment by Field of Study in Owaneco
Liberal arts & history (15 | 40.5%), visual & performing arts (9 | 24.3%), science & technology (5 | 13.5%), computers & mathematics (3 | 8.1%), and business (3 | 8.1%) are the most common fields of study among 37 individuals in Owaneco who have obtained a bachelor's degree or higher.
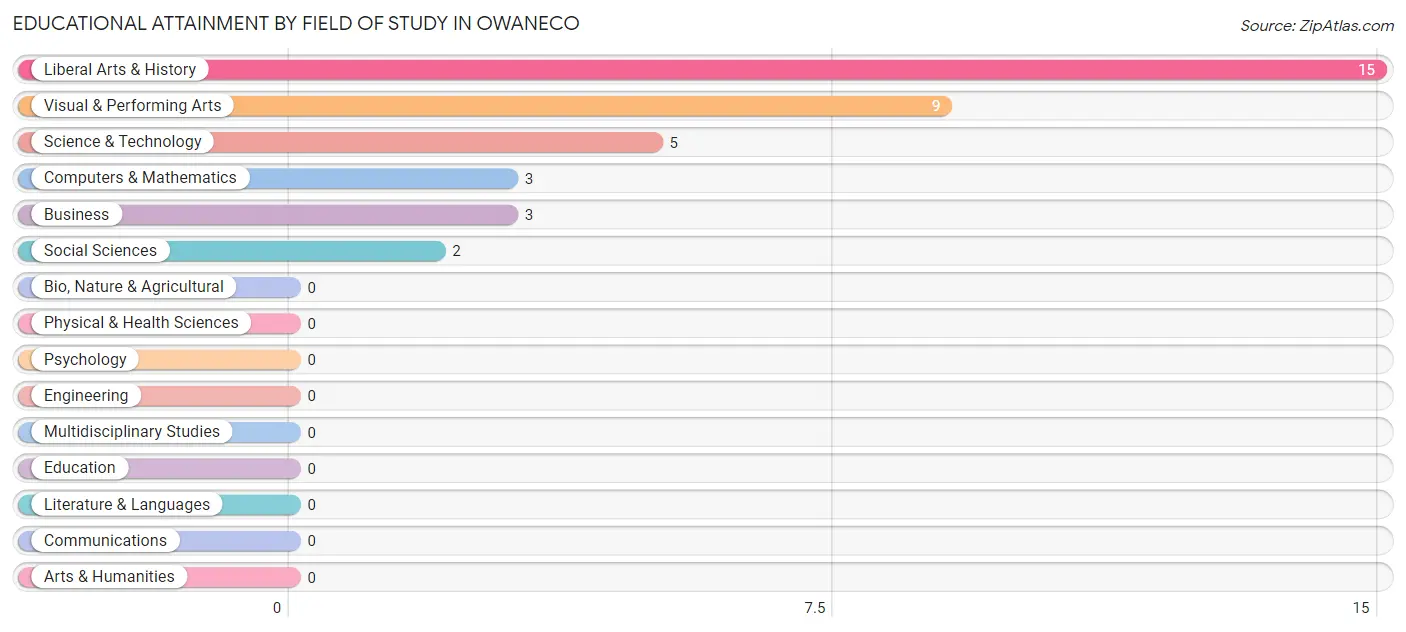
| Field of Study | # Graduates | % Graduates |
| Computers & Mathematics | 3 | 8.1% |
| Bio, Nature & Agricultural | 0 | 0.0% |
| Physical & Health Sciences | 0 | 0.0% |
| Psychology | 0 | 0.0% |
| Social Sciences | 2 | 5.4% |
| Engineering | 0 | 0.0% |
| Multidisciplinary Studies | 0 | 0.0% |
| Science & Technology | 5 | 13.5% |
| Business | 3 | 8.1% |
| Education | 0 | 0.0% |
| Literature & Languages | 0 | 0.0% |
| Liberal Arts & History | 15 | 40.5% |
| Visual & Performing Arts | 9 | 24.3% |
| Communications | 0 | 0.0% |
| Arts & Humanities | 0 | 0.0% |
| Total | 37 | 100.0% |
Transportation & Commute in Owaneco
Vehicle Availability by Sex in Owaneco
The most prevalent vehicle ownership categories in Owaneco are males with 3 vehicles (60, accounting for 43.2%) and females with 3 vehicles (48, making up 35.9%).
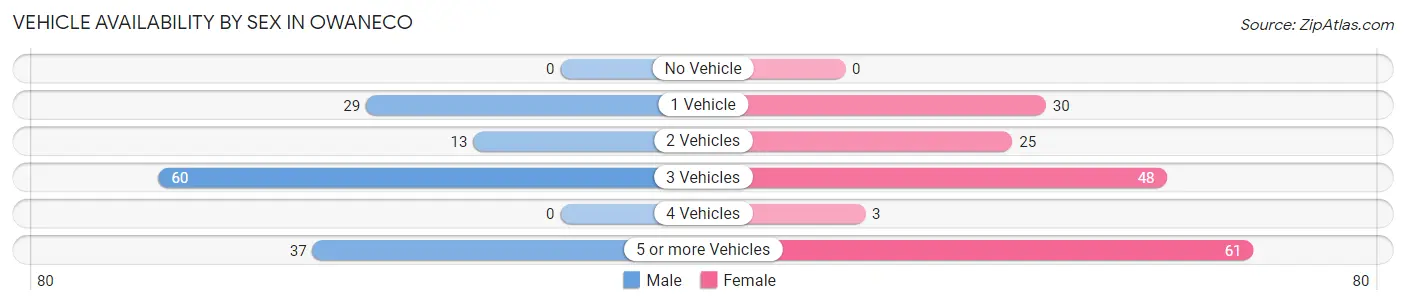
| Vehicles Available | Male | Female |
| No Vehicle | 0 (0.0%) | 0 (0.0%) |
| 1 Vehicle | 29 (20.9%) | 30 (18.0%) |
| 2 Vehicles | 13 (9.3%) | 25 (15.0%) |
| 3 Vehicles | 60 (43.2%) | 48 (28.7%) |
| 4 Vehicles | 0 (0.0%) | 3 (1.8%) |
| 5 or more Vehicles | 37 (26.6%) | 61 (36.5%) |
| Total | 139 (100.0%) | 167 (100.0%) |
Commute Time in Owaneco
The most frequently occuring commute durations in Owaneco are 45 to 59 minutes (111 commuters, 38.1%), 30 to 34 minutes (51 commuters, 17.5%), and 60 to 89 minutes (34 commuters, 11.7%).
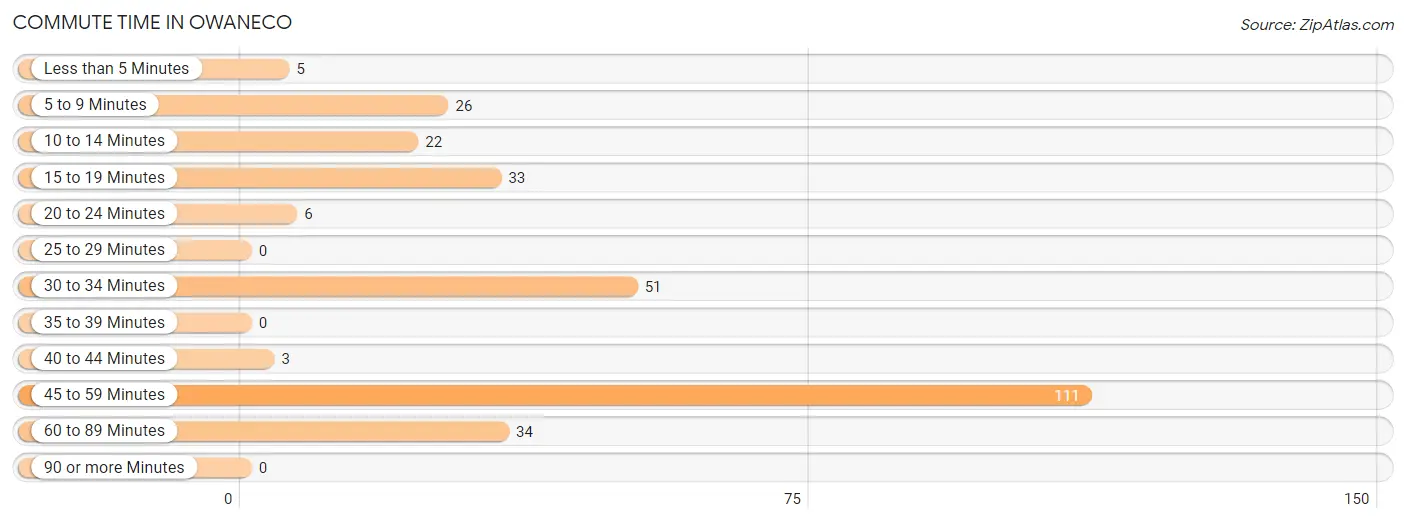
| Commute Time | # Commuters | % Commuters |
| Less than 5 Minutes | 5 | 1.7% |
| 5 to 9 Minutes | 26 | 8.9% |
| 10 to 14 Minutes | 22 | 7.6% |
| 15 to 19 Minutes | 33 | 11.3% |
| 20 to 24 Minutes | 6 | 2.1% |
| 25 to 29 Minutes | 0 | 0.0% |
| 30 to 34 Minutes | 51 | 17.5% |
| 35 to 39 Minutes | 0 | 0.0% |
| 40 to 44 Minutes | 3 | 1.0% |
| 45 to 59 Minutes | 111 | 38.1% |
| 60 to 89 Minutes | 34 | 11.7% |
| 90 or more Minutes | 0 | 0.0% |
Commute Time by Sex in Owaneco
The most common commute times in Owaneco are 45 to 59 minutes (67 commuters, 51.9%) for males and 30 to 34 minutes (51 commuters, 31.5%) for females.
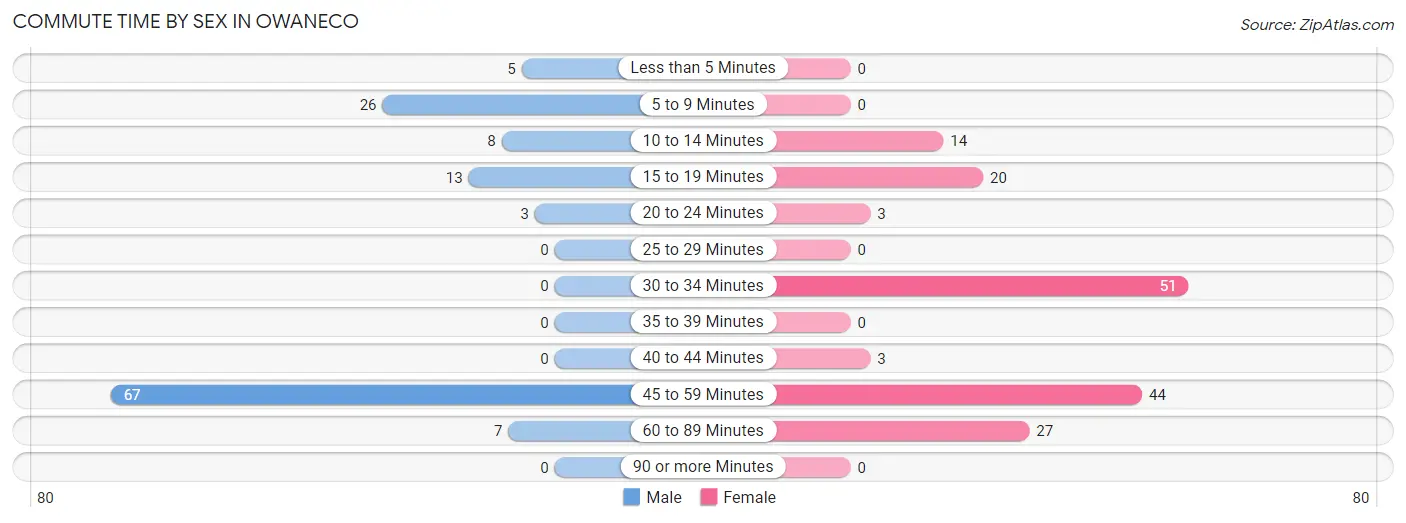
| Commute Time | Male | Female |
| Less than 5 Minutes | 5 (3.9%) | 0 (0.0%) |
| 5 to 9 Minutes | 26 (20.2%) | 0 (0.0%) |
| 10 to 14 Minutes | 8 (6.2%) | 14 (8.6%) |
| 15 to 19 Minutes | 13 (10.1%) | 20 (12.3%) |
| 20 to 24 Minutes | 3 (2.3%) | 3 (1.8%) |
| 25 to 29 Minutes | 0 (0.0%) | 0 (0.0%) |
| 30 to 34 Minutes | 0 (0.0%) | 51 (31.5%) |
| 35 to 39 Minutes | 0 (0.0%) | 0 (0.0%) |
| 40 to 44 Minutes | 0 (0.0%) | 3 (1.8%) |
| 45 to 59 Minutes | 67 (51.9%) | 44 (27.2%) |
| 60 to 89 Minutes | 7 (5.4%) | 27 (16.7%) |
| 90 or more Minutes | 0 (0.0%) | 0 (0.0%) |
Time of Departure to Work by Sex in Owaneco
The most frequent times of departure to work in Owaneco are 6:00 AM to 6:29 AM (44, 34.1%) for males and 6:30 AM to 6:59 AM (42, 25.9%) for females.
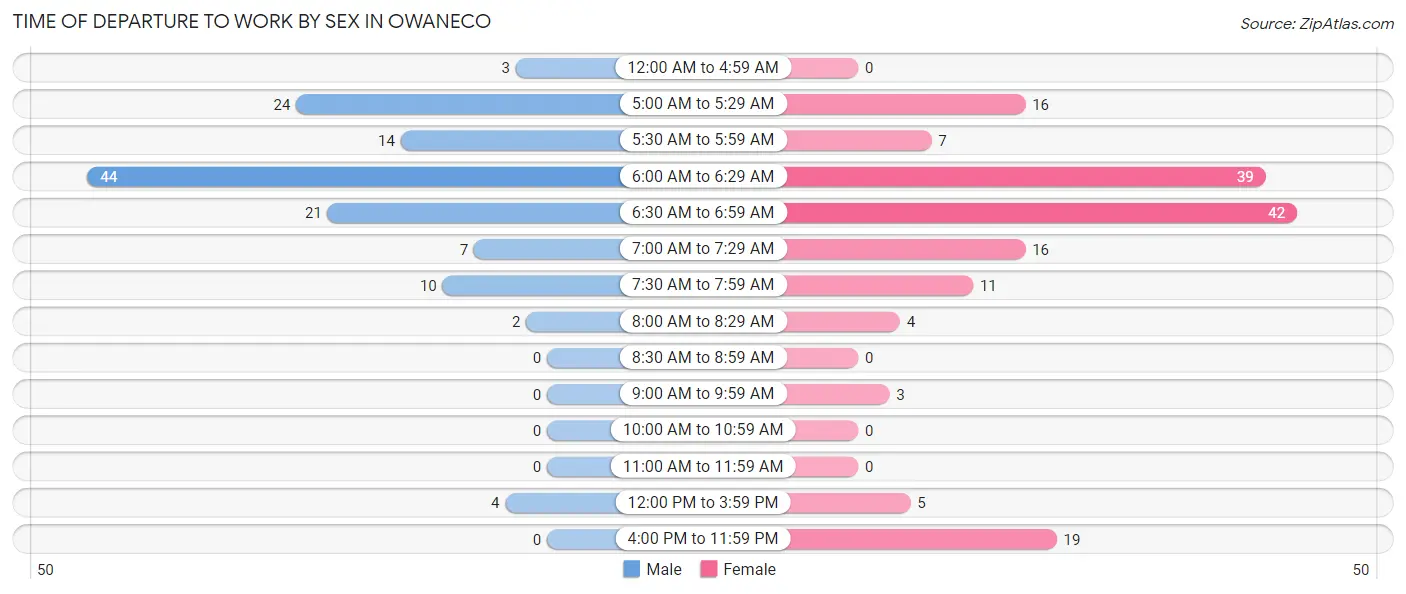
| Time of Departure | Male | Female |
| 12:00 AM to 4:59 AM | 3 (2.3%) | 0 (0.0%) |
| 5:00 AM to 5:29 AM | 24 (18.6%) | 16 (9.9%) |
| 5:30 AM to 5:59 AM | 14 (10.8%) | 7 (4.3%) |
| 6:00 AM to 6:29 AM | 44 (34.1%) | 39 (24.1%) |
| 6:30 AM to 6:59 AM | 21 (16.3%) | 42 (25.9%) |
| 7:00 AM to 7:29 AM | 7 (5.4%) | 16 (9.9%) |
| 7:30 AM to 7:59 AM | 10 (7.7%) | 11 (6.8%) |
| 8:00 AM to 8:29 AM | 2 (1.5%) | 4 (2.5%) |
| 8:30 AM to 8:59 AM | 0 (0.0%) | 0 (0.0%) |
| 9:00 AM to 9:59 AM | 0 (0.0%) | 3 (1.8%) |
| 10:00 AM to 10:59 AM | 0 (0.0%) | 0 (0.0%) |
| 11:00 AM to 11:59 AM | 0 (0.0%) | 0 (0.0%) |
| 12:00 PM to 3:59 PM | 4 (3.1%) | 5 (3.1%) |
| 4:00 PM to 11:59 PM | 0 (0.0%) | 19 (11.7%) |
| Total | 129 (100.0%) | 162 (100.0%) |
Housing Occupancy in Owaneco
Occupancy by Ownership in Owaneco
Of the total 204 dwellings in Owaneco, owner-occupied units account for 168 (82.4%), while renter-occupied units make up 36 (17.6%).
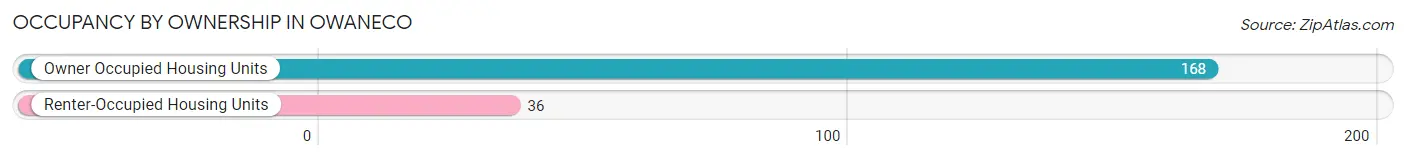
| Occupancy | # Housing Units | % Housing Units |
| Owner Occupied Housing Units | 168 | 82.4% |
| Renter-Occupied Housing Units | 36 | 17.6% |
| Total Occupied Housing Units | 204 | 100.0% |
Occupancy by Household Size in Owaneco
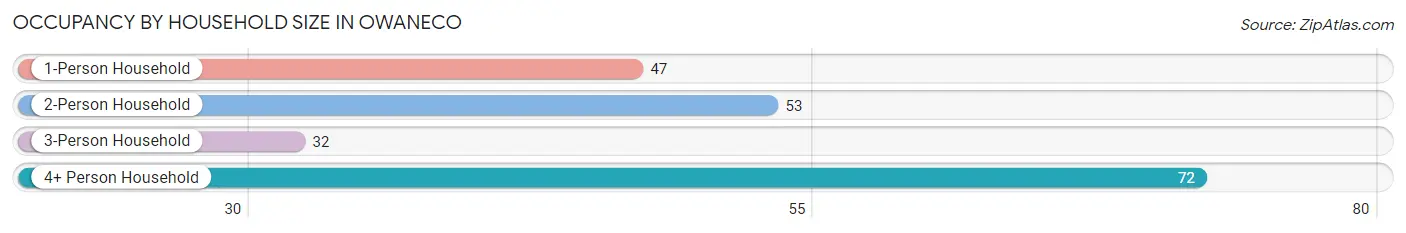
| Household Size | # Housing Units | % Housing Units |
| 1-Person Household | 47 | 23.0% |
| 2-Person Household | 53 | 26.0% |
| 3-Person Household | 32 | 15.7% |
| 4+ Person Household | 72 | 35.3% |
| Total Housing Units | 204 | 100.0% |
Occupancy by Ownership by Household Size in Owaneco
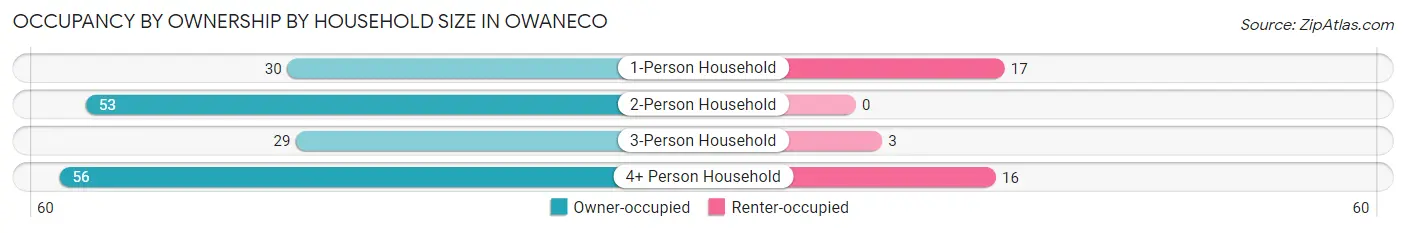
| Household Size | Owner-occupied | Renter-occupied |
| 1-Person Household | 30 (63.8%) | 17 (36.2%) |
| 2-Person Household | 53 (100.0%) | 0 (0.0%) |
| 3-Person Household | 29 (90.6%) | 3 (9.4%) |
| 4+ Person Household | 56 (77.8%) | 16 (22.2%) |
| Total Housing Units | 168 (82.4%) | 36 (17.6%) |
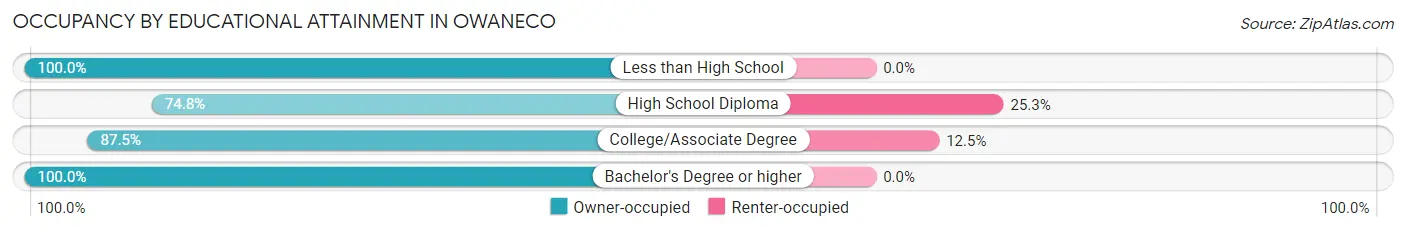
Occupancy by Educational Attainment in Owaneco
| Household Size | Owner-occupied | Renter-occupied |
| Less than High School | 3 (100.0%) | 0 (0.0%) |
| High School Diploma | 74 (74.8%) | 25 (25.3%) |
| College/Associate Degree | 77 (87.5%) | 11 (12.5%) |
| Bachelor's Degree or higher | 14 (100.0%) | 0 (0.0%) |
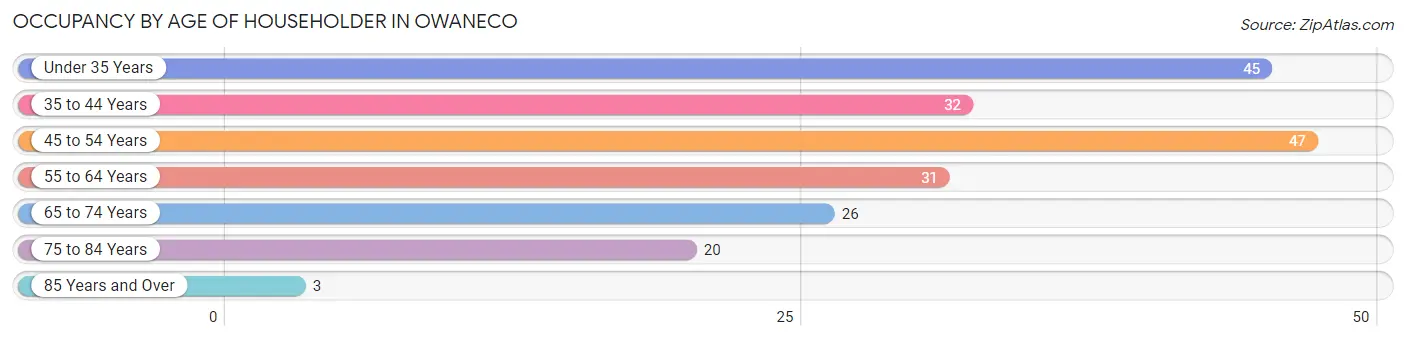
Occupancy by Age of Householder in Owaneco
| Age Bracket | # Households | % Households |
| Under 35 Years | 45 | 22.1% |
| 35 to 44 Years | 32 | 15.7% |
| 45 to 54 Years | 47 | 23.0% |
| 55 to 64 Years | 31 | 15.2% |
| 65 to 74 Years | 26 | 12.8% |
| 75 to 84 Years | 20 | 9.8% |
| 85 Years and Over | 3 | 1.5% |
| Total | 204 | 100.0% |
Housing Finances in Owaneco
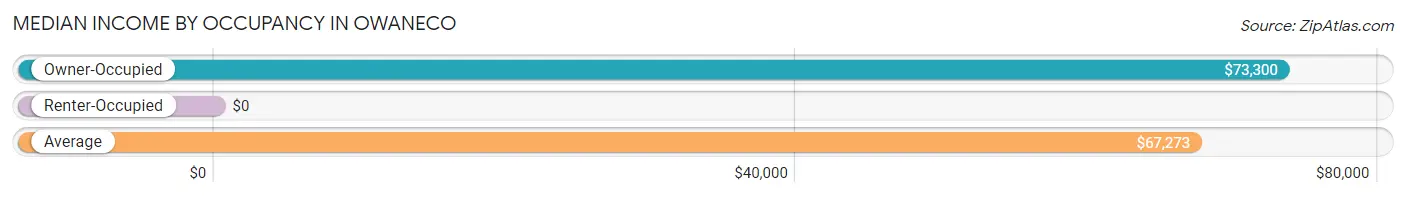
Median Income by Occupancy in Owaneco
| Occupancy Type | # Households | Median Income |
| Owner-Occupied | 168 (82.4%) | $73,300 |
| Renter-Occupied | 36 (17.6%) | $0 |
| Average | 204 (100.0%) | $67,273 |
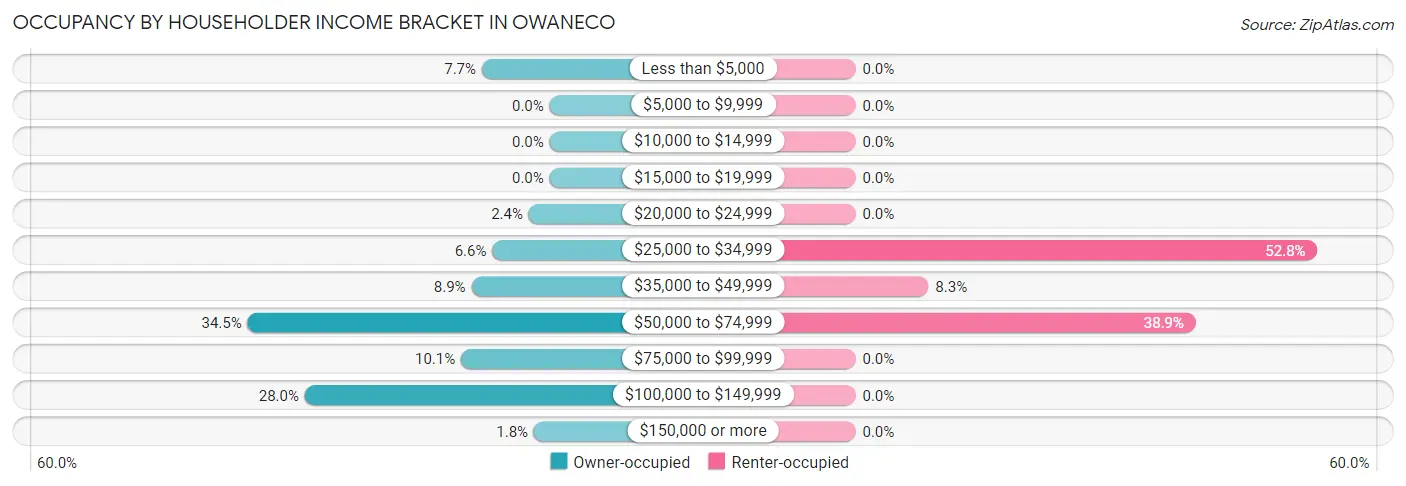
Occupancy by Householder Income Bracket in Owaneco
| Income Bracket | Owner-occupied | Renter-occupied |
| Less than $5,000 | 13 (7.7%) | 0 (0.0%) |
| $5,000 to $9,999 | 0 (0.0%) | 0 (0.0%) |
| $10,000 to $14,999 | 0 (0.0%) | 0 (0.0%) |
| $15,000 to $19,999 | 0 (0.0%) | 0 (0.0%) |
| $20,000 to $24,999 | 4 (2.4%) | 0 (0.0%) |
| $25,000 to $34,999 | 11 (6.6%) | 19 (52.8%) |
| $35,000 to $49,999 | 15 (8.9%) | 3 (8.3%) |
| $50,000 to $74,999 | 58 (34.5%) | 14 (38.9%) |
| $75,000 to $99,999 | 17 (10.1%) | 0 (0.0%) |
| $100,000 to $149,999 | 47 (28.0%) | 0 (0.0%) |
| $150,000 or more | 3 (1.8%) | 0 (0.0%) |
| Total | 168 (100.0%) | 36 (100.0%) |
Monthly Housing Cost Tiers in Owaneco
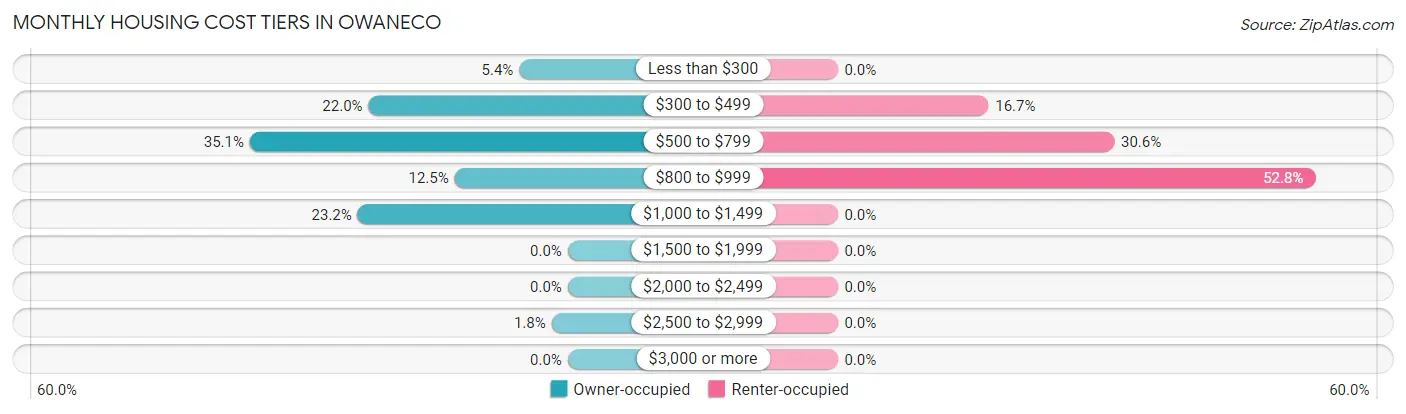
| Monthly Cost | Owner-occupied | Renter-occupied |
| Less than $300 | 9 (5.4%) | 0 (0.0%) |
| $300 to $499 | 37 (22.0%) | 6 (16.7%) |
| $500 to $799 | 59 (35.1%) | 11 (30.6%) |
| $800 to $999 | 21 (12.5%) | 19 (52.8%) |
| $1,000 to $1,499 | 39 (23.2%) | 0 (0.0%) |
| $1,500 to $1,999 | 0 (0.0%) | 0 (0.0%) |
| $2,000 to $2,499 | 0 (0.0%) | 0 (0.0%) |
| $2,500 to $2,999 | 3 (1.8%) | 0 (0.0%) |
| $3,000 or more | 0 (0.0%) | 0 (0.0%) |
| Total | 168 (100.0%) | 36 (100.0%) |
Physical Housing Characteristics in Owaneco
Housing Structures in Owaneco
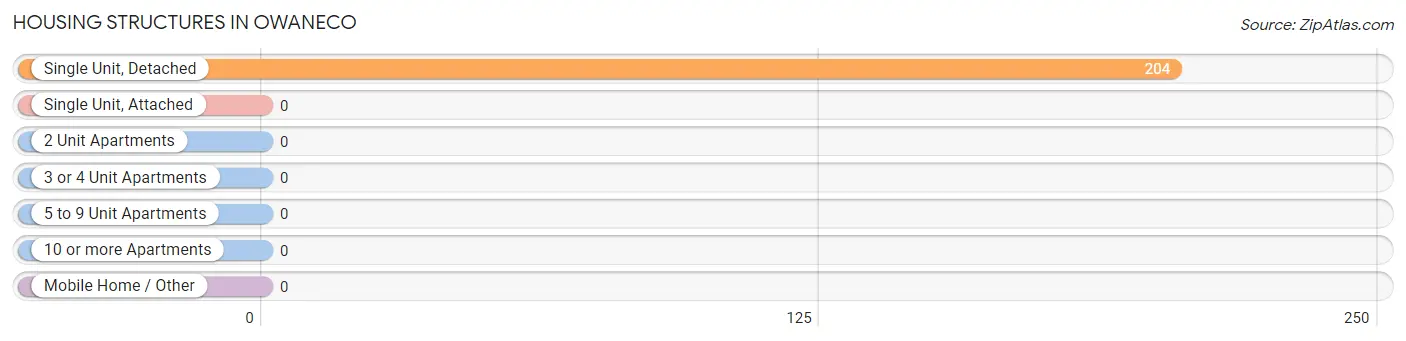
| Structure Type | # Housing Units | % Housing Units |
| Single Unit, Detached | 204 | 100.0% |
| Single Unit, Attached | 0 | 0.0% |
| 2 Unit Apartments | 0 | 0.0% |
| 3 or 4 Unit Apartments | 0 | 0.0% |
| 5 to 9 Unit Apartments | 0 | 0.0% |
| 10 or more Apartments | 0 | 0.0% |
| Mobile Home / Other | 0 | 0.0% |
| Total | 204 | 100.0% |
Housing Structures by Occupancy in Owaneco
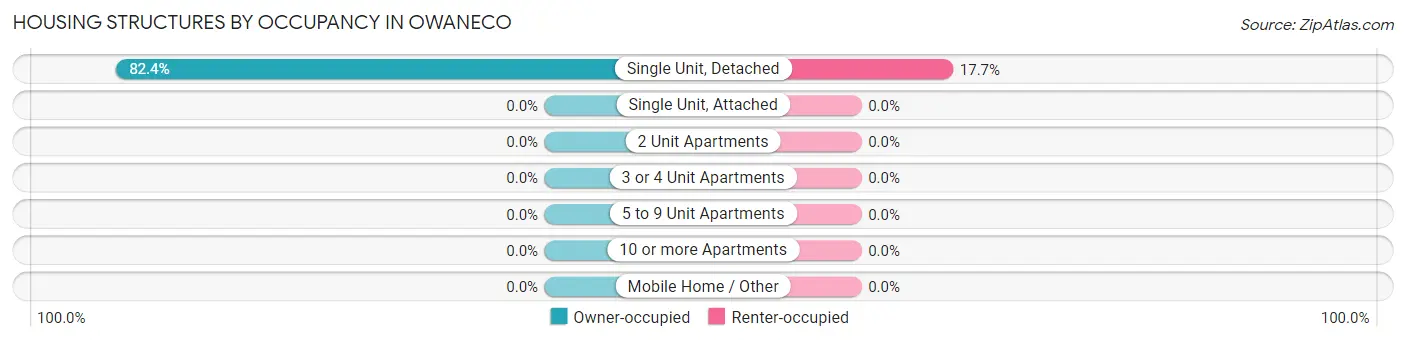
| Structure Type | Owner-occupied | Renter-occupied |
| Single Unit, Detached | 168 (82.4%) | 36 (17.6%) |
| Single Unit, Attached | 0 (0.0%) | 0 (0.0%) |
| 2 Unit Apartments | 0 (0.0%) | 0 (0.0%) |
| 3 or 4 Unit Apartments | 0 (0.0%) | 0 (0.0%) |
| 5 to 9 Unit Apartments | 0 (0.0%) | 0 (0.0%) |
| 10 or more Apartments | 0 (0.0%) | 0 (0.0%) |
| Mobile Home / Other | 0 (0.0%) | 0 (0.0%) |
| Total | 168 (82.4%) | 36 (17.6%) |
Housing Structures by Number of Rooms in Owaneco
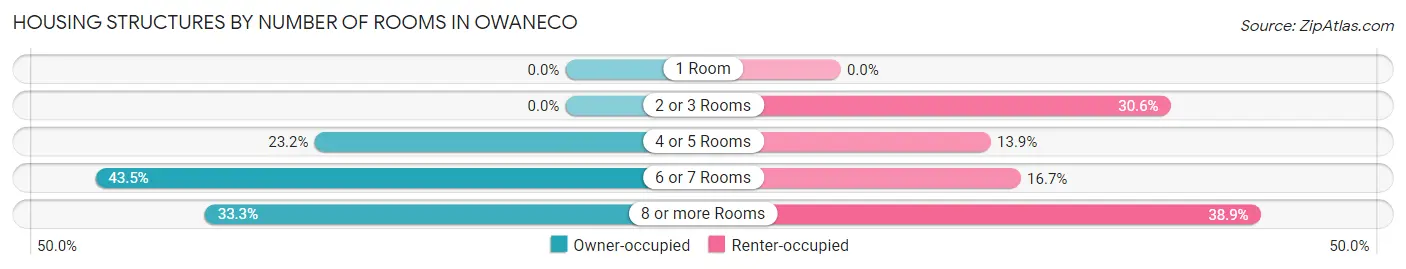
| Number of Rooms | Owner-occupied | Renter-occupied |
| 1 Room | 0 (0.0%) | 0 (0.0%) |
| 2 or 3 Rooms | 0 (0.0%) | 11 (30.6%) |
| 4 or 5 Rooms | 39 (23.2%) | 5 (13.9%) |
| 6 or 7 Rooms | 73 (43.4%) | 6 (16.7%) |
| 8 or more Rooms | 56 (33.3%) | 14 (38.9%) |
| Total | 168 (100.0%) | 36 (100.0%) |
Housing Structure by Heating Type in Owaneco
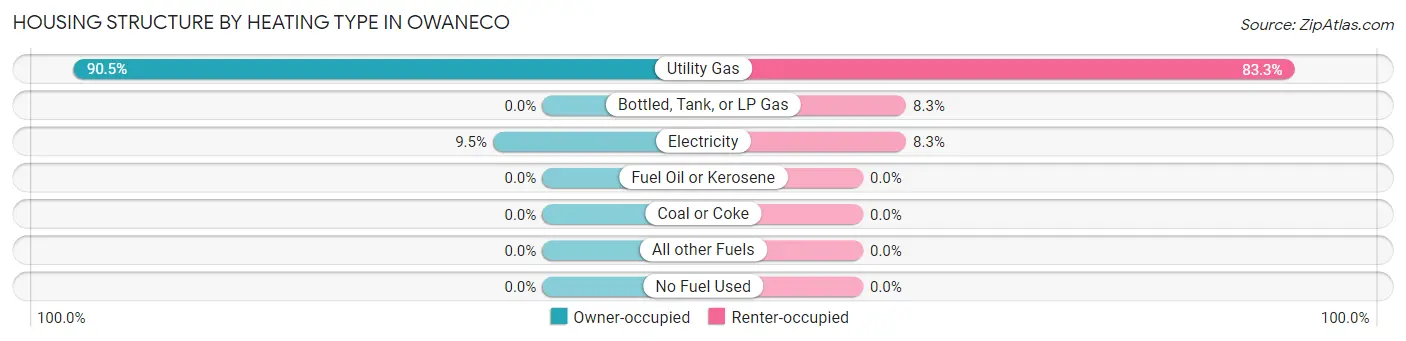
| Heating Type | Owner-occupied | Renter-occupied |
| Utility Gas | 152 (90.5%) | 30 (83.3%) |
| Bottled, Tank, or LP Gas | 0 (0.0%) | 3 (8.3%) |
| Electricity | 16 (9.5%) | 3 (8.3%) |
| Fuel Oil or Kerosene | 0 (0.0%) | 0 (0.0%) |
| Coal or Coke | 0 (0.0%) | 0 (0.0%) |
| All other Fuels | 0 (0.0%) | 0 (0.0%) |
| No Fuel Used | 0 (0.0%) | 0 (0.0%) |
| Total | 168 (100.0%) | 36 (100.0%) |
Household Vehicle Usage in Owaneco
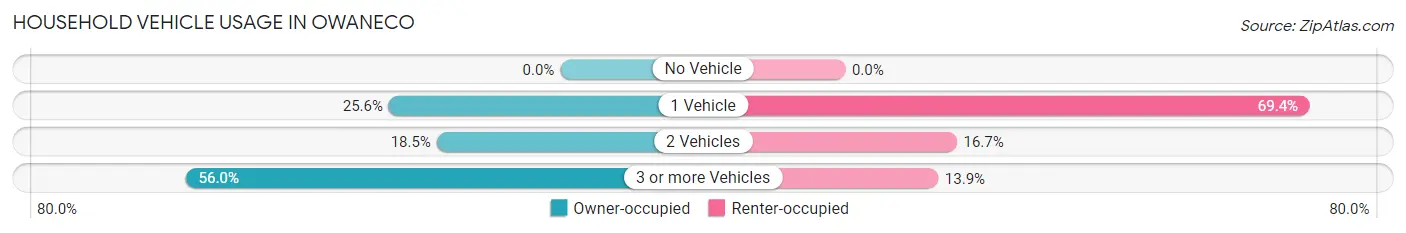
| Vehicles per Household | Owner-occupied | Renter-occupied |
| No Vehicle | 0 (0.0%) | 0 (0.0%) |
| 1 Vehicle | 43 (25.6%) | 25 (69.4%) |
| 2 Vehicles | 31 (18.4%) | 6 (16.7%) |
| 3 or more Vehicles | 94 (55.9%) | 5 (13.9%) |
| Total | 168 (100.0%) | 36 (100.0%) |
Real Estate & Mortgages in Owaneco
Real Estate and Mortgage Overview in Owaneco
| Characteristic | Without Mortgage | With Mortgage |
| Housing Units | 63 | 105 |
| Median Property Value | $95,900 | $81,600 |
| Median Household Income | $70,208 | $0 |
| Monthly Housing Costs | $437 | $0 |
| Real Estate Taxes | $1,477 | $0 |
Property Value by Mortgage Status in Owaneco
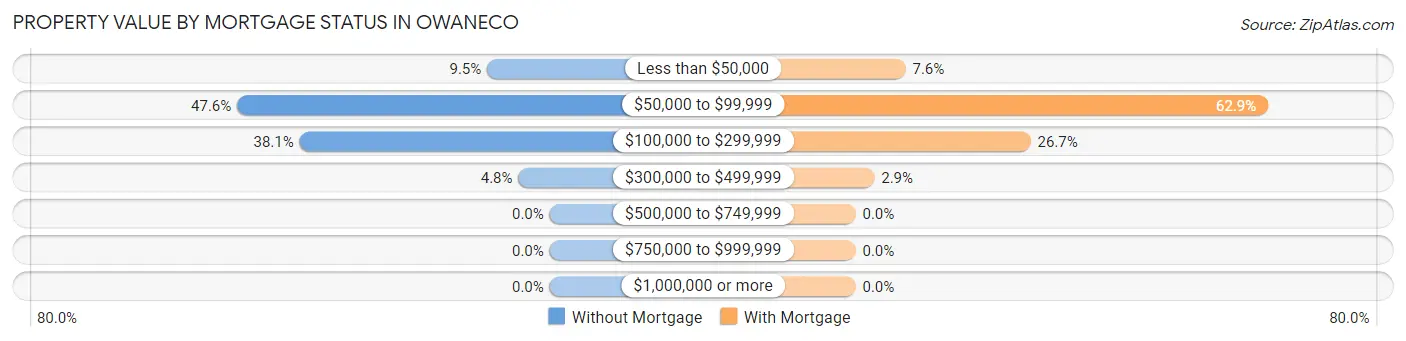
| Property Value | Without Mortgage | With Mortgage |
| Less than $50,000 | 6 (9.5%) | 8 (7.6%) |
| $50,000 to $99,999 | 30 (47.6%) | 66 (62.9%) |
| $100,000 to $299,999 | 24 (38.1%) | 28 (26.7%) |
| $300,000 to $499,999 | 3 (4.8%) | 3 (2.9%) |
| $500,000 to $749,999 | 0 (0.0%) | 0 (0.0%) |
| $750,000 to $999,999 | 0 (0.0%) | 0 (0.0%) |
| $1,000,000 or more | 0 (0.0%) | 0 (0.0%) |
| Total | 63 (100.0%) | 105 (100.0%) |
Household Income by Mortgage Status in Owaneco
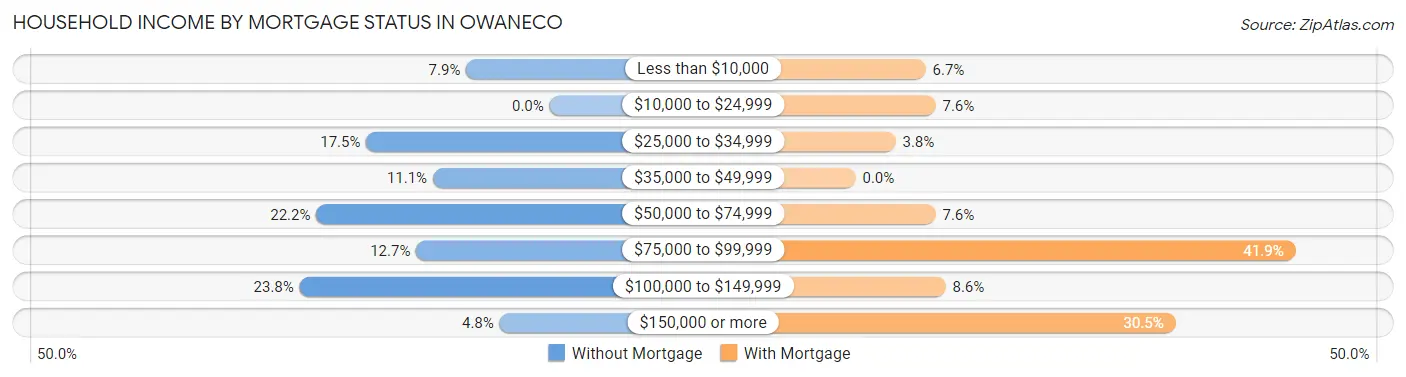
| Household Income | Without Mortgage | With Mortgage |
| Less than $10,000 | 5 (7.9%) | 7 (6.7%) |
| $10,000 to $24,999 | 0 (0.0%) | 8 (7.6%) |
| $25,000 to $34,999 | 11 (17.5%) | 4 (3.8%) |
| $35,000 to $49,999 | 7 (11.1%) | 0 (0.0%) |
| $50,000 to $74,999 | 14 (22.2%) | 8 (7.6%) |
| $75,000 to $99,999 | 8 (12.7%) | 44 (41.9%) |
| $100,000 to $149,999 | 15 (23.8%) | 9 (8.6%) |
| $150,000 or more | 3 (4.8%) | 32 (30.5%) |
| Total | 63 (100.0%) | 105 (100.0%) |
Property Value to Household Income Ratio in Owaneco
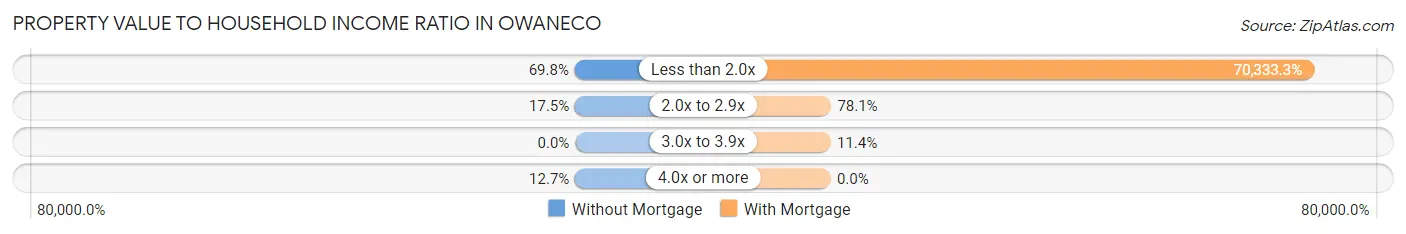
| Value-to-Income Ratio | Without Mortgage | With Mortgage |
| Less than 2.0x | 44 (69.8%) | 73,850 (70,333.3%) |
| 2.0x to 2.9x | 11 (17.5%) | 82 (78.1%) |
| 3.0x to 3.9x | 0 (0.0%) | 12 (11.4%) |
| 4.0x or more | 8 (12.7%) | 0 (0.0%) |
| Total | 63 (100.0%) | 105 (100.0%) |
Real Estate Taxes by Mortgage Status in Owaneco
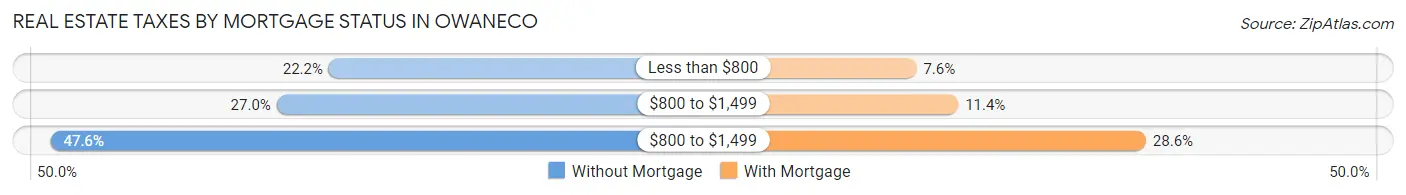
| Property Taxes | Without Mortgage | With Mortgage |
| Less than $800 | 14 (22.2%) | 8 (7.6%) |
| $800 to $1,499 | 17 (27.0%) | 12 (11.4%) |
| $800 to $1,499 | 30 (47.6%) | 30 (28.6%) |
| Total | 63 (100.0%) | 105 (100.0%) |
Health & Disability in Owaneco
Health Insurance Coverage by Age in Owaneco
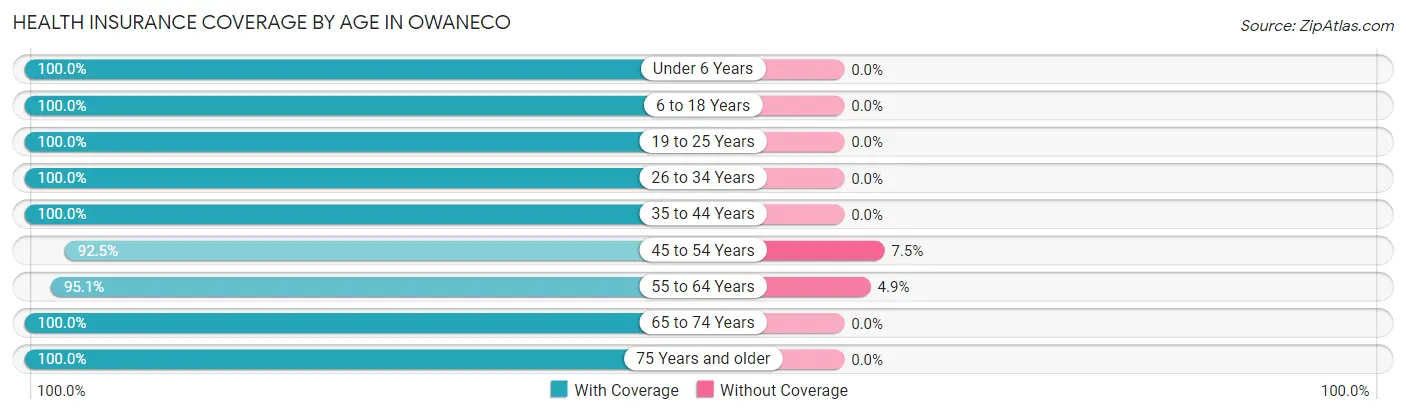
| Age Bracket | With Coverage | Without Coverage |
| Under 6 Years | 36 (100.0%) | 0 (0.0%) |
| 6 to 18 Years | 207 (100.0%) | 0 (0.0%) |
| 19 to 25 Years | 57 (100.0%) | 0 (0.0%) |
| 26 to 34 Years | 101 (100.0%) | 0 (0.0%) |
| 35 to 44 Years | 117 (100.0%) | 0 (0.0%) |
| 45 to 54 Years | 74 (92.5%) | 6 (7.5%) |
| 55 to 64 Years | 58 (95.1%) | 3 (4.9%) |
| 65 to 74 Years | 44 (100.0%) | 0 (0.0%) |
| 75 Years and older | 55 (100.0%) | 0 (0.0%) |
| Total | 749 (98.8%) | 9 (1.2%) |
Health Insurance Coverage by Citizenship Status in Owaneco
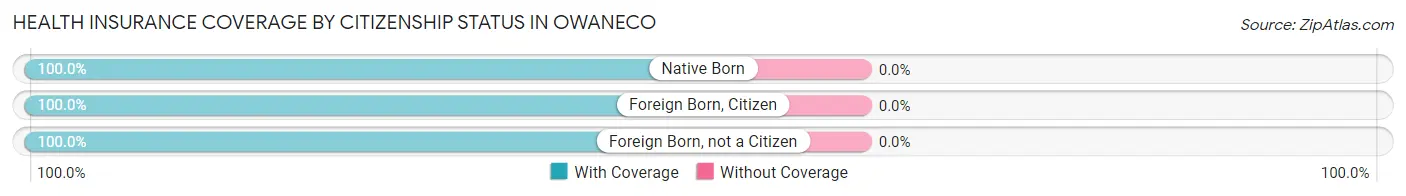
| Citizenship Status | With Coverage | Without Coverage |
| Native Born | 36 (100.0%) | 0 (0.0%) |
| Foreign Born, Citizen | 207 (100.0%) | 0 (0.0%) |
| Foreign Born, not a Citizen | 57 (100.0%) | 0 (0.0%) |
Health Insurance Coverage by Household Income in Owaneco
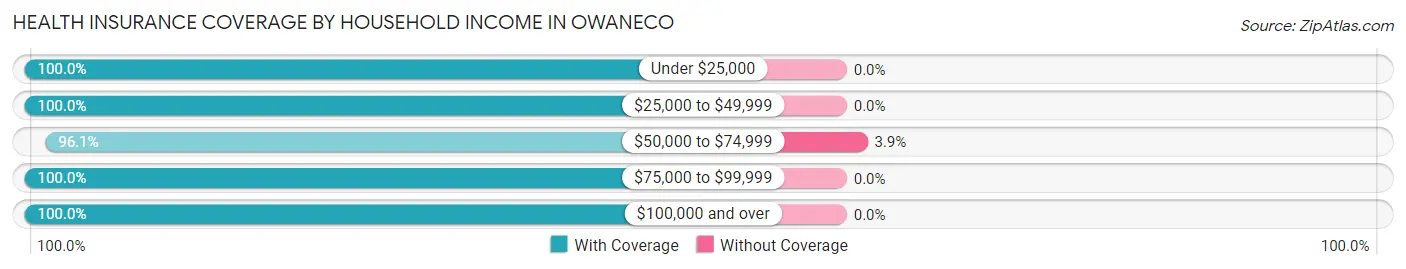
| Household Income | With Coverage | Without Coverage |
| Under $25,000 | 26 (100.0%) | 0 (0.0%) |
| $25,000 to $49,999 | 169 (100.0%) | 0 (0.0%) |
| $50,000 to $74,999 | 223 (96.1%) | 9 (3.9%) |
| $75,000 to $99,999 | 55 (100.0%) | 0 (0.0%) |
| $100,000 and over | 276 (100.0%) | 0 (0.0%) |
Public vs Private Health Insurance Coverage by Age in Owaneco
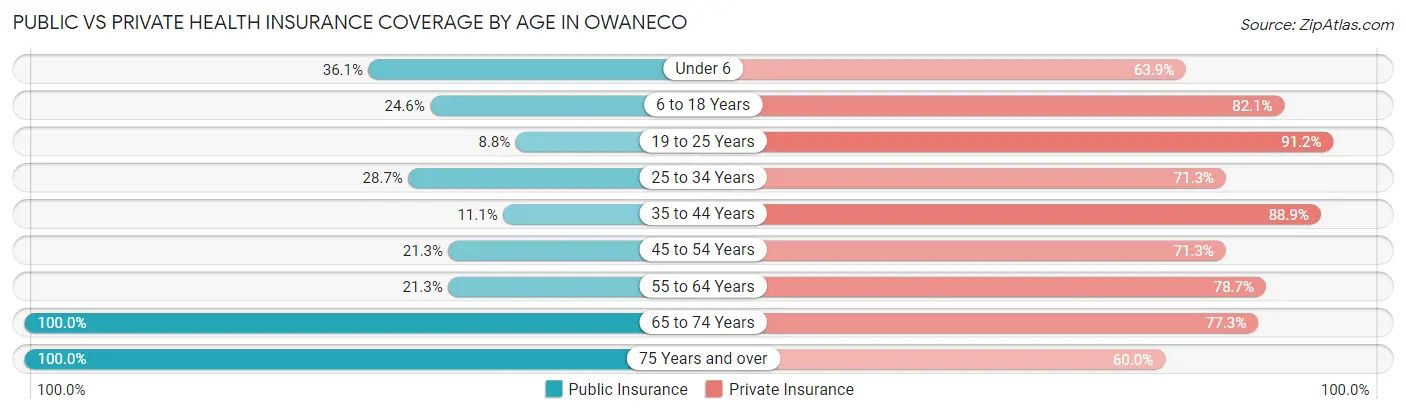
| Age Bracket | Public Insurance | Private Insurance |
| Under 6 | 13 (36.1%) | 23 (63.9%) |
| 6 to 18 Years | 51 (24.6%) | 170 (82.1%) |
| 19 to 25 Years | 5 (8.8%) | 52 (91.2%) |
| 25 to 34 Years | 29 (28.7%) | 72 (71.3%) |
| 35 to 44 Years | 13 (11.1%) | 104 (88.9%) |
| 45 to 54 Years | 17 (21.2%) | 57 (71.3%) |
| 55 to 64 Years | 13 (21.3%) | 48 (78.7%) |
| 65 to 74 Years | 44 (100.0%) | 34 (77.3%) |
| 75 Years and over | 55 (100.0%) | 33 (60.0%) |
| Total | 240 (31.7%) | 593 (78.2%) |
Disability Status by Sex by Age in Owaneco
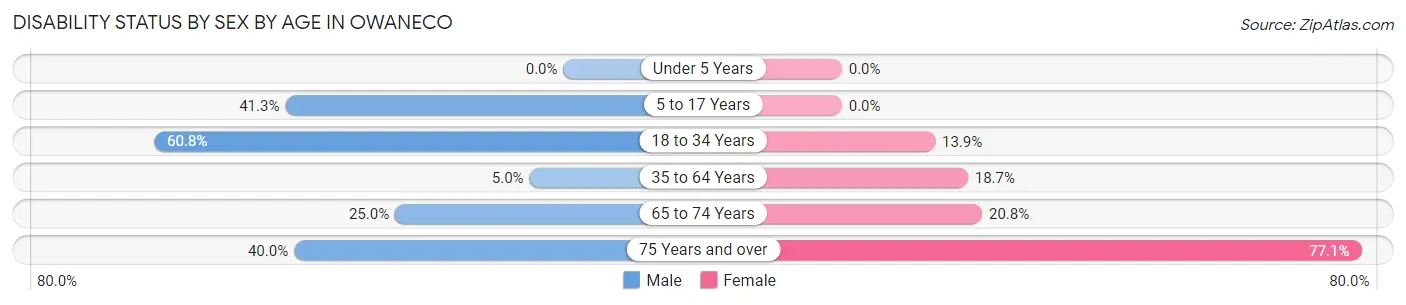
| Age Bracket | Male | Female |
| Under 5 Years | 0 (0.0%) | 0 (0.0%) |
| 5 to 17 Years | 19 (41.3%) | 0 (0.0%) |
| 18 to 34 Years | 62 (60.8%) | 18 (13.9%) |
| 35 to 64 Years | 6 (5.0%) | 26 (18.7%) |
| 65 to 74 Years | 5 (25.0%) | 5 (20.8%) |
| 75 Years and over | 8 (40.0%) | 27 (77.1%) |
Disability Class by Sex by Age in Owaneco
Disability Class: Hearing Difficulty
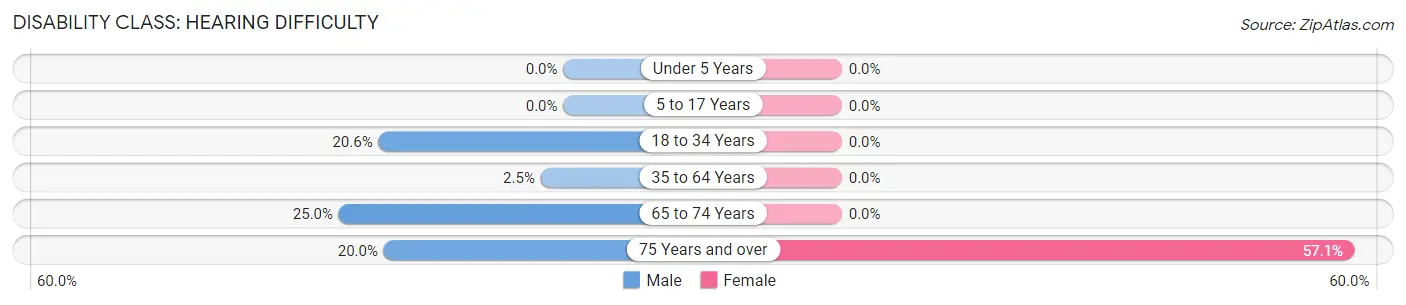
| Age Bracket | Male | Female |
| Under 5 Years | 0 (0.0%) | 0 (0.0%) |
| 5 to 17 Years | 0 (0.0%) | 0 (0.0%) |
| 18 to 34 Years | 21 (20.6%) | 0 (0.0%) |
| 35 to 64 Years | 3 (2.5%) | 0 (0.0%) |
| 65 to 74 Years | 5 (25.0%) | 0 (0.0%) |
| 75 Years and over | 4 (20.0%) | 20 (57.1%) |
Disability Class: Vision Difficulty
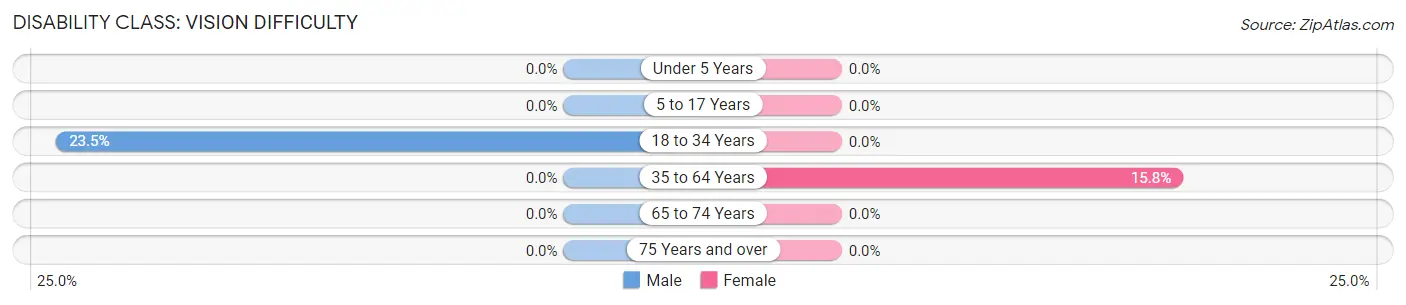
| Age Bracket | Male | Female |
| Under 5 Years | 0 (0.0%) | 0 (0.0%) |
| 5 to 17 Years | 0 (0.0%) | 0 (0.0%) |
| 18 to 34 Years | 24 (23.5%) | 0 (0.0%) |
| 35 to 64 Years | 0 (0.0%) | 22 (15.8%) |
| 65 to 74 Years | 0 (0.0%) | 0 (0.0%) |
| 75 Years and over | 0 (0.0%) | 0 (0.0%) |
Disability Class: Cognitive Difficulty
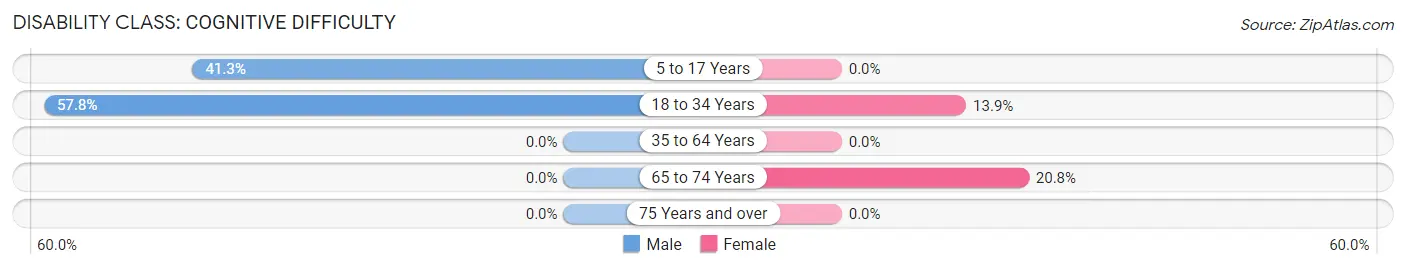
| Age Bracket | Male | Female |
| 5 to 17 Years | 19 (41.3%) | 0 (0.0%) |
| 18 to 34 Years | 59 (57.8%) | 18 (13.9%) |
| 35 to 64 Years | 0 (0.0%) | 0 (0.0%) |
| 65 to 74 Years | 0 (0.0%) | 5 (20.8%) |
| 75 Years and over | 0 (0.0%) | 0 (0.0%) |
Disability Class: Ambulatory Difficulty
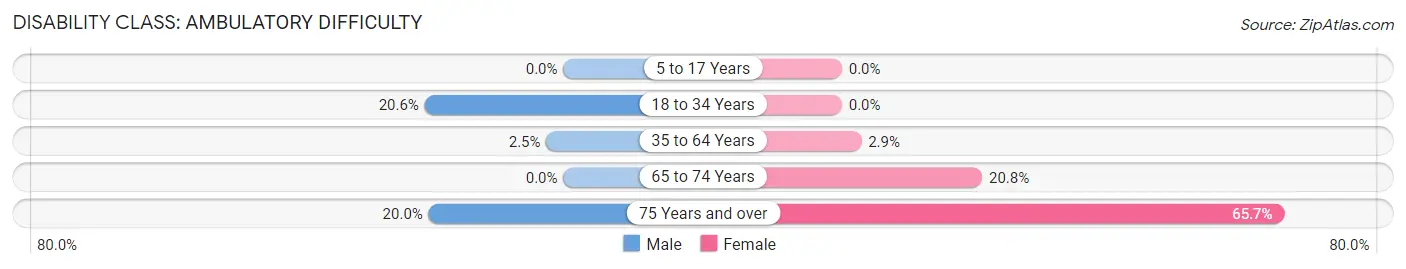
| Age Bracket | Male | Female |
| 5 to 17 Years | 0 (0.0%) | 0 (0.0%) |
| 18 to 34 Years | 21 (20.6%) | 0 (0.0%) |
| 35 to 64 Years | 3 (2.5%) | 4 (2.9%) |
| 65 to 74 Years | 0 (0.0%) | 5 (20.8%) |
| 75 Years and over | 4 (20.0%) | 23 (65.7%) |
Disability Class: Self-Care Difficulty
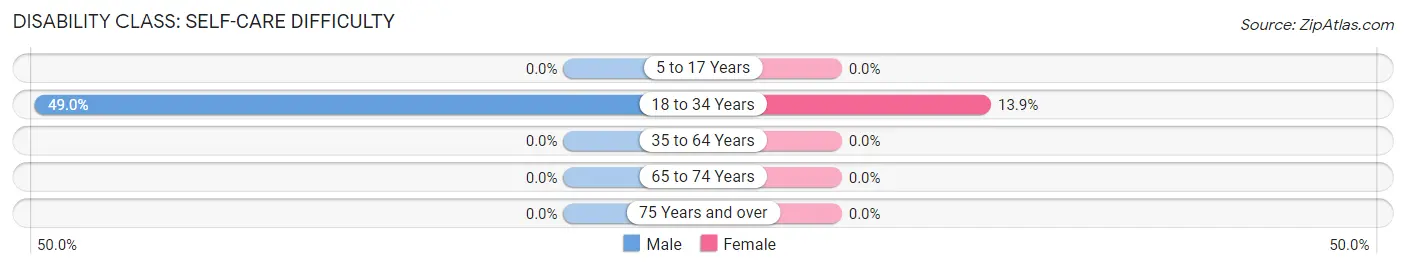
| Age Bracket | Male | Female |
| 5 to 17 Years | 0 (0.0%) | 0 (0.0%) |
| 18 to 34 Years | 50 (49.0%) | 18 (13.9%) |
| 35 to 64 Years | 0 (0.0%) | 0 (0.0%) |
| 65 to 74 Years | 0 (0.0%) | 0 (0.0%) |
| 75 Years and over | 0 (0.0%) | 0 (0.0%) |
Technology Access in Owaneco
Computing Device Access in Owaneco
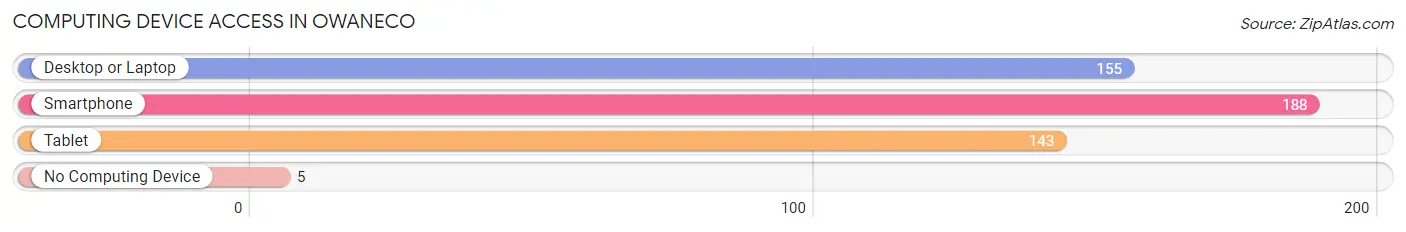
| Device Type | # Households | % Households |
| Desktop or Laptop | 155 | 76.0% |
| Smartphone | 188 | 92.2% |
| Tablet | 143 | 70.1% |
| No Computing Device | 5 | 2.5% |
| Total | 204 | 100.0% |
Internet Access in Owaneco
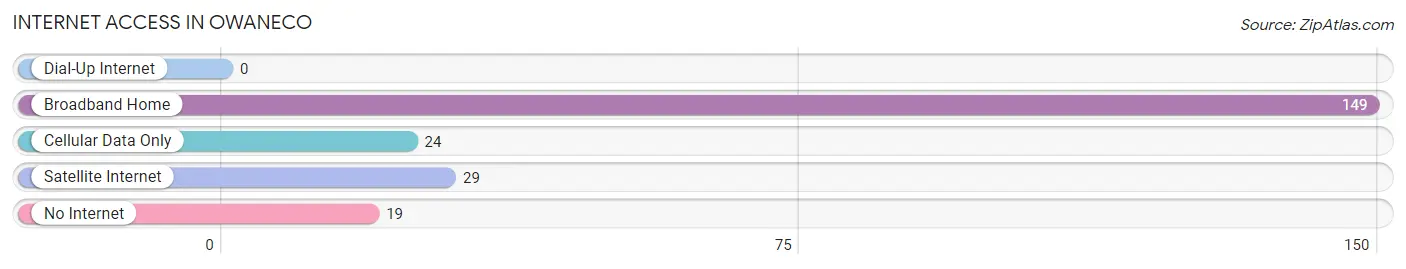
| Internet Type | # Households | % Households |
| Dial-Up Internet | 0 | 0.0% |
| Broadband Home | 149 | 73.0% |
| Cellular Data Only | 24 | 11.8% |
| Satellite Internet | 29 | 14.2% |
| No Internet | 19 | 9.3% |
| Total | 204 | 100.0% |
Owaneco Summary
Owaneco is a small village located in Christian County, Illinois. It is situated in the central part of the state, about 25 miles south of Springfield. The village has a population of approximately 500 people and is part of the Taylorville Micropolitan Statistical Area.
History
Owaneco was founded in 1854 by a group of settlers from Ohio. The village was named after the Owaneco Creek, which runs through the area. The creek was named after the Ojibwe tribe, who were the original inhabitants of the area. The settlers built a sawmill and a gristmill on the creek, which provided the village with its first industry.
In the late 19th century, Owaneco became a popular destination for tourists. The village was known for its natural beauty and its proximity to the Sangamon River. The village also had a number of hotels and resorts, which attracted visitors from all over the Midwest.
In the early 20th century, Owaneco experienced a period of growth. The village was connected to the rest of the state by the Illinois Central Railroad, which allowed for the transportation of goods and people. The village also had a number of businesses, including a bank, a post office, a general store, and a blacksmith shop.
Geography
Owaneco is located in the central part of Illinois, about 25 miles south of Springfield. The village is situated in the Sangamon River Valley, which is part of the Central Till Plains region. The village is surrounded by rolling hills and farmland. The Owaneco Creek runs through the village, providing a source of water for the area.
The climate in Owaneco is typical of the Midwest. Summers are hot and humid, while winters are cold and snowy. The average annual temperature is around 50 degrees Fahrenheit.
Economy
The economy of Owaneco is largely based on agriculture. The village is surrounded by farmland, and many of the residents are involved in farming. The village also has a number of small businesses, including a general store, a bank, and a post office.
Demographics
As of the 2010 census, the population of Owaneco was 498. The racial makeup of the village was 97.2% White, 0.2% African American, 0.2% Native American, 0.4% Asian, 0.2% from other races, and 1.9% from two or more races. Hispanic or Latino of any race were 1.2% of the population.
The median household income in Owaneco was $41,250, and the median family income was $45,625. The per capita income was $19,945. About 8.3% of families and 10.2% of the population were below the poverty line, including 14.3% of those under age 18 and 6.3% of those age 65 or over.
Conclusion
Owaneco is a small village located in Christian County, Illinois. It has a population of approximately 500 people and is part of the Taylorville Micropolitan Statistical Area. The village was founded in 1854 by a group of settlers from Ohio and is surrounded by rolling hills and farmland. The economy of Owaneco is largely based on agriculture, and the village also has a number of small businesses. The population of Owaneco is predominantly White, with a small percentage of African American, Native American, and Asian residents. The median household income in Owaneco is $41,250, and the per capita income is $19,945.
Common Questions
What is Per Capita Income in Owaneco?
Per Capita income in Owaneco is $21,484.
What is the Median Family Income in Owaneco?
Median Family Income in Owaneco is $73,631.
What is the Median Household income in Owaneco?
Median Household Income in Owaneco is $67,273.
What is Income or Wage Gap in Owaneco?
Income or Wage Gap in Owaneco is 40.3%.
Women in Owaneco earn 59.7 cents for every dollar earned by a man.
What is Inequality or Gini Index in Owaneco?
Inequality or Gini Index in Owaneco is 0.31.
What is the Total Population of Owaneco?
Total Population of Owaneco is 758.
What is the Total Male Population of Owaneco?
Total Male Population of Owaneco is 311.
What is the Total Female Population of Owaneco?
Total Female Population of Owaneco is 447.
What is the Ratio of Males per 100 Females in Owaneco?
There are 69.57 Males per 100 Females in Owaneco.
What is the Ratio of Females per 100 Males in Owaneco?
There are 143.73 Females per 100 Males in Owaneco.
What is the Median Population Age in Owaneco?
Median Population Age in Owaneco is 34.3 Years.
What is the Average Family Size in Owaneco
Average Family Size in Owaneco is 4.5 People.
What is the Average Household Size in Owaneco
Average Household Size in Owaneco is 3.7 People.
How Large is the Labor Force in Owaneco?
There are 327 People in the Labor Forcein in Owaneco.
What is the Percentage of People in the Labor Force in Owaneco?
54.7% of People are in the Labor Force in Owaneco.
What is the Unemployment Rate in Owaneco?
Unemployment Rate in Owaneco is 4.0%.