Orangeville, IL Map & Demographics
Orangeville Map
Orangeville Overview
$29,163
PER CAPITA INCOME
$70,509
AVG FAMILY INCOME
$63,690
AVG HOUSEHOLD INCOME
27.6%
WAGE / INCOME GAP [ % ]
72.4¢/ $1
WAGE / INCOME GAP [ $ ]
0.34
INEQUALITY / GINI INDEX
917
TOTAL POPULATION
471
MALE POPULATION
446
FEMALE POPULATION
105.61
MALES / 100 FEMALES
94.69
FEMALES / 100 MALES
39.6
MEDIAN AGE
3.0
AVG FAMILY SIZE
2.5
AVG HOUSEHOLD SIZE
519
LABOR FORCE [ PEOPLE ]
72.7%
PERCENT IN LABOR FORCE
13.1%
UNEMPLOYMENT RATE
Orangeville Zip Codes
Orangeville Area Codes
Income in Orangeville
Income Overview in Orangeville
Per Capita Income in Orangeville is $29,163, while median incomes of families and households are $70,509 and $63,690 respectively.
| Characteristic | Number | Measure |
| Per Capita Income | 917 | $29,163 |
| Median Family Income | 249 | $70,509 |
| Mean Family Income | 249 | $80,339 |
| Median Household Income | 374 | $63,690 |
| Mean Household Income | 374 | $71,046 |
| Income Deficit | 249 | $0 |
| Wage / Income Gap (%) | 917 | 27.56% |
| Wage / Income Gap ($) | 917 | 72.44¢ per $1 |
| Gini / Inequality Index | 917 | 0.34 |
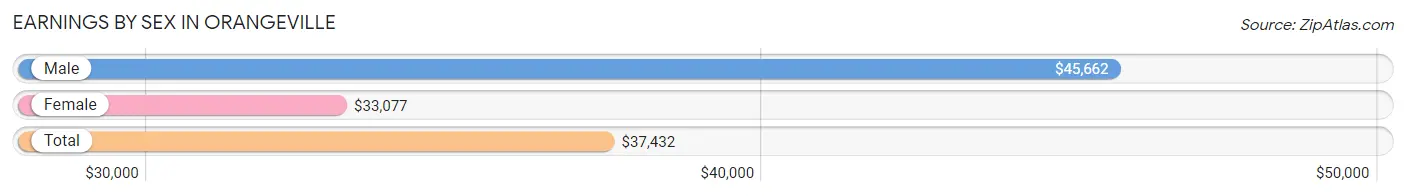
Earnings by Sex in Orangeville
Average Earnings in Orangeville are $37,432, $45,662 for men and $33,077 for women, a difference of 27.6%.
| Sex | Number | Average Earnings |
| Male | 298 (56.2%) | $45,662 |
| Female | 232 (43.8%) | $33,077 |
| Total | 530 (100.0%) | $37,432 |
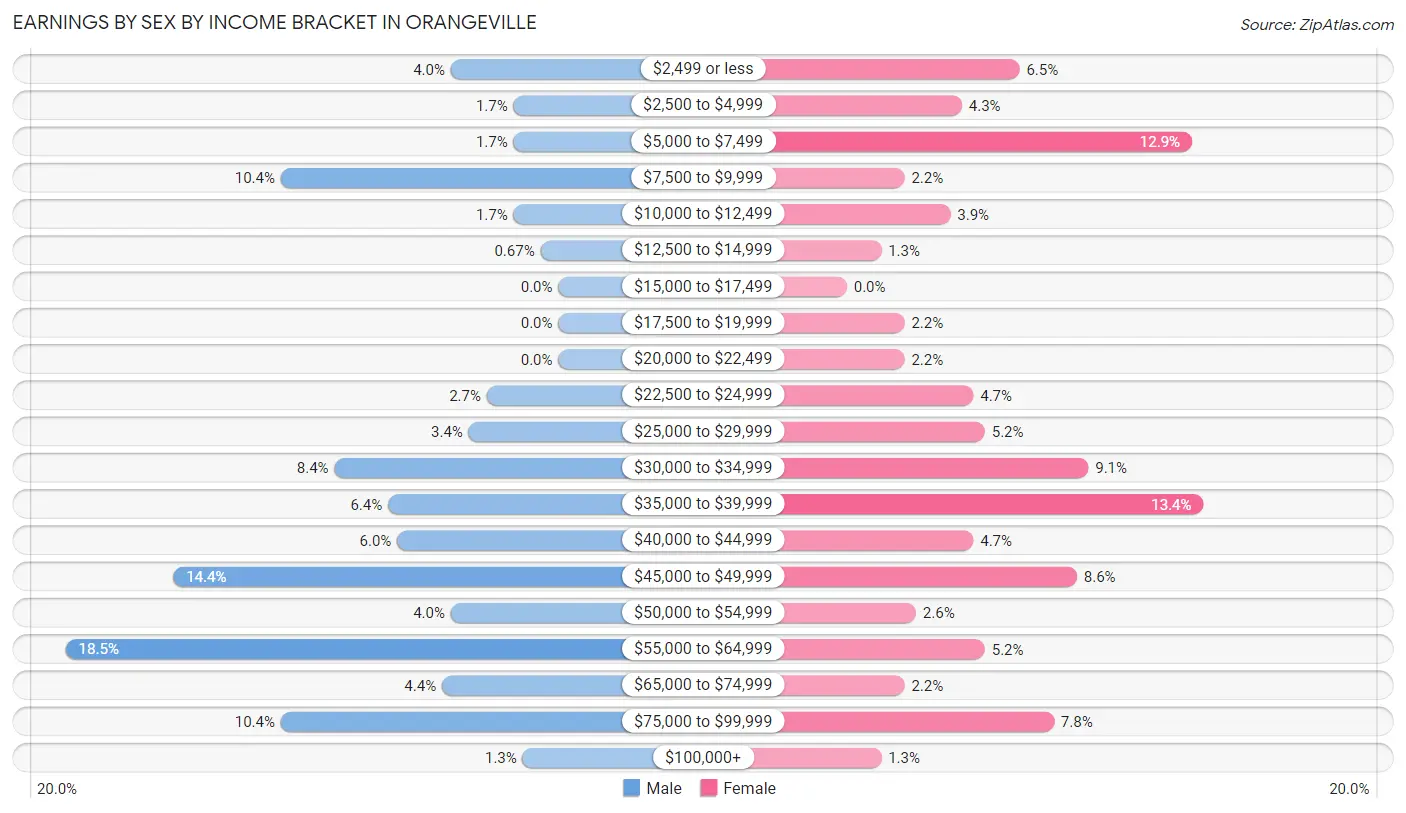
Earnings by Sex by Income Bracket in Orangeville
The most common earnings brackets in Orangeville are $55,000 to $64,999 for men (55 | 18.5%) and $35,000 to $39,999 for women (31 | 13.4%).
| Income | Male | Female |
| $2,499 or less | 12 (4.0%) | 15 (6.5%) |
| $2,500 to $4,999 | 5 (1.7%) | 10 (4.3%) |
| $5,000 to $7,499 | 5 (1.7%) | 30 (12.9%) |
| $7,500 to $9,999 | 31 (10.4%) | 5 (2.2%) |
| $10,000 to $12,499 | 5 (1.7%) | 9 (3.9%) |
| $12,500 to $14,999 | 2 (0.7%) | 3 (1.3%) |
| $15,000 to $17,499 | 0 (0.0%) | 0 (0.0%) |
| $17,500 to $19,999 | 0 (0.0%) | 5 (2.2%) |
| $20,000 to $22,499 | 0 (0.0%) | 5 (2.2%) |
| $22,500 to $24,999 | 8 (2.7%) | 11 (4.7%) |
| $25,000 to $29,999 | 10 (3.4%) | 12 (5.2%) |
| $30,000 to $34,999 | 25 (8.4%) | 21 (9.0%) |
| $35,000 to $39,999 | 19 (6.4%) | 31 (13.4%) |
| $40,000 to $44,999 | 18 (6.0%) | 11 (4.7%) |
| $45,000 to $49,999 | 43 (14.4%) | 20 (8.6%) |
| $50,000 to $54,999 | 12 (4.0%) | 6 (2.6%) |
| $55,000 to $64,999 | 55 (18.5%) | 12 (5.2%) |
| $65,000 to $74,999 | 13 (4.4%) | 5 (2.2%) |
| $75,000 to $99,999 | 31 (10.4%) | 18 (7.8%) |
| $100,000+ | 4 (1.3%) | 3 (1.3%) |
| Total | 298 (100.0%) | 232 (100.0%) |
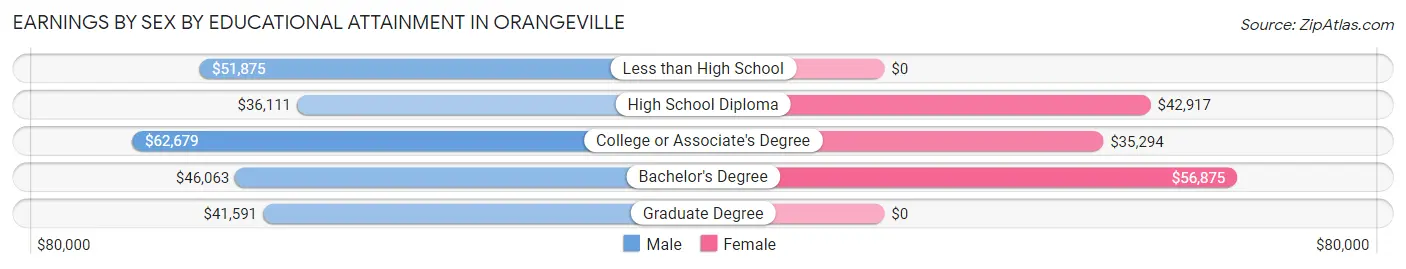
Earnings by Sex by Educational Attainment in Orangeville
Average earnings in Orangeville are $47,206 for men and $37,292 for women, a difference of 21.0%. Men with an educational attainment of college or associate's degree enjoy the highest average annual earnings of $62,679, while those with high school diploma education earn the least with $36,111. Women with an educational attainment of bachelor's degree earn the most with the average annual earnings of $56,875, while those with college or associate's degree education have the smallest earnings of $35,294.
| Educational Attainment | Male Income | Female Income |
| Less than High School | $51,875 | $0 |
| High School Diploma | $36,111 | $42,917 |
| College or Associate's Degree | $62,679 | $35,294 |
| Bachelor's Degree | $46,063 | $56,875 |
| Graduate Degree | $41,591 | $0 |
| Total | $47,206 | $37,292 |
Family Income in Orangeville
Family Income Brackets in Orangeville
According to the Orangeville family income data, there are 90 families falling into the $50,000 to $74,999 income range, which is the most common income bracket and makes up 36.1% of all families. Conversely, the $10,000 to $14,999 income bracket is the least frequent group with only 1 families (0.4%) belonging to this category.
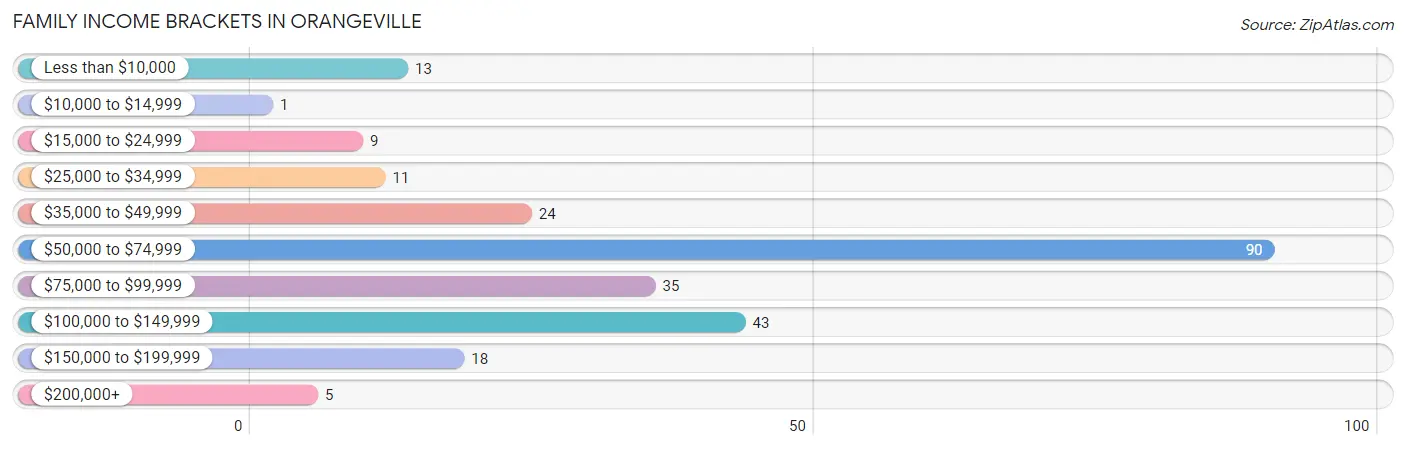
| Income Bracket | # Families | % Families |
| Less than $10,000 | 13 | 5.2% |
| $10,000 to $14,999 | 1 | 0.4% |
| $15,000 to $24,999 | 9 | 3.6% |
| $25,000 to $34,999 | 11 | 4.4% |
| $35,000 to $49,999 | 24 | 9.6% |
| $50,000 to $74,999 | 90 | 36.1% |
| $75,000 to $99,999 | 35 | 14.1% |
| $100,000 to $149,999 | 43 | 17.3% |
| $150,000 to $199,999 | 18 | 7.2% |
| $200,000+ | 5 | 2.0% |
Family Income by Famaliy Size in Orangeville
3-person families (38 | 15.3%) account for the highest median family income in Orangeville with $82,500 per family, while 2-person families (128 | 51.4%) have the highest median income of $35,893 per family member.
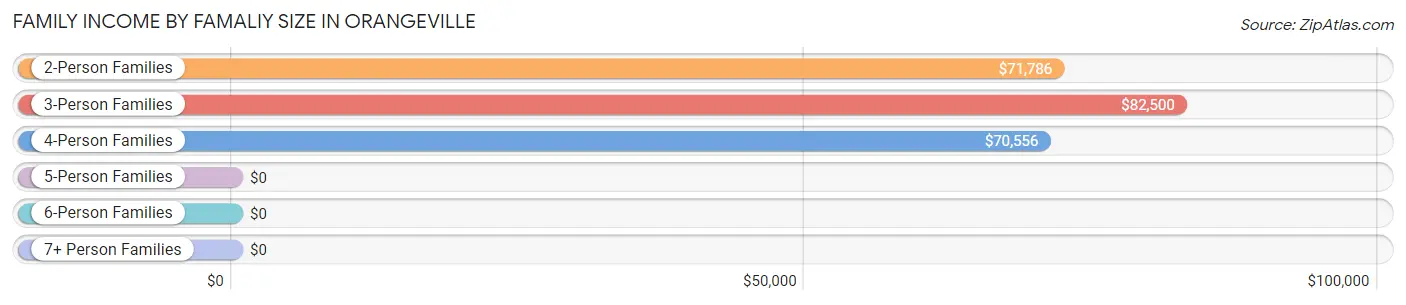
| Income Bracket | # Families | Median Income |
| 2-Person Families | 128 (51.4%) | $71,786 |
| 3-Person Families | 38 (15.3%) | $82,500 |
| 4-Person Families | 50 (20.1%) | $70,556 |
| 5-Person Families | 13 (5.2%) | $0 |
| 6-Person Families | 20 (8.0%) | $0 |
| 7+ Person Families | 0 (0.0%) | $0 |
| Total | 249 (100.0%) | $70,509 |
Family Income by Number of Earners in Orangeville
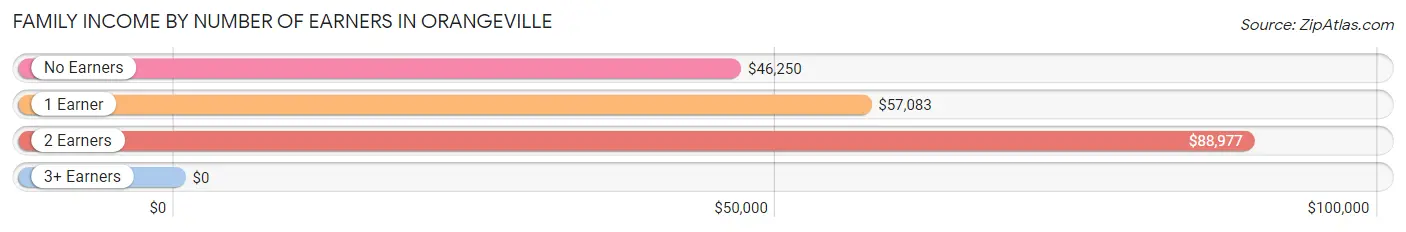
| Number of Earners | # Families | Median Income |
| No Earners | 18 (7.2%) | $46,250 |
| 1 Earner | 101 (40.6%) | $57,083 |
| 2 Earners | 95 (38.2%) | $88,977 |
| 3+ Earners | 35 (14.1%) | $0 |
| Total | 249 (100.0%) | $70,509 |
Household Income in Orangeville
Household Income Brackets in Orangeville
With 118 households falling in the category, the $50,000 to $74,999 income range is the most frequent in Orangeville, accounting for 31.6% of all households. In contrast, only 1 households (0.3%) fall into the $10,000 to $14,999 income bracket, making it the least populous group.
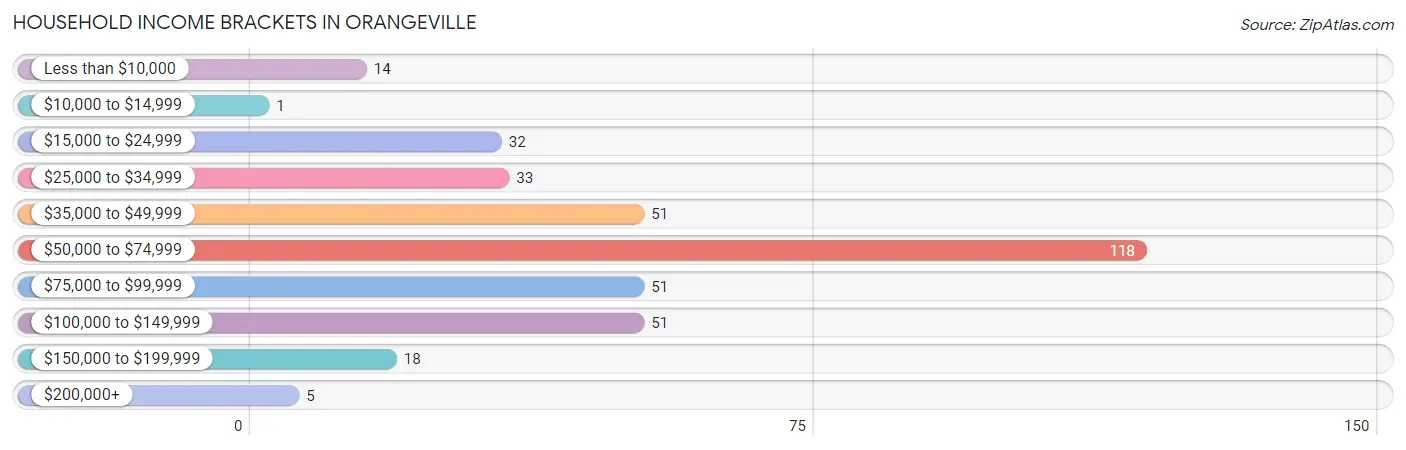
| Income Bracket | # Households | % Households |
| Less than $10,000 | 14 | 3.7% |
| $10,000 to $14,999 | 1 | 0.3% |
| $15,000 to $24,999 | 32 | 8.6% |
| $25,000 to $34,999 | 33 | 8.8% |
| $35,000 to $49,999 | 51 | 13.6% |
| $50,000 to $74,999 | 118 | 31.6% |
| $75,000 to $99,999 | 51 | 13.6% |
| $100,000 to $149,999 | 51 | 13.6% |
| $150,000 to $199,999 | 18 | 4.8% |
| $200,000+ | 5 | 1.3% |
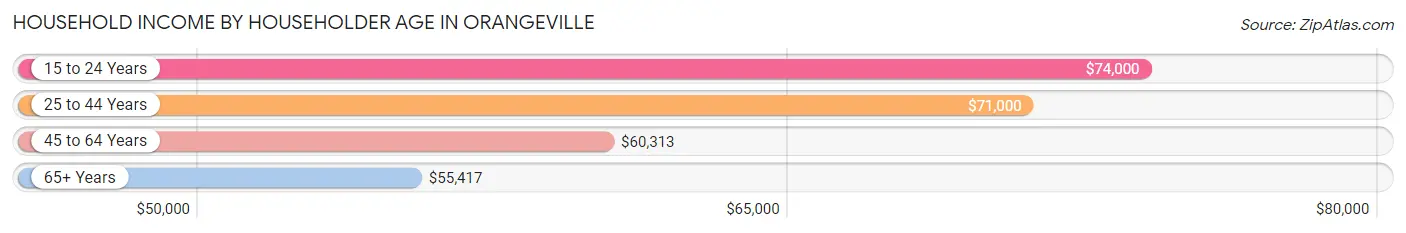
Household Income by Householder Age in Orangeville
The median household income in Orangeville is $63,690, with the highest median household income of $74,000 found in the 15 to 24 years age bracket for the primary householder. A total of 16 households (4.3%) fall into this category. Meanwhile, the 65+ years age bracket for the primary householder has the lowest median household income of $55,417, with 95 households (25.4%) in this group.
| Income Bracket | # Households | Median Income |
| 15 to 24 Years | 16 (4.3%) | $74,000 |
| 25 to 44 Years | 118 (31.6%) | $71,000 |
| 45 to 64 Years | 145 (38.8%) | $60,313 |
| 65+ Years | 95 (25.4%) | $55,417 |
| Total | 374 (100.0%) | $63,690 |
Poverty in Orangeville
Income Below Poverty by Sex and Age in Orangeville
With 11.1% poverty level for males and 15.5% for females among the residents of Orangeville, under 5 year old males and under 5 year old females are the most vulnerable to poverty, with 25 males (54.3%) and 8 females (57.1%) in their respective age groups living below the poverty level.
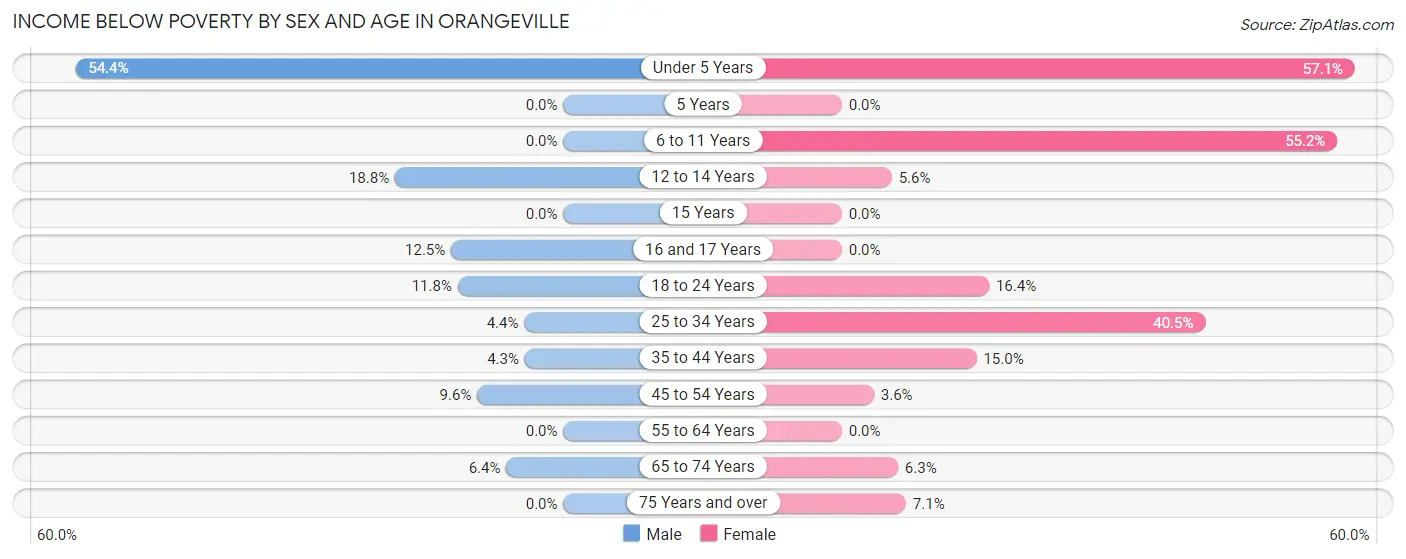
| Age Bracket | Male | Female |
| Under 5 Years | 25 (54.3%) | 8 (57.1%) |
| 5 Years | 0 (0.0%) | 0 (0.0%) |
| 6 to 11 Years | 0 (0.0%) | 16 (55.2%) |
| 12 to 14 Years | 3 (18.8%) | 2 (5.6%) |
| 15 Years | 0 (0.0%) | 0 (0.0%) |
| 16 and 17 Years | 5 (12.5%) | 0 (0.0%) |
| 18 to 24 Years | 2 (11.8%) | 10 (16.4%) |
| 25 to 34 Years | 2 (4.3%) | 17 (40.5%) |
| 35 to 44 Years | 3 (4.3%) | 9 (15.0%) |
| 45 to 54 Years | 7 (9.6%) | 2 (3.6%) |
| 55 to 64 Years | 0 (0.0%) | 0 (0.0%) |
| 65 to 74 Years | 4 (6.4%) | 3 (6.2%) |
| 75 Years and over | 0 (0.0%) | 2 (7.1%) |
| Total | 51 (11.1%) | 69 (15.5%) |
Income Above Poverty by Sex and Age in Orangeville
According to the poverty statistics in Orangeville, males aged 5 years and females aged 5 years are the age groups that are most secure financially, with 100.0% of males and 100.0% of females in these age groups living above the poverty line.
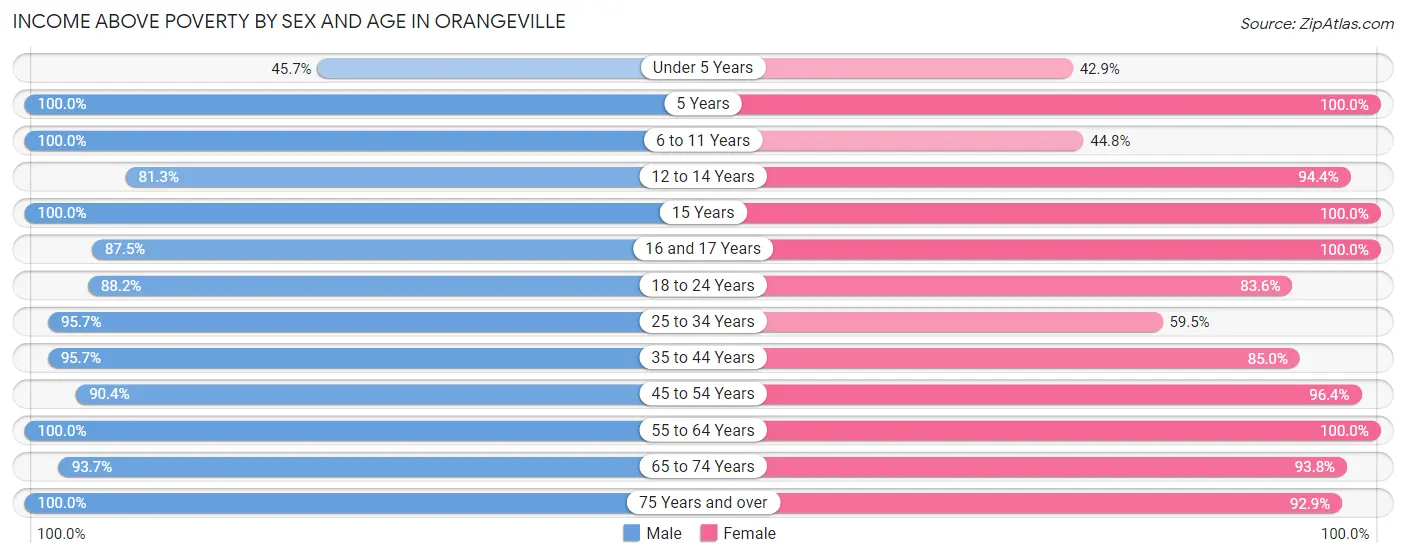
| Age Bracket | Male | Female |
| Under 5 Years | 21 (45.7%) | 6 (42.9%) |
| 5 Years | 7 (100.0%) | 2 (100.0%) |
| 6 to 11 Years | 19 (100.0%) | 13 (44.8%) |
| 12 to 14 Years | 13 (81.2%) | 34 (94.4%) |
| 15 Years | 8 (100.0%) | 15 (100.0%) |
| 16 and 17 Years | 35 (87.5%) | 3 (100.0%) |
| 18 to 24 Years | 15 (88.2%) | 51 (83.6%) |
| 25 to 34 Years | 44 (95.7%) | 25 (59.5%) |
| 35 to 44 Years | 67 (95.7%) | 51 (85.0%) |
| 45 to 54 Years | 66 (90.4%) | 54 (96.4%) |
| 55 to 64 Years | 38 (100.0%) | 52 (100.0%) |
| 65 to 74 Years | 59 (93.6%) | 45 (93.8%) |
| 75 Years and over | 17 (100.0%) | 26 (92.9%) |
| Total | 409 (88.9%) | 377 (84.5%) |
Income Below Poverty Among Married-Couple Families in Orangeville
The poverty statistics for married-couple families in Orangeville show that 2.1% or 4 of the total 188 families live below the poverty line. Families with no children have the highest poverty rate of 3.6%, comprising of 4 families. On the other hand, families with 1 or 2 children have the lowest poverty rate of 0.0%, which includes 0 families.
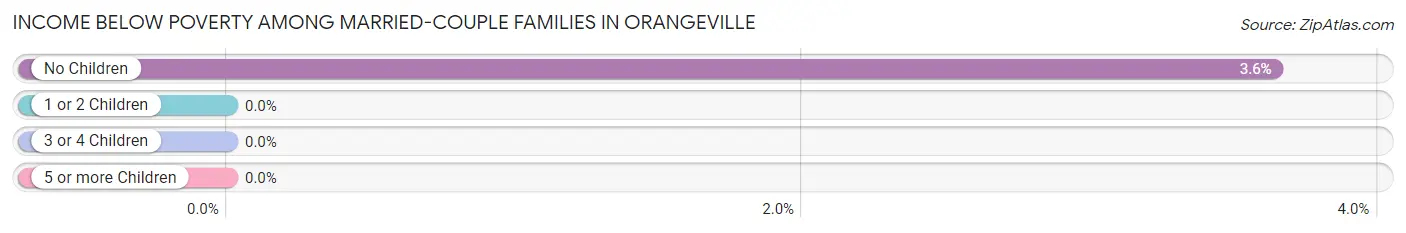
| Children | Above Poverty | Below Poverty |
| No Children | 106 (96.4%) | 4 (3.6%) |
| 1 or 2 Children | 53 (100.0%) | 0 (0.0%) |
| 3 or 4 Children | 25 (100.0%) | 0 (0.0%) |
| 5 or more Children | 0 (0.0%) | 0 (0.0%) |
| Total | 184 (97.9%) | 4 (2.1%) |
Income Below Poverty Among Single-Parent Households in Orangeville
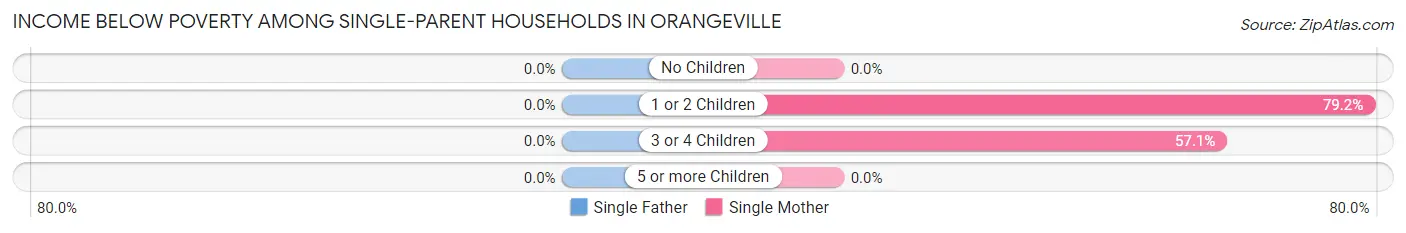
| Children | Single Father | Single Mother |
| No Children | 0 (0.0%) | 0 (0.0%) |
| 1 or 2 Children | 0 (0.0%) | 19 (79.2%) |
| 3 or 4 Children | 0 (0.0%) | 8 (57.1%) |
| 5 or more Children | 0 (0.0%) | 0 (0.0%) |
| Total | 0 (0.0%) | 27 (54.0%) |
Income Below Poverty Among Married-Couple vs Single-Parent Households in Orangeville
The poverty data for Orangeville shows that 4 of the married-couple family households (2.1%) and 27 of the single-parent households (44.3%) are living below the poverty level. Within the married-couple family households, those with no children have the highest poverty rate, with 4 households (3.6%) falling below the poverty line. Among the single-parent households, those with 1 or 2 children have the highest poverty rate, with 19 household (65.5%) living below poverty.
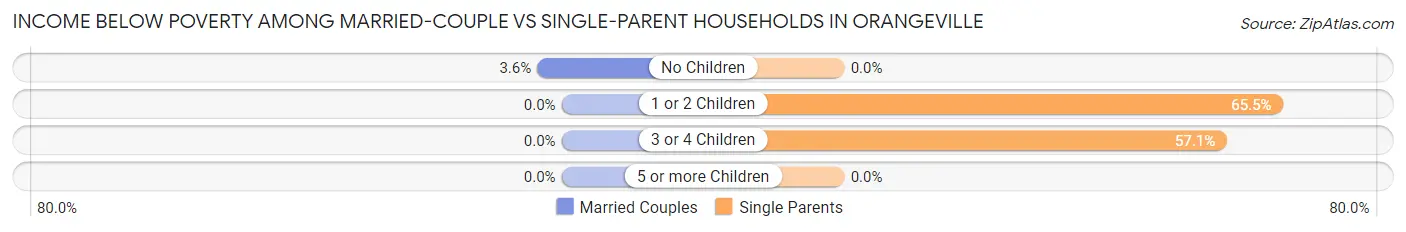
| Children | Married-Couple Families | Single-Parent Households |
| No Children | 4 (3.6%) | 0 (0.0%) |
| 1 or 2 Children | 0 (0.0%) | 19 (65.5%) |
| 3 or 4 Children | 0 (0.0%) | 8 (57.1%) |
| 5 or more Children | 0 (0.0%) | 0 (0.0%) |
| Total | 4 (2.1%) | 27 (44.3%) |
Race in Orangeville
The most populous races in Orangeville are White / Caucasian (904 | 98.6%), Some other Race (5 | 0.5%), and Black / African American (4 | 0.4%).
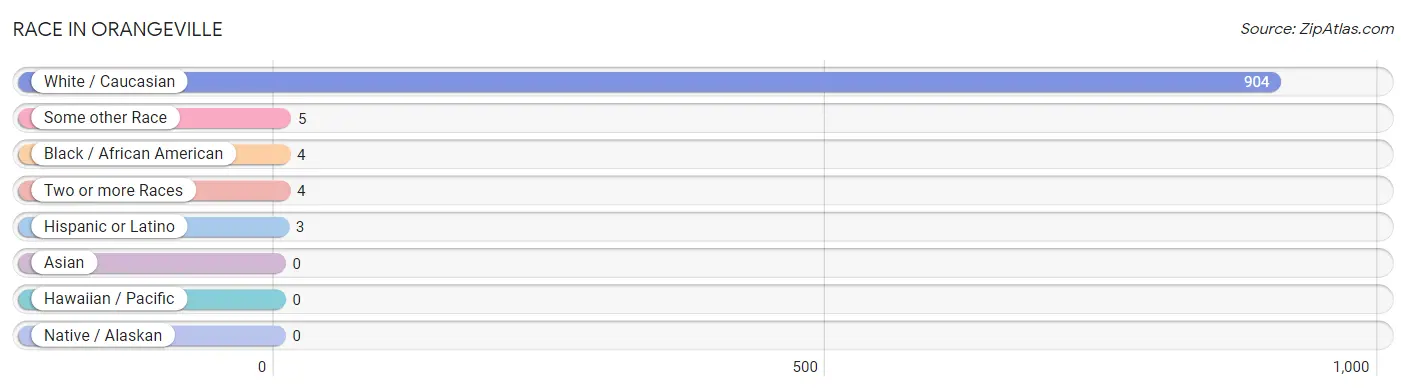
| Race | # Population | % Population |
| Asian | 0 | 0.0% |
| Black / African American | 4 | 0.4% |
| Hawaiian / Pacific | 0 | 0.0% |
| Hispanic or Latino | 3 | 0.3% |
| Native / Alaskan | 0 | 0.0% |
| White / Caucasian | 904 | 98.6% |
| Two or more Races | 4 | 0.4% |
| Some other Race | 5 | 0.5% |
| Total | 917 | 100.0% |
Ancestry in Orangeville
The most populous ancestries reported in Orangeville are German (341 | 37.2%), Irish (94 | 10.2%), English (72 | 7.9%), American (57 | 6.2%), and Norwegian (45 | 4.9%), together accounting for 66.4% of all Orangeville residents.
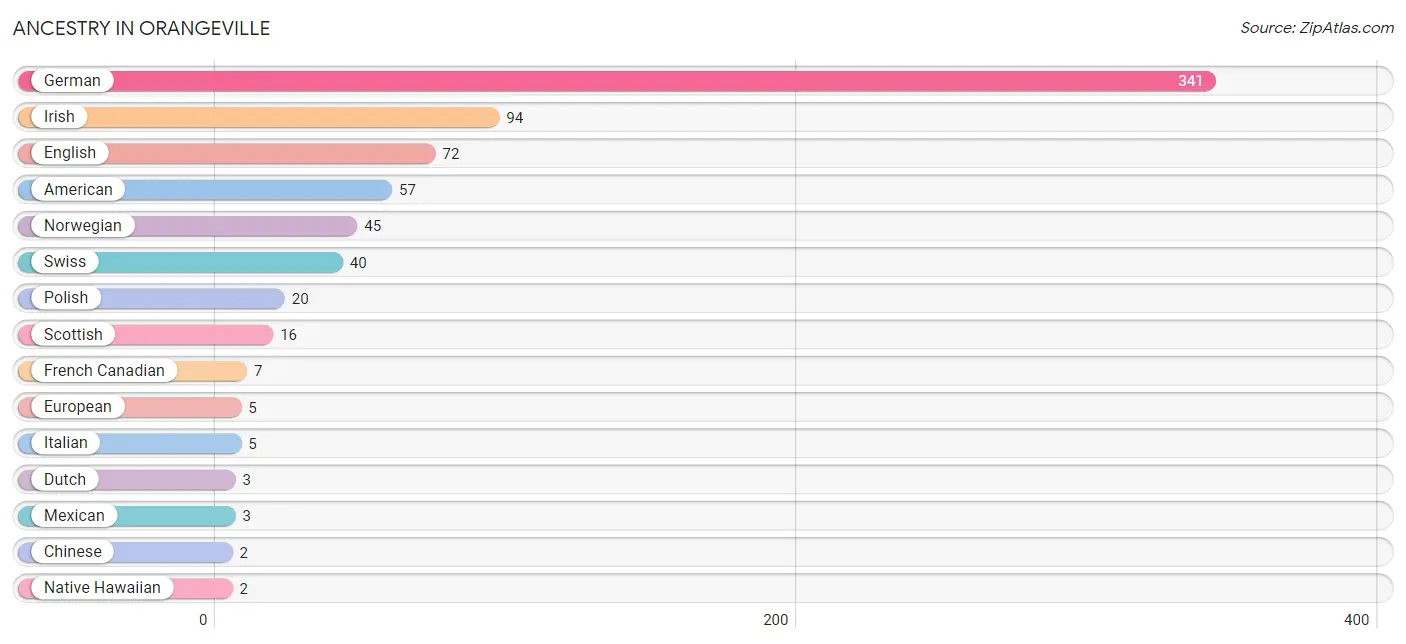
| Ancestry | # Population | % Population |
| American | 57 | 6.2% |
| Chinese | 2 | 0.2% |
| Dutch | 3 | 0.3% |
| English | 72 | 7.9% |
| European | 5 | 0.5% |
| French Canadian | 7 | 0.8% |
| German | 341 | 37.2% |
| Irish | 94 | 10.2% |
| Italian | 5 | 0.5% |
| Mexican | 3 | 0.3% |
| Native Hawaiian | 2 | 0.2% |
| Norwegian | 45 | 4.9% |
| Polish | 20 | 2.2% |
| Scandinavian | 2 | 0.2% |
| Scotch-Irish | 2 | 0.2% |
| Scottish | 16 | 1.7% |
| Swedish | 2 | 0.2% |
| Swiss | 40 | 4.4% | View All 18 Rows |
Immigrants in Orangeville

| Immigration Origin | # Population | % Population | View All 0 Rows |
Sex and Age in Orangeville
Sex and Age in Orangeville
The most populous age groups in Orangeville are 45 to 49 Years (56 | 11.9%) for men and 15 to 19 Years (54 | 12.1%) for women.
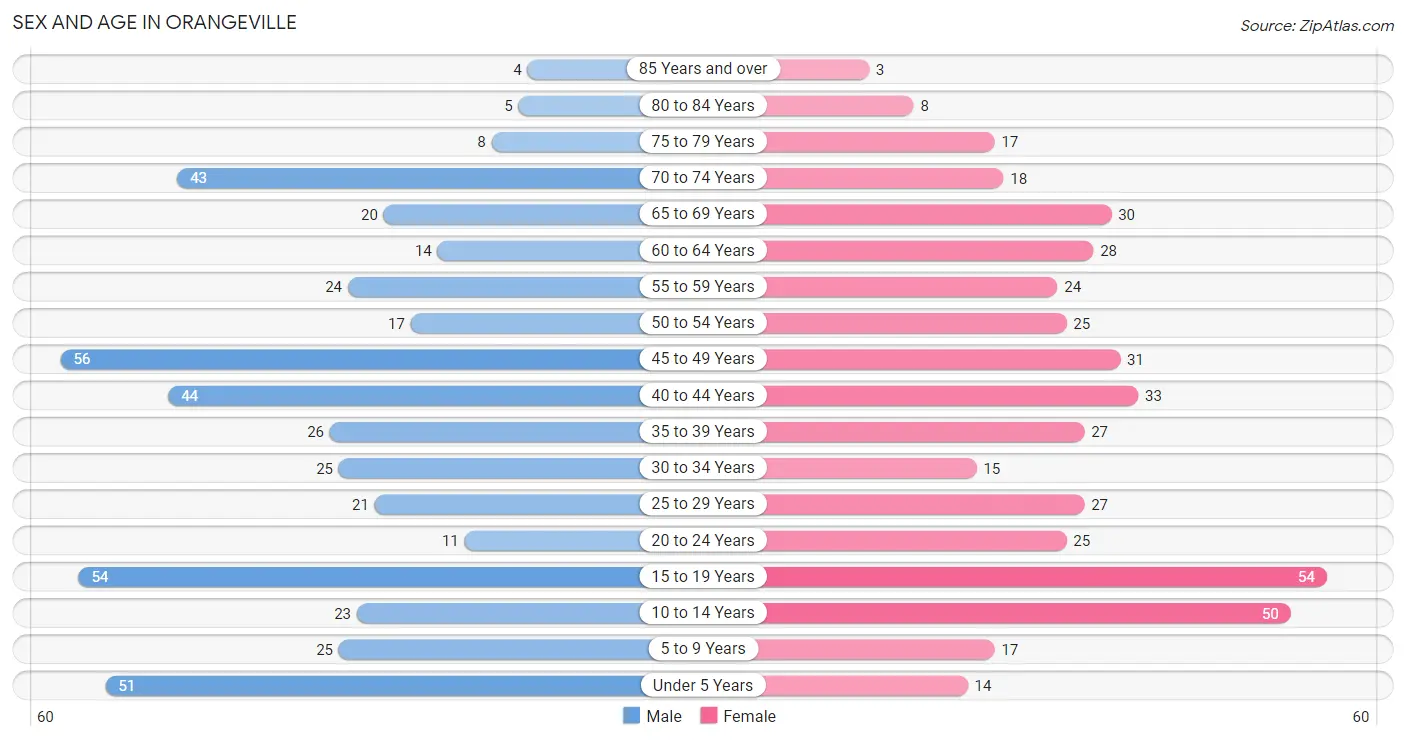
| Age Bracket | Male | Female |
| Under 5 Years | 51 (10.8%) | 14 (3.1%) |
| 5 to 9 Years | 25 (5.3%) | 17 (3.8%) |
| 10 to 14 Years | 23 (4.9%) | 50 (11.2%) |
| 15 to 19 Years | 54 (11.5%) | 54 (12.1%) |
| 20 to 24 Years | 11 (2.3%) | 25 (5.6%) |
| 25 to 29 Years | 21 (4.5%) | 27 (6.0%) |
| 30 to 34 Years | 25 (5.3%) | 15 (3.4%) |
| 35 to 39 Years | 26 (5.5%) | 27 (6.0%) |
| 40 to 44 Years | 44 (9.3%) | 33 (7.4%) |
| 45 to 49 Years | 56 (11.9%) | 31 (7.0%) |
| 50 to 54 Years | 17 (3.6%) | 25 (5.6%) |
| 55 to 59 Years | 24 (5.1%) | 24 (5.4%) |
| 60 to 64 Years | 14 (3.0%) | 28 (6.3%) |
| 65 to 69 Years | 20 (4.3%) | 30 (6.7%) |
| 70 to 74 Years | 43 (9.1%) | 18 (4.0%) |
| 75 to 79 Years | 8 (1.7%) | 17 (3.8%) |
| 80 to 84 Years | 5 (1.1%) | 8 (1.8%) |
| 85 Years and over | 4 (0.9%) | 3 (0.7%) |
| Total | 471 (100.0%) | 446 (100.0%) |
Families and Households in Orangeville
Median Family Size in Orangeville
The median family size in Orangeville is 2.95 persons per family, with married-couple families (188 | 75.5%) accounting for the largest median family size of 2.99 persons per family. On the other hand, single male/father families (11 | 4.4%) represent the smallest median family size with 2.18 persons per family.
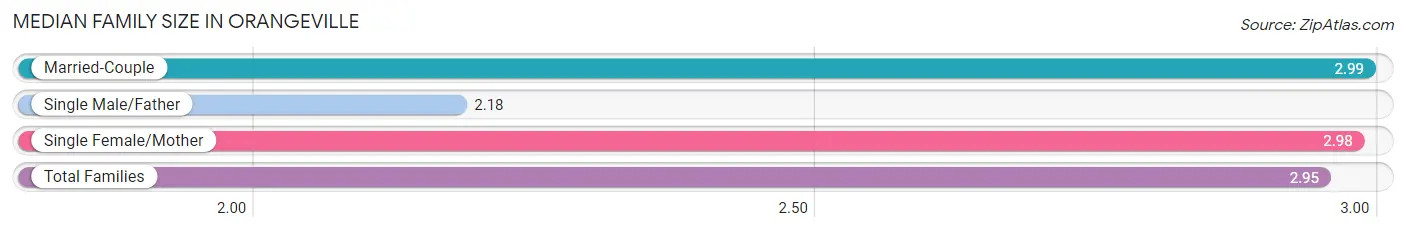
| Family Type | # Families | Family Size |
| Married-Couple | 188 (75.5%) | 2.99 |
| Single Male/Father | 11 (4.4%) | 2.18 |
| Single Female/Mother | 50 (20.1%) | 2.98 |
| Total Families | 249 (100.0%) | 2.95 |
Median Household Size in Orangeville
The median household size in Orangeville is 2.45 persons per household, with single female/mother households (50 | 13.4%) accounting for the largest median household size of 3.52 persons per household. non-family households (125 | 33.4%) represent the smallest median household size with 1.12 persons per household.
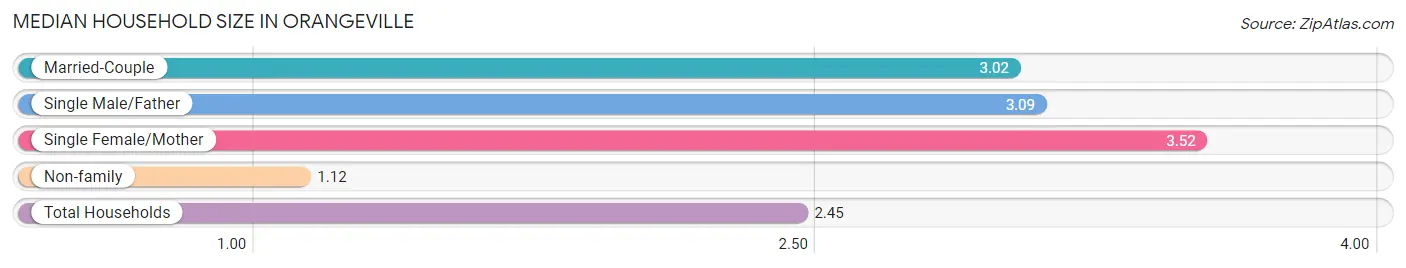
| Household Type | # Households | Household Size |
| Married-Couple | 188 (50.3%) | 3.02 |
| Single Male/Father | 11 (2.9%) | 3.09 |
| Single Female/Mother | 50 (13.4%) | 3.52 |
| Non-family | 125 (33.4%) | 1.12 |
| Total Households | 374 (100.0%) | 2.45 |
Household Size by Marriage Status in Orangeville
Out of a total of 374 households in Orangeville, 249 (66.6%) are family households, while 125 (33.4%) are nonfamily households. The most numerous type of family households are 2-person households, comprising 115, and the most common type of nonfamily households are 1-person households, comprising 113.
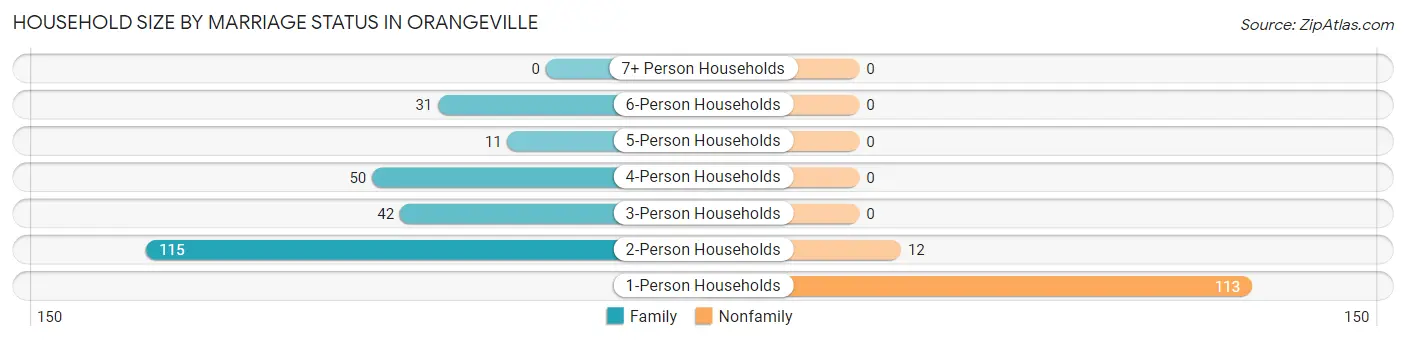
| Household Size | Family Households | Nonfamily Households |
| 1-Person Households | - | 113 (30.2%) |
| 2-Person Households | 115 (30.7%) | 12 (3.2%) |
| 3-Person Households | 42 (11.2%) | 0 (0.0%) |
| 4-Person Households | 50 (13.4%) | 0 (0.0%) |
| 5-Person Households | 11 (2.9%) | 0 (0.0%) |
| 6-Person Households | 31 (8.3%) | 0 (0.0%) |
| 7+ Person Households | 0 (0.0%) | 0 (0.0%) |
| Total | 249 (66.6%) | 125 (33.4%) |
Female Fertility in Orangeville
Fertility by Age in Orangeville
Average fertility rate in Orangeville is 65.0 births per 1,000 women. Women in the age bracket of 20 to 34 years have the highest fertility rate with 149.0 births per 1,000 women. Women in the age bracket of 20 to 34 years acount for 71.4% of all women with births.
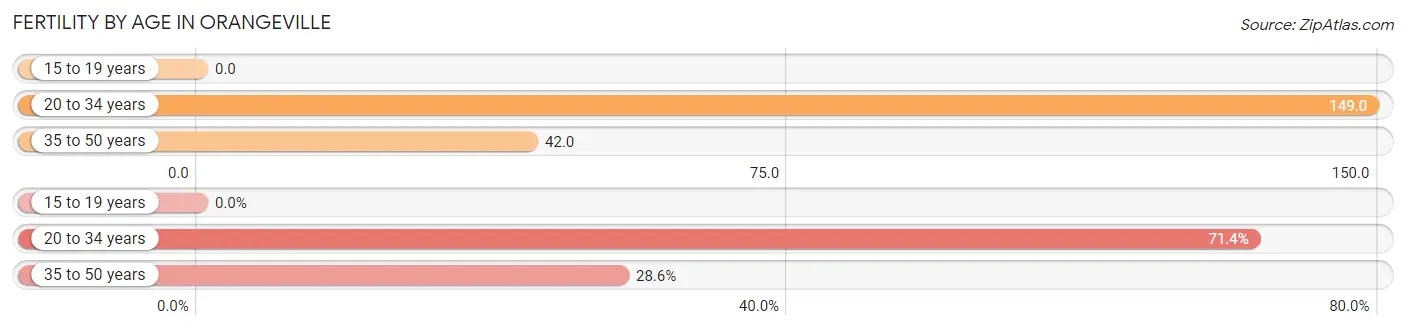
| Age Bracket | Women with Births | Births / 1,000 Women |
| 15 to 19 years | 0 (0.0%) | 0.0 |
| 20 to 34 years | 10 (71.4%) | 149.0 |
| 35 to 50 years | 4 (28.6%) | 42.0 |
| Total | 14 (100.0%) | 65.0 |
Fertility by Age by Marriage Status in Orangeville
14.3% of women with births (14) in Orangeville are married. The highest percentage of unmarried women with births falls into 35 to 50 years age bracket with 100.0% of them unmarried at the time of birth, while the lowest percentage of unmarried women with births belong to 20 to 34 years age bracket with 80.0% of them unmarried.
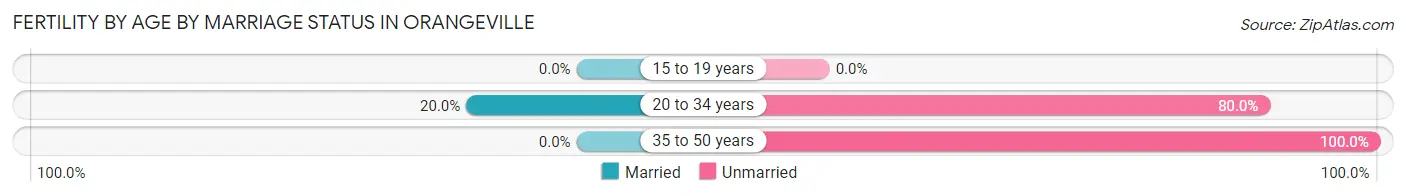
| Age Bracket | Married | Unmarried |
| 15 to 19 years | 0 (0.0%) | 0 (0.0%) |
| 20 to 34 years | 2 (20.0%) | 8 (80.0%) |
| 35 to 50 years | 0 (0.0%) | 4 (100.0%) |
| Total | 2 (14.3%) | 12 (85.7%) |
Fertility by Education in Orangeville
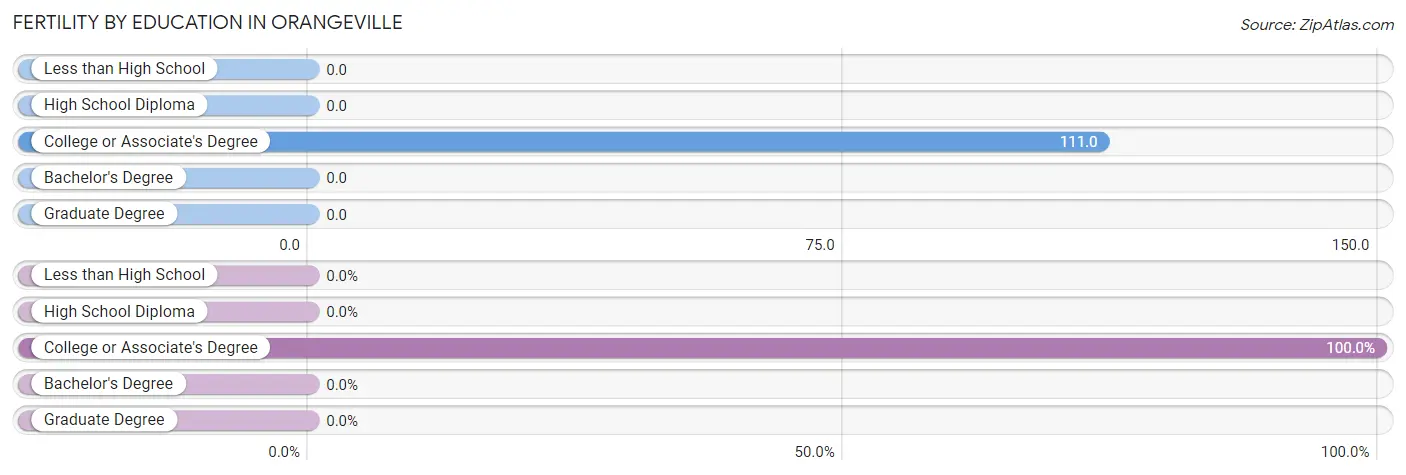
| Educational Attainment | Women with Births | Births / 1,000 Women |
| Less than High School | 0 (0.0%) | 0.0 |
| High School Diploma | 0 (0.0%) | 0.0 |
| College or Associate's Degree | 14 (100.0%) | 111.0 |
| Bachelor's Degree | 0 (0.0%) | 0.0 |
| Graduate Degree | 0 (0.0%) | 0.0 |
| Total | 14 (100.0%) | 65.0 |
Fertility by Education by Marriage Status in Orangeville
85.7% of women with births in Orangeville are unmarried. Women with the educational attainment of college or associate's degree are most likely to be married with 14.3% of them married at childbirth, while women with the educational attainment of college or associate's degree are least likely to be married with 85.7% of them unmarried at childbirth.
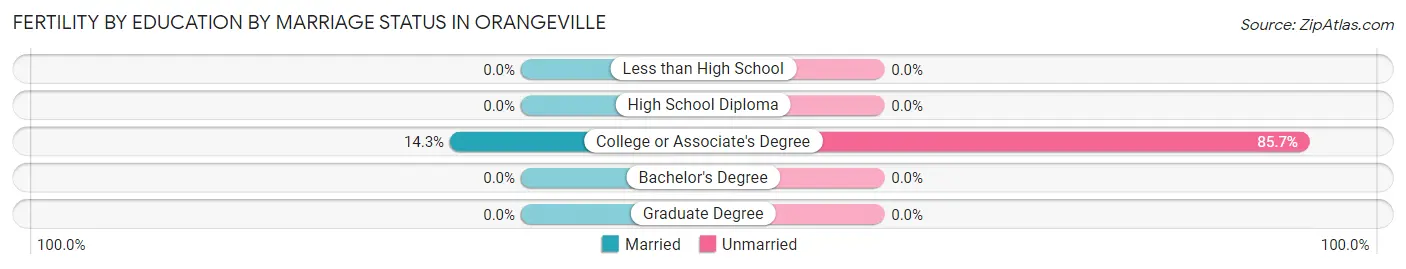
| Educational Attainment | Married | Unmarried |
| Less than High School | 0 (0.0%) | 0 (0.0%) |
| High School Diploma | 0 (0.0%) | 0 (0.0%) |
| College or Associate's Degree | 2 (14.3%) | 12 (85.7%) |
| Bachelor's Degree | 0 (0.0%) | 0 (0.0%) |
| Graduate Degree | 0 (0.0%) | 0 (0.0%) |
| Total | 2 (14.3%) | 12 (85.7%) |
Employment Characteristics in Orangeville
Employment by Class of Employer in Orangeville
Among the 433 employed individuals in Orangeville, private company employees (306 | 70.7%), not-for-profit organizations (52 | 12.0%), and self-employed (not incorporated) (36 | 8.3%) make up the most common classes of employment.
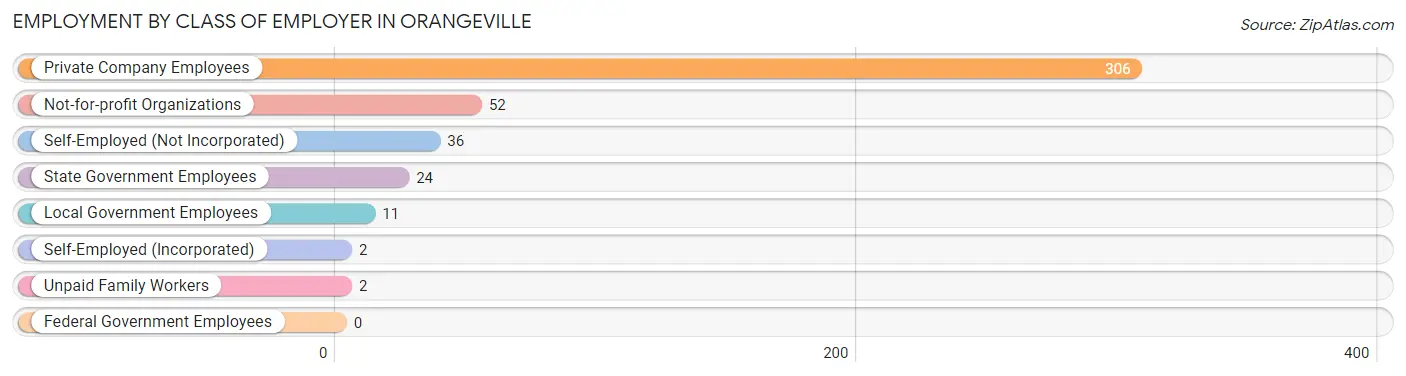
| Employer Class | # Employees | % Employees |
| Private Company Employees | 306 | 70.7% |
| Self-Employed (Incorporated) | 2 | 0.5% |
| Self-Employed (Not Incorporated) | 36 | 8.3% |
| Not-for-profit Organizations | 52 | 12.0% |
| Local Government Employees | 11 | 2.5% |
| State Government Employees | 24 | 5.5% |
| Federal Government Employees | 0 | 0.0% |
| Unpaid Family Workers | 2 | 0.5% |
| Total | 433 | 100.0% |
Employment Status by Age in Orangeville
According to the labor force statistics for Orangeville, out of the total population over 16 years of age (714), 72.7% or 519 individuals are in the labor force, with 13.1% or 68 of them unemployed. The age group with the highest labor force participation rate is 20 to 24 years, with 100.0% or 36 individuals in the labor force. Within the labor force, the 16 to 19 years age range has the highest percentage of unemployed individuals, with 40.0% or 28 of them being unemployed.
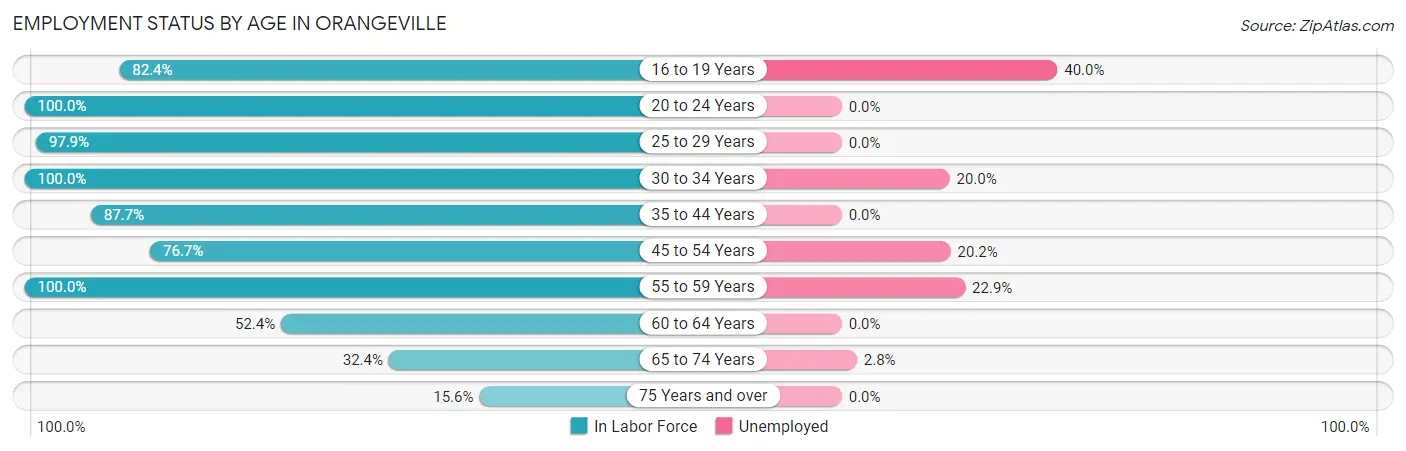
| Age Bracket | In Labor Force | Unemployed |
| 16 to 19 Years | 70 (82.4%) | 28 (40.0%) |
| 20 to 24 Years | 36 (100.0%) | 0 (0.0%) |
| 25 to 29 Years | 47 (97.9%) | 0 (0.0%) |
| 30 to 34 Years | 40 (100.0%) | 8 (20.0%) |
| 35 to 44 Years | 114 (87.7%) | 0 (0.0%) |
| 45 to 54 Years | 99 (76.7%) | 20 (20.2%) |
| 55 to 59 Years | 48 (100.0%) | 11 (22.9%) |
| 60 to 64 Years | 22 (52.4%) | 0 (0.0%) |
| 65 to 74 Years | 36 (32.4%) | 1 (2.8%) |
| 75 Years and over | 7 (15.6%) | 0 (0.0%) |
| Total | 519 (72.7%) | 68 (13.1%) |
Employment Status by Educational Attainment in Orangeville
According to labor force statistics for Orangeville, 84.7% of individuals (370) out of the total population between 25 and 64 years of age (437) are in the labor force, with 10.5% or 39 of them being unemployed. The group with the highest labor force participation rate are those with the educational attainment of bachelor's degree or higher, with 100.0% or 84 individuals in the labor force. Within the labor force, individuals with less than high school education have the highest percentage of unemployment, with 34.8% or 8 of them being unemployed.
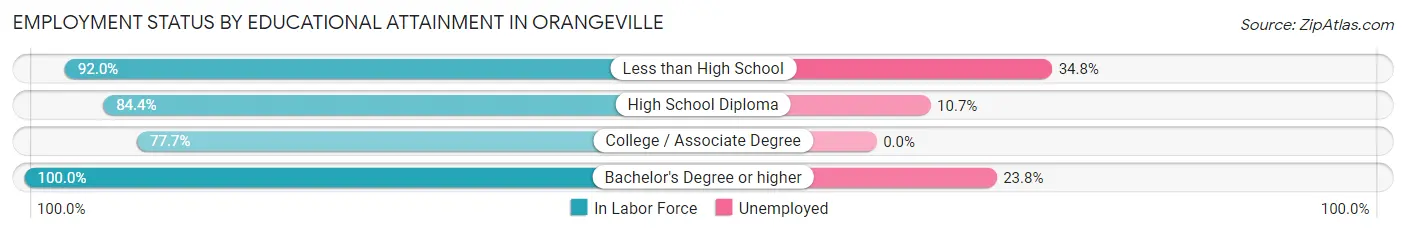
| Educational Attainment | In Labor Force | Unemployed |
| Less than High School | 23 (92.0%) | 9 (34.8%) |
| High School Diploma | 103 (84.4%) | 13 (10.7%) |
| College / Associate Degree | 160 (77.7%) | 0 (0.0%) |
| Bachelor's Degree or higher | 84 (100.0%) | 20 (23.8%) |
| Total | 370 (84.7%) | 46 (10.5%) |
Employment Occupations by Sex in Orangeville
Management, Business, Science and Arts Occupations
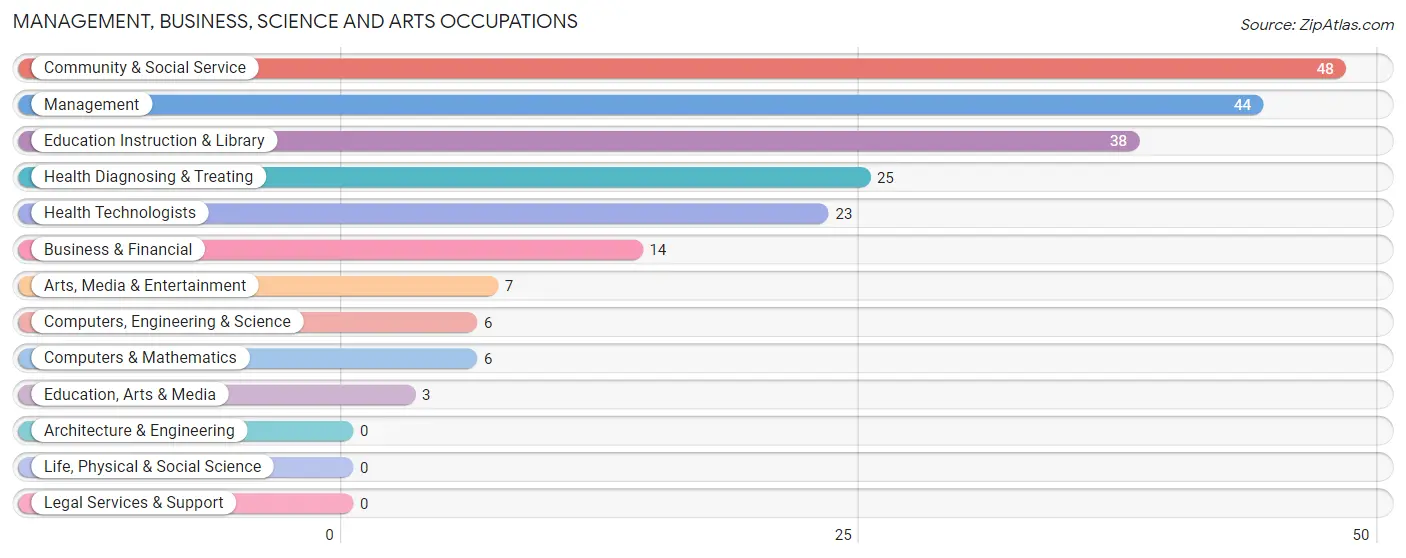
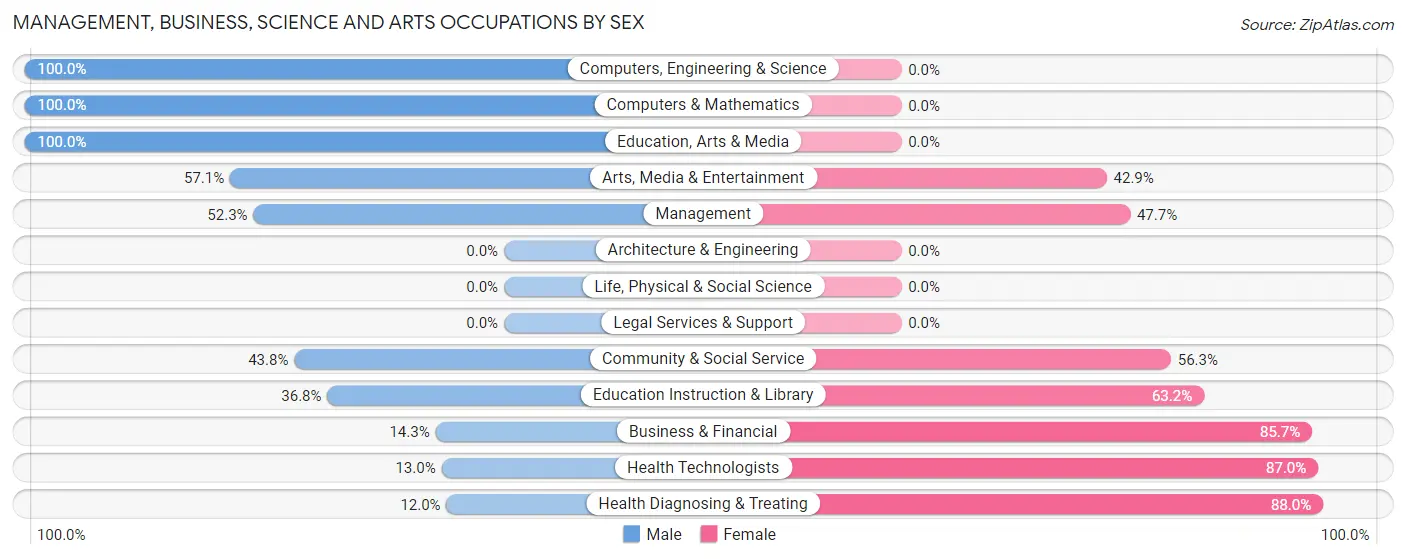
The most common Management, Business, Science and Arts occupations in Orangeville are Community & Social Service (48 | 10.6%), Management (44 | 9.8%), Education Instruction & Library (38 | 8.4%), Health Diagnosing & Treating (25 | 5.5%), and Health Technologists (23 | 5.1%).
Management, Business, Science and Arts Occupations by Sex
Within the Management, Business, Science and Arts occupations in Orangeville, the most male-oriented occupations are Computers, Engineering & Science (100.0%), Computers & Mathematics (100.0%), and Education, Arts & Media (100.0%), while the most female-oriented occupations are Health Diagnosing & Treating (88.0%), Health Technologists (87.0%), and Business & Financial (85.7%).
| Occupation | Male | Female |
| Management | 23 (52.3%) | 21 (47.7%) |
| Business & Financial | 2 (14.3%) | 12 (85.7%) |
| Computers, Engineering & Science | 6 (100.0%) | 0 (0.0%) |
| Computers & Mathematics | 6 (100.0%) | 0 (0.0%) |
| Architecture & Engineering | 0 (0.0%) | 0 (0.0%) |
| Life, Physical & Social Science | 0 (0.0%) | 0 (0.0%) |
| Community & Social Service | 21 (43.8%) | 27 (56.2%) |
| Education, Arts & Media | 3 (100.0%) | 0 (0.0%) |
| Legal Services & Support | 0 (0.0%) | 0 (0.0%) |
| Education Instruction & Library | 14 (36.8%) | 24 (63.2%) |
| Arts, Media & Entertainment | 4 (57.1%) | 3 (42.9%) |
| Health Diagnosing & Treating | 3 (12.0%) | 22 (88.0%) |
| Health Technologists | 3 (13.0%) | 20 (87.0%) |
| Total (Category) | 55 (40.2%) | 82 (59.9%) |
| Total (Overall) | 258 (57.2%) | 193 (42.8%) |
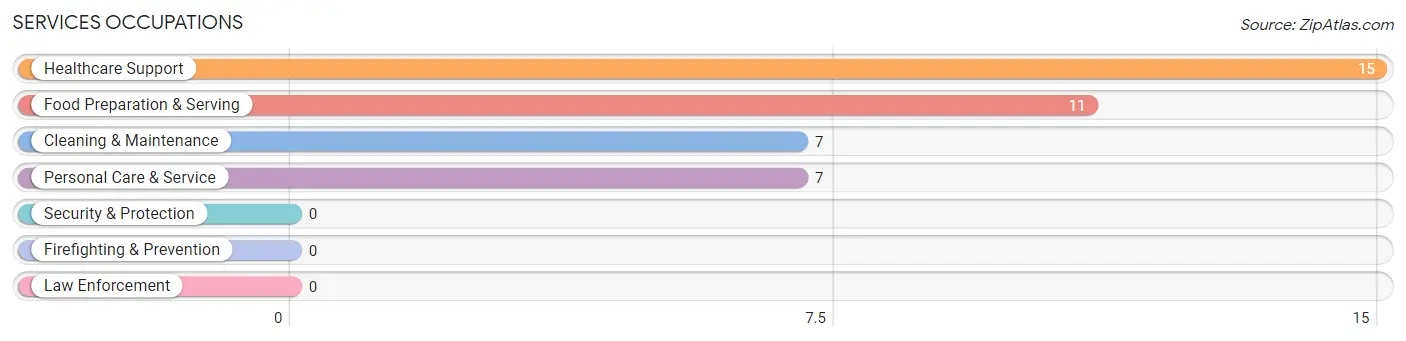
Services Occupations
The most common Services occupations in Orangeville are Healthcare Support (15 | 3.3%), Food Preparation & Serving (11 | 2.4%), Cleaning & Maintenance (7 | 1.5%), and Personal Care & Service (7 | 1.5%).
Services Occupations by Sex
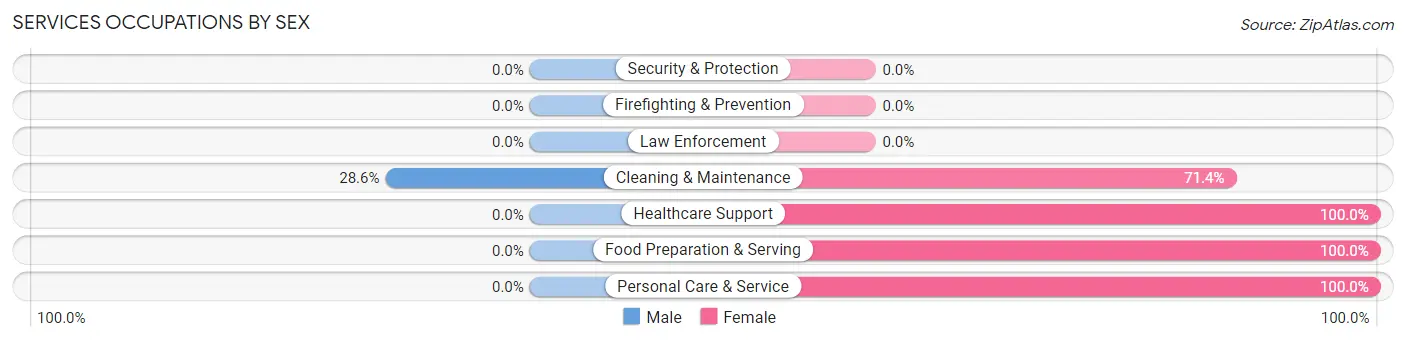
| Occupation | Male | Female |
| Healthcare Support | 0 (0.0%) | 15 (100.0%) |
| Security & Protection | 0 (0.0%) | 0 (0.0%) |
| Firefighting & Prevention | 0 (0.0%) | 0 (0.0%) |
| Law Enforcement | 0 (0.0%) | 0 (0.0%) |
| Food Preparation & Serving | 0 (0.0%) | 11 (100.0%) |
| Cleaning & Maintenance | 2 (28.6%) | 5 (71.4%) |
| Personal Care & Service | 0 (0.0%) | 7 (100.0%) |
| Total (Category) | 2 (5.0%) | 38 (95.0%) |
| Total (Overall) | 258 (57.2%) | 193 (42.8%) |
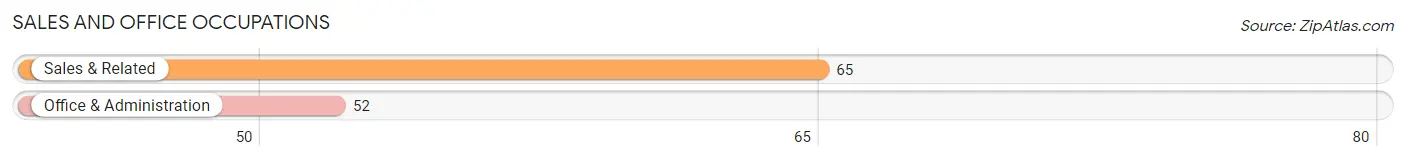
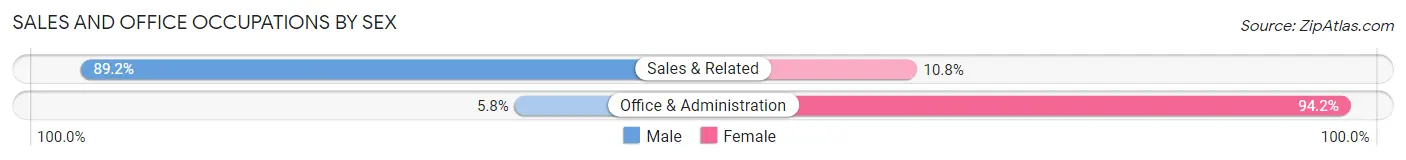
Sales and Office Occupations
The most common Sales and Office occupations in Orangeville are Sales & Related (65 | 14.4%), and Office & Administration (52 | 11.5%).
Sales and Office Occupations by Sex
| Occupation | Male | Female |
| Sales & Related | 58 (89.2%) | 7 (10.8%) |
| Office & Administration | 3 (5.8%) | 49 (94.2%) |
| Total (Category) | 61 (52.1%) | 56 (47.9%) |
| Total (Overall) | 258 (57.2%) | 193 (42.8%) |
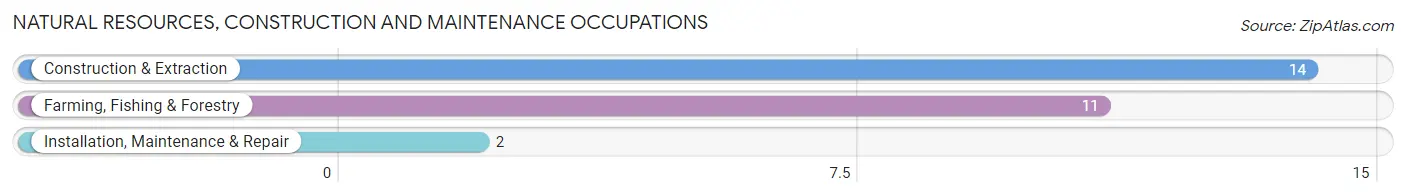
Natural Resources, Construction and Maintenance Occupations
The most common Natural Resources, Construction and Maintenance occupations in Orangeville are Construction & Extraction (14 | 3.1%), Farming, Fishing & Forestry (11 | 2.4%), and Installation, Maintenance & Repair (2 | 0.4%).
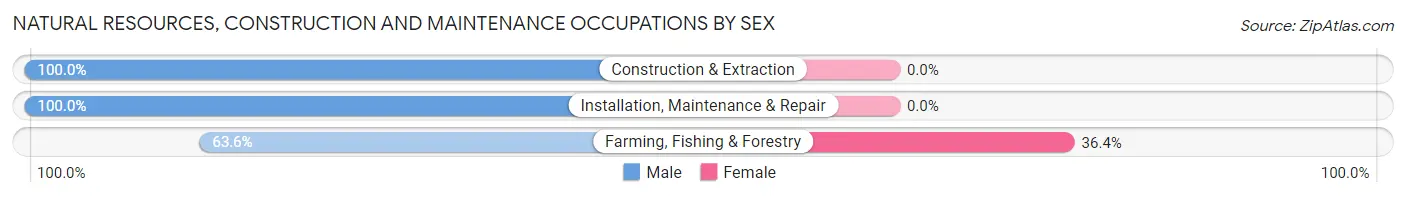
Natural Resources, Construction and Maintenance Occupations by Sex
| Occupation | Male | Female |
| Farming, Fishing & Forestry | 7 (63.6%) | 4 (36.4%) |
| Construction & Extraction | 14 (100.0%) | 0 (0.0%) |
| Installation, Maintenance & Repair | 2 (100.0%) | 0 (0.0%) |
| Total (Category) | 23 (85.2%) | 4 (14.8%) |
| Total (Overall) | 258 (57.2%) | 193 (42.8%) |
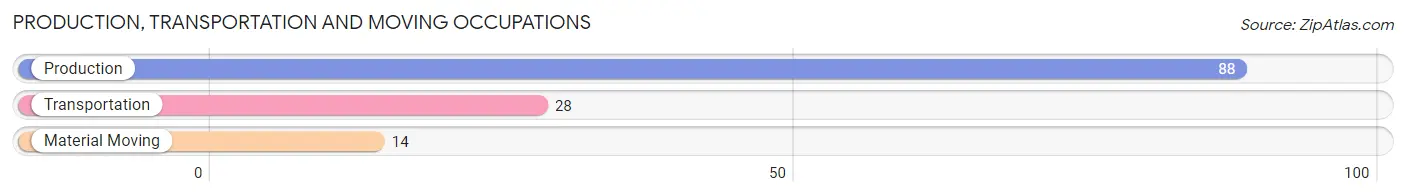
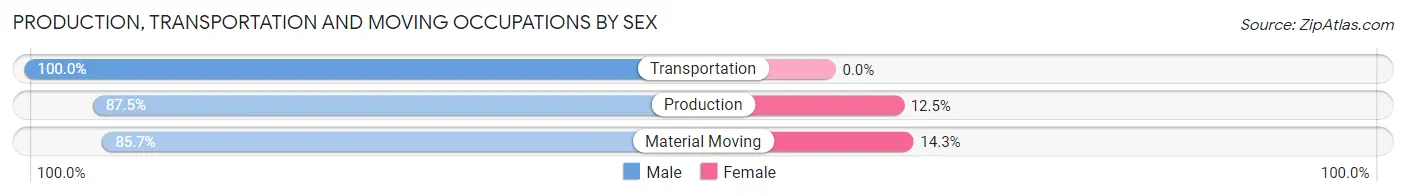
Production, Transportation and Moving Occupations
The most common Production, Transportation and Moving occupations in Orangeville are Production (88 | 19.5%), Transportation (28 | 6.2%), and Material Moving (14 | 3.1%).
Production, Transportation and Moving Occupations by Sex
| Occupation | Male | Female |
| Production | 77 (87.5%) | 11 (12.5%) |
| Transportation | 28 (100.0%) | 0 (0.0%) |
| Material Moving | 12 (85.7%) | 2 (14.3%) |
| Total (Category) | 117 (90.0%) | 13 (10.0%) |
| Total (Overall) | 258 (57.2%) | 193 (42.8%) |
Employment Industries by Sex in Orangeville
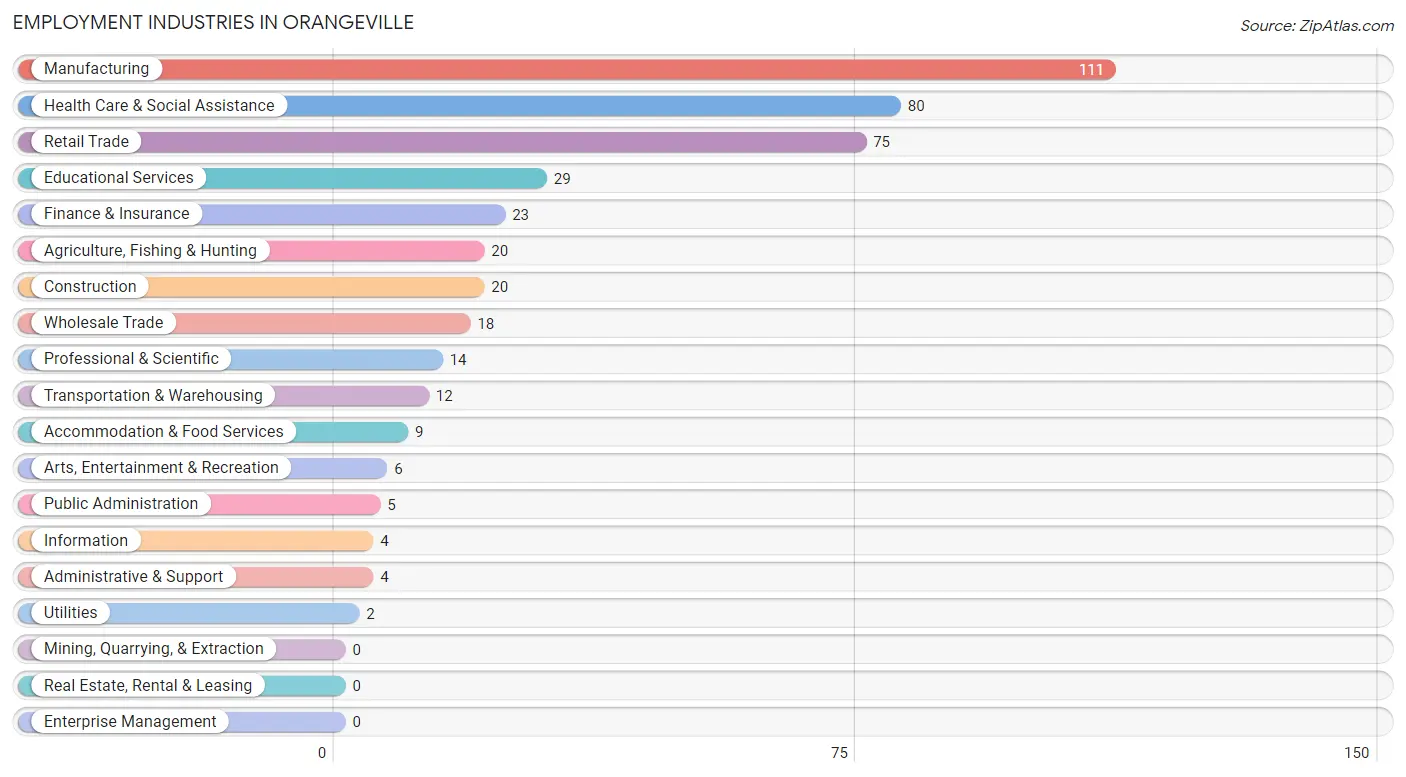
Employment Industries in Orangeville
The major employment industries in Orangeville include Manufacturing (111 | 24.6%), Health Care & Social Assistance (80 | 17.7%), Retail Trade (75 | 16.6%), Educational Services (29 | 6.4%), and Finance & Insurance (23 | 5.1%).
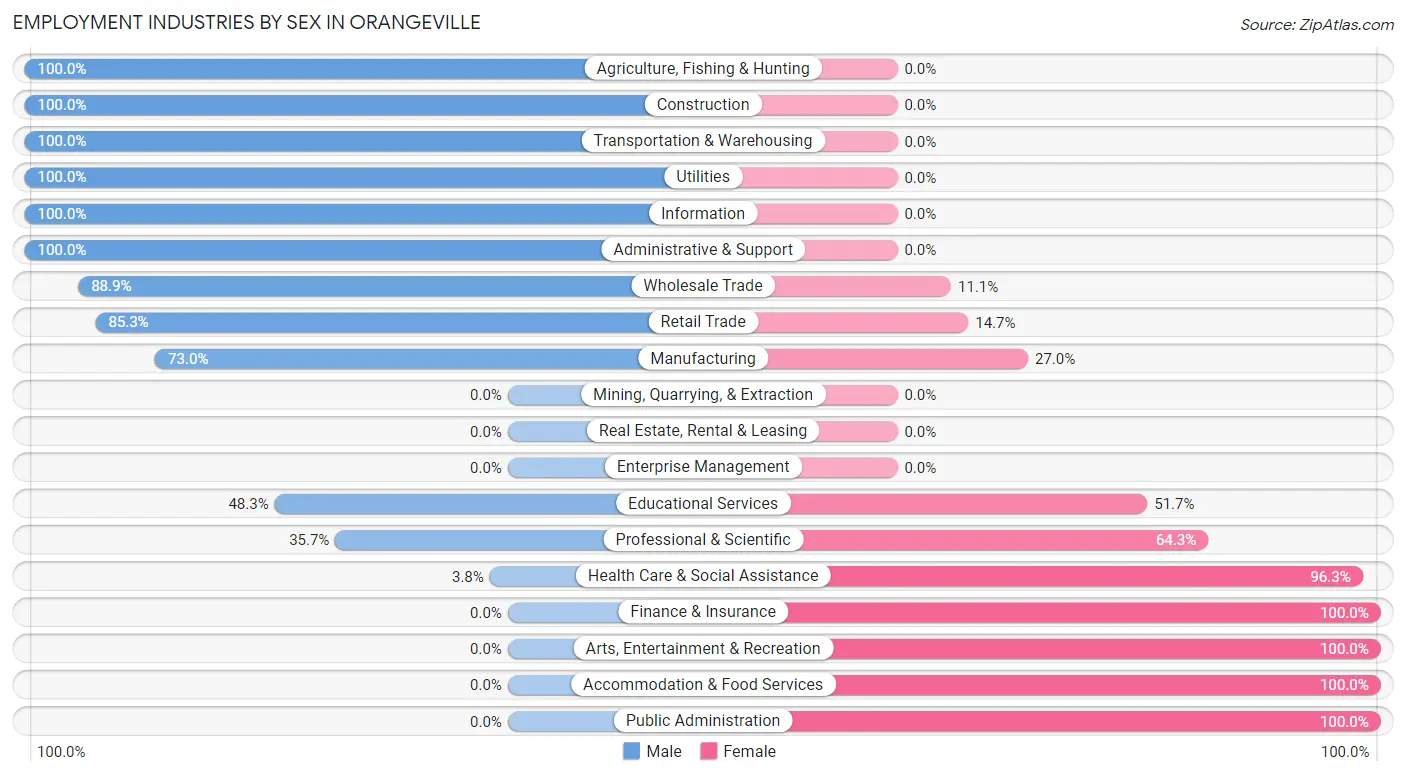
Employment Industries by Sex in Orangeville
The Orangeville industries that see more men than women are Agriculture, Fishing & Hunting (100.0%), Construction (100.0%), and Transportation & Warehousing (100.0%), whereas the industries that tend to have a higher number of women are Finance & Insurance (100.0%), Arts, Entertainment & Recreation (100.0%), and Accommodation & Food Services (100.0%).
| Industry | Male | Female |
| Agriculture, Fishing & Hunting | 20 (100.0%) | 0 (0.0%) |
| Mining, Quarrying, & Extraction | 0 (0.0%) | 0 (0.0%) |
| Construction | 20 (100.0%) | 0 (0.0%) |
| Manufacturing | 81 (73.0%) | 30 (27.0%) |
| Wholesale Trade | 16 (88.9%) | 2 (11.1%) |
| Retail Trade | 64 (85.3%) | 11 (14.7%) |
| Transportation & Warehousing | 12 (100.0%) | 0 (0.0%) |
| Utilities | 2 (100.0%) | 0 (0.0%) |
| Information | 4 (100.0%) | 0 (0.0%) |
| Finance & Insurance | 0 (0.0%) | 23 (100.0%) |
| Real Estate, Rental & Leasing | 0 (0.0%) | 0 (0.0%) |
| Professional & Scientific | 5 (35.7%) | 9 (64.3%) |
| Enterprise Management | 0 (0.0%) | 0 (0.0%) |
| Administrative & Support | 4 (100.0%) | 0 (0.0%) |
| Educational Services | 14 (48.3%) | 15 (51.7%) |
| Health Care & Social Assistance | 3 (3.7%) | 77 (96.3%) |
| Arts, Entertainment & Recreation | 0 (0.0%) | 6 (100.0%) |
| Accommodation & Food Services | 0 (0.0%) | 9 (100.0%) |
| Public Administration | 0 (0.0%) | 5 (100.0%) |
| Total | 258 (57.2%) | 193 (42.8%) |
Education in Orangeville
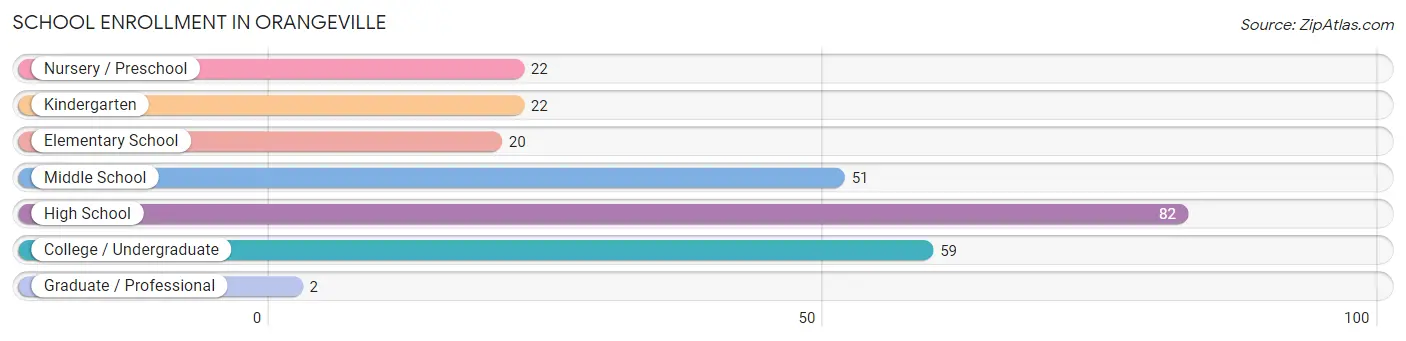
School Enrollment in Orangeville
The most common levels of schooling among the 258 students in Orangeville are high school (82 | 31.8%), college / undergraduate (59 | 22.9%), and middle school (51 | 19.8%).
| School Level | # Students | % Students |
| Nursery / Preschool | 22 | 8.5% |
| Kindergarten | 22 | 8.5% |
| Elementary School | 20 | 7.7% |
| Middle School | 51 | 19.8% |
| High School | 82 | 31.8% |
| College / Undergraduate | 59 | 22.9% |
| Graduate / Professional | 2 | 0.8% |
| Total | 258 | 100.0% |
School Enrollment by Age by Funding Source in Orangeville
Out of a total of 258 students who are enrolled in schools in Orangeville, 12 (4.7%) attend a private institution, while the remaining 246 (95.3%) are enrolled in public schools. The age group of 5 to 9 year old has the highest likelihood of being enrolled in private schools, with 10 (23.8% in the age bracket) enrolled. Conversely, the age group of 3 to 4 year olds has the lowest likelihood of being enrolled in a private school, with 17 (100.0% in the age bracket) attending a public institution.
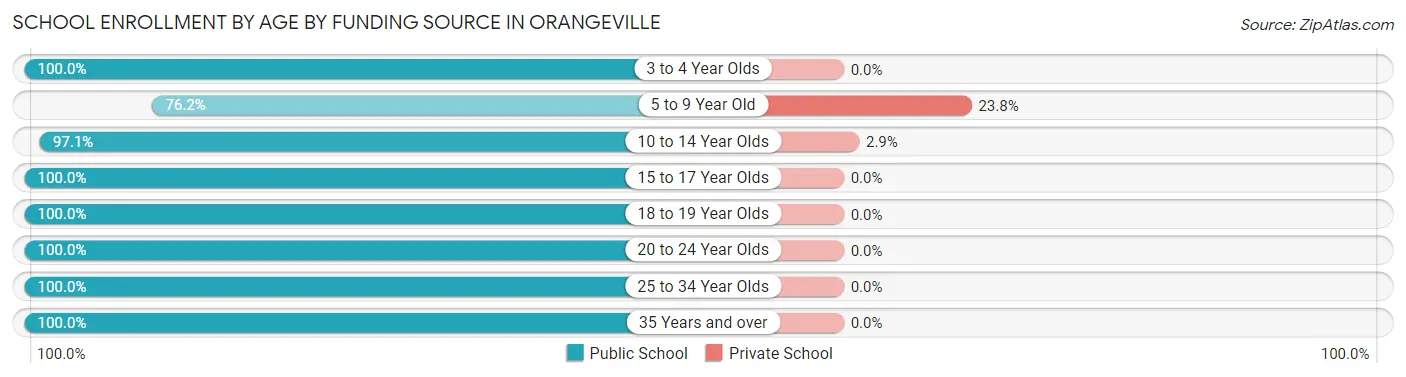
| Age Bracket | Public School | Private School |
| 3 to 4 Year Olds | 17 (100.0%) | 0 (0.0%) |
| 5 to 9 Year Old | 32 (76.2%) | 10 (23.8%) |
| 10 to 14 Year Olds | 68 (97.1%) | 2 (2.9%) |
| 15 to 17 Year Olds | 66 (100.0%) | 0 (0.0%) |
| 18 to 19 Year Olds | 36 (100.0%) | 0 (0.0%) |
| 20 to 24 Year Olds | 11 (100.0%) | 0 (0.0%) |
| 25 to 34 Year Olds | 6 (100.0%) | 0 (0.0%) |
| 35 Years and over | 10 (100.0%) | 0 (0.0%) |
| Total | 246 (95.3%) | 12 (4.7%) |
Educational Attainment by Field of Study in Orangeville
Bio, nature & agricultural (27 | 26.2%), business (25 | 24.3%), education (23 | 22.3%), science & technology (10 | 9.7%), and social sciences (5 | 4.9%) are the most common fields of study among 103 individuals in Orangeville who have obtained a bachelor's degree or higher.
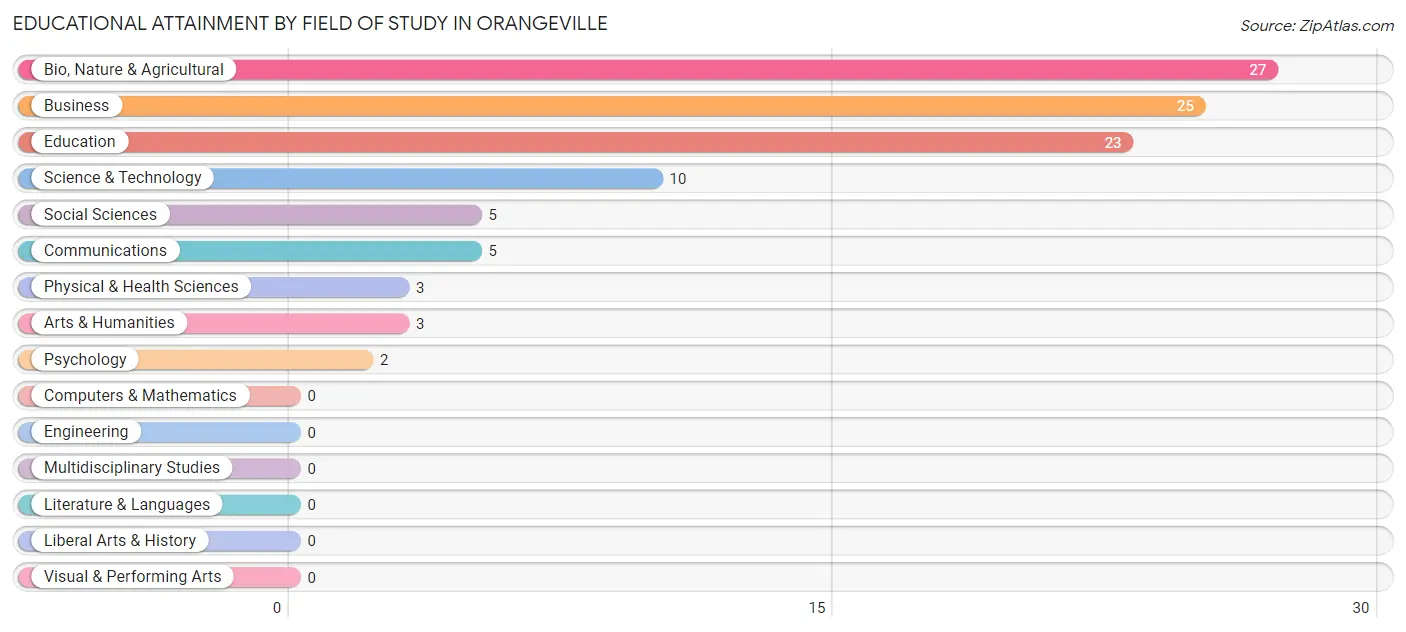
| Field of Study | # Graduates | % Graduates |
| Computers & Mathematics | 0 | 0.0% |
| Bio, Nature & Agricultural | 27 | 26.2% |
| Physical & Health Sciences | 3 | 2.9% |
| Psychology | 2 | 1.9% |
| Social Sciences | 5 | 4.9% |
| Engineering | 0 | 0.0% |
| Multidisciplinary Studies | 0 | 0.0% |
| Science & Technology | 10 | 9.7% |
| Business | 25 | 24.3% |
| Education | 23 | 22.3% |
| Literature & Languages | 0 | 0.0% |
| Liberal Arts & History | 0 | 0.0% |
| Visual & Performing Arts | 0 | 0.0% |
| Communications | 5 | 4.9% |
| Arts & Humanities | 3 | 2.9% |
| Total | 103 | 100.0% |
Transportation & Commute in Orangeville
Vehicle Availability by Sex in Orangeville
The most prevalent vehicle ownership categories in Orangeville are males with 2 vehicles (96, accounting for 39.2%) and females with 2 vehicles (96, making up 51.1%).
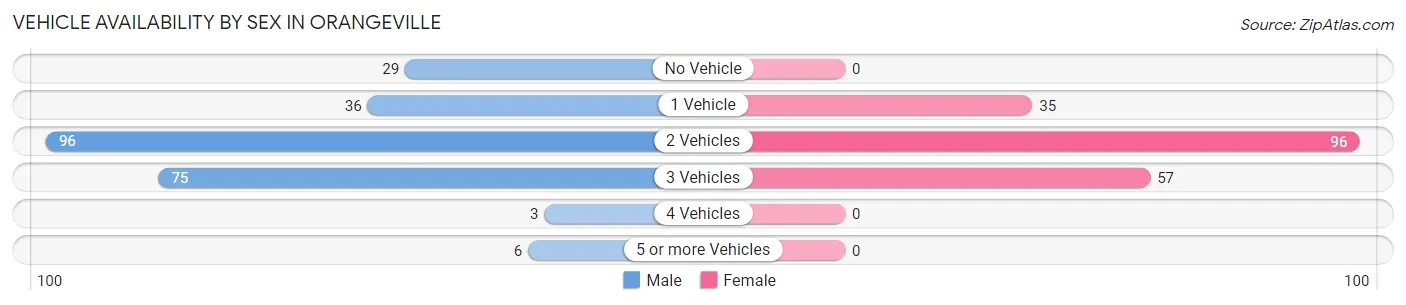
| Vehicles Available | Male | Female |
| No Vehicle | 29 (11.8%) | 0 (0.0%) |
| 1 Vehicle | 36 (14.7%) | 35 (18.6%) |
| 2 Vehicles | 96 (39.2%) | 96 (51.1%) |
| 3 Vehicles | 75 (30.6%) | 57 (30.3%) |
| 4 Vehicles | 3 (1.2%) | 0 (0.0%) |
| 5 or more Vehicles | 6 (2.5%) | 0 (0.0%) |
| Total | 245 (100.0%) | 188 (100.0%) |
Commute Time in Orangeville
The most frequently occuring commute durations in Orangeville are 20 to 24 minutes (140 commuters, 33.8%), 15 to 19 minutes (87 commuters, 21.0%), and 25 to 29 minutes (49 commuters, 11.8%).
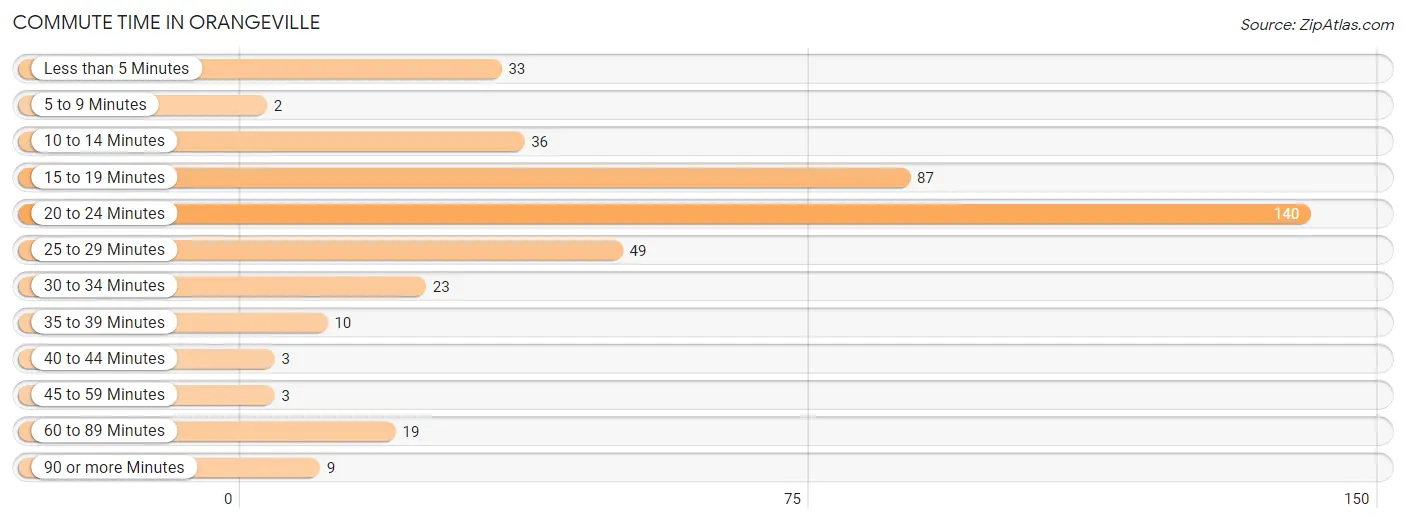
| Commute Time | # Commuters | % Commuters |
| Less than 5 Minutes | 33 | 8.0% |
| 5 to 9 Minutes | 2 | 0.5% |
| 10 to 14 Minutes | 36 | 8.7% |
| 15 to 19 Minutes | 87 | 21.0% |
| 20 to 24 Minutes | 140 | 33.8% |
| 25 to 29 Minutes | 49 | 11.8% |
| 30 to 34 Minutes | 23 | 5.6% |
| 35 to 39 Minutes | 10 | 2.4% |
| 40 to 44 Minutes | 3 | 0.7% |
| 45 to 59 Minutes | 3 | 0.7% |
| 60 to 89 Minutes | 19 | 4.6% |
| 90 or more Minutes | 9 | 2.2% |
Commute Time by Sex in Orangeville
The most common commute times in Orangeville are 20 to 24 minutes (57 commuters, 24.3%) for males and 20 to 24 minutes (83 commuters, 46.4%) for females.
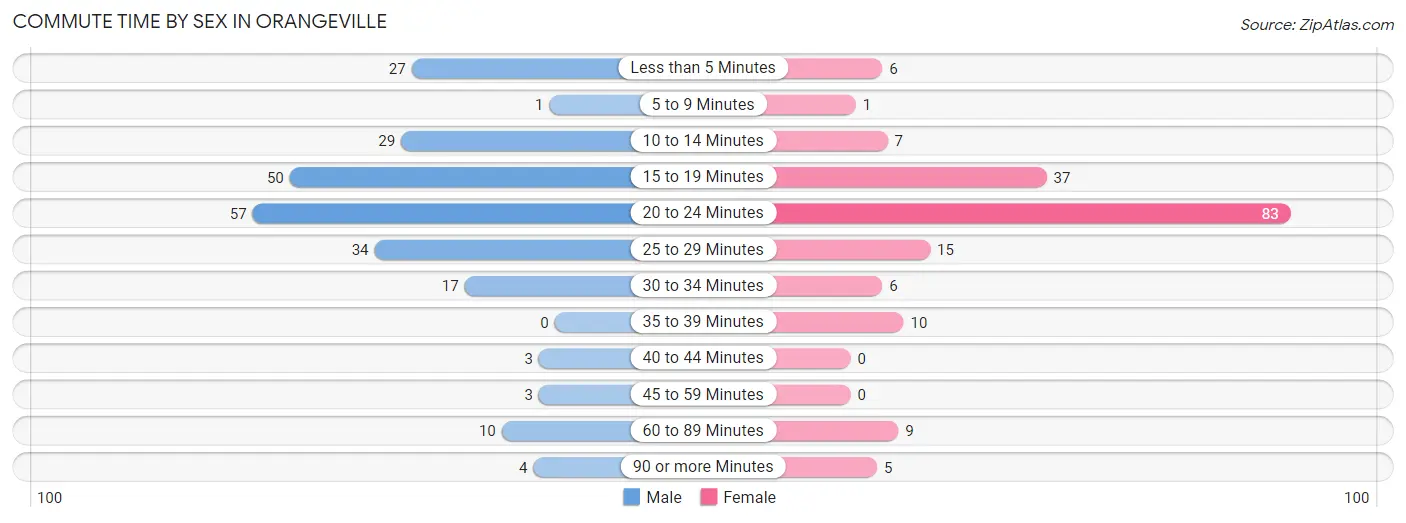
| Commute Time | Male | Female |
| Less than 5 Minutes | 27 (11.5%) | 6 (3.4%) |
| 5 to 9 Minutes | 1 (0.4%) | 1 (0.6%) |
| 10 to 14 Minutes | 29 (12.3%) | 7 (3.9%) |
| 15 to 19 Minutes | 50 (21.3%) | 37 (20.7%) |
| 20 to 24 Minutes | 57 (24.3%) | 83 (46.4%) |
| 25 to 29 Minutes | 34 (14.5%) | 15 (8.4%) |
| 30 to 34 Minutes | 17 (7.2%) | 6 (3.4%) |
| 35 to 39 Minutes | 0 (0.0%) | 10 (5.6%) |
| 40 to 44 Minutes | 3 (1.3%) | 0 (0.0%) |
| 45 to 59 Minutes | 3 (1.3%) | 0 (0.0%) |
| 60 to 89 Minutes | 10 (4.3%) | 9 (5.0%) |
| 90 or more Minutes | 4 (1.7%) | 5 (2.8%) |
Time of Departure to Work by Sex in Orangeville
The most frequent times of departure to work in Orangeville are 6:00 AM to 6:29 AM (44, 18.7%) for males and 7:30 AM to 7:59 AM (41, 22.9%) for females.
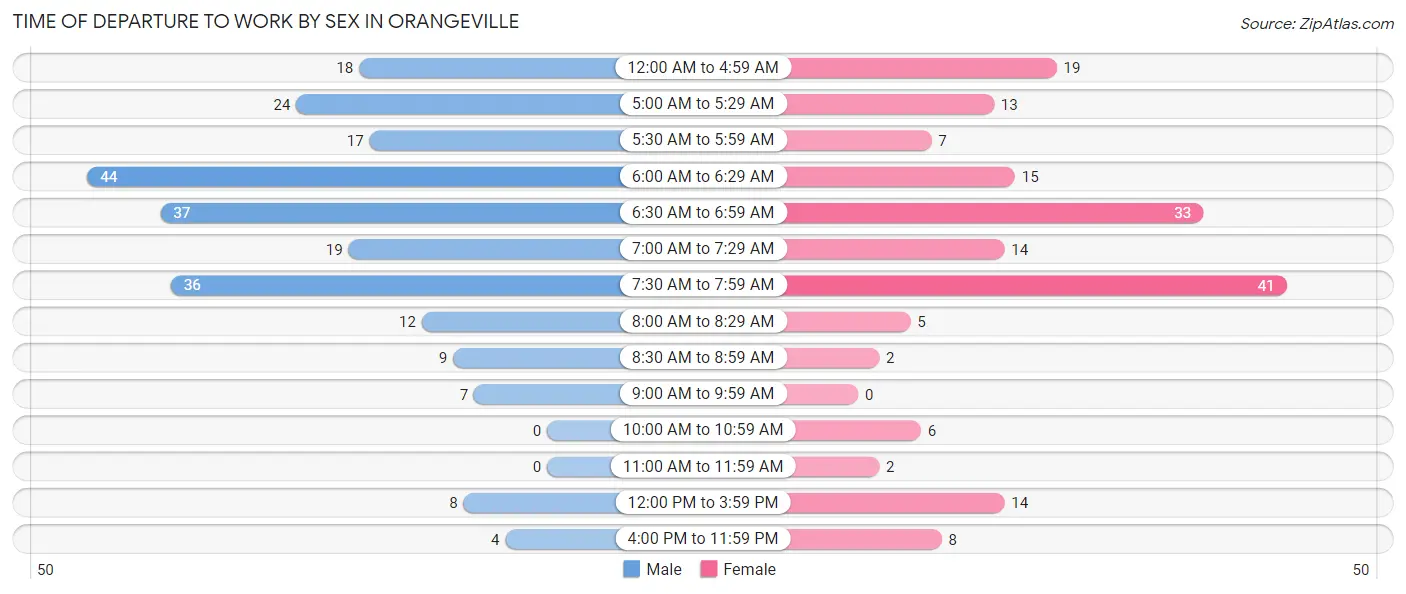
| Time of Departure | Male | Female |
| 12:00 AM to 4:59 AM | 18 (7.7%) | 19 (10.6%) |
| 5:00 AM to 5:29 AM | 24 (10.2%) | 13 (7.3%) |
| 5:30 AM to 5:59 AM | 17 (7.2%) | 7 (3.9%) |
| 6:00 AM to 6:29 AM | 44 (18.7%) | 15 (8.4%) |
| 6:30 AM to 6:59 AM | 37 (15.7%) | 33 (18.4%) |
| 7:00 AM to 7:29 AM | 19 (8.1%) | 14 (7.8%) |
| 7:30 AM to 7:59 AM | 36 (15.3%) | 41 (22.9%) |
| 8:00 AM to 8:29 AM | 12 (5.1%) | 5 (2.8%) |
| 8:30 AM to 8:59 AM | 9 (3.8%) | 2 (1.1%) |
| 9:00 AM to 9:59 AM | 7 (3.0%) | 0 (0.0%) |
| 10:00 AM to 10:59 AM | 0 (0.0%) | 6 (3.4%) |
| 11:00 AM to 11:59 AM | 0 (0.0%) | 2 (1.1%) |
| 12:00 PM to 3:59 PM | 8 (3.4%) | 14 (7.8%) |
| 4:00 PM to 11:59 PM | 4 (1.7%) | 8 (4.5%) |
| Total | 235 (100.0%) | 179 (100.0%) |
Housing Occupancy in Orangeville
Occupancy by Ownership in Orangeville
Of the total 374 dwellings in Orangeville, owner-occupied units account for 285 (76.2%), while renter-occupied units make up 89 (23.8%).
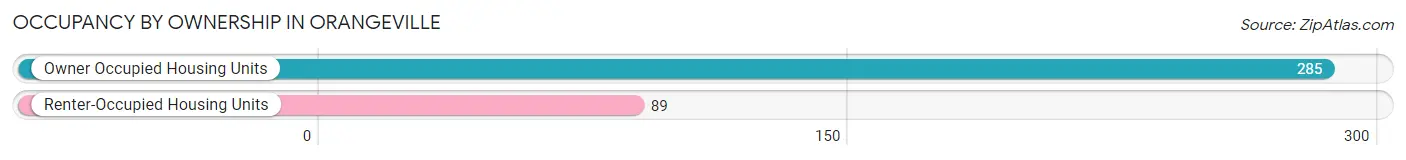
| Occupancy | # Housing Units | % Housing Units |
| Owner Occupied Housing Units | 285 | 76.2% |
| Renter-Occupied Housing Units | 89 | 23.8% |
| Total Occupied Housing Units | 374 | 100.0% |
Occupancy by Household Size in Orangeville
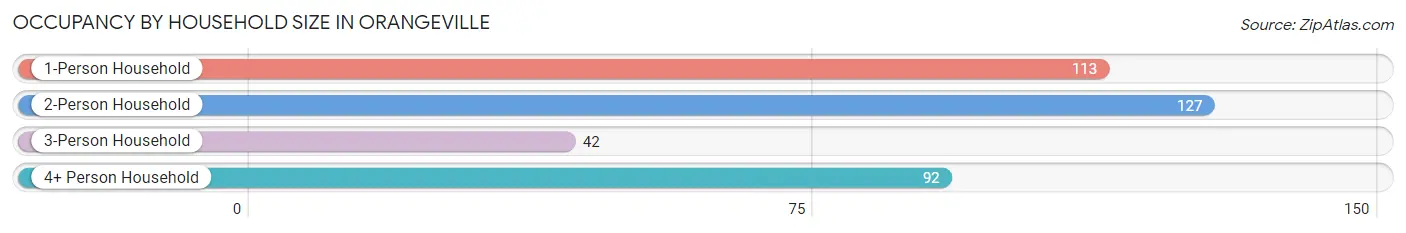
| Household Size | # Housing Units | % Housing Units |
| 1-Person Household | 113 | 30.2% |
| 2-Person Household | 127 | 34.0% |
| 3-Person Household | 42 | 11.2% |
| 4+ Person Household | 92 | 24.6% |
| Total Housing Units | 374 | 100.0% |
Occupancy by Ownership by Household Size in Orangeville
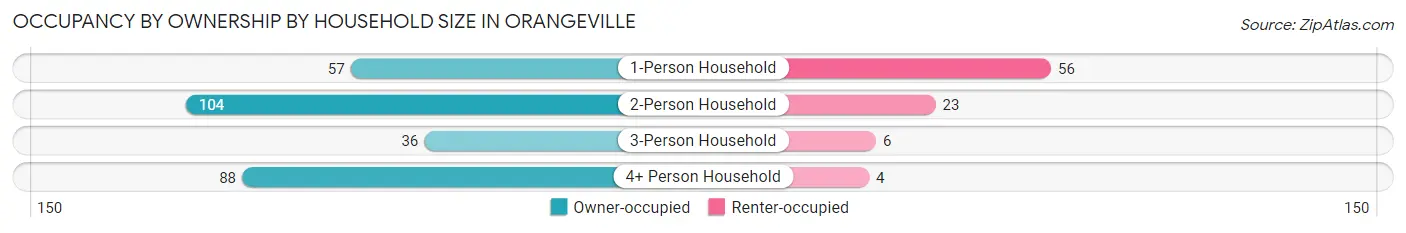
| Household Size | Owner-occupied | Renter-occupied |
| 1-Person Household | 57 (50.4%) | 56 (49.6%) |
| 2-Person Household | 104 (81.9%) | 23 (18.1%) |
| 3-Person Household | 36 (85.7%) | 6 (14.3%) |
| 4+ Person Household | 88 (95.7%) | 4 (4.3%) |
| Total Housing Units | 285 (76.2%) | 89 (23.8%) |
Occupancy by Educational Attainment in Orangeville
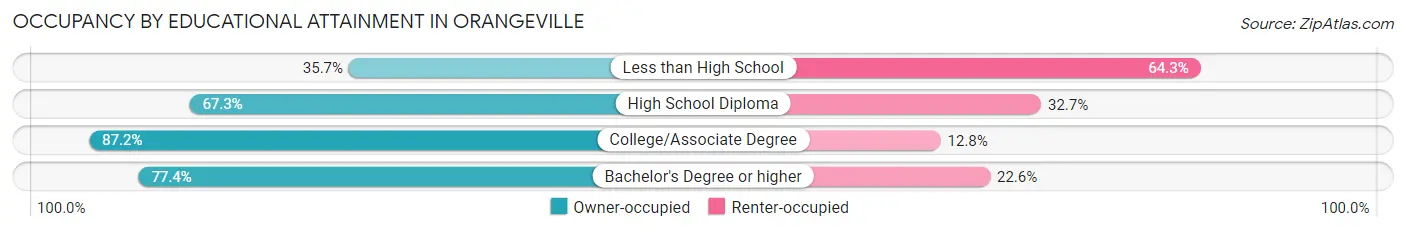
| Household Size | Owner-occupied | Renter-occupied |
| Less than High School | 10 (35.7%) | 18 (64.3%) |
| High School Diploma | 70 (67.3%) | 34 (32.7%) |
| College/Associate Degree | 157 (87.2%) | 23 (12.8%) |
| Bachelor's Degree or higher | 48 (77.4%) | 14 (22.6%) |
Occupancy by Age of Householder in Orangeville
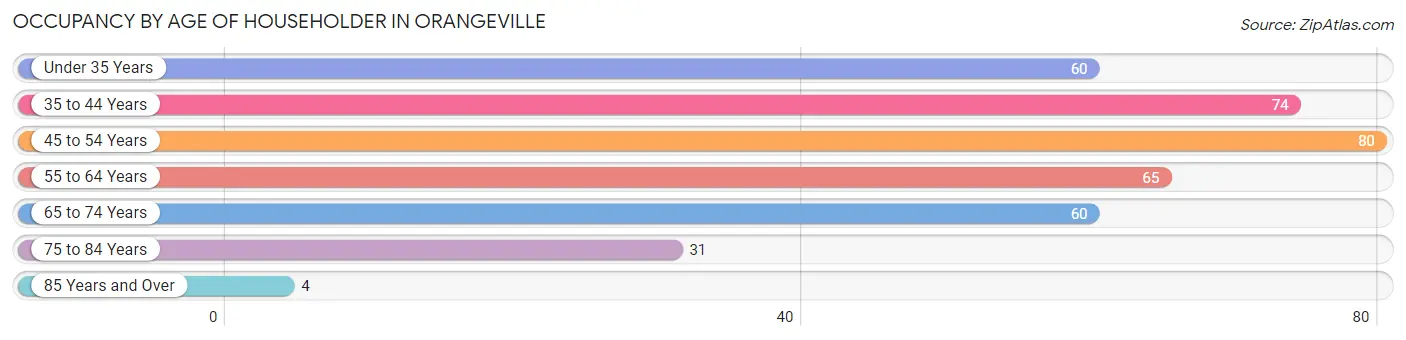
| Age Bracket | # Households | % Households |
| Under 35 Years | 60 | 16.0% |
| 35 to 44 Years | 74 | 19.8% |
| 45 to 54 Years | 80 | 21.4% |
| 55 to 64 Years | 65 | 17.4% |
| 65 to 74 Years | 60 | 16.0% |
| 75 to 84 Years | 31 | 8.3% |
| 85 Years and Over | 4 | 1.1% |
| Total | 374 | 100.0% |
Housing Finances in Orangeville
Median Income by Occupancy in Orangeville
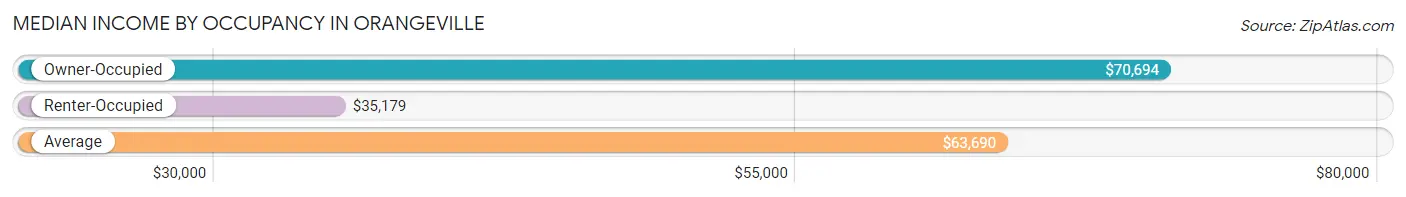
| Occupancy Type | # Households | Median Income |
| Owner-Occupied | 285 (76.2%) | $70,694 |
| Renter-Occupied | 89 (23.8%) | $35,179 |
| Average | 374 (100.0%) | $63,690 |
Occupancy by Householder Income Bracket in Orangeville
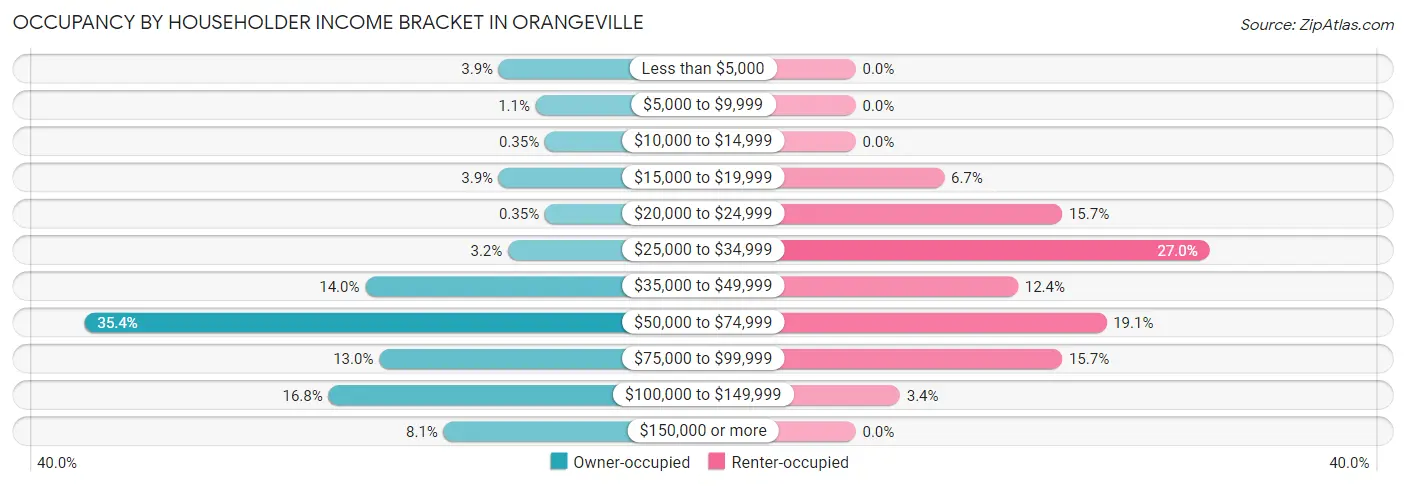
| Income Bracket | Owner-occupied | Renter-occupied |
| Less than $5,000 | 11 (3.9%) | 0 (0.0%) |
| $5,000 to $9,999 | 3 (1.1%) | 0 (0.0%) |
| $10,000 to $14,999 | 1 (0.4%) | 0 (0.0%) |
| $15,000 to $19,999 | 11 (3.9%) | 6 (6.7%) |
| $20,000 to $24,999 | 1 (0.4%) | 14 (15.7%) |
| $25,000 to $34,999 | 9 (3.2%) | 24 (27.0%) |
| $35,000 to $49,999 | 40 (14.0%) | 11 (12.4%) |
| $50,000 to $74,999 | 101 (35.4%) | 17 (19.1%) |
| $75,000 to $99,999 | 37 (13.0%) | 14 (15.7%) |
| $100,000 to $149,999 | 48 (16.8%) | 3 (3.4%) |
| $150,000 or more | 23 (8.1%) | 0 (0.0%) |
| Total | 285 (100.0%) | 89 (100.0%) |
Monthly Housing Cost Tiers in Orangeville
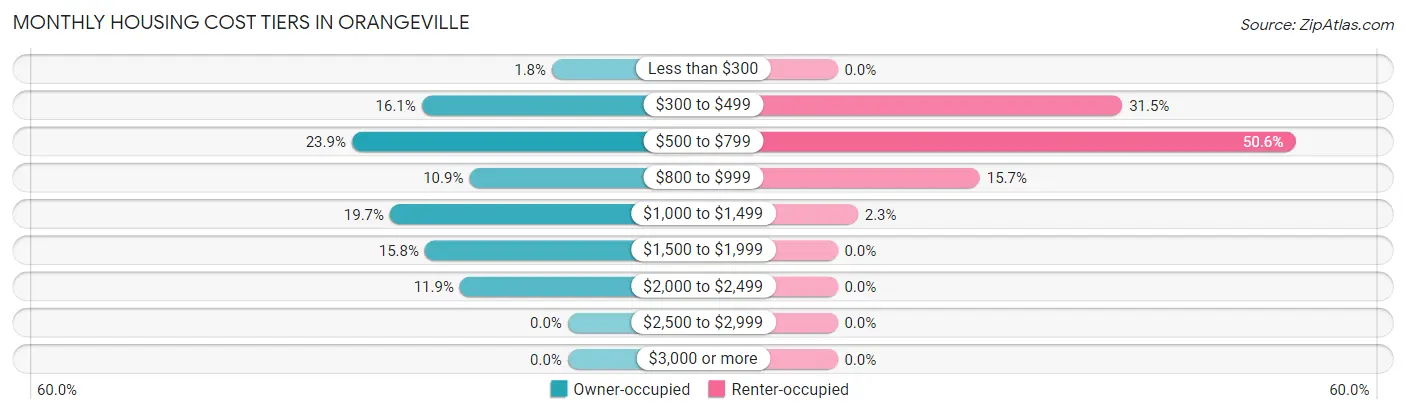
| Monthly Cost | Owner-occupied | Renter-occupied |
| Less than $300 | 5 (1.8%) | 0 (0.0%) |
| $300 to $499 | 46 (16.1%) | 28 (31.5%) |
| $500 to $799 | 68 (23.9%) | 45 (50.6%) |
| $800 to $999 | 31 (10.9%) | 14 (15.7%) |
| $1,000 to $1,499 | 56 (19.7%) | 2 (2.2%) |
| $1,500 to $1,999 | 45 (15.8%) | 0 (0.0%) |
| $2,000 to $2,499 | 34 (11.9%) | 0 (0.0%) |
| $2,500 to $2,999 | 0 (0.0%) | 0 (0.0%) |
| $3,000 or more | 0 (0.0%) | 0 (0.0%) |
| Total | 285 (100.0%) | 89 (100.0%) |
Physical Housing Characteristics in Orangeville
Housing Structures in Orangeville
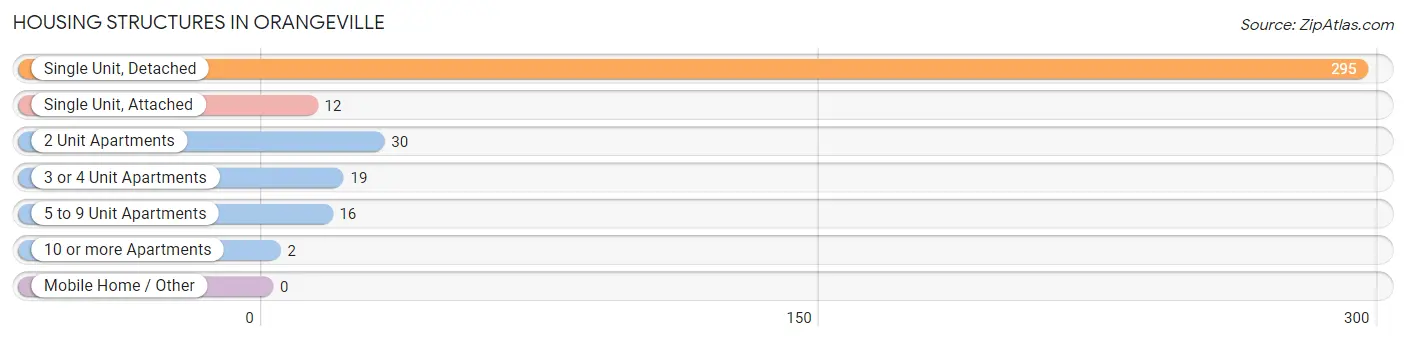
| Structure Type | # Housing Units | % Housing Units |
| Single Unit, Detached | 295 | 78.9% |
| Single Unit, Attached | 12 | 3.2% |
| 2 Unit Apartments | 30 | 8.0% |
| 3 or 4 Unit Apartments | 19 | 5.1% |
| 5 to 9 Unit Apartments | 16 | 4.3% |
| 10 or more Apartments | 2 | 0.5% |
| Mobile Home / Other | 0 | 0.0% |
| Total | 374 | 100.0% |
Housing Structures by Occupancy in Orangeville
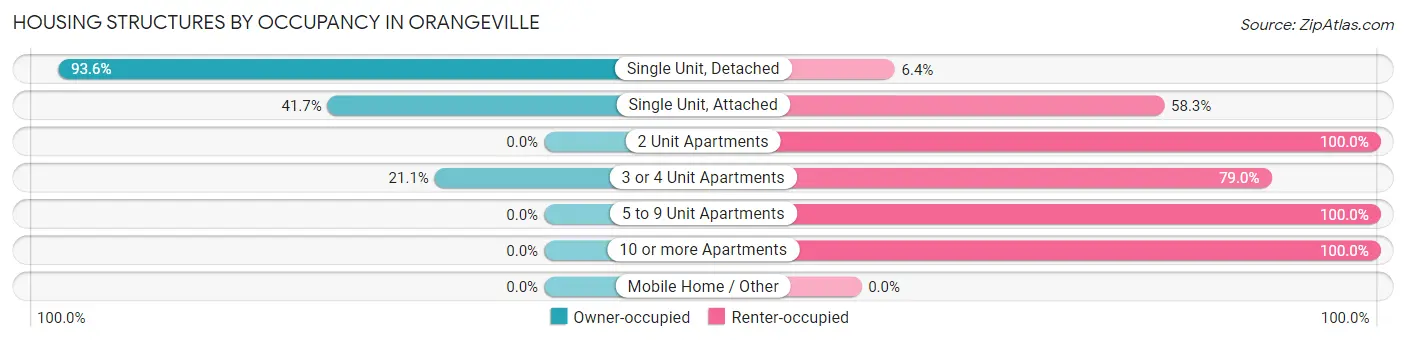
| Structure Type | Owner-occupied | Renter-occupied |
| Single Unit, Detached | 276 (93.6%) | 19 (6.4%) |
| Single Unit, Attached | 5 (41.7%) | 7 (58.3%) |
| 2 Unit Apartments | 0 (0.0%) | 30 (100.0%) |
| 3 or 4 Unit Apartments | 4 (21.0%) | 15 (78.9%) |
| 5 to 9 Unit Apartments | 0 (0.0%) | 16 (100.0%) |
| 10 or more Apartments | 0 (0.0%) | 2 (100.0%) |
| Mobile Home / Other | 0 (0.0%) | 0 (0.0%) |
| Total | 285 (76.2%) | 89 (23.8%) |
Housing Structures by Number of Rooms in Orangeville
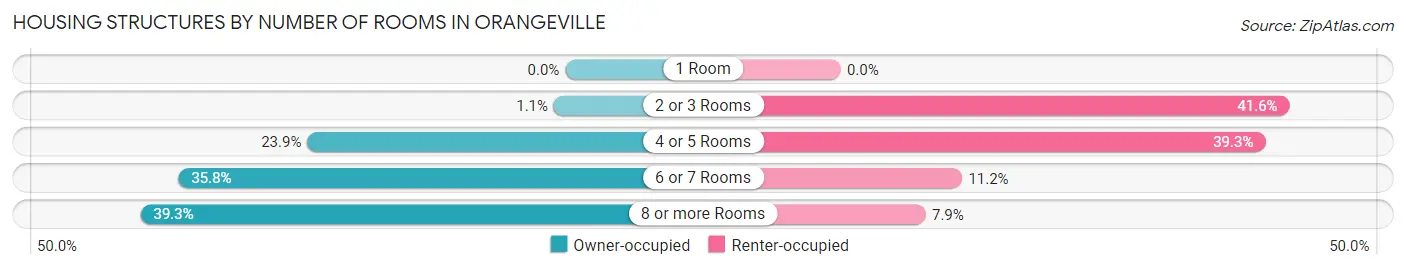
| Number of Rooms | Owner-occupied | Renter-occupied |
| 1 Room | 0 (0.0%) | 0 (0.0%) |
| 2 or 3 Rooms | 3 (1.1%) | 37 (41.6%) |
| 4 or 5 Rooms | 68 (23.9%) | 35 (39.3%) |
| 6 or 7 Rooms | 102 (35.8%) | 10 (11.2%) |
| 8 or more Rooms | 112 (39.3%) | 7 (7.9%) |
| Total | 285 (100.0%) | 89 (100.0%) |
Housing Structure by Heating Type in Orangeville
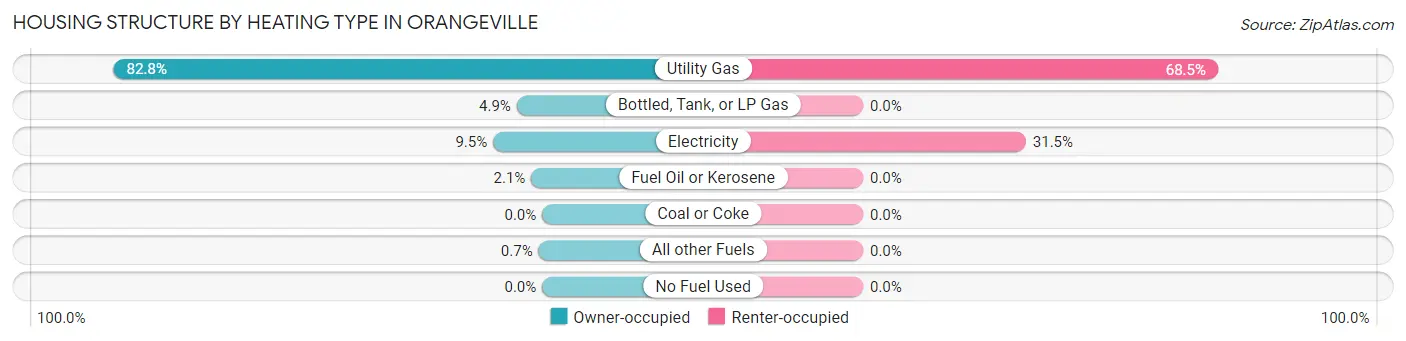
| Heating Type | Owner-occupied | Renter-occupied |
| Utility Gas | 236 (82.8%) | 61 (68.5%) |
| Bottled, Tank, or LP Gas | 14 (4.9%) | 0 (0.0%) |
| Electricity | 27 (9.5%) | 28 (31.5%) |
| Fuel Oil or Kerosene | 6 (2.1%) | 0 (0.0%) |
| Coal or Coke | 0 (0.0%) | 0 (0.0%) |
| All other Fuels | 2 (0.7%) | 0 (0.0%) |
| No Fuel Used | 0 (0.0%) | 0 (0.0%) |
| Total | 285 (100.0%) | 89 (100.0%) |
Household Vehicle Usage in Orangeville
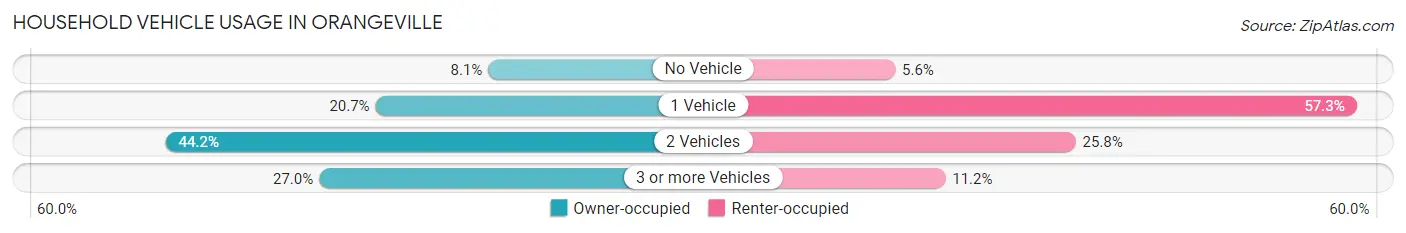
| Vehicles per Household | Owner-occupied | Renter-occupied |
| No Vehicle | 23 (8.1%) | 5 (5.6%) |
| 1 Vehicle | 59 (20.7%) | 51 (57.3%) |
| 2 Vehicles | 126 (44.2%) | 23 (25.8%) |
| 3 or more Vehicles | 77 (27.0%) | 10 (11.2%) |
| Total | 285 (100.0%) | 89 (100.0%) |
Real Estate & Mortgages in Orangeville
Real Estate and Mortgage Overview in Orangeville
| Characteristic | Without Mortgage | With Mortgage |
| Housing Units | 97 | 188 |
| Median Property Value | $123,900 | $138,200 |
| Median Household Income | $56,250 | $18 |
| Monthly Housing Costs | $498 | $0 |
| Real Estate Taxes | $2,813 | $2 |
Property Value by Mortgage Status in Orangeville
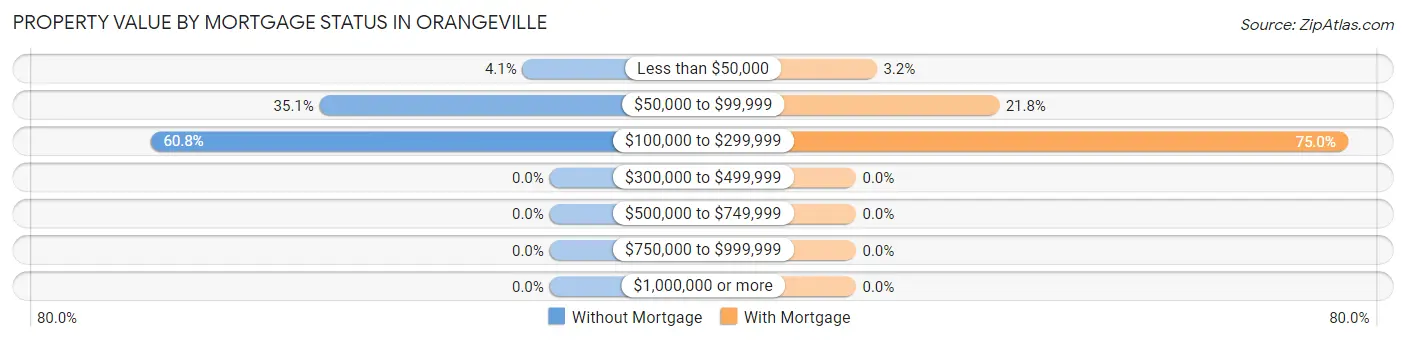
| Property Value | Without Mortgage | With Mortgage |
| Less than $50,000 | 4 (4.1%) | 6 (3.2%) |
| $50,000 to $99,999 | 34 (35.0%) | 41 (21.8%) |
| $100,000 to $299,999 | 59 (60.8%) | 141 (75.0%) |
| $300,000 to $499,999 | 0 (0.0%) | 0 (0.0%) |
| $500,000 to $749,999 | 0 (0.0%) | 0 (0.0%) |
| $750,000 to $999,999 | 0 (0.0%) | 0 (0.0%) |
| $1,000,000 or more | 0 (0.0%) | 0 (0.0%) |
| Total | 97 (100.0%) | 188 (100.0%) |
Household Income by Mortgage Status in Orangeville
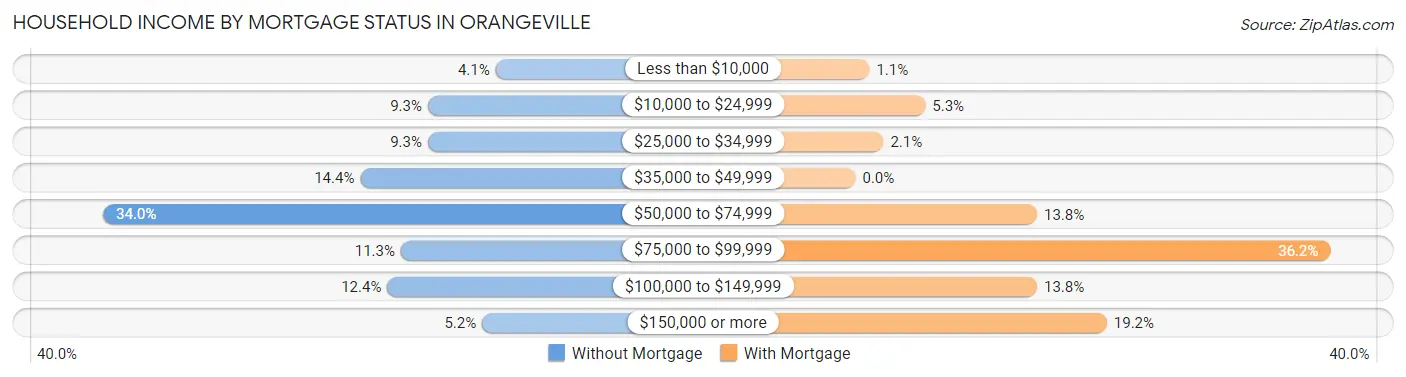
| Household Income | Without Mortgage | With Mortgage |
| Less than $10,000 | 4 (4.1%) | 2 (1.1%) |
| $10,000 to $24,999 | 9 (9.3%) | 10 (5.3%) |
| $25,000 to $34,999 | 9 (9.3%) | 4 (2.1%) |
| $35,000 to $49,999 | 14 (14.4%) | 0 (0.0%) |
| $50,000 to $74,999 | 33 (34.0%) | 26 (13.8%) |
| $75,000 to $99,999 | 11 (11.3%) | 68 (36.2%) |
| $100,000 to $149,999 | 12 (12.4%) | 26 (13.8%) |
| $150,000 or more | 5 (5.1%) | 36 (19.2%) |
| Total | 97 (100.0%) | 188 (100.0%) |
Property Value to Household Income Ratio in Orangeville
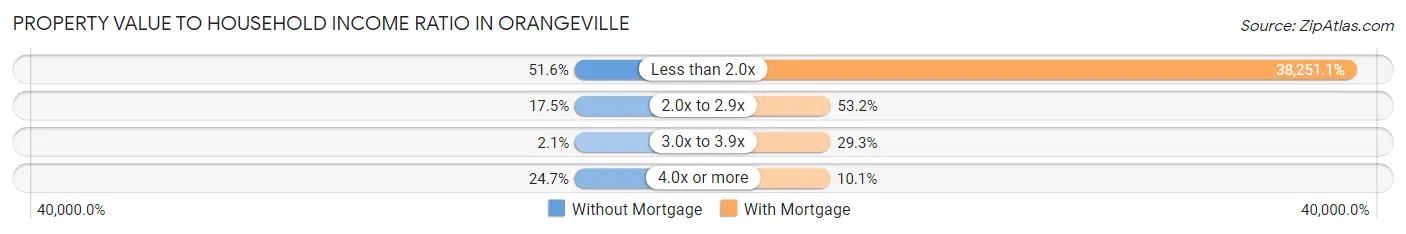
| Value-to-Income Ratio | Without Mortgage | With Mortgage |
| Less than 2.0x | 50 (51.5%) | 71,912 (38,251.1%) |
| 2.0x to 2.9x | 17 (17.5%) | 100 (53.2%) |
| 3.0x to 3.9x | 2 (2.1%) | 55 (29.3%) |
| 4.0x or more | 24 (24.7%) | 19 (10.1%) |
| Total | 97 (100.0%) | 188 (100.0%) |
Real Estate Taxes by Mortgage Status in Orangeville
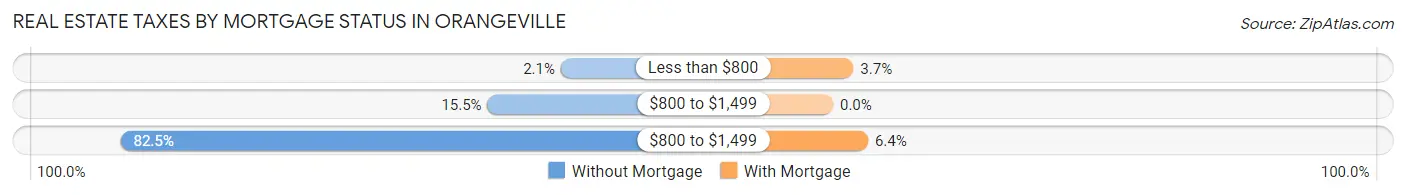
| Property Taxes | Without Mortgage | With Mortgage |
| Less than $800 | 2 (2.1%) | 7 (3.7%) |
| $800 to $1,499 | 15 (15.5%) | 0 (0.0%) |
| $800 to $1,499 | 80 (82.5%) | 12 (6.4%) |
| Total | 97 (100.0%) | 188 (100.0%) |
Health & Disability in Orangeville
Health Insurance Coverage by Age in Orangeville
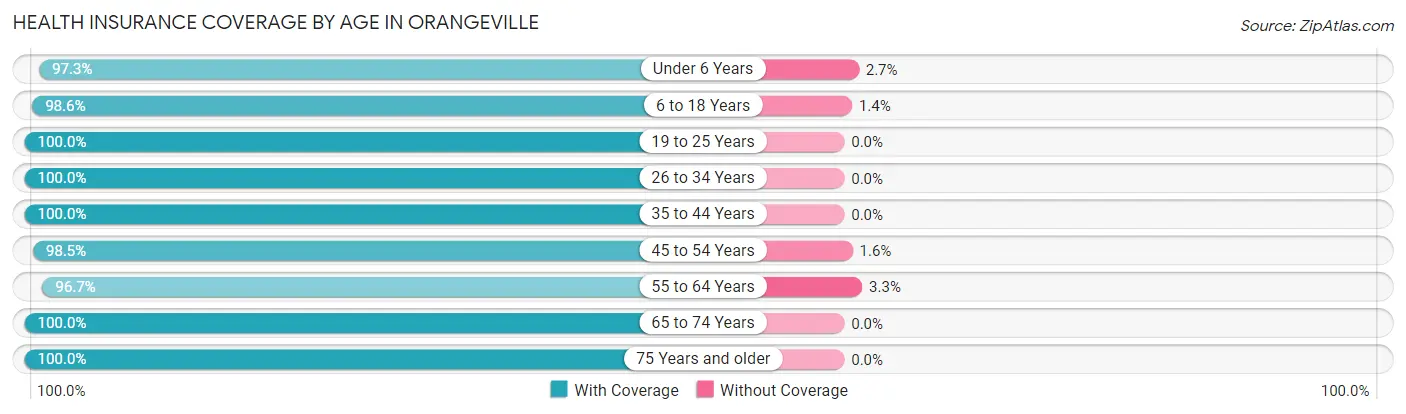
| Age Bracket | With Coverage | Without Coverage |
| Under 6 Years | 72 (97.3%) | 2 (2.7%) |
| 6 to 18 Years | 207 (98.6%) | 3 (1.4%) |
| 19 to 25 Years | 52 (100.0%) | 0 (0.0%) |
| 26 to 34 Years | 76 (100.0%) | 0 (0.0%) |
| 35 to 44 Years | 130 (100.0%) | 0 (0.0%) |
| 45 to 54 Years | 127 (98.5%) | 2 (1.5%) |
| 55 to 64 Years | 87 (96.7%) | 3 (3.3%) |
| 65 to 74 Years | 111 (100.0%) | 0 (0.0%) |
| 75 Years and older | 45 (100.0%) | 0 (0.0%) |
| Total | 907 (98.9%) | 10 (1.1%) |
Health Insurance Coverage by Citizenship Status in Orangeville
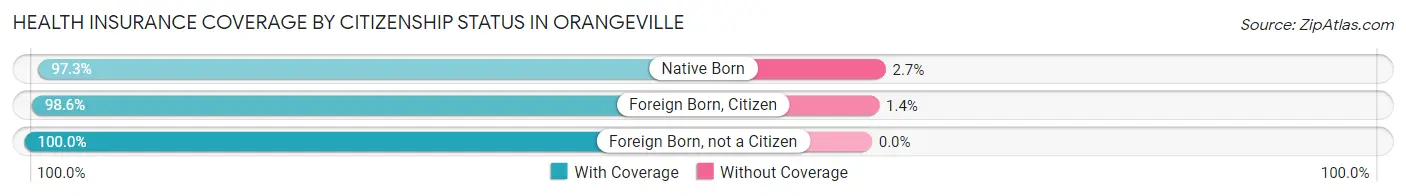
| Citizenship Status | With Coverage | Without Coverage |
| Native Born | 72 (97.3%) | 2 (2.7%) |
| Foreign Born, Citizen | 207 (98.6%) | 3 (1.4%) |
| Foreign Born, not a Citizen | 52 (100.0%) | 0 (0.0%) |
Health Insurance Coverage by Household Income in Orangeville
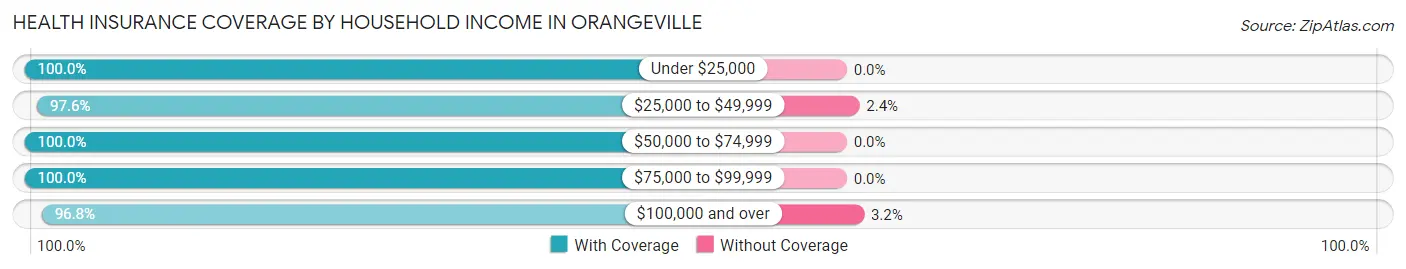
| Household Income | With Coverage | Without Coverage |
| Under $25,000 | 74 (100.0%) | 0 (0.0%) |
| $25,000 to $49,999 | 124 (97.6%) | 3 (2.4%) |
| $50,000 to $74,999 | 366 (100.0%) | 0 (0.0%) |
| $75,000 to $99,999 | 132 (100.0%) | 0 (0.0%) |
| $100,000 and over | 211 (96.8%) | 7 (3.2%) |
Public vs Private Health Insurance Coverage by Age in Orangeville
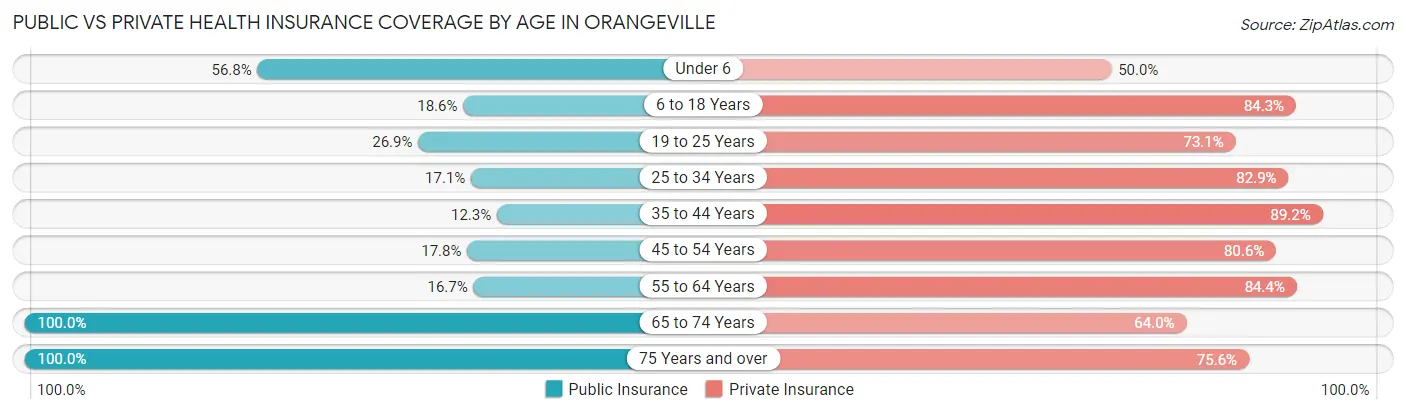
| Age Bracket | Public Insurance | Private Insurance |
| Under 6 | 42 (56.8%) | 37 (50.0%) |
| 6 to 18 Years | 39 (18.6%) | 177 (84.3%) |
| 19 to 25 Years | 14 (26.9%) | 38 (73.1%) |
| 25 to 34 Years | 13 (17.1%) | 63 (82.9%) |
| 35 to 44 Years | 16 (12.3%) | 116 (89.2%) |
| 45 to 54 Years | 23 (17.8%) | 104 (80.6%) |
| 55 to 64 Years | 15 (16.7%) | 76 (84.4%) |
| 65 to 74 Years | 111 (100.0%) | 71 (64.0%) |
| 75 Years and over | 45 (100.0%) | 34 (75.6%) |
| Total | 318 (34.7%) | 716 (78.1%) |
Disability Status by Sex by Age in Orangeville
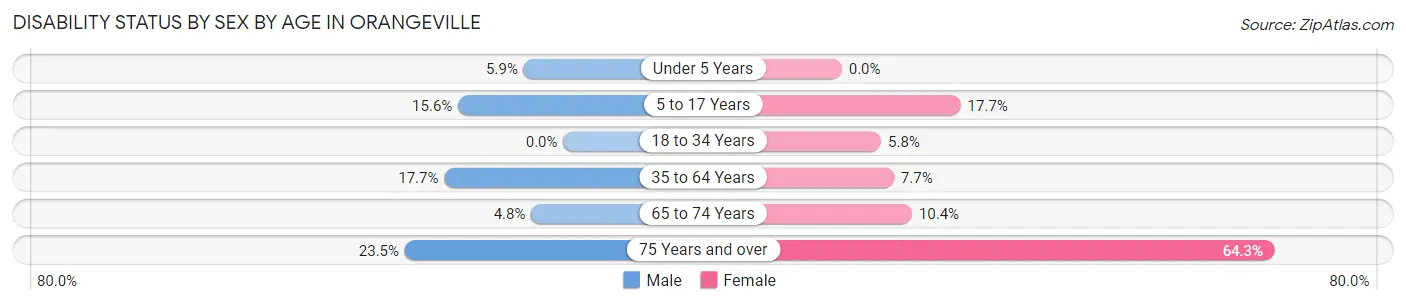
| Age Bracket | Male | Female |
| Under 5 Years | 3 (5.9%) | 0 (0.0%) |
| 5 to 17 Years | 15 (15.6%) | 15 (17.6%) |
| 18 to 34 Years | 0 (0.0%) | 6 (5.8%) |
| 35 to 64 Years | 32 (17.7%) | 13 (7.7%) |
| 65 to 74 Years | 3 (4.8%) | 5 (10.4%) |
| 75 Years and over | 4 (23.5%) | 18 (64.3%) |
Disability Class by Sex by Age in Orangeville
Disability Class: Hearing Difficulty
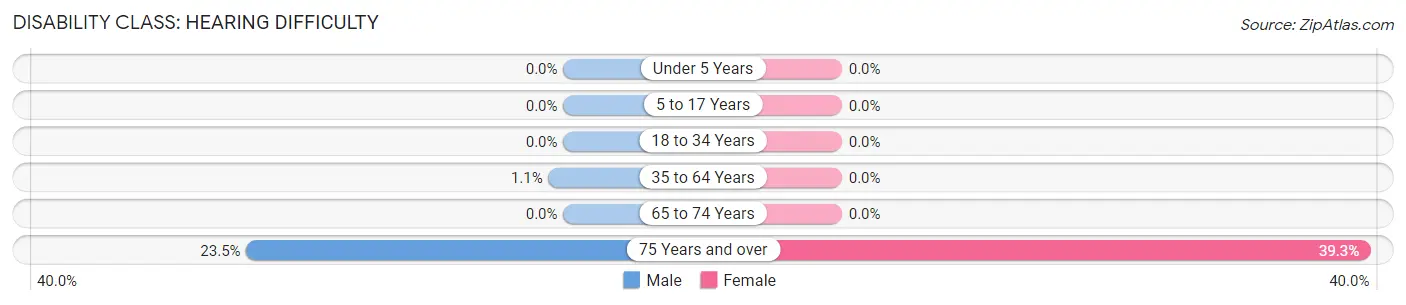
| Age Bracket | Male | Female |
| Under 5 Years | 0 (0.0%) | 0 (0.0%) |
| 5 to 17 Years | 0 (0.0%) | 0 (0.0%) |
| 18 to 34 Years | 0 (0.0%) | 0 (0.0%) |
| 35 to 64 Years | 2 (1.1%) | 0 (0.0%) |
| 65 to 74 Years | 0 (0.0%) | 0 (0.0%) |
| 75 Years and over | 4 (23.5%) | 11 (39.3%) |
Disability Class: Vision Difficulty
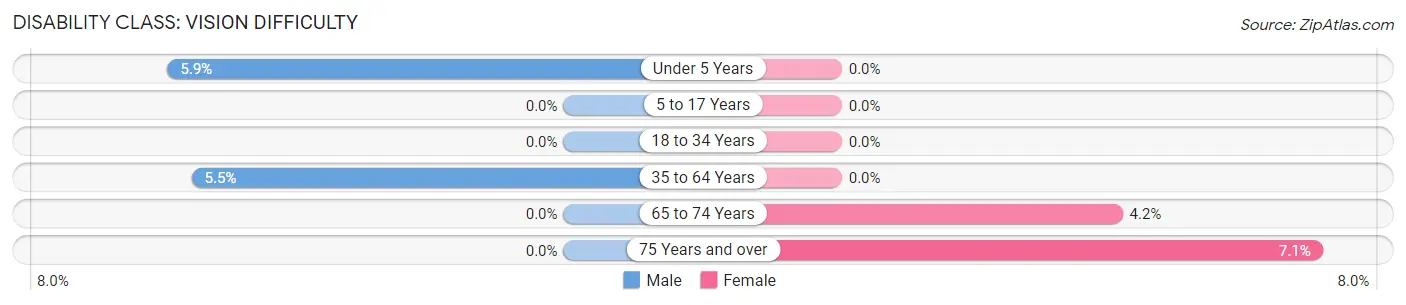
| Age Bracket | Male | Female |
| Under 5 Years | 3 (5.9%) | 0 (0.0%) |
| 5 to 17 Years | 0 (0.0%) | 0 (0.0%) |
| 18 to 34 Years | 0 (0.0%) | 0 (0.0%) |
| 35 to 64 Years | 10 (5.5%) | 0 (0.0%) |
| 65 to 74 Years | 0 (0.0%) | 2 (4.2%) |
| 75 Years and over | 0 (0.0%) | 2 (7.1%) |
Disability Class: Cognitive Difficulty
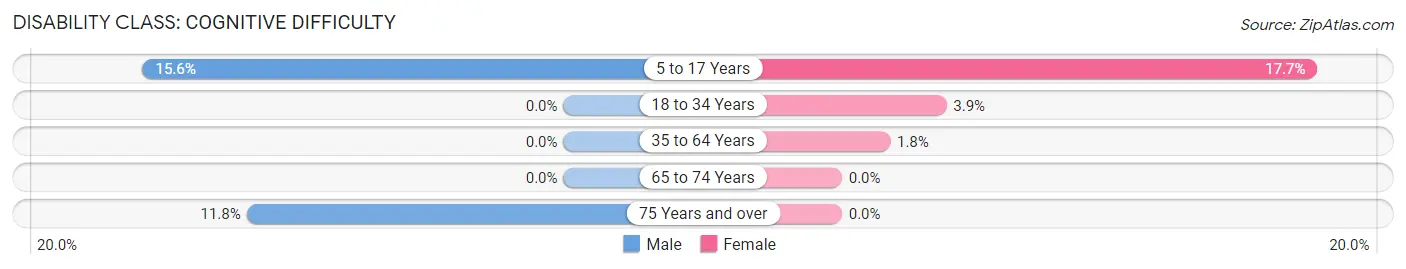
| Age Bracket | Male | Female |
| 5 to 17 Years | 15 (15.6%) | 15 (17.6%) |
| 18 to 34 Years | 0 (0.0%) | 4 (3.9%) |
| 35 to 64 Years | 0 (0.0%) | 3 (1.8%) |
| 65 to 74 Years | 0 (0.0%) | 0 (0.0%) |
| 75 Years and over | 2 (11.8%) | 0 (0.0%) |
Disability Class: Ambulatory Difficulty
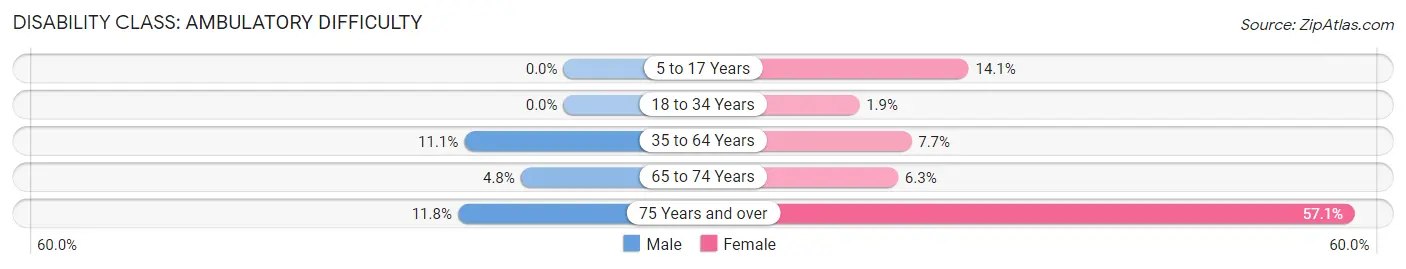
| Age Bracket | Male | Female |
| 5 to 17 Years | 0 (0.0%) | 12 (14.1%) |
| 18 to 34 Years | 0 (0.0%) | 2 (1.9%) |
| 35 to 64 Years | 20 (11.1%) | 13 (7.7%) |
| 65 to 74 Years | 3 (4.8%) | 3 (6.2%) |
| 75 Years and over | 2 (11.8%) | 16 (57.1%) |
Disability Class: Self-Care Difficulty
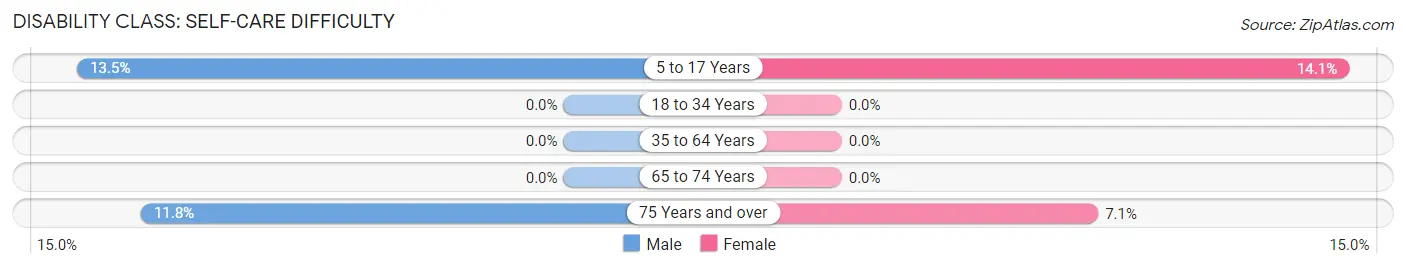
| Age Bracket | Male | Female |
| 5 to 17 Years | 13 (13.5%) | 12 (14.1%) |
| 18 to 34 Years | 0 (0.0%) | 0 (0.0%) |
| 35 to 64 Years | 0 (0.0%) | 0 (0.0%) |
| 65 to 74 Years | 0 (0.0%) | 0 (0.0%) |
| 75 Years and over | 2 (11.8%) | 2 (7.1%) |
Technology Access in Orangeville
Computing Device Access in Orangeville
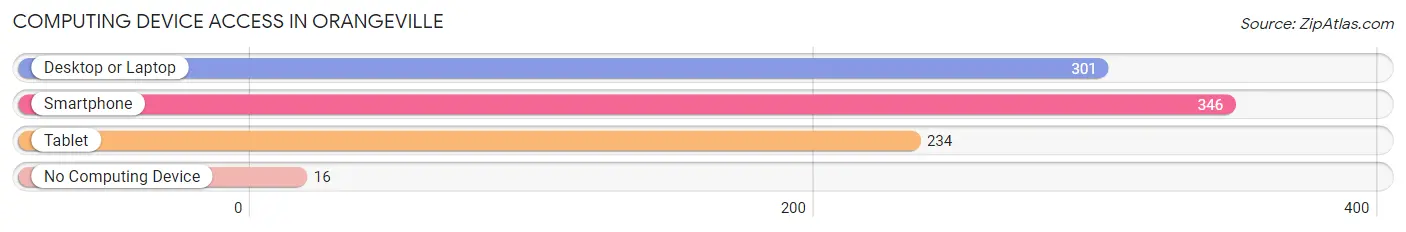
| Device Type | # Households | % Households |
| Desktop or Laptop | 301 | 80.5% |
| Smartphone | 346 | 92.5% |
| Tablet | 234 | 62.6% |
| No Computing Device | 16 | 4.3% |
| Total | 374 | 100.0% |
Internet Access in Orangeville
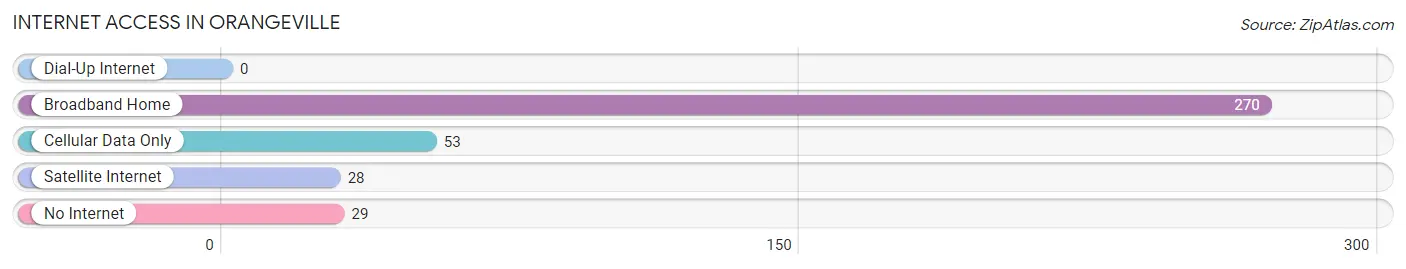
| Internet Type | # Households | % Households |
| Dial-Up Internet | 0 | 0.0% |
| Broadband Home | 270 | 72.2% |
| Cellular Data Only | 53 | 14.2% |
| Satellite Internet | 28 | 7.5% |
| No Internet | 29 | 7.7% |
| Total | 374 | 100.0% |
Orangeville Summary
Introduction
The small town of Orangeville, Illinois is located in Stephenson County, in the northwest corner of the state. It is a rural community with a population of 1,845 people, according to the 2010 census. The town was founded in 1854 and has a rich history of farming, industry, and small-town life. This paper will explore the history, geography, economy, and demographics of Orangeville, Illinois.
History
Orangeville was founded in 1854 by a group of settlers from Orangeville, New York. The town was named after the original Orangeville, and the settlers brought with them the same values and traditions that had been established in the New York town. The first settlers were mostly farmers, and the town quickly grew to include a post office, a school, a church, and a general store.
The town was officially incorporated in 1867, and the first mayor was elected in 1868. The town continued to grow and prosper, and by the early 1900s, it had become a thriving agricultural center. The town was home to several grain elevators, a creamery, and a number of other businesses.
In the late 1800s and early 1900s, the town was also home to a number of industries, including a brickyard, a sawmill, and a furniture factory. These industries provided jobs for many of the town’s residents, and helped to make Orangeville a prosperous community.
Geography
Orangeville is located in the northwest corner of Stephenson County, in the state of Illinois. The town is situated on the banks of the Pecatonica River, and is surrounded by rolling hills and farmland. The town is located approximately 25 miles west of Rockford, and is about an hour’s drive from Madison, Wisconsin.
The town covers an area of 1.2 square miles, and has a population of 1,845 people, according to the 2010 census. The town is served by two major highways, US Route 20 and Illinois Route 75.
Economy
Orangeville’s economy is largely based on agriculture and small businesses. The town is home to several grain elevators, a creamery, and a number of other businesses. The town is also home to a number of manufacturing companies, including a furniture factory and a sawmill.
The town is also home to a number of small businesses, including restaurants, retail stores, and service providers. The town is also home to a number of small farms, which produce a variety of crops, including corn, soybeans, and wheat.
Demographics
According to the 2010 census, the population of Orangeville is 1,845 people. The town is predominantly white, with a population that is 97.3% white, 0.7% African American, 0.3% Native American, 0.3% Asian, and 1.4% other. The median household income is $45,938, and the median age is 41.7 years.
Conclusion
Orangeville, Illinois is a small rural town located in Stephenson County. The town has a rich history of farming, industry, and small-town life. The town is predominantly white, and the economy is largely based on agriculture and small businesses. The town is served by two major highways, and is home to a number of small businesses, farms, and manufacturing companies.
Common Questions
What is Per Capita Income in Orangeville?
Per Capita income in Orangeville is $29,163.
What is the Median Family Income in Orangeville?
Median Family Income in Orangeville is $70,509.
What is the Median Household income in Orangeville?
Median Household Income in Orangeville is $63,690.
What is Income or Wage Gap in Orangeville?
Income or Wage Gap in Orangeville is 27.6%.
Women in Orangeville earn 72.4 cents for every dollar earned by a man.
What is Inequality or Gini Index in Orangeville?
Inequality or Gini Index in Orangeville is 0.34.
What is the Total Population of Orangeville?
Total Population of Orangeville is 917.
What is the Total Male Population of Orangeville?
Total Male Population of Orangeville is 471.
What is the Total Female Population of Orangeville?
Total Female Population of Orangeville is 446.
What is the Ratio of Males per 100 Females in Orangeville?
There are 105.61 Males per 100 Females in Orangeville.
What is the Ratio of Females per 100 Males in Orangeville?
There are 94.69 Females per 100 Males in Orangeville.
What is the Median Population Age in Orangeville?
Median Population Age in Orangeville is 39.6 Years.
What is the Average Family Size in Orangeville
Average Family Size in Orangeville is 3.0 People.
What is the Average Household Size in Orangeville
Average Household Size in Orangeville is 2.5 People.
How Large is the Labor Force in Orangeville?
There are 519 People in the Labor Forcein in Orangeville.
What is the Percentage of People in the Labor Force in Orangeville?
72.7% of People are in the Labor Force in Orangeville.
What is the Unemployment Rate in Orangeville?
Unemployment Rate in Orangeville is 13.1%.