Ohio, IL Map & Demographics
Ohio Map
Ohio Overview
$28,495
PER CAPITA INCOME
$70,977
AVG FAMILY INCOME
$58,375
AVG HOUSEHOLD INCOME
56.3%
WAGE / INCOME GAP [ % ]
43.7¢/ $1
WAGE / INCOME GAP [ $ ]
0.48
INEQUALITY / GINI INDEX
623
TOTAL POPULATION
321
MALE POPULATION
302
FEMALE POPULATION
106.29
MALES / 100 FEMALES
94.08
FEMALES / 100 MALES
35.1
MEDIAN AGE
3.3
AVG FAMILY SIZE
2.8
AVG HOUSEHOLD SIZE
334
LABOR FORCE [ PEOPLE ]
71.8%
PERCENT IN LABOR FORCE
12.3%
UNEMPLOYMENT RATE
Ohio Zip Codes
Ohio Area Codes
Income in Ohio
Income Overview in Ohio
Per Capita Income in Ohio is $28,495, while median incomes of families and households are $70,977 and $58,375 respectively.
| Characteristic | Number | Measure |
| Per Capita Income | 623 | $28,495 |
| Median Family Income | 163 | $70,977 |
| Mean Family Income | 163 | $76,463 |
| Median Household Income | 225 | $58,375 |
| Mean Household Income | 225 | $73,358 |
| Income Deficit | 163 | $0 |
| Wage / Income Gap (%) | 623 | 56.35% |
| Wage / Income Gap ($) | 623 | 43.65¢ per $1 |
| Gini / Inequality Index | 623 | 0.48 |
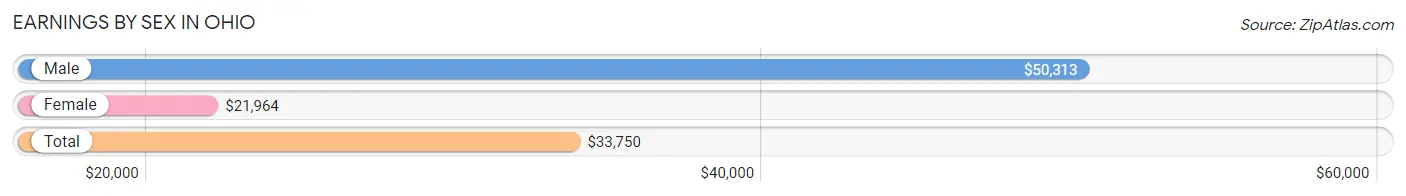
Earnings by Sex in Ohio
Average Earnings in Ohio are $33,750, $50,313 for men and $21,964 for women, a difference of 56.4%.
| Sex | Number | Average Earnings |
| Male | 187 (53.7%) | $50,313 |
| Female | 161 (46.3%) | $21,964 |
| Total | 348 (100.0%) | $33,750 |
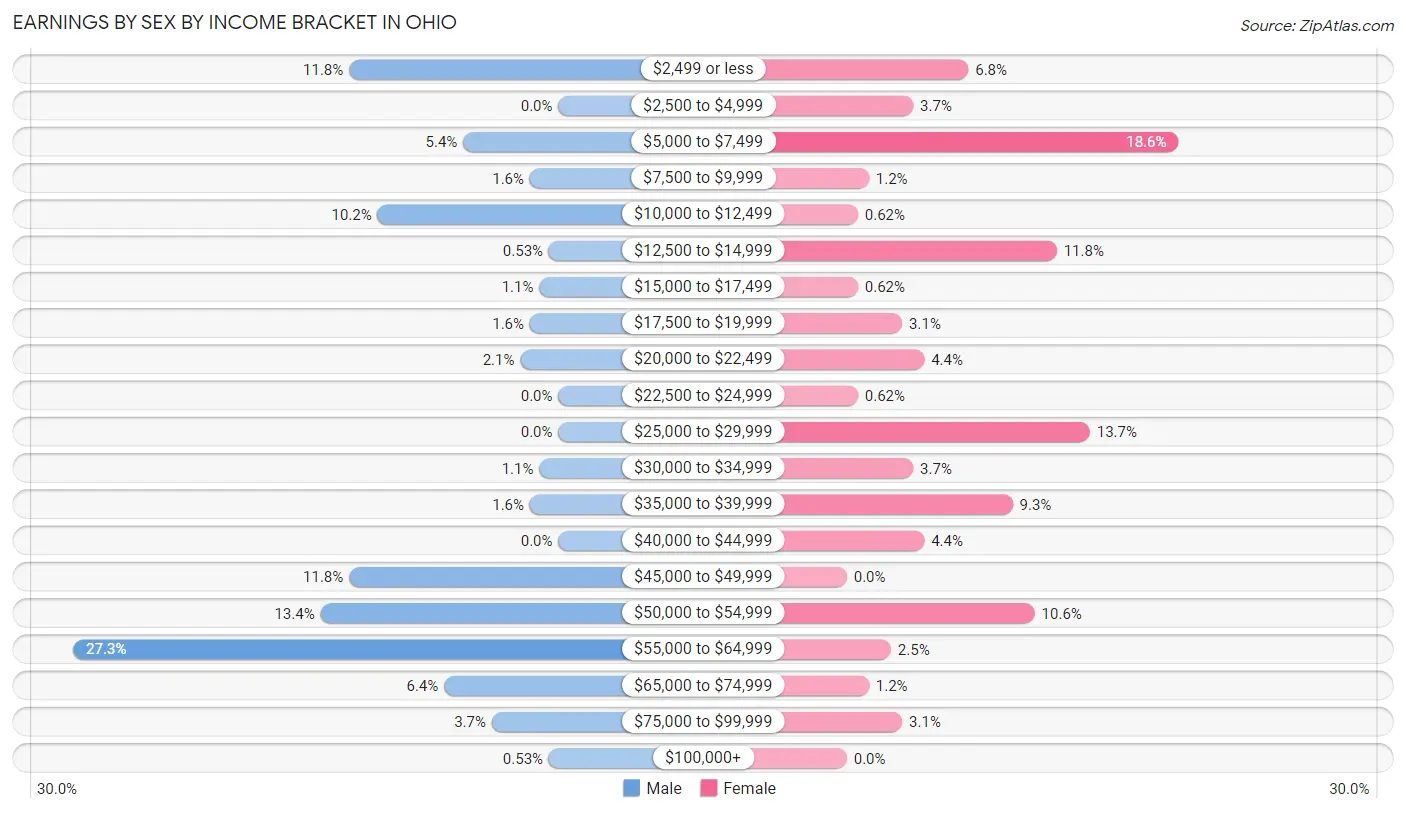
Earnings by Sex by Income Bracket in Ohio
The most common earnings brackets in Ohio are $55,000 to $64,999 for men (51 | 27.3%) and $5,000 to $7,499 for women (30 | 18.6%).
| Income | Male | Female |
| $2,499 or less | 22 (11.8%) | 11 (6.8%) |
| $2,500 to $4,999 | 0 (0.0%) | 6 (3.7%) |
| $5,000 to $7,499 | 10 (5.3%) | 30 (18.6%) |
| $7,500 to $9,999 | 3 (1.6%) | 2 (1.2%) |
| $10,000 to $12,499 | 19 (10.2%) | 1 (0.6%) |
| $12,500 to $14,999 | 1 (0.5%) | 19 (11.8%) |
| $15,000 to $17,499 | 2 (1.1%) | 1 (0.6%) |
| $17,500 to $19,999 | 3 (1.6%) | 5 (3.1%) |
| $20,000 to $22,499 | 4 (2.1%) | 7 (4.3%) |
| $22,500 to $24,999 | 0 (0.0%) | 1 (0.6%) |
| $25,000 to $29,999 | 0 (0.0%) | 22 (13.7%) |
| $30,000 to $34,999 | 2 (1.1%) | 6 (3.7%) |
| $35,000 to $39,999 | 3 (1.6%) | 15 (9.3%) |
| $40,000 to $44,999 | 0 (0.0%) | 7 (4.3%) |
| $45,000 to $49,999 | 22 (11.8%) | 0 (0.0%) |
| $50,000 to $54,999 | 25 (13.4%) | 17 (10.6%) |
| $55,000 to $64,999 | 51 (27.3%) | 4 (2.5%) |
| $65,000 to $74,999 | 12 (6.4%) | 2 (1.2%) |
| $75,000 to $99,999 | 7 (3.7%) | 5 (3.1%) |
| $100,000+ | 1 (0.5%) | 0 (0.0%) |
| Total | 187 (100.0%) | 161 (100.0%) |
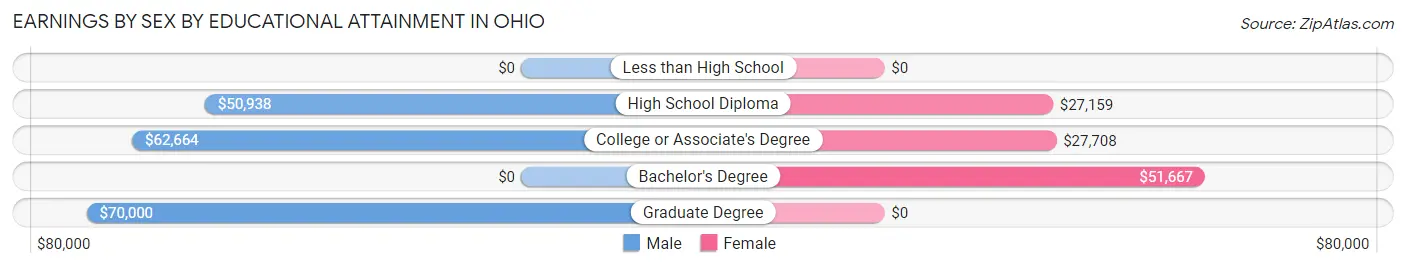
Earnings by Sex by Educational Attainment in Ohio
Average earnings in Ohio are $51,938 for men and $25,625 for women, a difference of 50.7%. Men with an educational attainment of graduate degree enjoy the highest average annual earnings of $70,000, while those with high school diploma education earn the least with $50,938. Women with an educational attainment of bachelor's degree earn the most with the average annual earnings of $51,667, while those with high school diploma education have the smallest earnings of $27,159.
| Educational Attainment | Male Income | Female Income |
| Less than High School | - | - |
| High School Diploma | $50,938 | $27,159 |
| College or Associate's Degree | $62,664 | $27,708 |
| Bachelor's Degree | - | - |
| Graduate Degree | $70,000 | $0 |
| Total | $51,938 | $25,625 |
Family Income in Ohio
Family Income Brackets in Ohio
According to the Ohio family income data, there are 57 families falling into the $50,000 to $74,999 income range, which is the most common income bracket and makes up 35.0% of all families.
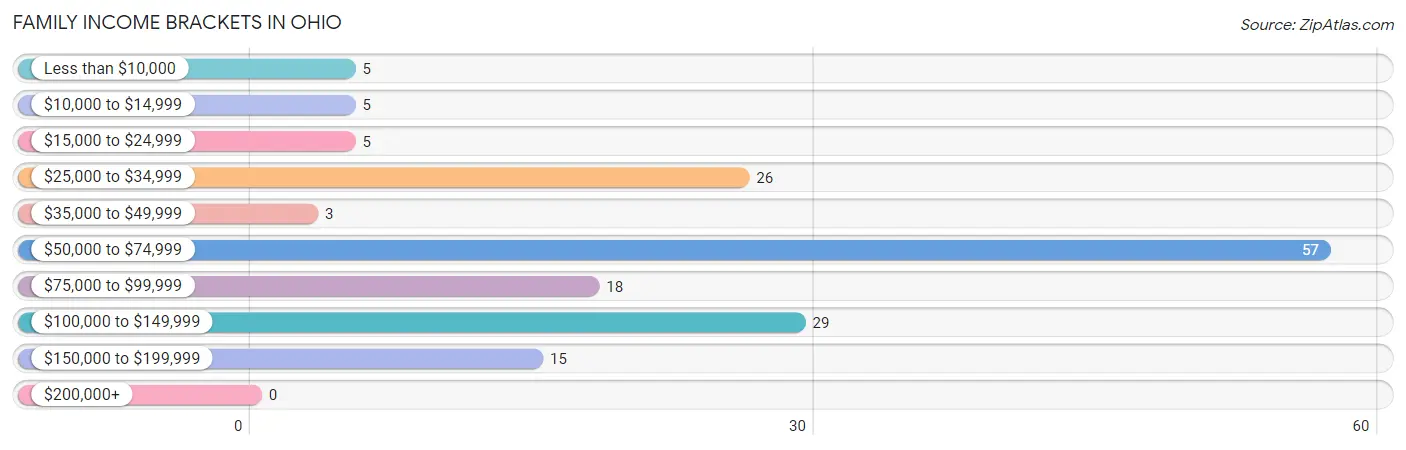
| Income Bracket | # Families | % Families |
| Less than $10,000 | 5 | 3.1% |
| $10,000 to $14,999 | 5 | 3.1% |
| $15,000 to $24,999 | 5 | 3.1% |
| $25,000 to $34,999 | 26 | 16.0% |
| $35,000 to $49,999 | 3 | 1.8% |
| $50,000 to $74,999 | 57 | 35.0% |
| $75,000 to $99,999 | 18 | 11.0% |
| $100,000 to $149,999 | 29 | 17.8% |
| $150,000 to $199,999 | 15 | 9.2% |
| $200,000+ | 0 | 0.0% |
Family Income by Famaliy Size in Ohio
2-person families (71 | 43.6%) account for the highest median family income in Ohio with $71,375 per family, while 2-person families (71 | 43.6%) have the highest median income of $35,688 per family member.
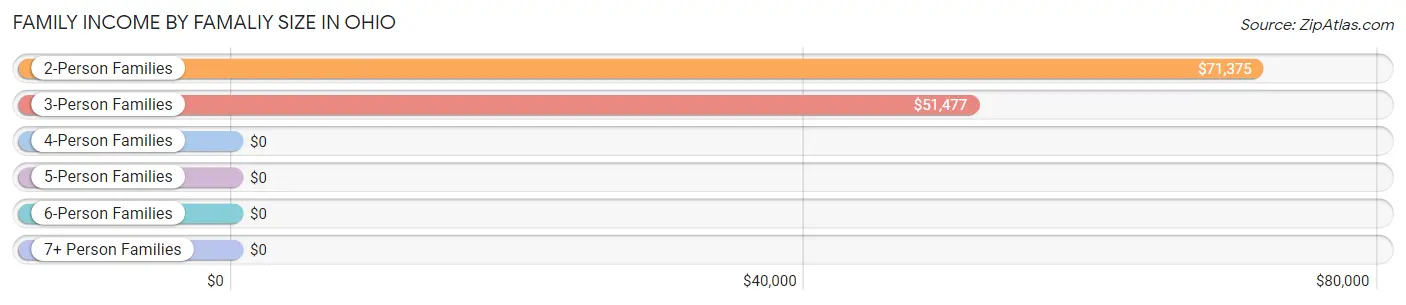
| Income Bracket | # Families | Median Income |
| 2-Person Families | 71 (43.6%) | $71,375 |
| 3-Person Families | 49 (30.1%) | $51,477 |
| 4-Person Families | 23 (14.1%) | $0 |
| 5-Person Families | 8 (4.9%) | $0 |
| 6-Person Families | 12 (7.4%) | $0 |
| 7+ Person Families | 0 (0.0%) | $0 |
| Total | 163 (100.0%) | $70,977 |
Family Income by Number of Earners in Ohio
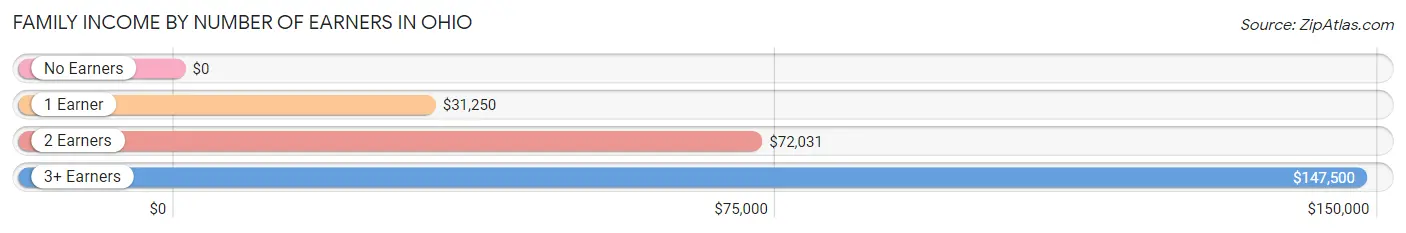
| Number of Earners | # Families | Median Income |
| No Earners | 14 (8.6%) | $0 |
| 1 Earner | 27 (16.6%) | $31,250 |
| 2 Earners | 104 (63.8%) | $72,031 |
| 3+ Earners | 18 (11.0%) | $147,500 |
| Total | 163 (100.0%) | $70,977 |
Household Income in Ohio
Household Income Brackets in Ohio
With 69 households falling in the category, the $50,000 to $74,999 income range is the most frequent in Ohio, accounting for 30.7% of all households. In contrast, only 3 households (1.3%) fall into the $200,000+ income bracket, making it the least populous group.
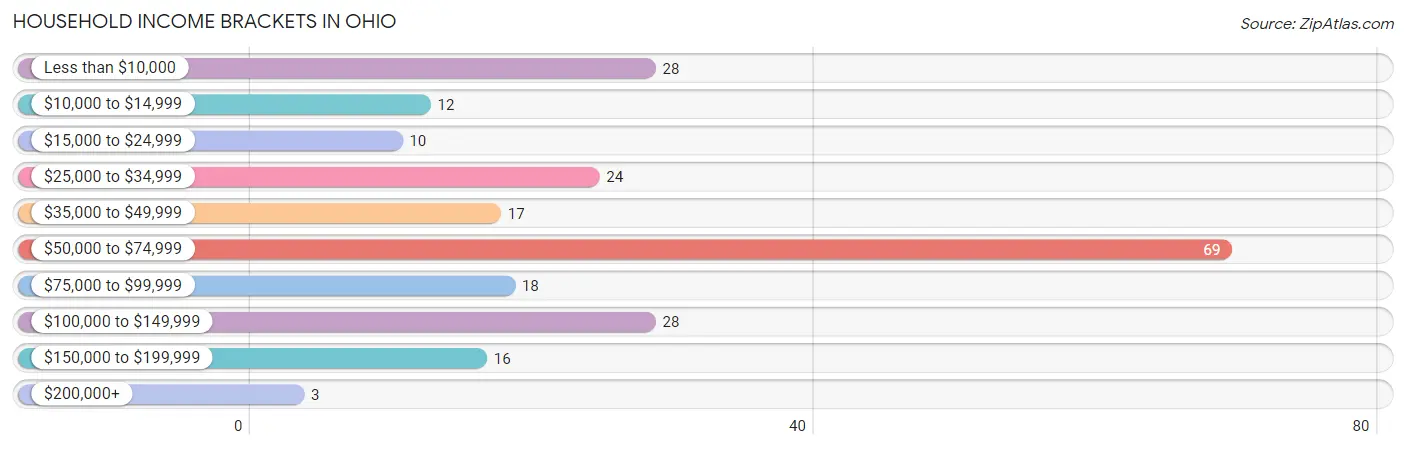
| Income Bracket | # Households | % Households |
| Less than $10,000 | 28 | 12.4% |
| $10,000 to $14,999 | 12 | 5.3% |
| $15,000 to $24,999 | 10 | 4.4% |
| $25,000 to $34,999 | 24 | 10.7% |
| $35,000 to $49,999 | 17 | 7.6% |
| $50,000 to $74,999 | 69 | 30.7% |
| $75,000 to $99,999 | 18 | 8.0% |
| $100,000 to $149,999 | 28 | 12.4% |
| $150,000 to $199,999 | 16 | 7.1% |
| $200,000+ | 3 | 1.3% |
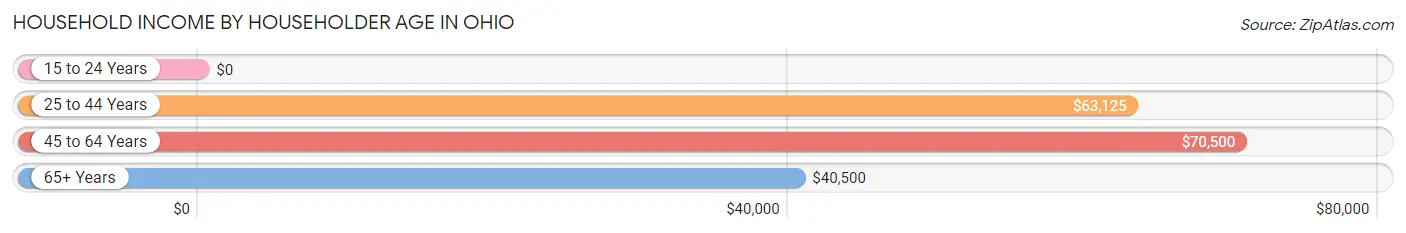
Household Income by Householder Age in Ohio
The median household income in Ohio is $58,375, with the highest median household income of $70,500 found in the 45 to 64 years age bracket for the primary householder. A total of 102 households (45.3%) fall into this category. Meanwhile, the 15 to 24 years age bracket for the primary householder has the lowest median household income of $0, with 4 households (1.8%) in this group.
| Income Bracket | # Households | Median Income |
| 15 to 24 Years | 4 (1.8%) | $0 |
| 25 to 44 Years | 65 (28.9%) | $63,125 |
| 45 to 64 Years | 102 (45.3%) | $70,500 |
| 65+ Years | 54 (24.0%) | $40,500 |
| Total | 225 (100.0%) | $58,375 |
Poverty in Ohio
Income Below Poverty by Sex and Age in Ohio
With 18.1% poverty level for males and 22.3% for females among the residents of Ohio, 5 year old males and 5 year old females are the most vulnerable to poverty, with 5 males (100.0%) and 10 females (100.0%) in their respective age groups living below the poverty level.
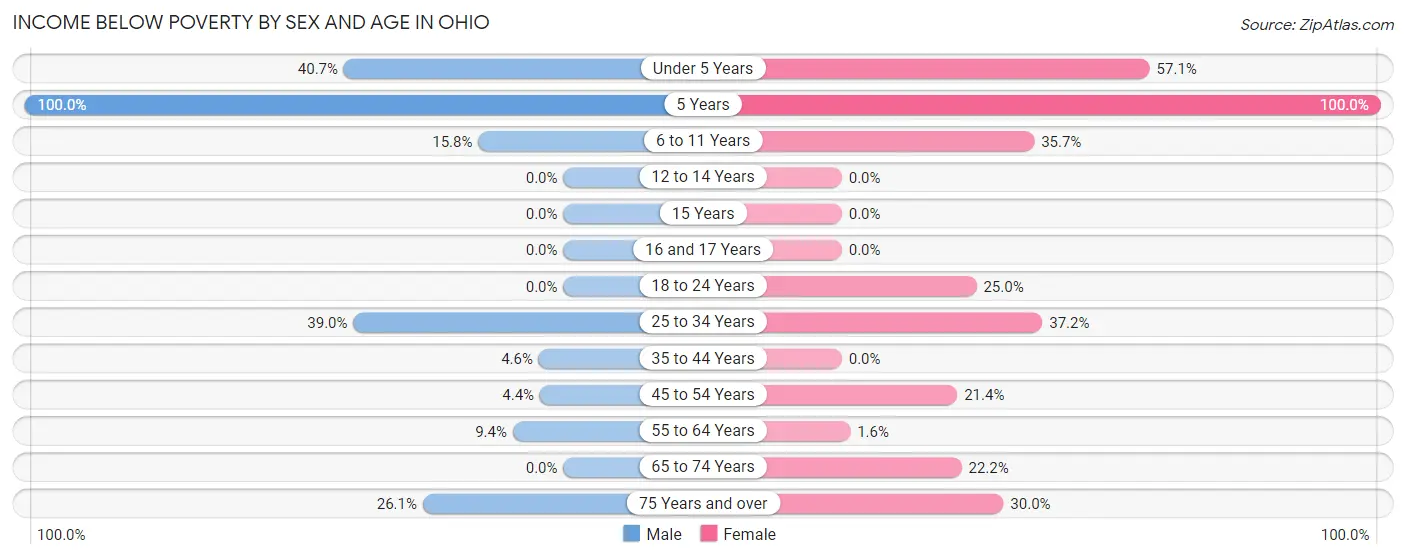
| Age Bracket | Male | Female |
| Under 5 Years | 11 (40.7%) | 4 (57.1%) |
| 5 Years | 5 (100.0%) | 10 (100.0%) |
| 6 to 11 Years | 6 (15.8%) | 15 (35.7%) |
| 12 to 14 Years | 0 (0.0%) | 0 (0.0%) |
| 15 Years | 0 (0.0%) | 0 (0.0%) |
| 16 and 17 Years | 0 (0.0%) | 0 (0.0%) |
| 18 to 24 Years | 0 (0.0%) | 2 (25.0%) |
| 25 to 34 Years | 23 (39.0%) | 16 (37.2%) |
| 35 to 44 Years | 3 (4.5%) | 0 (0.0%) |
| 45 to 54 Years | 1 (4.3%) | 9 (21.4%) |
| 55 to 64 Years | 3 (9.4%) | 1 (1.6%) |
| 65 to 74 Years | 0 (0.0%) | 4 (22.2%) |
| 75 Years and over | 6 (26.1%) | 6 (30.0%) |
| Total | 58 (18.1%) | 67 (22.3%) |
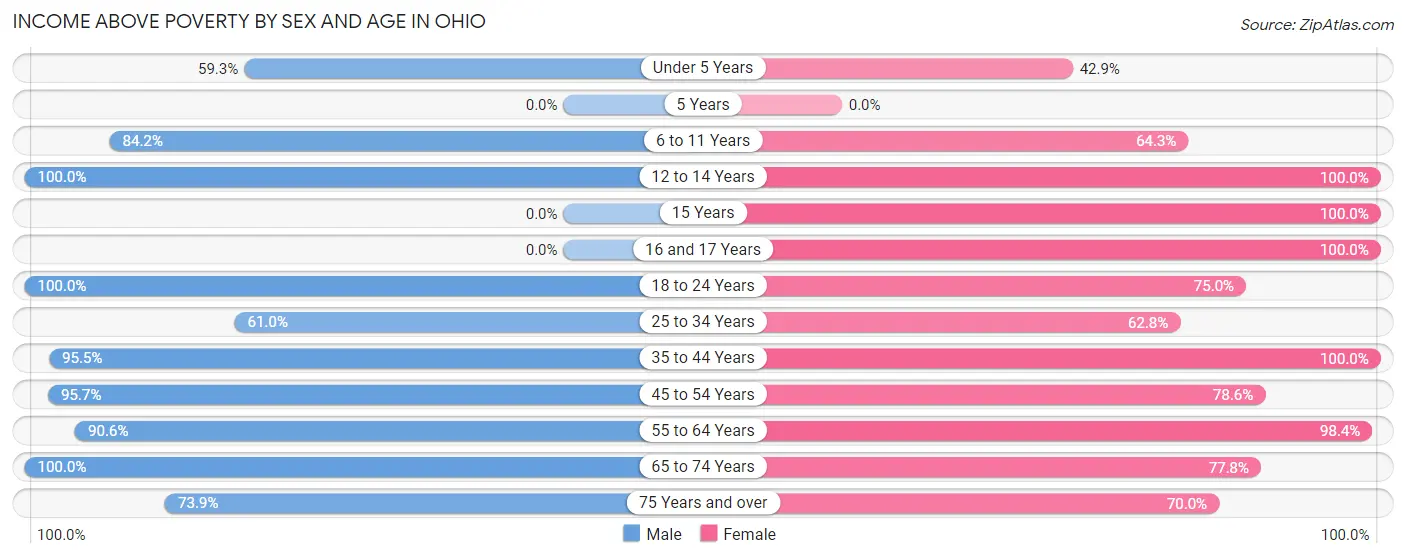
Income Above Poverty by Sex and Age in Ohio
According to the poverty statistics in Ohio, males aged 12 to 14 years and females aged 12 to 14 years are the age groups that are most secure financially, with 100.0% of males and 100.0% of females in these age groups living above the poverty line.
| Age Bracket | Male | Female |
| Under 5 Years | 16 (59.3%) | 3 (42.9%) |
| 5 Years | 0 (0.0%) | 0 (0.0%) |
| 6 to 11 Years | 32 (84.2%) | 27 (64.3%) |
| 12 to 14 Years | 6 (100.0%) | 16 (100.0%) |
| 15 Years | 0 (0.0%) | 7 (100.0%) |
| 16 and 17 Years | 0 (0.0%) | 8 (100.0%) |
| 18 to 24 Years | 31 (100.0%) | 6 (75.0%) |
| 25 to 34 Years | 36 (61.0%) | 27 (62.8%) |
| 35 to 44 Years | 63 (95.5%) | 15 (100.0%) |
| 45 to 54 Years | 22 (95.7%) | 33 (78.6%) |
| 55 to 64 Years | 29 (90.6%) | 63 (98.4%) |
| 65 to 74 Years | 10 (100.0%) | 14 (77.8%) |
| 75 Years and over | 17 (73.9%) | 14 (70.0%) |
| Total | 262 (81.9%) | 233 (77.7%) |
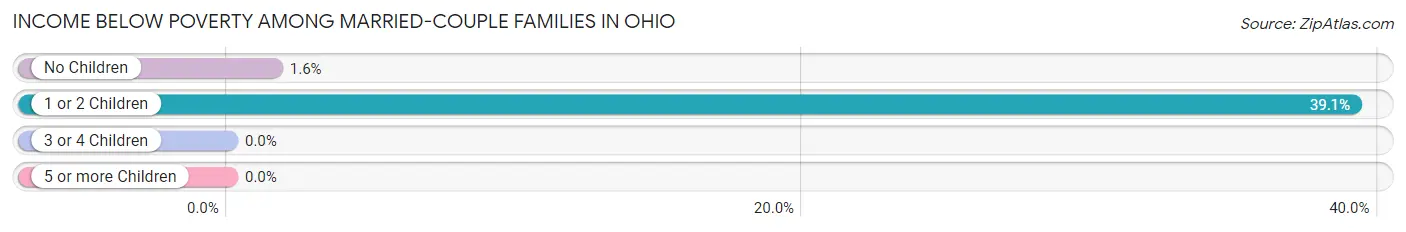
Income Below Poverty Among Married-Couple Families in Ohio
The poverty statistics for married-couple families in Ohio show that 10.0% or 10 of the total 100 families live below the poverty line. Families with 1 or 2 children have the highest poverty rate of 39.1%, comprising of 9 families. On the other hand, families with 3 or 4 children have the lowest poverty rate of 0.0%, which includes 0 families.
| Children | Above Poverty | Below Poverty |
| No Children | 63 (98.4%) | 1 (1.6%) |
| 1 or 2 Children | 14 (60.9%) | 9 (39.1%) |
| 3 or 4 Children | 13 (100.0%) | 0 (0.0%) |
| 5 or more Children | 0 (0.0%) | 0 (0.0%) |
| Total | 90 (90.0%) | 10 (10.0%) |
Income Below Poverty Among Single-Parent Households in Ohio
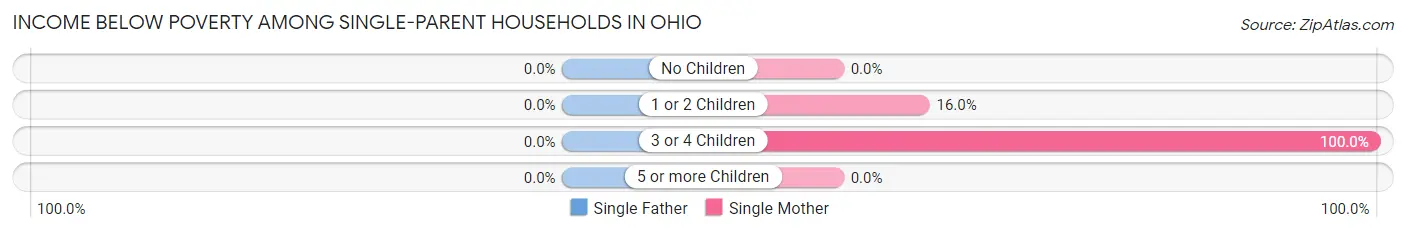
| Children | Single Father | Single Mother |
| No Children | 0 (0.0%) | 0 (0.0%) |
| 1 or 2 Children | 0 (0.0%) | 4 (16.0%) |
| 3 or 4 Children | 0 (0.0%) | 5 (100.0%) |
| 5 or more Children | 0 (0.0%) | 0 (0.0%) |
| Total | 0 (0.0%) | 9 (14.3%) |
Income Below Poverty Among Married-Couple vs Single-Parent Households in Ohio
The poverty data for Ohio shows that 10 of the married-couple family households (10.0%) and 9 of the single-parent households (14.3%) are living below the poverty level. Within the married-couple family households, those with 1 or 2 children have the highest poverty rate, with 9 households (39.1%) falling below the poverty line. Among the single-parent households, those with 3 or 4 children have the highest poverty rate, with 5 household (100.0%) living below poverty.
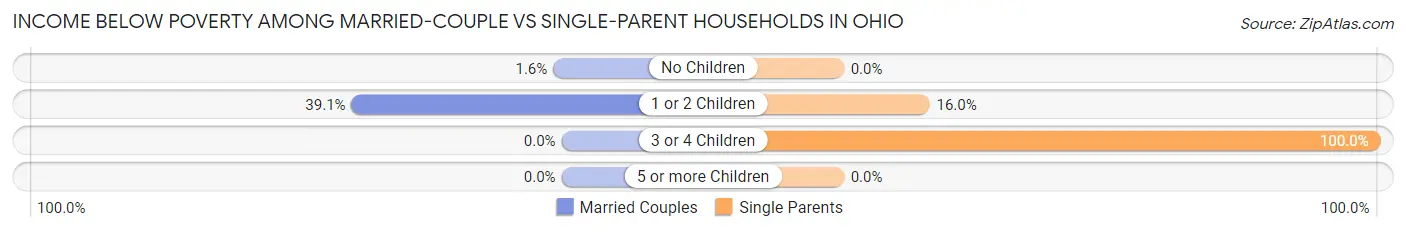
| Children | Married-Couple Families | Single-Parent Households |
| No Children | 1 (1.6%) | 0 (0.0%) |
| 1 or 2 Children | 9 (39.1%) | 4 (16.0%) |
| 3 or 4 Children | 0 (0.0%) | 5 (100.0%) |
| 5 or more Children | 0 (0.0%) | 0 (0.0%) |
| Total | 10 (10.0%) | 9 (14.3%) |
Race in Ohio
The most populous races in Ohio are White / Caucasian (577 | 92.6%), Hispanic or Latino (51 | 8.2%), and Two or more Races (31 | 5.0%).
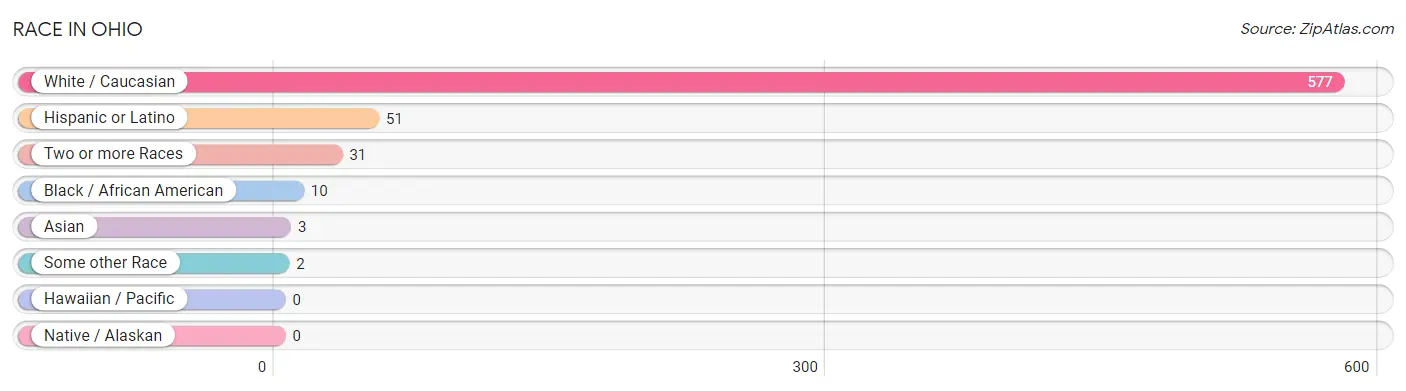
| Race | # Population | % Population |
| Asian | 3 | 0.5% |
| Black / African American | 10 | 1.6% |
| Hawaiian / Pacific | 0 | 0.0% |
| Hispanic or Latino | 51 | 8.2% |
| Native / Alaskan | 0 | 0.0% |
| White / Caucasian | 577 | 92.6% |
| Two or more Races | 31 | 5.0% |
| Some other Race | 2 | 0.3% |
| Total | 623 | 100.0% |
Ancestry in Ohio
The most populous ancestries reported in Ohio are German (138 | 22.2%), Irish (84 | 13.5%), English (72 | 11.6%), Puerto Rican (31 | 5.0%), and Scottish (28 | 4.5%), together accounting for 56.7% of all Ohio residents.
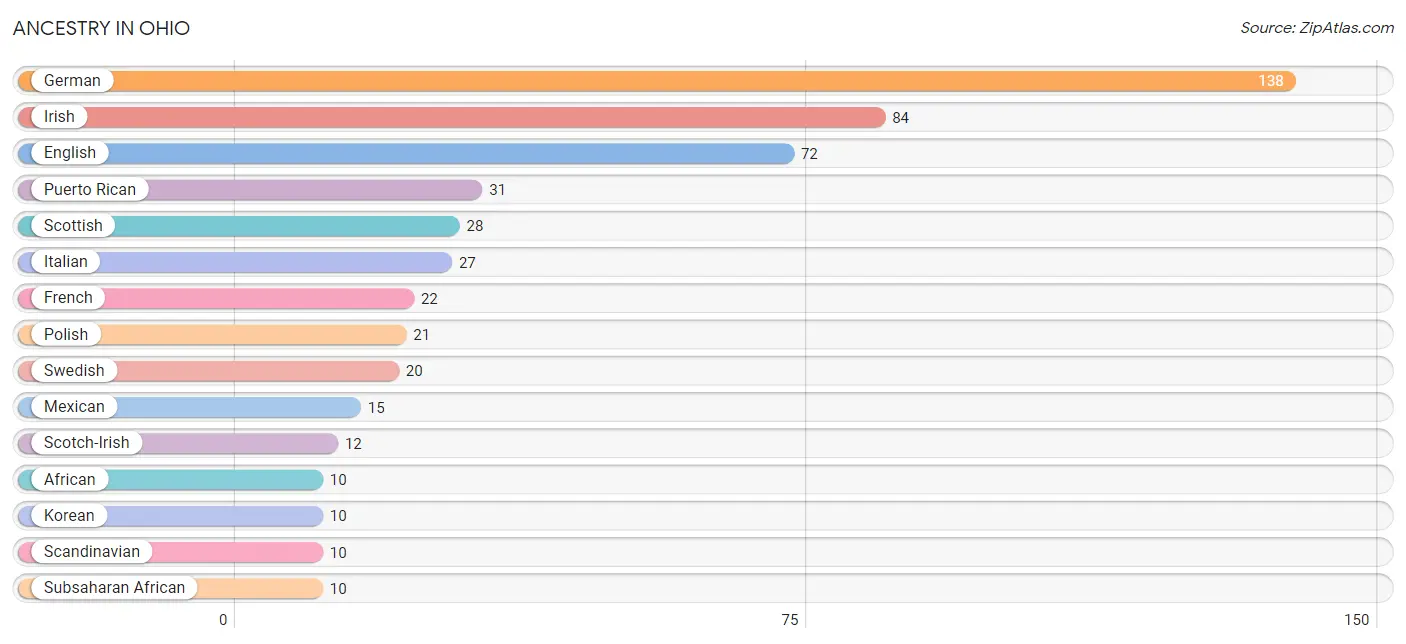
| Ancestry | # Population | % Population |
| African | 10 | 1.6% |
| American | 8 | 1.3% |
| Austrian | 1 | 0.2% |
| Belgian | 3 | 0.5% |
| Dutch | 4 | 0.6% |
| English | 72 | 11.6% |
| French | 22 | 3.5% |
| French Canadian | 3 | 0.5% |
| German | 138 | 22.2% |
| Irish | 84 | 13.5% |
| Italian | 27 | 4.3% |
| Korean | 10 | 1.6% |
| Lithuanian | 4 | 0.6% |
| Mexican | 15 | 2.4% |
| Norwegian | 6 | 1.0% |
| Polish | 21 | 3.4% |
| Portuguese | 2 | 0.3% |
| Puerto Rican | 31 | 5.0% |
| Scandinavian | 10 | 1.6% |
| Scotch-Irish | 12 | 1.9% |
| Scottish | 28 | 4.5% |
| Subsaharan African | 10 | 1.6% |
| Swedish | 20 | 3.2% | View All 23 Rows |
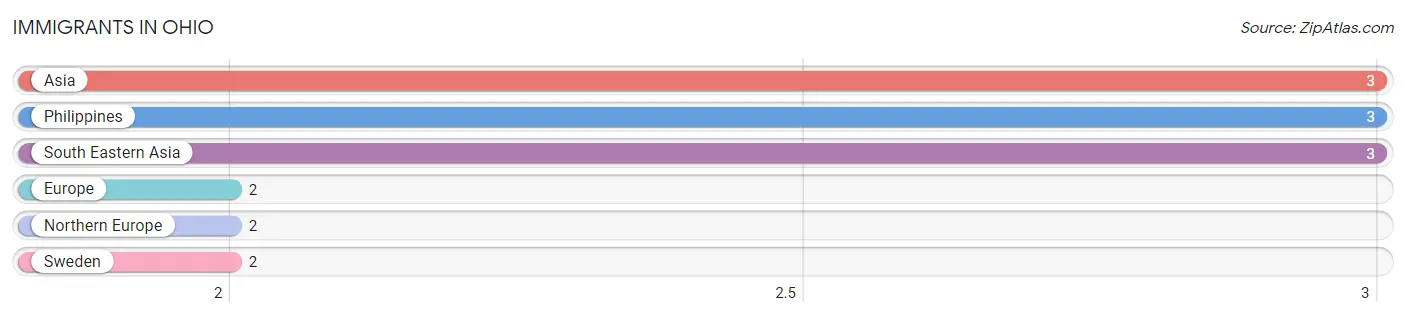
Immigrants in Ohio
The most numerous immigrant groups reported in Ohio came from Asia (3 | 0.5%), Philippines (3 | 0.5%), South Eastern Asia (3 | 0.5%), Europe (2 | 0.3%), and Northern Europe (2 | 0.3%), together accounting for 2.1% of all Ohio residents.
| Immigration Origin | # Population | % Population |
| Asia | 3 | 0.5% |
| Europe | 2 | 0.3% |
| Northern Europe | 2 | 0.3% |
| Philippines | 3 | 0.5% |
| South Eastern Asia | 3 | 0.5% |
| Sweden | 2 | 0.3% | View All 6 Rows |
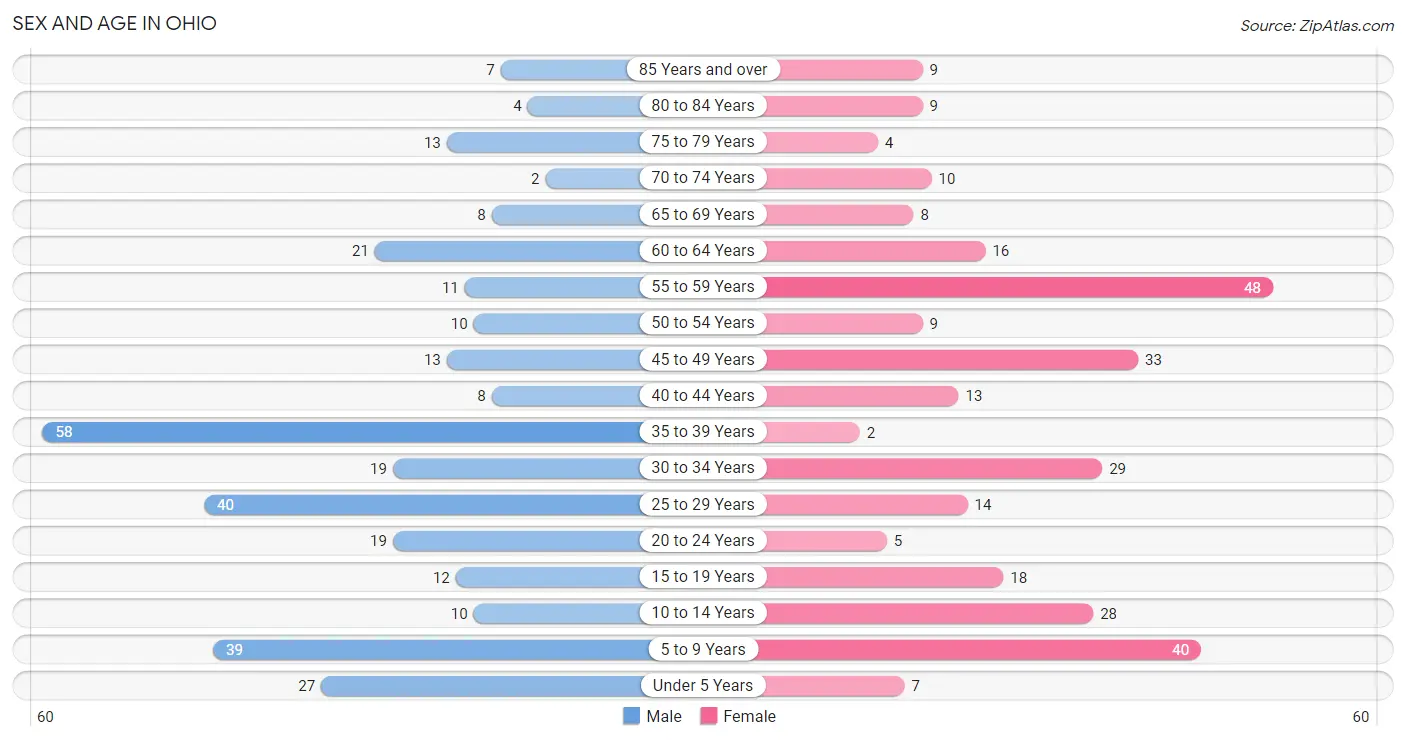
Sex and Age in Ohio
Sex and Age in Ohio
The most populous age groups in Ohio are 35 to 39 Years (58 | 18.1%) for men and 55 to 59 Years (48 | 15.9%) for women.
| Age Bracket | Male | Female |
| Under 5 Years | 27 (8.4%) | 7 (2.3%) |
| 5 to 9 Years | 39 (12.1%) | 40 (13.3%) |
| 10 to 14 Years | 10 (3.1%) | 28 (9.3%) |
| 15 to 19 Years | 12 (3.7%) | 18 (6.0%) |
| 20 to 24 Years | 19 (5.9%) | 5 (1.7%) |
| 25 to 29 Years | 40 (12.5%) | 14 (4.6%) |
| 30 to 34 Years | 19 (5.9%) | 29 (9.6%) |
| 35 to 39 Years | 58 (18.1%) | 2 (0.7%) |
| 40 to 44 Years | 8 (2.5%) | 13 (4.3%) |
| 45 to 49 Years | 13 (4.1%) | 33 (10.9%) |
| 50 to 54 Years | 10 (3.1%) | 9 (3.0%) |
| 55 to 59 Years | 11 (3.4%) | 48 (15.9%) |
| 60 to 64 Years | 21 (6.5%) | 16 (5.3%) |
| 65 to 69 Years | 8 (2.5%) | 8 (2.6%) |
| 70 to 74 Years | 2 (0.6%) | 10 (3.3%) |
| 75 to 79 Years | 13 (4.1%) | 4 (1.3%) |
| 80 to 84 Years | 4 (1.3%) | 9 (3.0%) |
| 85 Years and over | 7 (2.2%) | 9 (3.0%) |
| Total | 321 (100.0%) | 302 (100.0%) |
Families and Households in Ohio
Median Family Size in Ohio
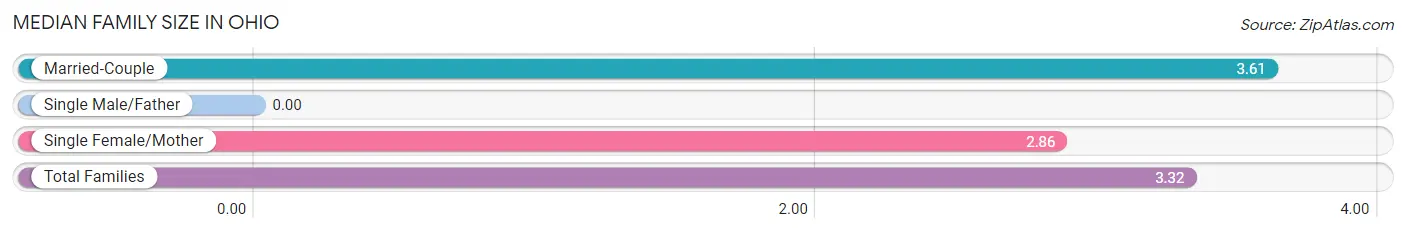
| Family Type | # Families | Family Size |
| Married-Couple | 100 (61.4%) | 3.61 |
| Single Male/Father | 0 (0.0%) | - |
| Single Female/Mother | 63 (38.7%) | 2.86 |
| Total Families | 163 (100.0%) | 3.32 |
Median Household Size in Ohio
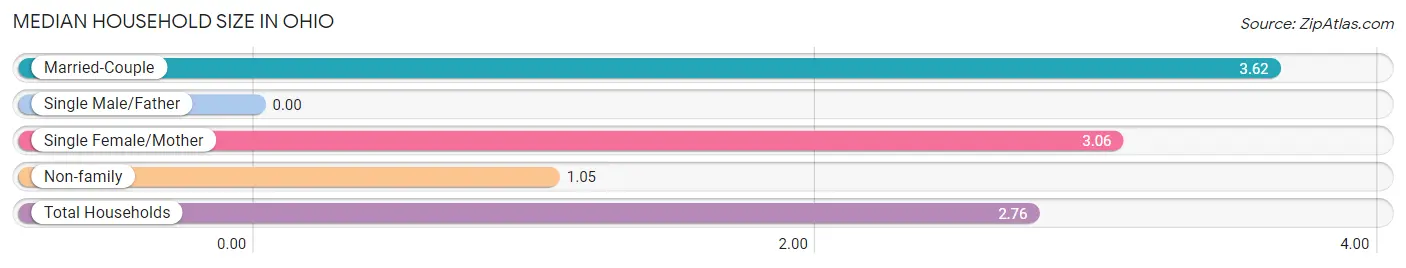
| Household Type | # Households | Household Size |
| Married-Couple | 100 (44.4%) | 3.62 |
| Single Male/Father | 0 (0.0%) | - |
| Single Female/Mother | 63 (28.0%) | 3.06 |
| Non-family | 62 (27.6%) | 1.05 |
| Total Households | 225 (100.0%) | 2.76 |
Household Size by Marriage Status in Ohio
Out of a total of 225 households in Ohio, 163 (72.4%) are family households, while 62 (27.6%) are nonfamily households. The most numerous type of family households are 2-person households, comprising 71, and the most common type of nonfamily households are 1-person households, comprising 59.
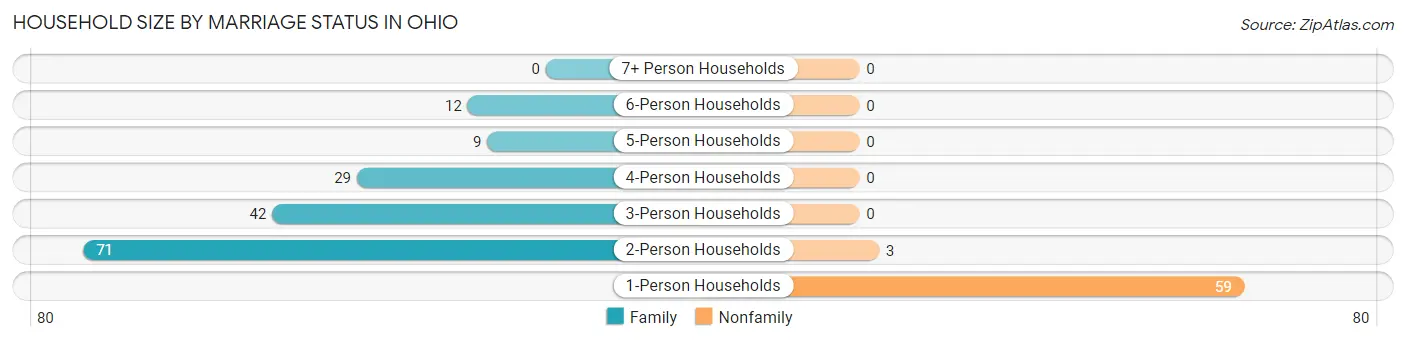
| Household Size | Family Households | Nonfamily Households |
| 1-Person Households | - | 59 (26.2%) |
| 2-Person Households | 71 (31.6%) | 3 (1.3%) |
| 3-Person Households | 42 (18.7%) | 0 (0.0%) |
| 4-Person Households | 29 (12.9%) | 0 (0.0%) |
| 5-Person Households | 9 (4.0%) | 0 (0.0%) |
| 6-Person Households | 12 (5.3%) | 0 (0.0%) |
| 7+ Person Households | 0 (0.0%) | 0 (0.0%) |
| Total | 163 (72.4%) | 62 (27.6%) |
Female Fertility in Ohio
Fertility by Age in Ohio
Average fertility rate in Ohio is 17.0 births per 1,000 women. Women in the age bracket of 20 to 34 years have the highest fertility rate with 42.0 births per 1,000 women. Women in the age bracket of 20 to 34 years acount for 100.0% of all women with births.
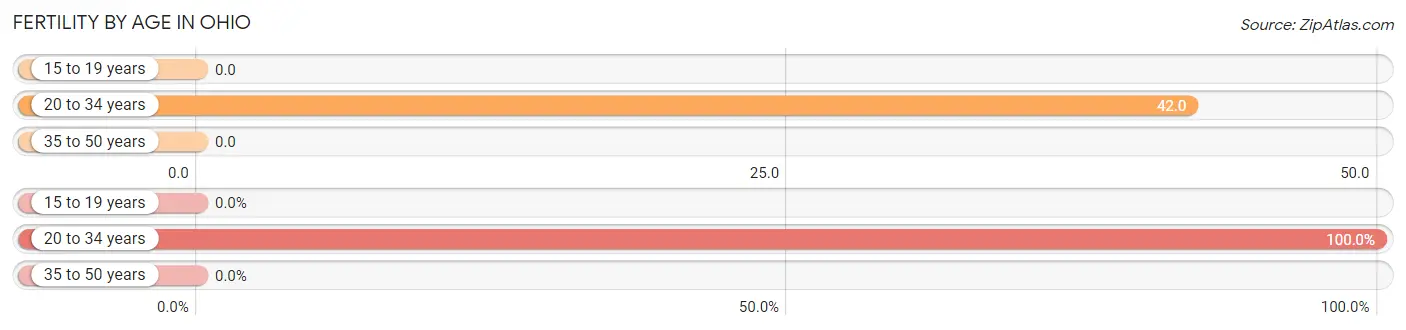
| Age Bracket | Women with Births | Births / 1,000 Women |
| 15 to 19 years | 0 (0.0%) | 0.0 |
| 20 to 34 years | 2 (100.0%) | 42.0 |
| 35 to 50 years | 0 (0.0%) | 0.0 |
| Total | 2 (100.0%) | 17.0 |
Fertility by Age by Marriage Status in Ohio
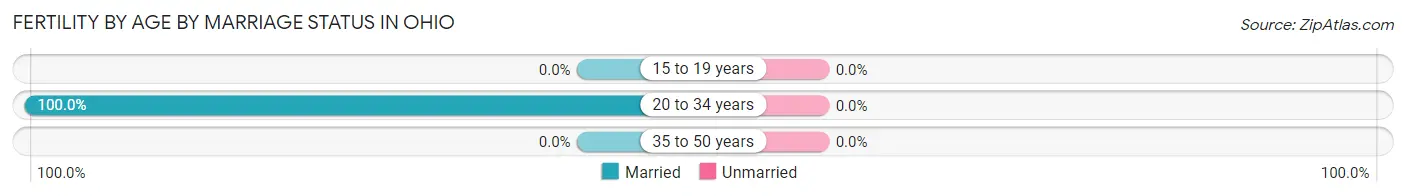
| Age Bracket | Married | Unmarried |
| 15 to 19 years | 0 (0.0%) | 0 (0.0%) |
| 20 to 34 years | 2 (100.0%) | 0 (0.0%) |
| 35 to 50 years | 0 (0.0%) | 0 (0.0%) |
| Total | 2 (100.0%) | 0 (0.0%) |
Fertility by Education in Ohio
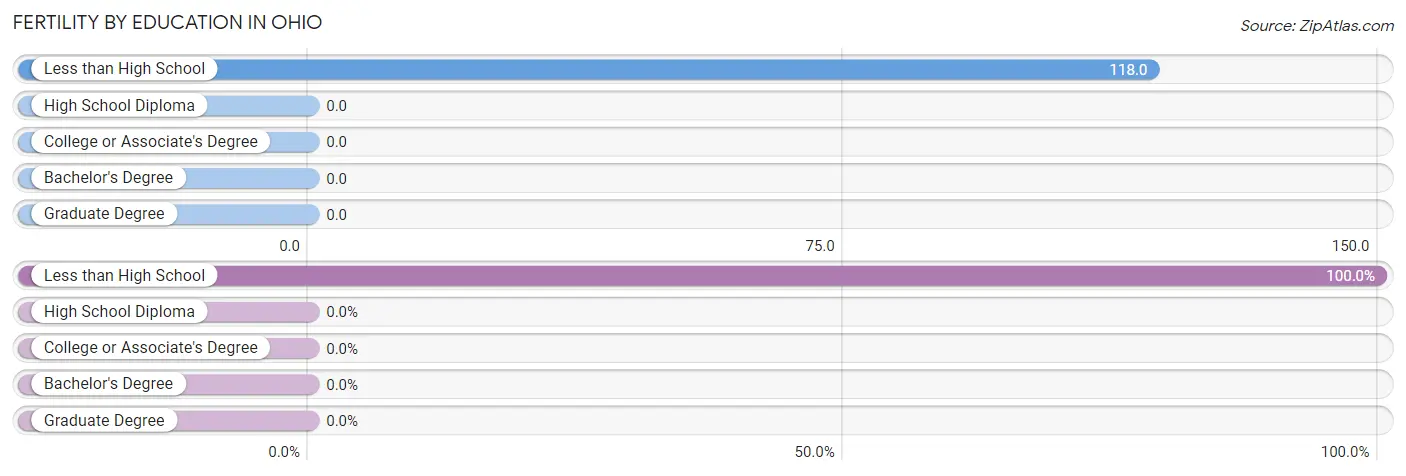
| Educational Attainment | Women with Births | Births / 1,000 Women |
| Less than High School | 2 (100.0%) | 118.0 |
| High School Diploma | 0 (0.0%) | 0.0 |
| College or Associate's Degree | 0 (0.0%) | 0.0 |
| Bachelor's Degree | 0 (0.0%) | 0.0 |
| Graduate Degree | 0 (0.0%) | 0.0 |
| Total | 2 (100.0%) | 17.0 |
Fertility by Education by Marriage Status in Ohio
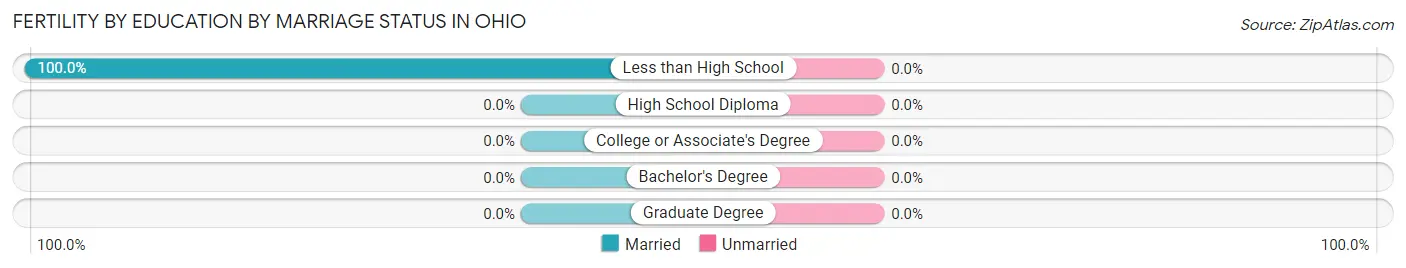
| Educational Attainment | Married | Unmarried |
| Less than High School | 2 (100.0%) | 0 (0.0%) |
| High School Diploma | 0 (0.0%) | 0 (0.0%) |
| College or Associate's Degree | 0 (0.0%) | 0 (0.0%) |
| Bachelor's Degree | 0 (0.0%) | 0 (0.0%) |
| Graduate Degree | 0 (0.0%) | 0 (0.0%) |
| Total | 2 (100.0%) | 0 (0.0%) |
Employment Characteristics in Ohio
Employment by Class of Employer in Ohio
Among the 288 employed individuals in Ohio, private company employees (211 | 73.3%), local government employees (35 | 12.1%), and not-for-profit organizations (26 | 9.0%) make up the most common classes of employment.
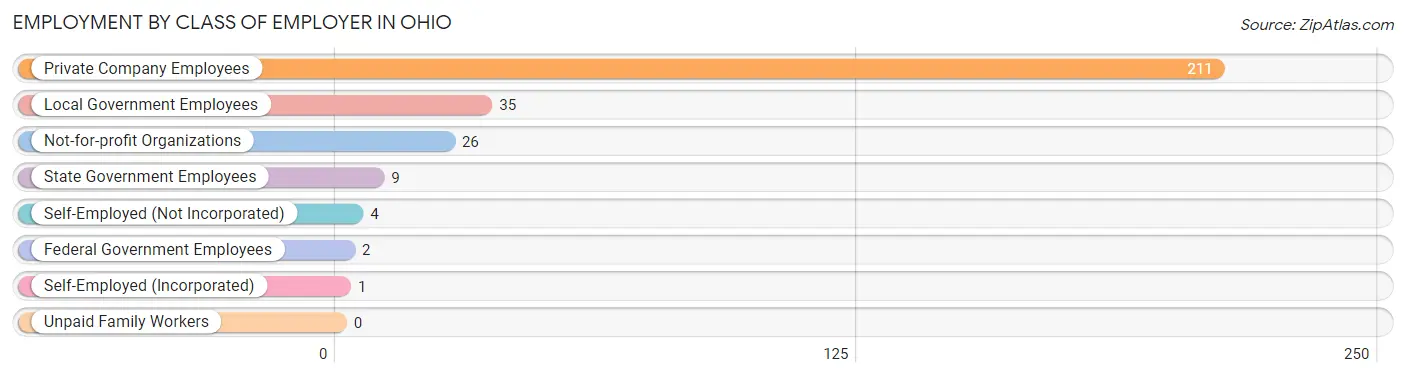
| Employer Class | # Employees | % Employees |
| Private Company Employees | 211 | 73.3% |
| Self-Employed (Incorporated) | 1 | 0.4% |
| Self-Employed (Not Incorporated) | 4 | 1.4% |
| Not-for-profit Organizations | 26 | 9.0% |
| Local Government Employees | 35 | 12.1% |
| State Government Employees | 9 | 3.1% |
| Federal Government Employees | 2 | 0.7% |
| Unpaid Family Workers | 0 | 0.0% |
| Total | 288 | 100.0% |
Employment Status by Age in Ohio
According to the labor force statistics for Ohio, out of the total population over 16 years of age (465), 71.8% or 334 individuals are in the labor force, with 12.3% or 41 of them unemployed. The age group with the highest labor force participation rate is 55 to 59 years, with 98.3% or 58 individuals in the labor force. Within the labor force, the 16 to 19 years age range has the highest percentage of unemployed individuals, with 52.6% or 10 of them being unemployed.
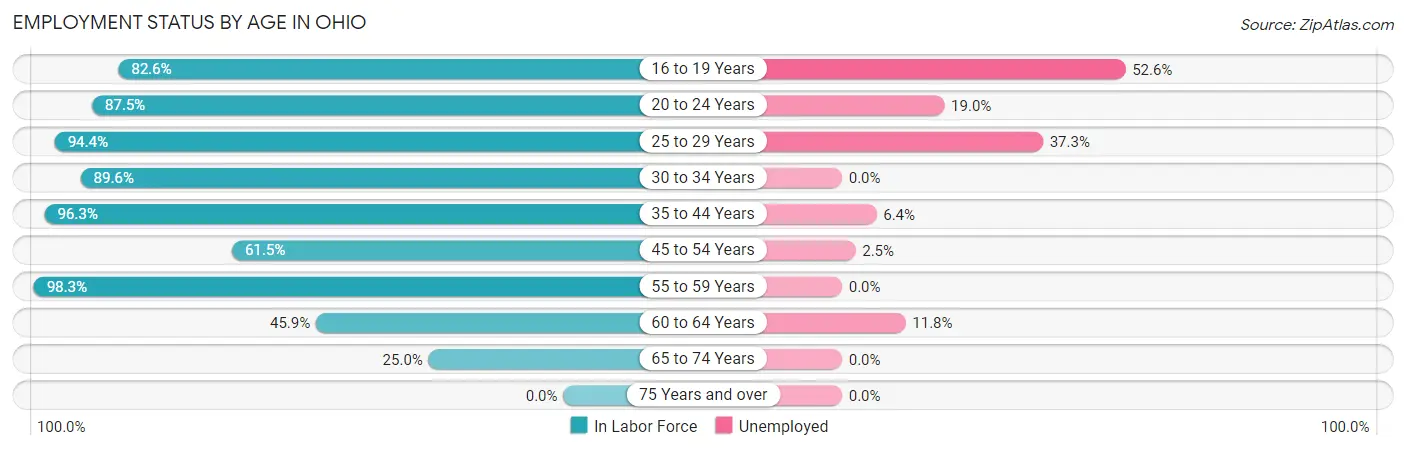
| Age Bracket | In Labor Force | Unemployed |
| 16 to 19 Years | 19 (82.6%) | 10 (52.6%) |
| 20 to 24 Years | 21 (87.5%) | 4 (19.0%) |
| 25 to 29 Years | 51 (94.4%) | 19 (37.3%) |
| 30 to 34 Years | 43 (89.6%) | 0 (0.0%) |
| 35 to 44 Years | 78 (96.3%) | 5 (6.4%) |
| 45 to 54 Years | 40 (61.5%) | 1 (2.5%) |
| 55 to 59 Years | 58 (98.3%) | 0 (0.0%) |
| 60 to 64 Years | 17 (45.9%) | 2 (11.8%) |
| 65 to 74 Years | 7 (25.0%) | 0 (0.0%) |
| 75 Years and over | 0 (0.0%) | 0 (0.0%) |
| Total | 334 (71.8%) | 41 (12.3%) |
Employment Status by Educational Attainment in Ohio
According to labor force statistics for Ohio, 83.4% of individuals (287) out of the total population between 25 and 64 years of age (344) are in the labor force, with 9.4% or 27 of them being unemployed. The group with the highest labor force participation rate are those with the educational attainment of less than high school, with 100.0% or 38 individuals in the labor force. Within the labor force, individuals with high school diploma education have the highest percentage of unemployment, with 14.6% or 12 of them being unemployed.
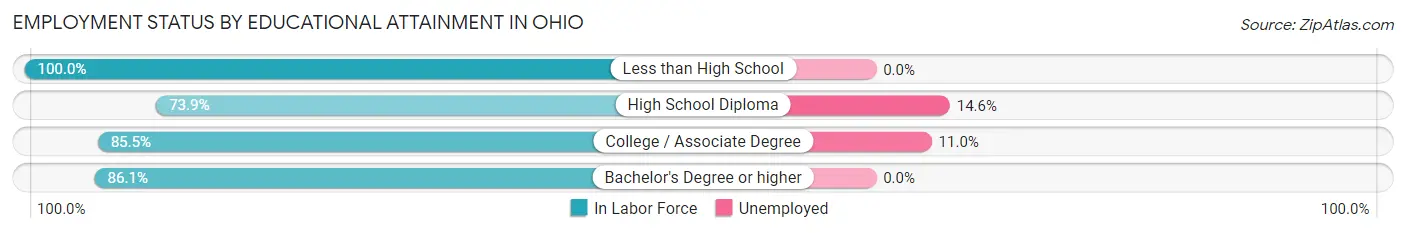
| Educational Attainment | In Labor Force | Unemployed |
| Less than High School | 38 (100.0%) | 0 (0.0%) |
| High School Diploma | 82 (73.9%) | 16 (14.6%) |
| College / Associate Degree | 136 (85.5%) | 17 (11.0%) |
| Bachelor's Degree or higher | 31 (86.1%) | 0 (0.0%) |
| Total | 287 (83.4%) | 32 (9.4%) |
Employment Occupations by Sex in Ohio
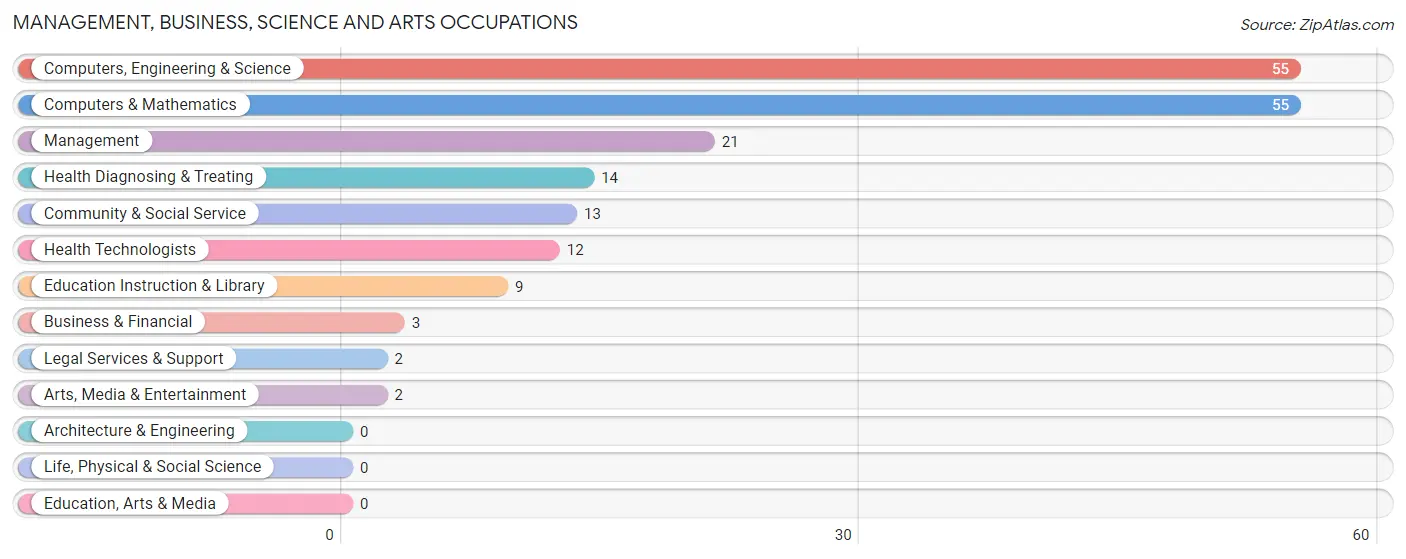
Management, Business, Science and Arts Occupations
The most common Management, Business, Science and Arts occupations in Ohio are Computers, Engineering & Science (55 | 18.8%), Computers & Mathematics (55 | 18.8%), Management (21 | 7.2%), Health Diagnosing & Treating (14 | 4.8%), and Community & Social Service (13 | 4.4%).
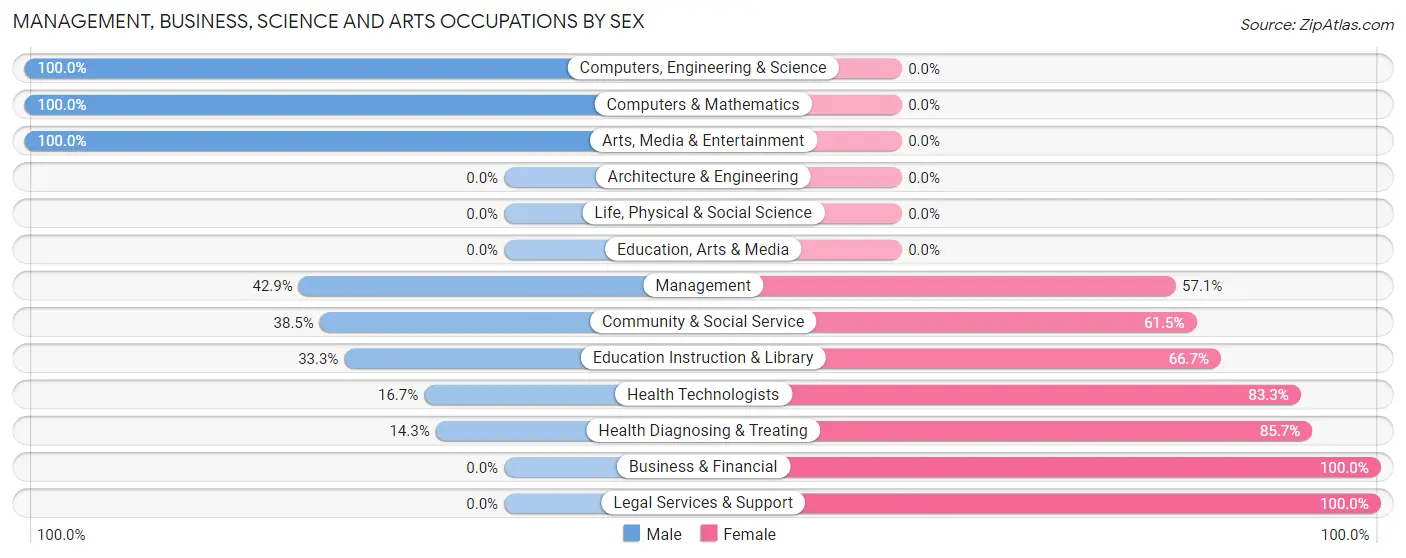
Management, Business, Science and Arts Occupations by Sex
Within the Management, Business, Science and Arts occupations in Ohio, the most male-oriented occupations are Computers, Engineering & Science (100.0%), Computers & Mathematics (100.0%), and Arts, Media & Entertainment (100.0%), while the most female-oriented occupations are Business & Financial (100.0%), Legal Services & Support (100.0%), and Health Diagnosing & Treating (85.7%).
| Occupation | Male | Female |
| Management | 9 (42.9%) | 12 (57.1%) |
| Business & Financial | 0 (0.0%) | 3 (100.0%) |
| Computers, Engineering & Science | 55 (100.0%) | 0 (0.0%) |
| Computers & Mathematics | 55 (100.0%) | 0 (0.0%) |
| Architecture & Engineering | 0 (0.0%) | 0 (0.0%) |
| Life, Physical & Social Science | 0 (0.0%) | 0 (0.0%) |
| Community & Social Service | 5 (38.5%) | 8 (61.5%) |
| Education, Arts & Media | 0 (0.0%) | 0 (0.0%) |
| Legal Services & Support | 0 (0.0%) | 2 (100.0%) |
| Education Instruction & Library | 3 (33.3%) | 6 (66.7%) |
| Arts, Media & Entertainment | 2 (100.0%) | 0 (0.0%) |
| Health Diagnosing & Treating | 2 (14.3%) | 12 (85.7%) |
| Health Technologists | 2 (16.7%) | 10 (83.3%) |
| Total (Category) | 71 (67.0%) | 35 (33.0%) |
| Total (Overall) | 153 (52.2%) | 140 (47.8%) |
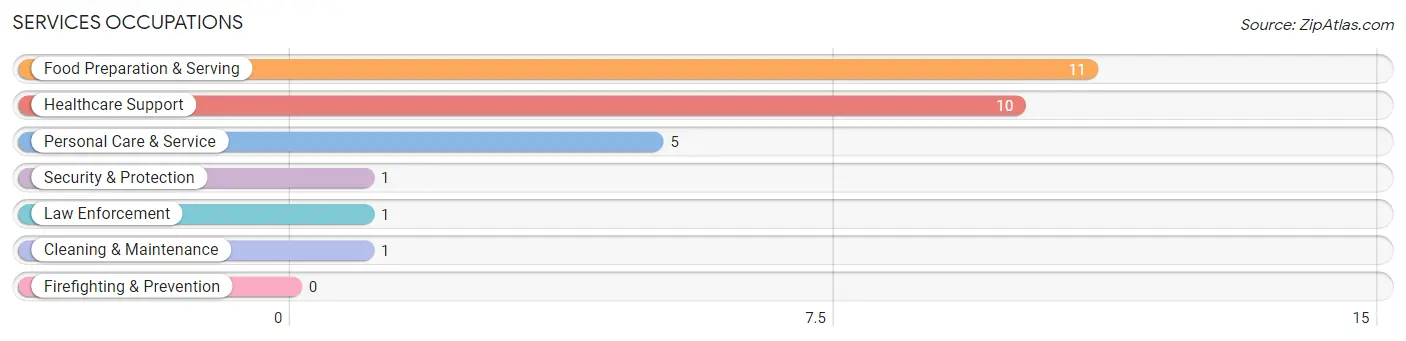
Services Occupations
The most common Services occupations in Ohio are Food Preparation & Serving (11 | 3.7%), Healthcare Support (10 | 3.4%), Personal Care & Service (5 | 1.7%), Security & Protection (1 | 0.3%), and Law Enforcement (1 | 0.3%).
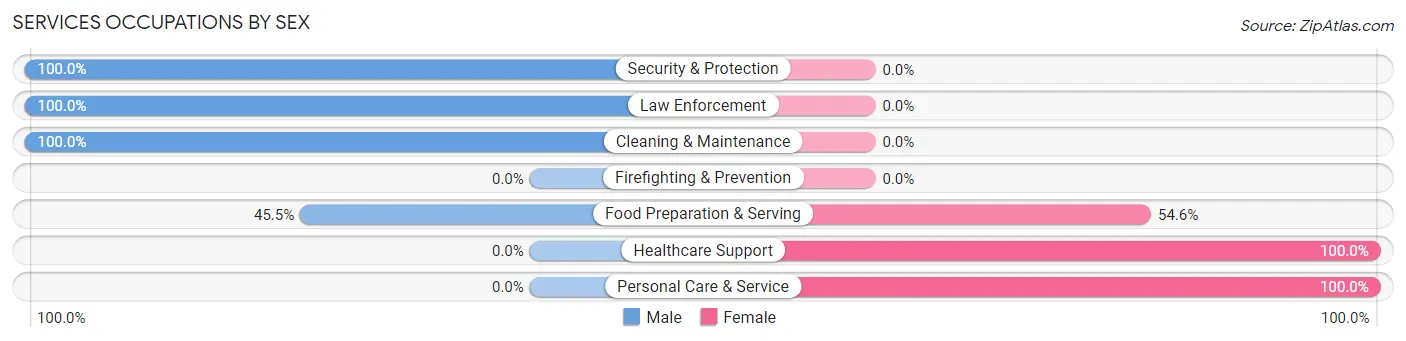
Services Occupations by Sex
Within the Services occupations in Ohio, the most male-oriented occupations are Security & Protection (100.0%), Law Enforcement (100.0%), and Cleaning & Maintenance (100.0%), while the most female-oriented occupations are Healthcare Support (100.0%), Personal Care & Service (100.0%), and Food Preparation & Serving (54.5%).
| Occupation | Male | Female |
| Healthcare Support | 0 (0.0%) | 10 (100.0%) |
| Security & Protection | 1 (100.0%) | 0 (0.0%) |
| Firefighting & Prevention | 0 (0.0%) | 0 (0.0%) |
| Law Enforcement | 1 (100.0%) | 0 (0.0%) |
| Food Preparation & Serving | 5 (45.5%) | 6 (54.5%) |
| Cleaning & Maintenance | 1 (100.0%) | 0 (0.0%) |
| Personal Care & Service | 0 (0.0%) | 5 (100.0%) |
| Total (Category) | 7 (25.0%) | 21 (75.0%) |
| Total (Overall) | 153 (52.2%) | 140 (47.8%) |
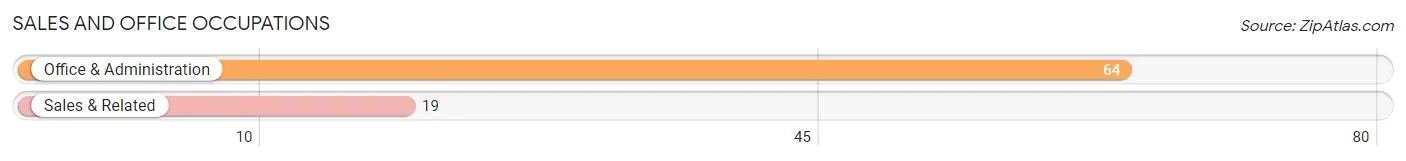
Sales and Office Occupations
The most common Sales and Office occupations in Ohio are Office & Administration (64 | 21.8%), and Sales & Related (19 | 6.5%).
Sales and Office Occupations by Sex
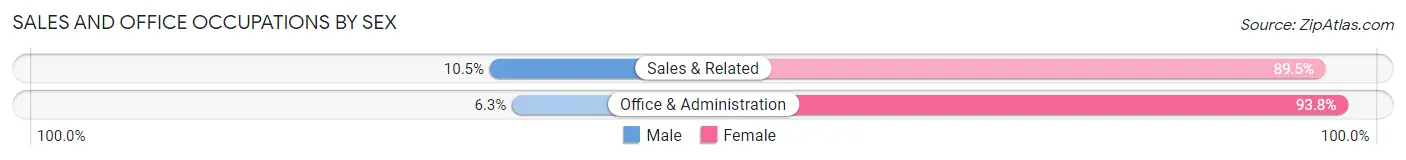
| Occupation | Male | Female |
| Sales & Related | 2 (10.5%) | 17 (89.5%) |
| Office & Administration | 4 (6.2%) | 60 (93.8%) |
| Total (Category) | 6 (7.2%) | 77 (92.8%) |
| Total (Overall) | 153 (52.2%) | 140 (47.8%) |
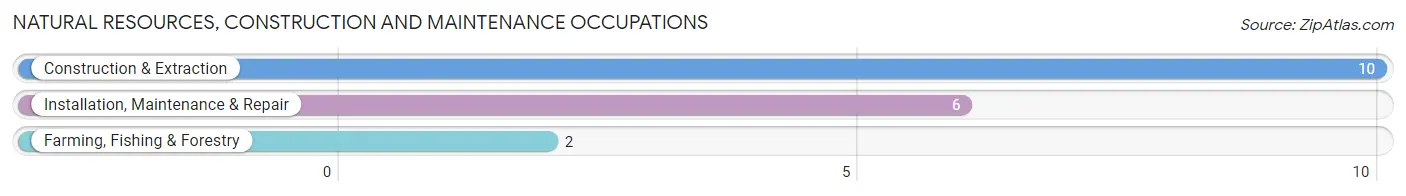
Natural Resources, Construction and Maintenance Occupations
The most common Natural Resources, Construction and Maintenance occupations in Ohio are Construction & Extraction (10 | 3.4%), Installation, Maintenance & Repair (6 | 2.1%), and Farming, Fishing & Forestry (2 | 0.7%).
Natural Resources, Construction and Maintenance Occupations by Sex
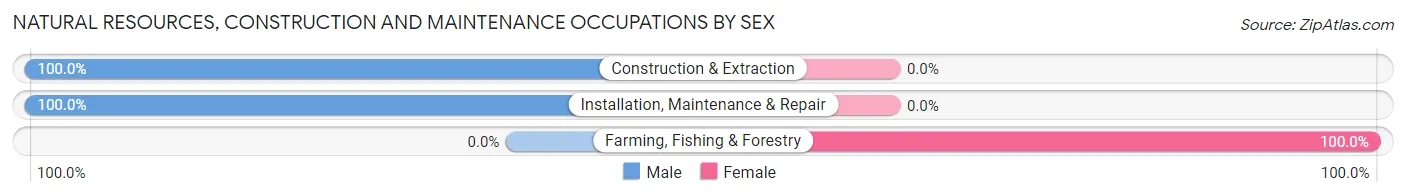
| Occupation | Male | Female |
| Farming, Fishing & Forestry | 0 (0.0%) | 2 (100.0%) |
| Construction & Extraction | 10 (100.0%) | 0 (0.0%) |
| Installation, Maintenance & Repair | 6 (100.0%) | 0 (0.0%) |
| Total (Category) | 16 (88.9%) | 2 (11.1%) |
| Total (Overall) | 153 (52.2%) | 140 (47.8%) |
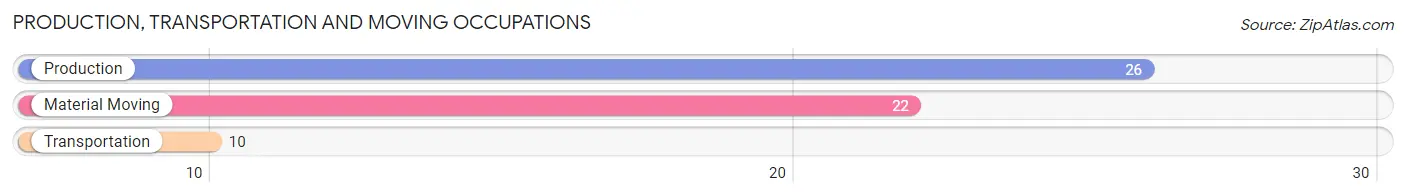
Production, Transportation and Moving Occupations
The most common Production, Transportation and Moving occupations in Ohio are Production (26 | 8.9%), Material Moving (22 | 7.5%), and Transportation (10 | 3.4%).
Production, Transportation and Moving Occupations by Sex
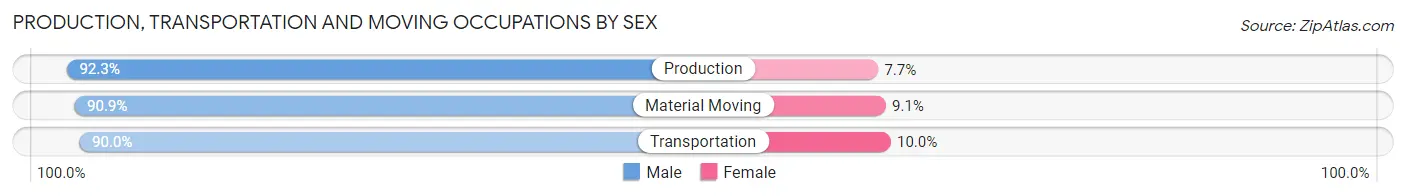
| Occupation | Male | Female |
| Production | 24 (92.3%) | 2 (7.7%) |
| Transportation | 9 (90.0%) | 1 (10.0%) |
| Material Moving | 20 (90.9%) | 2 (9.1%) |
| Total (Category) | 53 (91.4%) | 5 (8.6%) |
| Total (Overall) | 153 (52.2%) | 140 (47.8%) |
Employment Industries by Sex in Ohio
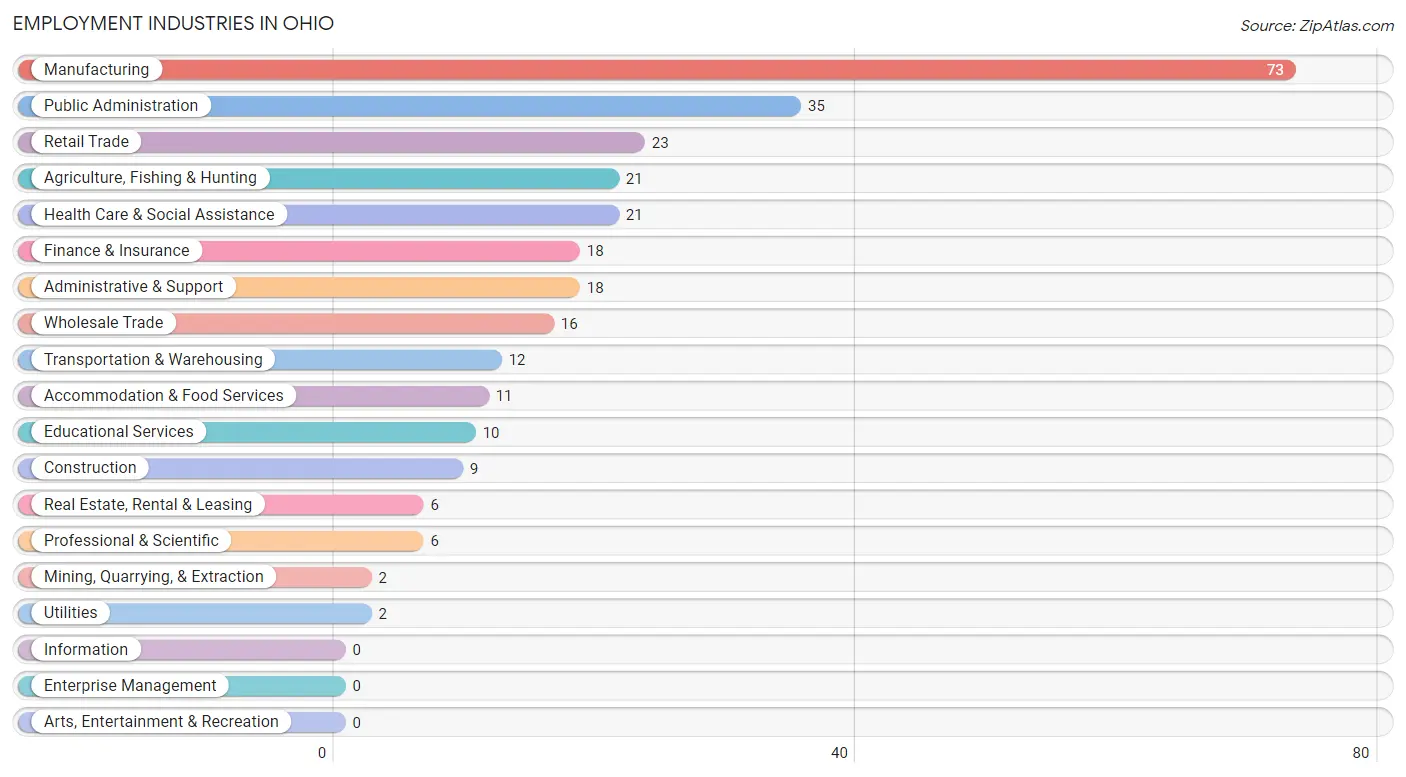
Employment Industries in Ohio
The major employment industries in Ohio include Manufacturing (73 | 24.9%), Public Administration (35 | 11.9%), Retail Trade (23 | 7.9%), Agriculture, Fishing & Hunting (21 | 7.2%), and Health Care & Social Assistance (21 | 7.2%).
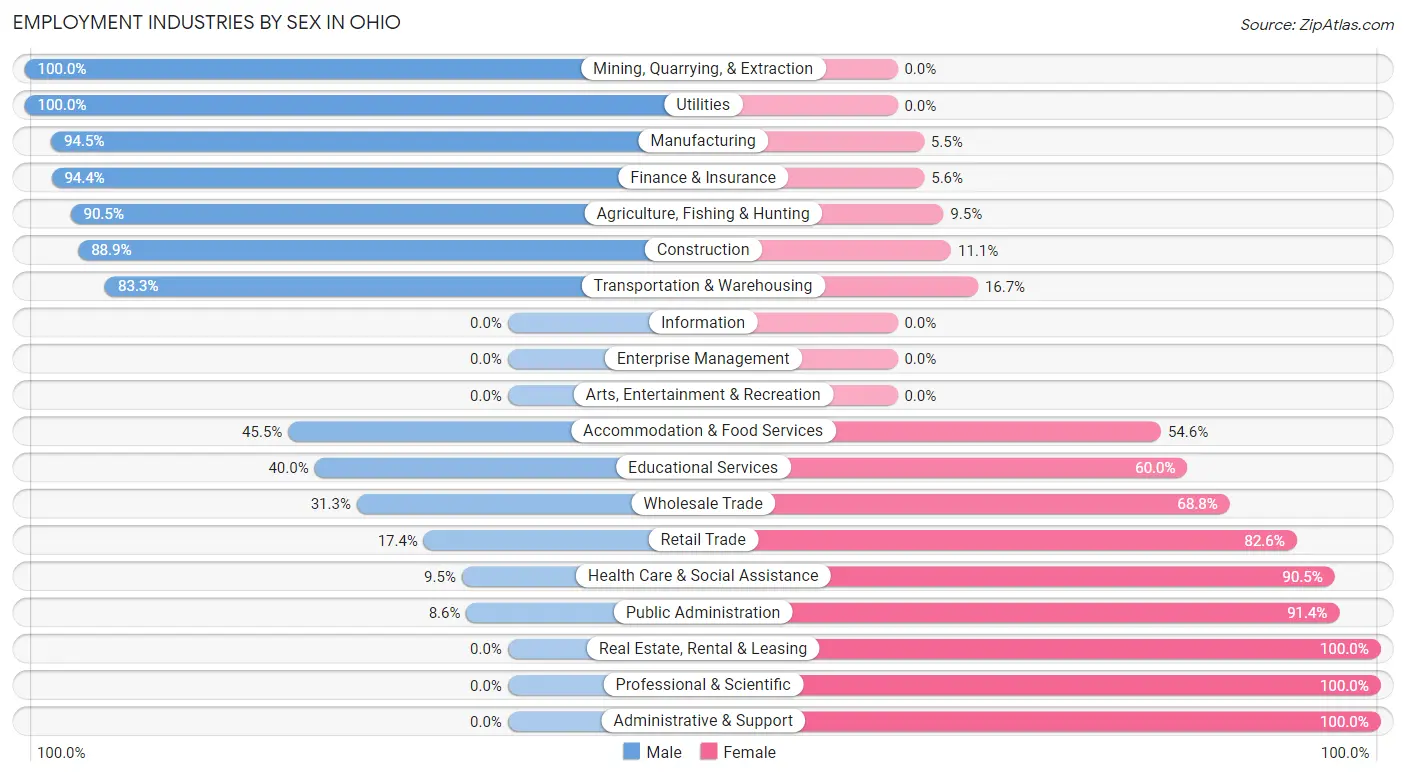
Employment Industries by Sex in Ohio
The Ohio industries that see more men than women are Mining, Quarrying, & Extraction (100.0%), Utilities (100.0%), and Manufacturing (94.5%), whereas the industries that tend to have a higher number of women are Real Estate, Rental & Leasing (100.0%), Professional & Scientific (100.0%), and Administrative & Support (100.0%).
| Industry | Male | Female |
| Agriculture, Fishing & Hunting | 19 (90.5%) | 2 (9.5%) |
| Mining, Quarrying, & Extraction | 2 (100.0%) | 0 (0.0%) |
| Construction | 8 (88.9%) | 1 (11.1%) |
| Manufacturing | 69 (94.5%) | 4 (5.5%) |
| Wholesale Trade | 5 (31.2%) | 11 (68.8%) |
| Retail Trade | 4 (17.4%) | 19 (82.6%) |
| Transportation & Warehousing | 10 (83.3%) | 2 (16.7%) |
| Utilities | 2 (100.0%) | 0 (0.0%) |
| Information | 0 (0.0%) | 0 (0.0%) |
| Finance & Insurance | 17 (94.4%) | 1 (5.6%) |
| Real Estate, Rental & Leasing | 0 (0.0%) | 6 (100.0%) |
| Professional & Scientific | 0 (0.0%) | 6 (100.0%) |
| Enterprise Management | 0 (0.0%) | 0 (0.0%) |
| Administrative & Support | 0 (0.0%) | 18 (100.0%) |
| Educational Services | 4 (40.0%) | 6 (60.0%) |
| Health Care & Social Assistance | 2 (9.5%) | 19 (90.5%) |
| Arts, Entertainment & Recreation | 0 (0.0%) | 0 (0.0%) |
| Accommodation & Food Services | 5 (45.5%) | 6 (54.5%) |
| Public Administration | 3 (8.6%) | 32 (91.4%) |
| Total | 153 (52.2%) | 140 (47.8%) |
Education in Ohio
School Enrollment in Ohio
The most common levels of schooling among the 113 students in Ohio are elementary school (38 | 33.6%), kindergarten (20 | 17.7%), and middle school (17 | 15.0%).
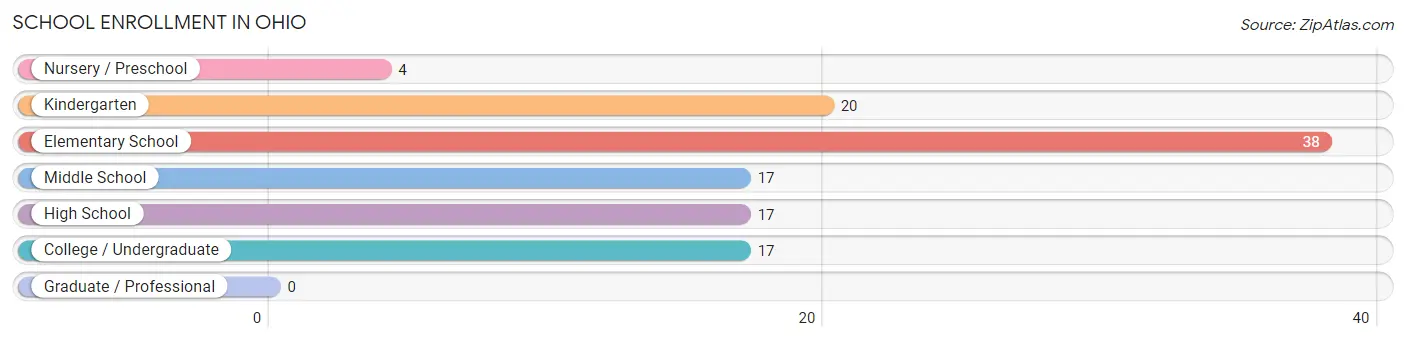
| School Level | # Students | % Students |
| Nursery / Preschool | 4 | 3.5% |
| Kindergarten | 20 | 17.7% |
| Elementary School | 38 | 33.6% |
| Middle School | 17 | 15.0% |
| High School | 17 | 15.0% |
| College / Undergraduate | 17 | 15.0% |
| Graduate / Professional | 0 | 0.0% |
| Total | 113 | 100.0% |
School Enrollment by Age by Funding Source in Ohio
Out of a total of 113 students who are enrolled in schools in Ohio, 1 (0.9%) attend a private institution, while the remaining 112 (99.1%) are enrolled in public schools. The age group of 15 to 17 year olds has the highest likelihood of being enrolled in private schools, with 1 (12.5% in the age bracket) enrolled. Conversely, the age group of 3 to 4 year olds has the lowest likelihood of being enrolled in a private school, with 4 (100.0% in the age bracket) attending a public institution.
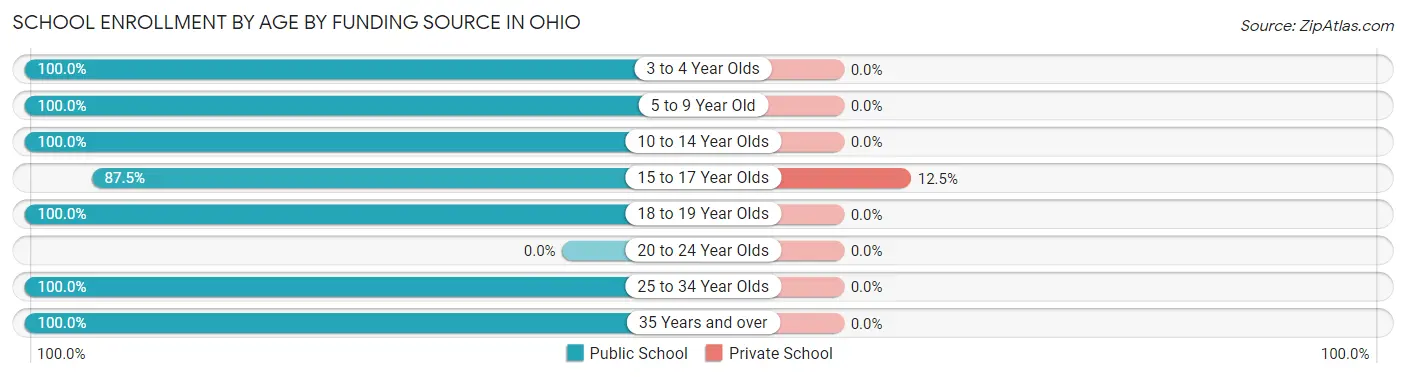
| Age Bracket | Public School | Private School |
| 3 to 4 Year Olds | 4 (100.0%) | 0 (0.0%) |
| 5 to 9 Year Old | 56 (100.0%) | 0 (0.0%) |
| 10 to 14 Year Olds | 26 (100.0%) | 0 (0.0%) |
| 15 to 17 Year Olds | 7 (87.5%) | 1 (12.5%) |
| 18 to 19 Year Olds | 5 (100.0%) | 0 (0.0%) |
| 20 to 24 Year Olds | 0 (0.0%) | 0 (0.0%) |
| 25 to 34 Year Olds | 9 (100.0%) | 0 (0.0%) |
| 35 Years and over | 5 (100.0%) | 0 (0.0%) |
| Total | 112 (99.1%) | 1 (0.9%) |
Educational Attainment by Field of Study in Ohio
Education (12 | 27.3%), liberal arts & history (9 | 20.4%), arts & humanities (7 | 15.9%), science & technology (6 | 13.6%), and business (4 | 9.1%) are the most common fields of study among 44 individuals in Ohio who have obtained a bachelor's degree or higher.
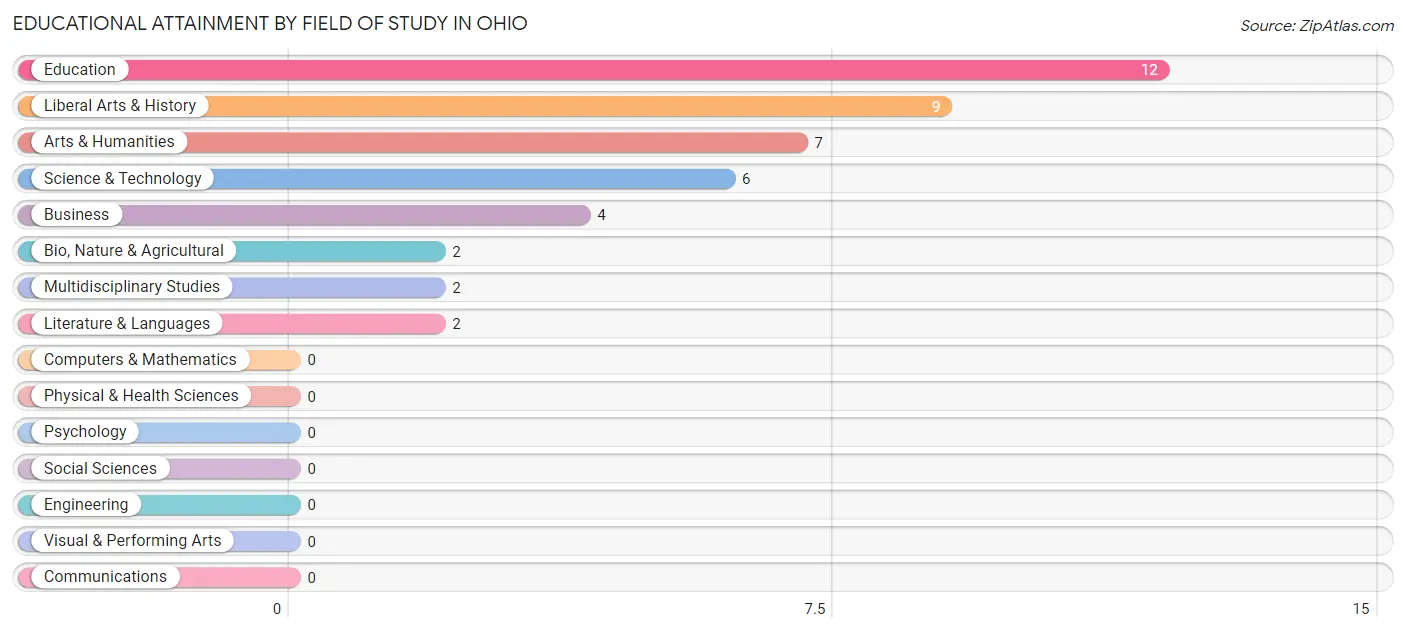
| Field of Study | # Graduates | % Graduates |
| Computers & Mathematics | 0 | 0.0% |
| Bio, Nature & Agricultural | 2 | 4.5% |
| Physical & Health Sciences | 0 | 0.0% |
| Psychology | 0 | 0.0% |
| Social Sciences | 0 | 0.0% |
| Engineering | 0 | 0.0% |
| Multidisciplinary Studies | 2 | 4.5% |
| Science & Technology | 6 | 13.6% |
| Business | 4 | 9.1% |
| Education | 12 | 27.3% |
| Literature & Languages | 2 | 4.5% |
| Liberal Arts & History | 9 | 20.4% |
| Visual & Performing Arts | 0 | 0.0% |
| Communications | 0 | 0.0% |
| Arts & Humanities | 7 | 15.9% |
| Total | 44 | 100.0% |
Transportation & Commute in Ohio
Vehicle Availability by Sex in Ohio
The most prevalent vehicle ownership categories in Ohio are males with 2 vehicles (87, accounting for 58.8%) and females with 2 vehicles (65, making up 62.1%).
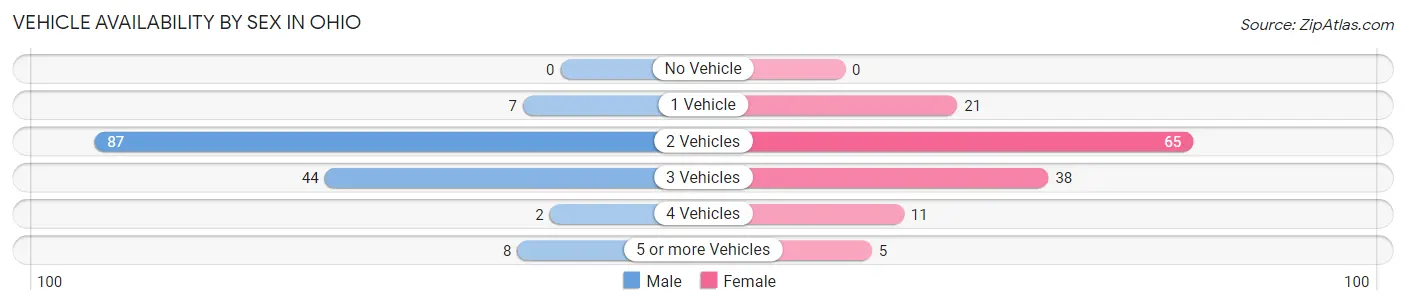
| Vehicles Available | Male | Female |
| No Vehicle | 0 (0.0%) | 0 (0.0%) |
| 1 Vehicle | 7 (4.7%) | 21 (15.0%) |
| 2 Vehicles | 87 (58.8%) | 65 (46.4%) |
| 3 Vehicles | 44 (29.7%) | 38 (27.1%) |
| 4 Vehicles | 2 (1.3%) | 11 (7.9%) |
| 5 or more Vehicles | 8 (5.4%) | 5 (3.6%) |
| Total | 148 (100.0%) | 140 (100.0%) |
Commute Time in Ohio
The most frequently occuring commute durations in Ohio are 25 to 29 minutes (125 commuters, 43.7%), 20 to 24 minutes (37 commuters, 12.9%), and 30 to 34 minutes (32 commuters, 11.2%).
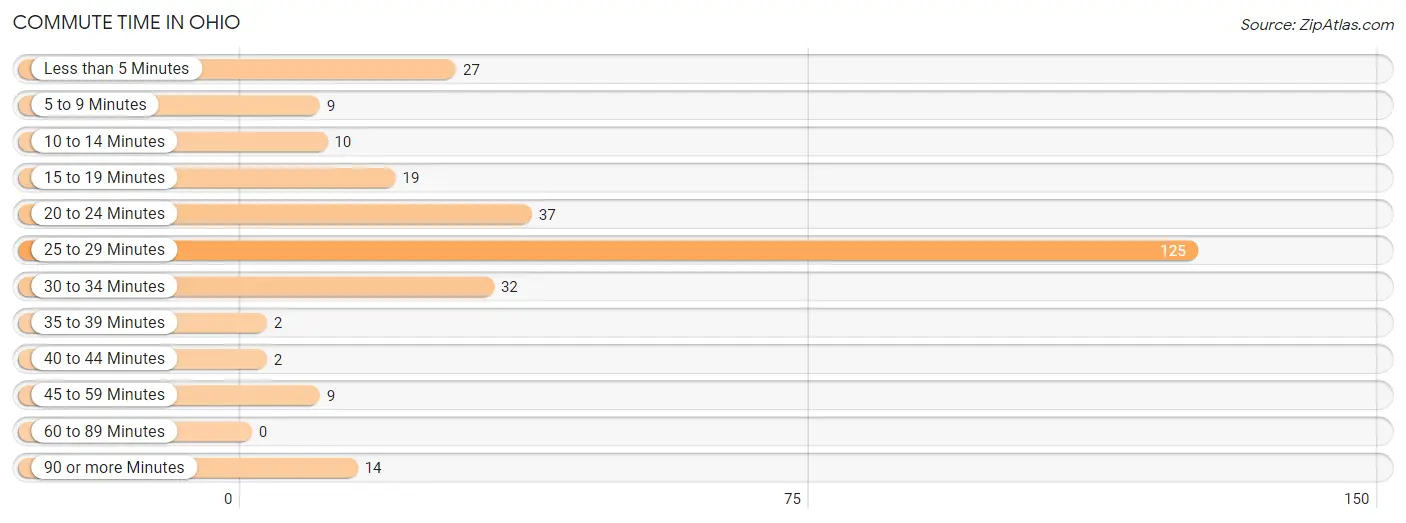
| Commute Time | # Commuters | % Commuters |
| Less than 5 Minutes | 27 | 9.4% |
| 5 to 9 Minutes | 9 | 3.2% |
| 10 to 14 Minutes | 10 | 3.5% |
| 15 to 19 Minutes | 19 | 6.6% |
| 20 to 24 Minutes | 37 | 12.9% |
| 25 to 29 Minutes | 125 | 43.7% |
| 30 to 34 Minutes | 32 | 11.2% |
| 35 to 39 Minutes | 2 | 0.7% |
| 40 to 44 Minutes | 2 | 0.7% |
| 45 to 59 Minutes | 9 | 3.2% |
| 60 to 89 Minutes | 0 | 0.0% |
| 90 or more Minutes | 14 | 4.9% |
Commute Time by Sex in Ohio
The most common commute times in Ohio are 25 to 29 minutes (81 commuters, 54.7%) for males and 25 to 29 minutes (44 commuters, 31.9%) for females.
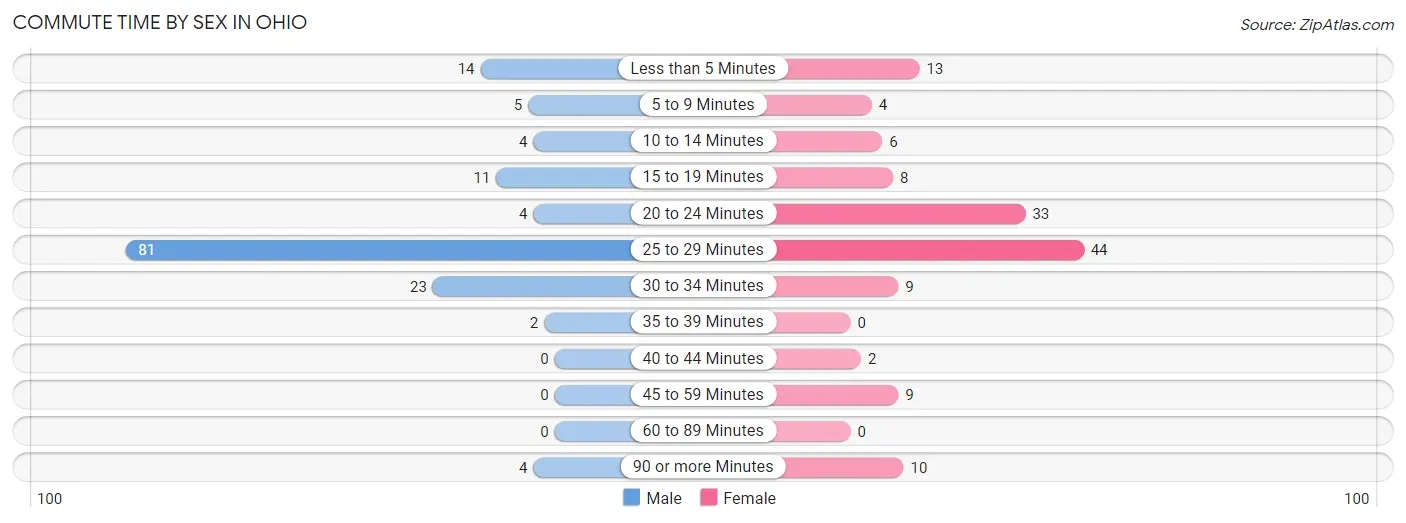
| Commute Time | Male | Female |
| Less than 5 Minutes | 14 (9.5%) | 13 (9.4%) |
| 5 to 9 Minutes | 5 (3.4%) | 4 (2.9%) |
| 10 to 14 Minutes | 4 (2.7%) | 6 (4.3%) |
| 15 to 19 Minutes | 11 (7.4%) | 8 (5.8%) |
| 20 to 24 Minutes | 4 (2.7%) | 33 (23.9%) |
| 25 to 29 Minutes | 81 (54.7%) | 44 (31.9%) |
| 30 to 34 Minutes | 23 (15.5%) | 9 (6.5%) |
| 35 to 39 Minutes | 2 (1.3%) | 0 (0.0%) |
| 40 to 44 Minutes | 0 (0.0%) | 2 (1.5%) |
| 45 to 59 Minutes | 0 (0.0%) | 9 (6.5%) |
| 60 to 89 Minutes | 0 (0.0%) | 0 (0.0%) |
| 90 or more Minutes | 4 (2.7%) | 10 (7.2%) |
Time of Departure to Work by Sex in Ohio
The most frequent times of departure to work in Ohio are 7:00 AM to 7:29 AM (49, 33.1%) for males and 12:00 PM to 3:59 PM (53, 38.4%) for females.
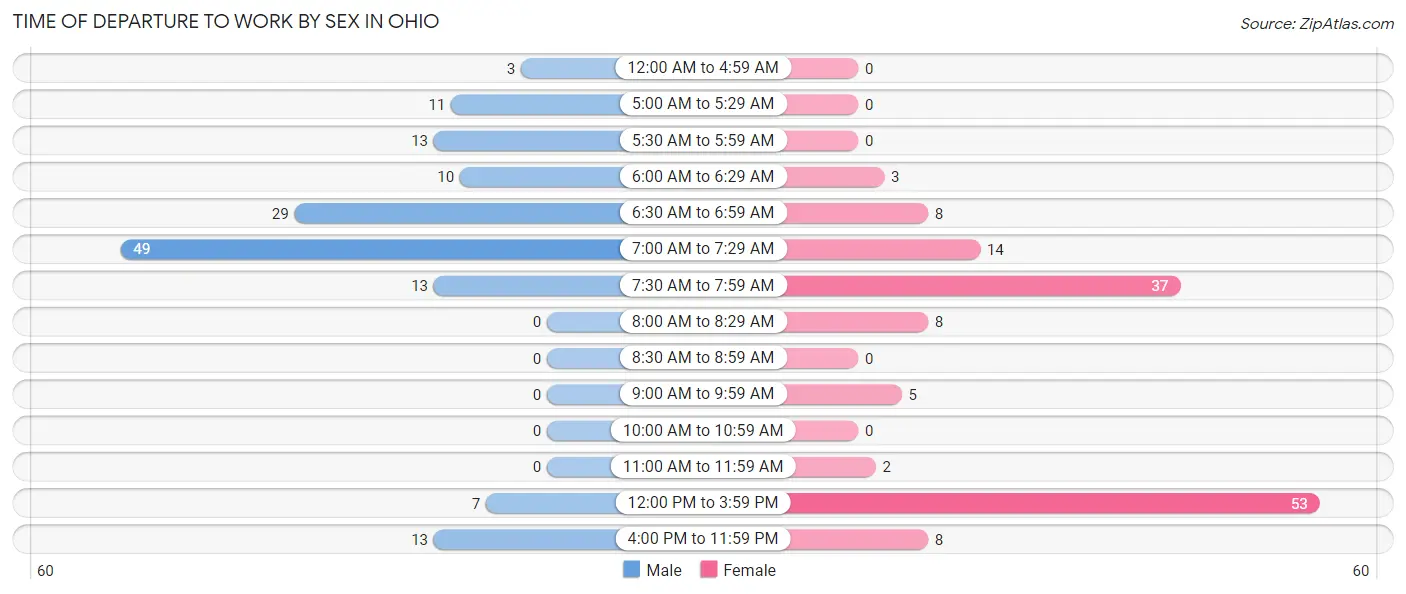
| Time of Departure | Male | Female |
| 12:00 AM to 4:59 AM | 3 (2.0%) | 0 (0.0%) |
| 5:00 AM to 5:29 AM | 11 (7.4%) | 0 (0.0%) |
| 5:30 AM to 5:59 AM | 13 (8.8%) | 0 (0.0%) |
| 6:00 AM to 6:29 AM | 10 (6.8%) | 3 (2.2%) |
| 6:30 AM to 6:59 AM | 29 (19.6%) | 8 (5.8%) |
| 7:00 AM to 7:29 AM | 49 (33.1%) | 14 (10.1%) |
| 7:30 AM to 7:59 AM | 13 (8.8%) | 37 (26.8%) |
| 8:00 AM to 8:29 AM | 0 (0.0%) | 8 (5.8%) |
| 8:30 AM to 8:59 AM | 0 (0.0%) | 0 (0.0%) |
| 9:00 AM to 9:59 AM | 0 (0.0%) | 5 (3.6%) |
| 10:00 AM to 10:59 AM | 0 (0.0%) | 0 (0.0%) |
| 11:00 AM to 11:59 AM | 0 (0.0%) | 2 (1.5%) |
| 12:00 PM to 3:59 PM | 7 (4.7%) | 53 (38.4%) |
| 4:00 PM to 11:59 PM | 13 (8.8%) | 8 (5.8%) |
| Total | 148 (100.0%) | 138 (100.0%) |
Housing Occupancy in Ohio
Occupancy by Ownership in Ohio
Of the total 225 dwellings in Ohio, owner-occupied units account for 177 (78.7%), while renter-occupied units make up 48 (21.3%).
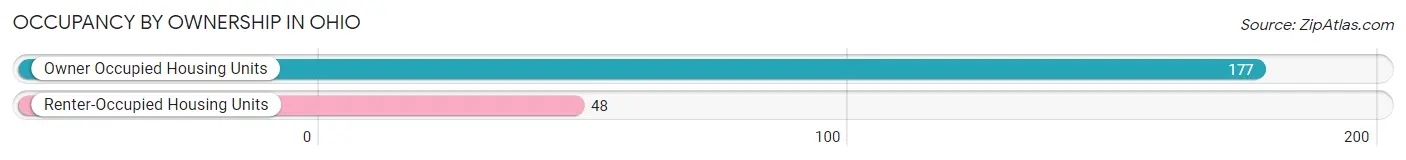
| Occupancy | # Housing Units | % Housing Units |
| Owner Occupied Housing Units | 177 | 78.7% |
| Renter-Occupied Housing Units | 48 | 21.3% |
| Total Occupied Housing Units | 225 | 100.0% |
Occupancy by Household Size in Ohio
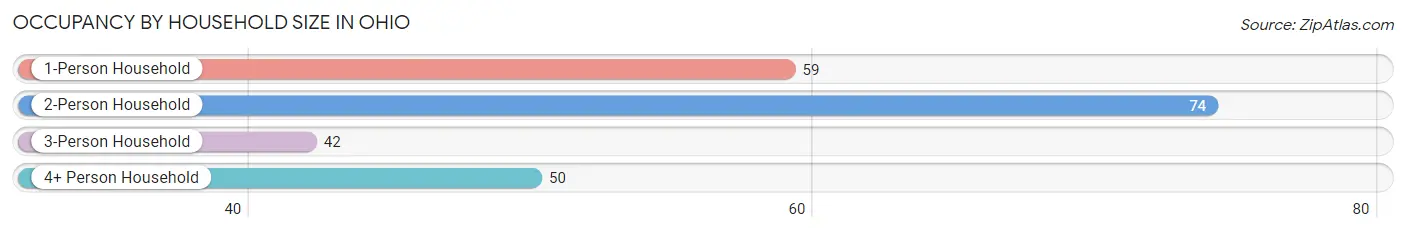
| Household Size | # Housing Units | % Housing Units |
| 1-Person Household | 59 | 26.2% |
| 2-Person Household | 74 | 32.9% |
| 3-Person Household | 42 | 18.7% |
| 4+ Person Household | 50 | 22.2% |
| Total Housing Units | 225 | 100.0% |
Occupancy by Ownership by Household Size in Ohio
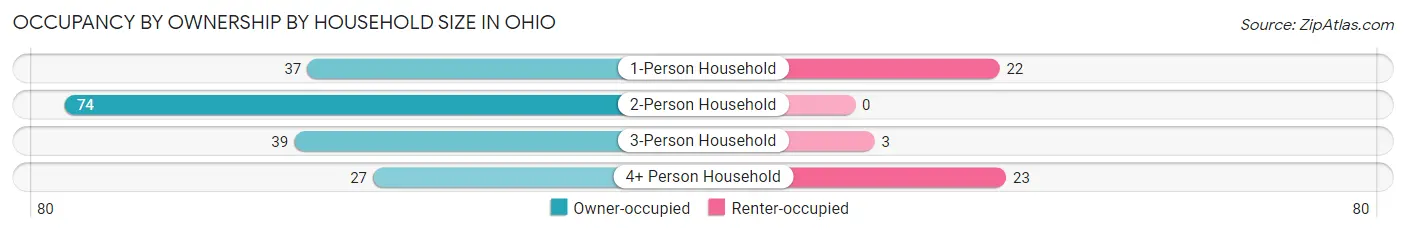
| Household Size | Owner-occupied | Renter-occupied |
| 1-Person Household | 37 (62.7%) | 22 (37.3%) |
| 2-Person Household | 74 (100.0%) | 0 (0.0%) |
| 3-Person Household | 39 (92.9%) | 3 (7.1%) |
| 4+ Person Household | 27 (54.0%) | 23 (46.0%) |
| Total Housing Units | 177 (78.7%) | 48 (21.3%) |
Occupancy by Educational Attainment in Ohio
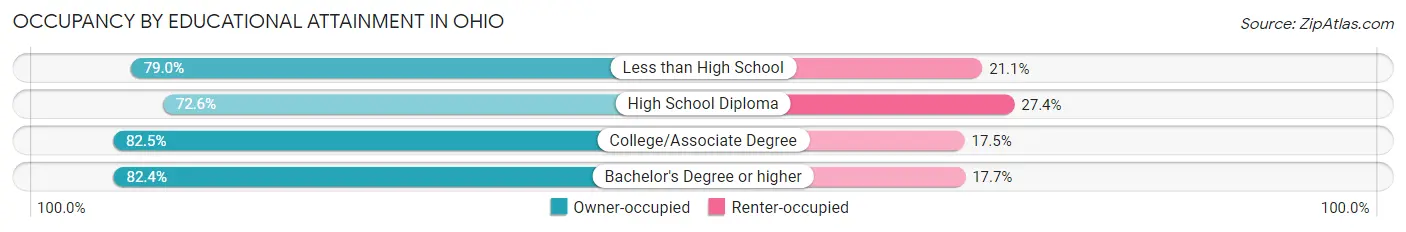
| Household Size | Owner-occupied | Renter-occupied |
| Less than High School | 30 (78.9%) | 8 (21.0%) |
| High School Diploma | 53 (72.6%) | 20 (27.4%) |
| College/Associate Degree | 80 (82.5%) | 17 (17.5%) |
| Bachelor's Degree or higher | 14 (82.4%) | 3 (17.6%) |
Occupancy by Age of Householder in Ohio
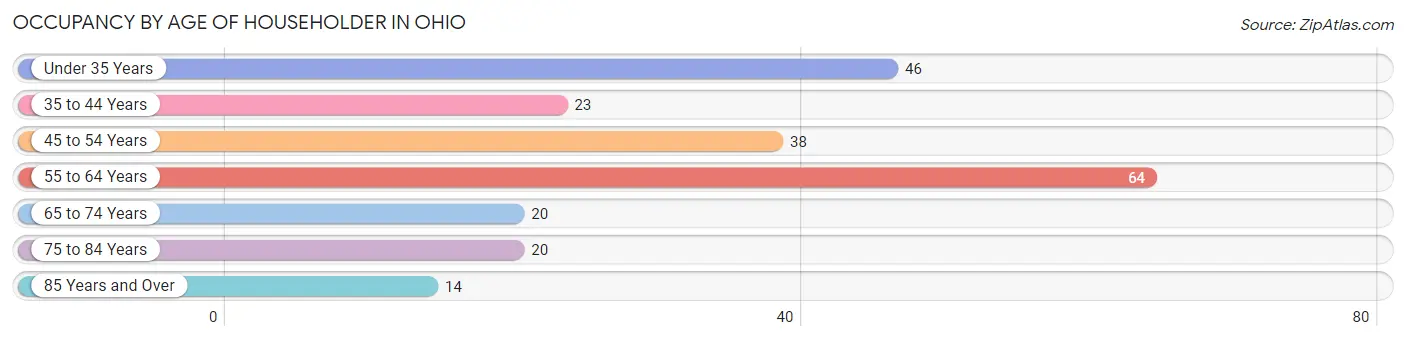
| Age Bracket | # Households | % Households |
| Under 35 Years | 46 | 20.4% |
| 35 to 44 Years | 23 | 10.2% |
| 45 to 54 Years | 38 | 16.9% |
| 55 to 64 Years | 64 | 28.4% |
| 65 to 74 Years | 20 | 8.9% |
| 75 to 84 Years | 20 | 8.9% |
| 85 Years and Over | 14 | 6.2% |
| Total | 225 | 100.0% |
Housing Finances in Ohio
Median Income by Occupancy in Ohio
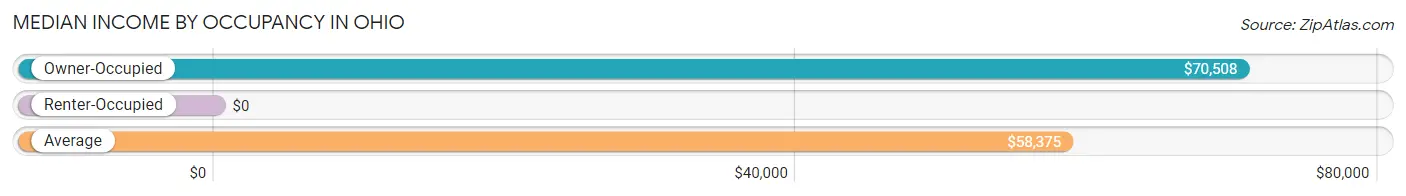
| Occupancy Type | # Households | Median Income |
| Owner-Occupied | 177 (78.7%) | $70,508 |
| Renter-Occupied | 48 (21.3%) | $0 |
| Average | 225 (100.0%) | $58,375 |
Occupancy by Householder Income Bracket in Ohio
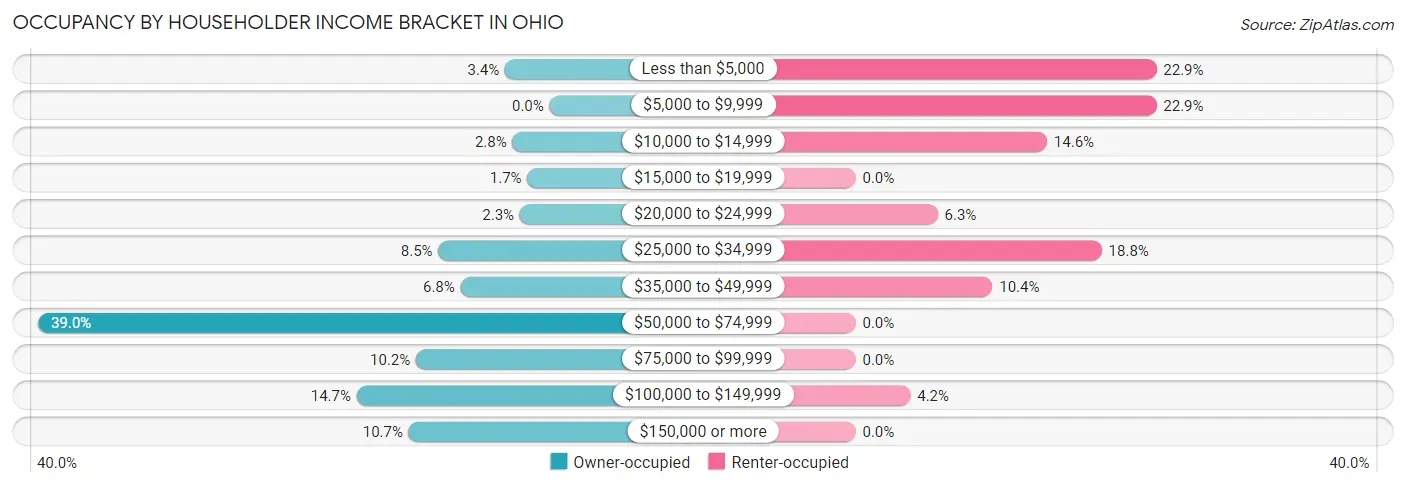
| Income Bracket | Owner-occupied | Renter-occupied |
| Less than $5,000 | 6 (3.4%) | 11 (22.9%) |
| $5,000 to $9,999 | 0 (0.0%) | 11 (22.9%) |
| $10,000 to $14,999 | 5 (2.8%) | 7 (14.6%) |
| $15,000 to $19,999 | 3 (1.7%) | 0 (0.0%) |
| $20,000 to $24,999 | 4 (2.3%) | 3 (6.2%) |
| $25,000 to $34,999 | 15 (8.5%) | 9 (18.8%) |
| $35,000 to $49,999 | 12 (6.8%) | 5 (10.4%) |
| $50,000 to $74,999 | 69 (39.0%) | 0 (0.0%) |
| $75,000 to $99,999 | 18 (10.2%) | 0 (0.0%) |
| $100,000 to $149,999 | 26 (14.7%) | 2 (4.2%) |
| $150,000 or more | 19 (10.7%) | 0 (0.0%) |
| Total | 177 (100.0%) | 48 (100.0%) |
Monthly Housing Cost Tiers in Ohio
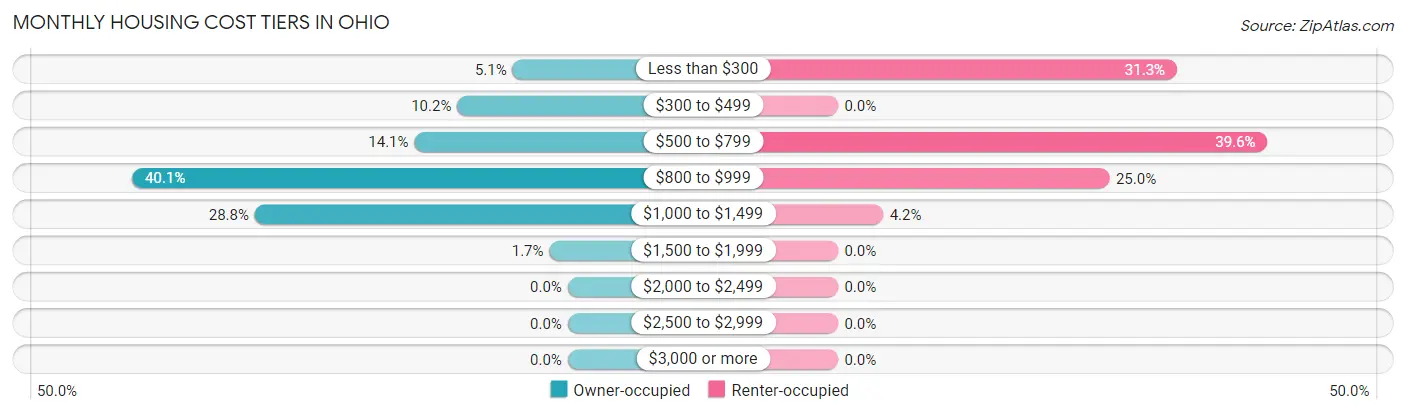
| Monthly Cost | Owner-occupied | Renter-occupied |
| Less than $300 | 9 (5.1%) | 15 (31.2%) |
| $300 to $499 | 18 (10.2%) | 0 (0.0%) |
| $500 to $799 | 25 (14.1%) | 19 (39.6%) |
| $800 to $999 | 71 (40.1%) | 12 (25.0%) |
| $1,000 to $1,499 | 51 (28.8%) | 2 (4.2%) |
| $1,500 to $1,999 | 3 (1.7%) | 0 (0.0%) |
| $2,000 to $2,499 | 0 (0.0%) | 0 (0.0%) |
| $2,500 to $2,999 | 0 (0.0%) | 0 (0.0%) |
| $3,000 or more | 0 (0.0%) | 0 (0.0%) |
| Total | 177 (100.0%) | 48 (100.0%) |
Physical Housing Characteristics in Ohio
Housing Structures in Ohio
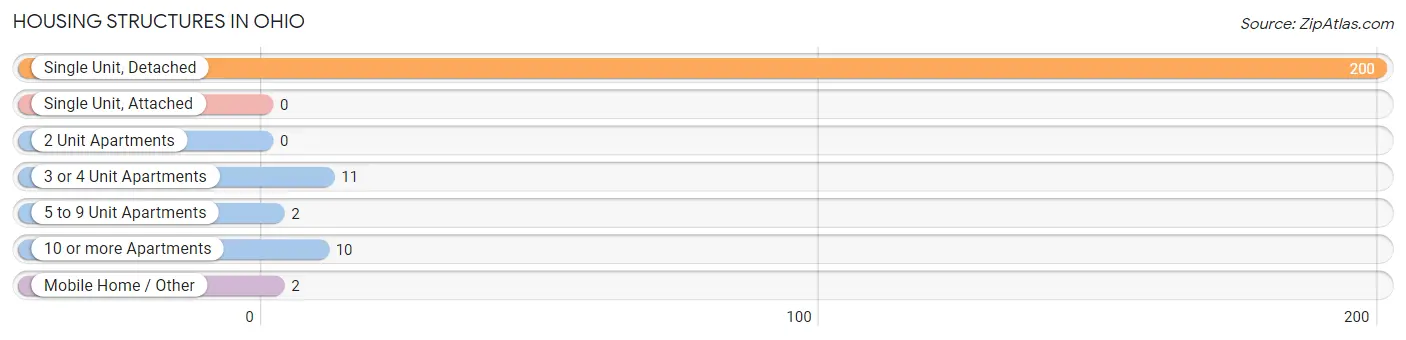
| Structure Type | # Housing Units | % Housing Units |
| Single Unit, Detached | 200 | 88.9% |
| Single Unit, Attached | 0 | 0.0% |
| 2 Unit Apartments | 0 | 0.0% |
| 3 or 4 Unit Apartments | 11 | 4.9% |
| 5 to 9 Unit Apartments | 2 | 0.9% |
| 10 or more Apartments | 10 | 4.4% |
| Mobile Home / Other | 2 | 0.9% |
| Total | 225 | 100.0% |
Housing Structures by Occupancy in Ohio
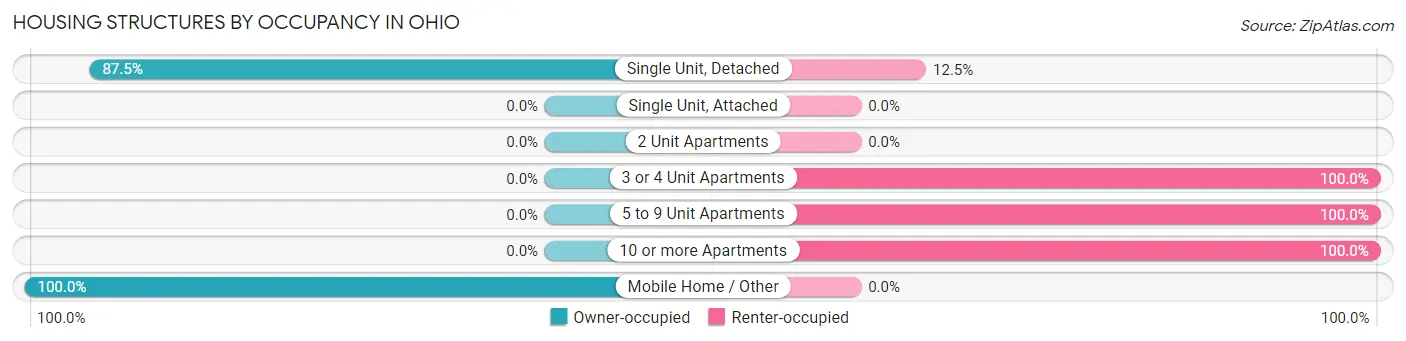
| Structure Type | Owner-occupied | Renter-occupied |
| Single Unit, Detached | 175 (87.5%) | 25 (12.5%) |
| Single Unit, Attached | 0 (0.0%) | 0 (0.0%) |
| 2 Unit Apartments | 0 (0.0%) | 0 (0.0%) |
| 3 or 4 Unit Apartments | 0 (0.0%) | 11 (100.0%) |
| 5 to 9 Unit Apartments | 0 (0.0%) | 2 (100.0%) |
| 10 or more Apartments | 0 (0.0%) | 10 (100.0%) |
| Mobile Home / Other | 2 (100.0%) | 0 (0.0%) |
| Total | 177 (78.7%) | 48 (21.3%) |
Housing Structures by Number of Rooms in Ohio
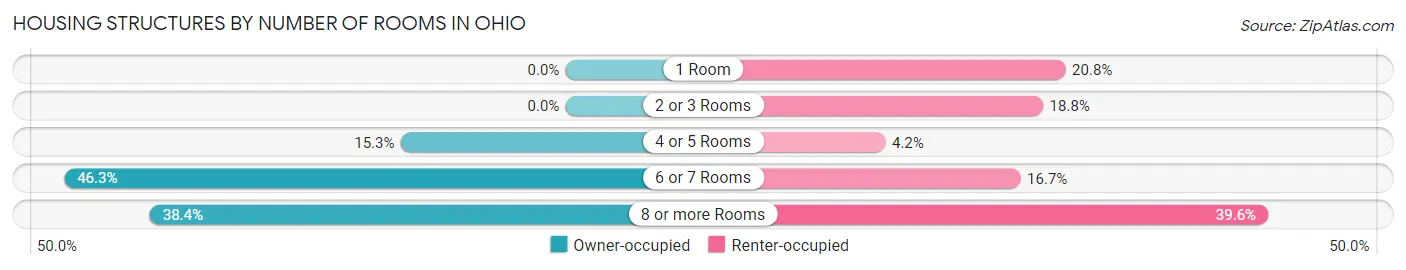
| Number of Rooms | Owner-occupied | Renter-occupied |
| 1 Room | 0 (0.0%) | 10 (20.8%) |
| 2 or 3 Rooms | 0 (0.0%) | 9 (18.8%) |
| 4 or 5 Rooms | 27 (15.2%) | 2 (4.2%) |
| 6 or 7 Rooms | 82 (46.3%) | 8 (16.7%) |
| 8 or more Rooms | 68 (38.4%) | 19 (39.6%) |
| Total | 177 (100.0%) | 48 (100.0%) |
Housing Structure by Heating Type in Ohio
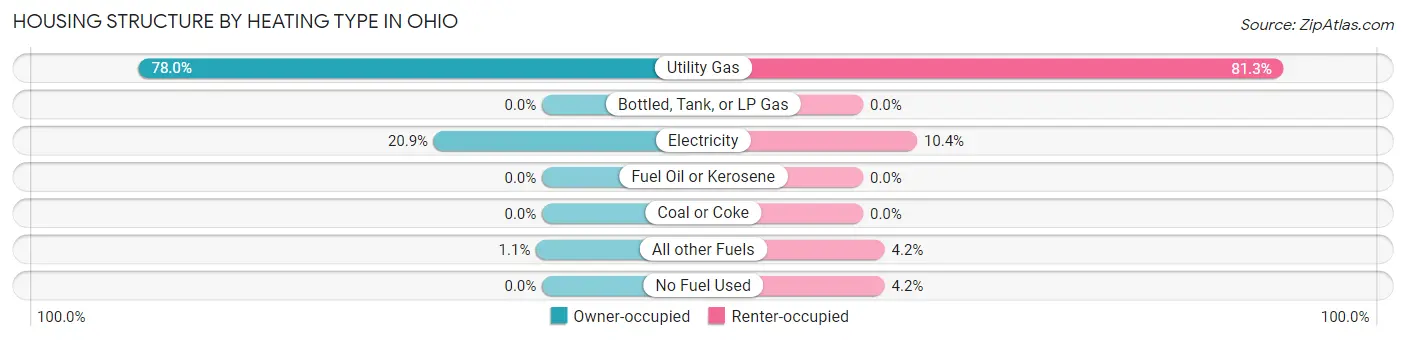
| Heating Type | Owner-occupied | Renter-occupied |
| Utility Gas | 138 (78.0%) | 39 (81.2%) |
| Bottled, Tank, or LP Gas | 0 (0.0%) | 0 (0.0%) |
| Electricity | 37 (20.9%) | 5 (10.4%) |
| Fuel Oil or Kerosene | 0 (0.0%) | 0 (0.0%) |
| Coal or Coke | 0 (0.0%) | 0 (0.0%) |
| All other Fuels | 2 (1.1%) | 2 (4.2%) |
| No Fuel Used | 0 (0.0%) | 2 (4.2%) |
| Total | 177 (100.0%) | 48 (100.0%) |
Household Vehicle Usage in Ohio
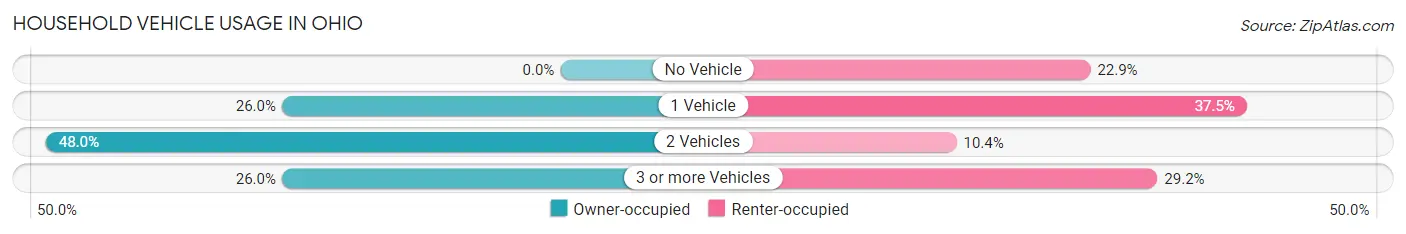
| Vehicles per Household | Owner-occupied | Renter-occupied |
| No Vehicle | 0 (0.0%) | 11 (22.9%) |
| 1 Vehicle | 46 (26.0%) | 18 (37.5%) |
| 2 Vehicles | 85 (48.0%) | 5 (10.4%) |
| 3 or more Vehicles | 46 (26.0%) | 14 (29.2%) |
| Total | 177 (100.0%) | 48 (100.0%) |
Real Estate & Mortgages in Ohio
Real Estate and Mortgage Overview in Ohio
| Characteristic | Without Mortgage | With Mortgage |
| Housing Units | 47 | 130 |
| Median Property Value | $97,200 | $92,800 |
| Median Household Income | $50,625 | $14 |
| Monthly Housing Costs | $456 | $0 |
| Real Estate Taxes | $1,656 | $0 |
Property Value by Mortgage Status in Ohio
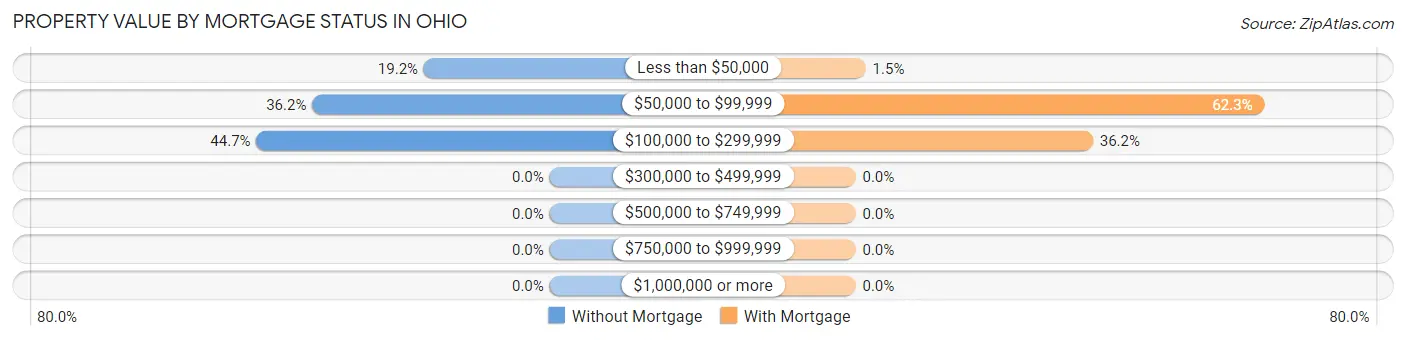
| Property Value | Without Mortgage | With Mortgage |
| Less than $50,000 | 9 (19.2%) | 2 (1.5%) |
| $50,000 to $99,999 | 17 (36.2%) | 81 (62.3%) |
| $100,000 to $299,999 | 21 (44.7%) | 47 (36.1%) |
| $300,000 to $499,999 | 0 (0.0%) | 0 (0.0%) |
| $500,000 to $749,999 | 0 (0.0%) | 0 (0.0%) |
| $750,000 to $999,999 | 0 (0.0%) | 0 (0.0%) |
| $1,000,000 or more | 0 (0.0%) | 0 (0.0%) |
| Total | 47 (100.0%) | 130 (100.0%) |
Household Income by Mortgage Status in Ohio
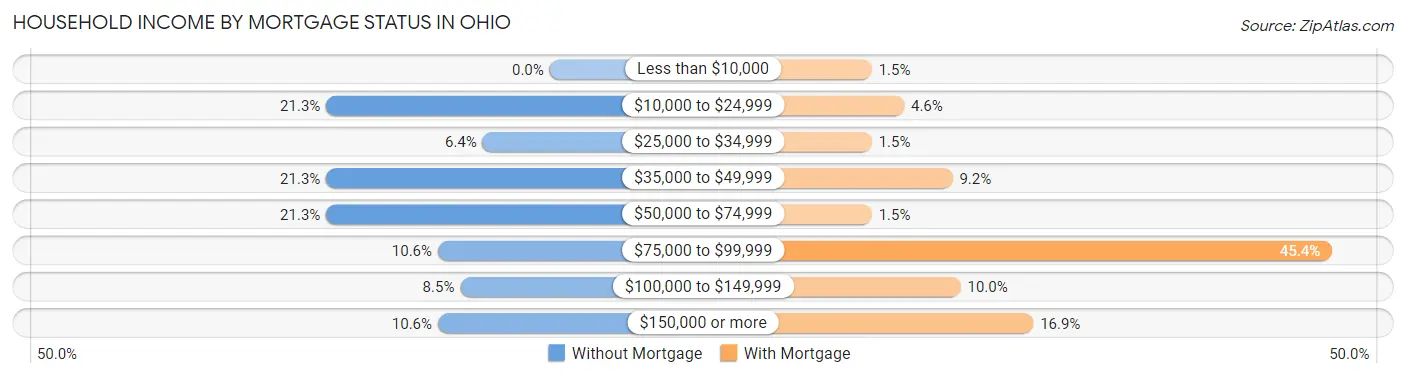
| Household Income | Without Mortgage | With Mortgage |
| Less than $10,000 | 0 (0.0%) | 2 (1.5%) |
| $10,000 to $24,999 | 10 (21.3%) | 6 (4.6%) |
| $25,000 to $34,999 | 3 (6.4%) | 2 (1.5%) |
| $35,000 to $49,999 | 10 (21.3%) | 12 (9.2%) |
| $50,000 to $74,999 | 10 (21.3%) | 2 (1.5%) |
| $75,000 to $99,999 | 5 (10.6%) | 59 (45.4%) |
| $100,000 to $149,999 | 4 (8.5%) | 13 (10.0%) |
| $150,000 or more | 5 (10.6%) | 22 (16.9%) |
| Total | 47 (100.0%) | 130 (100.0%) |
Property Value to Household Income Ratio in Ohio
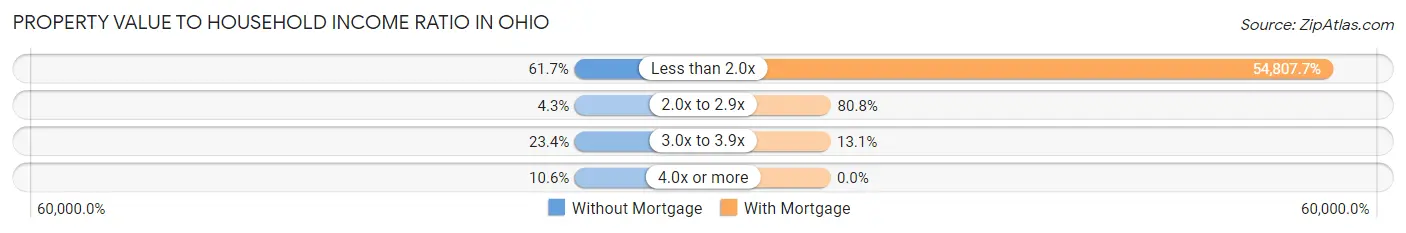
| Value-to-Income Ratio | Without Mortgage | With Mortgage |
| Less than 2.0x | 29 (61.7%) | 71,250 (54,807.7%) |
| 2.0x to 2.9x | 2 (4.3%) | 105 (80.8%) |
| 3.0x to 3.9x | 11 (23.4%) | 17 (13.1%) |
| 4.0x or more | 5 (10.6%) | 0 (0.0%) |
| Total | 47 (100.0%) | 130 (100.0%) |
Real Estate Taxes by Mortgage Status in Ohio
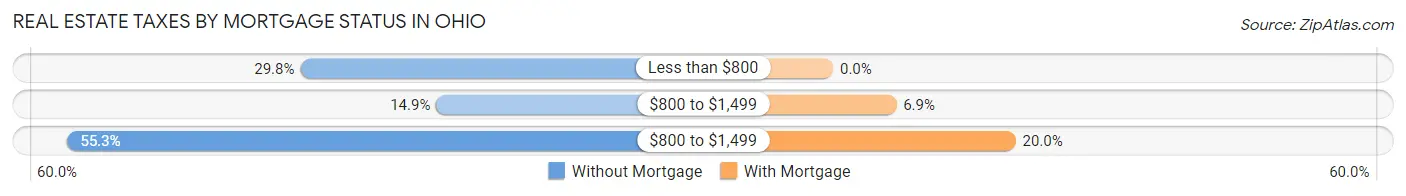
| Property Taxes | Without Mortgage | With Mortgage |
| Less than $800 | 14 (29.8%) | 0 (0.0%) |
| $800 to $1,499 | 7 (14.9%) | 9 (6.9%) |
| $800 to $1,499 | 26 (55.3%) | 26 (20.0%) |
| Total | 47 (100.0%) | 130 (100.0%) |
Health & Disability in Ohio
Health Insurance Coverage by Age in Ohio
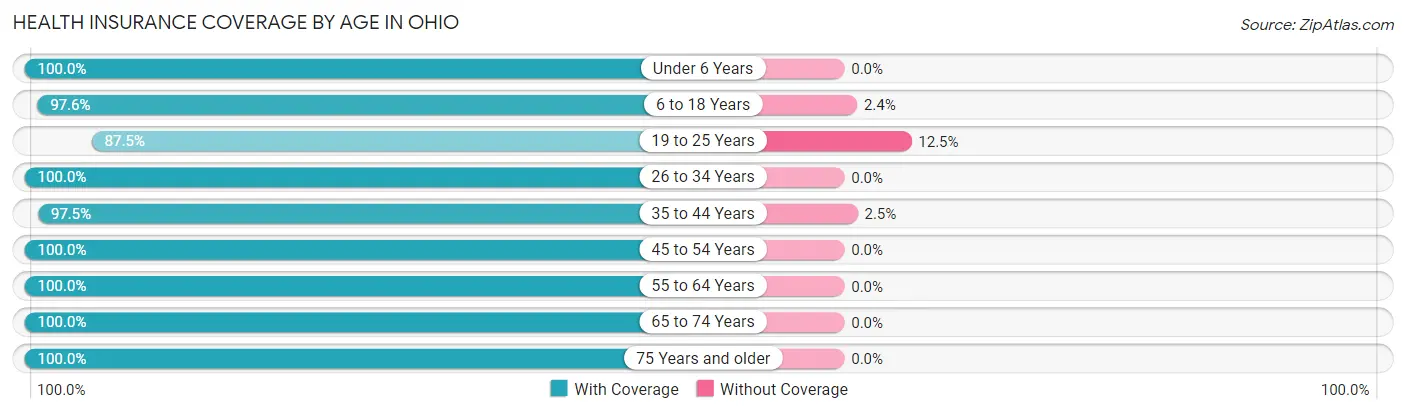
| Age Bracket | With Coverage | Without Coverage |
| Under 6 Years | 49 (100.0%) | 0 (0.0%) |
| 6 to 18 Years | 124 (97.6%) | 3 (2.4%) |
| 19 to 25 Years | 28 (87.5%) | 4 (12.5%) |
| 26 to 34 Years | 99 (100.0%) | 0 (0.0%) |
| 35 to 44 Years | 79 (97.5%) | 2 (2.5%) |
| 45 to 54 Years | 65 (100.0%) | 0 (0.0%) |
| 55 to 64 Years | 96 (100.0%) | 0 (0.0%) |
| 65 to 74 Years | 28 (100.0%) | 0 (0.0%) |
| 75 Years and older | 43 (100.0%) | 0 (0.0%) |
| Total | 611 (98.6%) | 9 (1.5%) |
Health Insurance Coverage by Citizenship Status in Ohio
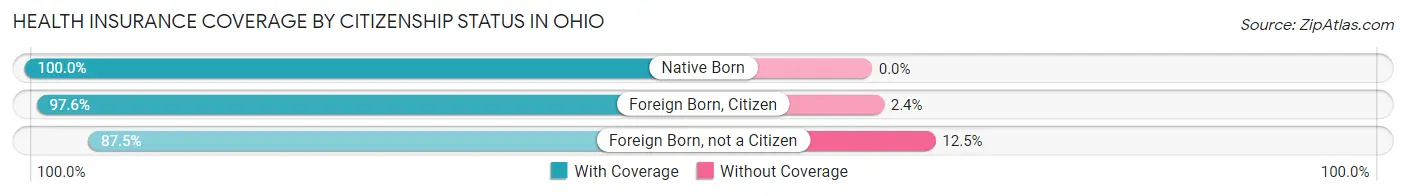
| Citizenship Status | With Coverage | Without Coverage |
| Native Born | 49 (100.0%) | 0 (0.0%) |
| Foreign Born, Citizen | 124 (97.6%) | 3 (2.4%) |
| Foreign Born, not a Citizen | 28 (87.5%) | 4 (12.5%) |
Health Insurance Coverage by Household Income in Ohio
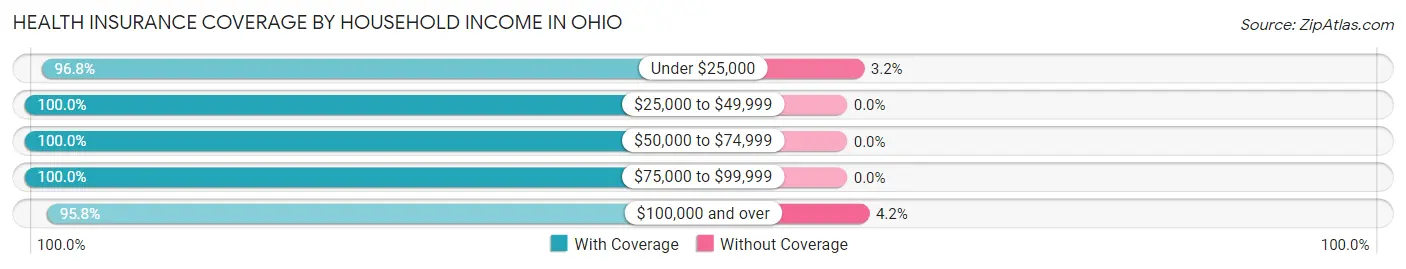
| Household Income | With Coverage | Without Coverage |
| Under $25,000 | 91 (96.8%) | 3 (3.2%) |
| $25,000 to $49,999 | 114 (100.0%) | 0 (0.0%) |
| $50,000 to $74,999 | 166 (100.0%) | 0 (0.0%) |
| $75,000 to $99,999 | 102 (100.0%) | 0 (0.0%) |
| $100,000 and over | 138 (95.8%) | 6 (4.2%) |
Public vs Private Health Insurance Coverage by Age in Ohio
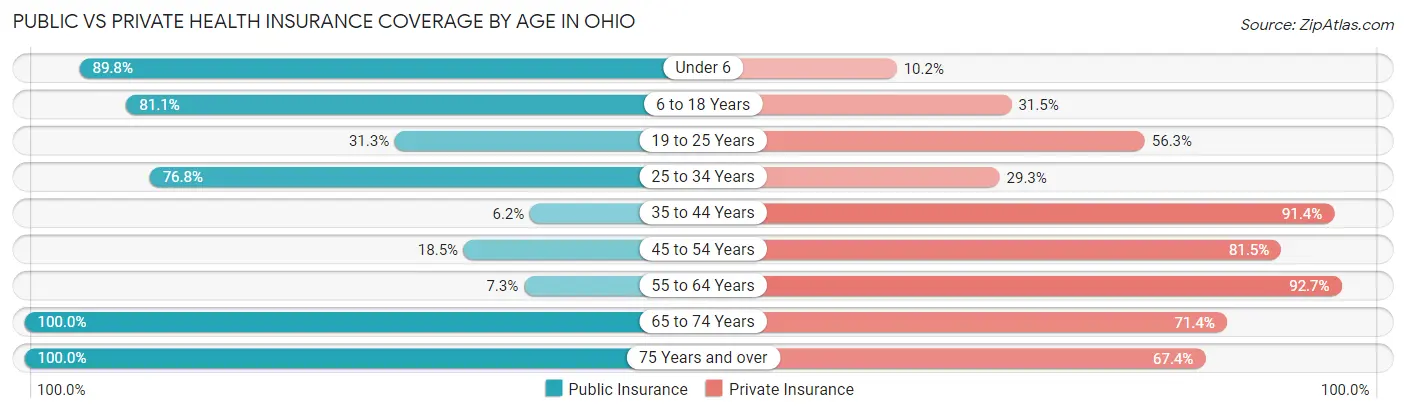
| Age Bracket | Public Insurance | Private Insurance |
| Under 6 | 44 (89.8%) | 5 (10.2%) |
| 6 to 18 Years | 103 (81.1%) | 40 (31.5%) |
| 19 to 25 Years | 10 (31.2%) | 18 (56.2%) |
| 25 to 34 Years | 76 (76.8%) | 29 (29.3%) |
| 35 to 44 Years | 5 (6.2%) | 74 (91.4%) |
| 45 to 54 Years | 12 (18.5%) | 53 (81.5%) |
| 55 to 64 Years | 7 (7.3%) | 89 (92.7%) |
| 65 to 74 Years | 28 (100.0%) | 20 (71.4%) |
| 75 Years and over | 43 (100.0%) | 29 (67.4%) |
| Total | 328 (52.9%) | 357 (57.6%) |
Disability Status by Sex by Age in Ohio
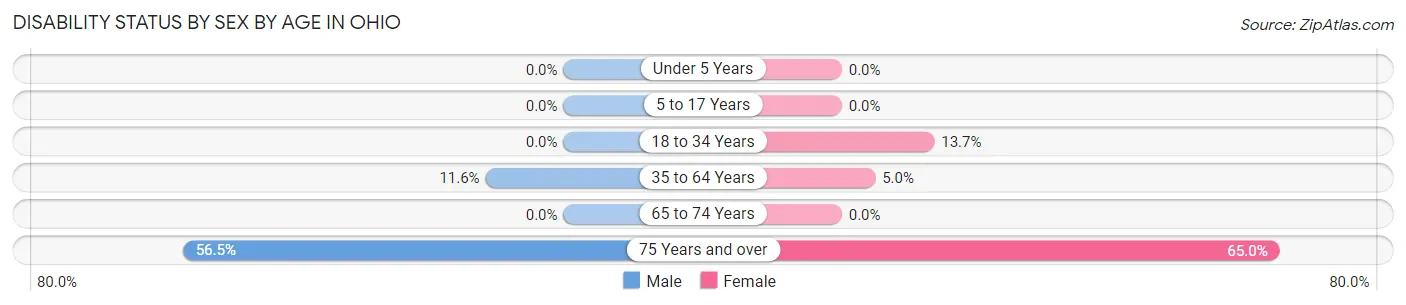
| Age Bracket | Male | Female |
| Under 5 Years | 0 (0.0%) | 0 (0.0%) |
| 5 to 17 Years | 0 (0.0%) | 0 (0.0%) |
| 18 to 34 Years | 0 (0.0%) | 7 (13.7%) |
| 35 to 64 Years | 14 (11.6%) | 6 (5.0%) |
| 65 to 74 Years | 0 (0.0%) | 0 (0.0%) |
| 75 Years and over | 13 (56.5%) | 13 (65.0%) |
Disability Class by Sex by Age in Ohio
Disability Class: Hearing Difficulty
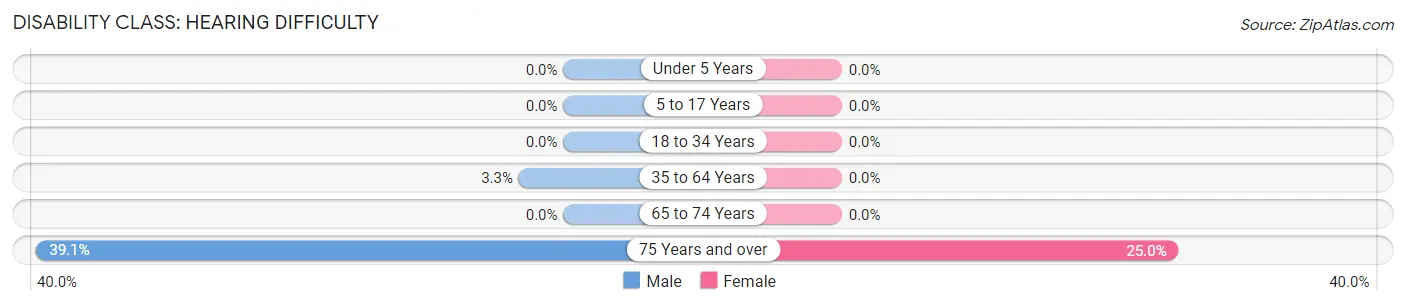
| Age Bracket | Male | Female |
| Under 5 Years | 0 (0.0%) | 0 (0.0%) |
| 5 to 17 Years | 0 (0.0%) | 0 (0.0%) |
| 18 to 34 Years | 0 (0.0%) | 0 (0.0%) |
| 35 to 64 Years | 4 (3.3%) | 0 (0.0%) |
| 65 to 74 Years | 0 (0.0%) | 0 (0.0%) |
| 75 Years and over | 9 (39.1%) | 5 (25.0%) |
Disability Class: Vision Difficulty
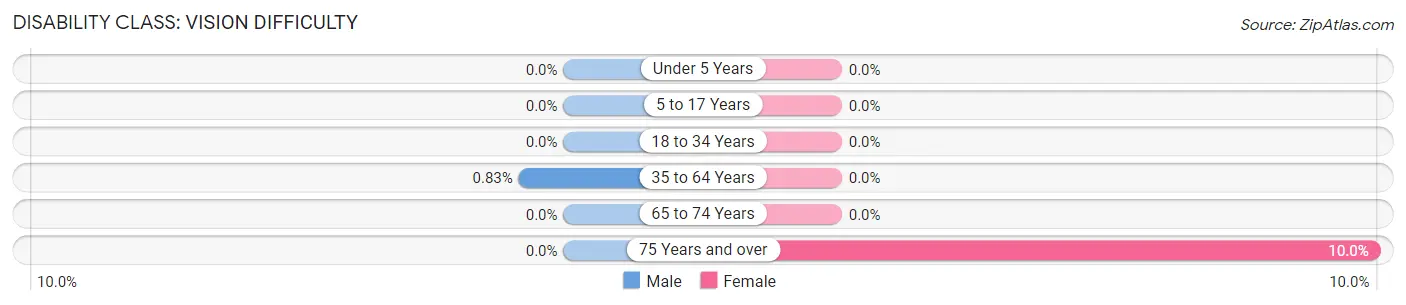
| Age Bracket | Male | Female |
| Under 5 Years | 0 (0.0%) | 0 (0.0%) |
| 5 to 17 Years | 0 (0.0%) | 0 (0.0%) |
| 18 to 34 Years | 0 (0.0%) | 0 (0.0%) |
| 35 to 64 Years | 1 (0.8%) | 0 (0.0%) |
| 65 to 74 Years | 0 (0.0%) | 0 (0.0%) |
| 75 Years and over | 0 (0.0%) | 2 (10.0%) |
Disability Class: Cognitive Difficulty
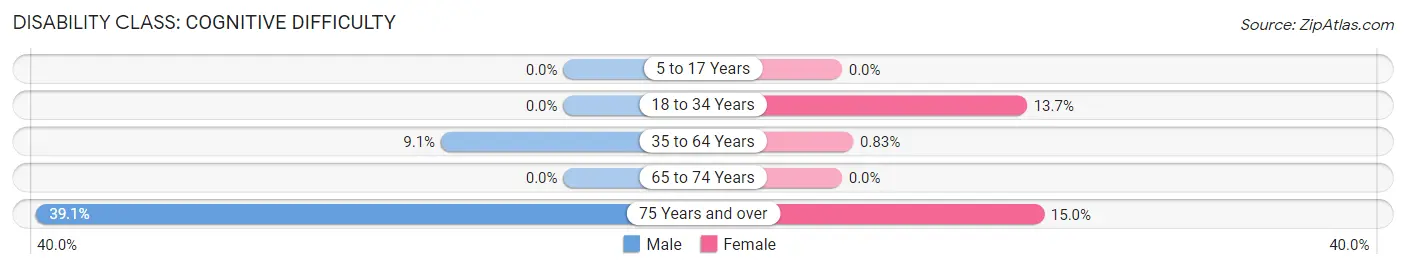
| Age Bracket | Male | Female |
| 5 to 17 Years | 0 (0.0%) | 0 (0.0%) |
| 18 to 34 Years | 0 (0.0%) | 7 (13.7%) |
| 35 to 64 Years | 11 (9.1%) | 1 (0.8%) |
| 65 to 74 Years | 0 (0.0%) | 0 (0.0%) |
| 75 Years and over | 9 (39.1%) | 3 (15.0%) |
Disability Class: Ambulatory Difficulty
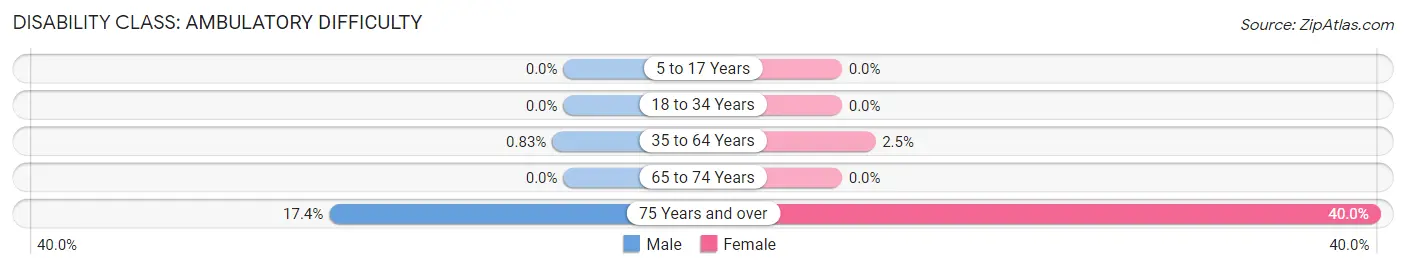
| Age Bracket | Male | Female |
| 5 to 17 Years | 0 (0.0%) | 0 (0.0%) |
| 18 to 34 Years | 0 (0.0%) | 0 (0.0%) |
| 35 to 64 Years | 1 (0.8%) | 3 (2.5%) |
| 65 to 74 Years | 0 (0.0%) | 0 (0.0%) |
| 75 Years and over | 4 (17.4%) | 8 (40.0%) |
Disability Class: Self-Care Difficulty
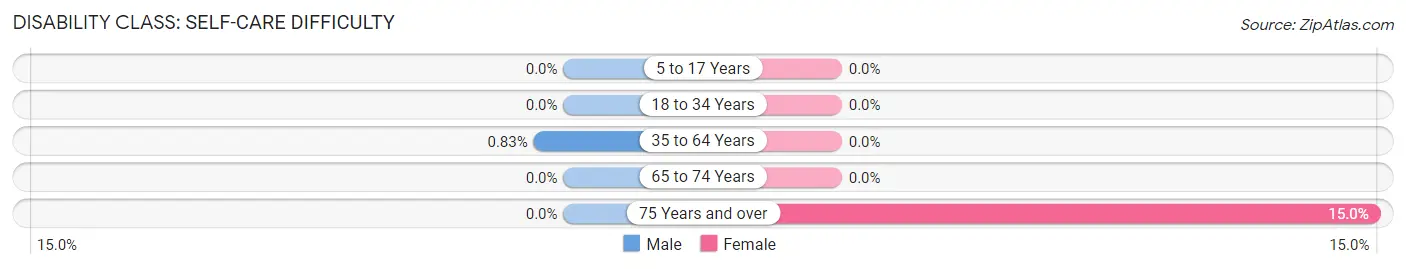
| Age Bracket | Male | Female |
| 5 to 17 Years | 0 (0.0%) | 0 (0.0%) |
| 18 to 34 Years | 0 (0.0%) | 0 (0.0%) |
| 35 to 64 Years | 1 (0.8%) | 0 (0.0%) |
| 65 to 74 Years | 0 (0.0%) | 0 (0.0%) |
| 75 Years and over | 0 (0.0%) | 3 (15.0%) |
Technology Access in Ohio
Computing Device Access in Ohio
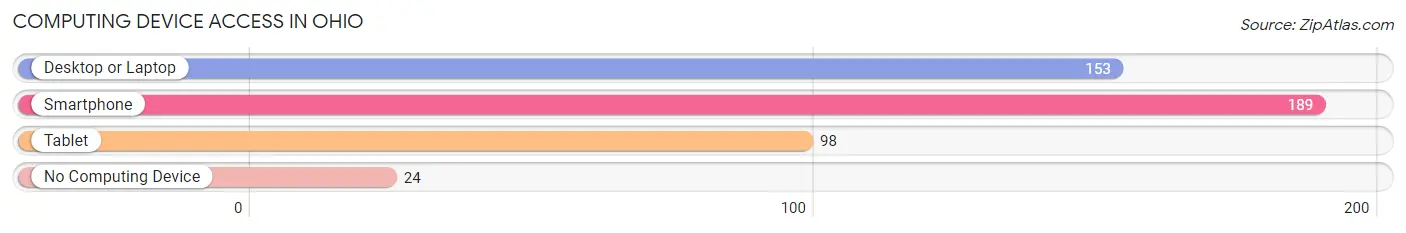
| Device Type | # Households | % Households |
| Desktop or Laptop | 153 | 68.0% |
| Smartphone | 189 | 84.0% |
| Tablet | 98 | 43.6% |
| No Computing Device | 24 | 10.7% |
| Total | 225 | 100.0% |
Internet Access in Ohio
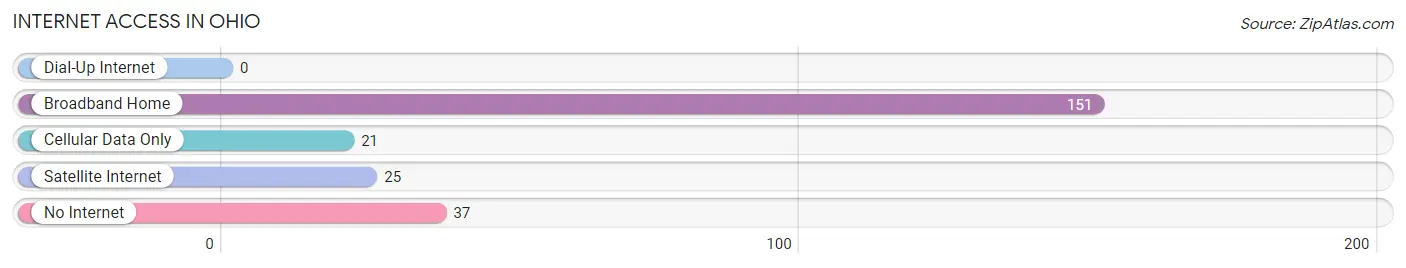
| Internet Type | # Households | % Households |
| Dial-Up Internet | 0 | 0.0% |
| Broadband Home | 151 | 67.1% |
| Cellular Data Only | 21 | 9.3% |
| Satellite Internet | 25 | 11.1% |
| No Internet | 37 | 16.4% |
| Total | 225 | 100.0% |
Ohio Summary
Ohio is a state located in the Midwestern United States. It is bordered by Lake Erie to the north, Pennsylvania to the east, West Virginia to the southeast, Kentucky to the southwest, and Indiana to the west. Ohio is the 34th largest state in the United States, with an area of 44,825 square miles (116,096 km2). It is the 7th most populous state in the United States, with an estimated population of 11,689,100 in 2019.
Geography
Ohio is located in the Midwest region of the United States. It is bordered by Lake Erie to the north, Pennsylvania to the east, West Virginia to the southeast, Kentucky to the southwest, and Indiana to the west. The Ohio River forms the border between Ohio and Kentucky. The state has a total area of 44,825 square miles (116,096 km2), making it the 34th largest state in the United States. The state is divided into 88 counties.
The geography of Ohio is diverse, with flat plains in the northwest, rolling hills in the south, and rugged hills and deep valleys in the southeast. The state has four distinct geographic regions: the Great Lakes Plain in the northwest, the Appalachian Plateau in the east, the Central Lowlands in the center, and the Allegheny Plateau in the southeast. The highest point in Ohio is Campbell Hill, at 1,549 feet (472 m). The lowest point is the Ohio River, at 455 feet (139 m).
Economy
Ohio has a diverse economy, with a mix of manufacturing, services, and agriculture. The state is the second largest producer of automobiles in the United States, and is home to many major corporations, including Procter & Gamble, Goodyear Tire & Rubber Company, and Marathon Petroleum. Ohio is also a major producer of steel, aluminum, and other metals.
Agriculture is an important part of the state's economy, with corn, soybeans, and wheat being the major crops. Livestock production is also important, with Ohio being the second largest producer of dairy products in the United States.
Demographics
As of the 2010 census, the population of Ohio was 11,536,504, making it the seventh most populous state in the United States. The population density was 268.9 people per square mile (104.1/km2). The racial makeup of the state was 81.2% White, 12.3% African American, 0.4% Native American, 2.2% Asian, 0.1% Pacific Islander, 2.3% from other races, and 1.6% from two or more races. Hispanic or Latino of any race were 4.2% of the population.
The median income for a household in Ohio was $48,179, and the median income for a family was $59,817. The per capita income for the state was $25,936. The poverty rate was 15.2%.
Conclusion
Ohio is a state located in the Midwestern United States. It is bordered by Lake Erie to the north, Pennsylvania to the east, West Virginia to the southeast, Kentucky to the southwest, and Indiana to the west. Ohio is the 34th largest state in the United States, with an area of 44,825 square miles (116,096 km2). It is the 7th most populous state in the United States, with an estimated population of 11,689,100 in 2019. The geography of Ohio is diverse, with flat plains in the northwest, rolling hills in the south, and rugged hills and deep valleys in the southeast. The economy of Ohio is diverse, with a mix of manufacturing, services, and agriculture. The population of Ohio is 11,536,504, making it the seventh most populous state in the United States. The median income for a household in Ohio was $48,179, and the median income for a family was $59,817. The poverty rate was 15.2%.
Common Questions
What is Per Capita Income in Ohio?
Per Capita income in Ohio is $28,495.
What is the Median Family Income in Ohio?
Median Family Income in Ohio is $70,977.
What is the Median Household income in Ohio?
Median Household Income in Ohio is $58,375.
What is Income or Wage Gap in Ohio?
Income or Wage Gap in Ohio is 56.3%.
Women in Ohio earn 43.7 cents for every dollar earned by a man.
What is Inequality or Gini Index in Ohio?
Inequality or Gini Index in Ohio is 0.48.
What is the Total Population of Ohio?
Total Population of Ohio is 623.
What is the Total Male Population of Ohio?
Total Male Population of Ohio is 321.
What is the Total Female Population of Ohio?
Total Female Population of Ohio is 302.
What is the Ratio of Males per 100 Females in Ohio?
There are 106.29 Males per 100 Females in Ohio.
What is the Ratio of Females per 100 Males in Ohio?
There are 94.08 Females per 100 Males in Ohio.
What is the Median Population Age in Ohio?
Median Population Age in Ohio is 35.1 Years.
What is the Average Family Size in Ohio
Average Family Size in Ohio is 3.3 People.
What is the Average Household Size in Ohio
Average Household Size in Ohio is 2.8 People.
How Large is the Labor Force in Ohio?
There are 334 People in the Labor Forcein in Ohio.
What is the Percentage of People in the Labor Force in Ohio?
71.8% of People are in the Labor Force in Ohio.
What is the Unemployment Rate in Ohio?
Unemployment Rate in Ohio is 12.3%.