Niantic, IL Map & Demographics
Niantic Map
Niantic Overview
$24,320
PER CAPITA INCOME
$65,962
AVG FAMILY INCOME
$61,307
AVG HOUSEHOLD INCOME
56.2%
WAGE / INCOME GAP [ % ]
43.8¢/ $1
WAGE / INCOME GAP [ $ ]
0.34
INEQUALITY / GINI INDEX
748
TOTAL POPULATION
409
MALE POPULATION
339
FEMALE POPULATION
120.65
MALES / 100 FEMALES
82.89
FEMALES / 100 MALES
32.4
MEDIAN AGE
4.2
AVG FAMILY SIZE
3.2
AVG HOUSEHOLD SIZE
333
LABOR FORCE [ PEOPLE ]
68.7%
PERCENT IN LABOR FORCE
12.0%
UNEMPLOYMENT RATE
Niantic Zip Codes
Niantic Area Codes
Income in Niantic
Income Overview in Niantic
Per Capita Income in Niantic is $24,320, while median incomes of families and households are $65,962 and $61,307 respectively.
| Characteristic | Number | Measure |
| Per Capita Income | 748 | $24,320 |
| Median Family Income | 136 | $65,962 |
| Mean Family Income | 136 | $83,540 |
| Median Household Income | 235 | $61,307 |
| Mean Household Income | 235 | $70,246 |
| Income Deficit | 136 | $0 |
| Wage / Income Gap (%) | 748 | 56.21% |
| Wage / Income Gap ($) | 748 | 43.79¢ per $1 |
| Gini / Inequality Index | 748 | 0.34 |
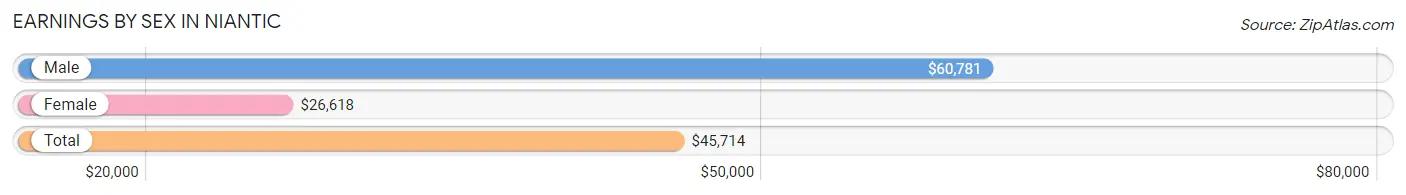
Earnings by Sex in Niantic
Average Earnings in Niantic are $45,714, $60,781 for men and $26,618 for women, a difference of 56.2%.
| Sex | Number | Average Earnings |
| Male | 178 (56.0%) | $60,781 |
| Female | 140 (44.0%) | $26,618 |
| Total | 318 (100.0%) | $45,714 |
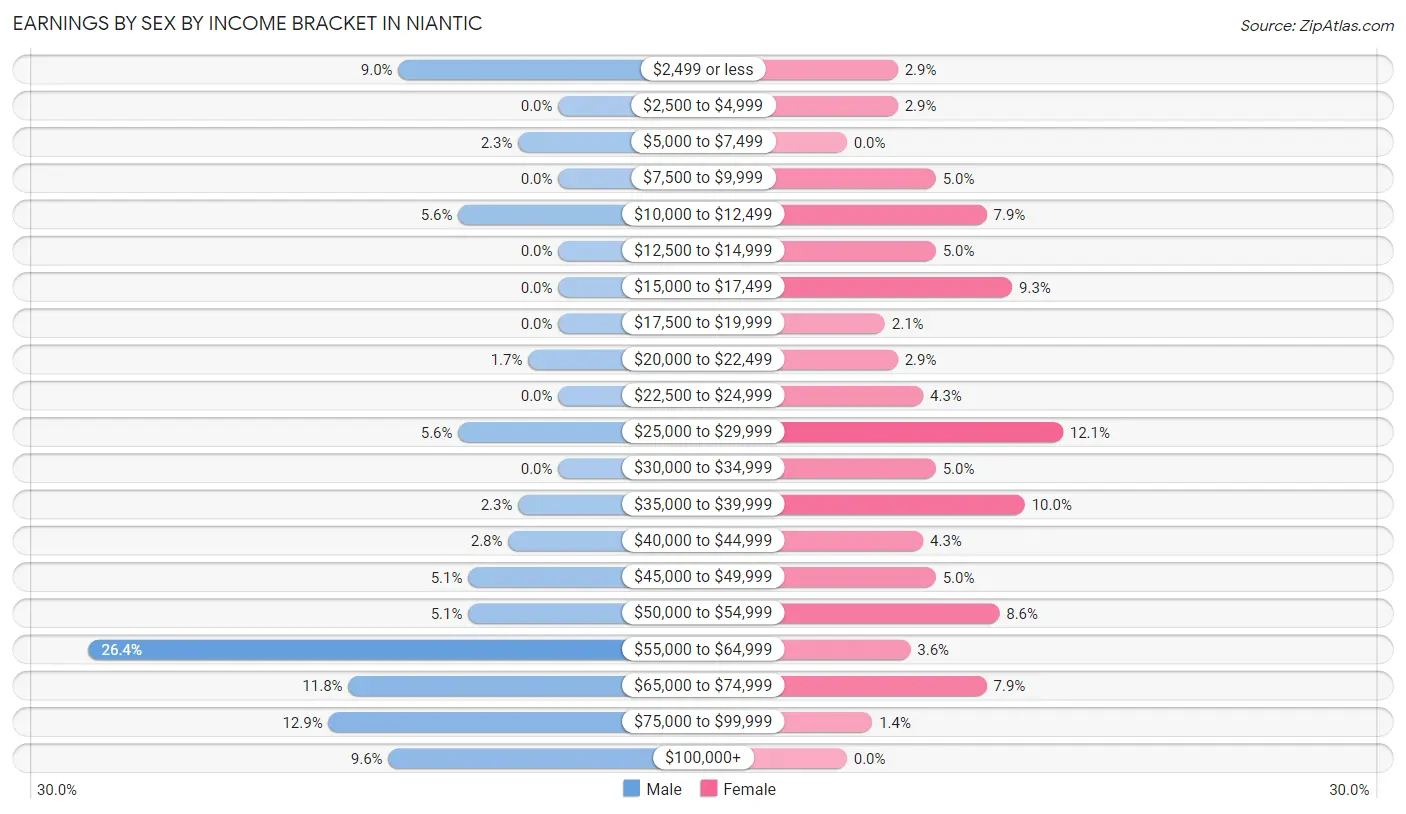
Earnings by Sex by Income Bracket in Niantic
The most common earnings brackets in Niantic are $55,000 to $64,999 for men (47 | 26.4%) and $25,000 to $29,999 for women (17 | 12.1%).
| Income | Male | Female |
| $2,499 or less | 16 (9.0%) | 4 (2.9%) |
| $2,500 to $4,999 | 0 (0.0%) | 4 (2.9%) |
| $5,000 to $7,499 | 4 (2.2%) | 0 (0.0%) |
| $7,500 to $9,999 | 0 (0.0%) | 7 (5.0%) |
| $10,000 to $12,499 | 10 (5.6%) | 11 (7.9%) |
| $12,500 to $14,999 | 0 (0.0%) | 7 (5.0%) |
| $15,000 to $17,499 | 0 (0.0%) | 13 (9.3%) |
| $17,500 to $19,999 | 0 (0.0%) | 3 (2.1%) |
| $20,000 to $22,499 | 3 (1.7%) | 4 (2.9%) |
| $22,500 to $24,999 | 0 (0.0%) | 6 (4.3%) |
| $25,000 to $29,999 | 10 (5.6%) | 17 (12.1%) |
| $30,000 to $34,999 | 0 (0.0%) | 7 (5.0%) |
| $35,000 to $39,999 | 4 (2.2%) | 14 (10.0%) |
| $40,000 to $44,999 | 5 (2.8%) | 6 (4.3%) |
| $45,000 to $49,999 | 9 (5.1%) | 7 (5.0%) |
| $50,000 to $54,999 | 9 (5.1%) | 12 (8.6%) |
| $55,000 to $64,999 | 47 (26.4%) | 5 (3.6%) |
| $65,000 to $74,999 | 21 (11.8%) | 11 (7.9%) |
| $75,000 to $99,999 | 23 (12.9%) | 2 (1.4%) |
| $100,000+ | 17 (9.6%) | 0 (0.0%) |
| Total | 178 (100.0%) | 140 (100.0%) |
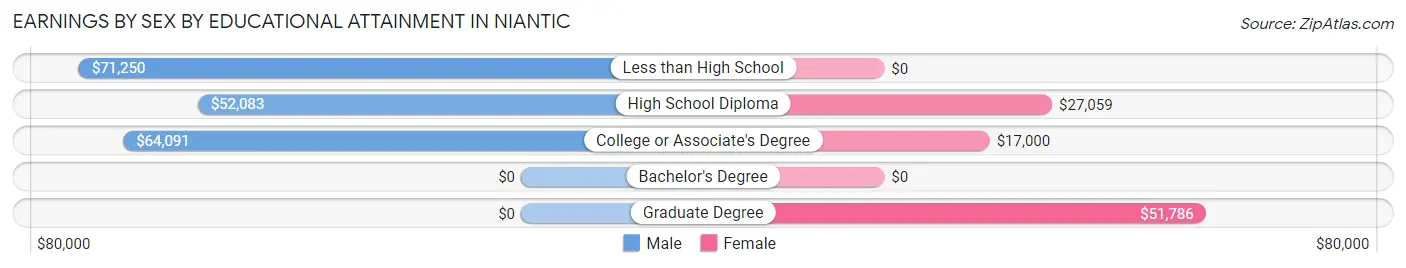
Earnings by Sex by Educational Attainment in Niantic
Average earnings in Niantic are $62,500 for men and $27,279 for women, a difference of 56.4%. Men with an educational attainment of less than high school enjoy the highest average annual earnings of $71,250, while those with high school diploma education earn the least with $52,083. Women with an educational attainment of graduate degree earn the most with the average annual earnings of $51,786, while those with college or associate's degree education have the smallest earnings of $17,000.
| Educational Attainment | Male Income | Female Income |
| Less than High School | $71,250 | $0 |
| High School Diploma | $52,083 | $27,059 |
| College or Associate's Degree | $64,091 | $17,000 |
| Bachelor's Degree | - | - |
| Graduate Degree | - | - |
| Total | $62,500 | $27,279 |
Family Income in Niantic
Family Income Brackets in Niantic
According to the Niantic family income data, there are 59 families falling into the $50,000 to $74,999 income range, which is the most common income bracket and makes up 43.4% of all families.
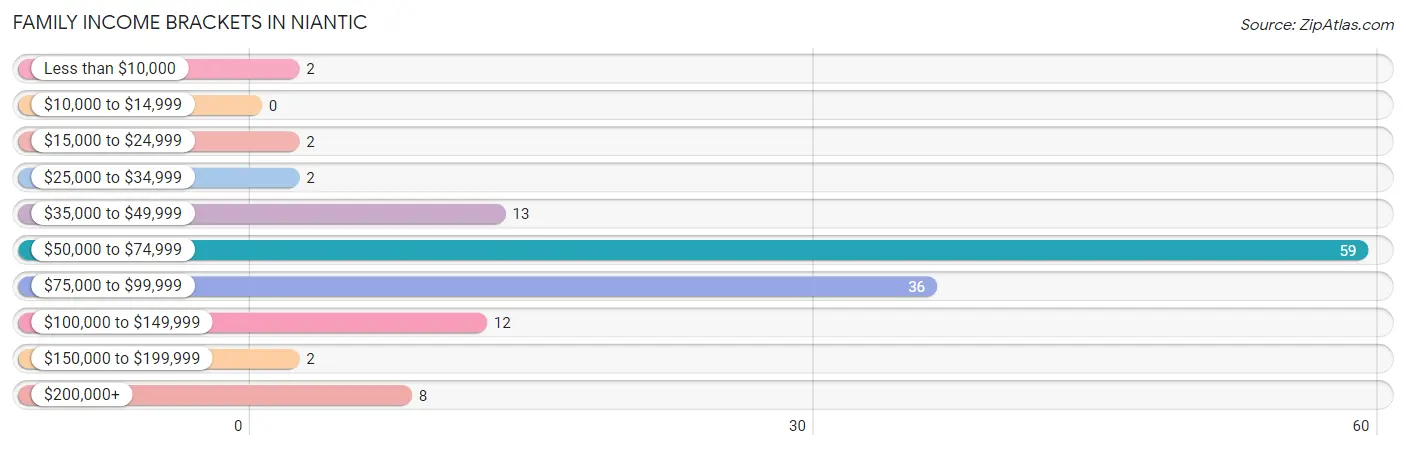
| Income Bracket | # Families | % Families |
| Less than $10,000 | 2 | 1.5% |
| $10,000 to $14,999 | 0 | 0.0% |
| $15,000 to $24,999 | 2 | 1.5% |
| $25,000 to $34,999 | 2 | 1.5% |
| $35,000 to $49,999 | 13 | 9.6% |
| $50,000 to $74,999 | 59 | 43.4% |
| $75,000 to $99,999 | 36 | 26.5% |
| $100,000 to $149,999 | 12 | 8.8% |
| $150,000 to $199,999 | 2 | 1.5% |
| $200,000+ | 8 | 5.9% |
Family Income by Famaliy Size in Niantic
4-person families (39 | 28.7%) account for the highest median family income in Niantic with $82,625 per family, while 2-person families (48 | 35.3%) have the highest median income of $39,375 per family member.
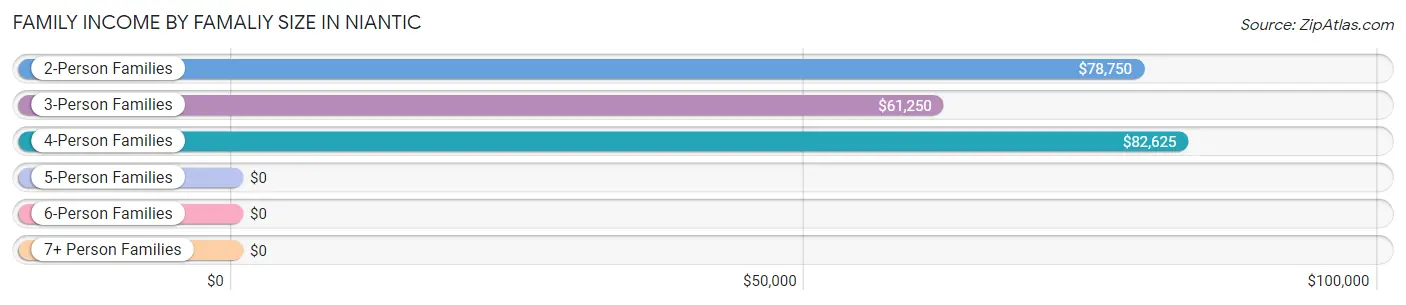
| Income Bracket | # Families | Median Income |
| 2-Person Families | 48 (35.3%) | $78,750 |
| 3-Person Families | 25 (18.4%) | $61,250 |
| 4-Person Families | 39 (28.7%) | $82,625 |
| 5-Person Families | 10 (7.3%) | $0 |
| 6-Person Families | 6 (4.4%) | $0 |
| 7+ Person Families | 8 (5.9%) | $0 |
| Total | 136 (100.0%) | $65,962 |
Family Income by Number of Earners in Niantic
The median family income in Niantic is $65,962, with families comprising 2 earners (35) having the highest median family income of $91,563, while families with no earners (17) have the lowest median family income of $56,563, accounting for 25.7% and 12.5% of families, respectively.
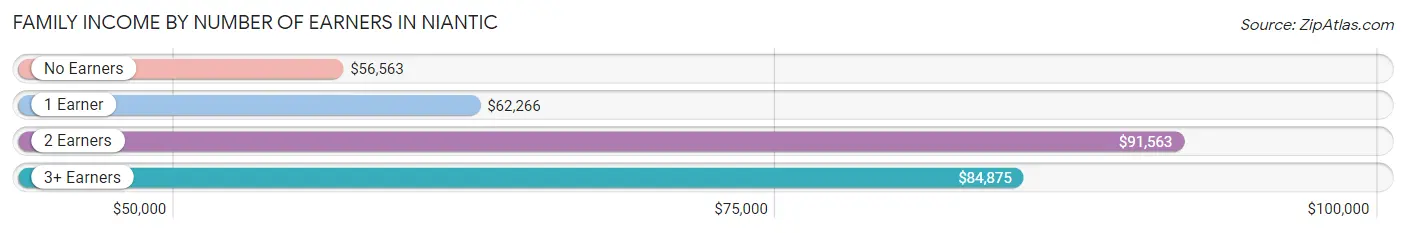
| Number of Earners | # Families | Median Income |
| No Earners | 17 (12.5%) | $56,563 |
| 1 Earner | 57 (41.9%) | $62,266 |
| 2 Earners | 35 (25.7%) | $91,563 |
| 3+ Earners | 27 (19.9%) | $84,875 |
| Total | 136 (100.0%) | $65,962 |
Household Income in Niantic
Household Income Brackets in Niantic
With 75 households falling in the category, the $50,000 to $74,999 income range is the most frequent in Niantic, accounting for 31.9% of all households. In contrast, only 2 households (0.9%) fall into the $10,000 to $14,999 income bracket, making it the least populous group.
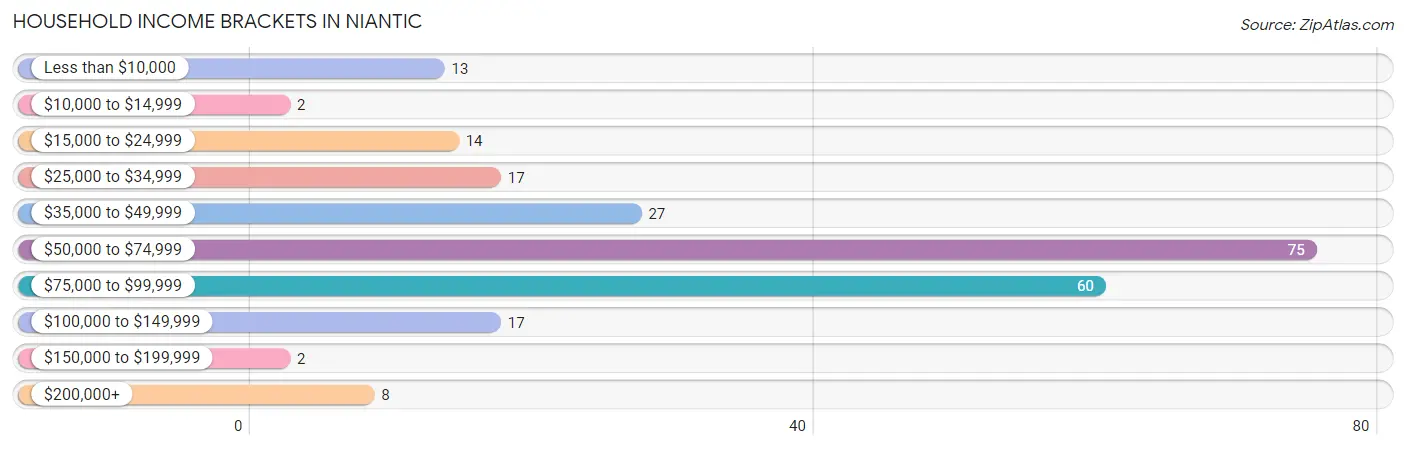
| Income Bracket | # Households | % Households |
| Less than $10,000 | 13 | 5.5% |
| $10,000 to $14,999 | 2 | 0.9% |
| $15,000 to $24,999 | 14 | 6.0% |
| $25,000 to $34,999 | 17 | 7.2% |
| $35,000 to $49,999 | 27 | 11.5% |
| $50,000 to $74,999 | 75 | 31.9% |
| $75,000 to $99,999 | 60 | 25.5% |
| $100,000 to $149,999 | 17 | 7.2% |
| $150,000 to $199,999 | 2 | 0.9% |
| $200,000+ | 8 | 3.4% |
Household Income by Householder Age in Niantic
The median household income in Niantic is $61,307, with the highest median household income of $83,125 found in the 25 to 44 years age bracket for the primary householder. A total of 99 households (42.1%) fall into this category. Meanwhile, the 15 to 24 years age bracket for the primary householder has the lowest median household income of $0, with 2 households (0.9%) in this group.
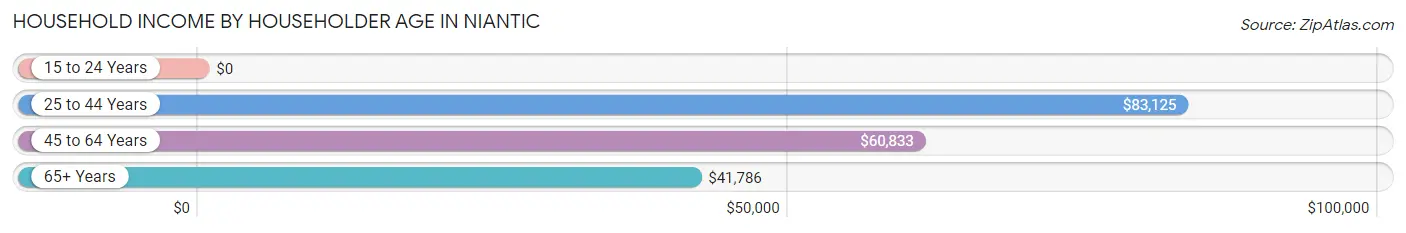
| Income Bracket | # Households | Median Income |
| 15 to 24 Years | 2 (0.9%) | $0 |
| 25 to 44 Years | 99 (42.1%) | $83,125 |
| 45 to 64 Years | 66 (28.1%) | $60,833 |
| 65+ Years | 68 (28.9%) | $41,786 |
| Total | 235 (100.0%) | $61,307 |
Poverty in Niantic
Income Below Poverty by Sex and Age in Niantic
With 3.0% poverty level for males and 9.0% for females among the residents of Niantic, 55 to 64 year old males and 75 year old and over females are the most vulnerable to poverty, with 3 males (17.6%) and 6 females (30.0%) in their respective age groups living below the poverty level.
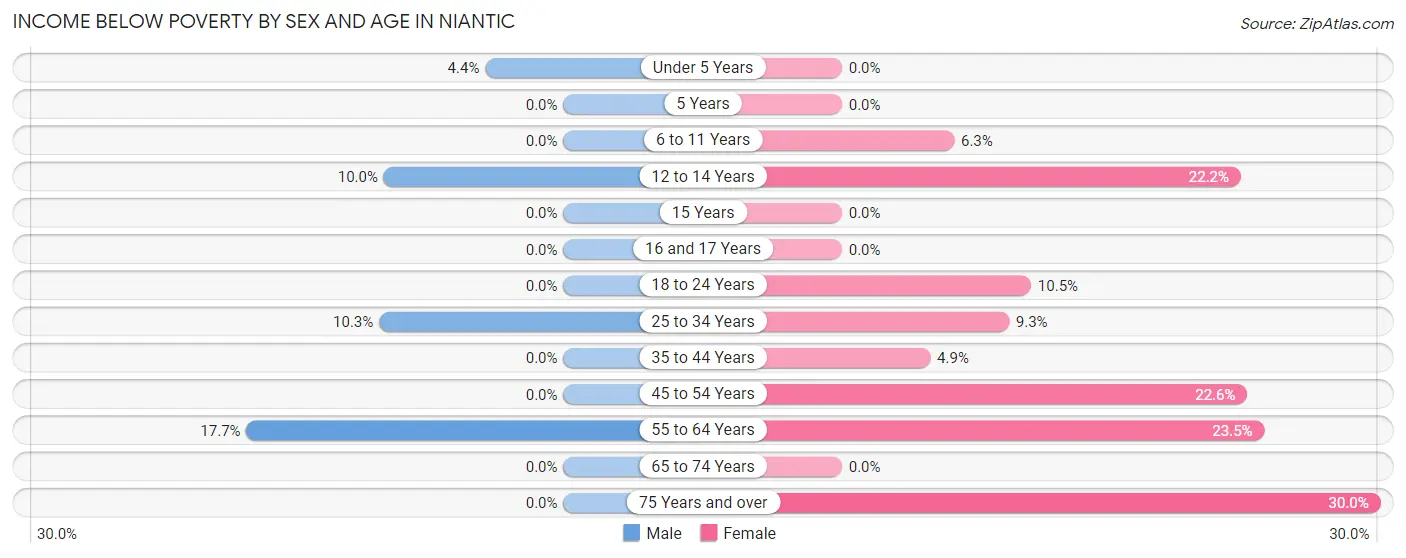
| Age Bracket | Male | Female |
| Under 5 Years | 2 (4.3%) | 0 (0.0%) |
| 5 Years | 0 (0.0%) | 0 (0.0%) |
| 6 to 11 Years | 0 (0.0%) | 2 (6.2%) |
| 12 to 14 Years | 2 (10.0%) | 2 (22.2%) |
| 15 Years | 0 (0.0%) | 0 (0.0%) |
| 16 and 17 Years | 0 (0.0%) | 0 (0.0%) |
| 18 to 24 Years | 0 (0.0%) | 2 (10.5%) |
| 25 to 34 Years | 4 (10.3%) | 4 (9.3%) |
| 35 to 44 Years | 0 (0.0%) | 3 (4.9%) |
| 45 to 54 Years | 0 (0.0%) | 7 (22.6%) |
| 55 to 64 Years | 3 (17.6%) | 4 (23.5%) |
| 65 to 74 Years | 0 (0.0%) | 0 (0.0%) |
| 75 Years and over | 0 (0.0%) | 6 (30.0%) |
| Total | 11 (3.0%) | 30 (9.0%) |
Income Above Poverty by Sex and Age in Niantic
According to the poverty statistics in Niantic, males aged 5 years and females aged under 5 years are the age groups that are most secure financially, with 100.0% of males and 100.0% of females in these age groups living above the poverty line.
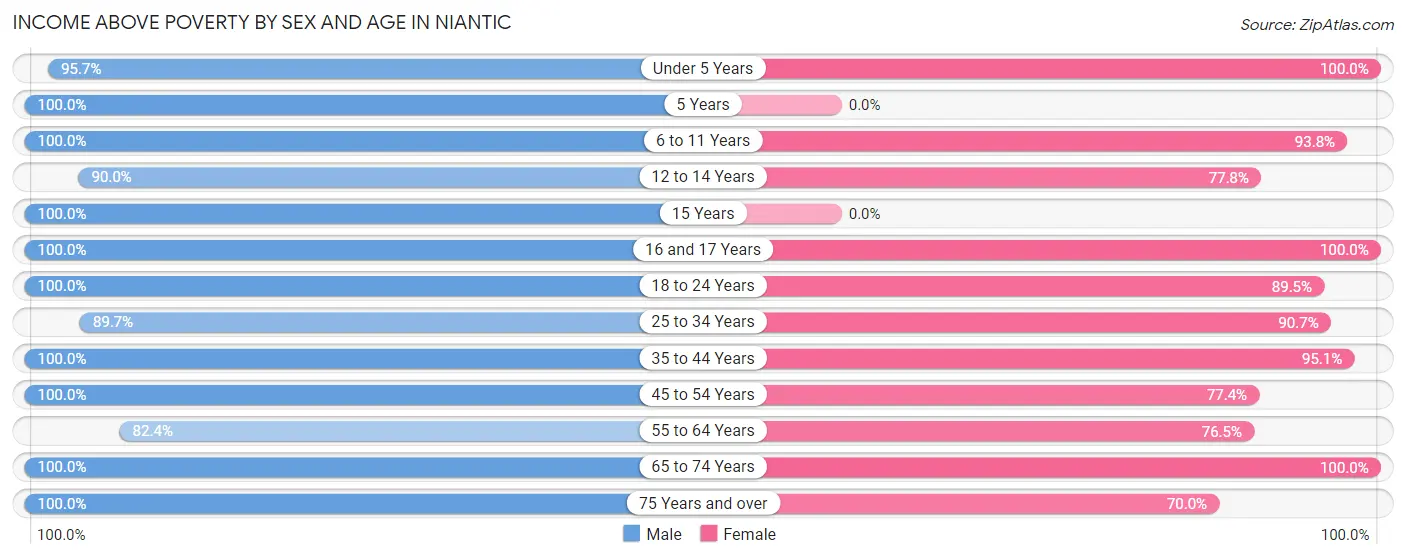
| Age Bracket | Male | Female |
| Under 5 Years | 44 (95.7%) | 54 (100.0%) |
| 5 Years | 14 (100.0%) | 0 (0.0%) |
| 6 to 11 Years | 41 (100.0%) | 30 (93.8%) |
| 12 to 14 Years | 18 (90.0%) | 7 (77.8%) |
| 15 Years | 6 (100.0%) | 0 (0.0%) |
| 16 and 17 Years | 7 (100.0%) | 16 (100.0%) |
| 18 to 24 Years | 19 (100.0%) | 17 (89.5%) |
| 25 to 34 Years | 35 (89.7%) | 39 (90.7%) |
| 35 to 44 Years | 64 (100.0%) | 58 (95.1%) |
| 45 to 54 Years | 49 (100.0%) | 24 (77.4%) |
| 55 to 64 Years | 14 (82.4%) | 13 (76.5%) |
| 65 to 74 Years | 39 (100.0%) | 33 (100.0%) |
| 75 Years and over | 11 (100.0%) | 14 (70.0%) |
| Total | 361 (97.0%) | 305 (91.0%) |
Income Below Poverty Among Married-Couple Families in Niantic
The poverty statistics for married-couple families in Niantic show that 3.7% or 4 of the total 108 families live below the poverty line. Families with 1 or 2 children have the highest poverty rate of 8.5%, comprising of 4 families. On the other hand, families with no children have the lowest poverty rate of 0.0%, which includes 0 families.
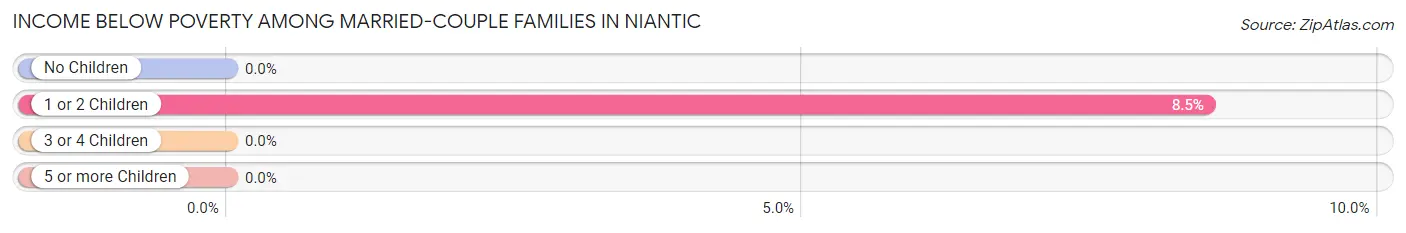
| Children | Above Poverty | Below Poverty |
| No Children | 53 (100.0%) | 0 (0.0%) |
| 1 or 2 Children | 43 (91.5%) | 4 (8.5%) |
| 3 or 4 Children | 2 (100.0%) | 0 (0.0%) |
| 5 or more Children | 6 (100.0%) | 0 (0.0%) |
| Total | 104 (96.3%) | 4 (3.7%) |
Income Below Poverty Among Single-Parent Households in Niantic
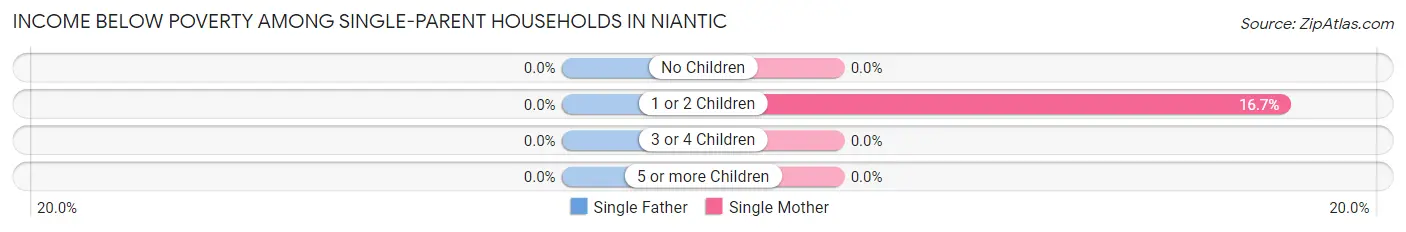
| Children | Single Father | Single Mother |
| No Children | 0 (0.0%) | 0 (0.0%) |
| 1 or 2 Children | 0 (0.0%) | 2 (16.7%) |
| 3 or 4 Children | 0 (0.0%) | 0 (0.0%) |
| 5 or more Children | 0 (0.0%) | 0 (0.0%) |
| Total | 0 (0.0%) | 2 (16.7%) |
Income Below Poverty Among Married-Couple vs Single-Parent Households in Niantic
The poverty data for Niantic shows that 4 of the married-couple family households (3.7%) and 2 of the single-parent households (7.1%) are living below the poverty level. Within the married-couple family households, those with 1 or 2 children have the highest poverty rate, with 4 households (8.5%) falling below the poverty line. Among the single-parent households, those with 1 or 2 children have the highest poverty rate, with 2 household (10.0%) living below poverty.
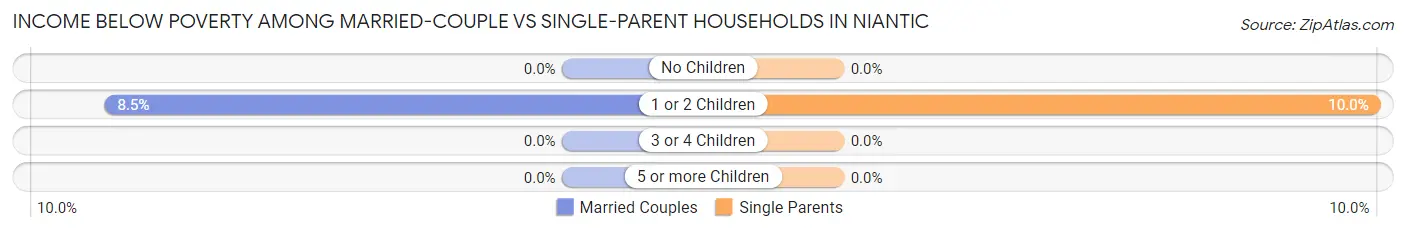
| Children | Married-Couple Families | Single-Parent Households |
| No Children | 0 (0.0%) | 0 (0.0%) |
| 1 or 2 Children | 4 (8.5%) | 2 (10.0%) |
| 3 or 4 Children | 0 (0.0%) | 0 (0.0%) |
| 5 or more Children | 0 (0.0%) | 0 (0.0%) |
| Total | 4 (3.7%) | 2 (7.1%) |
Race in Niantic
The most populous races in Niantic are White / Caucasian (607 | 81.1%), Two or more Races (140 | 18.7%), and Hispanic or Latino (69 | 9.2%).
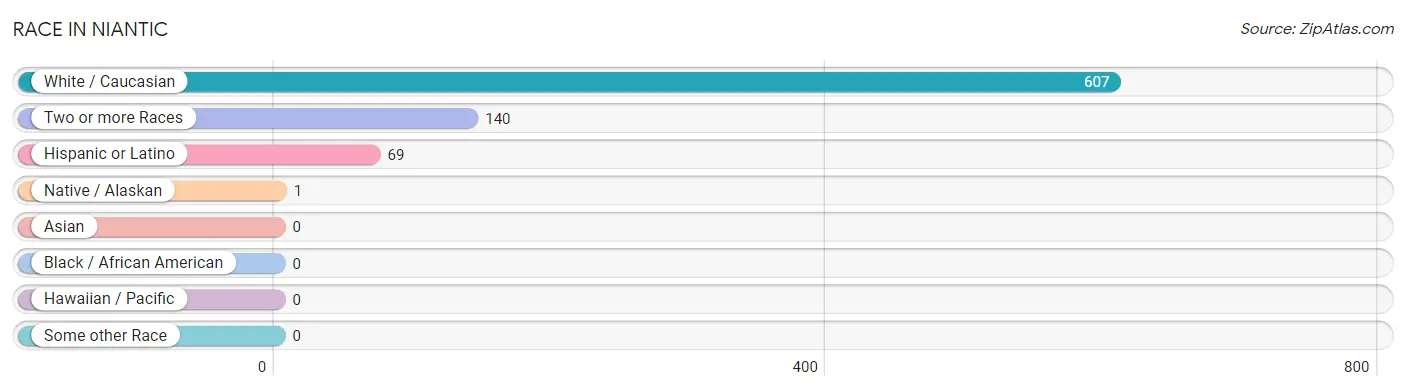
| Race | # Population | % Population |
| Asian | 0 | 0.0% |
| Black / African American | 0 | 0.0% |
| Hawaiian / Pacific | 0 | 0.0% |
| Hispanic or Latino | 69 | 9.2% |
| Native / Alaskan | 1 | 0.1% |
| White / Caucasian | 607 | 81.1% |
| Two or more Races | 140 | 18.7% |
| Some other Race | 0 | 0.0% |
| Total | 748 | 100.0% |
Ancestry in Niantic
The most populous ancestries reported in Niantic are English (148 | 19.8%), German (112 | 15.0%), American (79 | 10.6%), Irish (70 | 9.4%), and Mexican (69 | 9.2%), together accounting for 63.9% of all Niantic residents.
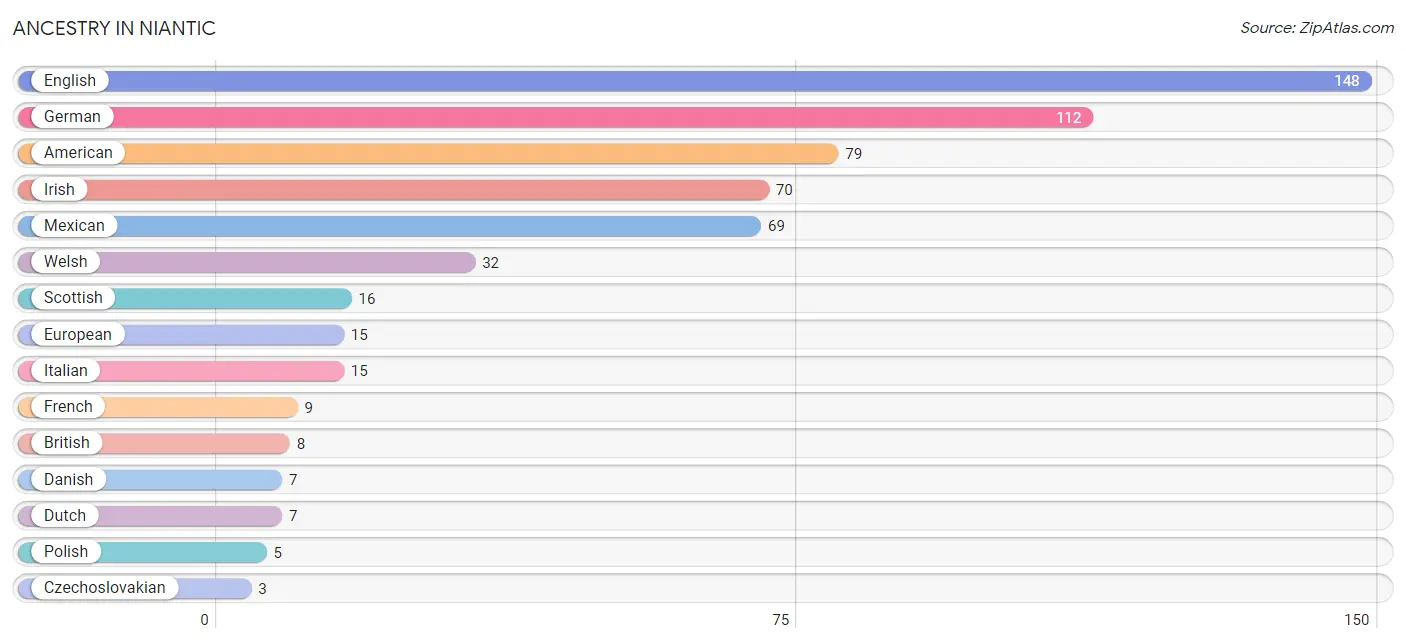
| Ancestry | # Population | % Population |
| American | 79 | 10.6% |
| British | 8 | 1.1% |
| Choctaw | 1 | 0.1% |
| Czechoslovakian | 3 | 0.4% |
| Danish | 7 | 0.9% |
| Dutch | 7 | 0.9% |
| English | 148 | 19.8% |
| European | 15 | 2.0% |
| French | 9 | 1.2% |
| German | 112 | 15.0% |
| Irish | 70 | 9.4% |
| Italian | 15 | 2.0% |
| Mexican | 69 | 9.2% |
| Norwegian | 2 | 0.3% |
| Polish | 5 | 0.7% |
| Scandinavian | 2 | 0.3% |
| Scotch-Irish | 2 | 0.3% |
| Scottish | 16 | 2.1% |
| Swedish | 2 | 0.3% |
| Welsh | 32 | 4.3% | View All 20 Rows |
Immigrants in Niantic
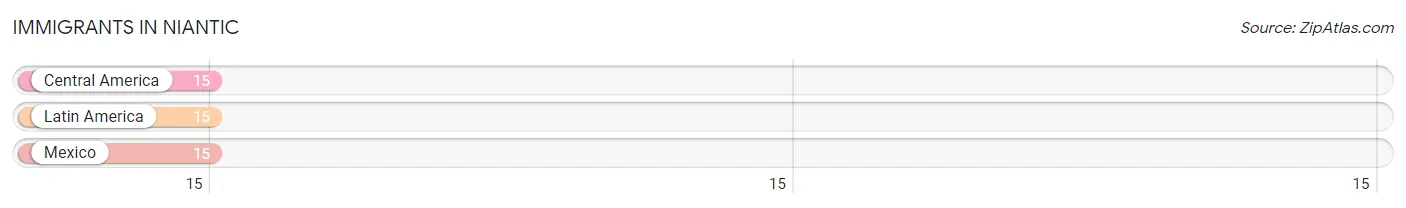
The most numerous immigrant groups reported in Niantic came from Central America (15 | 2.0%), Latin America (15 | 2.0%), and Mexico (15 | 2.0%), together accounting for 6.0% of all Niantic residents.
| Immigration Origin | # Population | % Population |
| Central America | 15 | 2.0% |
| Latin America | 15 | 2.0% |
| Mexico | 15 | 2.0% | View All 3 Rows |
Sex and Age in Niantic
Sex and Age in Niantic
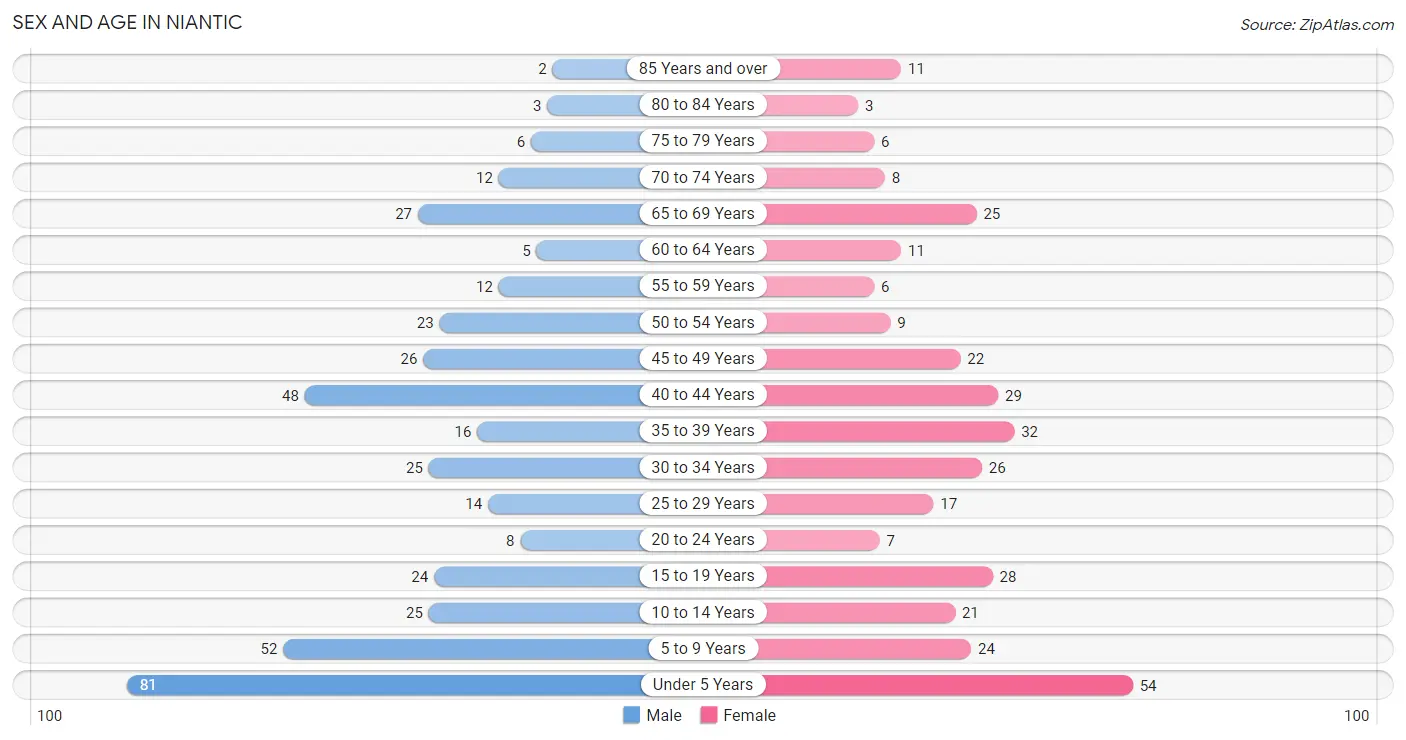
The most populous age groups in Niantic are Under 5 Years (81 | 19.8%) for men and Under 5 Years (54 | 15.9%) for women.
| Age Bracket | Male | Female |
| Under 5 Years | 81 (19.8%) | 54 (15.9%) |
| 5 to 9 Years | 52 (12.7%) | 24 (7.1%) |
| 10 to 14 Years | 25 (6.1%) | 21 (6.2%) |
| 15 to 19 Years | 24 (5.9%) | 28 (8.3%) |
| 20 to 24 Years | 8 (2.0%) | 7 (2.1%) |
| 25 to 29 Years | 14 (3.4%) | 17 (5.0%) |
| 30 to 34 Years | 25 (6.1%) | 26 (7.7%) |
| 35 to 39 Years | 16 (3.9%) | 32 (9.4%) |
| 40 to 44 Years | 48 (11.7%) | 29 (8.6%) |
| 45 to 49 Years | 26 (6.4%) | 22 (6.5%) |
| 50 to 54 Years | 23 (5.6%) | 9 (2.6%) |
| 55 to 59 Years | 12 (2.9%) | 6 (1.8%) |
| 60 to 64 Years | 5 (1.2%) | 11 (3.2%) |
| 65 to 69 Years | 27 (6.6%) | 25 (7.4%) |
| 70 to 74 Years | 12 (2.9%) | 8 (2.4%) |
| 75 to 79 Years | 6 (1.5%) | 6 (1.8%) |
| 80 to 84 Years | 3 (0.7%) | 3 (0.9%) |
| 85 Years and over | 2 (0.5%) | 11 (3.2%) |
| Total | 409 (100.0%) | 339 (100.0%) |
Families and Households in Niantic
Median Family Size in Niantic
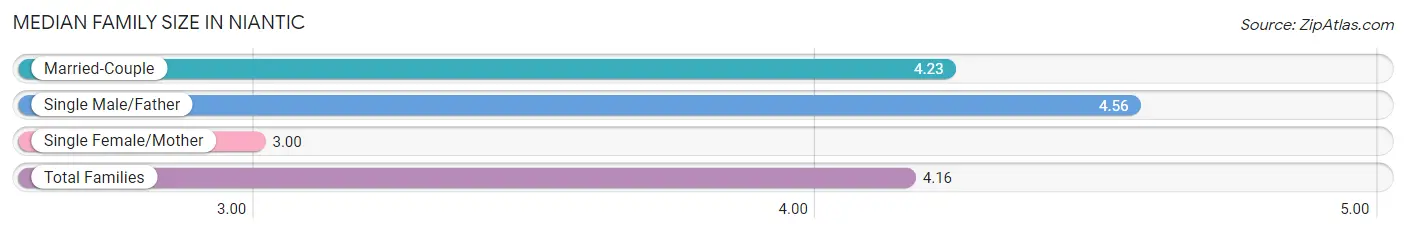
The median family size in Niantic is 4.16 persons per family, with single male/father families (16 | 11.8%) accounting for the largest median family size of 4.56 persons per family. On the other hand, single female/mother families (12 | 8.8%) represent the smallest median family size with 3.00 persons per family.
| Family Type | # Families | Family Size |
| Married-Couple | 108 (79.4%) | 4.23 |
| Single Male/Father | 16 (11.8%) | 4.56 |
| Single Female/Mother | 12 (8.8%) | 3.00 |
| Total Families | 136 (100.0%) | 4.16 |
Median Household Size in Niantic
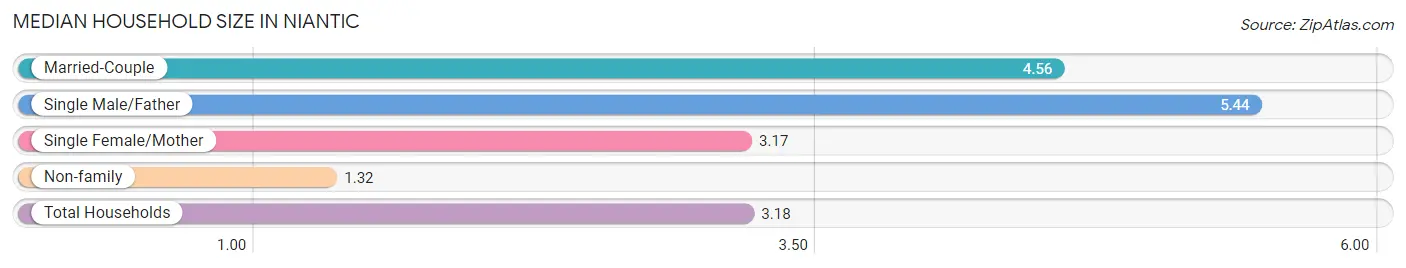
The median household size in Niantic is 3.18 persons per household, with single male/father households (16 | 6.8%) accounting for the largest median household size of 5.44 persons per household. non-family households (99 | 42.1%) represent the smallest median household size with 1.32 persons per household.
| Household Type | # Households | Household Size |
| Married-Couple | 108 (46.0%) | 4.56 |
| Single Male/Father | 16 (6.8%) | 5.44 |
| Single Female/Mother | 12 (5.1%) | 3.17 |
| Non-family | 99 (42.1%) | 1.32 |
| Total Households | 235 (100.0%) | 3.18 |
Household Size by Marriage Status in Niantic
Out of a total of 235 households in Niantic, 136 (57.9%) are family households, while 99 (42.1%) are nonfamily households. The most numerous type of family households are 2-person households, comprising 48, and the most common type of nonfamily households are 1-person households, comprising 78.
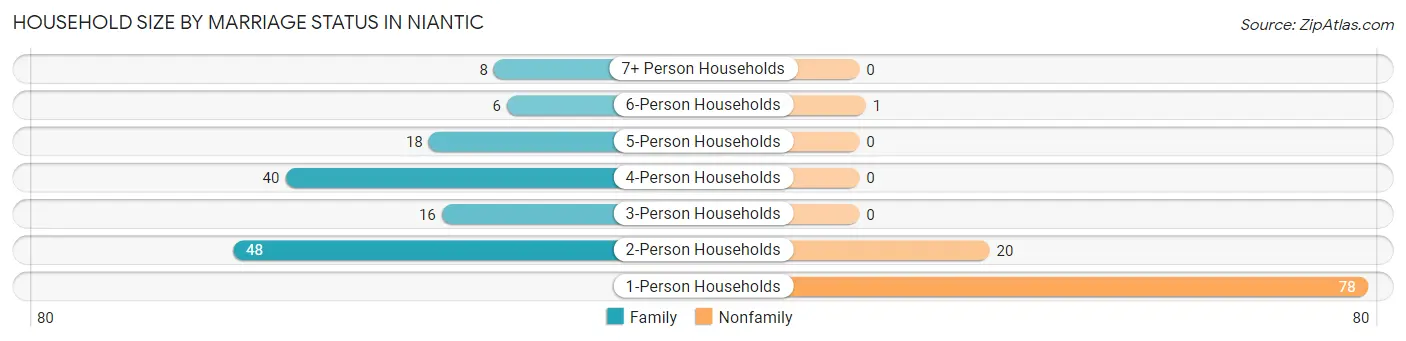
| Household Size | Family Households | Nonfamily Households |
| 1-Person Households | - | 78 (33.2%) |
| 2-Person Households | 48 (20.4%) | 20 (8.5%) |
| 3-Person Households | 16 (6.8%) | 0 (0.0%) |
| 4-Person Households | 40 (17.0%) | 0 (0.0%) |
| 5-Person Households | 18 (7.7%) | 0 (0.0%) |
| 6-Person Households | 6 (2.5%) | 1 (0.4%) |
| 7+ Person Households | 8 (3.4%) | 0 (0.0%) |
| Total | 136 (57.9%) | 99 (42.1%) |
Female Fertility in Niantic
Fertility by Age in Niantic
Average fertility rate in Niantic is 12.0 births per 1,000 women. Women in the age bracket of 35 to 50 years have the highest fertility rate with 23.0 births per 1,000 women. Women in the age bracket of 35 to 50 years acount for 100.0% of all women with births.
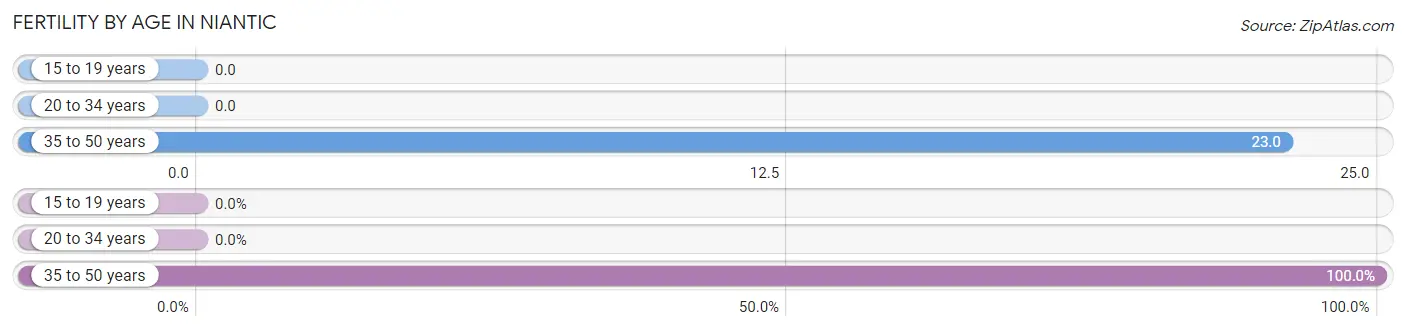
| Age Bracket | Women with Births | Births / 1,000 Women |
| 15 to 19 years | 0 (0.0%) | 0.0 |
| 20 to 34 years | 0 (0.0%) | 0.0 |
| 35 to 50 years | 2 (100.0%) | 23.0 |
| Total | 2 (100.0%) | 12.0 |
Fertility by Age by Marriage Status in Niantic
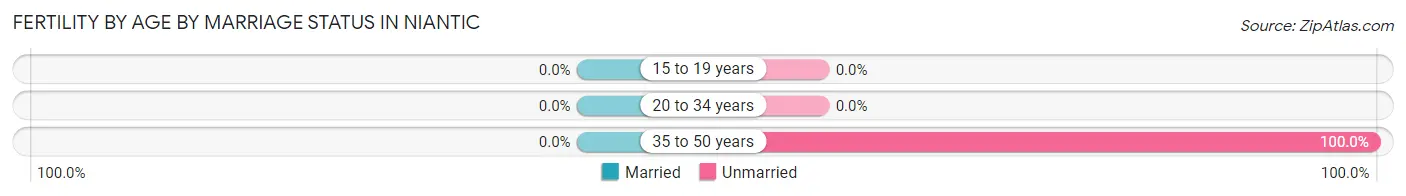
| Age Bracket | Married | Unmarried |
| 15 to 19 years | 0 (0.0%) | 0 (0.0%) |
| 20 to 34 years | 0 (0.0%) | 0 (0.0%) |
| 35 to 50 years | 0 (0.0%) | 2 (100.0%) |
| Total | 0 (0.0%) | 2 (100.0%) |
Fertility by Education in Niantic
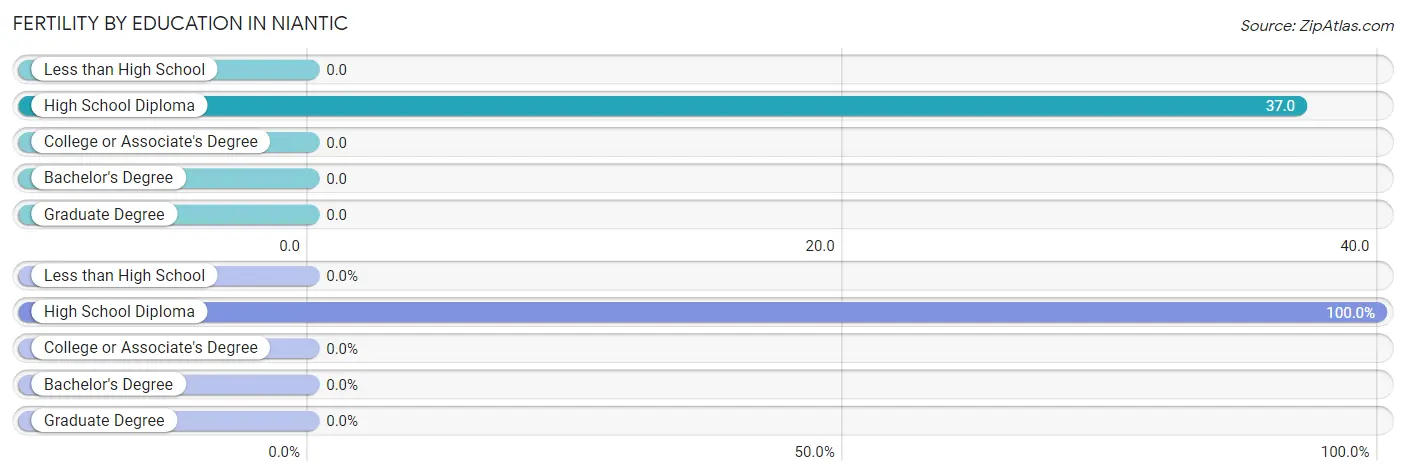
| Educational Attainment | Women with Births | Births / 1,000 Women |
| Less than High School | 0 (0.0%) | 0.0 |
| High School Diploma | 2 (100.0%) | 37.0 |
| College or Associate's Degree | 0 (0.0%) | 0.0 |
| Bachelor's Degree | 0 (0.0%) | 0.0 |
| Graduate Degree | 0 (0.0%) | 0.0 |
| Total | 2 (100.0%) | 12.0 |
Fertility by Education by Marriage Status in Niantic
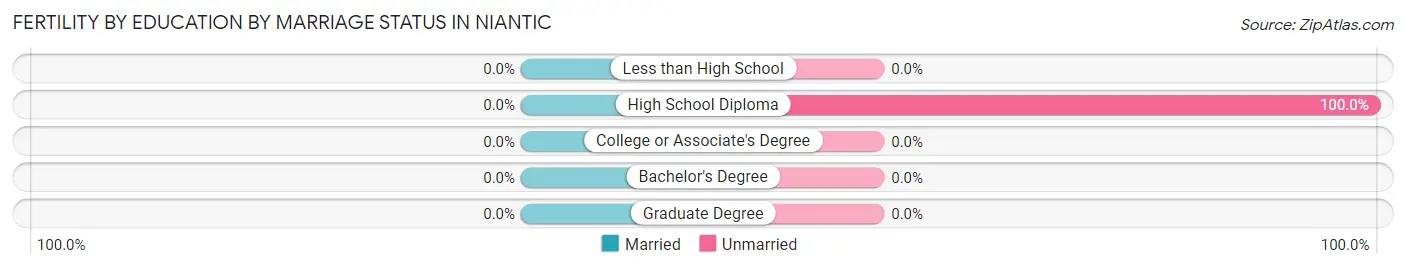
| Educational Attainment | Married | Unmarried |
| Less than High School | 0 (0.0%) | 0 (0.0%) |
| High School Diploma | 0 (0.0%) | 2 (100.0%) |
| College or Associate's Degree | 0 (0.0%) | 0 (0.0%) |
| Bachelor's Degree | 0 (0.0%) | 0 (0.0%) |
| Graduate Degree | 0 (0.0%) | 0 (0.0%) |
| Total | 0 (0.0%) | 2 (100.0%) |
Employment Characteristics in Niantic
Employment by Class of Employer in Niantic
Among the 293 employed individuals in Niantic, private company employees (233 | 79.5%), local government employees (16 | 5.5%), and state government employees (16 | 5.5%) make up the most common classes of employment.
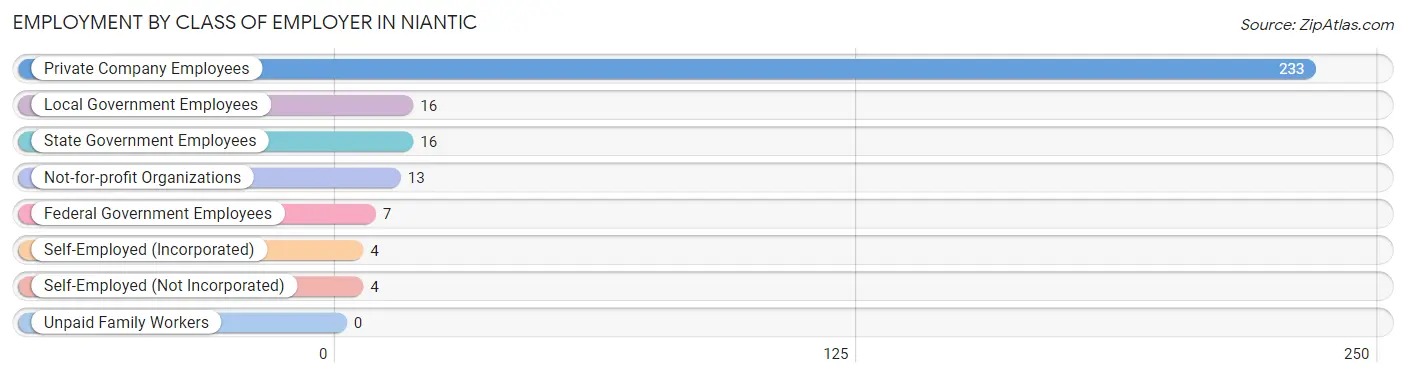
| Employer Class | # Employees | % Employees |
| Private Company Employees | 233 | 79.5% |
| Self-Employed (Incorporated) | 4 | 1.4% |
| Self-Employed (Not Incorporated) | 4 | 1.4% |
| Not-for-profit Organizations | 13 | 4.4% |
| Local Government Employees | 16 | 5.5% |
| State Government Employees | 16 | 5.5% |
| Federal Government Employees | 7 | 2.4% |
| Unpaid Family Workers | 0 | 0.0% |
| Total | 293 | 100.0% |
Employment Status by Age in Niantic
According to the labor force statistics for Niantic, out of the total population over 16 years of age (485), 68.7% or 333 individuals are in the labor force, with 12.0% or 40 of them unemployed. The age group with the highest labor force participation rate is 45 to 54 years, with 92.5% or 74 individuals in the labor force. Within the labor force, the 16 to 19 years age range has the highest percentage of unemployed individuals, with 80.0% or 20 of them being unemployed.
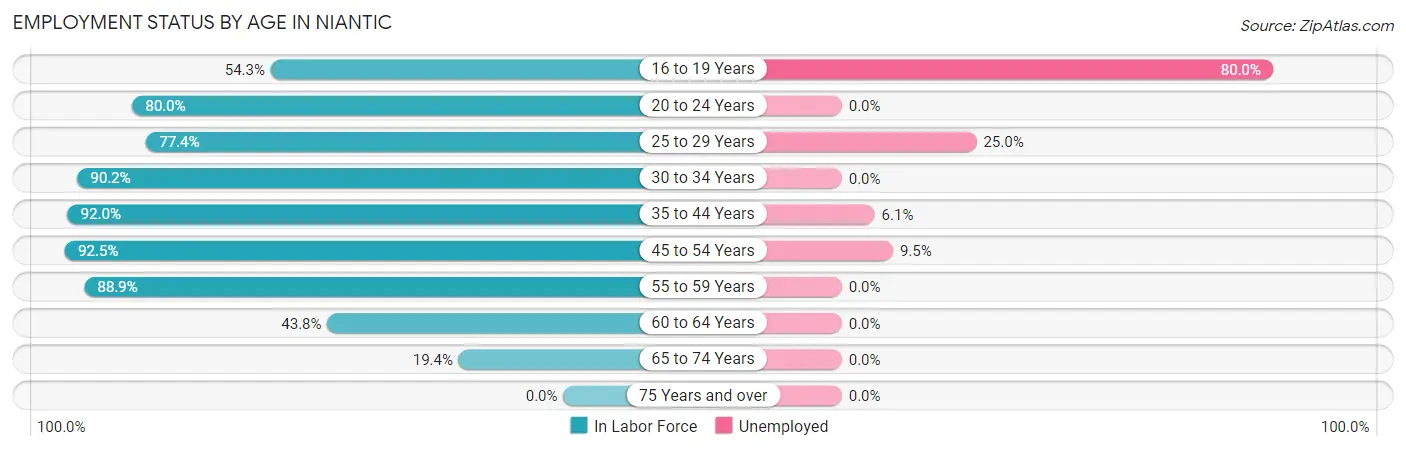
| Age Bracket | In Labor Force | Unemployed |
| 16 to 19 Years | 25 (54.3%) | 20 (80.0%) |
| 20 to 24 Years | 12 (80.0%) | 0 (0.0%) |
| 25 to 29 Years | 24 (77.4%) | 6 (25.0%) |
| 30 to 34 Years | 46 (90.2%) | 0 (0.0%) |
| 35 to 44 Years | 115 (92.0%) | 7 (6.1%) |
| 45 to 54 Years | 74 (92.5%) | 7 (9.5%) |
| 55 to 59 Years | 16 (88.9%) | 0 (0.0%) |
| 60 to 64 Years | 7 (43.8%) | 0 (0.0%) |
| 65 to 74 Years | 14 (19.4%) | 0 (0.0%) |
| 75 Years and over | 0 (0.0%) | 0 (0.0%) |
| Total | 333 (68.7%) | 40 (12.0%) |
Employment Status by Educational Attainment in Niantic
According to labor force statistics for Niantic, 87.9% of individuals (282) out of the total population between 25 and 64 years of age (321) are in the labor force, with 7.1% or 20 of them being unemployed. The group with the highest labor force participation rate are those with the educational attainment of less than high school, with 91.4% or 32 individuals in the labor force. Within the labor force, individuals with high school diploma education have the highest percentage of unemployment, with 12.7% or 13 of them being unemployed.
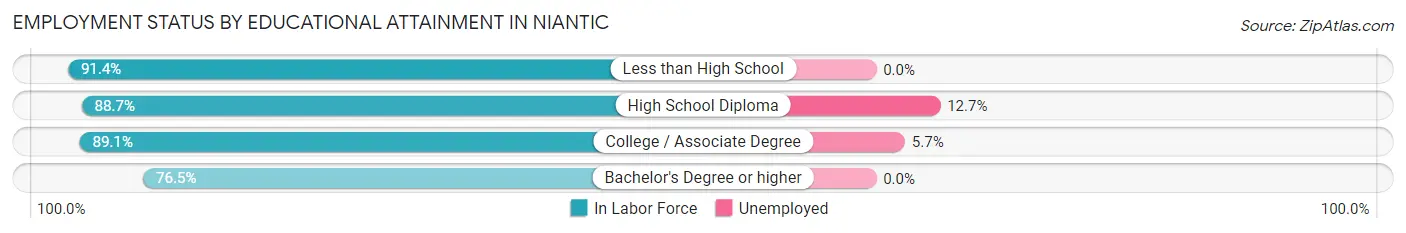
| Educational Attainment | In Labor Force | Unemployed |
| Less than High School | 32 (91.4%) | 0 (0.0%) |
| High School Diploma | 102 (88.7%) | 15 (12.7%) |
| College / Associate Degree | 122 (89.1%) | 8 (5.7%) |
| Bachelor's Degree or higher | 26 (76.5%) | 0 (0.0%) |
| Total | 282 (87.9%) | 23 (7.1%) |
Employment Occupations by Sex in Niantic
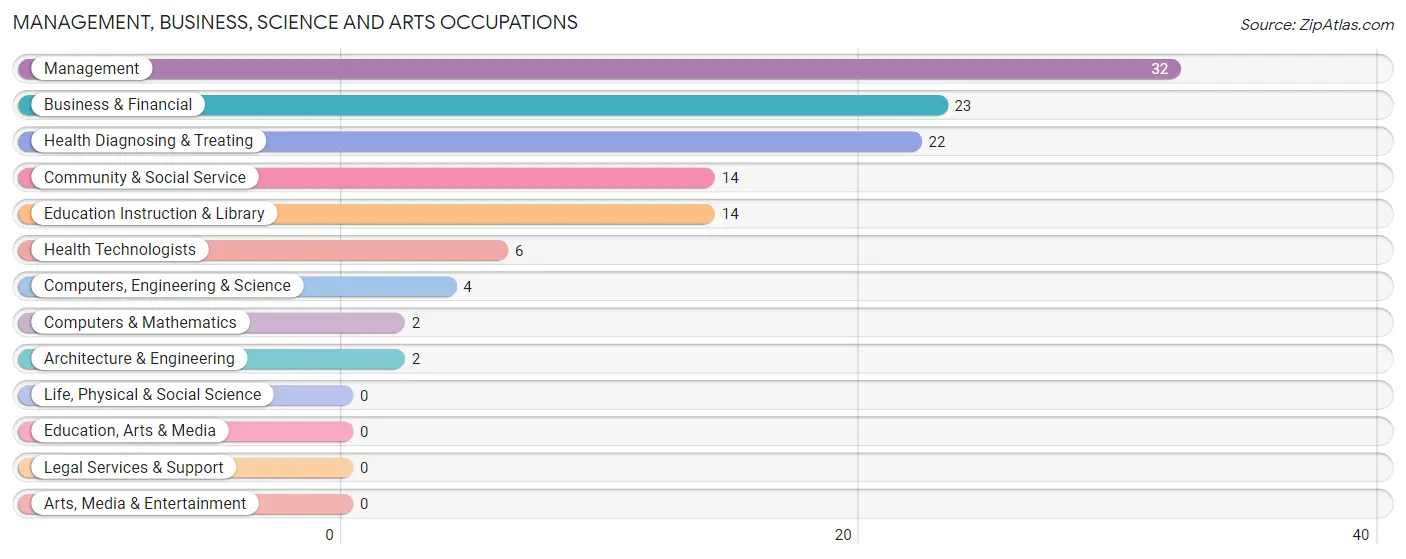
Management, Business, Science and Arts Occupations
The most common Management, Business, Science and Arts occupations in Niantic are Management (32 | 10.9%), Business & Financial (23 | 7.9%), Health Diagnosing & Treating (22 | 7.5%), Community & Social Service (14 | 4.8%), and Education Instruction & Library (14 | 4.8%).
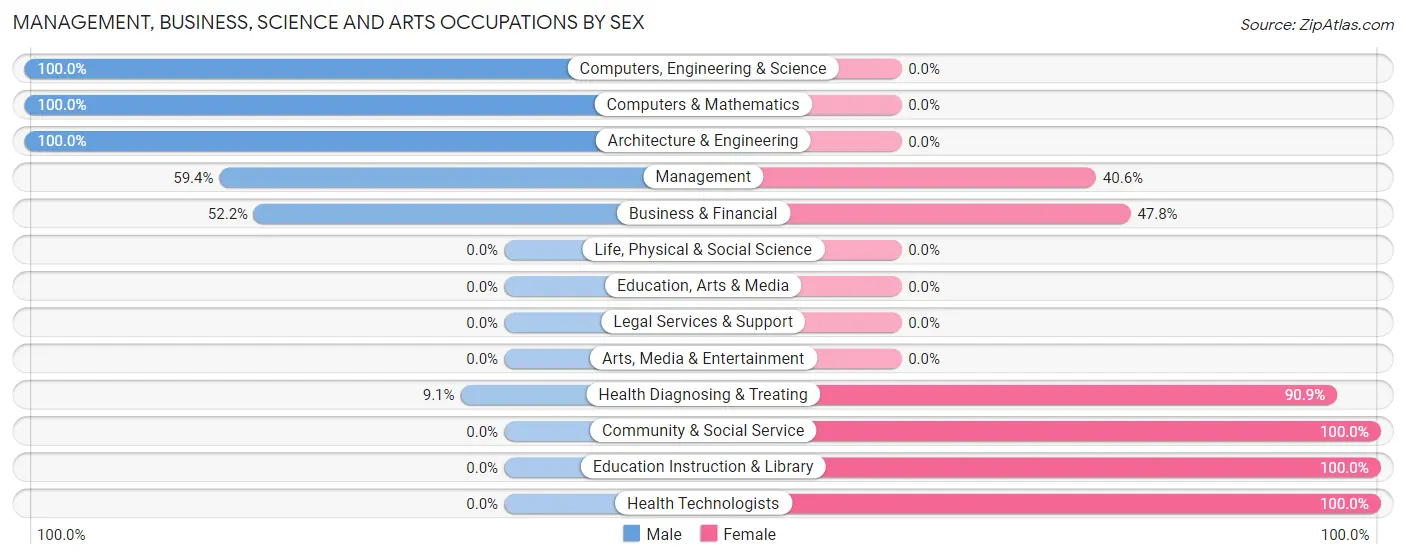
Management, Business, Science and Arts Occupations by Sex
Within the Management, Business, Science and Arts occupations in Niantic, the most male-oriented occupations are Computers, Engineering & Science (100.0%), Computers & Mathematics (100.0%), and Architecture & Engineering (100.0%), while the most female-oriented occupations are Community & Social Service (100.0%), Education Instruction & Library (100.0%), and Health Technologists (100.0%).
| Occupation | Male | Female |
| Management | 19 (59.4%) | 13 (40.6%) |
| Business & Financial | 12 (52.2%) | 11 (47.8%) |
| Computers, Engineering & Science | 4 (100.0%) | 0 (0.0%) |
| Computers & Mathematics | 2 (100.0%) | 0 (0.0%) |
| Architecture & Engineering | 2 (100.0%) | 0 (0.0%) |
| Life, Physical & Social Science | 0 (0.0%) | 0 (0.0%) |
| Community & Social Service | 0 (0.0%) | 14 (100.0%) |
| Education, Arts & Media | 0 (0.0%) | 0 (0.0%) |
| Legal Services & Support | 0 (0.0%) | 0 (0.0%) |
| Education Instruction & Library | 0 (0.0%) | 14 (100.0%) |
| Arts, Media & Entertainment | 0 (0.0%) | 0 (0.0%) |
| Health Diagnosing & Treating | 2 (9.1%) | 20 (90.9%) |
| Health Technologists | 0 (0.0%) | 6 (100.0%) |
| Total (Category) | 37 (39.0%) | 58 (61.1%) |
| Total (Overall) | 162 (55.3%) | 131 (44.7%) |
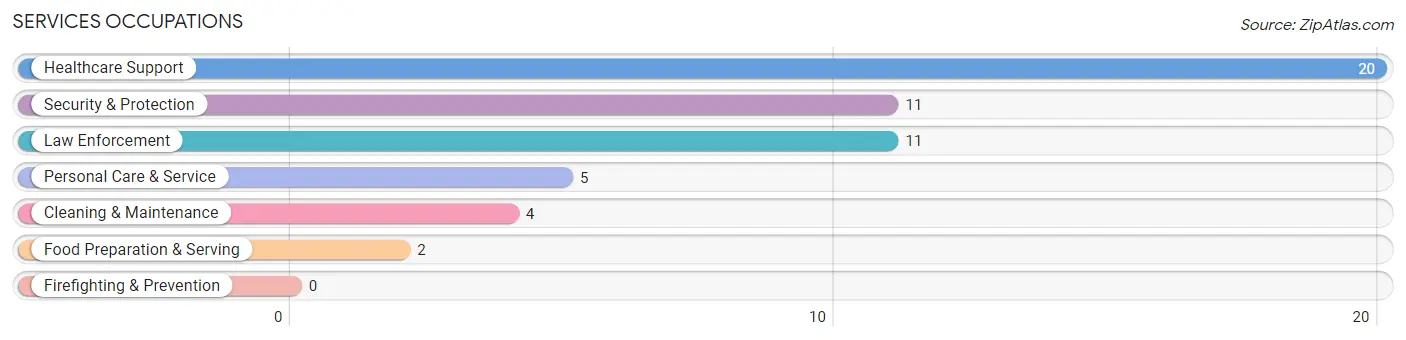
Services Occupations
The most common Services occupations in Niantic are Healthcare Support (20 | 6.8%), Security & Protection (11 | 3.7%), Law Enforcement (11 | 3.7%), Personal Care & Service (5 | 1.7%), and Cleaning & Maintenance (4 | 1.4%).
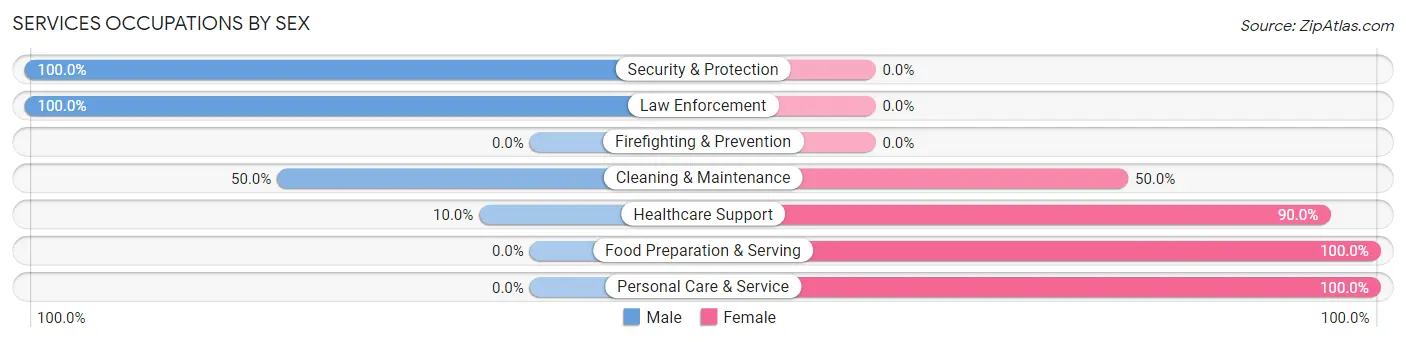
Services Occupations by Sex
Within the Services occupations in Niantic, the most male-oriented occupations are Security & Protection (100.0%), Law Enforcement (100.0%), and Cleaning & Maintenance (50.0%), while the most female-oriented occupations are Food Preparation & Serving (100.0%), Personal Care & Service (100.0%), and Healthcare Support (90.0%).
| Occupation | Male | Female |
| Healthcare Support | 2 (10.0%) | 18 (90.0%) |
| Security & Protection | 11 (100.0%) | 0 (0.0%) |
| Firefighting & Prevention | 0 (0.0%) | 0 (0.0%) |
| Law Enforcement | 11 (100.0%) | 0 (0.0%) |
| Food Preparation & Serving | 0 (0.0%) | 2 (100.0%) |
| Cleaning & Maintenance | 2 (50.0%) | 2 (50.0%) |
| Personal Care & Service | 0 (0.0%) | 5 (100.0%) |
| Total (Category) | 15 (35.7%) | 27 (64.3%) |
| Total (Overall) | 162 (55.3%) | 131 (44.7%) |
Sales and Office Occupations
The most common Sales and Office occupations in Niantic are Sales & Related (39 | 13.3%), and Office & Administration (31 | 10.6%).
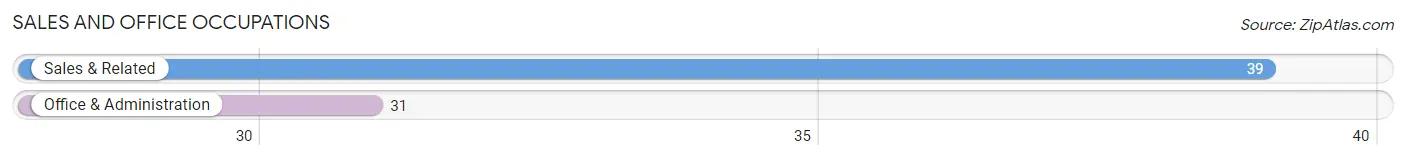
Sales and Office Occupations by Sex
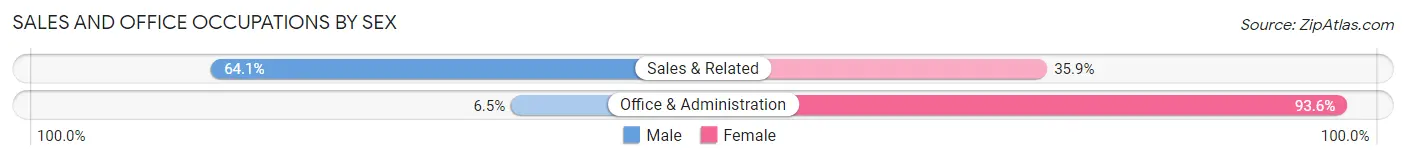
| Occupation | Male | Female |
| Sales & Related | 25 (64.1%) | 14 (35.9%) |
| Office & Administration | 2 (6.5%) | 29 (93.5%) |
| Total (Category) | 27 (38.6%) | 43 (61.4%) |
| Total (Overall) | 162 (55.3%) | 131 (44.7%) |
Natural Resources, Construction and Maintenance Occupations
The most common Natural Resources, Construction and Maintenance occupations in Niantic are Installation, Maintenance & Repair (30 | 10.2%), Construction & Extraction (17 | 5.8%), and Farming, Fishing & Forestry (3 | 1.0%).
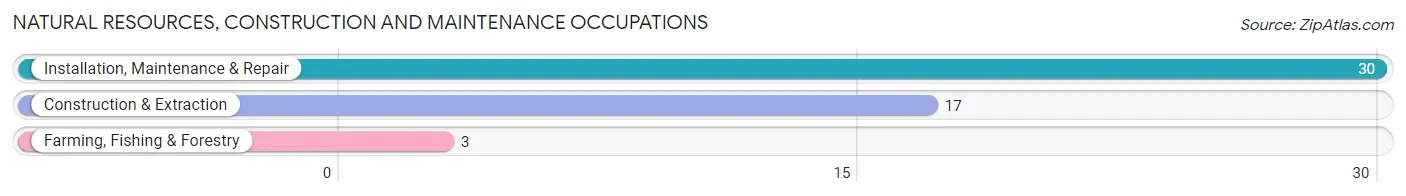
Natural Resources, Construction and Maintenance Occupations by Sex
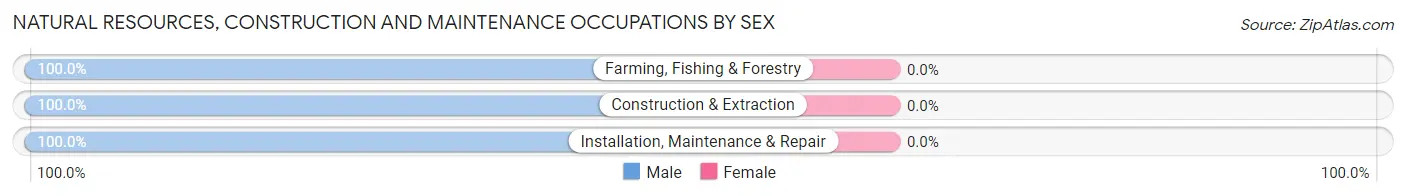
| Occupation | Male | Female |
| Farming, Fishing & Forestry | 3 (100.0%) | 0 (0.0%) |
| Construction & Extraction | 17 (100.0%) | 0 (0.0%) |
| Installation, Maintenance & Repair | 30 (100.0%) | 0 (0.0%) |
| Total (Category) | 50 (100.0%) | 0 (0.0%) |
| Total (Overall) | 162 (55.3%) | 131 (44.7%) |
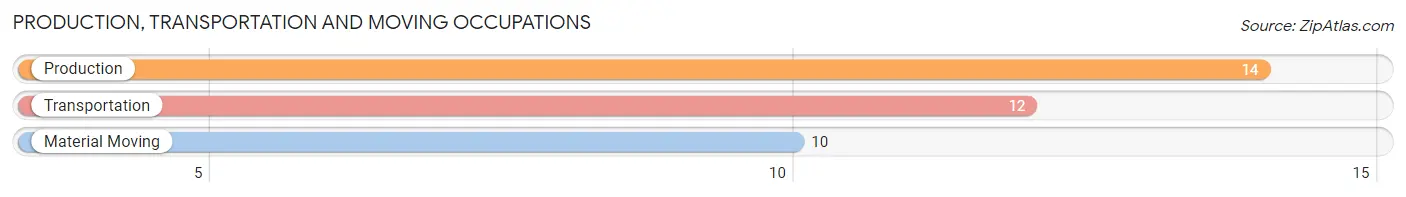
Production, Transportation and Moving Occupations
The most common Production, Transportation and Moving occupations in Niantic are Production (14 | 4.8%), Transportation (12 | 4.1%), and Material Moving (10 | 3.4%).
Production, Transportation and Moving Occupations by Sex
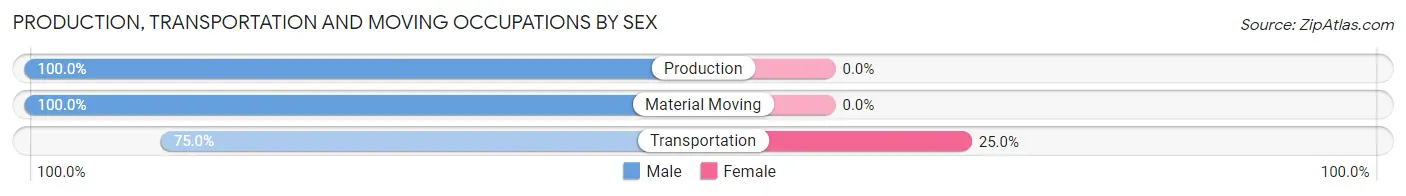
| Occupation | Male | Female |
| Production | 14 (100.0%) | 0 (0.0%) |
| Transportation | 9 (75.0%) | 3 (25.0%) |
| Material Moving | 10 (100.0%) | 0 (0.0%) |
| Total (Category) | 33 (91.7%) | 3 (8.3%) |
| Total (Overall) | 162 (55.3%) | 131 (44.7%) |
Employment Industries by Sex in Niantic
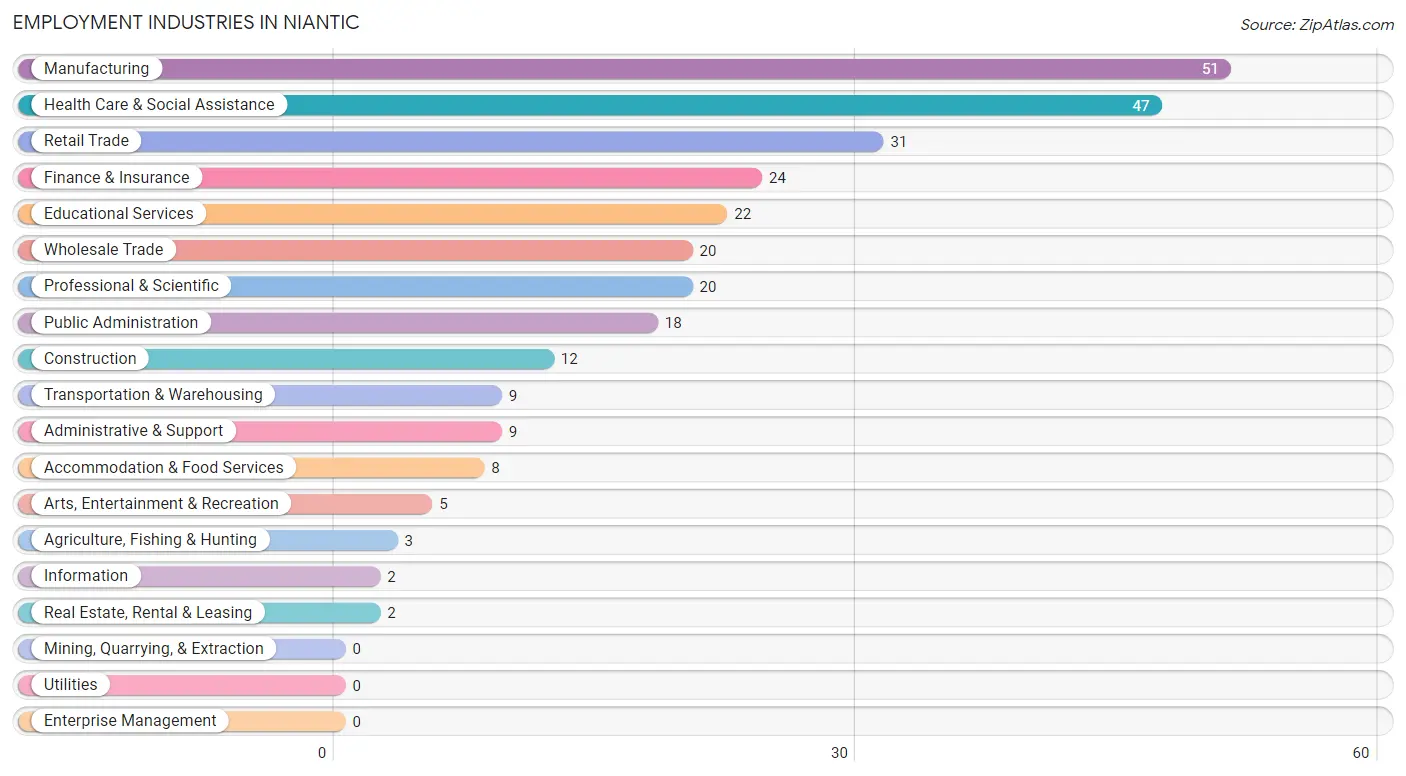
Employment Industries in Niantic
The major employment industries in Niantic include Manufacturing (51 | 17.4%), Health Care & Social Assistance (47 | 16.0%), Retail Trade (31 | 10.6%), Finance & Insurance (24 | 8.2%), and Educational Services (22 | 7.5%).
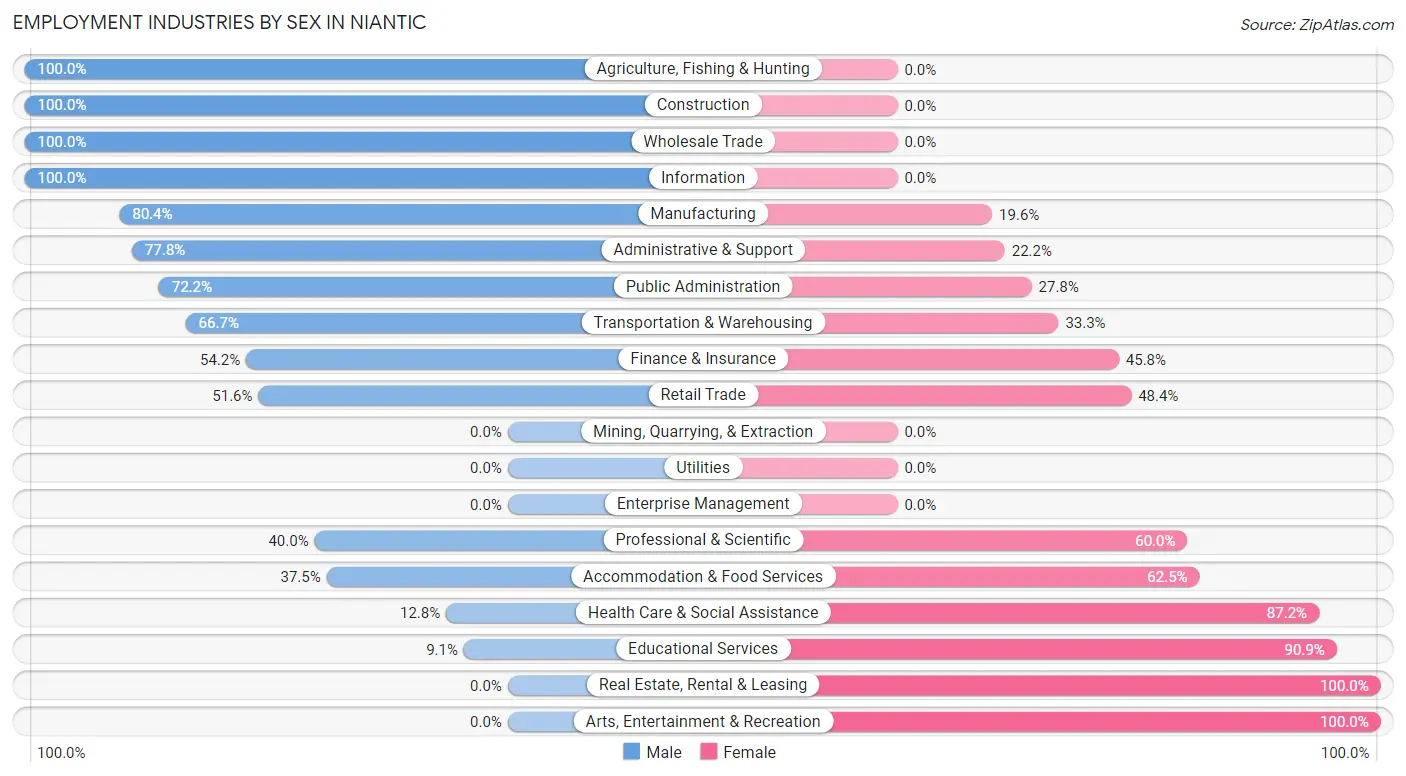
Employment Industries by Sex in Niantic
The Niantic industries that see more men than women are Agriculture, Fishing & Hunting (100.0%), Construction (100.0%), and Wholesale Trade (100.0%), whereas the industries that tend to have a higher number of women are Real Estate, Rental & Leasing (100.0%), Arts, Entertainment & Recreation (100.0%), and Educational Services (90.9%).
| Industry | Male | Female |
| Agriculture, Fishing & Hunting | 3 (100.0%) | 0 (0.0%) |
| Mining, Quarrying, & Extraction | 0 (0.0%) | 0 (0.0%) |
| Construction | 12 (100.0%) | 0 (0.0%) |
| Manufacturing | 41 (80.4%) | 10 (19.6%) |
| Wholesale Trade | 20 (100.0%) | 0 (0.0%) |
| Retail Trade | 16 (51.6%) | 15 (48.4%) |
| Transportation & Warehousing | 6 (66.7%) | 3 (33.3%) |
| Utilities | 0 (0.0%) | 0 (0.0%) |
| Information | 2 (100.0%) | 0 (0.0%) |
| Finance & Insurance | 13 (54.2%) | 11 (45.8%) |
| Real Estate, Rental & Leasing | 0 (0.0%) | 2 (100.0%) |
| Professional & Scientific | 8 (40.0%) | 12 (60.0%) |
| Enterprise Management | 0 (0.0%) | 0 (0.0%) |
| Administrative & Support | 7 (77.8%) | 2 (22.2%) |
| Educational Services | 2 (9.1%) | 20 (90.9%) |
| Health Care & Social Assistance | 6 (12.8%) | 41 (87.2%) |
| Arts, Entertainment & Recreation | 0 (0.0%) | 5 (100.0%) |
| Accommodation & Food Services | 3 (37.5%) | 5 (62.5%) |
| Public Administration | 13 (72.2%) | 5 (27.8%) |
| Total | 162 (55.3%) | 131 (44.7%) |
Education in Niantic
School Enrollment in Niantic
The most common levels of schooling among the 179 students in Niantic are elementary school (63 | 35.2%), middle school (45 | 25.1%), and high school (29 | 16.2%).
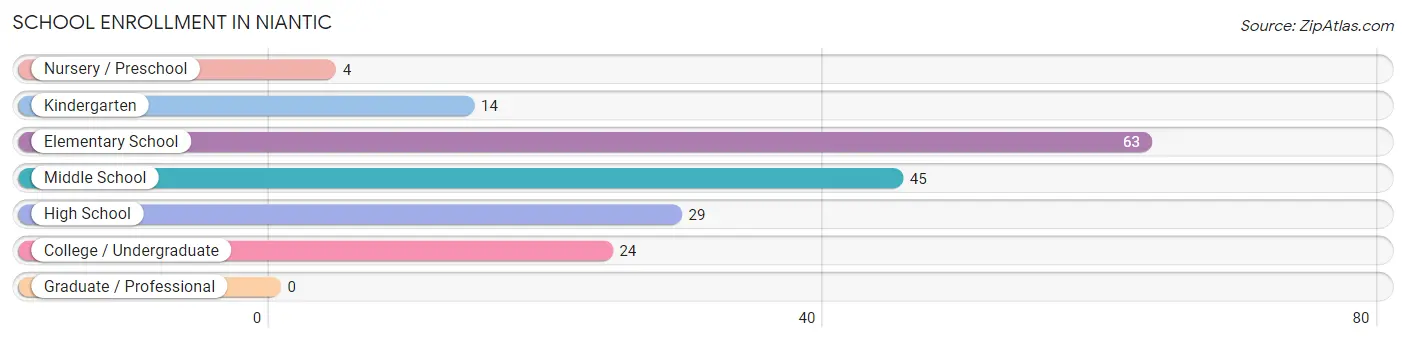
| School Level | # Students | % Students |
| Nursery / Preschool | 4 | 2.2% |
| Kindergarten | 14 | 7.8% |
| Elementary School | 63 | 35.2% |
| Middle School | 45 | 25.1% |
| High School | 29 | 16.2% |
| College / Undergraduate | 24 | 13.4% |
| Graduate / Professional | 0 | 0.0% |
| Total | 179 | 100.0% |
School Enrollment by Age by Funding Source in Niantic
Out of a total of 179 students who are enrolled in schools in Niantic, 23 (12.8%) attend a private institution, while the remaining 156 (87.2%) are enrolled in public schools. The age group of 20 to 24 year olds has the highest likelihood of being enrolled in private schools, with 8 (100.0% in the age bracket) enrolled. Conversely, the age group of 3 to 4 year olds has the lowest likelihood of being enrolled in a private school, with 2 (100.0% in the age bracket) attending a public institution.
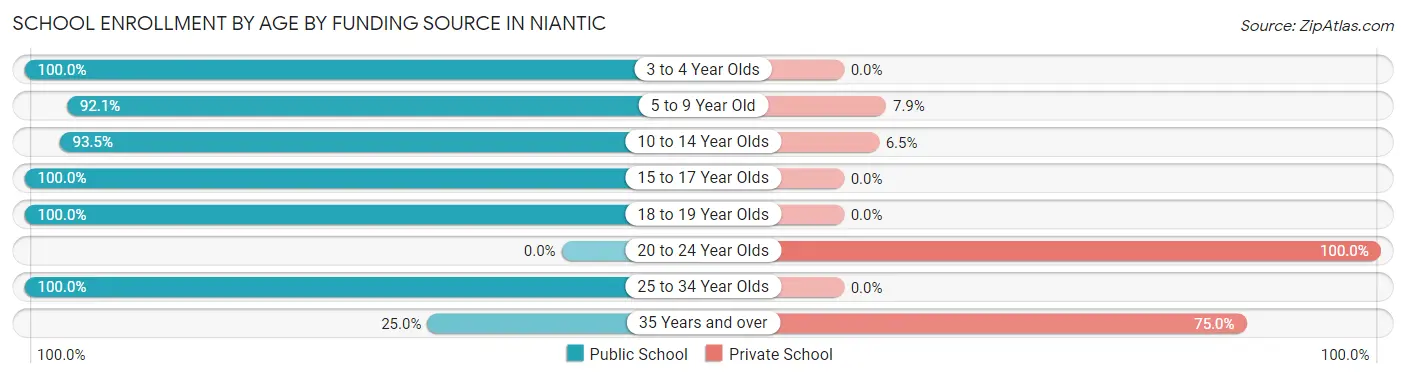
| Age Bracket | Public School | Private School |
| 3 to 4 Year Olds | 2 (100.0%) | 0 (0.0%) |
| 5 to 9 Year Old | 70 (92.1%) | 6 (7.9%) |
| 10 to 14 Year Olds | 43 (93.5%) | 3 (6.5%) |
| 15 to 17 Year Olds | 29 (100.0%) | 0 (0.0%) |
| 18 to 19 Year Olds | 3 (100.0%) | 0 (0.0%) |
| 20 to 24 Year Olds | 0 (0.0%) | 8 (100.0%) |
| 25 to 34 Year Olds | 7 (100.0%) | 0 (0.0%) |
| 35 Years and over | 2 (25.0%) | 6 (75.0%) |
| Total | 156 (87.2%) | 23 (12.8%) |
Educational Attainment by Field of Study in Niantic
Business (15 | 31.2%), arts & humanities (9 | 18.8%), education (6 | 12.5%), computers & mathematics (5 | 10.4%), and science & technology (4 | 8.3%) are the most common fields of study among 48 individuals in Niantic who have obtained a bachelor's degree or higher.
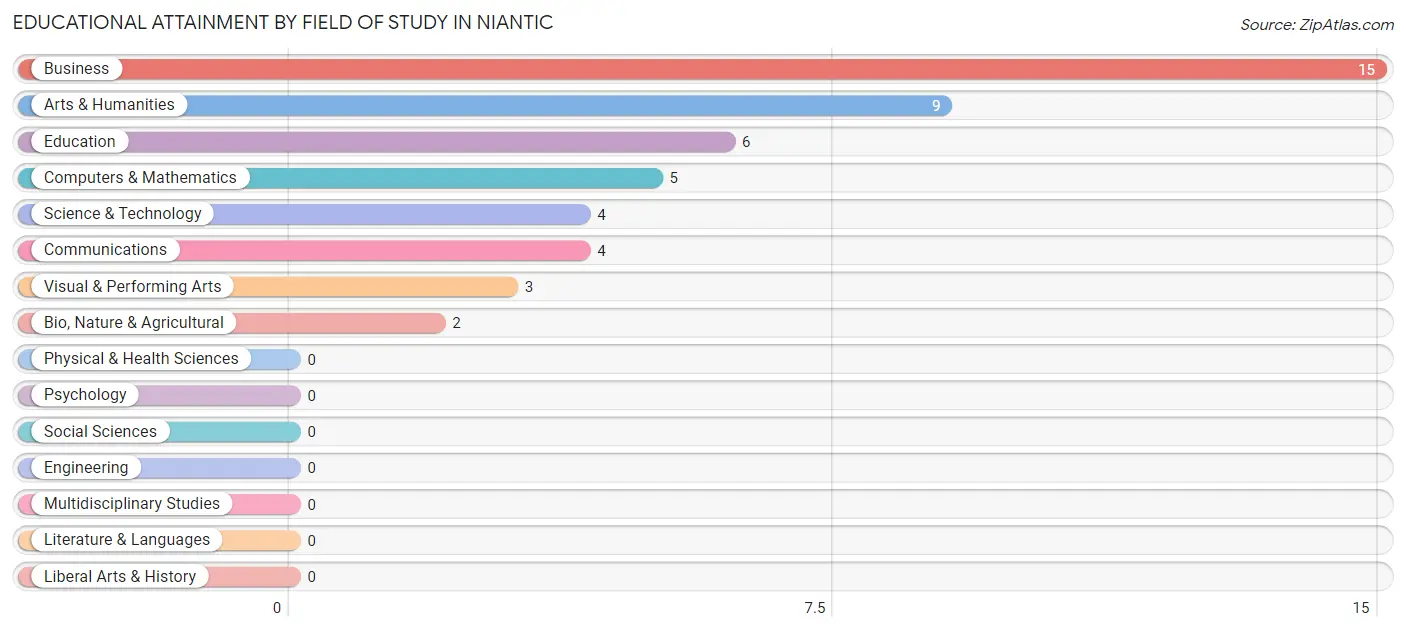
| Field of Study | # Graduates | % Graduates |
| Computers & Mathematics | 5 | 10.4% |
| Bio, Nature & Agricultural | 2 | 4.2% |
| Physical & Health Sciences | 0 | 0.0% |
| Psychology | 0 | 0.0% |
| Social Sciences | 0 | 0.0% |
| Engineering | 0 | 0.0% |
| Multidisciplinary Studies | 0 | 0.0% |
| Science & Technology | 4 | 8.3% |
| Business | 15 | 31.2% |
| Education | 6 | 12.5% |
| Literature & Languages | 0 | 0.0% |
| Liberal Arts & History | 0 | 0.0% |
| Visual & Performing Arts | 3 | 6.2% |
| Communications | 4 | 8.3% |
| Arts & Humanities | 9 | 18.8% |
| Total | 48 | 100.0% |
Transportation & Commute in Niantic
Vehicle Availability by Sex in Niantic
The most prevalent vehicle ownership categories in Niantic are males with 2 vehicles (72, accounting for 44.4%) and females with 2 vehicles (65, making up 55.0%).
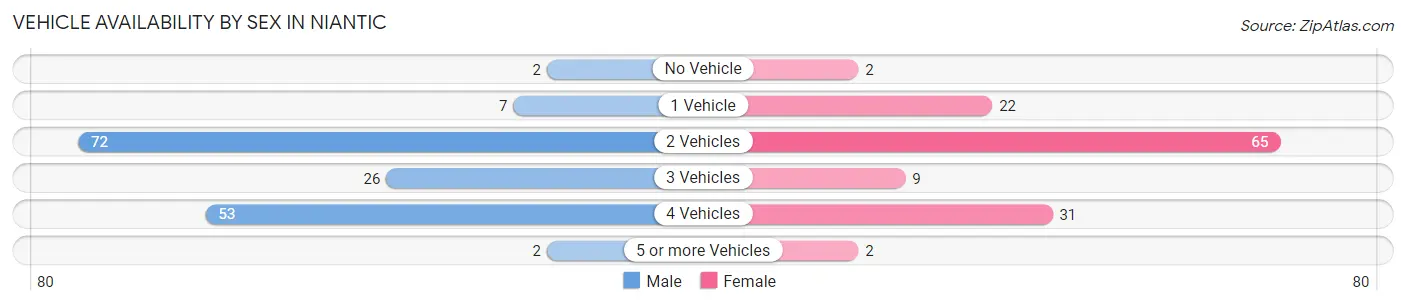
| Vehicles Available | Male | Female |
| No Vehicle | 2 (1.2%) | 2 (1.5%) |
| 1 Vehicle | 7 (4.3%) | 22 (16.8%) |
| 2 Vehicles | 72 (44.4%) | 65 (49.6%) |
| 3 Vehicles | 26 (16.1%) | 9 (6.9%) |
| 4 Vehicles | 53 (32.7%) | 31 (23.7%) |
| 5 or more Vehicles | 2 (1.2%) | 2 (1.5%) |
| Total | 162 (100.0%) | 131 (100.0%) |
Commute Time in Niantic
The most frequently occuring commute durations in Niantic are 25 to 29 minutes (78 commuters, 27.6%), 20 to 24 minutes (68 commuters, 24.0%), and 30 to 34 minutes (38 commuters, 13.4%).
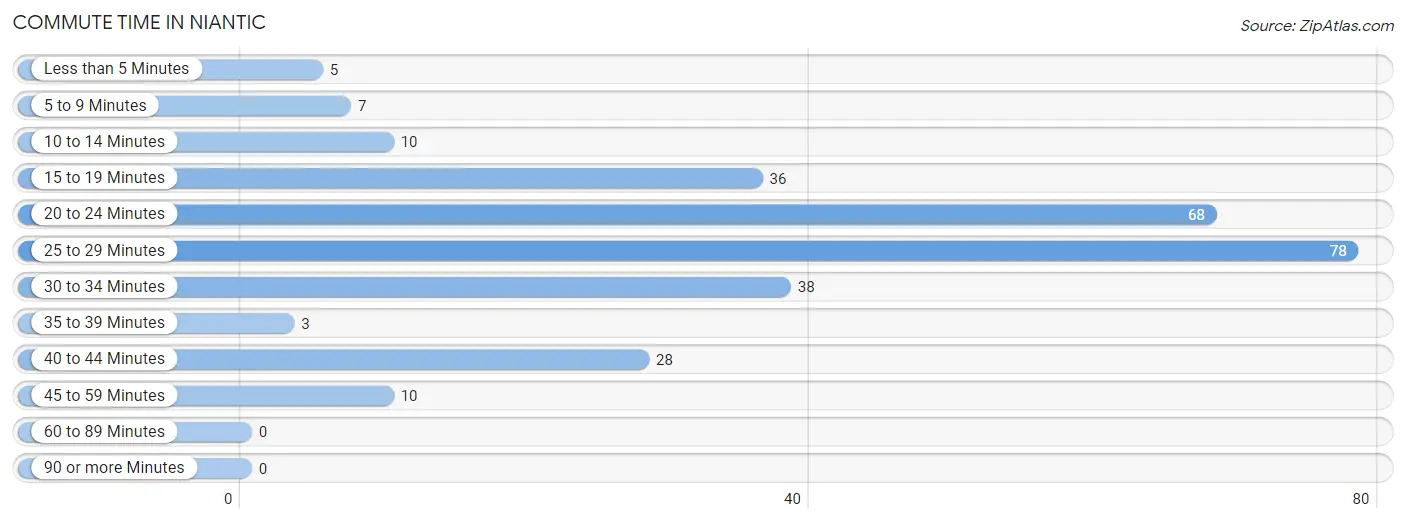
| Commute Time | # Commuters | % Commuters |
| Less than 5 Minutes | 5 | 1.8% |
| 5 to 9 Minutes | 7 | 2.5% |
| 10 to 14 Minutes | 10 | 3.5% |
| 15 to 19 Minutes | 36 | 12.7% |
| 20 to 24 Minutes | 68 | 24.0% |
| 25 to 29 Minutes | 78 | 27.6% |
| 30 to 34 Minutes | 38 | 13.4% |
| 35 to 39 Minutes | 3 | 1.1% |
| 40 to 44 Minutes | 28 | 9.9% |
| 45 to 59 Minutes | 10 | 3.5% |
| 60 to 89 Minutes | 0 | 0.0% |
| 90 or more Minutes | 0 | 0.0% |
Commute Time by Sex in Niantic
The most common commute times in Niantic are 25 to 29 minutes (52 commuters, 33.1%) for males and 20 to 24 minutes (26 commuters, 20.6%) for females.
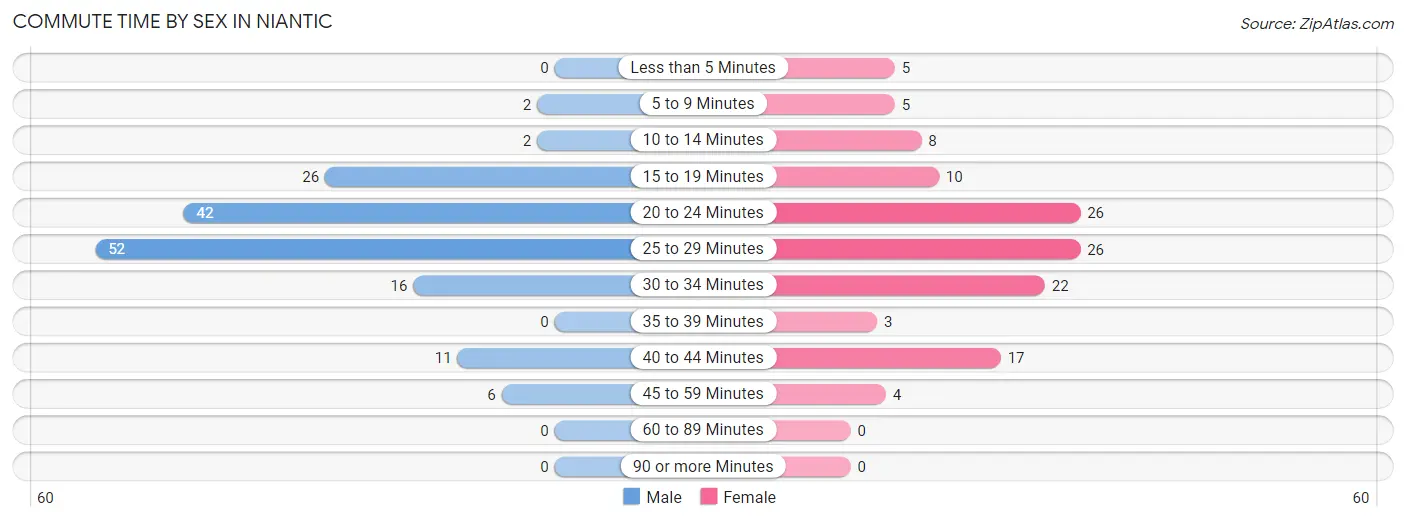
| Commute Time | Male | Female |
| Less than 5 Minutes | 0 (0.0%) | 5 (4.0%) |
| 5 to 9 Minutes | 2 (1.3%) | 5 (4.0%) |
| 10 to 14 Minutes | 2 (1.3%) | 8 (6.4%) |
| 15 to 19 Minutes | 26 (16.6%) | 10 (7.9%) |
| 20 to 24 Minutes | 42 (26.8%) | 26 (20.6%) |
| 25 to 29 Minutes | 52 (33.1%) | 26 (20.6%) |
| 30 to 34 Minutes | 16 (10.2%) | 22 (17.5%) |
| 35 to 39 Minutes | 0 (0.0%) | 3 (2.4%) |
| 40 to 44 Minutes | 11 (7.0%) | 17 (13.5%) |
| 45 to 59 Minutes | 6 (3.8%) | 4 (3.2%) |
| 60 to 89 Minutes | 0 (0.0%) | 0 (0.0%) |
| 90 or more Minutes | 0 (0.0%) | 0 (0.0%) |
Time of Departure to Work by Sex in Niantic
The most frequent times of departure to work in Niantic are 5:30 AM to 5:59 AM (30, 19.1%) for males and 7:30 AM to 7:59 AM (41, 32.5%) for females.
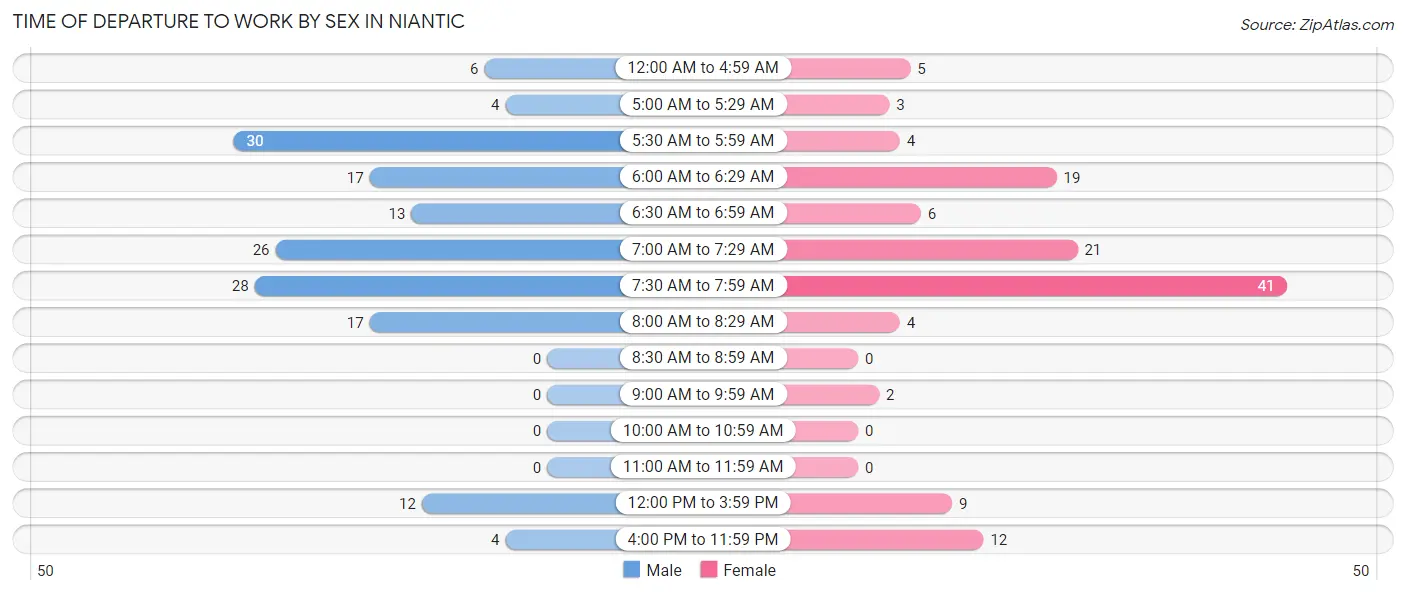
| Time of Departure | Male | Female |
| 12:00 AM to 4:59 AM | 6 (3.8%) | 5 (4.0%) |
| 5:00 AM to 5:29 AM | 4 (2.5%) | 3 (2.4%) |
| 5:30 AM to 5:59 AM | 30 (19.1%) | 4 (3.2%) |
| 6:00 AM to 6:29 AM | 17 (10.8%) | 19 (15.1%) |
| 6:30 AM to 6:59 AM | 13 (8.3%) | 6 (4.8%) |
| 7:00 AM to 7:29 AM | 26 (16.6%) | 21 (16.7%) |
| 7:30 AM to 7:59 AM | 28 (17.8%) | 41 (32.5%) |
| 8:00 AM to 8:29 AM | 17 (10.8%) | 4 (3.2%) |
| 8:30 AM to 8:59 AM | 0 (0.0%) | 0 (0.0%) |
| 9:00 AM to 9:59 AM | 0 (0.0%) | 2 (1.6%) |
| 10:00 AM to 10:59 AM | 0 (0.0%) | 0 (0.0%) |
| 11:00 AM to 11:59 AM | 0 (0.0%) | 0 (0.0%) |
| 12:00 PM to 3:59 PM | 12 (7.6%) | 9 (7.1%) |
| 4:00 PM to 11:59 PM | 4 (2.5%) | 12 (9.5%) |
| Total | 157 (100.0%) | 126 (100.0%) |
Housing Occupancy in Niantic
Occupancy by Ownership in Niantic
Of the total 235 dwellings in Niantic, owner-occupied units account for 201 (85.5%), while renter-occupied units make up 34 (14.5%).
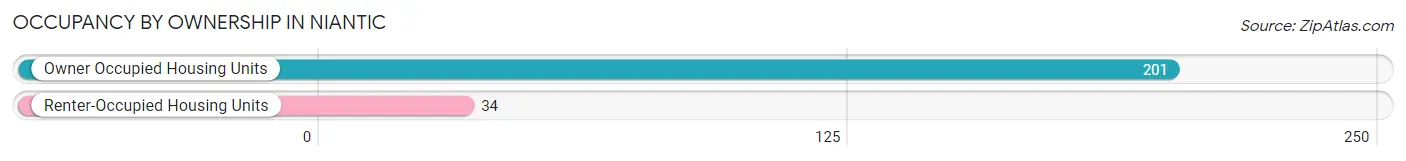
| Occupancy | # Housing Units | % Housing Units |
| Owner Occupied Housing Units | 201 | 85.5% |
| Renter-Occupied Housing Units | 34 | 14.5% |
| Total Occupied Housing Units | 235 | 100.0% |
Occupancy by Household Size in Niantic
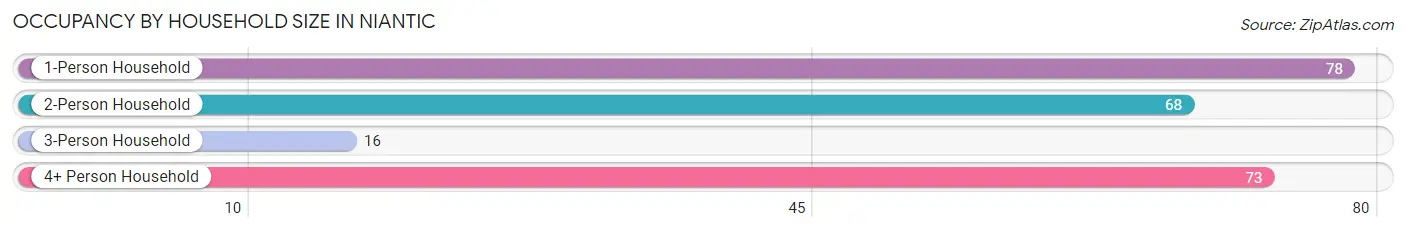
| Household Size | # Housing Units | % Housing Units |
| 1-Person Household | 78 | 33.2% |
| 2-Person Household | 68 | 28.9% |
| 3-Person Household | 16 | 6.8% |
| 4+ Person Household | 73 | 31.1% |
| Total Housing Units | 235 | 100.0% |
Occupancy by Ownership by Household Size in Niantic
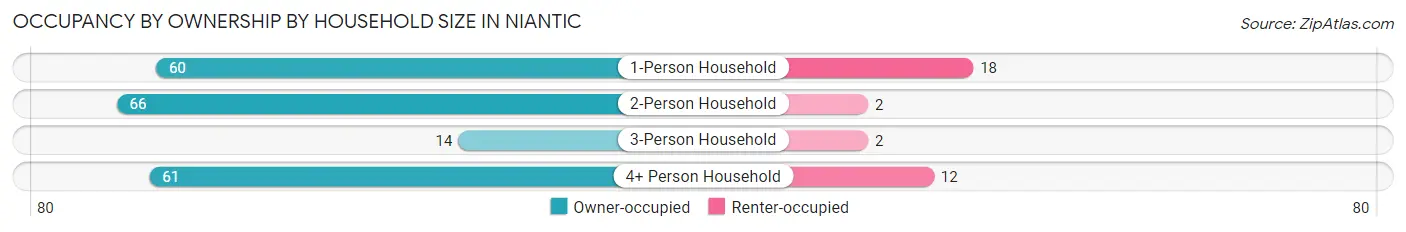
| Household Size | Owner-occupied | Renter-occupied |
| 1-Person Household | 60 (76.9%) | 18 (23.1%) |
| 2-Person Household | 66 (97.1%) | 2 (2.9%) |
| 3-Person Household | 14 (87.5%) | 2 (12.5%) |
| 4+ Person Household | 61 (83.6%) | 12 (16.4%) |
| Total Housing Units | 201 (85.5%) | 34 (14.5%) |
Occupancy by Educational Attainment in Niantic
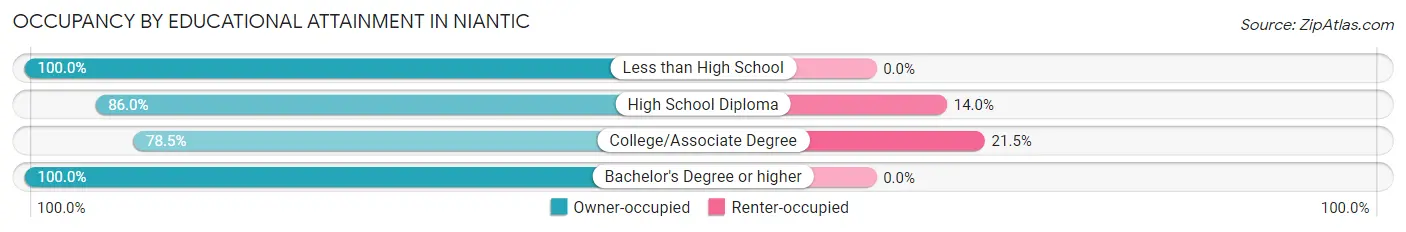
| Household Size | Owner-occupied | Renter-occupied |
| Less than High School | 11 (100.0%) | 0 (0.0%) |
| High School Diploma | 86 (86.0%) | 14 (14.0%) |
| College/Associate Degree | 73 (78.5%) | 20 (21.5%) |
| Bachelor's Degree or higher | 31 (100.0%) | 0 (0.0%) |
Occupancy by Age of Householder in Niantic
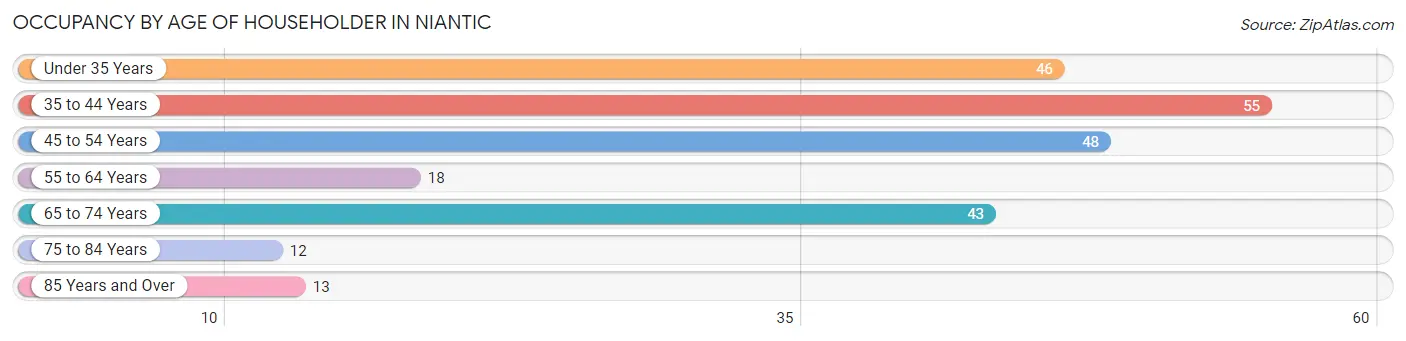
| Age Bracket | # Households | % Households |
| Under 35 Years | 46 | 19.6% |
| 35 to 44 Years | 55 | 23.4% |
| 45 to 54 Years | 48 | 20.4% |
| 55 to 64 Years | 18 | 7.7% |
| 65 to 74 Years | 43 | 18.3% |
| 75 to 84 Years | 12 | 5.1% |
| 85 Years and Over | 13 | 5.5% |
| Total | 235 | 100.0% |
Housing Finances in Niantic
Median Income by Occupancy in Niantic
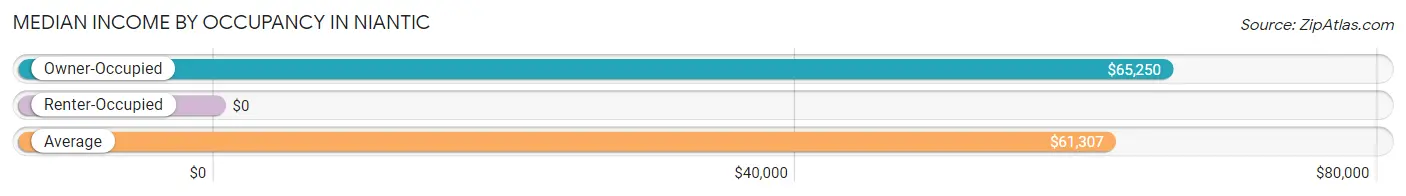
| Occupancy Type | # Households | Median Income |
| Owner-Occupied | 201 (85.5%) | $65,250 |
| Renter-Occupied | 34 (14.5%) | $0 |
| Average | 235 (100.0%) | $61,307 |
Occupancy by Householder Income Bracket in Niantic
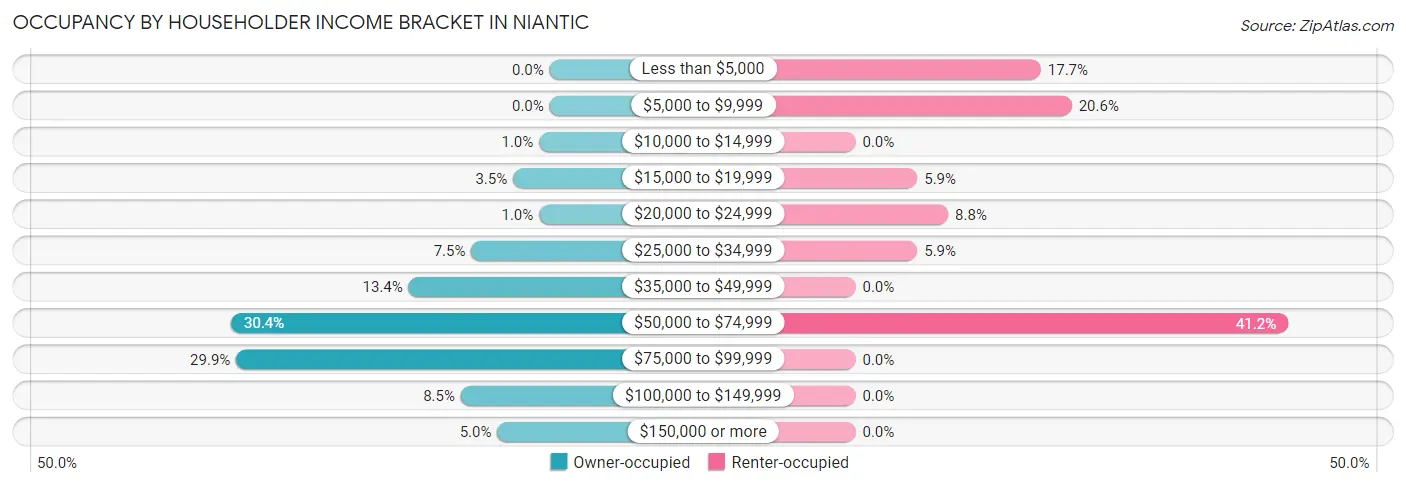
| Income Bracket | Owner-occupied | Renter-occupied |
| Less than $5,000 | 0 (0.0%) | 6 (17.6%) |
| $5,000 to $9,999 | 0 (0.0%) | 7 (20.6%) |
| $10,000 to $14,999 | 2 (1.0%) | 0 (0.0%) |
| $15,000 to $19,999 | 7 (3.5%) | 2 (5.9%) |
| $20,000 to $24,999 | 2 (1.0%) | 3 (8.8%) |
| $25,000 to $34,999 | 15 (7.5%) | 2 (5.9%) |
| $35,000 to $49,999 | 27 (13.4%) | 0 (0.0%) |
| $50,000 to $74,999 | 61 (30.3%) | 14 (41.2%) |
| $75,000 to $99,999 | 60 (29.8%) | 0 (0.0%) |
| $100,000 to $149,999 | 17 (8.5%) | 0 (0.0%) |
| $150,000 or more | 10 (5.0%) | 0 (0.0%) |
| Total | 201 (100.0%) | 34 (100.0%) |
Monthly Housing Cost Tiers in Niantic
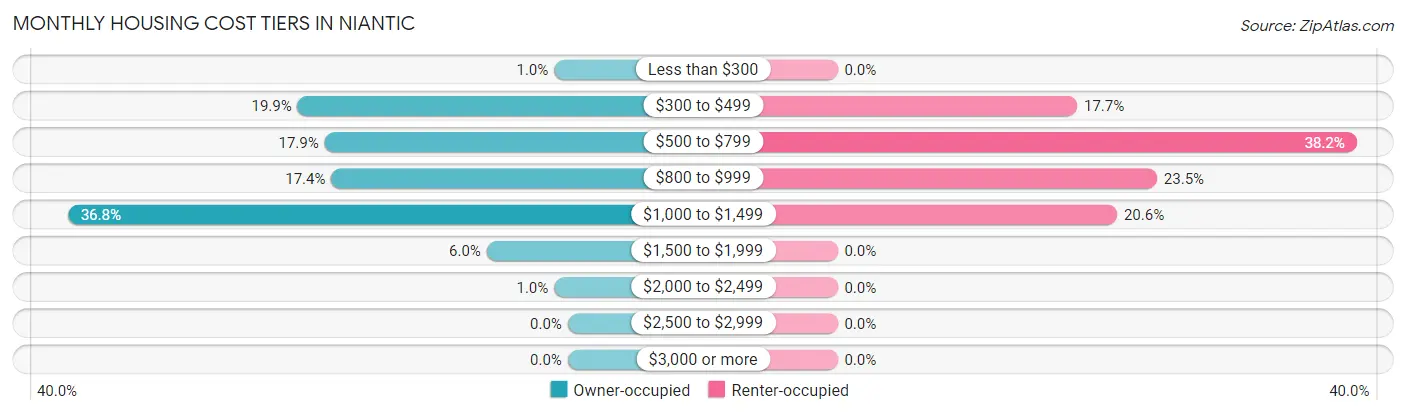
| Monthly Cost | Owner-occupied | Renter-occupied |
| Less than $300 | 2 (1.0%) | 0 (0.0%) |
| $300 to $499 | 40 (19.9%) | 6 (17.6%) |
| $500 to $799 | 36 (17.9%) | 13 (38.2%) |
| $800 to $999 | 35 (17.4%) | 8 (23.5%) |
| $1,000 to $1,499 | 74 (36.8%) | 7 (20.6%) |
| $1,500 to $1,999 | 12 (6.0%) | 0 (0.0%) |
| $2,000 to $2,499 | 2 (1.0%) | 0 (0.0%) |
| $2,500 to $2,999 | 0 (0.0%) | 0 (0.0%) |
| $3,000 or more | 0 (0.0%) | 0 (0.0%) |
| Total | 201 (100.0%) | 34 (100.0%) |
Physical Housing Characteristics in Niantic
Housing Structures in Niantic
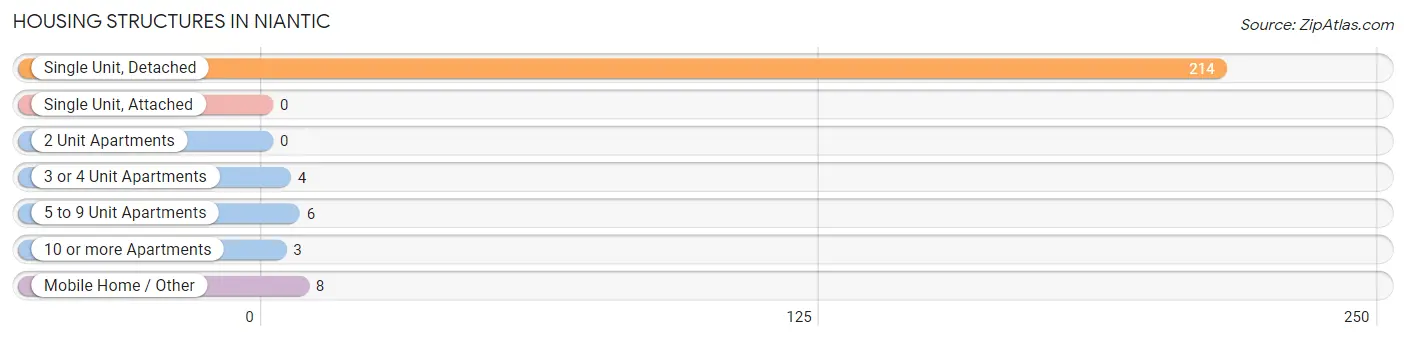
| Structure Type | # Housing Units | % Housing Units |
| Single Unit, Detached | 214 | 91.1% |
| Single Unit, Attached | 0 | 0.0% |
| 2 Unit Apartments | 0 | 0.0% |
| 3 or 4 Unit Apartments | 4 | 1.7% |
| 5 to 9 Unit Apartments | 6 | 2.5% |
| 10 or more Apartments | 3 | 1.3% |
| Mobile Home / Other | 8 | 3.4% |
| Total | 235 | 100.0% |
Housing Structures by Occupancy in Niantic
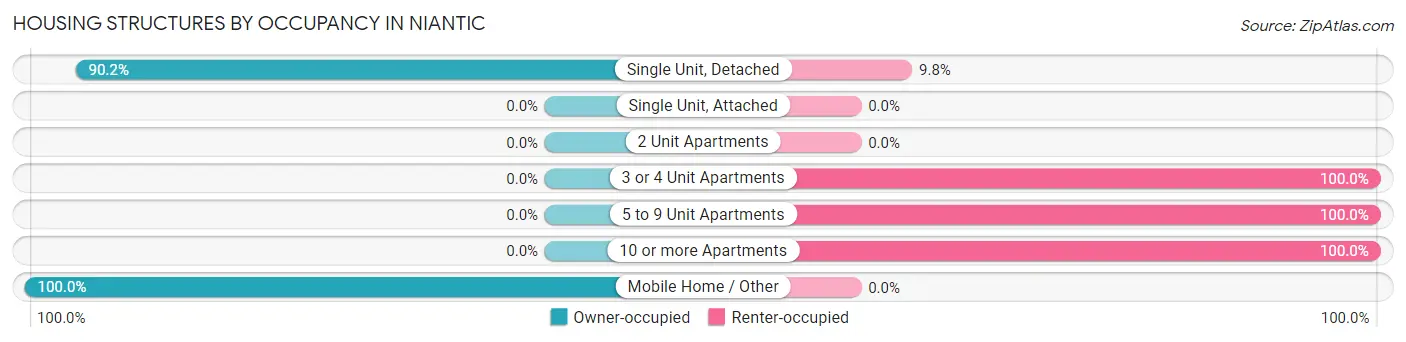
| Structure Type | Owner-occupied | Renter-occupied |
| Single Unit, Detached | 193 (90.2%) | 21 (9.8%) |
| Single Unit, Attached | 0 (0.0%) | 0 (0.0%) |
| 2 Unit Apartments | 0 (0.0%) | 0 (0.0%) |
| 3 or 4 Unit Apartments | 0 (0.0%) | 4 (100.0%) |
| 5 to 9 Unit Apartments | 0 (0.0%) | 6 (100.0%) |
| 10 or more Apartments | 0 (0.0%) | 3 (100.0%) |
| Mobile Home / Other | 8 (100.0%) | 0 (0.0%) |
| Total | 201 (85.5%) | 34 (14.5%) |
Housing Structures by Number of Rooms in Niantic
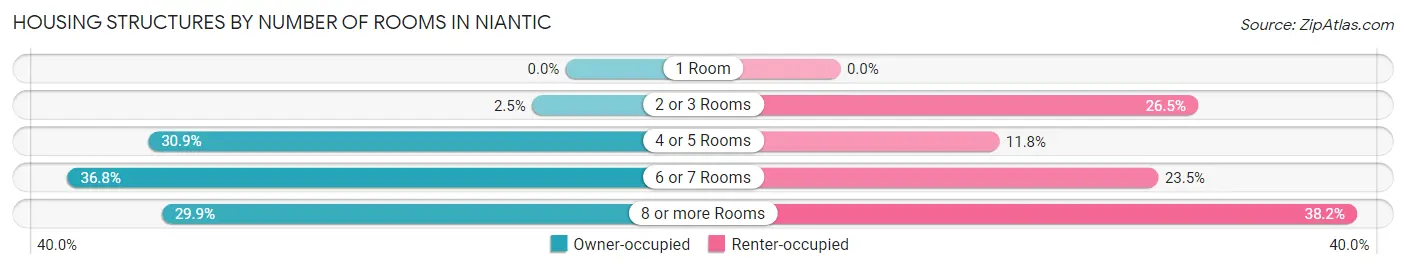
| Number of Rooms | Owner-occupied | Renter-occupied |
| 1 Room | 0 (0.0%) | 0 (0.0%) |
| 2 or 3 Rooms | 5 (2.5%) | 9 (26.5%) |
| 4 or 5 Rooms | 62 (30.8%) | 4 (11.8%) |
| 6 or 7 Rooms | 74 (36.8%) | 8 (23.5%) |
| 8 or more Rooms | 60 (29.8%) | 13 (38.2%) |
| Total | 201 (100.0%) | 34 (100.0%) |
Housing Structure by Heating Type in Niantic
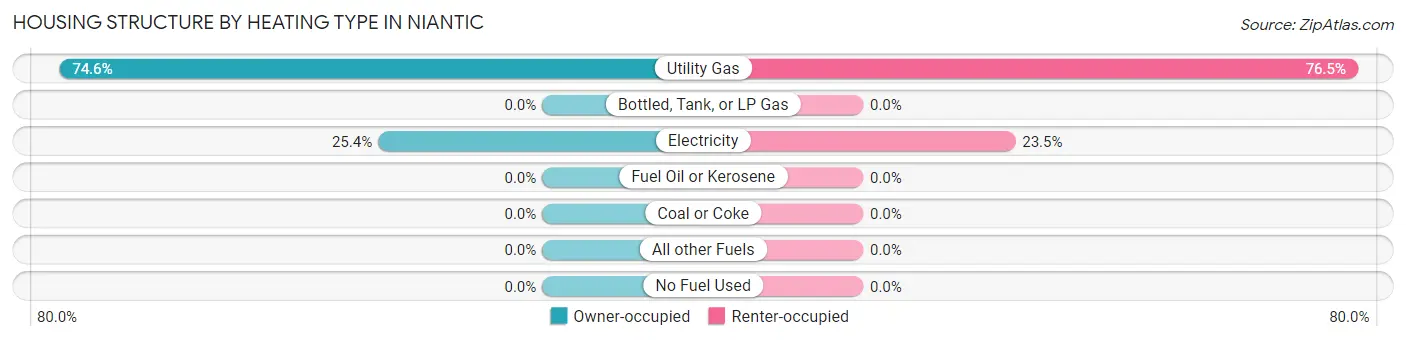
| Heating Type | Owner-occupied | Renter-occupied |
| Utility Gas | 150 (74.6%) | 26 (76.5%) |
| Bottled, Tank, or LP Gas | 0 (0.0%) | 0 (0.0%) |
| Electricity | 51 (25.4%) | 8 (23.5%) |
| Fuel Oil or Kerosene | 0 (0.0%) | 0 (0.0%) |
| Coal or Coke | 0 (0.0%) | 0 (0.0%) |
| All other Fuels | 0 (0.0%) | 0 (0.0%) |
| No Fuel Used | 0 (0.0%) | 0 (0.0%) |
| Total | 201 (100.0%) | 34 (100.0%) |
Household Vehicle Usage in Niantic
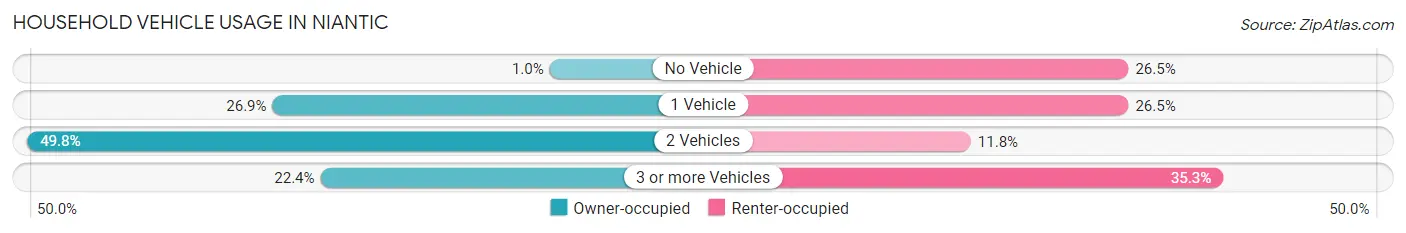
| Vehicles per Household | Owner-occupied | Renter-occupied |
| No Vehicle | 2 (1.0%) | 9 (26.5%) |
| 1 Vehicle | 54 (26.9%) | 9 (26.5%) |
| 2 Vehicles | 100 (49.7%) | 4 (11.8%) |
| 3 or more Vehicles | 45 (22.4%) | 12 (35.3%) |
| Total | 201 (100.0%) | 34 (100.0%) |
Real Estate & Mortgages in Niantic
Real Estate and Mortgage Overview in Niantic
| Characteristic | Without Mortgage | With Mortgage |
| Housing Units | 76 | 125 |
| Median Property Value | $101,900 | $98,900 |
| Median Household Income | $50,833 | $8 |
| Monthly Housing Costs | $487 | $0 |
| Real Estate Taxes | $1,958 | $0 |
Property Value by Mortgage Status in Niantic
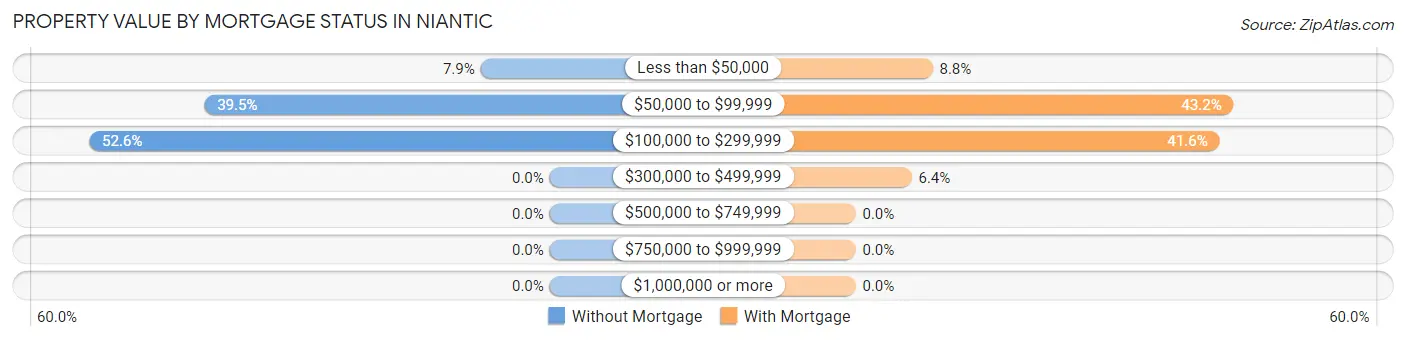
| Property Value | Without Mortgage | With Mortgage |
| Less than $50,000 | 6 (7.9%) | 11 (8.8%) |
| $50,000 to $99,999 | 30 (39.5%) | 54 (43.2%) |
| $100,000 to $299,999 | 40 (52.6%) | 52 (41.6%) |
| $300,000 to $499,999 | 0 (0.0%) | 8 (6.4%) |
| $500,000 to $749,999 | 0 (0.0%) | 0 (0.0%) |
| $750,000 to $999,999 | 0 (0.0%) | 0 (0.0%) |
| $1,000,000 or more | 0 (0.0%) | 0 (0.0%) |
| Total | 76 (100.0%) | 125 (100.0%) |
Household Income by Mortgage Status in Niantic
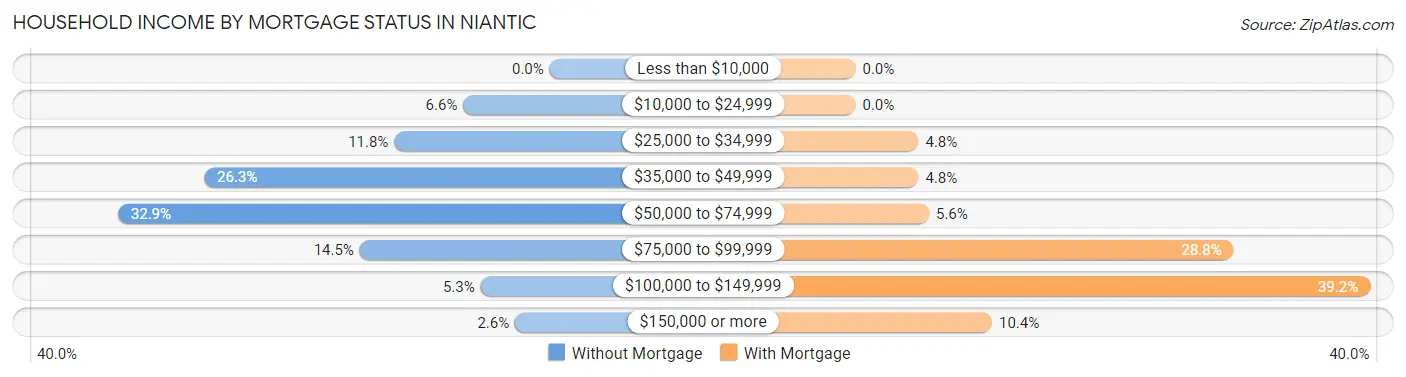
| Household Income | Without Mortgage | With Mortgage |
| Less than $10,000 | 0 (0.0%) | 0 (0.0%) |
| $10,000 to $24,999 | 5 (6.6%) | 0 (0.0%) |
| $25,000 to $34,999 | 9 (11.8%) | 6 (4.8%) |
| $35,000 to $49,999 | 20 (26.3%) | 6 (4.8%) |
| $50,000 to $74,999 | 25 (32.9%) | 7 (5.6%) |
| $75,000 to $99,999 | 11 (14.5%) | 36 (28.8%) |
| $100,000 to $149,999 | 4 (5.3%) | 49 (39.2%) |
| $150,000 or more | 2 (2.6%) | 13 (10.4%) |
| Total | 76 (100.0%) | 125 (100.0%) |
Property Value to Household Income Ratio in Niantic
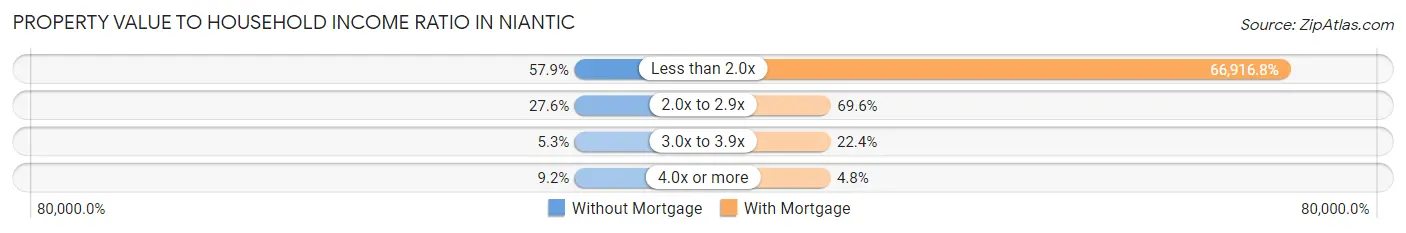
| Value-to-Income Ratio | Without Mortgage | With Mortgage |
| Less than 2.0x | 44 (57.9%) | 83,646 (66,916.8%) |
| 2.0x to 2.9x | 21 (27.6%) | 87 (69.6%) |
| 3.0x to 3.9x | 4 (5.3%) | 28 (22.4%) |
| 4.0x or more | 7 (9.2%) | 6 (4.8%) |
| Total | 76 (100.0%) | 125 (100.0%) |
Real Estate Taxes by Mortgage Status in Niantic
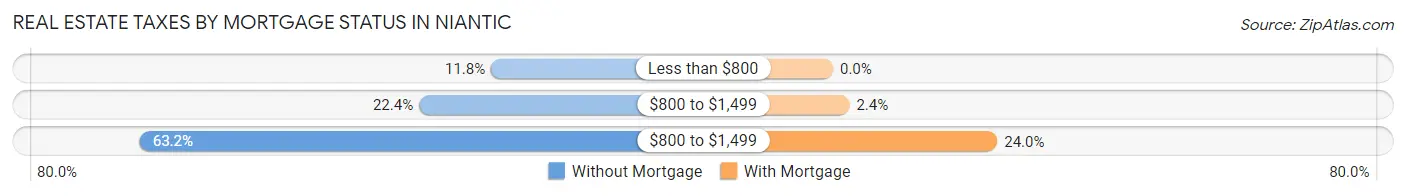
| Property Taxes | Without Mortgage | With Mortgage |
| Less than $800 | 9 (11.8%) | 0 (0.0%) |
| $800 to $1,499 | 17 (22.4%) | 3 (2.4%) |
| $800 to $1,499 | 48 (63.2%) | 30 (24.0%) |
| Total | 76 (100.0%) | 125 (100.0%) |
Health & Disability in Niantic
Health Insurance Coverage by Age in Niantic
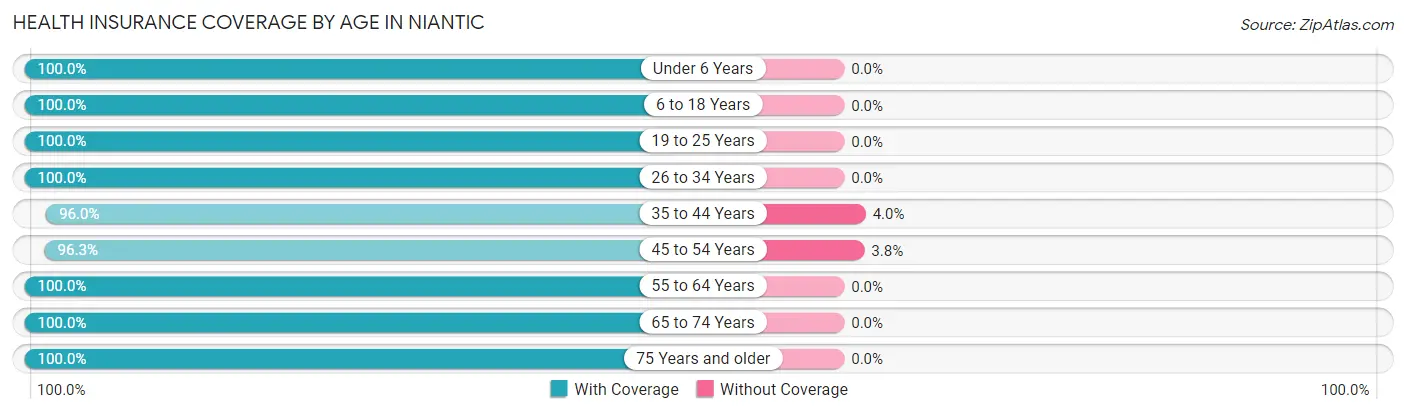
| Age Bracket | With Coverage | Without Coverage |
| Under 6 Years | 149 (100.0%) | 0 (0.0%) |
| 6 to 18 Years | 148 (100.0%) | 0 (0.0%) |
| 19 to 25 Years | 32 (100.0%) | 0 (0.0%) |
| 26 to 34 Years | 77 (100.0%) | 0 (0.0%) |
| 35 to 44 Years | 120 (96.0%) | 5 (4.0%) |
| 45 to 54 Years | 77 (96.3%) | 3 (3.7%) |
| 55 to 64 Years | 34 (100.0%) | 0 (0.0%) |
| 65 to 74 Years | 72 (100.0%) | 0 (0.0%) |
| 75 Years and older | 31 (100.0%) | 0 (0.0%) |
| Total | 740 (98.9%) | 8 (1.1%) |
Health Insurance Coverage by Citizenship Status in Niantic
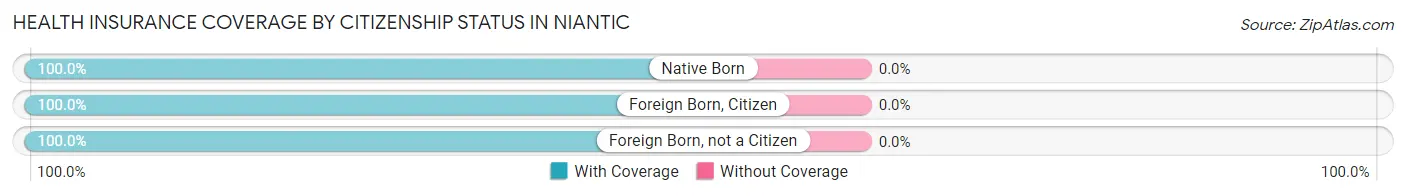
| Citizenship Status | With Coverage | Without Coverage |
| Native Born | 149 (100.0%) | 0 (0.0%) |
| Foreign Born, Citizen | 148 (100.0%) | 0 (0.0%) |
| Foreign Born, not a Citizen | 32 (100.0%) | 0 (0.0%) |
Health Insurance Coverage by Household Income in Niantic
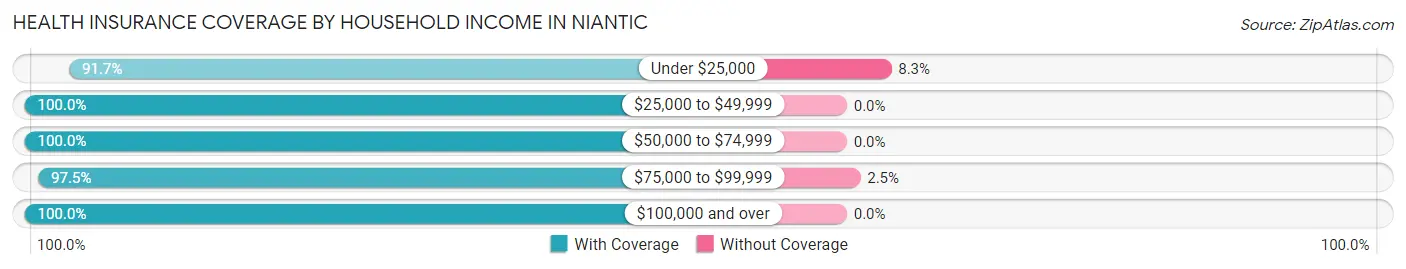
| Household Income | With Coverage | Without Coverage |
| Under $25,000 | 33 (91.7%) | 3 (8.3%) |
| $25,000 to $49,999 | 63 (100.0%) | 0 (0.0%) |
| $50,000 to $74,999 | 321 (100.0%) | 0 (0.0%) |
| $75,000 to $99,999 | 193 (97.5%) | 5 (2.5%) |
| $100,000 and over | 130 (100.0%) | 0 (0.0%) |
Public vs Private Health Insurance Coverage by Age in Niantic
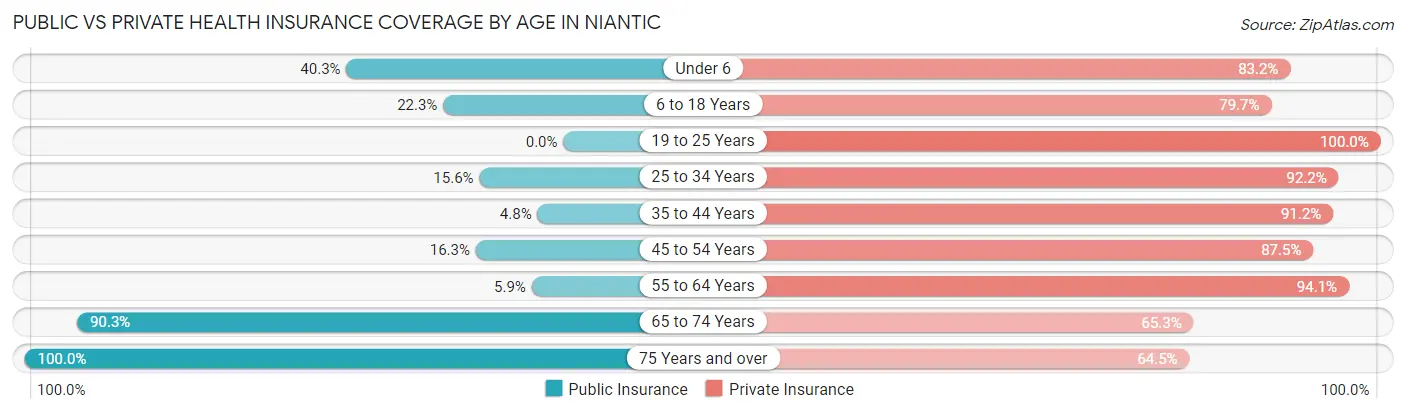
| Age Bracket | Public Insurance | Private Insurance |
| Under 6 | 60 (40.3%) | 124 (83.2%) |
| 6 to 18 Years | 33 (22.3%) | 118 (79.7%) |
| 19 to 25 Years | 0 (0.0%) | 32 (100.0%) |
| 25 to 34 Years | 12 (15.6%) | 71 (92.2%) |
| 35 to 44 Years | 6 (4.8%) | 114 (91.2%) |
| 45 to 54 Years | 13 (16.3%) | 70 (87.5%) |
| 55 to 64 Years | 2 (5.9%) | 32 (94.1%) |
| 65 to 74 Years | 65 (90.3%) | 47 (65.3%) |
| 75 Years and over | 31 (100.0%) | 20 (64.5%) |
| Total | 222 (29.7%) | 628 (84.0%) |
Disability Status by Sex by Age in Niantic
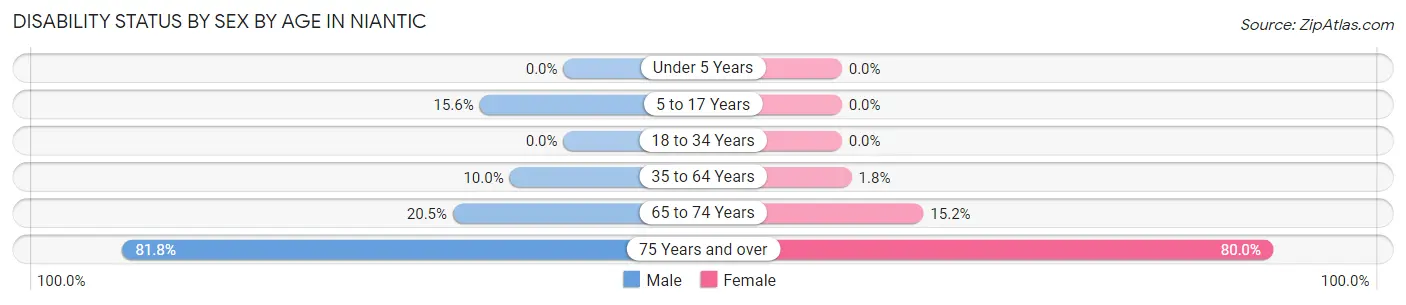
| Age Bracket | Male | Female |
| Under 5 Years | 0 (0.0%) | 0 (0.0%) |
| 5 to 17 Years | 14 (15.6%) | 0 (0.0%) |
| 18 to 34 Years | 0 (0.0%) | 0 (0.0%) |
| 35 to 64 Years | 13 (10.0%) | 2 (1.8%) |
| 65 to 74 Years | 8 (20.5%) | 5 (15.1%) |
| 75 Years and over | 9 (81.8%) | 16 (80.0%) |
Disability Class by Sex by Age in Niantic
Disability Class: Hearing Difficulty
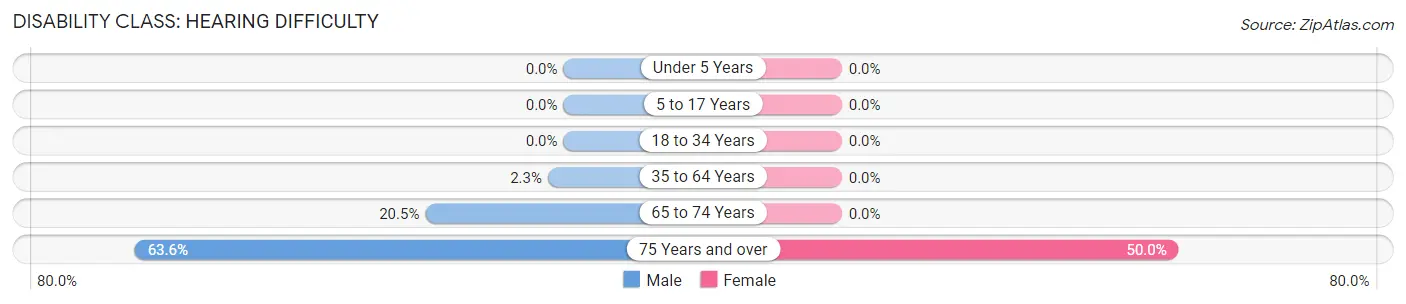
| Age Bracket | Male | Female |
| Under 5 Years | 0 (0.0%) | 0 (0.0%) |
| 5 to 17 Years | 0 (0.0%) | 0 (0.0%) |
| 18 to 34 Years | 0 (0.0%) | 0 (0.0%) |
| 35 to 64 Years | 3 (2.3%) | 0 (0.0%) |
| 65 to 74 Years | 8 (20.5%) | 0 (0.0%) |
| 75 Years and over | 7 (63.6%) | 10 (50.0%) |
Disability Class: Vision Difficulty
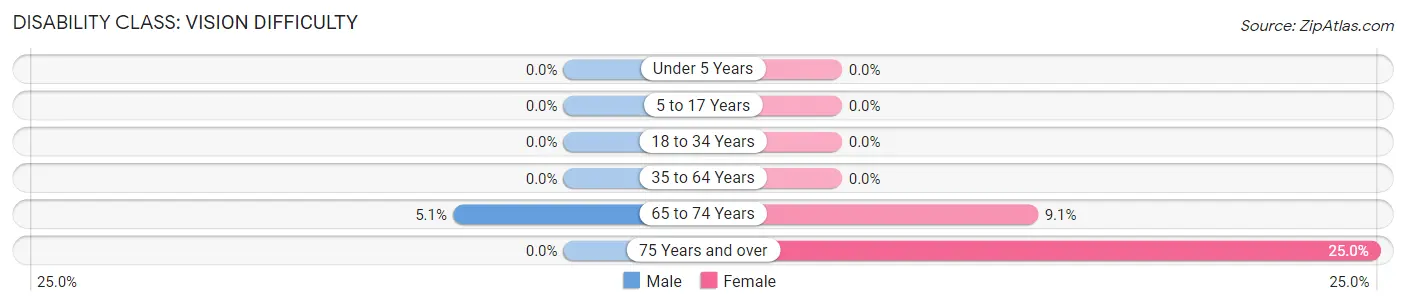
| Age Bracket | Male | Female |
| Under 5 Years | 0 (0.0%) | 0 (0.0%) |
| 5 to 17 Years | 0 (0.0%) | 0 (0.0%) |
| 18 to 34 Years | 0 (0.0%) | 0 (0.0%) |
| 35 to 64 Years | 0 (0.0%) | 0 (0.0%) |
| 65 to 74 Years | 2 (5.1%) | 3 (9.1%) |
| 75 Years and over | 0 (0.0%) | 5 (25.0%) |
Disability Class: Cognitive Difficulty
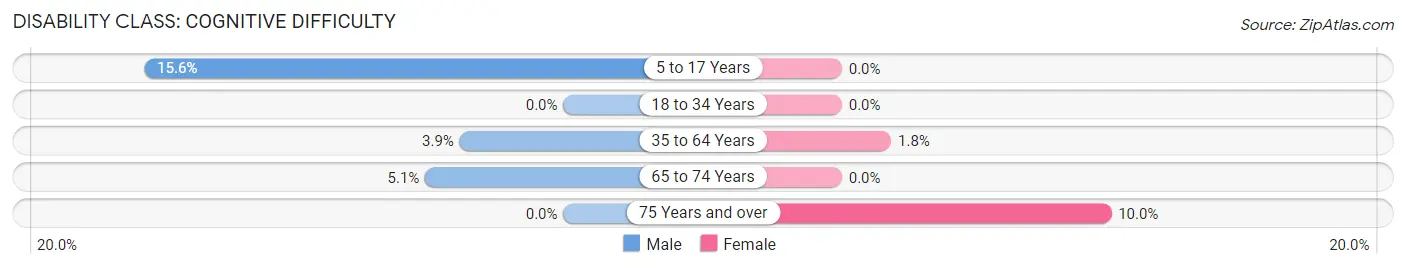
| Age Bracket | Male | Female |
| 5 to 17 Years | 14 (15.6%) | 0 (0.0%) |
| 18 to 34 Years | 0 (0.0%) | 0 (0.0%) |
| 35 to 64 Years | 5 (3.8%) | 2 (1.8%) |
| 65 to 74 Years | 2 (5.1%) | 0 (0.0%) |
| 75 Years and over | 0 (0.0%) | 2 (10.0%) |
Disability Class: Ambulatory Difficulty
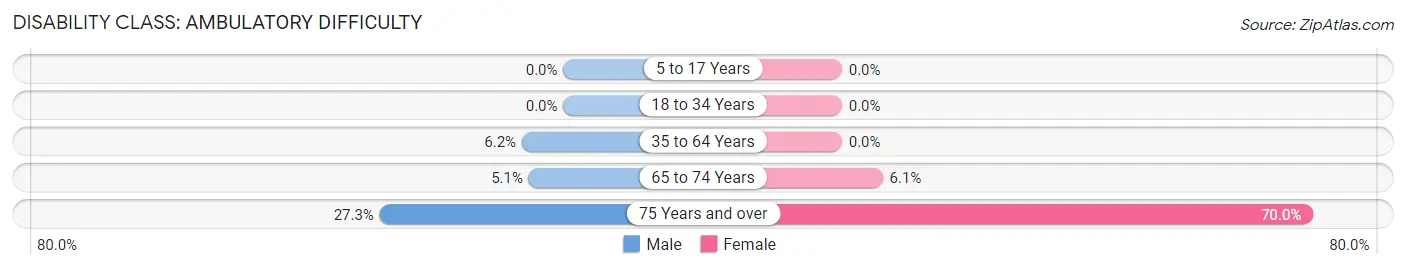
| Age Bracket | Male | Female |
| 5 to 17 Years | 0 (0.0%) | 0 (0.0%) |
| 18 to 34 Years | 0 (0.0%) | 0 (0.0%) |
| 35 to 64 Years | 8 (6.1%) | 0 (0.0%) |
| 65 to 74 Years | 2 (5.1%) | 2 (6.1%) |
| 75 Years and over | 3 (27.3%) | 14 (70.0%) |
Disability Class: Self-Care Difficulty
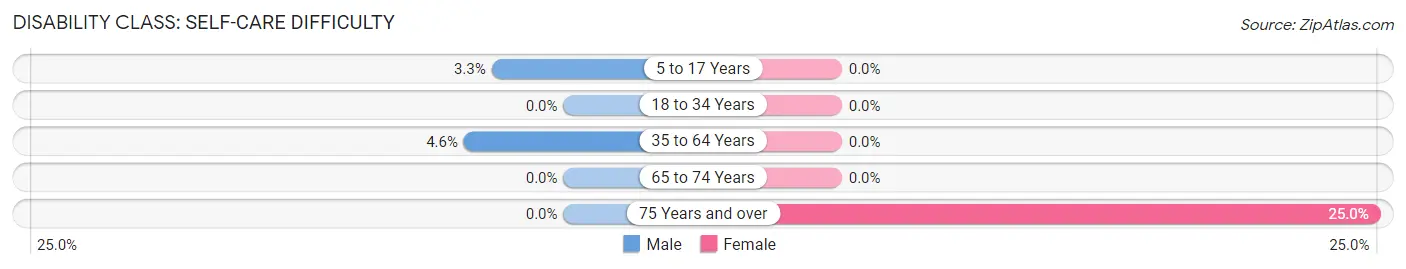
| Age Bracket | Male | Female |
| 5 to 17 Years | 3 (3.3%) | 0 (0.0%) |
| 18 to 34 Years | 0 (0.0%) | 0 (0.0%) |
| 35 to 64 Years | 6 (4.6%) | 0 (0.0%) |
| 65 to 74 Years | 0 (0.0%) | 0 (0.0%) |
| 75 Years and over | 0 (0.0%) | 5 (25.0%) |
Technology Access in Niantic
Computing Device Access in Niantic
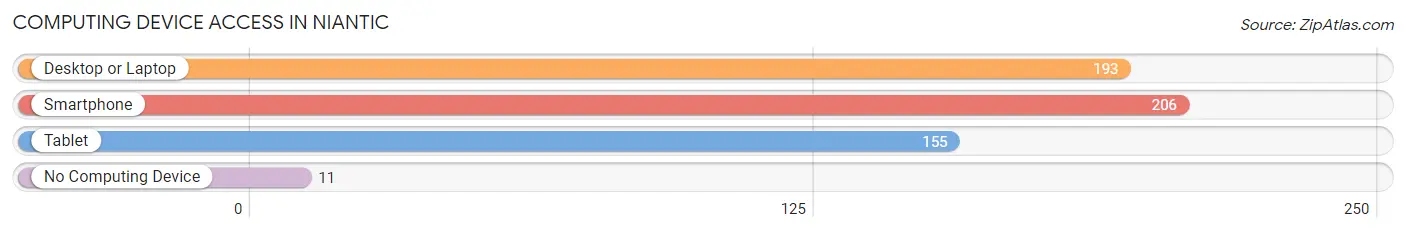
| Device Type | # Households | % Households |
| Desktop or Laptop | 193 | 82.1% |
| Smartphone | 206 | 87.7% |
| Tablet | 155 | 66.0% |
| No Computing Device | 11 | 4.7% |
| Total | 235 | 100.0% |
Internet Access in Niantic
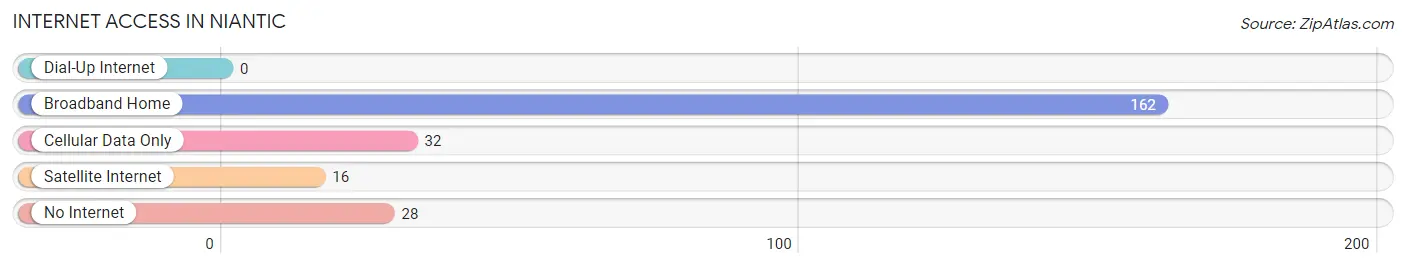
| Internet Type | # Households | % Households |
| Dial-Up Internet | 0 | 0.0% |
| Broadband Home | 162 | 68.9% |
| Cellular Data Only | 32 | 13.6% |
| Satellite Internet | 16 | 6.8% |
| No Internet | 28 | 11.9% |
| Total | 235 | 100.0% |
Niantic Summary
Niantic is a small village located in the northeastern corner of Illinois, in the county of Macon. It is situated on the banks of the Sangamon River, and is surrounded by rolling hills and farmland. The village has a population of just over 500 people, and is home to a variety of businesses, including a grocery store, a hardware store, a post office, and a few restaurants.
Niantic was first settled in 1835 by a group of settlers from Kentucky. The village was named after the Niantic Indians, who had lived in the area prior to the settlers’ arrival. The settlers built a log cabin and a small church, and the village grew slowly over the years. In 1854, the village was officially incorporated, and the first mayor was elected.
Geographically, Niantic is located in the northern part of Macon County, and is bordered by the Sangamon River to the east and the Sangamon River State Park to the west. The village is situated on a flat plain, and is surrounded by rolling hills and farmland. The climate in Niantic is generally mild, with temperatures ranging from the low 30s in the winter to the mid-80s in the summer.
The economy of Niantic is largely based on agriculture. The village is home to several farms, which produce a variety of crops, including corn, soybeans, and wheat. In addition, the village is home to a number of small businesses, including a grocery store, a hardware store, a post office, and a few restaurants.
The demographics of Niantic are largely homogeneous. The village is predominantly white, with a small minority population. The median household income in Niantic is $45,000, and the median age is 44. The village is home to a variety of religious denominations, including Baptist, Methodist, and Catholic.
Niantic is a small, rural village with a rich history and a strong sense of community. The village is home to a variety of businesses, and the economy is largely based on agriculture. The village is predominantly white, with a small minority population, and the median household income is $45,000. The village is home to a variety of religious denominations, and the climate is generally mild.
Common Questions
What is Per Capita Income in Niantic?
Per Capita income in Niantic is $24,320.
What is the Median Family Income in Niantic?
Median Family Income in Niantic is $65,962.
What is the Median Household income in Niantic?
Median Household Income in Niantic is $61,307.
What is Income or Wage Gap in Niantic?
Income or Wage Gap in Niantic is 56.2%.
Women in Niantic earn 43.8 cents for every dollar earned by a man.
What is Inequality or Gini Index in Niantic?
Inequality or Gini Index in Niantic is 0.34.
What is the Total Population of Niantic?
Total Population of Niantic is 748.
What is the Total Male Population of Niantic?
Total Male Population of Niantic is 409.
What is the Total Female Population of Niantic?
Total Female Population of Niantic is 339.
What is the Ratio of Males per 100 Females in Niantic?
There are 120.65 Males per 100 Females in Niantic.
What is the Ratio of Females per 100 Males in Niantic?
There are 82.89 Females per 100 Males in Niantic.
What is the Median Population Age in Niantic?
Median Population Age in Niantic is 32.4 Years.
What is the Average Family Size in Niantic
Average Family Size in Niantic is 4.2 People.
What is the Average Household Size in Niantic
Average Household Size in Niantic is 3.2 People.
How Large is the Labor Force in Niantic?
There are 333 People in the Labor Forcein in Niantic.
What is the Percentage of People in the Labor Force in Niantic?
68.7% of People are in the Labor Force in Niantic.
What is the Unemployment Rate in Niantic?
Unemployment Rate in Niantic is 12.0%.