Muncie, IL Map & Demographics
Muncie Map
Muncie Overview
$34,716
PER CAPITA INCOME
$81,875
AVG FAMILY INCOME
$76,500
AVG HOUSEHOLD INCOME
0.31
INEQUALITY / GINI INDEX
146
TOTAL POPULATION
75
MALE POPULATION
71
FEMALE POPULATION
105.63
MALES / 100 FEMALES
94.67
FEMALES / 100 MALES
54.3
MEDIAN AGE
3.0
AVG FAMILY SIZE
2.1
AVG HOUSEHOLD SIZE
83
LABOR FORCE [ PEOPLE ]
62.4%
PERCENT IN LABOR FORCE
7.2%
UNEMPLOYMENT RATE
Muncie Zip Codes
Muncie Area Codes
Income in Muncie
Income Overview in Muncie
Per Capita Income in Muncie is $34,716, while median incomes of families and households are $81,875 and $76,500 respectively.
| Characteristic | Number | Measure |
| Per Capita Income | 146 | $34,716 |
| Median Family Income | 35 | $81,875 |
| Mean Family Income | 35 | $86,646 |
| Median Household Income | 68 | $76,500 |
| Mean Household Income | 68 | $72,138 |
| Income Deficit | 35 | $0 |
| Wage / Income Gap (%) | 146 | 0.00% |
| Wage / Income Gap ($) | 146 | 100.00¢ per $1 |
| Gini / Inequality Index | 146 | 0.31 |
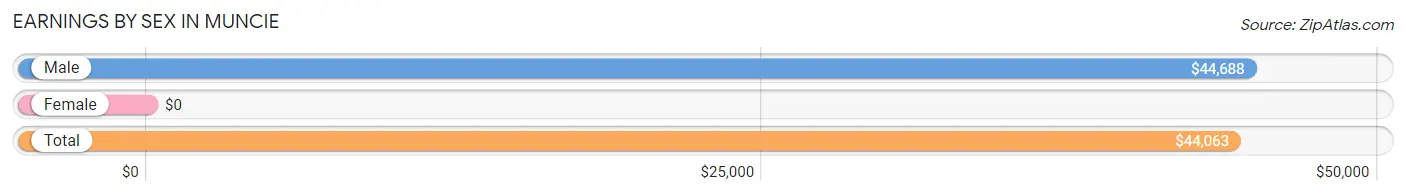
Earnings by Sex in Muncie
| Sex | Number | Average Earnings |
| Male | 41 (49.4%) | $44,688 |
| Female | 42 (50.6%) | $0 |
| Total | 83 (100.0%) | $44,063 |
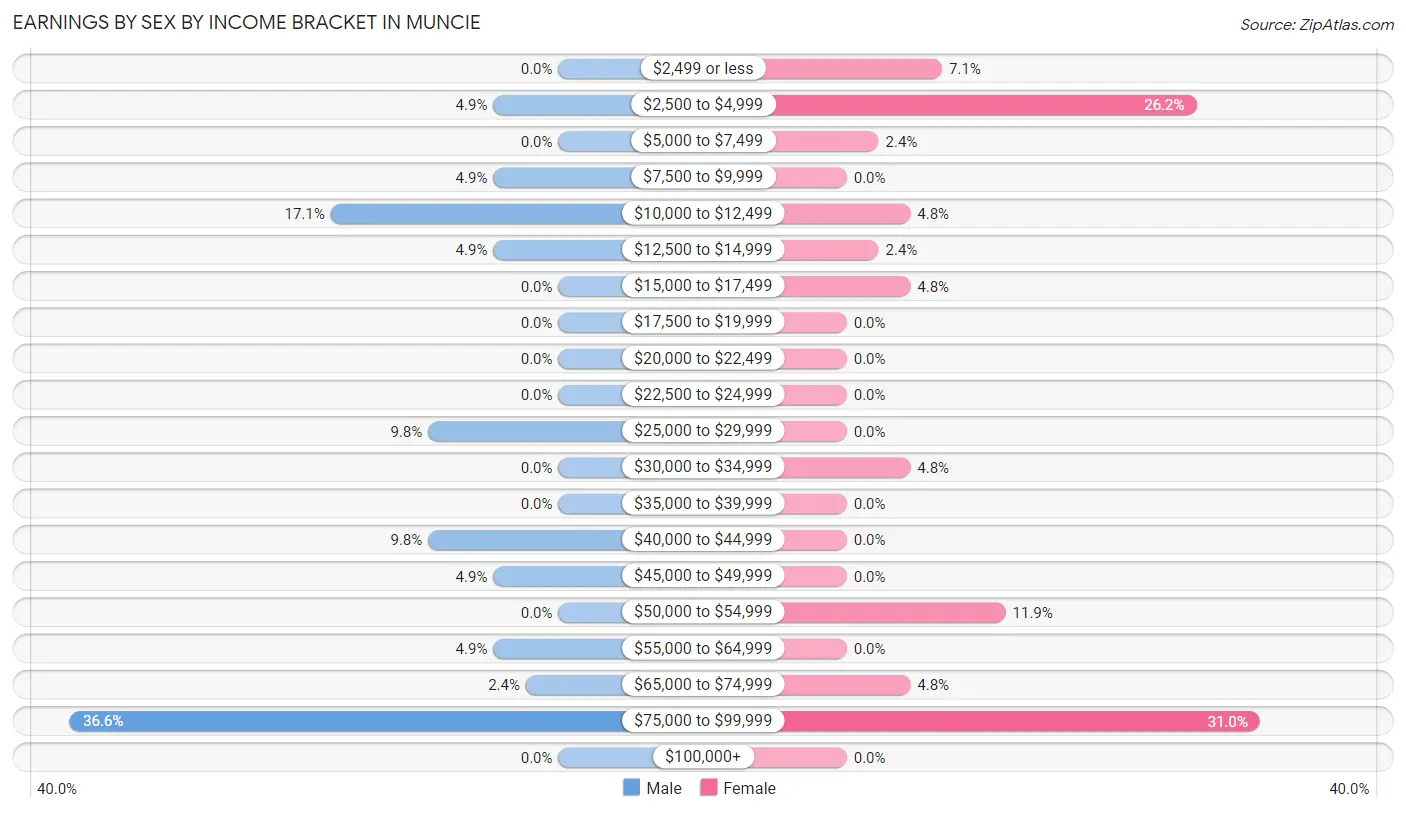
Earnings by Sex by Income Bracket in Muncie
The most common earnings brackets in Muncie are $75,000 to $99,999 for men (15 | 36.6%) and $75,000 to $99,999 for women (13 | 30.9%).
| Income | Male | Female |
| $2,499 or less | 0 (0.0%) | 3 (7.1%) |
| $2,500 to $4,999 | 2 (4.9%) | 11 (26.2%) |
| $5,000 to $7,499 | 0 (0.0%) | 1 (2.4%) |
| $7,500 to $9,999 | 2 (4.9%) | 0 (0.0%) |
| $10,000 to $12,499 | 7 (17.1%) | 2 (4.8%) |
| $12,500 to $14,999 | 2 (4.9%) | 1 (2.4%) |
| $15,000 to $17,499 | 0 (0.0%) | 2 (4.8%) |
| $17,500 to $19,999 | 0 (0.0%) | 0 (0.0%) |
| $20,000 to $22,499 | 0 (0.0%) | 0 (0.0%) |
| $22,500 to $24,999 | 0 (0.0%) | 0 (0.0%) |
| $25,000 to $29,999 | 4 (9.8%) | 0 (0.0%) |
| $30,000 to $34,999 | 0 (0.0%) | 2 (4.8%) |
| $35,000 to $39,999 | 0 (0.0%) | 0 (0.0%) |
| $40,000 to $44,999 | 4 (9.8%) | 0 (0.0%) |
| $45,000 to $49,999 | 2 (4.9%) | 0 (0.0%) |
| $50,000 to $54,999 | 0 (0.0%) | 5 (11.9%) |
| $55,000 to $64,999 | 2 (4.9%) | 0 (0.0%) |
| $65,000 to $74,999 | 1 (2.4%) | 2 (4.8%) |
| $75,000 to $99,999 | 15 (36.6%) | 13 (30.9%) |
| $100,000+ | 0 (0.0%) | 0 (0.0%) |
| Total | 41 (100.0%) | 42 (100.0%) |
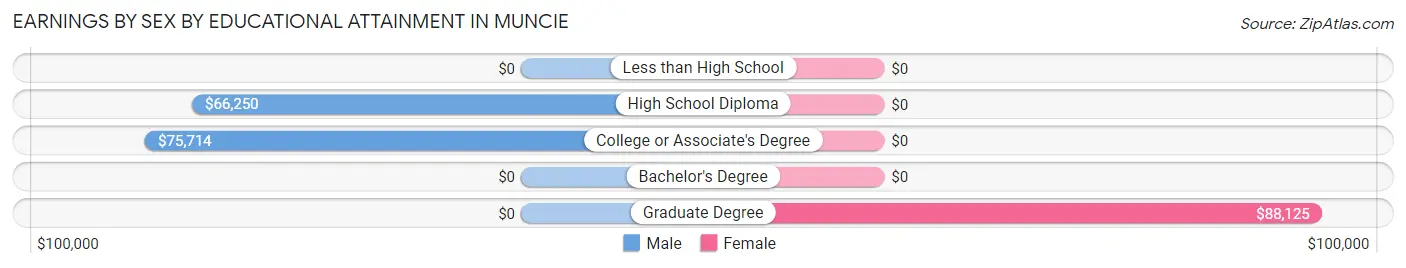
Earnings by Sex by Educational Attainment in Muncie
| Educational Attainment | Male Income | Female Income |
| Less than High School | - | - |
| High School Diploma | $66,250 | $0 |
| College or Associate's Degree | $75,714 | $0 |
| Bachelor's Degree | - | - |
| Graduate Degree | - | - |
| Total | $65,000 | $0 |
Family Income in Muncie
Family Income Brackets in Muncie
According to the Muncie family income data, there are 15 families falling into the $75,000 to $99,999 income range, which is the most common income bracket and makes up 42.9% of all families.
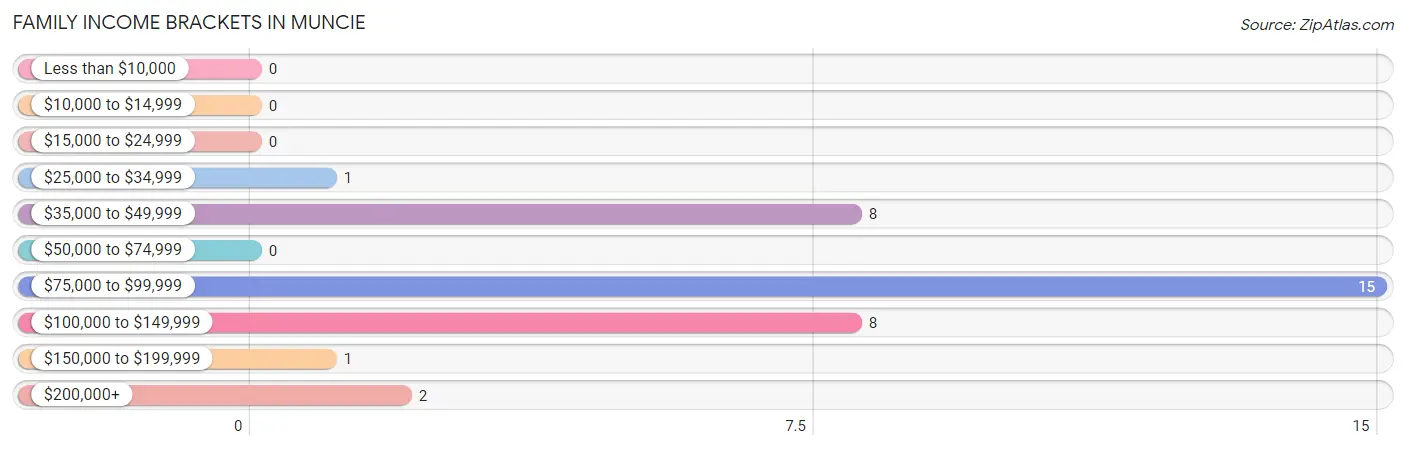
| Income Bracket | # Families | % Families |
| Less than $10,000 | 0 | 0.0% |
| $10,000 to $14,999 | 0 | 0.0% |
| $15,000 to $24,999 | 0 | 0.0% |
| $25,000 to $34,999 | 1 | 2.9% |
| $35,000 to $49,999 | 8 | 22.9% |
| $50,000 to $74,999 | 0 | 0.0% |
| $75,000 to $99,999 | 15 | 42.9% |
| $100,000 to $149,999 | 8 | 22.9% |
| $150,000 to $199,999 | 1 | 2.9% |
| $200,000+ | 2 | 5.7% |
Family Income by Famaliy Size in Muncie
2-person families (22 | 62.9%) account for the highest median family income in Muncie with $84,500 per family, while 2-person families (22 | 62.9%) have the highest median income of $42,250 per family member.
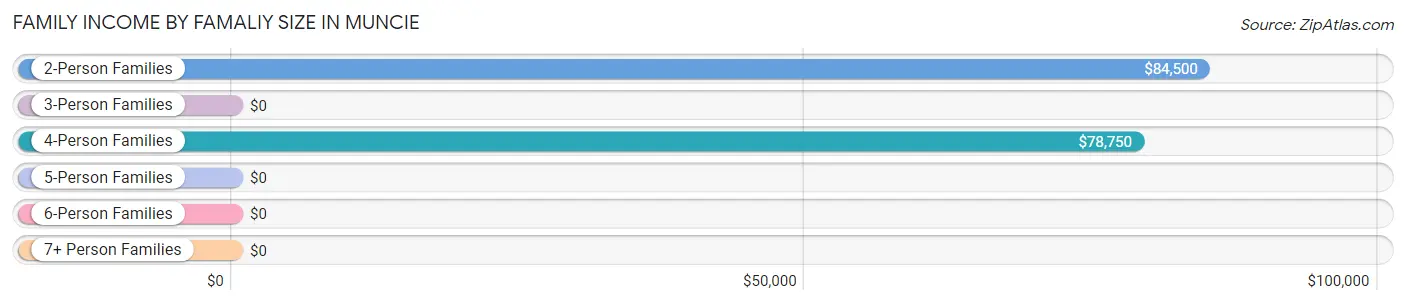
| Income Bracket | # Families | Median Income |
| 2-Person Families | 22 (62.9%) | $84,500 |
| 3-Person Families | 6 (17.1%) | $0 |
| 4-Person Families | 3 (8.6%) | $78,750 |
| 5-Person Families | 2 (5.7%) | $0 |
| 6-Person Families | 2 (5.7%) | $0 |
| 7+ Person Families | 0 (0.0%) | $0 |
| Total | 35 (100.0%) | $81,875 |
Family Income by Number of Earners in Muncie
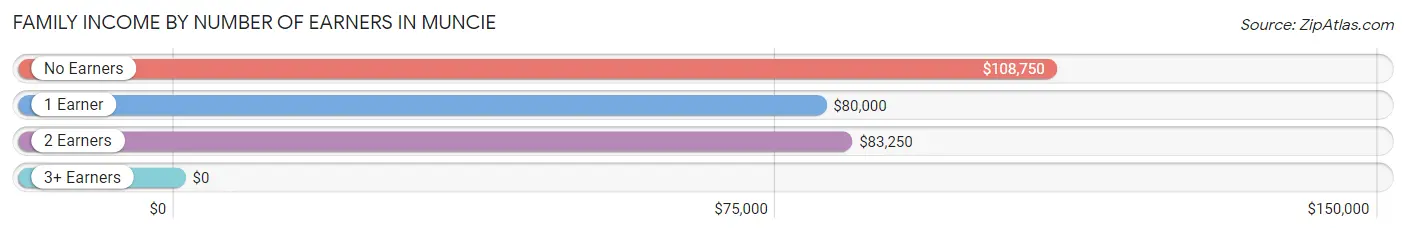
| Number of Earners | # Families | Median Income |
| No Earners | 6 (17.1%) | $108,750 |
| 1 Earner | 12 (34.3%) | $80,000 |
| 2 Earners | 15 (42.9%) | $83,250 |
| 3+ Earners | 2 (5.7%) | $0 |
| Total | 35 (100.0%) | $81,875 |
Household Income in Muncie
Household Income Brackets in Muncie
With 18 households falling in the category, the $100,000 to $149,999 income range is the most frequent in Muncie, accounting for 26.5% of all households.
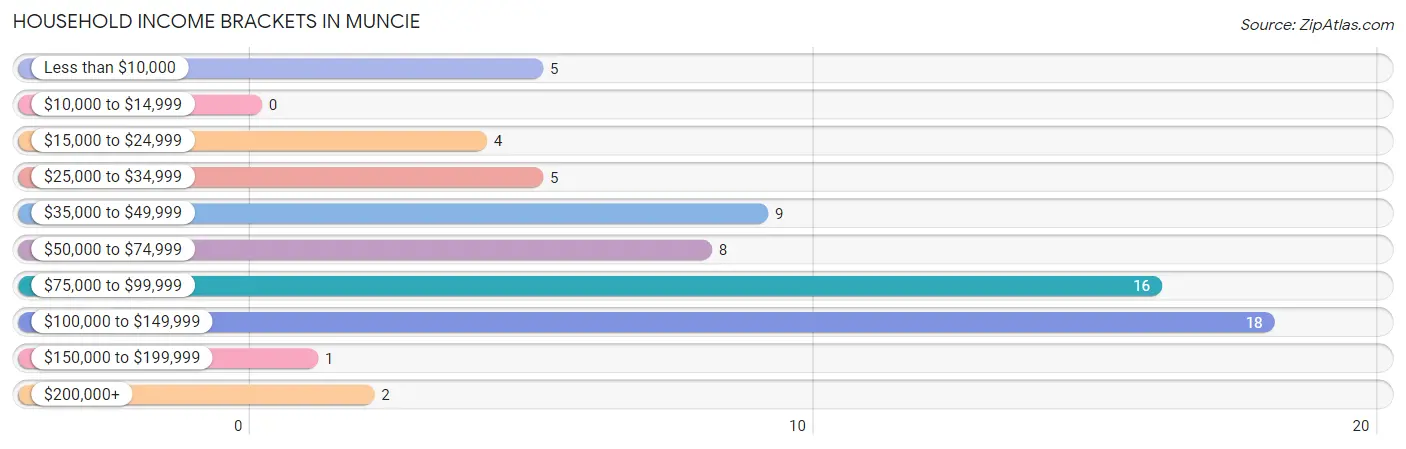
| Income Bracket | # Households | % Households |
| Less than $10,000 | 5 | 7.4% |
| $10,000 to $14,999 | 0 | 0.0% |
| $15,000 to $24,999 | 4 | 5.9% |
| $25,000 to $34,999 | 5 | 7.4% |
| $35,000 to $49,999 | 9 | 13.2% |
| $50,000 to $74,999 | 8 | 11.8% |
| $75,000 to $99,999 | 16 | 23.5% |
| $100,000 to $149,999 | 18 | 26.5% |
| $150,000 to $199,999 | 1 | 1.5% |
| $200,000+ | 2 | 2.9% |
Household Income by Householder Age in Muncie
The median household income in Muncie is $76,500, with the highest median household income of $78,333 found in the 25 to 44 years age bracket for the primary householder. A total of 16 households (23.5%) fall into this category.
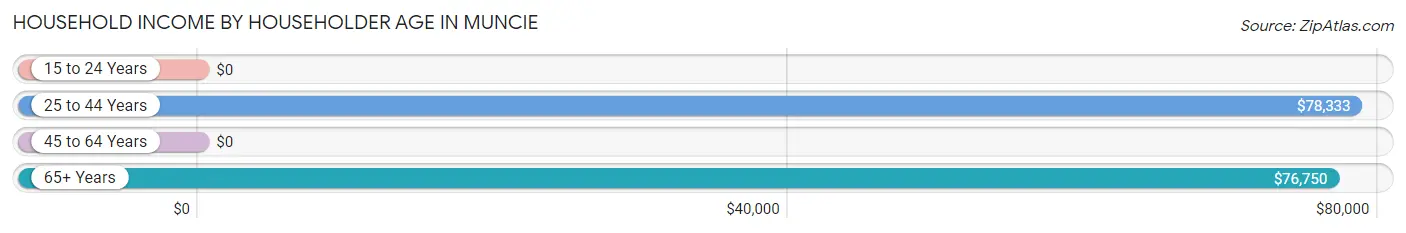
| Income Bracket | # Households | Median Income |
| 15 to 24 Years | 0 (0.0%) | $0 |
| 25 to 44 Years | 16 (23.5%) | $78,333 |
| 45 to 64 Years | 19 (27.9%) | $0 |
| 65+ Years | 33 (48.5%) | $76,750 |
| Total | 68 (100.0%) | $76,500 |
Poverty in Muncie
Income Below Poverty by Sex and Age in Muncie
With 12.3% poverty level for males and 4.2% for females among the residents of Muncie, 55 to 64 year old males and 25 to 34 year old females are the most vulnerable to poverty, with 5 males (35.7%) and 3 females (33.3%) in their respective age groups living below the poverty level.
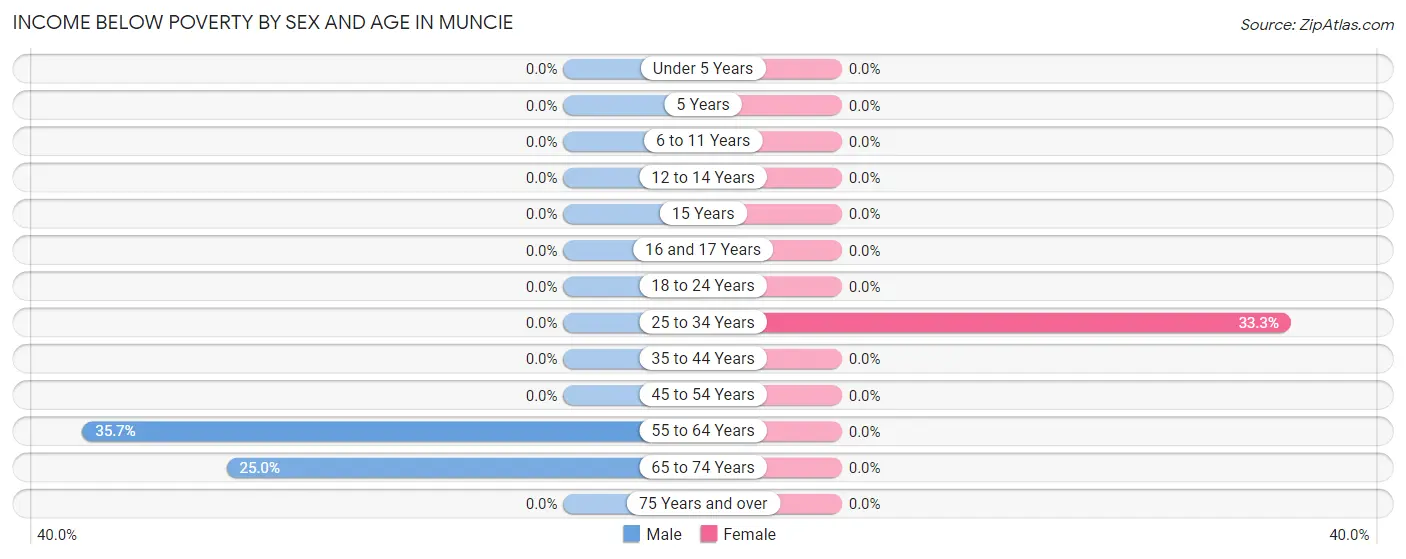
| Age Bracket | Male | Female |
| Under 5 Years | 0 (0.0%) | 0 (0.0%) |
| 5 Years | 0 (0.0%) | 0 (0.0%) |
| 6 to 11 Years | 0 (0.0%) | 0 (0.0%) |
| 12 to 14 Years | 0 (0.0%) | 0 (0.0%) |
| 15 Years | 0 (0.0%) | 0 (0.0%) |
| 16 and 17 Years | 0 (0.0%) | 0 (0.0%) |
| 18 to 24 Years | 0 (0.0%) | 0 (0.0%) |
| 25 to 34 Years | 0 (0.0%) | 3 (33.3%) |
| 35 to 44 Years | 0 (0.0%) | 0 (0.0%) |
| 45 to 54 Years | 0 (0.0%) | 0 (0.0%) |
| 55 to 64 Years | 5 (35.7%) | 0 (0.0%) |
| 65 to 74 Years | 4 (25.0%) | 0 (0.0%) |
| 75 Years and over | 0 (0.0%) | 0 (0.0%) |
| Total | 9 (12.3%) | 3 (4.2%) |
Income Above Poverty by Sex and Age in Muncie
According to the poverty statistics in Muncie, males aged under 5 years and females aged 5 years are the age groups that are most secure financially, with 100.0% of males and 100.0% of females in these age groups living above the poverty line.
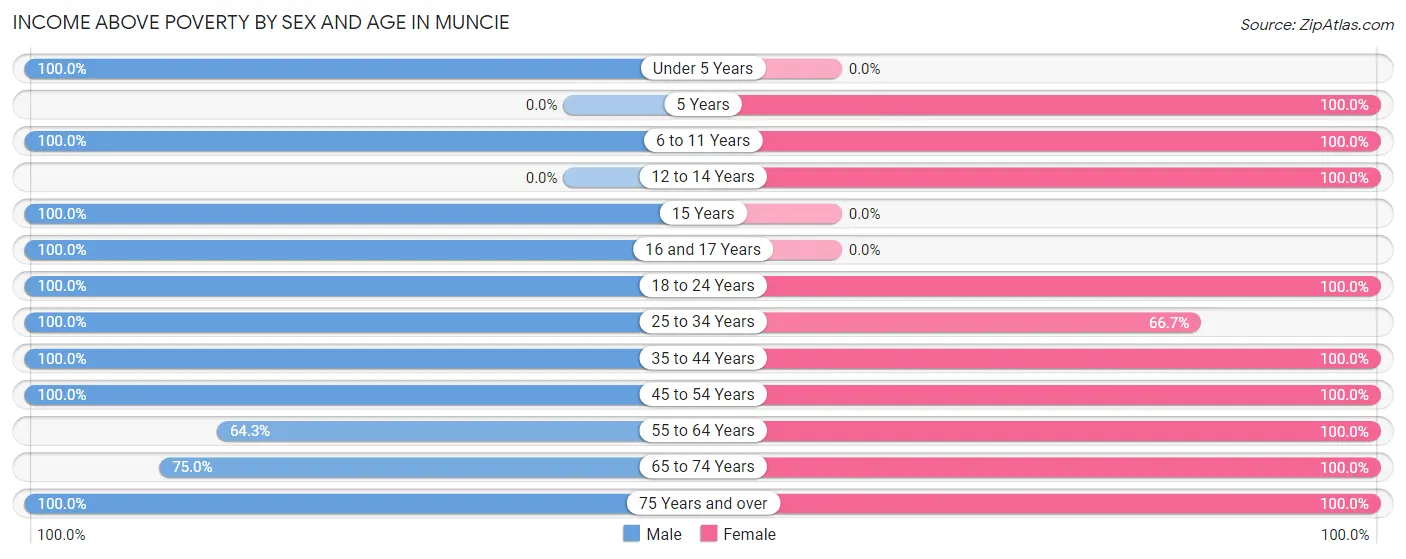
| Age Bracket | Male | Female |
| Under 5 Years | 1 (100.0%) | 0 (0.0%) |
| 5 Years | 0 (0.0%) | 1 (100.0%) |
| 6 to 11 Years | 2 (100.0%) | 3 (100.0%) |
| 12 to 14 Years | 0 (0.0%) | 3 (100.0%) |
| 15 Years | 1 (100.0%) | 0 (0.0%) |
| 16 and 17 Years | 4 (100.0%) | 0 (0.0%) |
| 18 to 24 Years | 9 (100.0%) | 7 (100.0%) |
| 25 to 34 Years | 9 (100.0%) | 6 (66.7%) |
| 35 to 44 Years | 7 (100.0%) | 2 (100.0%) |
| 45 to 54 Years | 6 (100.0%) | 10 (100.0%) |
| 55 to 64 Years | 9 (64.3%) | 12 (100.0%) |
| 65 to 74 Years | 12 (75.0%) | 22 (100.0%) |
| 75 Years and over | 4 (100.0%) | 2 (100.0%) |
| Total | 64 (87.7%) | 68 (95.8%) |
Income Below Poverty Among Married-Couple Families in Muncie
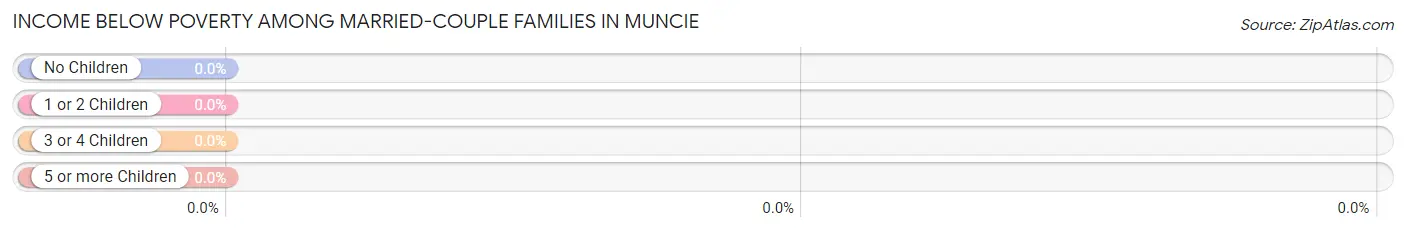
| Children | Above Poverty | Below Poverty |
| No Children | 27 (100.0%) | 0 (0.0%) |
| 1 or 2 Children | 5 (100.0%) | 0 (0.0%) |
| 3 or 4 Children | 1 (100.0%) | 0 (0.0%) |
| 5 or more Children | 0 (0.0%) | 0 (0.0%) |
| Total | 33 (100.0%) | 0 (0.0%) |
Income Below Poverty Among Single-Parent Households in Muncie
| Children | Single Father | Single Mother |
| No Children | 0 (0.0%) | 0 (0.0%) |
| 1 or 2 Children | 0 (0.0%) | 0 (0.0%) |
| 3 or 4 Children | 0 (0.0%) | 0 (0.0%) |
| 5 or more Children | 0 (0.0%) | 0 (0.0%) |
| Total | 0 (0.0%) | 0 (0.0%) |
Income Below Poverty Among Married-Couple vs Single-Parent Households in Muncie
| Children | Married-Couple Families | Single-Parent Households |
| No Children | 0 (0.0%) | 0 (0.0%) |
| 1 or 2 Children | 0 (0.0%) | 0 (0.0%) |
| 3 or 4 Children | 0 (0.0%) | 0 (0.0%) |
| 5 or more Children | 0 (0.0%) | 0 (0.0%) |
| Total | 0 (0.0%) | 0 (0.0%) |
Race in Muncie
The most populous races in Muncie are White / Caucasian (142 | 97.3%), and Two or more Races (4 | 2.7%).
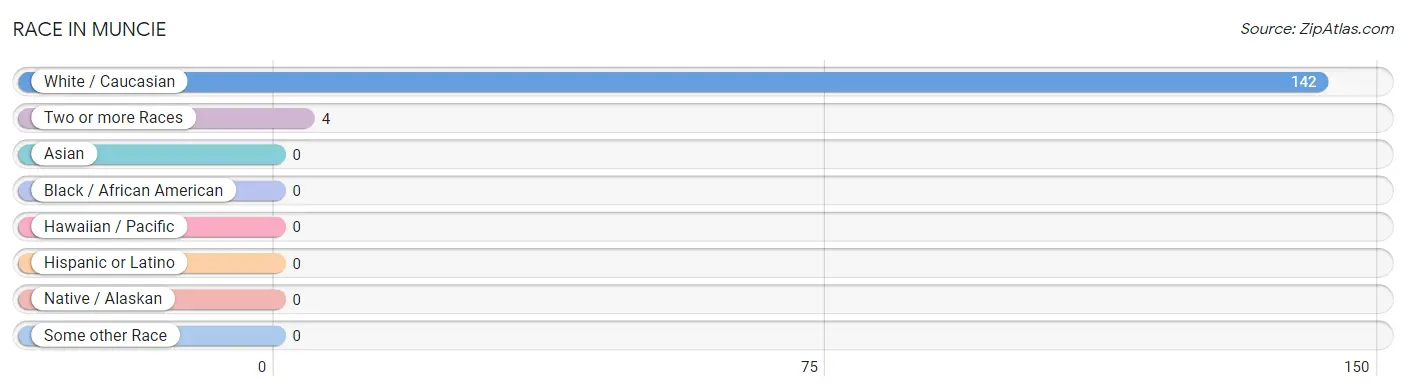
| Race | # Population | % Population |
| Asian | 0 | 0.0% |
| Black / African American | 0 | 0.0% |
| Hawaiian / Pacific | 0 | 0.0% |
| Hispanic or Latino | 0 | 0.0% |
| Native / Alaskan | 0 | 0.0% |
| White / Caucasian | 142 | 97.3% |
| Two or more Races | 4 | 2.7% |
| Some other Race | 0 | 0.0% |
| Total | 146 | 100.0% |
Ancestry in Muncie
The most populous ancestries reported in Muncie are German (24 | 16.4%), English (12 | 8.2%), Scottish (12 | 8.2%), Irish (8 | 5.5%), and American (5 | 3.4%), together accounting for 41.8% of all Muncie residents.
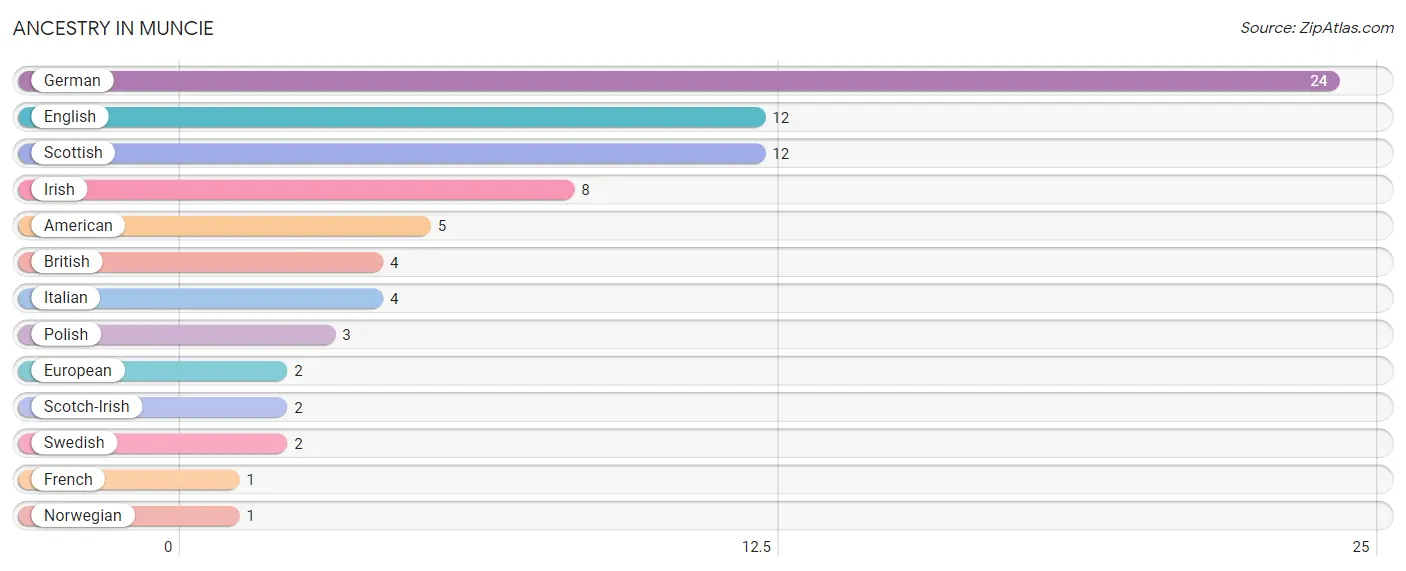
| Ancestry | # Population | % Population |
| American | 5 | 3.4% |
| British | 4 | 2.7% |
| English | 12 | 8.2% |
| European | 2 | 1.4% |
| French | 1 | 0.7% |
| German | 24 | 16.4% |
| Irish | 8 | 5.5% |
| Italian | 4 | 2.7% |
| Norwegian | 1 | 0.7% |
| Polish | 3 | 2.1% |
| Scotch-Irish | 2 | 1.4% |
| Scottish | 12 | 8.2% |
| Swedish | 2 | 1.4% | View All 13 Rows |
Immigrants in Muncie

| Immigration Origin | # Population | % Population | View All 0 Rows |
Sex and Age in Muncie
Sex and Age in Muncie
The most populous age groups in Muncie are 60 to 64 Years (11 | 14.7%) for men and 65 to 69 Years (22 | 31.0%) for women.
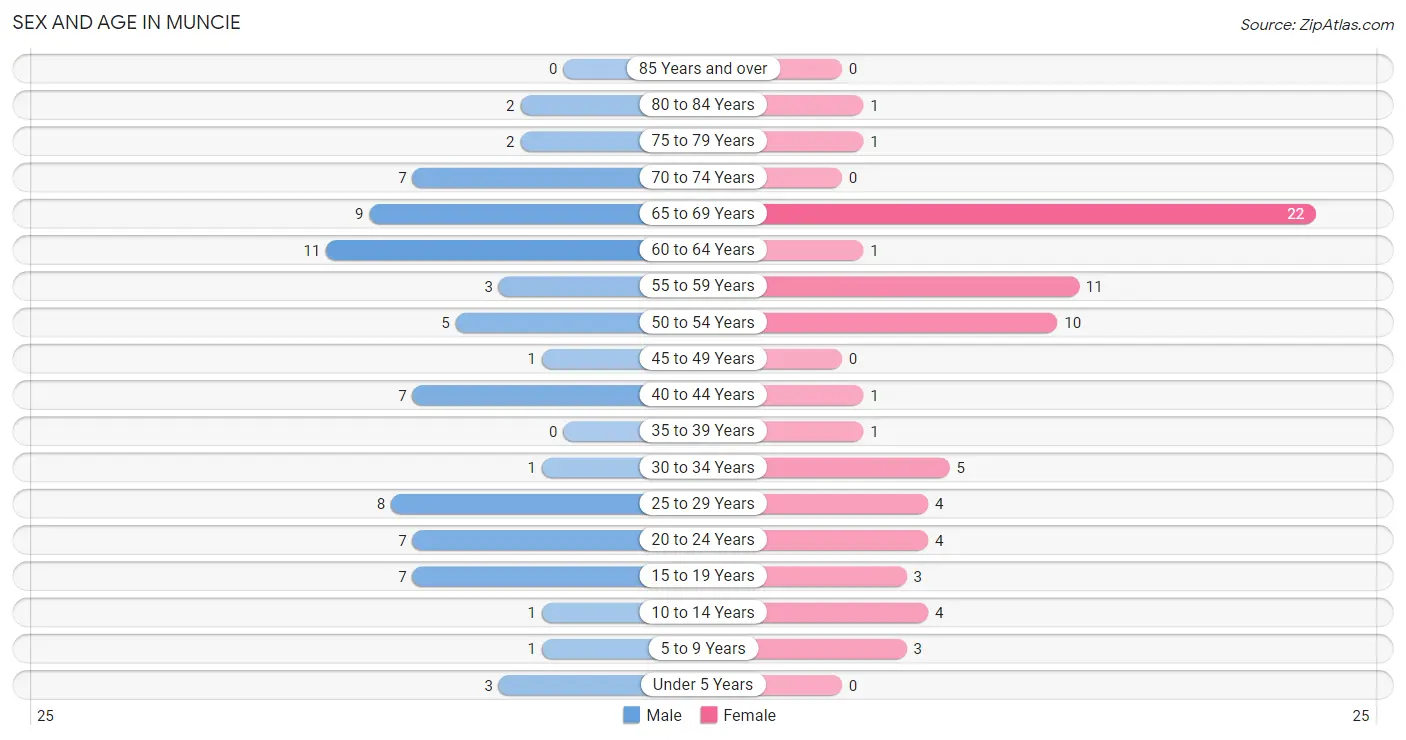
| Age Bracket | Male | Female |
| Under 5 Years | 3 (4.0%) | 0 (0.0%) |
| 5 to 9 Years | 1 (1.3%) | 3 (4.2%) |
| 10 to 14 Years | 1 (1.3%) | 4 (5.6%) |
| 15 to 19 Years | 7 (9.3%) | 3 (4.2%) |
| 20 to 24 Years | 7 (9.3%) | 4 (5.6%) |
| 25 to 29 Years | 8 (10.7%) | 4 (5.6%) |
| 30 to 34 Years | 1 (1.3%) | 5 (7.0%) |
| 35 to 39 Years | 0 (0.0%) | 1 (1.4%) |
| 40 to 44 Years | 7 (9.3%) | 1 (1.4%) |
| 45 to 49 Years | 1 (1.3%) | 0 (0.0%) |
| 50 to 54 Years | 5 (6.7%) | 10 (14.1%) |
| 55 to 59 Years | 3 (4.0%) | 11 (15.5%) |
| 60 to 64 Years | 11 (14.7%) | 1 (1.4%) |
| 65 to 69 Years | 9 (12.0%) | 22 (31.0%) |
| 70 to 74 Years | 7 (9.3%) | 0 (0.0%) |
| 75 to 79 Years | 2 (2.7%) | 1 (1.4%) |
| 80 to 84 Years | 2 (2.7%) | 1 (1.4%) |
| 85 Years and over | 0 (0.0%) | 0 (0.0%) |
| Total | 75 (100.0%) | 71 (100.0%) |
Families and Households in Muncie
Median Family Size in Muncie
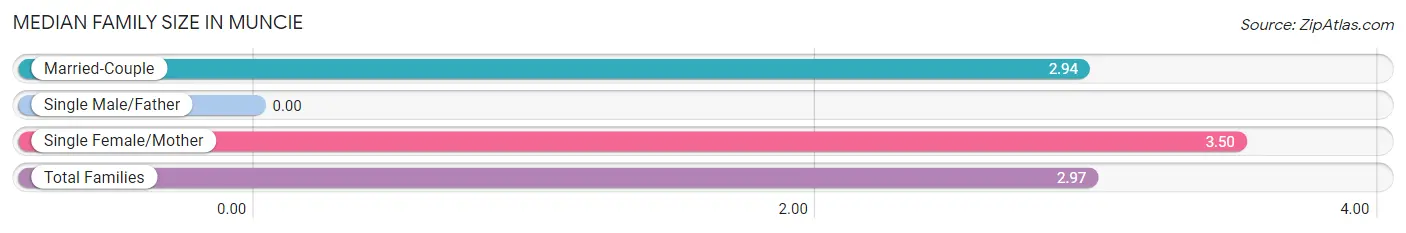
| Family Type | # Families | Family Size |
| Married-Couple | 33 (94.3%) | 2.94 |
| Single Male/Father | 0 (0.0%) | - |
| Single Female/Mother | 2 (5.7%) | 3.50 |
| Total Families | 35 (100.0%) | 2.97 |
Median Household Size in Muncie
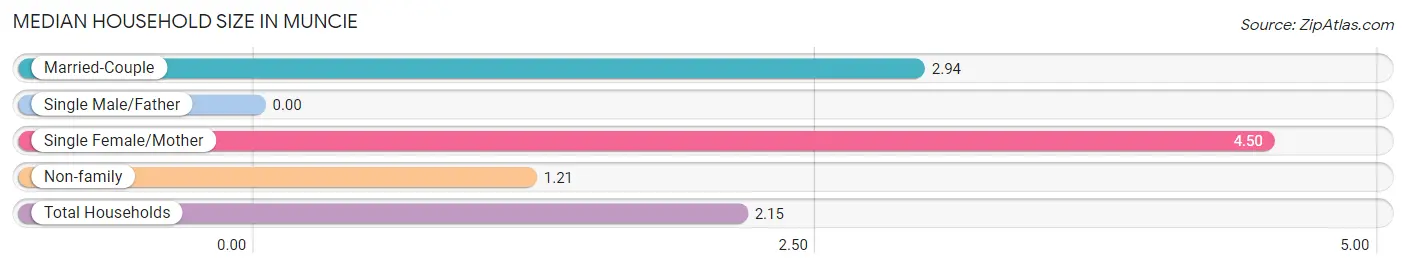
| Household Type | # Households | Household Size |
| Married-Couple | 33 (48.5%) | 2.94 |
| Single Male/Father | 0 (0.0%) | - |
| Single Female/Mother | 2 (2.9%) | 4.50 |
| Non-family | 33 (48.5%) | 1.21 |
| Total Households | 68 (100.0%) | 2.15 |
Household Size by Marriage Status in Muncie
Out of a total of 68 households in Muncie, 35 (51.5%) are family households, while 33 (48.5%) are nonfamily households. The most numerous type of family households are 2-person households, comprising 22, and the most common type of nonfamily households are 1-person households, comprising 26.
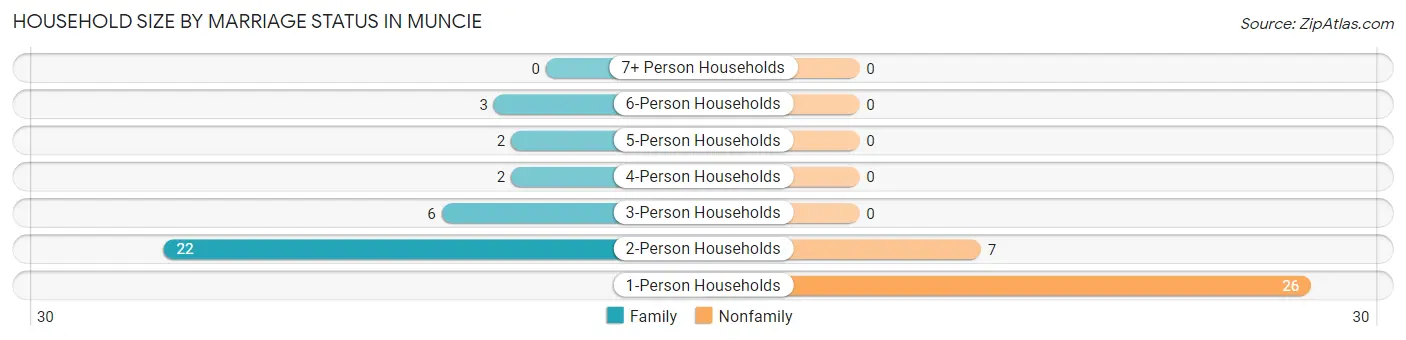
| Household Size | Family Households | Nonfamily Households |
| 1-Person Households | - | 26 (38.2%) |
| 2-Person Households | 22 (32.4%) | 7 (10.3%) |
| 3-Person Households | 6 (8.8%) | 0 (0.0%) |
| 4-Person Households | 2 (2.9%) | 0 (0.0%) |
| 5-Person Households | 2 (2.9%) | 0 (0.0%) |
| 6-Person Households | 3 (4.4%) | 0 (0.0%) |
| 7+ Person Households | 0 (0.0%) | 0 (0.0%) |
| Total | 35 (51.5%) | 33 (48.5%) |
Female Fertility in Muncie
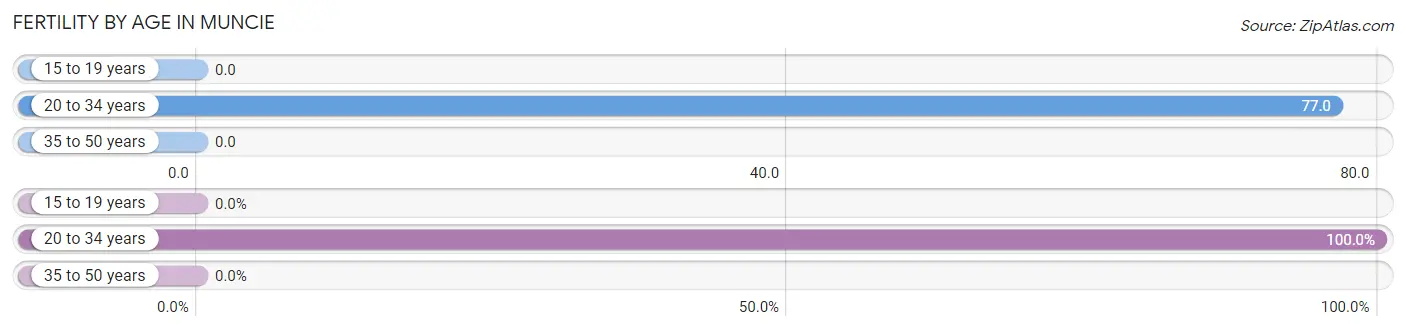
Fertility by Age in Muncie
Average fertility rate in Muncie is 56.0 births per 1,000 women. Women in the age bracket of 20 to 34 years have the highest fertility rate with 77.0 births per 1,000 women. Women in the age bracket of 20 to 34 years acount for 100.0% of all women with births.
| Age Bracket | Women with Births | Births / 1,000 Women |
| 15 to 19 years | 0 (0.0%) | 0.0 |
| 20 to 34 years | 1 (100.0%) | 77.0 |
| 35 to 50 years | 0 (0.0%) | 0.0 |
| Total | 1 (100.0%) | 56.0 |
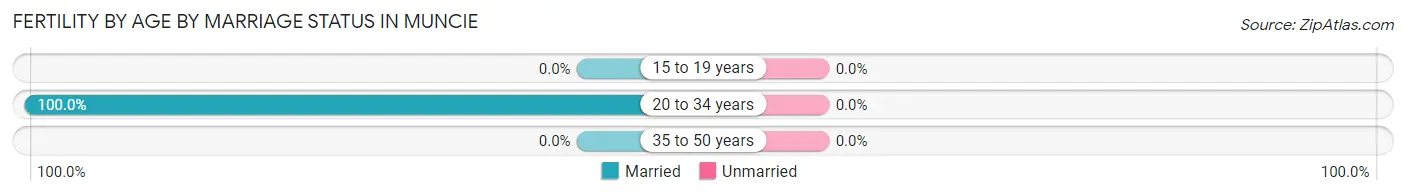
Fertility by Age by Marriage Status in Muncie
| Age Bracket | Married | Unmarried |
| 15 to 19 years | 0 (0.0%) | 0 (0.0%) |
| 20 to 34 years | 1 (100.0%) | 0 (0.0%) |
| 35 to 50 years | 0 (0.0%) | 0 (0.0%) |
| Total | 1 (100.0%) | 0 (0.0%) |
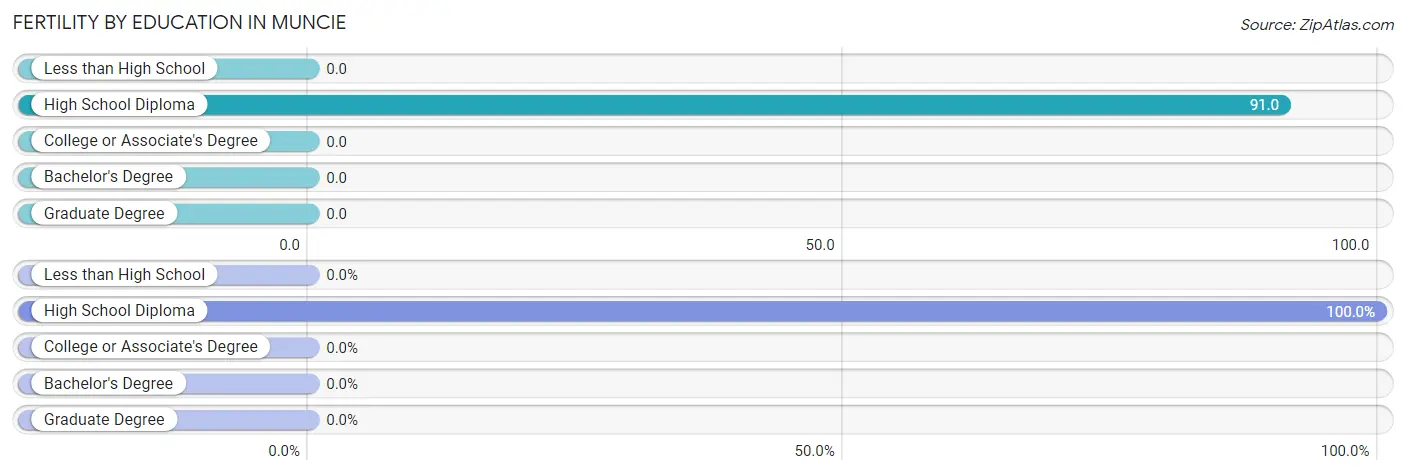
Fertility by Education in Muncie
| Educational Attainment | Women with Births | Births / 1,000 Women |
| Less than High School | 0 (0.0%) | 0.0 |
| High School Diploma | 1 (100.0%) | 91.0 |
| College or Associate's Degree | 0 (0.0%) | 0.0 |
| Bachelor's Degree | 0 (0.0%) | 0.0 |
| Graduate Degree | 0 (0.0%) | 0.0 |
| Total | 1 (100.0%) | 56.0 |
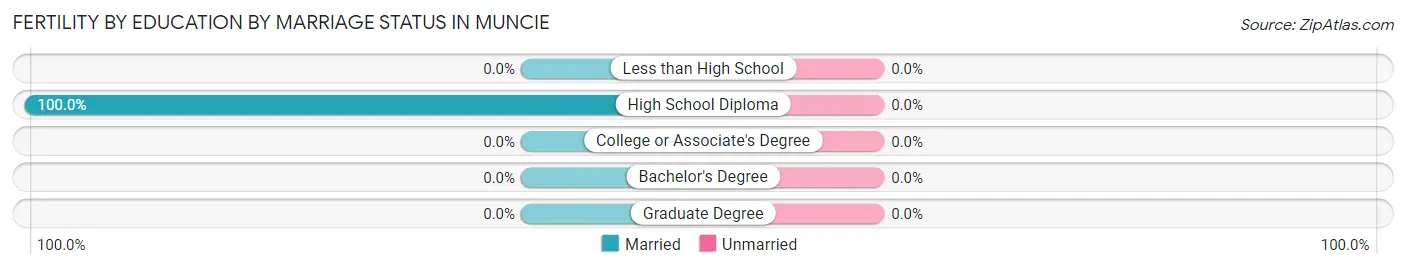
Fertility by Education by Marriage Status in Muncie
| Educational Attainment | Married | Unmarried |
| Less than High School | 0 (0.0%) | 0 (0.0%) |
| High School Diploma | 1 (100.0%) | 0 (0.0%) |
| College or Associate's Degree | 0 (0.0%) | 0 (0.0%) |
| Bachelor's Degree | 0 (0.0%) | 0 (0.0%) |
| Graduate Degree | 0 (0.0%) | 0 (0.0%) |
| Total | 1 (100.0%) | 0 (0.0%) |
Employment Characteristics in Muncie
Employment by Class of Employer in Muncie
Among the 77 employed individuals in Muncie, private company employees (41 | 53.2%), state government employees (15 | 19.5%), and self-employed (not incorporated) (13 | 16.9%) make up the most common classes of employment.
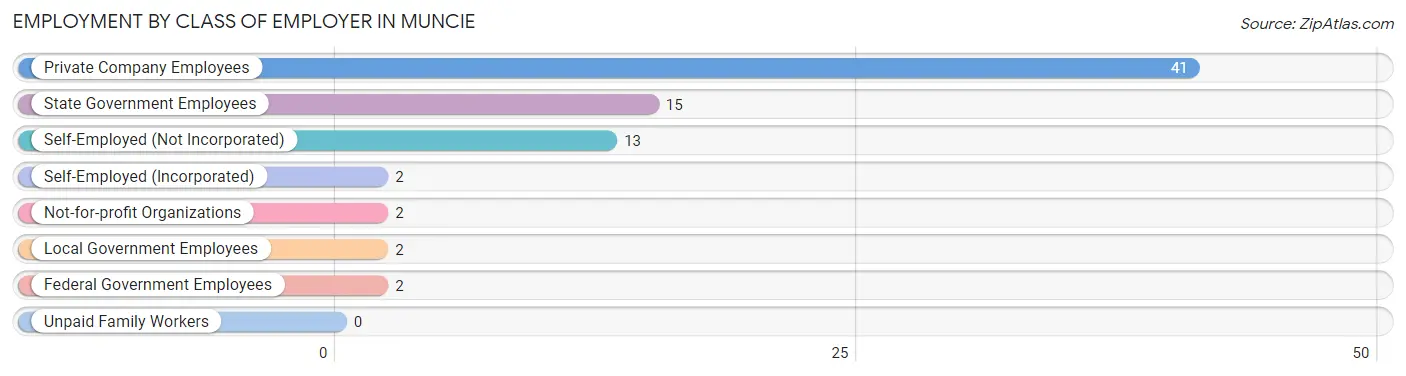
| Employer Class | # Employees | % Employees |
| Private Company Employees | 41 | 53.2% |
| Self-Employed (Incorporated) | 2 | 2.6% |
| Self-Employed (Not Incorporated) | 13 | 16.9% |
| Not-for-profit Organizations | 2 | 2.6% |
| Local Government Employees | 2 | 2.6% |
| State Government Employees | 15 | 19.5% |
| Federal Government Employees | 2 | 2.6% |
| Unpaid Family Workers | 0 | 0.0% |
| Total | 77 | 100.0% |
Employment Status by Age in Muncie
According to the labor force statistics for Muncie, out of the total population over 16 years of age (133), 62.4% or 83 individuals are in the labor force, with 7.2% or 6 of them unemployed. The age group with the highest labor force participation rate is 20 to 24 years, with 100.0% or 11 individuals in the labor force. Within the labor force, the 45 to 54 years age range has the highest percentage of unemployed individuals, with 36.4% or 4 of them being unemployed.
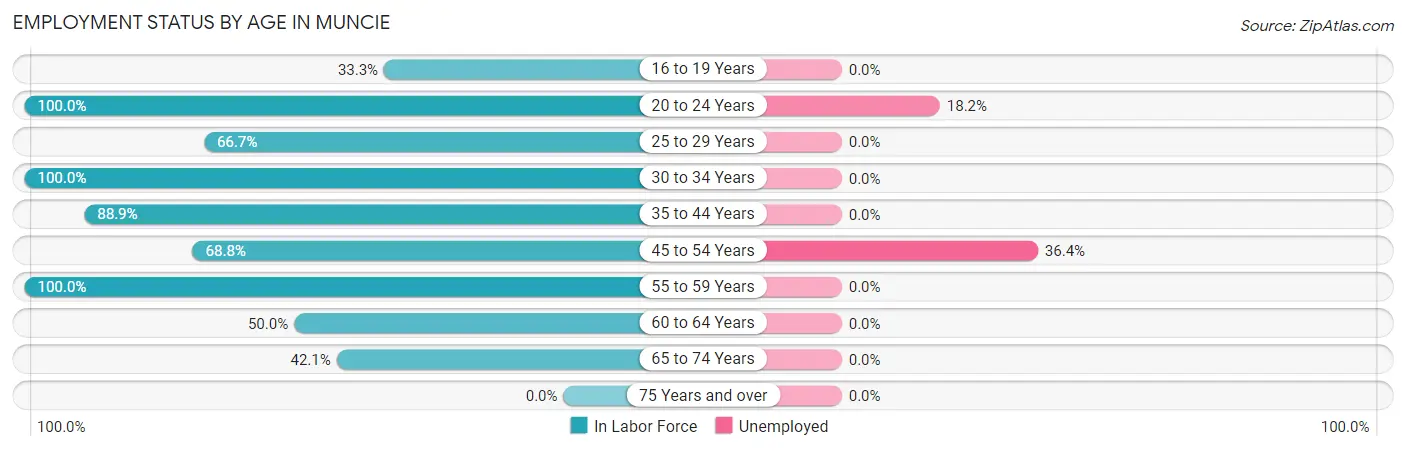
| Age Bracket | In Labor Force | Unemployed |
| 16 to 19 Years | 3 (33.3%) | 0 (0.0%) |
| 20 to 24 Years | 11 (100.0%) | 2 (18.2%) |
| 25 to 29 Years | 8 (66.7%) | 0 (0.0%) |
| 30 to 34 Years | 6 (100.0%) | 0 (0.0%) |
| 35 to 44 Years | 8 (88.9%) | 0 (0.0%) |
| 45 to 54 Years | 11 (68.8%) | 4 (36.4%) |
| 55 to 59 Years | 14 (100.0%) | 0 (0.0%) |
| 60 to 64 Years | 6 (50.0%) | 0 (0.0%) |
| 65 to 74 Years | 16 (42.1%) | 0 (0.0%) |
| 75 Years and over | 0 (0.0%) | 0 (0.0%) |
| Total | 83 (62.4%) | 6 (7.2%) |
Employment Status by Educational Attainment in Muncie
According to labor force statistics for Muncie, 76.8% of individuals (53) out of the total population between 25 and 64 years of age (69) are in the labor force, with 7.5% or 4 of them being unemployed. The group with the highest labor force participation rate are those with the educational attainment of less than high school, with 100.0% or 6 individuals in the labor force. Within the labor force, individuals with high school diploma education have the highest percentage of unemployment, with 23.5% or 4 of them being unemployed.
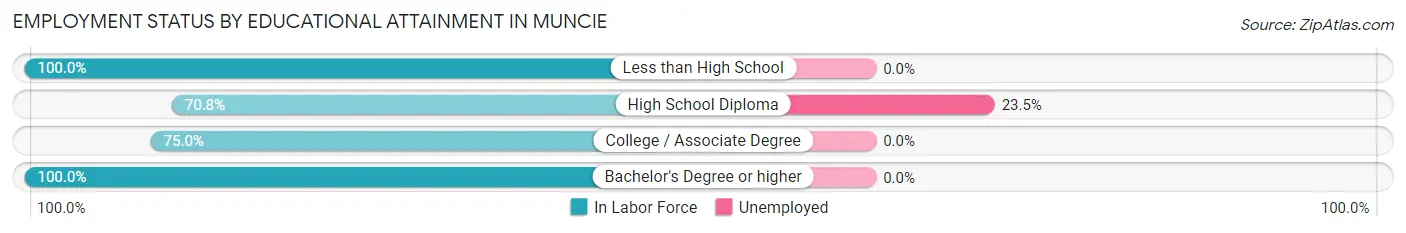
| Educational Attainment | In Labor Force | Unemployed |
| Less than High School | 6 (100.0%) | 0 (0.0%) |
| High School Diploma | 17 (70.8%) | 6 (23.5%) |
| College / Associate Degree | 27 (75.0%) | 0 (0.0%) |
| Bachelor's Degree or higher | 3 (100.0%) | 0 (0.0%) |
| Total | 53 (76.8%) | 5 (7.5%) |
Employment Occupations by Sex in Muncie
Management, Business, Science and Arts Occupations
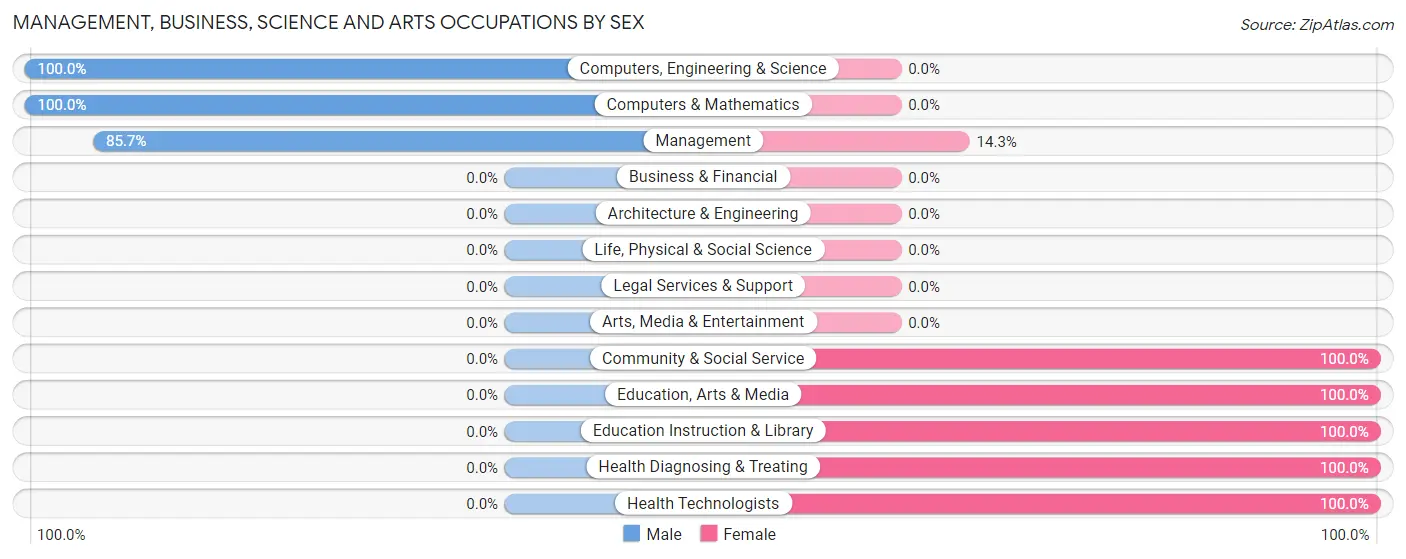
The most common Management, Business, Science and Arts occupations in Muncie are Management (14 | 18.2%), Health Diagnosing & Treating (12 | 15.6%), Health Technologists (12 | 15.6%), Computers, Engineering & Science (7 | 9.1%), and Computers & Mathematics (7 | 9.1%).
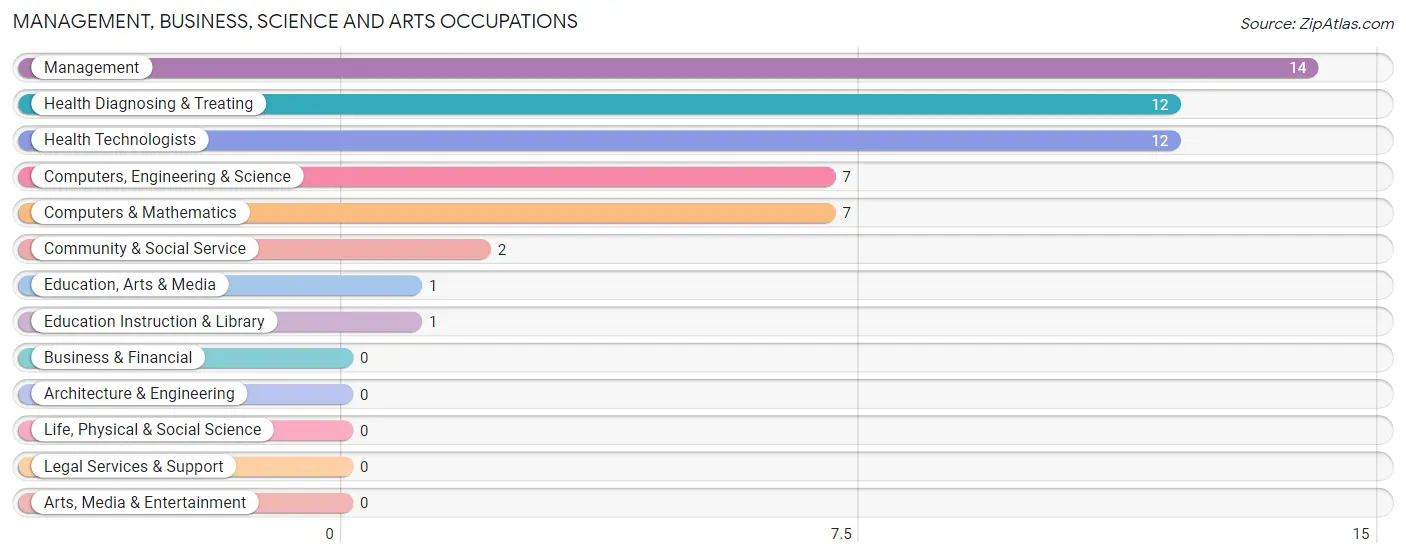
Management, Business, Science and Arts Occupations by Sex
Within the Management, Business, Science and Arts occupations in Muncie, the most male-oriented occupations are Computers, Engineering & Science (100.0%), Computers & Mathematics (100.0%), and Management (85.7%), while the most female-oriented occupations are Community & Social Service (100.0%), Education, Arts & Media (100.0%), and Education Instruction & Library (100.0%).
| Occupation | Male | Female |
| Management | 12 (85.7%) | 2 (14.3%) |
| Business & Financial | 0 (0.0%) | 0 (0.0%) |
| Computers, Engineering & Science | 7 (100.0%) | 0 (0.0%) |
| Computers & Mathematics | 7 (100.0%) | 0 (0.0%) |
| Architecture & Engineering | 0 (0.0%) | 0 (0.0%) |
| Life, Physical & Social Science | 0 (0.0%) | 0 (0.0%) |
| Community & Social Service | 0 (0.0%) | 2 (100.0%) |
| Education, Arts & Media | 0 (0.0%) | 1 (100.0%) |
| Legal Services & Support | 0 (0.0%) | 0 (0.0%) |
| Education Instruction & Library | 0 (0.0%) | 1 (100.0%) |
| Arts, Media & Entertainment | 0 (0.0%) | 0 (0.0%) |
| Health Diagnosing & Treating | 0 (0.0%) | 12 (100.0%) |
| Health Technologists | 0 (0.0%) | 12 (100.0%) |
| Total (Category) | 19 (54.3%) | 16 (45.7%) |
| Total (Overall) | 39 (50.6%) | 38 (49.3%) |
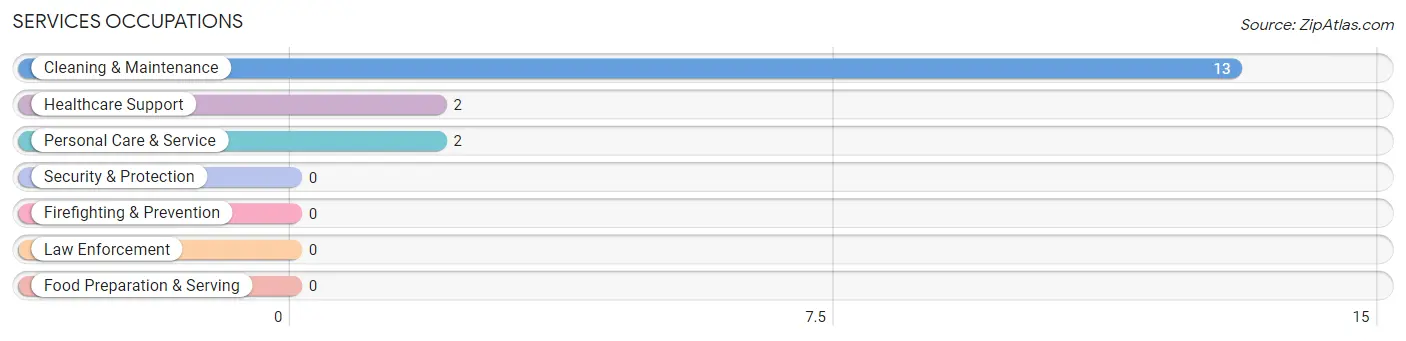
Services Occupations
The most common Services occupations in Muncie are Cleaning & Maintenance (13 | 16.9%), Healthcare Support (2 | 2.6%), and Personal Care & Service (2 | 2.6%).
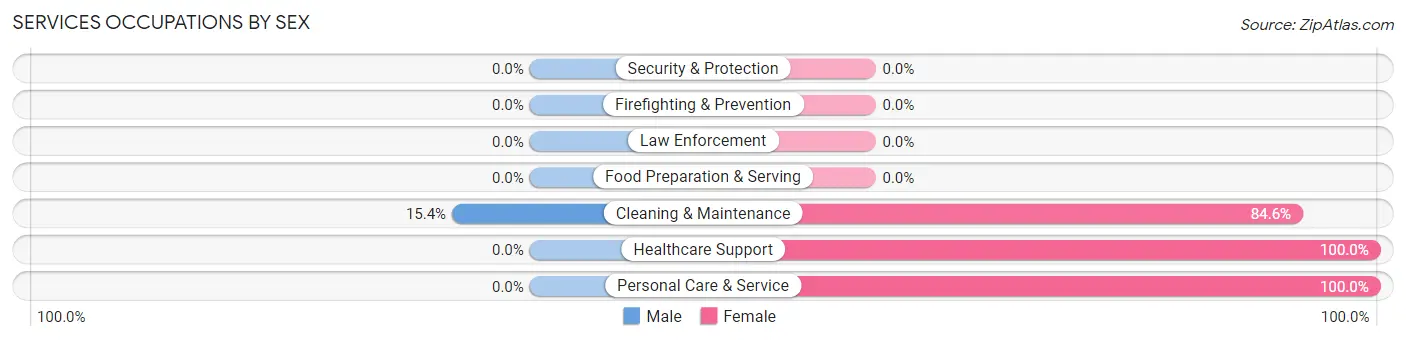
Services Occupations by Sex
| Occupation | Male | Female |
| Healthcare Support | 0 (0.0%) | 2 (100.0%) |
| Security & Protection | 0 (0.0%) | 0 (0.0%) |
| Firefighting & Prevention | 0 (0.0%) | 0 (0.0%) |
| Law Enforcement | 0 (0.0%) | 0 (0.0%) |
| Food Preparation & Serving | 0 (0.0%) | 0 (0.0%) |
| Cleaning & Maintenance | 2 (15.4%) | 11 (84.6%) |
| Personal Care & Service | 0 (0.0%) | 2 (100.0%) |
| Total (Category) | 2 (11.8%) | 15 (88.2%) |
| Total (Overall) | 39 (50.6%) | 38 (49.3%) |
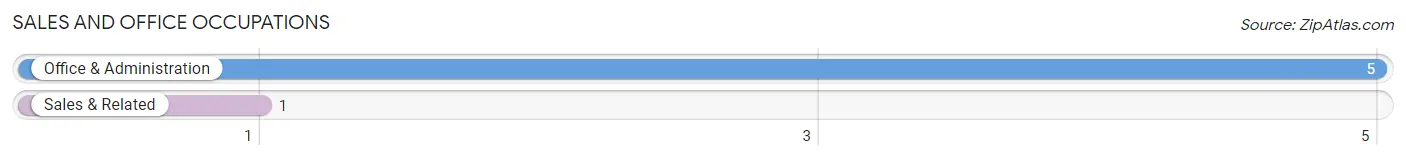
Sales and Office Occupations
The most common Sales and Office occupations in Muncie are Office & Administration (5 | 6.5%), and Sales & Related (1 | 1.3%).
Sales and Office Occupations by Sex
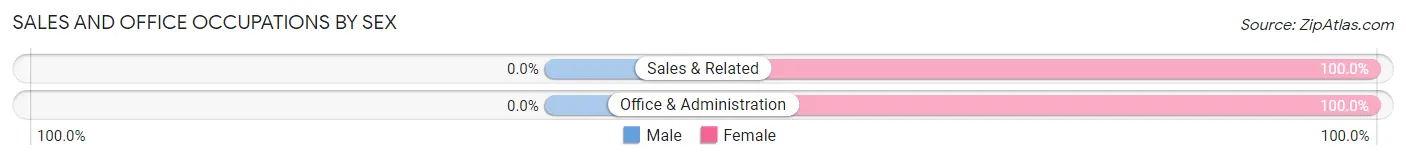
| Occupation | Male | Female |
| Sales & Related | 0 (0.0%) | 1 (100.0%) |
| Office & Administration | 0 (0.0%) | 5 (100.0%) |
| Total (Category) | 0 (0.0%) | 6 (100.0%) |
| Total (Overall) | 39 (50.6%) | 38 (49.3%) |
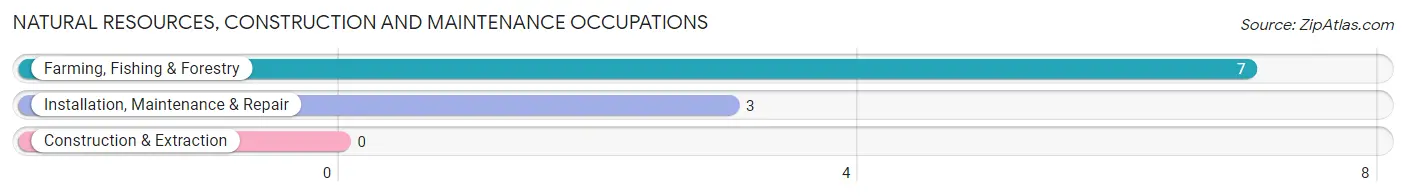
Natural Resources, Construction and Maintenance Occupations
The most common Natural Resources, Construction and Maintenance occupations in Muncie are Farming, Fishing & Forestry (7 | 9.1%), and Installation, Maintenance & Repair (3 | 3.9%).
Natural Resources, Construction and Maintenance Occupations by Sex
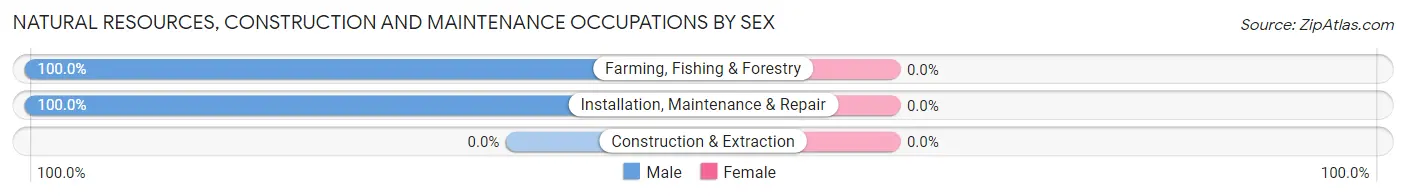
| Occupation | Male | Female |
| Farming, Fishing & Forestry | 7 (100.0%) | 0 (0.0%) |
| Construction & Extraction | 0 (0.0%) | 0 (0.0%) |
| Installation, Maintenance & Repair | 3 (100.0%) | 0 (0.0%) |
| Total (Category) | 10 (100.0%) | 0 (0.0%) |
| Total (Overall) | 39 (50.6%) | 38 (49.3%) |
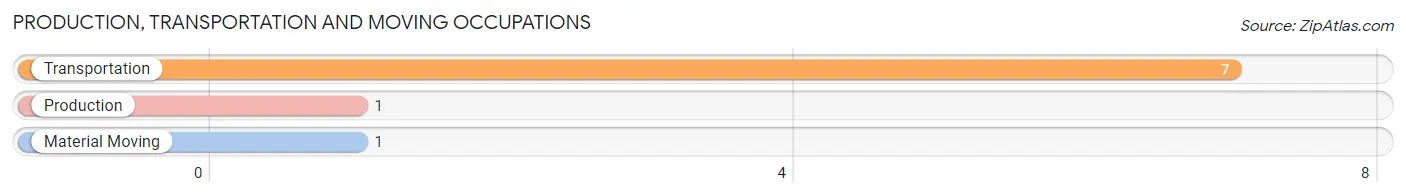
Production, Transportation and Moving Occupations
The most common Production, Transportation and Moving occupations in Muncie are Transportation (7 | 9.1%), Production (1 | 1.3%), and Material Moving (1 | 1.3%).
Production, Transportation and Moving Occupations by Sex
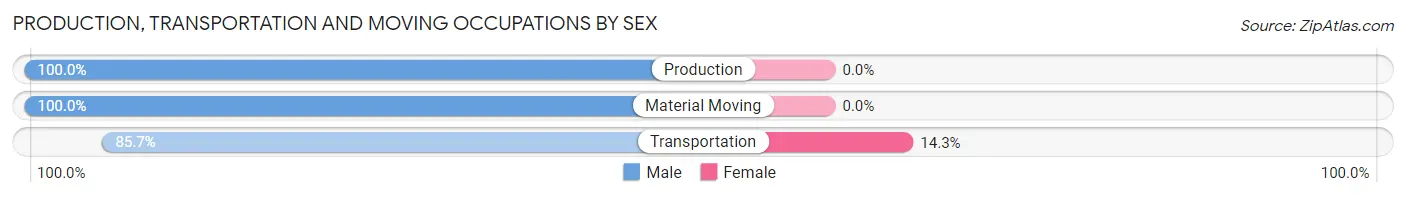
| Occupation | Male | Female |
| Production | 1 (100.0%) | 0 (0.0%) |
| Transportation | 6 (85.7%) | 1 (14.3%) |
| Material Moving | 1 (100.0%) | 0 (0.0%) |
| Total (Category) | 8 (88.9%) | 1 (11.1%) |
| Total (Overall) | 39 (50.6%) | 38 (49.3%) |
Employment Industries by Sex in Muncie
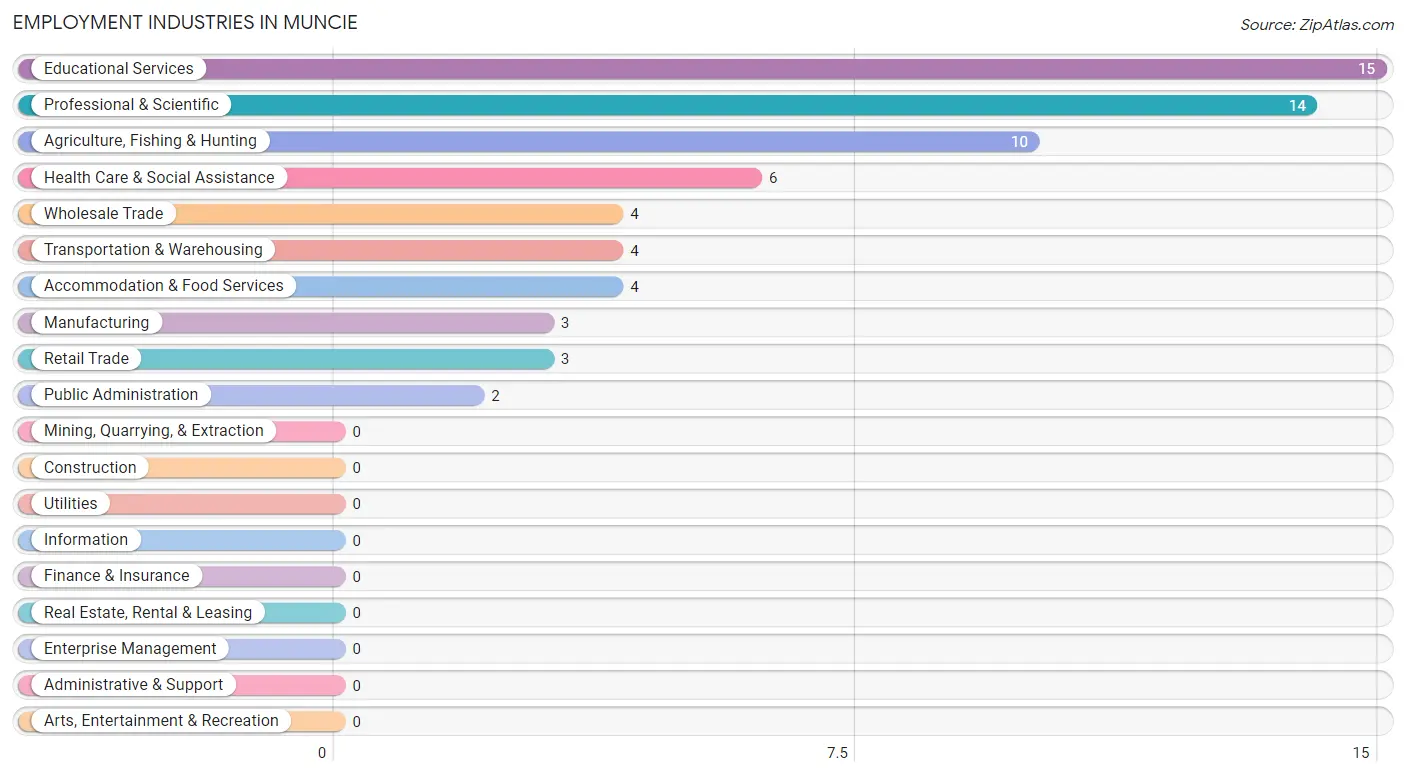
Employment Industries in Muncie
The major employment industries in Muncie include Educational Services (15 | 19.5%), Professional & Scientific (14 | 18.2%), Agriculture, Fishing & Hunting (10 | 13.0%), Health Care & Social Assistance (6 | 7.8%), and Wholesale Trade (4 | 5.2%).
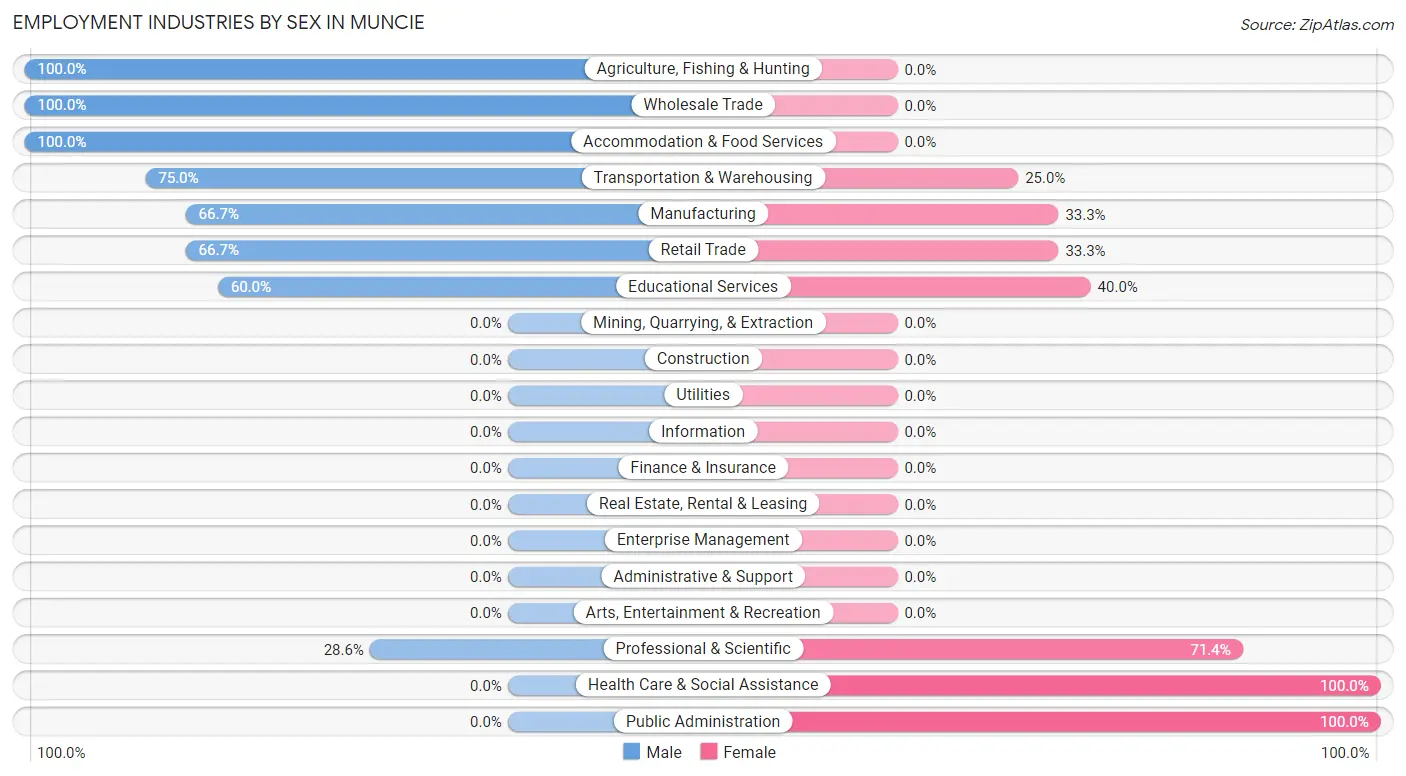
Employment Industries by Sex in Muncie
The Muncie industries that see more men than women are Agriculture, Fishing & Hunting (100.0%), Wholesale Trade (100.0%), and Accommodation & Food Services (100.0%), whereas the industries that tend to have a higher number of women are Health Care & Social Assistance (100.0%), Public Administration (100.0%), and Professional & Scientific (71.4%).
| Industry | Male | Female |
| Agriculture, Fishing & Hunting | 10 (100.0%) | 0 (0.0%) |
| Mining, Quarrying, & Extraction | 0 (0.0%) | 0 (0.0%) |
| Construction | 0 (0.0%) | 0 (0.0%) |
| Manufacturing | 2 (66.7%) | 1 (33.3%) |
| Wholesale Trade | 4 (100.0%) | 0 (0.0%) |
| Retail Trade | 2 (66.7%) | 1 (33.3%) |
| Transportation & Warehousing | 3 (75.0%) | 1 (25.0%) |
| Utilities | 0 (0.0%) | 0 (0.0%) |
| Information | 0 (0.0%) | 0 (0.0%) |
| Finance & Insurance | 0 (0.0%) | 0 (0.0%) |
| Real Estate, Rental & Leasing | 0 (0.0%) | 0 (0.0%) |
| Professional & Scientific | 4 (28.6%) | 10 (71.4%) |
| Enterprise Management | 0 (0.0%) | 0 (0.0%) |
| Administrative & Support | 0 (0.0%) | 0 (0.0%) |
| Educational Services | 9 (60.0%) | 6 (40.0%) |
| Health Care & Social Assistance | 0 (0.0%) | 6 (100.0%) |
| Arts, Entertainment & Recreation | 0 (0.0%) | 0 (0.0%) |
| Accommodation & Food Services | 4 (100.0%) | 0 (0.0%) |
| Public Administration | 0 (0.0%) | 2 (100.0%) |
| Total | 39 (50.6%) | 38 (49.3%) |
Education in Muncie
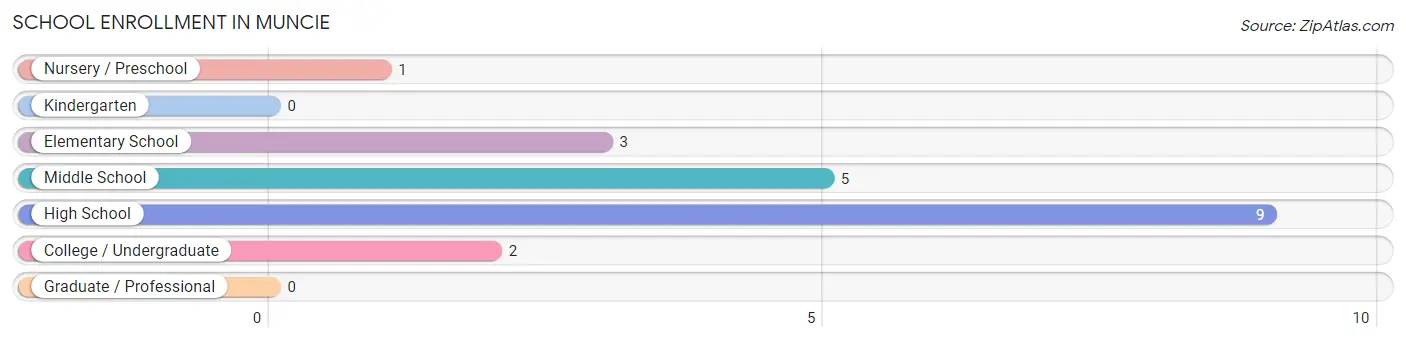
School Enrollment in Muncie
The most common levels of schooling among the 20 students in Muncie are high school (9 | 45.0%), middle school (5 | 25.0%), and elementary school (3 | 15.0%).
| School Level | # Students | % Students |
| Nursery / Preschool | 1 | 5.0% |
| Kindergarten | 0 | 0.0% |
| Elementary School | 3 | 15.0% |
| Middle School | 5 | 25.0% |
| High School | 9 | 45.0% |
| College / Undergraduate | 2 | 10.0% |
| Graduate / Professional | 0 | 0.0% |
| Total | 20 | 100.0% |
School Enrollment by Age by Funding Source in Muncie
Out of a total of 20 students who are enrolled in schools in Muncie, 3 (15.0%) attend a private institution, while the remaining 17 (85.0%) are enrolled in public schools. The age group of 15 to 17 year olds has the highest likelihood of being enrolled in private schools, with 3 (60.0% in the age bracket) enrolled. Conversely, the age group of 5 to 9 year old has the lowest likelihood of being enrolled in a private school, with 4 (100.0% in the age bracket) attending a public institution.
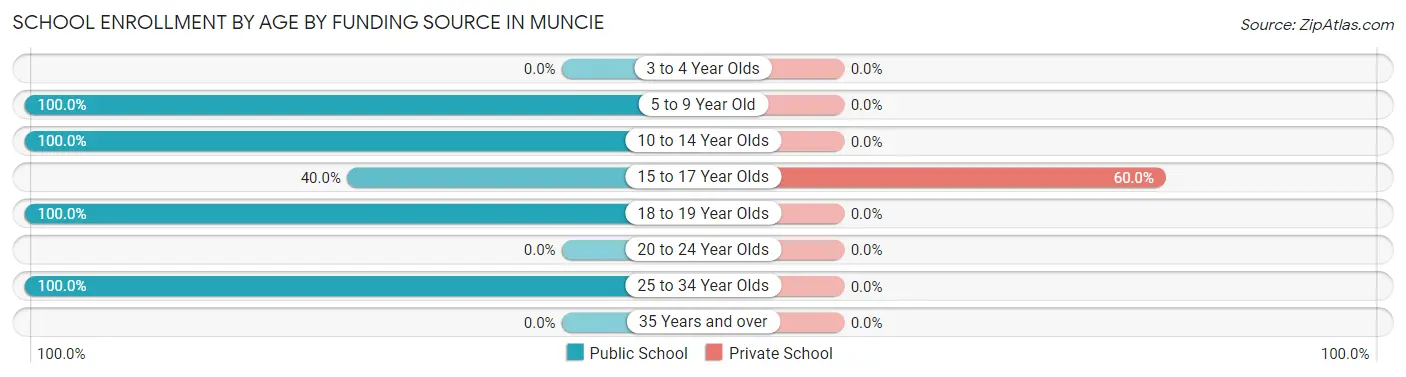
| Age Bracket | Public School | Private School |
| 3 to 4 Year Olds | 0 (0.0%) | 0 (0.0%) |
| 5 to 9 Year Old | 4 (100.0%) | 0 (0.0%) |
| 10 to 14 Year Olds | 5 (100.0%) | 0 (0.0%) |
| 15 to 17 Year Olds | 2 (40.0%) | 3 (60.0%) |
| 18 to 19 Year Olds | 4 (100.0%) | 0 (0.0%) |
| 20 to 24 Year Olds | 0 (0.0%) | 0 (0.0%) |
| 25 to 34 Year Olds | 2 (100.0%) | 0 (0.0%) |
| 35 Years and over | 0 (0.0%) | 0 (0.0%) |
| Total | 17 (85.0%) | 3 (15.0%) |
Educational Attainment by Field of Study in Muncie
Bio, nature & agricultural (11 | 30.6%), psychology (11 | 30.6%), social sciences (10 | 27.8%), education (2 | 5.6%), and science & technology (1 | 2.8%) are the most common fields of study among 36 individuals in Muncie who have obtained a bachelor's degree or higher.
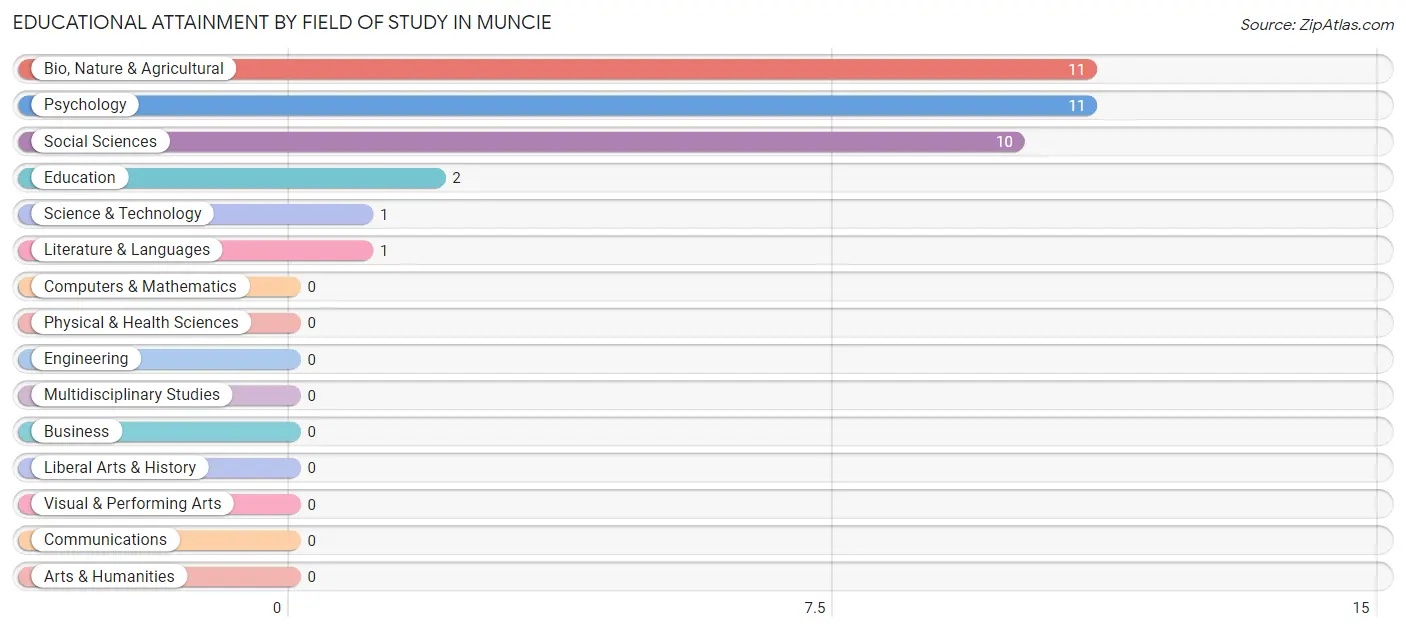
| Field of Study | # Graduates | % Graduates |
| Computers & Mathematics | 0 | 0.0% |
| Bio, Nature & Agricultural | 11 | 30.6% |
| Physical & Health Sciences | 0 | 0.0% |
| Psychology | 11 | 30.6% |
| Social Sciences | 10 | 27.8% |
| Engineering | 0 | 0.0% |
| Multidisciplinary Studies | 0 | 0.0% |
| Science & Technology | 1 | 2.8% |
| Business | 0 | 0.0% |
| Education | 2 | 5.6% |
| Literature & Languages | 1 | 2.8% |
| Liberal Arts & History | 0 | 0.0% |
| Visual & Performing Arts | 0 | 0.0% |
| Communications | 0 | 0.0% |
| Arts & Humanities | 0 | 0.0% |
| Total | 36 | 100.0% |
Transportation & Commute in Muncie
Vehicle Availability by Sex in Muncie
The most prevalent vehicle ownership categories in Muncie are males with 3 vehicles (24, accounting for 61.5%) and females with 3 vehicles (19, making up 63.2%).
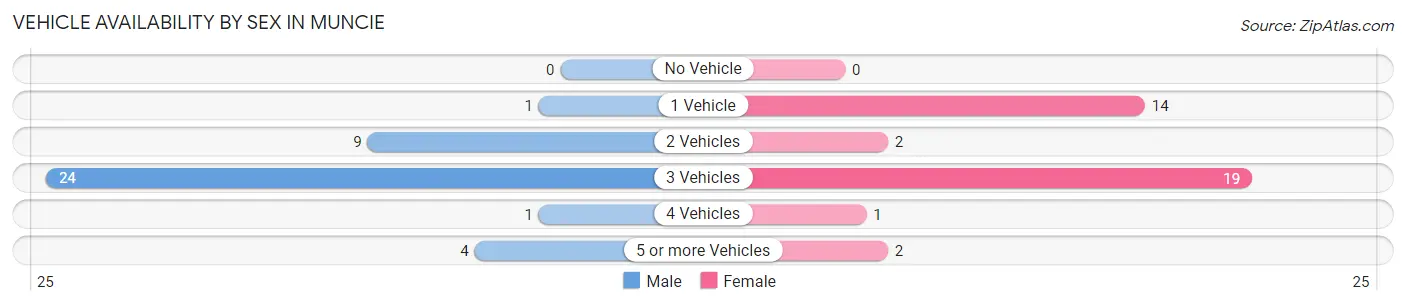
| Vehicles Available | Male | Female |
| No Vehicle | 0 (0.0%) | 0 (0.0%) |
| 1 Vehicle | 1 (2.6%) | 14 (36.8%) |
| 2 Vehicles | 9 (23.1%) | 2 (5.3%) |
| 3 Vehicles | 24 (61.5%) | 19 (50.0%) |
| 4 Vehicles | 1 (2.6%) | 1 (2.6%) |
| 5 or more Vehicles | 4 (10.3%) | 2 (5.3%) |
| Total | 39 (100.0%) | 38 (100.0%) |
Commute Time in Muncie
The most frequently occuring commute durations in Muncie are 30 to 34 minutes (29 commuters, 38.7%), 20 to 24 minutes (24 commuters, 32.0%), and 15 to 19 minutes (10 commuters, 13.3%).
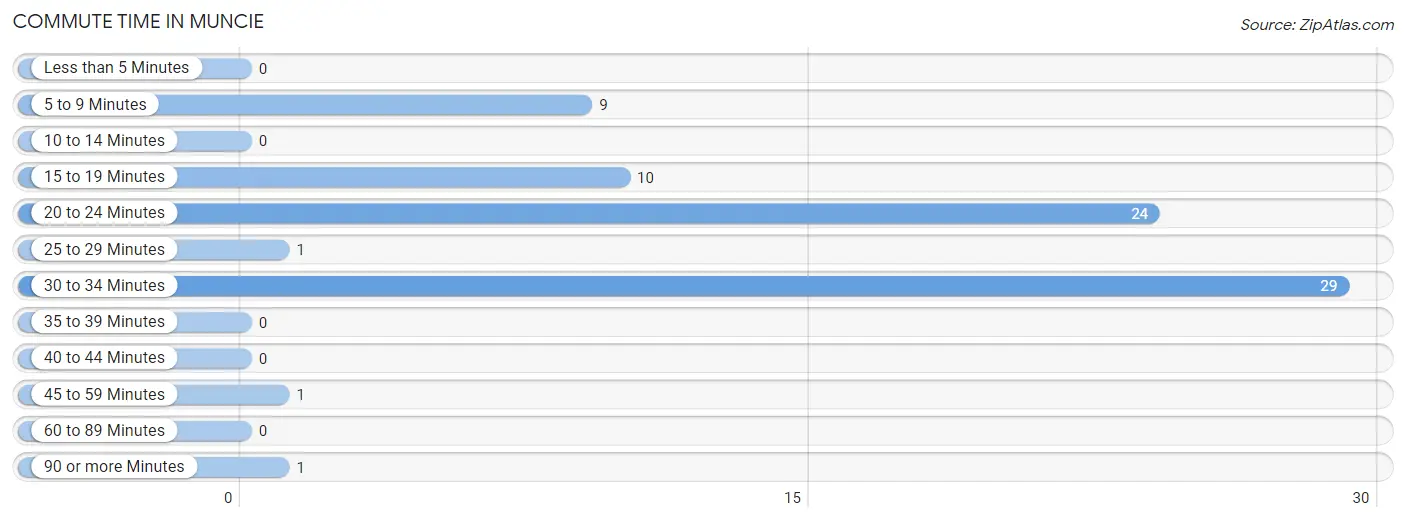
| Commute Time | # Commuters | % Commuters |
| Less than 5 Minutes | 0 | 0.0% |
| 5 to 9 Minutes | 9 | 12.0% |
| 10 to 14 Minutes | 0 | 0.0% |
| 15 to 19 Minutes | 10 | 13.3% |
| 20 to 24 Minutes | 24 | 32.0% |
| 25 to 29 Minutes | 1 | 1.3% |
| 30 to 34 Minutes | 29 | 38.7% |
| 35 to 39 Minutes | 0 | 0.0% |
| 40 to 44 Minutes | 0 | 0.0% |
| 45 to 59 Minutes | 1 | 1.3% |
| 60 to 89 Minutes | 0 | 0.0% |
| 90 or more Minutes | 1 | 1.3% |
Commute Time by Sex in Muncie
The most common commute times in Muncie are 20 to 24 minutes (18 commuters, 46.2%) for males and 30 to 34 minutes (19 commuters, 52.8%) for females.
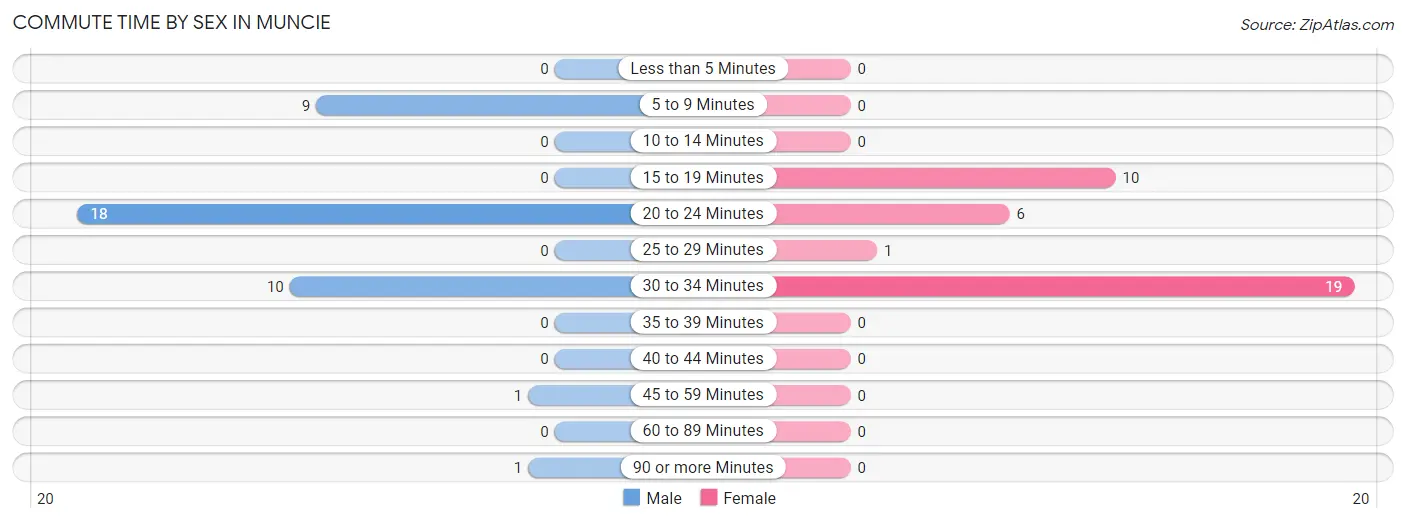
| Commute Time | Male | Female |
| Less than 5 Minutes | 0 (0.0%) | 0 (0.0%) |
| 5 to 9 Minutes | 9 (23.1%) | 0 (0.0%) |
| 10 to 14 Minutes | 0 (0.0%) | 0 (0.0%) |
| 15 to 19 Minutes | 0 (0.0%) | 10 (27.8%) |
| 20 to 24 Minutes | 18 (46.2%) | 6 (16.7%) |
| 25 to 29 Minutes | 0 (0.0%) | 1 (2.8%) |
| 30 to 34 Minutes | 10 (25.6%) | 19 (52.8%) |
| 35 to 39 Minutes | 0 (0.0%) | 0 (0.0%) |
| 40 to 44 Minutes | 0 (0.0%) | 0 (0.0%) |
| 45 to 59 Minutes | 1 (2.6%) | 0 (0.0%) |
| 60 to 89 Minutes | 0 (0.0%) | 0 (0.0%) |
| 90 or more Minutes | 1 (2.6%) | 0 (0.0%) |
Time of Departure to Work by Sex in Muncie
The most frequent times of departure to work in Muncie are 6:30 AM to 6:59 AM (10, 25.6%) for males and 7:30 AM to 7:59 AM (18, 50.0%) for females.
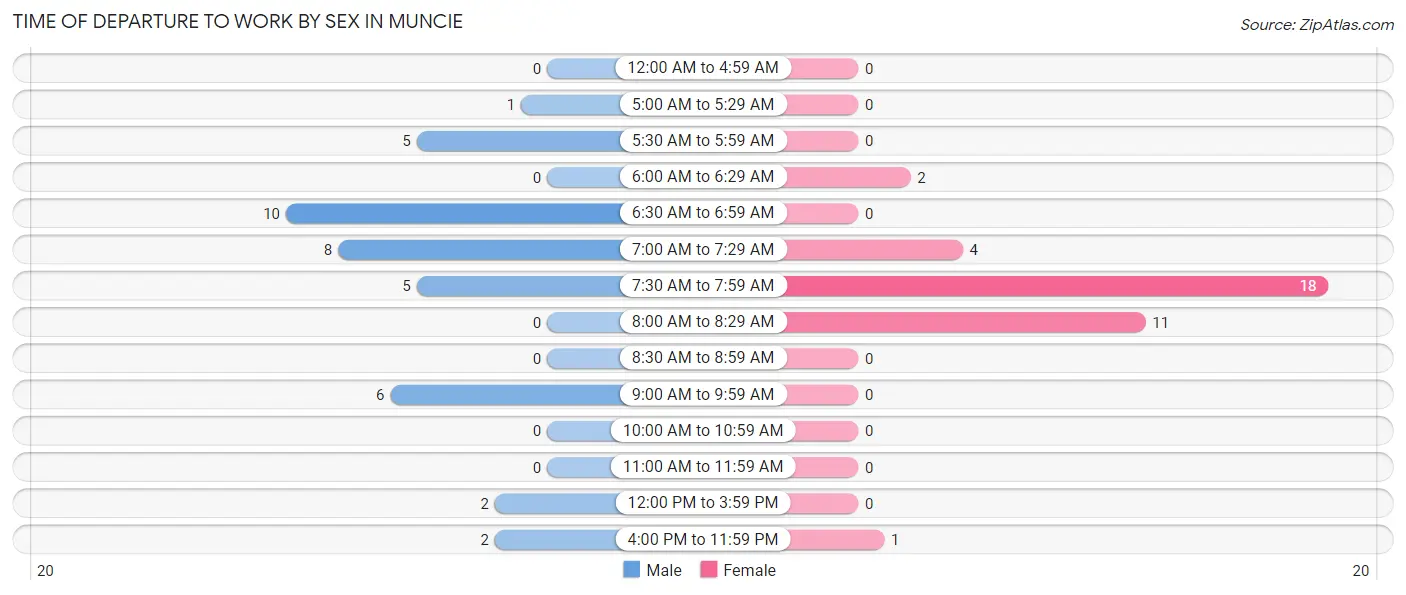
| Time of Departure | Male | Female |
| 12:00 AM to 4:59 AM | 0 (0.0%) | 0 (0.0%) |
| 5:00 AM to 5:29 AM | 1 (2.6%) | 0 (0.0%) |
| 5:30 AM to 5:59 AM | 5 (12.8%) | 0 (0.0%) |
| 6:00 AM to 6:29 AM | 0 (0.0%) | 2 (5.6%) |
| 6:30 AM to 6:59 AM | 10 (25.6%) | 0 (0.0%) |
| 7:00 AM to 7:29 AM | 8 (20.5%) | 4 (11.1%) |
| 7:30 AM to 7:59 AM | 5 (12.8%) | 18 (50.0%) |
| 8:00 AM to 8:29 AM | 0 (0.0%) | 11 (30.6%) |
| 8:30 AM to 8:59 AM | 0 (0.0%) | 0 (0.0%) |
| 9:00 AM to 9:59 AM | 6 (15.4%) | 0 (0.0%) |
| 10:00 AM to 10:59 AM | 0 (0.0%) | 0 (0.0%) |
| 11:00 AM to 11:59 AM | 0 (0.0%) | 0 (0.0%) |
| 12:00 PM to 3:59 PM | 2 (5.1%) | 0 (0.0%) |
| 4:00 PM to 11:59 PM | 2 (5.1%) | 1 (2.8%) |
| Total | 39 (100.0%) | 36 (100.0%) |
Housing Occupancy in Muncie
Occupancy by Ownership in Muncie
Of the total 68 dwellings in Muncie, owner-occupied units account for 60 (88.2%), while renter-occupied units make up 8 (11.8%).
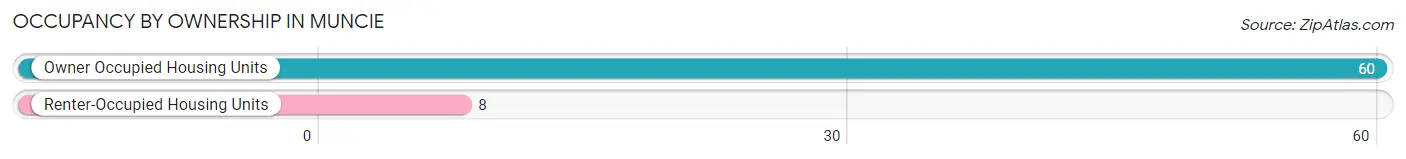
| Occupancy | # Housing Units | % Housing Units |
| Owner Occupied Housing Units | 60 | 88.2% |
| Renter-Occupied Housing Units | 8 | 11.8% |
| Total Occupied Housing Units | 68 | 100.0% |
Occupancy by Household Size in Muncie
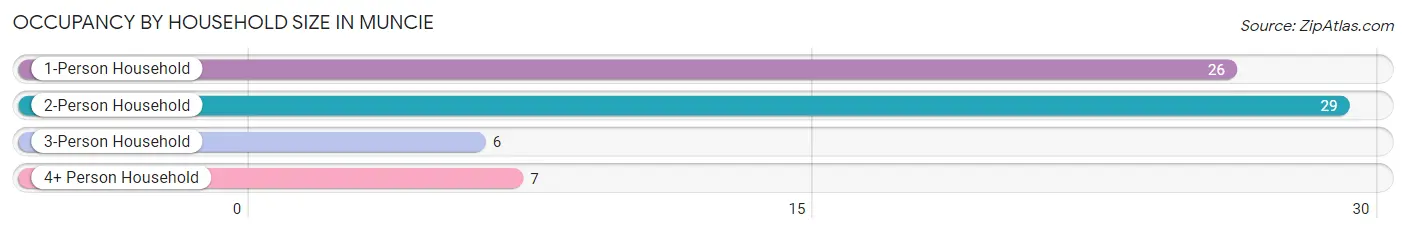
| Household Size | # Housing Units | % Housing Units |
| 1-Person Household | 26 | 38.2% |
| 2-Person Household | 29 | 42.6% |
| 3-Person Household | 6 | 8.8% |
| 4+ Person Household | 7 | 10.3% |
| Total Housing Units | 68 | 100.0% |
Occupancy by Ownership by Household Size in Muncie
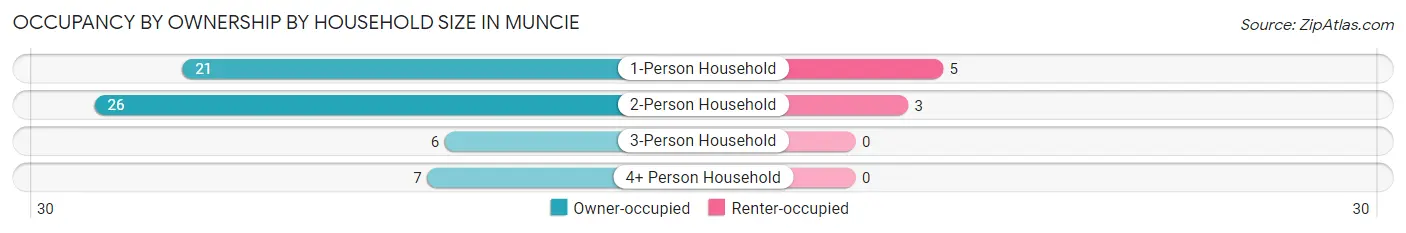
| Household Size | Owner-occupied | Renter-occupied |
| 1-Person Household | 21 (80.8%) | 5 (19.2%) |
| 2-Person Household | 26 (89.7%) | 3 (10.3%) |
| 3-Person Household | 6 (100.0%) | 0 (0.0%) |
| 4+ Person Household | 7 (100.0%) | 0 (0.0%) |
| Total Housing Units | 60 (88.2%) | 8 (11.8%) |
Occupancy by Educational Attainment in Muncie
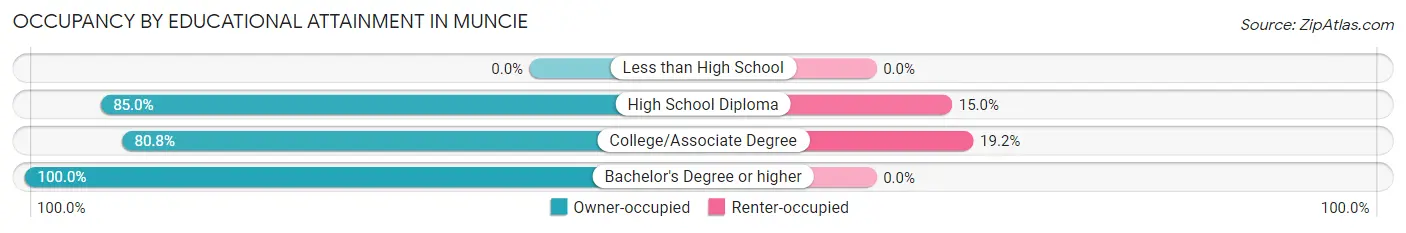
| Household Size | Owner-occupied | Renter-occupied |
| Less than High School | 0 (0.0%) | 0 (0.0%) |
| High School Diploma | 17 (85.0%) | 3 (15.0%) |
| College/Associate Degree | 21 (80.8%) | 5 (19.2%) |
| Bachelor's Degree or higher | 22 (100.0%) | 0 (0.0%) |
Occupancy by Age of Householder in Muncie
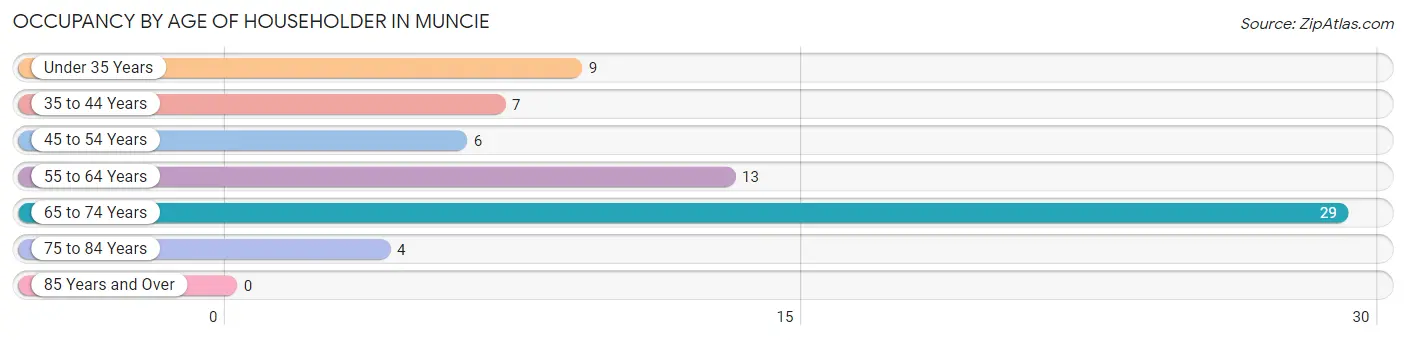
| Age Bracket | # Households | % Households |
| Under 35 Years | 9 | 13.2% |
| 35 to 44 Years | 7 | 10.3% |
| 45 to 54 Years | 6 | 8.8% |
| 55 to 64 Years | 13 | 19.1% |
| 65 to 74 Years | 29 | 42.6% |
| 75 to 84 Years | 4 | 5.9% |
| 85 Years and Over | 0 | 0.0% |
| Total | 68 | 100.0% |
Housing Finances in Muncie
Median Income by Occupancy in Muncie
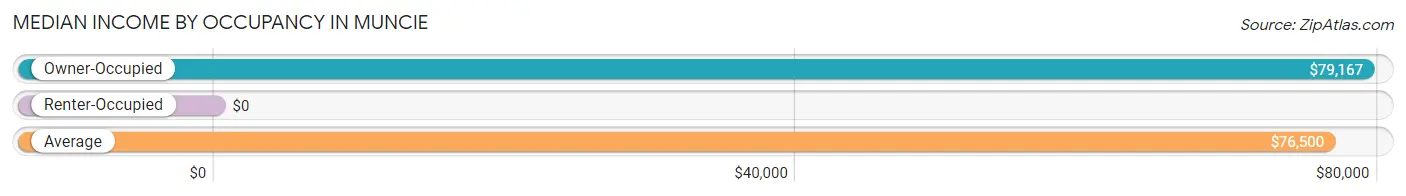
| Occupancy Type | # Households | Median Income |
| Owner-Occupied | 60 (88.2%) | $79,167 |
| Renter-Occupied | 8 (11.8%) | $0 |
| Average | 68 (100.0%) | $76,500 |
Occupancy by Householder Income Bracket in Muncie
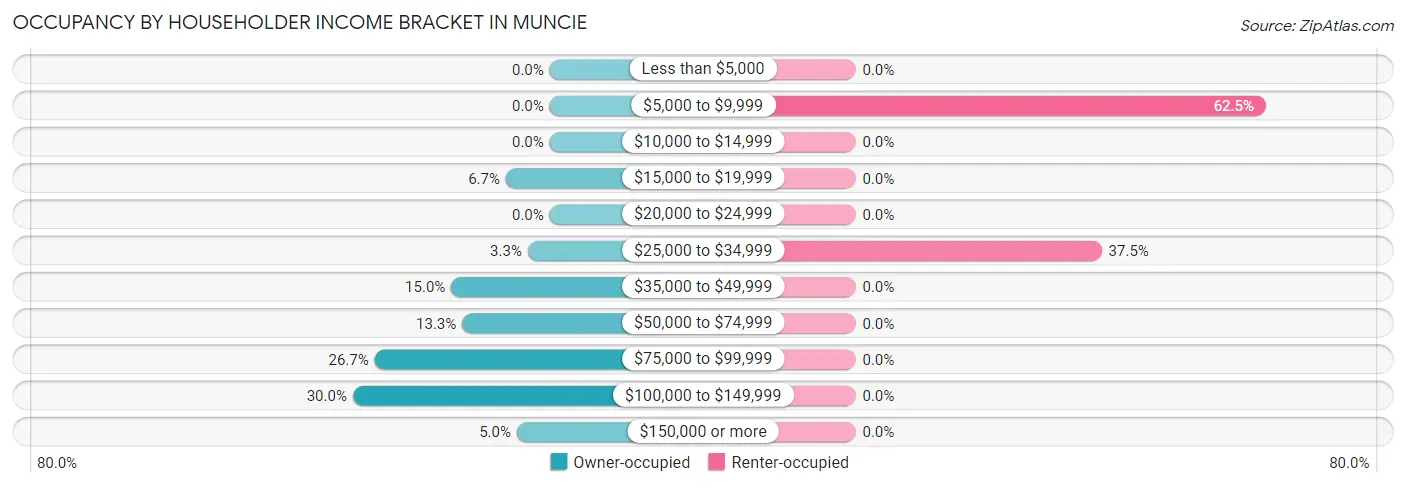
| Income Bracket | Owner-occupied | Renter-occupied |
| Less than $5,000 | 0 (0.0%) | 0 (0.0%) |
| $5,000 to $9,999 | 0 (0.0%) | 5 (62.5%) |
| $10,000 to $14,999 | 0 (0.0%) | 0 (0.0%) |
| $15,000 to $19,999 | 4 (6.7%) | 0 (0.0%) |
| $20,000 to $24,999 | 0 (0.0%) | 0 (0.0%) |
| $25,000 to $34,999 | 2 (3.3%) | 3 (37.5%) |
| $35,000 to $49,999 | 9 (15.0%) | 0 (0.0%) |
| $50,000 to $74,999 | 8 (13.3%) | 0 (0.0%) |
| $75,000 to $99,999 | 16 (26.7%) | 0 (0.0%) |
| $100,000 to $149,999 | 18 (30.0%) | 0 (0.0%) |
| $150,000 or more | 3 (5.0%) | 0 (0.0%) |
| Total | 60 (100.0%) | 8 (100.0%) |
Monthly Housing Cost Tiers in Muncie
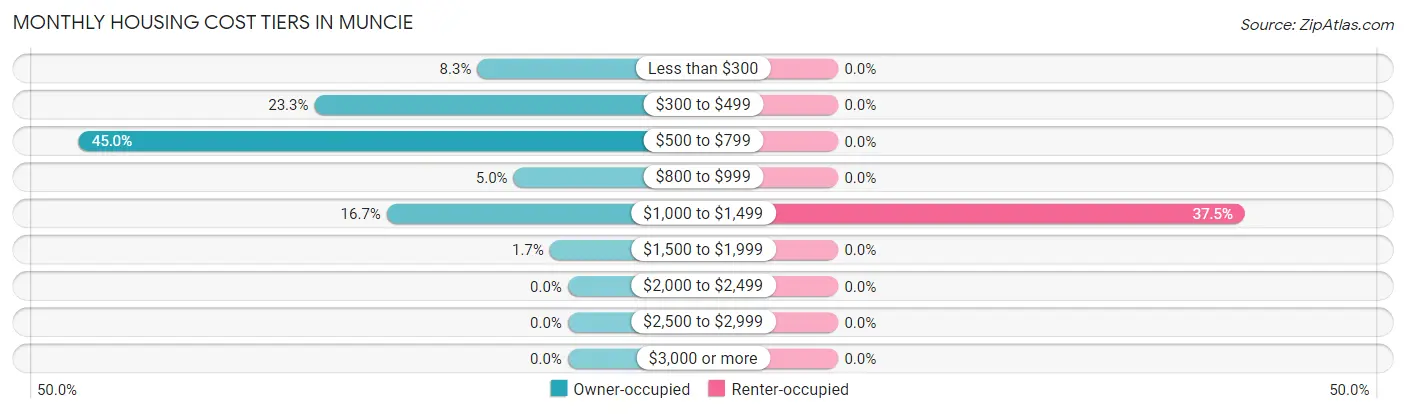
| Monthly Cost | Owner-occupied | Renter-occupied |
| Less than $300 | 5 (8.3%) | 0 (0.0%) |
| $300 to $499 | 14 (23.3%) | 0 (0.0%) |
| $500 to $799 | 27 (45.0%) | 0 (0.0%) |
| $800 to $999 | 3 (5.0%) | 0 (0.0%) |
| $1,000 to $1,499 | 10 (16.7%) | 3 (37.5%) |
| $1,500 to $1,999 | 1 (1.7%) | 0 (0.0%) |
| $2,000 to $2,499 | 0 (0.0%) | 0 (0.0%) |
| $2,500 to $2,999 | 0 (0.0%) | 0 (0.0%) |
| $3,000 or more | 0 (0.0%) | 0 (0.0%) |
| Total | 60 (100.0%) | 8 (100.0%) |
Physical Housing Characteristics in Muncie
Housing Structures in Muncie
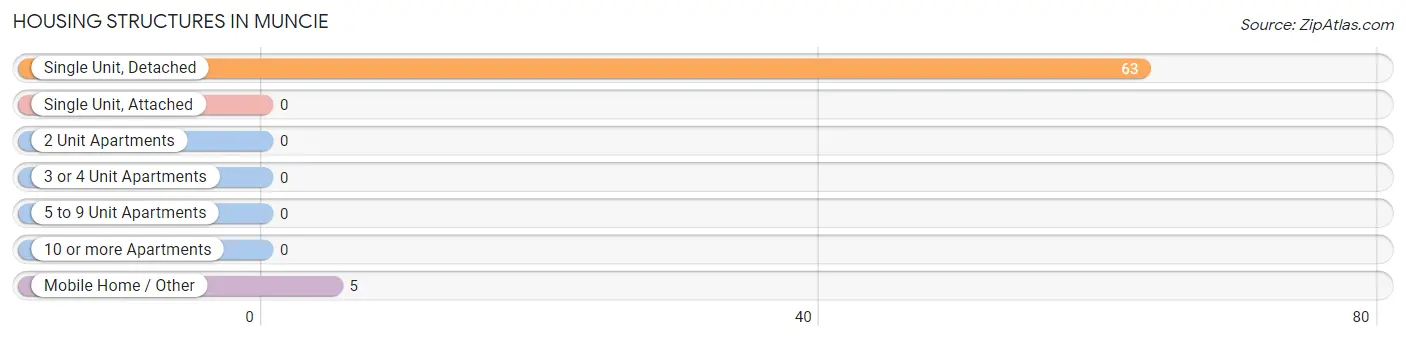
| Structure Type | # Housing Units | % Housing Units |
| Single Unit, Detached | 63 | 92.6% |
| Single Unit, Attached | 0 | 0.0% |
| 2 Unit Apartments | 0 | 0.0% |
| 3 or 4 Unit Apartments | 0 | 0.0% |
| 5 to 9 Unit Apartments | 0 | 0.0% |
| 10 or more Apartments | 0 | 0.0% |
| Mobile Home / Other | 5 | 7.3% |
| Total | 68 | 100.0% |
Housing Structures by Occupancy in Muncie
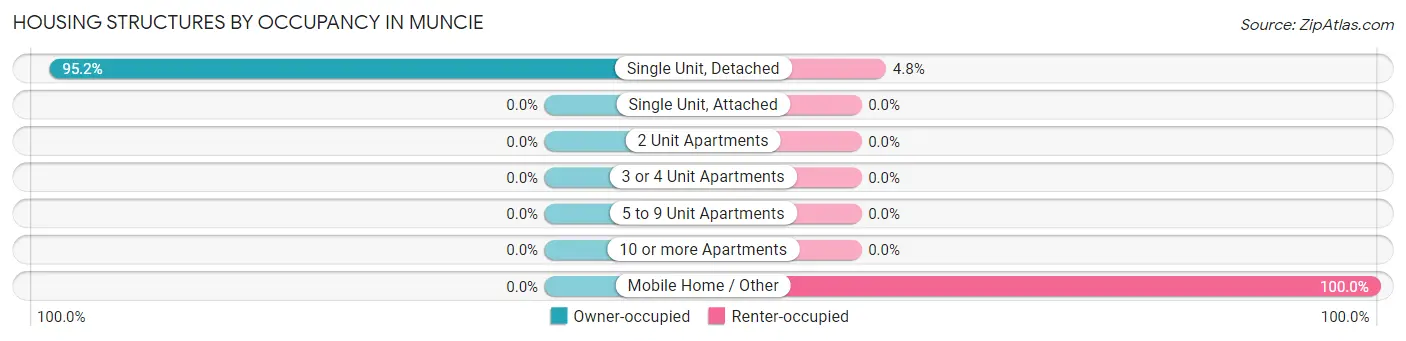
| Structure Type | Owner-occupied | Renter-occupied |
| Single Unit, Detached | 60 (95.2%) | 3 (4.8%) |
| Single Unit, Attached | 0 (0.0%) | 0 (0.0%) |
| 2 Unit Apartments | 0 (0.0%) | 0 (0.0%) |
| 3 or 4 Unit Apartments | 0 (0.0%) | 0 (0.0%) |
| 5 to 9 Unit Apartments | 0 (0.0%) | 0 (0.0%) |
| 10 or more Apartments | 0 (0.0%) | 0 (0.0%) |
| Mobile Home / Other | 0 (0.0%) | 5 (100.0%) |
| Total | 60 (88.2%) | 8 (11.8%) |
Housing Structures by Number of Rooms in Muncie
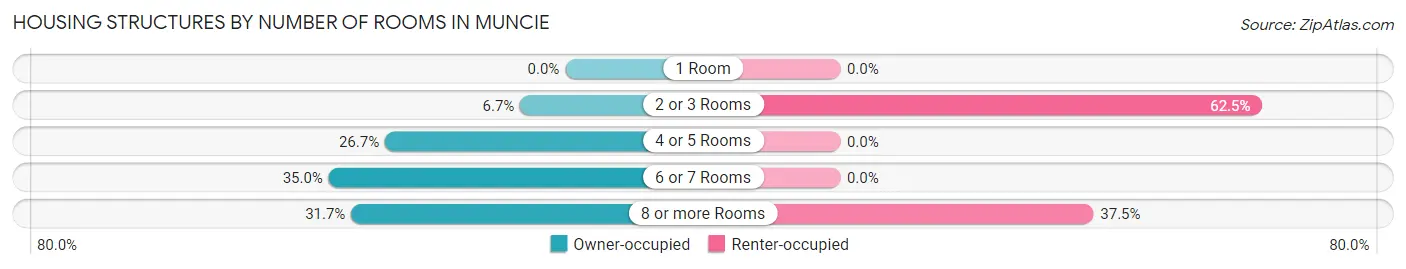
| Number of Rooms | Owner-occupied | Renter-occupied |
| 1 Room | 0 (0.0%) | 0 (0.0%) |
| 2 or 3 Rooms | 4 (6.7%) | 5 (62.5%) |
| 4 or 5 Rooms | 16 (26.7%) | 0 (0.0%) |
| 6 or 7 Rooms | 21 (35.0%) | 0 (0.0%) |
| 8 or more Rooms | 19 (31.7%) | 3 (37.5%) |
| Total | 60 (100.0%) | 8 (100.0%) |
Housing Structure by Heating Type in Muncie
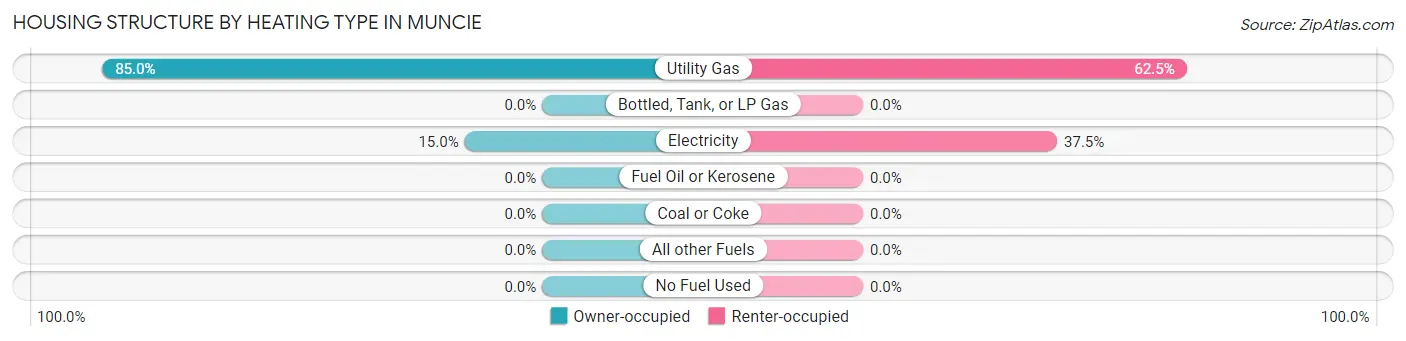
| Heating Type | Owner-occupied | Renter-occupied |
| Utility Gas | 51 (85.0%) | 5 (62.5%) |
| Bottled, Tank, or LP Gas | 0 (0.0%) | 0 (0.0%) |
| Electricity | 9 (15.0%) | 3 (37.5%) |
| Fuel Oil or Kerosene | 0 (0.0%) | 0 (0.0%) |
| Coal or Coke | 0 (0.0%) | 0 (0.0%) |
| All other Fuels | 0 (0.0%) | 0 (0.0%) |
| No Fuel Used | 0 (0.0%) | 0 (0.0%) |
| Total | 60 (100.0%) | 8 (100.0%) |
Household Vehicle Usage in Muncie
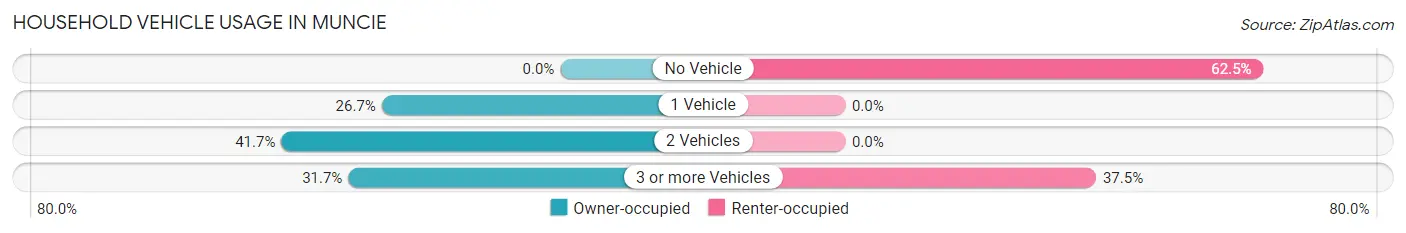
| Vehicles per Household | Owner-occupied | Renter-occupied |
| No Vehicle | 0 (0.0%) | 5 (62.5%) |
| 1 Vehicle | 16 (26.7%) | 0 (0.0%) |
| 2 Vehicles | 25 (41.7%) | 0 (0.0%) |
| 3 or more Vehicles | 19 (31.7%) | 3 (37.5%) |
| Total | 60 (100.0%) | 8 (100.0%) |
Real Estate & Mortgages in Muncie
Real Estate and Mortgage Overview in Muncie
| Characteristic | Without Mortgage | With Mortgage |
| Housing Units | 36 | 24 |
| Median Property Value | $76,000 | $104,200 |
| Median Household Income | $77,500 | $3 |
| Monthly Housing Costs | $480 | $0 |
| Real Estate Taxes | - | - |
Property Value by Mortgage Status in Muncie
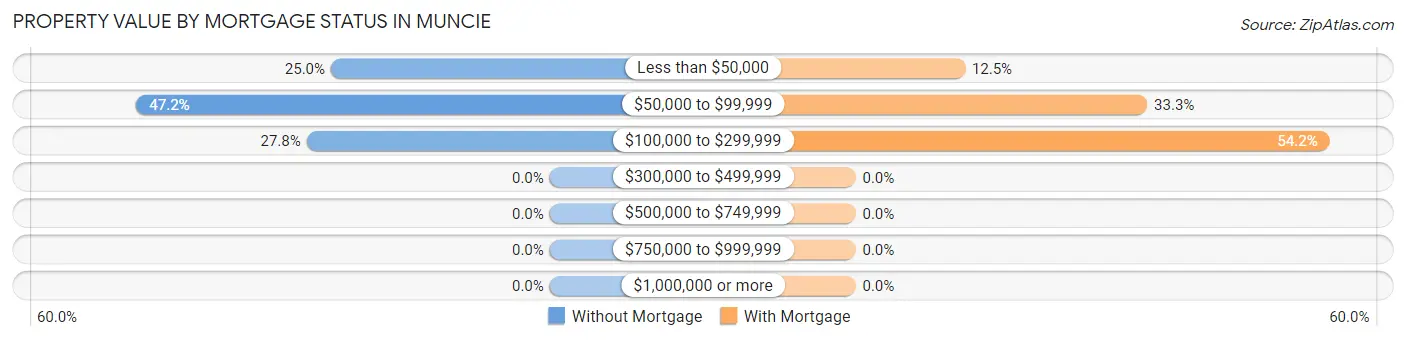
| Property Value | Without Mortgage | With Mortgage |
| Less than $50,000 | 9 (25.0%) | 3 (12.5%) |
| $50,000 to $99,999 | 17 (47.2%) | 8 (33.3%) |
| $100,000 to $299,999 | 10 (27.8%) | 13 (54.2%) |
| $300,000 to $499,999 | 0 (0.0%) | 0 (0.0%) |
| $500,000 to $749,999 | 0 (0.0%) | 0 (0.0%) |
| $750,000 to $999,999 | 0 (0.0%) | 0 (0.0%) |
| $1,000,000 or more | 0 (0.0%) | 0 (0.0%) |
| Total | 36 (100.0%) | 24 (100.0%) |
Household Income by Mortgage Status in Muncie
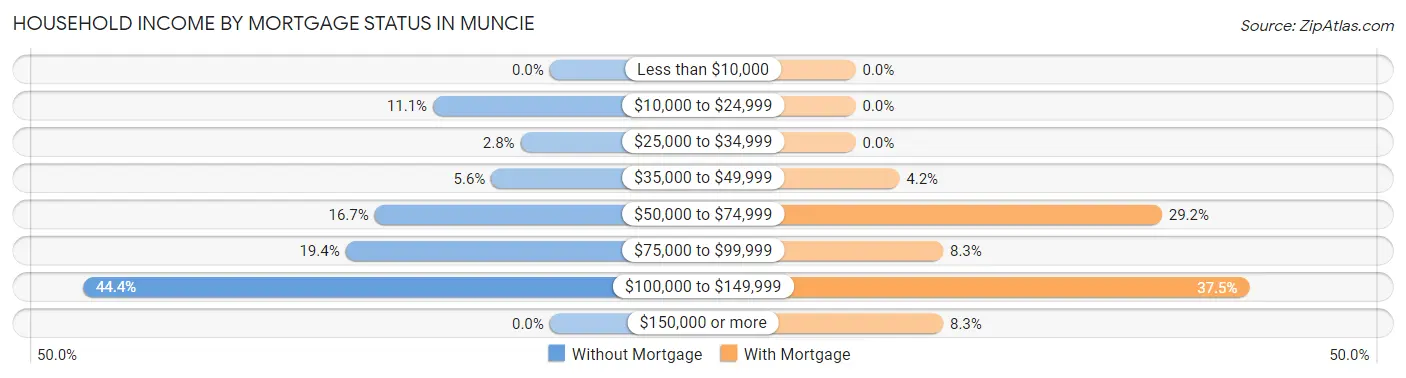
| Household Income | Without Mortgage | With Mortgage |
| Less than $10,000 | 0 (0.0%) | 0 (0.0%) |
| $10,000 to $24,999 | 4 (11.1%) | 0 (0.0%) |
| $25,000 to $34,999 | 1 (2.8%) | 0 (0.0%) |
| $35,000 to $49,999 | 2 (5.6%) | 1 (4.2%) |
| $50,000 to $74,999 | 6 (16.7%) | 7 (29.2%) |
| $75,000 to $99,999 | 7 (19.4%) | 2 (8.3%) |
| $100,000 to $149,999 | 16 (44.4%) | 9 (37.5%) |
| $150,000 or more | 0 (0.0%) | 2 (8.3%) |
| Total | 36 (100.0%) | 24 (100.0%) |
Property Value to Household Income Ratio in Muncie
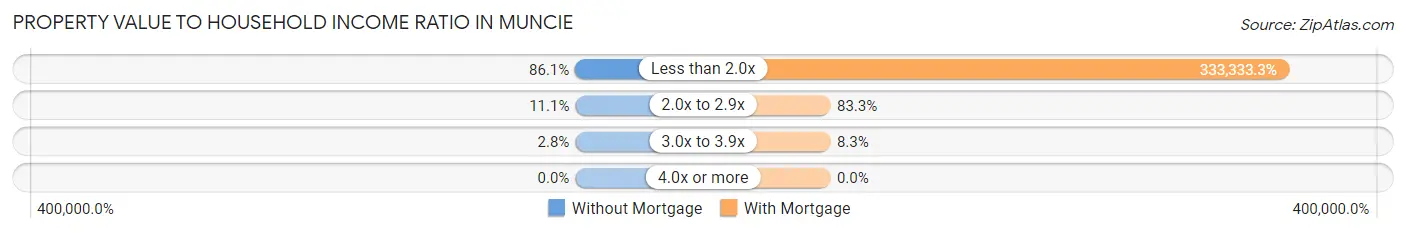
| Value-to-Income Ratio | Without Mortgage | With Mortgage |
| Less than 2.0x | 31 (86.1%) | 80,000 (333,333.3%) |
| 2.0x to 2.9x | 4 (11.1%) | 20 (83.3%) |
| 3.0x to 3.9x | 1 (2.8%) | 2 (8.3%) |
| 4.0x or more | 0 (0.0%) | 0 (0.0%) |
| Total | 36 (100.0%) | 24 (100.0%) |
Real Estate Taxes by Mortgage Status in Muncie
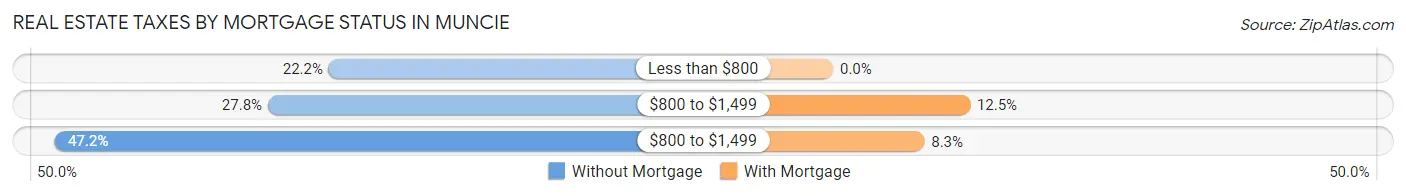
| Property Taxes | Without Mortgage | With Mortgage |
| Less than $800 | 8 (22.2%) | 0 (0.0%) |
| $800 to $1,499 | 10 (27.8%) | 3 (12.5%) |
| $800 to $1,499 | 17 (47.2%) | 2 (8.3%) |
| Total | 36 (100.0%) | 24 (100.0%) |
Health & Disability in Muncie
Health Insurance Coverage by Age in Muncie
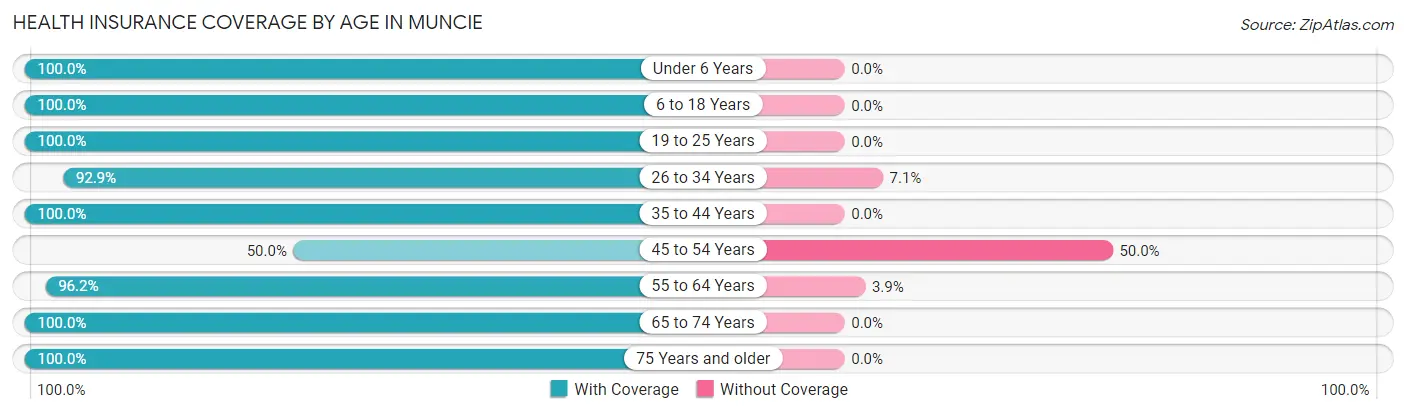
| Age Bracket | With Coverage | Without Coverage |
| Under 6 Years | 4 (100.0%) | 0 (0.0%) |
| 6 to 18 Years | 17 (100.0%) | 0 (0.0%) |
| 19 to 25 Years | 16 (100.0%) | 0 (0.0%) |
| 26 to 34 Years | 13 (92.9%) | 1 (7.1%) |
| 35 to 44 Years | 9 (100.0%) | 0 (0.0%) |
| 45 to 54 Years | 8 (50.0%) | 8 (50.0%) |
| 55 to 64 Years | 25 (96.2%) | 1 (3.8%) |
| 65 to 74 Years | 38 (100.0%) | 0 (0.0%) |
| 75 Years and older | 6 (100.0%) | 0 (0.0%) |
| Total | 136 (93.1%) | 10 (6.9%) |
Health Insurance Coverage by Citizenship Status in Muncie
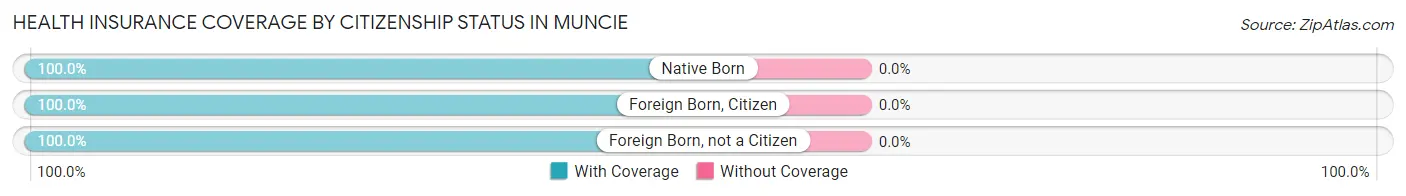
| Citizenship Status | With Coverage | Without Coverage |
| Native Born | 4 (100.0%) | 0 (0.0%) |
| Foreign Born, Citizen | 17 (100.0%) | 0 (0.0%) |
| Foreign Born, not a Citizen | 16 (100.0%) | 0 (0.0%) |
Health Insurance Coverage by Household Income in Muncie
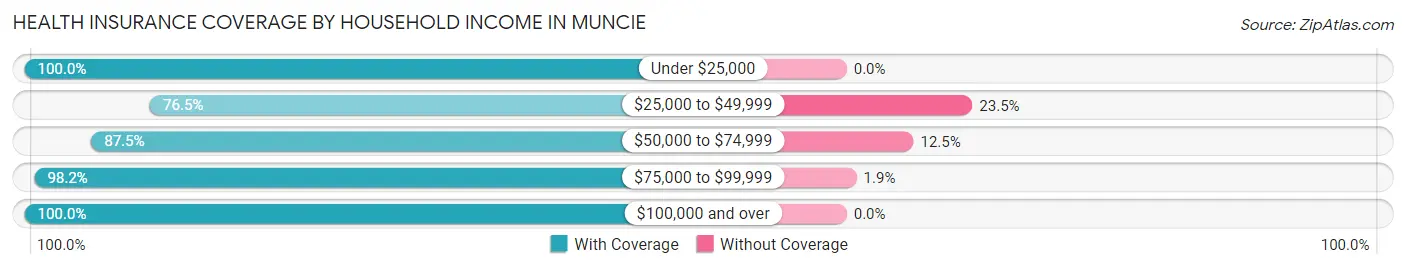
| Household Income | With Coverage | Without Coverage |
| Under $25,000 | 12 (100.0%) | 0 (0.0%) |
| $25,000 to $49,999 | 26 (76.5%) | 8 (23.5%) |
| $50,000 to $74,999 | 7 (87.5%) | 1 (12.5%) |
| $75,000 to $99,999 | 53 (98.2%) | 1 (1.8%) |
| $100,000 and over | 38 (100.0%) | 0 (0.0%) |
Public vs Private Health Insurance Coverage by Age in Muncie
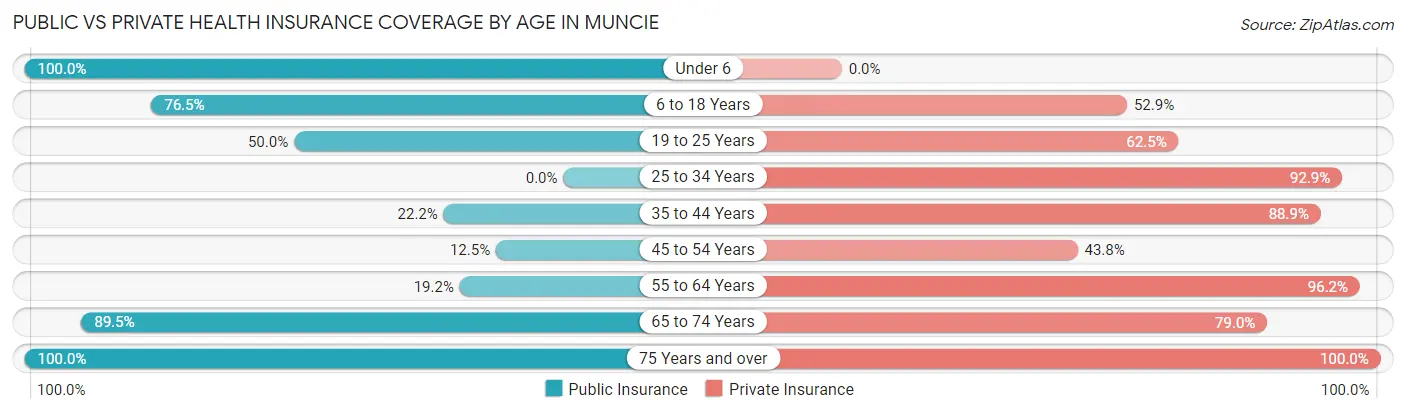
| Age Bracket | Public Insurance | Private Insurance |
| Under 6 | 4 (100.0%) | 0 (0.0%) |
| 6 to 18 Years | 13 (76.5%) | 9 (52.9%) |
| 19 to 25 Years | 8 (50.0%) | 10 (62.5%) |
| 25 to 34 Years | 0 (0.0%) | 13 (92.9%) |
| 35 to 44 Years | 2 (22.2%) | 8 (88.9%) |
| 45 to 54 Years | 2 (12.5%) | 7 (43.8%) |
| 55 to 64 Years | 5 (19.2%) | 25 (96.2%) |
| 65 to 74 Years | 34 (89.5%) | 30 (78.9%) |
| 75 Years and over | 6 (100.0%) | 6 (100.0%) |
| Total | 74 (50.7%) | 108 (74.0%) |
Disability Status by Sex by Age in Muncie
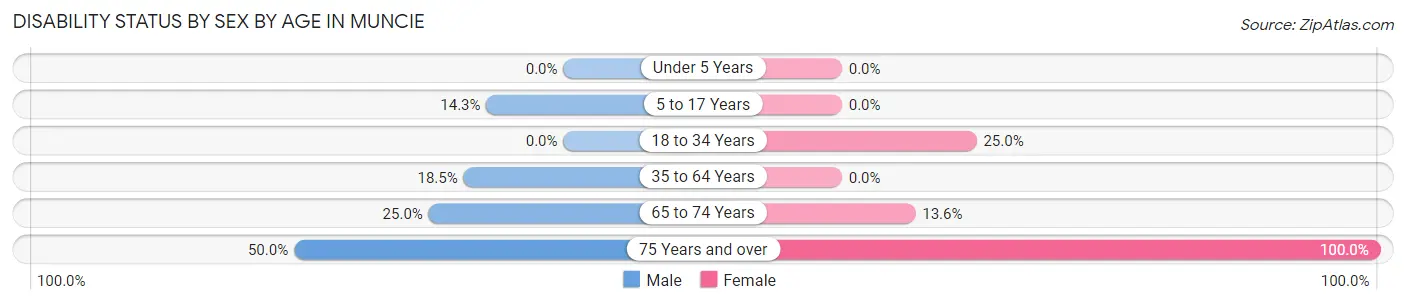
| Age Bracket | Male | Female |
| Under 5 Years | 0 (0.0%) | 0 (0.0%) |
| 5 to 17 Years | 1 (14.3%) | 0 (0.0%) |
| 18 to 34 Years | 0 (0.0%) | 4 (25.0%) |
| 35 to 64 Years | 5 (18.5%) | 0 (0.0%) |
| 65 to 74 Years | 4 (25.0%) | 3 (13.6%) |
| 75 Years and over | 2 (50.0%) | 2 (100.0%) |
Disability Class by Sex by Age in Muncie
Disability Class: Hearing Difficulty
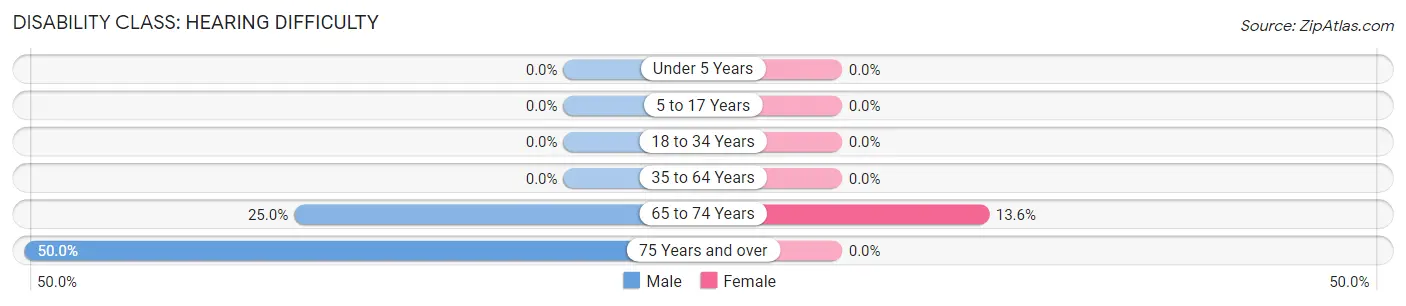
| Age Bracket | Male | Female |
| Under 5 Years | 0 (0.0%) | 0 (0.0%) |
| 5 to 17 Years | 0 (0.0%) | 0 (0.0%) |
| 18 to 34 Years | 0 (0.0%) | 0 (0.0%) |
| 35 to 64 Years | 0 (0.0%) | 0 (0.0%) |
| 65 to 74 Years | 4 (25.0%) | 3 (13.6%) |
| 75 Years and over | 2 (50.0%) | 0 (0.0%) |
Disability Class: Vision Difficulty
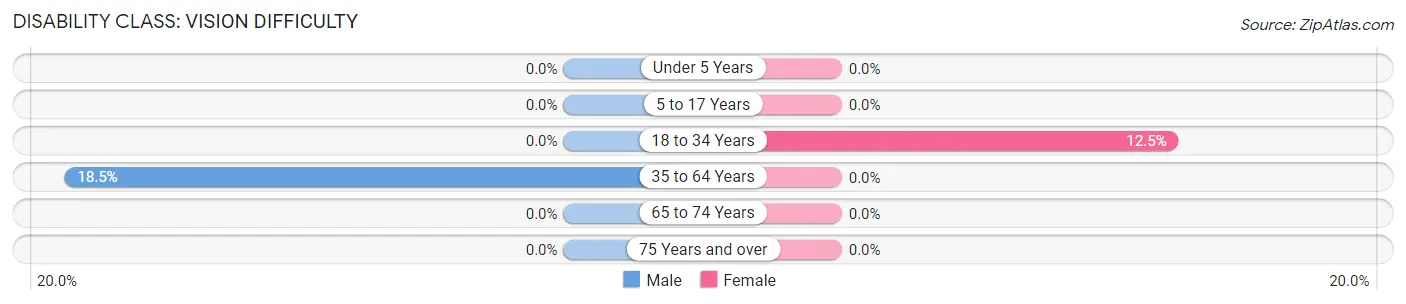
| Age Bracket | Male | Female |
| Under 5 Years | 0 (0.0%) | 0 (0.0%) |
| 5 to 17 Years | 0 (0.0%) | 0 (0.0%) |
| 18 to 34 Years | 0 (0.0%) | 2 (12.5%) |
| 35 to 64 Years | 5 (18.5%) | 0 (0.0%) |
| 65 to 74 Years | 0 (0.0%) | 0 (0.0%) |
| 75 Years and over | 0 (0.0%) | 0 (0.0%) |
Disability Class: Cognitive Difficulty
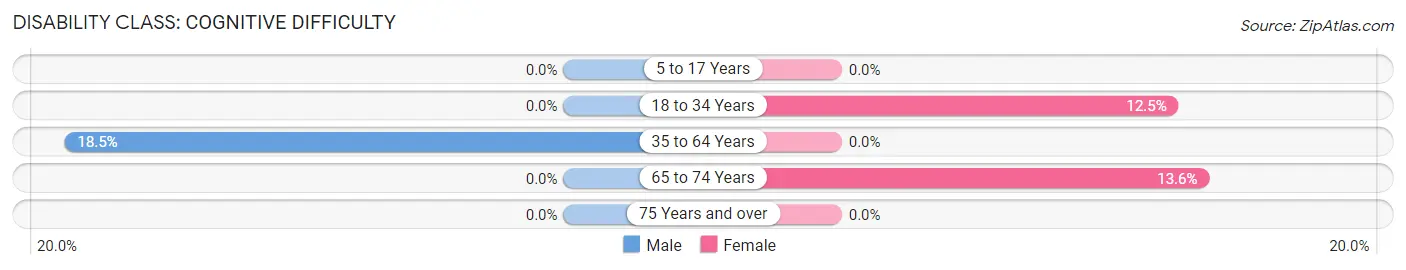
| Age Bracket | Male | Female |
| 5 to 17 Years | 0 (0.0%) | 0 (0.0%) |
| 18 to 34 Years | 0 (0.0%) | 2 (12.5%) |
| 35 to 64 Years | 5 (18.5%) | 0 (0.0%) |
| 65 to 74 Years | 0 (0.0%) | 3 (13.6%) |
| 75 Years and over | 0 (0.0%) | 0 (0.0%) |
Disability Class: Ambulatory Difficulty
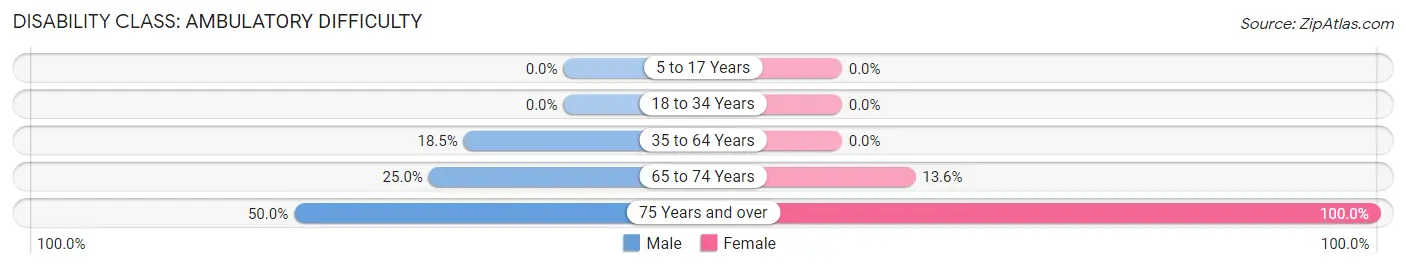
| Age Bracket | Male | Female |
| 5 to 17 Years | 0 (0.0%) | 0 (0.0%) |
| 18 to 34 Years | 0 (0.0%) | 0 (0.0%) |
| 35 to 64 Years | 5 (18.5%) | 0 (0.0%) |
| 65 to 74 Years | 4 (25.0%) | 3 (13.6%) |
| 75 Years and over | 2 (50.0%) | 2 (100.0%) |
Disability Class: Self-Care Difficulty
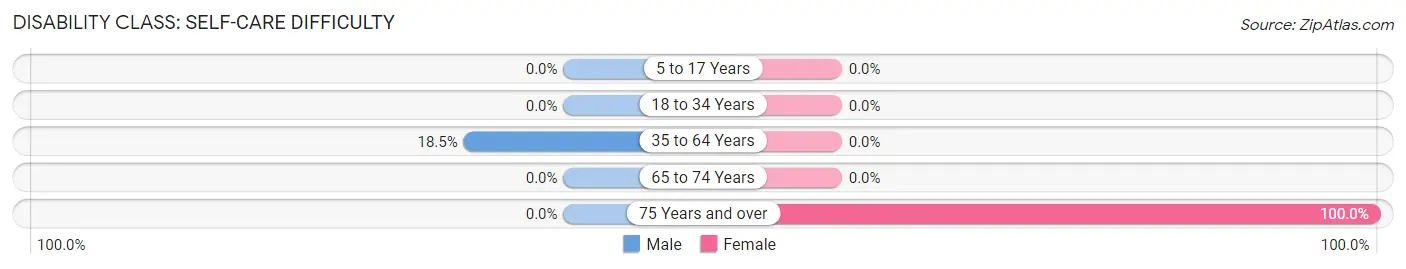
| Age Bracket | Male | Female |
| 5 to 17 Years | 0 (0.0%) | 0 (0.0%) |
| 18 to 34 Years | 0 (0.0%) | 0 (0.0%) |
| 35 to 64 Years | 5 (18.5%) | 0 (0.0%) |
| 65 to 74 Years | 0 (0.0%) | 0 (0.0%) |
| 75 Years and over | 0 (0.0%) | 2 (100.0%) |
Technology Access in Muncie
Computing Device Access in Muncie
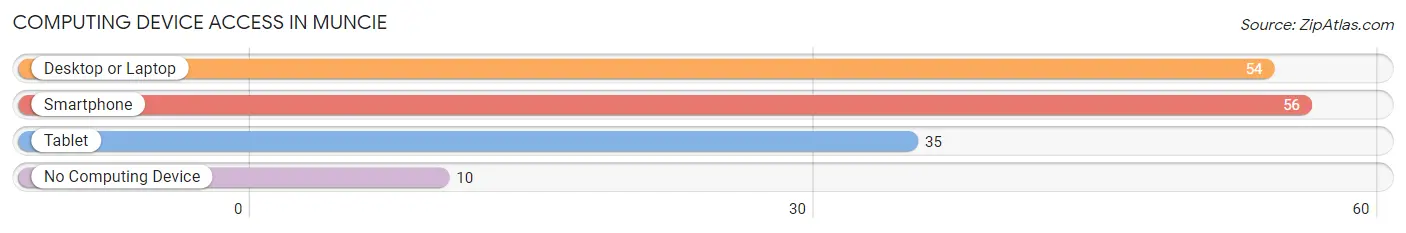
| Device Type | # Households | % Households |
| Desktop or Laptop | 54 | 79.4% |
| Smartphone | 56 | 82.4% |
| Tablet | 35 | 51.5% |
| No Computing Device | 10 | 14.7% |
| Total | 68 | 100.0% |
Internet Access in Muncie
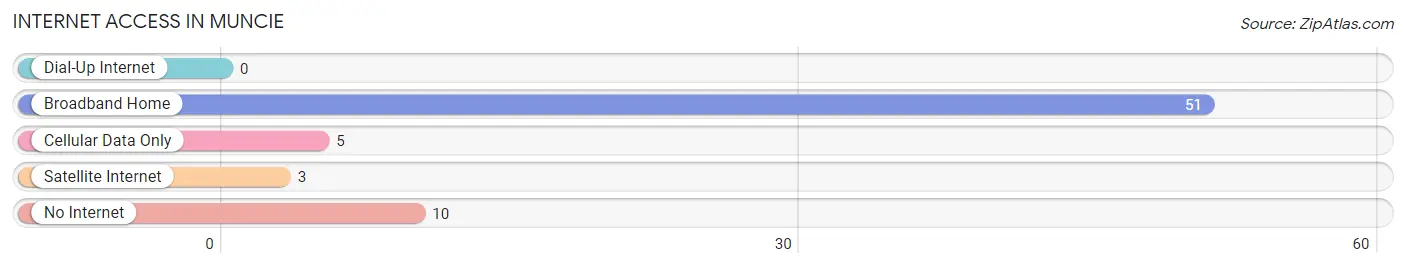
| Internet Type | # Households | % Households |
| Dial-Up Internet | 0 | 0.0% |
| Broadband Home | 51 | 75.0% |
| Cellular Data Only | 5 | 7.3% |
| Satellite Internet | 3 | 4.4% |
| No Internet | 10 | 14.7% |
| Total | 68 | 100.0% |
Muncie Summary
Muncie, Indiana is a city located in Delaware County, Indiana, United States. It is the county seat of Delaware County and the principal city of the Muncie metropolitan statistical area, which has a population of 118,769. The city is situated in east-central Indiana, about 50 miles northeast of Indianapolis.
History
Muncie was founded in 1827 by a group of settlers from the nearby town of Munsee. The town was named after the Munsee Indians, who had lived in the area for centuries. The first settlers were mostly Quakers, who established a small trading post and a few farms. The town grew slowly until the arrival of the railroad in 1851, which spurred rapid growth. By the late 19th century, Muncie had become a major industrial center, with several factories producing a variety of products, including glass, furniture, and automobiles.
In the early 20th century, Muncie was a major center of the Ku Klux Klan, and the city was the site of several violent clashes between the Klan and its opponents. In the 1950s, Muncie was the site of a major civil rights struggle, as African Americans sought to gain access to public facilities and services. The struggle was successful, and Muncie became a more integrated city.
Geography
Muncie is located in east-central Indiana, about 50 miles northeast of Indianapolis. The city is situated in the White River Valley, which is part of the Great Lakes region. The city is surrounded by rolling hills and farmland, and is located near several major highways, including Interstate 69 and U.S. Route 35.
The city has a total area of 24.3 square miles, of which 24.2 square miles is land and 0.1 square miles is water. The White River runs through the city, and there are several small lakes and ponds in the area.
Economy
Muncie’s economy is largely based on manufacturing and healthcare. The city is home to several major employers, including Ball State University, IU Health Ball Memorial Hospital, and BorgWarner. Other major employers include the Muncie Community Schools, the Muncie Sanitary District, and the Muncie Power Plant.
The city also has a vibrant small business sector, with many locally owned restaurants, shops, and other businesses. The city is also home to several large retail stores, including Walmart, Target, and Kohl’s.
Demographics
As of the 2010 census, the population of Muncie was 70,085. The racial makeup of the city was 79.2% White, 15.2% African American, 0.4% Native American, 1.2% Asian, 0.1% Pacific Islander, 1.3% from other races, and 2.7% from two or more races. Hispanic or Latino of any race were 4.2% of the population.
The median income for a household in the city was $35,945, and the median income for a family was $45,945. The per capita income for the city was $19,945. About 17.2% of families and 21.3% of the population were below the poverty line, including 28.3% of those under age 18 and 8.7% of those age 65 or over.
Common Questions
What is Per Capita Income in Muncie?
Per Capita income in Muncie is $34,716.
What is the Median Family Income in Muncie?
Median Family Income in Muncie is $81,875.
What is the Median Household income in Muncie?
Median Household Income in Muncie is $76,500.
What is Inequality or Gini Index in Muncie?
Inequality or Gini Index in Muncie is 0.31.
What is the Total Population of Muncie?
Total Population of Muncie is 146.
What is the Total Male Population of Muncie?
Total Male Population of Muncie is 75.
What is the Total Female Population of Muncie?
Total Female Population of Muncie is 71.
What is the Ratio of Males per 100 Females in Muncie?
There are 105.63 Males per 100 Females in Muncie.
What is the Ratio of Females per 100 Males in Muncie?
There are 94.67 Females per 100 Males in Muncie.
What is the Median Population Age in Muncie?
Median Population Age in Muncie is 54.3 Years.
What is the Average Family Size in Muncie
Average Family Size in Muncie is 3.0 People.
What is the Average Household Size in Muncie
Average Household Size in Muncie is 2.1 People.
How Large is the Labor Force in Muncie?
There are 83 People in the Labor Forcein in Muncie.
What is the Percentage of People in the Labor Force in Muncie?
62.4% of People are in the Labor Force in Muncie.
What is the Unemployment Rate in Muncie?
Unemployment Rate in Muncie is 7.2%.