Mount Morris, IL Map & Demographics
Mount Morris Map
Mount Morris Overview
$29,701
PER CAPITA INCOME
$64,139
AVG FAMILY INCOME
$38,359
AVG HOUSEHOLD INCOME
13.9%
WAGE / INCOME GAP [ % ]
86.1¢/ $1
WAGE / INCOME GAP [ $ ]
0.45
INEQUALITY / GINI INDEX
2,853
TOTAL POPULATION
1,275
MALE POPULATION
1,578
FEMALE POPULATION
80.80
MALES / 100 FEMALES
123.76
FEMALES / 100 MALES
45.7
MEDIAN AGE
3.0
AVG FAMILY SIZE
1.9
AVG HOUSEHOLD SIZE
1,267
LABOR FORCE [ PEOPLE ]
59.5%
PERCENT IN LABOR FORCE
5.0%
UNEMPLOYMENT RATE
Mount Morris Zip Codes
Income in Mount Morris
Income Overview in Mount Morris
Per Capita Income in Mount Morris is $29,701, while median incomes of families and households are $64,139 and $38,359 respectively.
| Characteristic | Number | Measure |
| Per Capita Income | 2,853 | $29,701 |
| Median Family Income | 594 | $64,139 |
| Mean Family Income | 594 | $82,995 |
| Median Household Income | 1,401 | $38,359 |
| Mean Household Income | 1,401 | $58,055 |
| Income Deficit | 594 | $0 |
| Wage / Income Gap (%) | 2,853 | 13.92% |
| Wage / Income Gap ($) | 2,853 | 86.08¢ per $1 |
| Gini / Inequality Index | 2,853 | 0.45 |
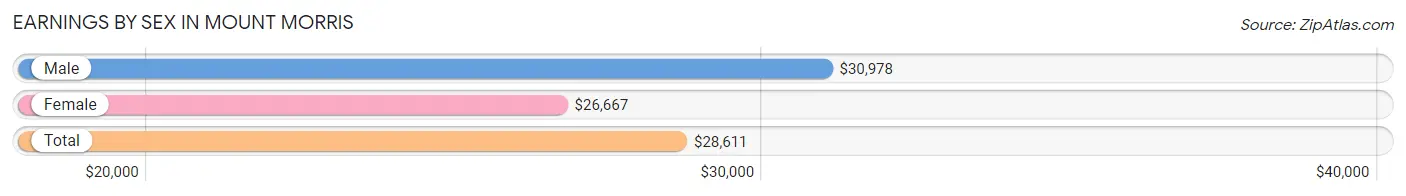
Earnings by Sex in Mount Morris
Average Earnings in Mount Morris are $28,611, $30,978 for men and $26,667 for women, a difference of 13.9%.
| Sex | Number | Average Earnings |
| Male | 692 (51.6%) | $30,978 |
| Female | 650 (48.4%) | $26,667 |
| Total | 1,342 (100.0%) | $28,611 |
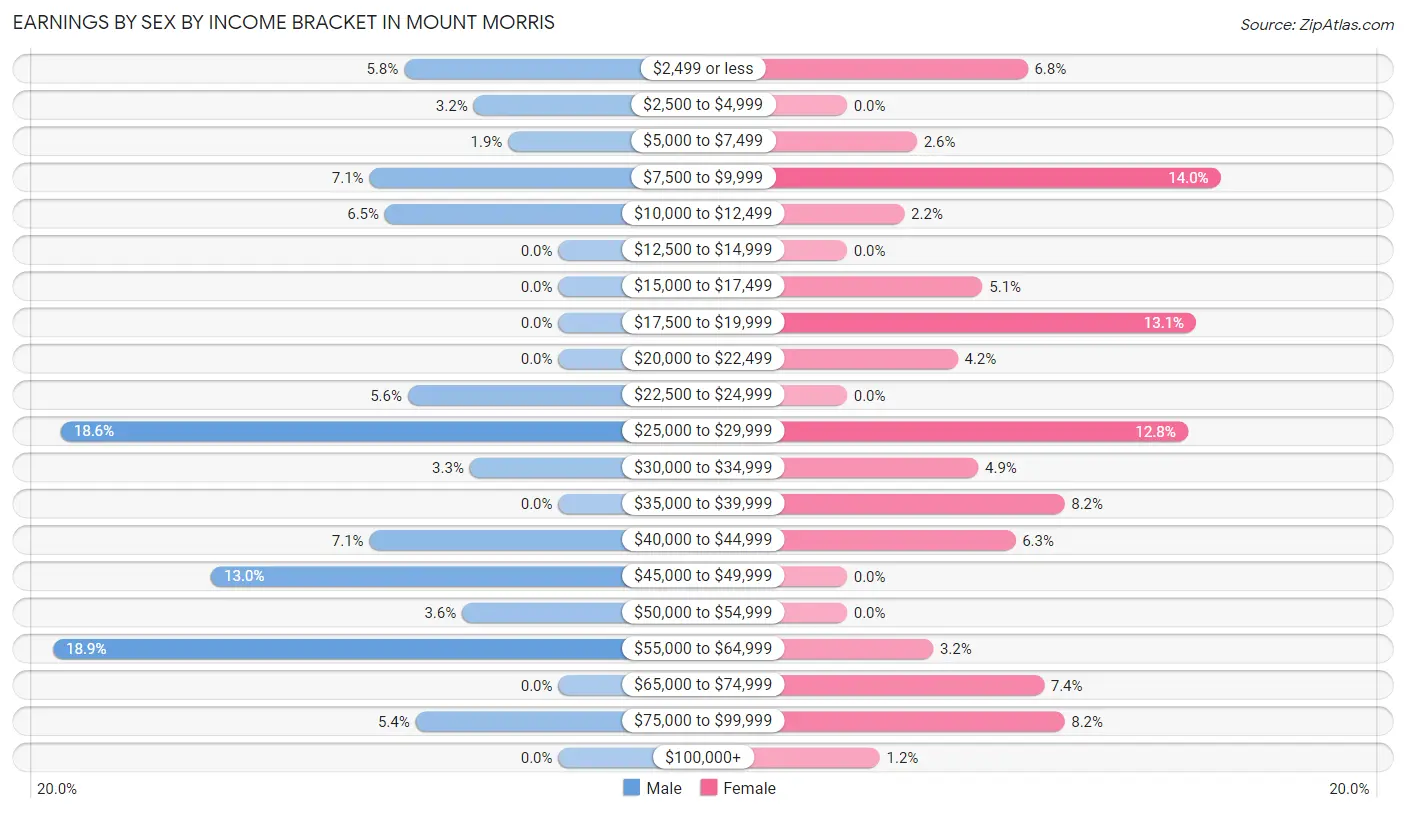
Earnings by Sex by Income Bracket in Mount Morris
The most common earnings brackets in Mount Morris are $55,000 to $64,999 for men (131 | 18.9%) and $7,500 to $9,999 for women (91 | 14.0%).
| Income | Male | Female |
| $2,499 or less | 40 (5.8%) | 44 (6.8%) |
| $2,500 to $4,999 | 22 (3.2%) | 0 (0.0%) |
| $5,000 to $7,499 | 13 (1.9%) | 17 (2.6%) |
| $7,500 to $9,999 | 49 (7.1%) | 91 (14.0%) |
| $10,000 to $12,499 | 45 (6.5%) | 14 (2.1%) |
| $12,500 to $14,999 | 0 (0.0%) | 0 (0.0%) |
| $15,000 to $17,499 | 0 (0.0%) | 33 (5.1%) |
| $17,500 to $19,999 | 0 (0.0%) | 85 (13.1%) |
| $20,000 to $22,499 | 0 (0.0%) | 27 (4.2%) |
| $22,500 to $24,999 | 39 (5.6%) | 0 (0.0%) |
| $25,000 to $29,999 | 129 (18.6%) | 83 (12.8%) |
| $30,000 to $34,999 | 23 (3.3%) | 32 (4.9%) |
| $35,000 to $39,999 | 0 (0.0%) | 53 (8.2%) |
| $40,000 to $44,999 | 49 (7.1%) | 41 (6.3%) |
| $45,000 to $49,999 | 90 (13.0%) | 0 (0.0%) |
| $50,000 to $54,999 | 25 (3.6%) | 0 (0.0%) |
| $55,000 to $64,999 | 131 (18.9%) | 21 (3.2%) |
| $65,000 to $74,999 | 0 (0.0%) | 48 (7.4%) |
| $75,000 to $99,999 | 37 (5.3%) | 53 (8.2%) |
| $100,000+ | 0 (0.0%) | 8 (1.2%) |
| Total | 692 (100.0%) | 650 (100.0%) |
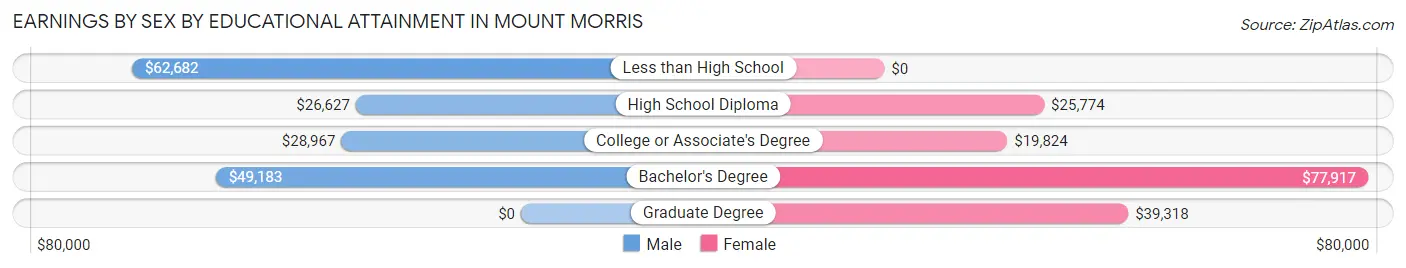
Earnings by Sex by Educational Attainment in Mount Morris
Average earnings in Mount Morris are $30,978 for men and $28,306 for women, a difference of 8.6%. Men with an educational attainment of less than high school enjoy the highest average annual earnings of $62,682, while those with high school diploma education earn the least with $26,627. Women with an educational attainment of bachelor's degree earn the most with the average annual earnings of $77,917, while those with college or associate's degree education have the smallest earnings of $19,824.
| Educational Attainment | Male Income | Female Income |
| Less than High School | $62,682 | $0 |
| High School Diploma | $26,627 | $25,774 |
| College or Associate's Degree | $28,967 | $19,824 |
| Bachelor's Degree | $49,183 | $77,917 |
| Graduate Degree | - | - |
| Total | $30,978 | $28,306 |
Family Income in Mount Morris
Family Income Brackets in Mount Morris
According to the Mount Morris family income data, there are 112 families falling into the $15,000 to $24,999 income range, which is the most common income bracket and makes up 18.9% of all families.
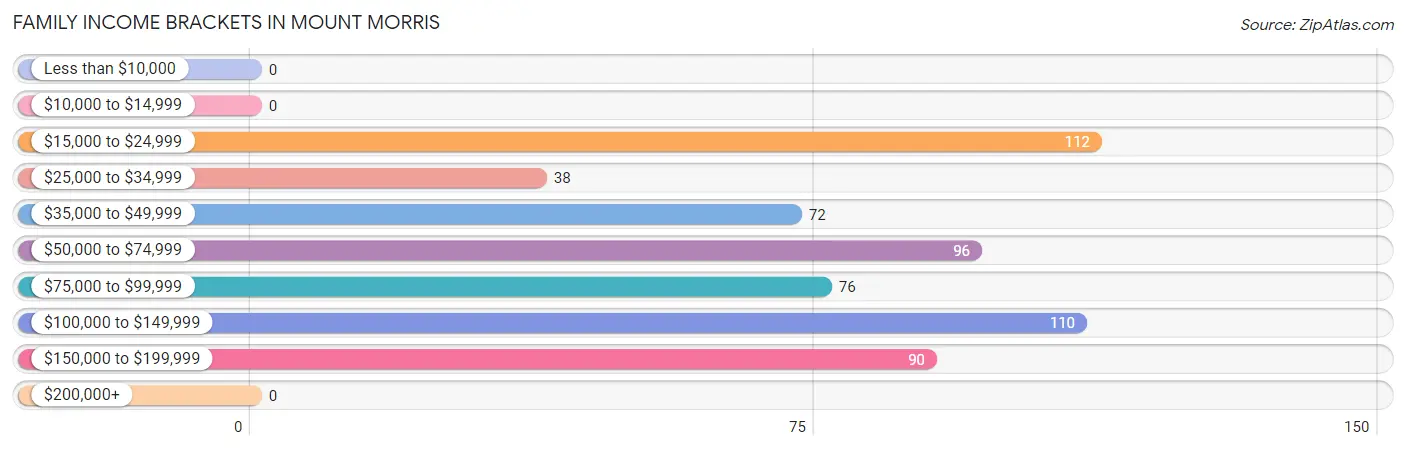
| Income Bracket | # Families | % Families |
| Less than $10,000 | 0 | 0.0% |
| $10,000 to $14,999 | 0 | 0.0% |
| $15,000 to $24,999 | 112 | 18.9% |
| $25,000 to $34,999 | 38 | 6.4% |
| $35,000 to $49,999 | 72 | 12.1% |
| $50,000 to $74,999 | 96 | 16.2% |
| $75,000 to $99,999 | 76 | 12.8% |
| $100,000 to $149,999 | 110 | 18.5% |
| $150,000 to $199,999 | 90 | 15.2% |
| $200,000+ | 0 | 0.0% |
Family Income by Famaliy Size in Mount Morris
2-person families (347 | 58.4%) account for the highest median family income in Mount Morris with $64,693 per family, while 2-person families (347 | 58.4%) have the highest median income of $32,346 per family member.
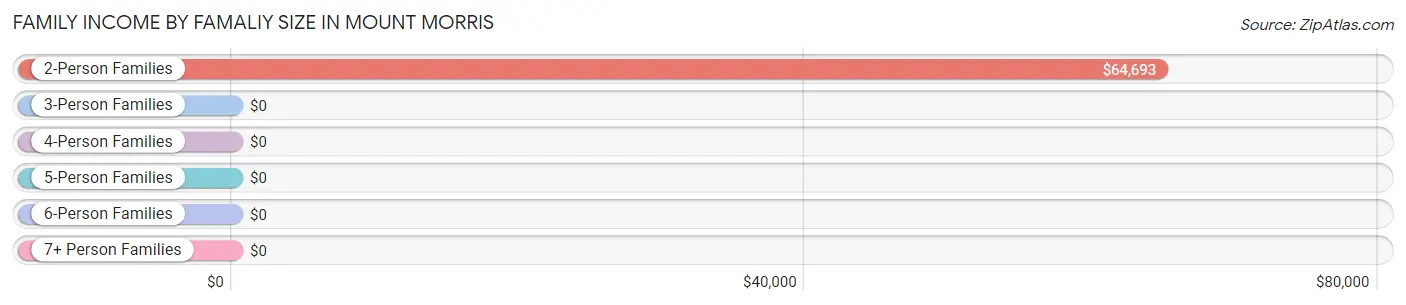
| Income Bracket | # Families | Median Income |
| 2-Person Families | 347 (58.4%) | $64,693 |
| 3-Person Families | 124 (20.9%) | $0 |
| 4-Person Families | 21 (3.5%) | $0 |
| 5-Person Families | 46 (7.7%) | $0 |
| 6-Person Families | 56 (9.4%) | $0 |
| 7+ Person Families | 0 (0.0%) | $0 |
| Total | 594 (100.0%) | $64,139 |
Family Income by Number of Earners in Mount Morris
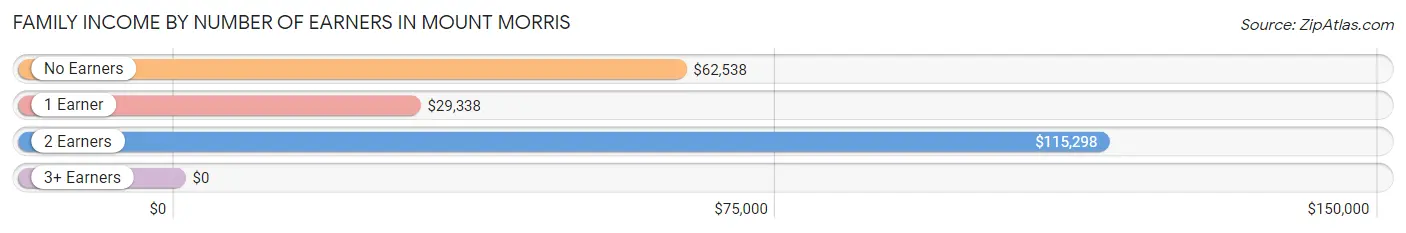
| Number of Earners | # Families | Median Income |
| No Earners | 65 (10.9%) | $62,538 |
| 1 Earner | 221 (37.2%) | $29,338 |
| 2 Earners | 259 (43.6%) | $115,298 |
| 3+ Earners | 49 (8.3%) | $0 |
| Total | 594 (100.0%) | $64,139 |
Household Income in Mount Morris
Household Income Brackets in Mount Morris
With 359 households falling in the category, the $15,000 to $24,999 income range is the most frequent in Mount Morris, accounting for 25.6% of all households.
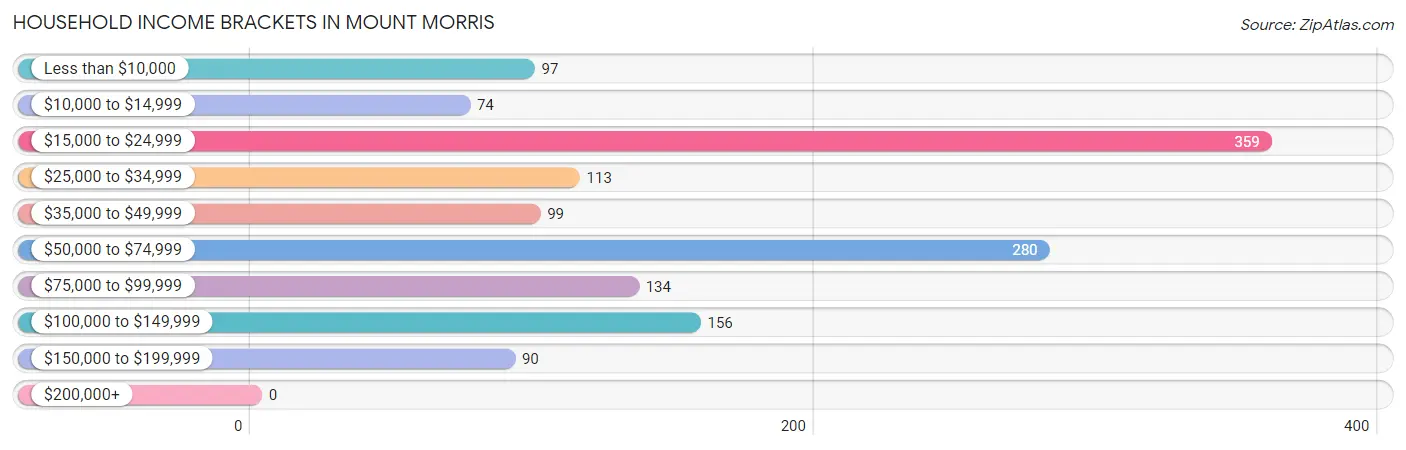
| Income Bracket | # Households | % Households |
| Less than $10,000 | 97 | 6.9% |
| $10,000 to $14,999 | 74 | 5.3% |
| $15,000 to $24,999 | 359 | 25.6% |
| $25,000 to $34,999 | 113 | 8.1% |
| $35,000 to $49,999 | 99 | 7.1% |
| $50,000 to $74,999 | 280 | 20.0% |
| $75,000 to $99,999 | 134 | 9.6% |
| $100,000 to $149,999 | 156 | 11.1% |
| $150,000 to $199,999 | 90 | 6.4% |
| $200,000+ | 0 | 0.0% |
Household Income by Householder Age in Mount Morris
The median household income in Mount Morris is $38,359, with the highest median household income of $63,750 found in the 25 to 44 years age bracket for the primary householder. A total of 349 households (24.9%) fall into this category. Meanwhile, the 15 to 24 years age bracket for the primary householder has the lowest median household income of $0, with 54 households (3.8%) in this group.
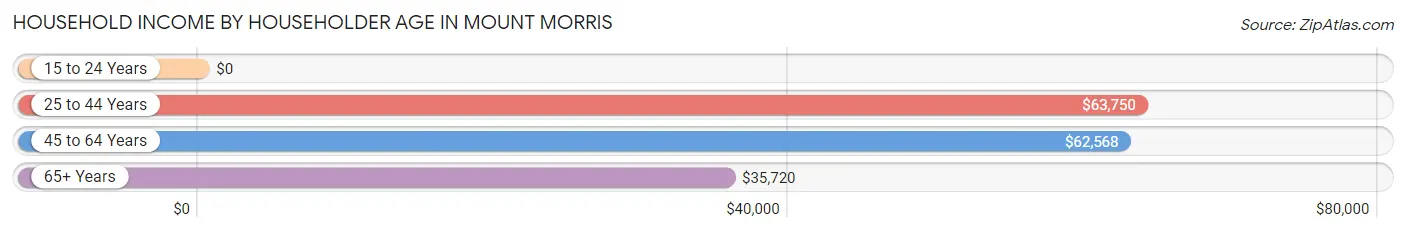
| Income Bracket | # Households | Median Income |
| 15 to 24 Years | 54 (3.8%) | $0 |
| 25 to 44 Years | 349 (24.9%) | $63,750 |
| 45 to 64 Years | 345 (24.6%) | $62,568 |
| 65+ Years | 653 (46.6%) | $35,720 |
| Total | 1,401 (100.0%) | $38,359 |
Poverty in Mount Morris
Income Below Poverty by Sex and Age in Mount Morris
With 18.0% poverty level for males and 17.5% for females among the residents of Mount Morris, 6 to 11 year old males and 6 to 11 year old females are the most vulnerable to poverty, with 39 males (100.0%) and 64 females (52.5%) in their respective age groups living below the poverty level.
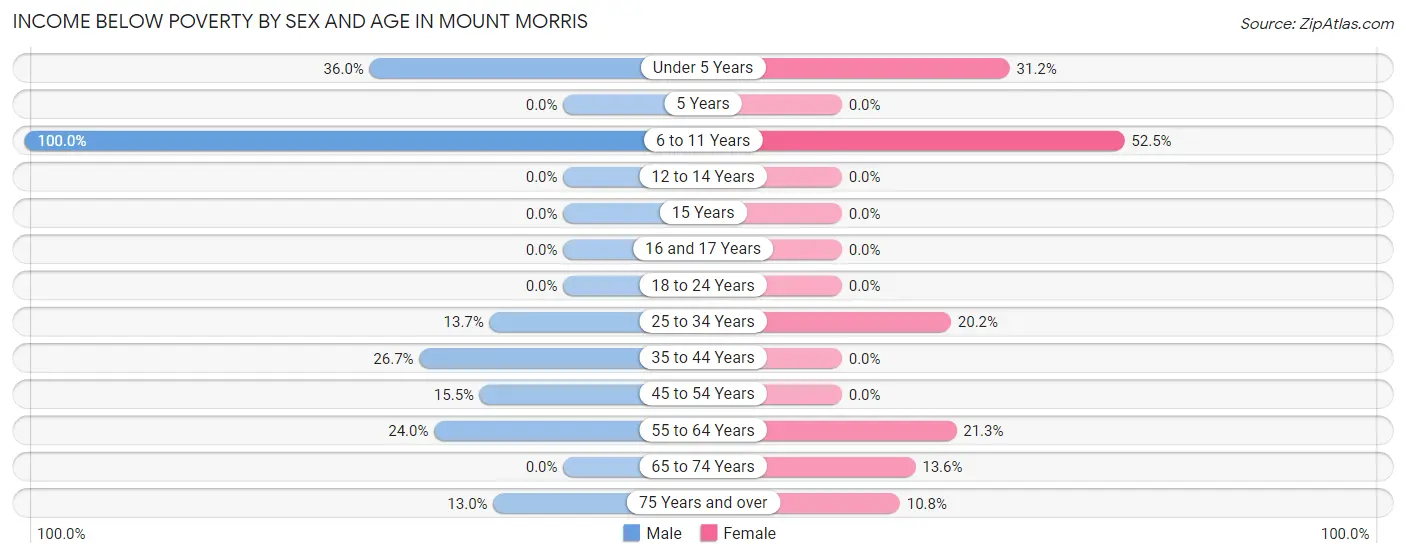
| Age Bracket | Male | Female |
| Under 5 Years | 55 (35.9%) | 81 (31.1%) |
| 5 Years | 0 (0.0%) | 0 (0.0%) |
| 6 to 11 Years | 39 (100.0%) | 64 (52.5%) |
| 12 to 14 Years | 0 (0.0%) | 0 (0.0%) |
| 15 Years | 0 (0.0%) | 0 (0.0%) |
| 16 and 17 Years | 0 (0.0%) | 0 (0.0%) |
| 18 to 24 Years | 0 (0.0%) | 0 (0.0%) |
| 25 to 34 Years | 23 (13.7%) | 50 (20.2%) |
| 35 to 44 Years | 35 (26.7%) | 0 (0.0%) |
| 45 to 54 Years | 22 (15.5%) | 0 (0.0%) |
| 55 to 64 Years | 23 (24.0%) | 17 (21.2%) |
| 65 to 74 Years | 0 (0.0%) | 18 (13.6%) |
| 75 Years and over | 17 (13.0%) | 32 (10.8%) |
| Total | 214 (18.0%) | 262 (17.5%) |
Income Above Poverty by Sex and Age in Mount Morris
According to the poverty statistics in Mount Morris, males aged 5 years and females aged 12 to 14 years are the age groups that are most secure financially, with 100.0% of males and 100.0% of females in these age groups living above the poverty line.
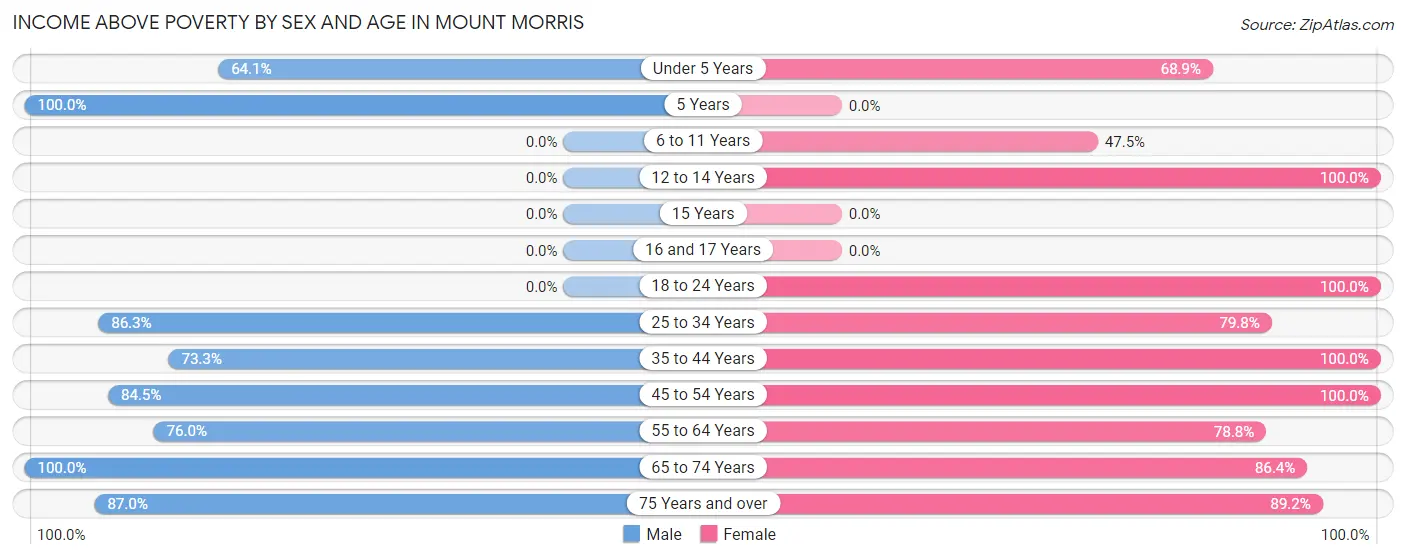
| Age Bracket | Male | Female |
| Under 5 Years | 98 (64.0%) | 179 (68.9%) |
| 5 Years | 69 (100.0%) | 0 (0.0%) |
| 6 to 11 Years | 0 (0.0%) | 58 (47.5%) |
| 12 to 14 Years | 0 (0.0%) | 26 (100.0%) |
| 15 Years | 0 (0.0%) | 0 (0.0%) |
| 16 and 17 Years | 0 (0.0%) | 0 (0.0%) |
| 18 to 24 Years | 0 (0.0%) | 54 (100.0%) |
| 25 to 34 Years | 145 (86.3%) | 197 (79.8%) |
| 35 to 44 Years | 96 (73.3%) | 73 (100.0%) |
| 45 to 54 Years | 120 (84.5%) | 203 (100.0%) |
| 55 to 64 Years | 73 (76.0%) | 63 (78.7%) |
| 65 to 74 Years | 260 (100.0%) | 114 (86.4%) |
| 75 Years and over | 114 (87.0%) | 265 (89.2%) |
| Total | 975 (82.0%) | 1,232 (82.5%) |
Income Below Poverty Among Married-Couple Families in Mount Morris
The poverty statistics for married-couple families in Mount Morris show that 14.2% or 58 of the total 409 families live below the poverty line. Families with 3 or 4 children have the highest poverty rate of 56.9%, comprising of 58 families. On the other hand, families with no children have the lowest poverty rate of 0.0%, which includes 0 families.
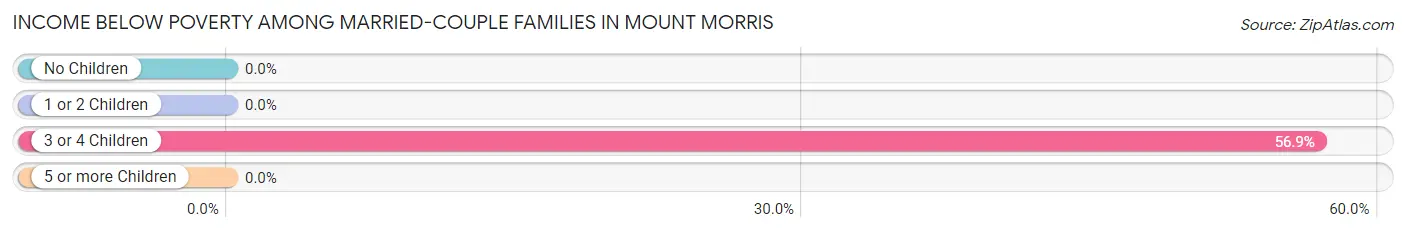
| Children | Above Poverty | Below Poverty |
| No Children | 286 (100.0%) | 0 (0.0%) |
| 1 or 2 Children | 21 (100.0%) | 0 (0.0%) |
| 3 or 4 Children | 44 (43.1%) | 58 (56.9%) |
| 5 or more Children | 0 (0.0%) | 0 (0.0%) |
| Total | 351 (85.8%) | 58 (14.2%) |
Income Below Poverty Among Single-Parent Households in Mount Morris
| Children | Single Father | Single Mother |
| No Children | 0 (0.0%) | 0 (0.0%) |
| 1 or 2 Children | 0 (0.0%) | 0 (0.0%) |
| 3 or 4 Children | 0 (0.0%) | 0 (0.0%) |
| 5 or more Children | 0 (0.0%) | 0 (0.0%) |
| Total | 0 (0.0%) | 0 (0.0%) |
Income Below Poverty Among Married-Couple vs Single-Parent Households in Mount Morris
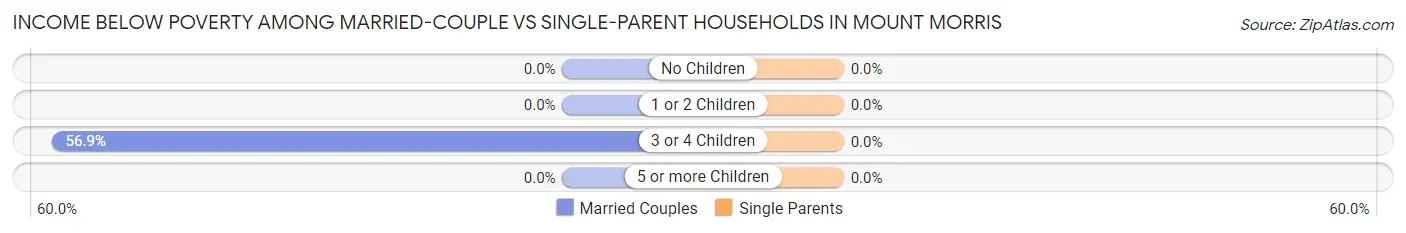
| Children | Married-Couple Families | Single-Parent Households |
| No Children | 0 (0.0%) | 0 (0.0%) |
| 1 or 2 Children | 0 (0.0%) | 0 (0.0%) |
| 3 or 4 Children | 58 (56.9%) | 0 (0.0%) |
| 5 or more Children | 0 (0.0%) | 0 (0.0%) |
| Total | 58 (14.2%) | 0 (0.0%) |
Race in Mount Morris
The most populous races in Mount Morris are White / Caucasian (2,762 | 96.8%), Hispanic or Latino (100 | 3.5%), and Black / African American (48 | 1.7%).
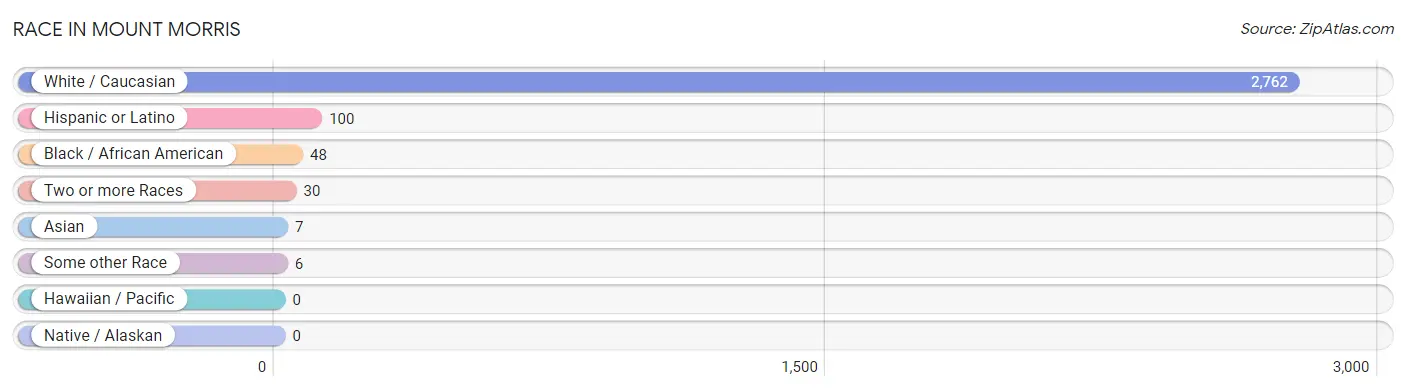
| Race | # Population | % Population |
| Asian | 7 | 0.3% |
| Black / African American | 48 | 1.7% |
| Hawaiian / Pacific | 0 | 0.0% |
| Hispanic or Latino | 100 | 3.5% |
| Native / Alaskan | 0 | 0.0% |
| White / Caucasian | 2,762 | 96.8% |
| Two or more Races | 30 | 1.1% |
| Some other Race | 6 | 0.2% |
| Total | 2,853 | 100.0% |
Ancestry in Mount Morris
The most populous ancestries reported in Mount Morris are German (1,066 | 37.4%), Irish (544 | 19.1%), Norwegian (369 | 12.9%), Italian (304 | 10.7%), and Polish (158 | 5.5%), together accounting for 85.6% of all Mount Morris residents.
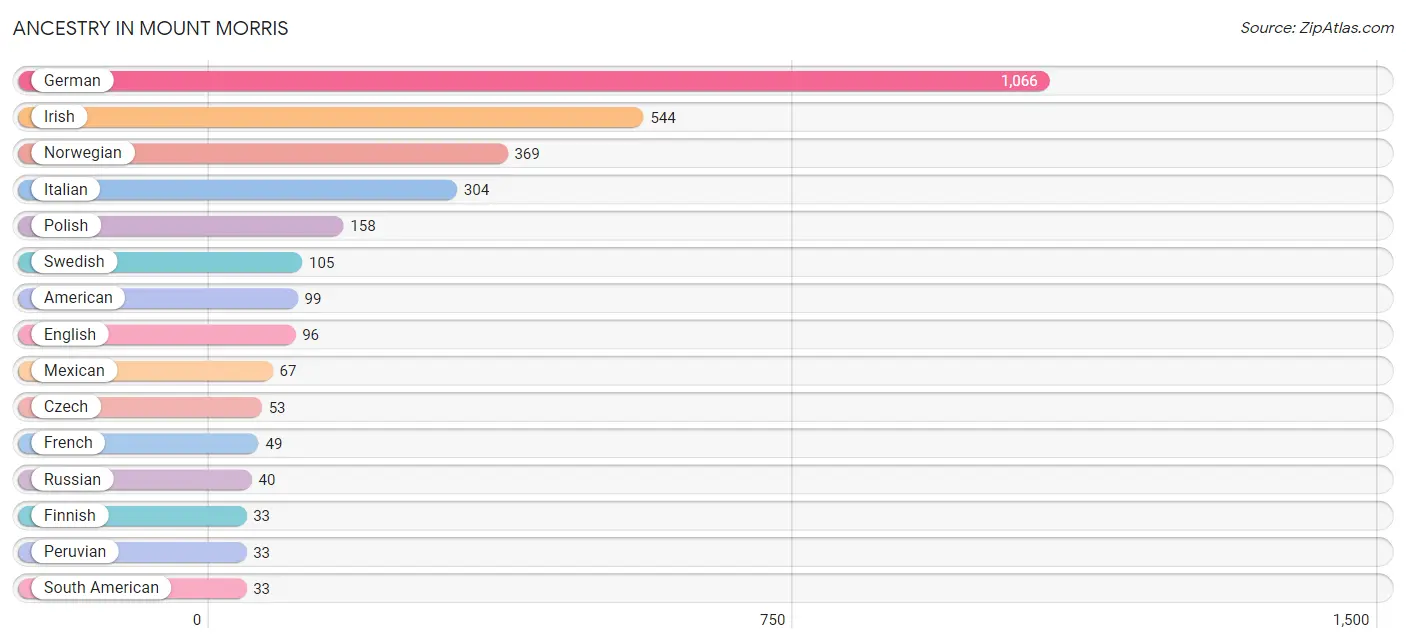
| Ancestry | # Population | % Population |
| American | 99 | 3.5% |
| Bhutanese | 20 | 0.7% |
| British | 18 | 0.6% |
| Czech | 53 | 1.9% |
| Dutch | 7 | 0.3% |
| English | 96 | 3.4% |
| Finnish | 33 | 1.2% |
| French | 49 | 1.7% |
| German | 1,066 | 37.4% |
| Irish | 544 | 19.1% |
| Italian | 304 | 10.7% |
| Korean | 7 | 0.3% |
| Lithuanian | 17 | 0.6% |
| Mexican | 67 | 2.4% |
| Norwegian | 369 | 12.9% |
| Pennsylvania German | 15 | 0.5% |
| Peruvian | 33 | 1.2% |
| Polish | 158 | 5.5% |
| Russian | 40 | 1.4% |
| Scotch-Irish | 23 | 0.8% |
| Scottish | 7 | 0.3% |
| South American | 33 | 1.2% |
| Swedish | 105 | 3.7% |
| Welsh | 16 | 0.6% | View All 24 Rows |
Immigrants in Mount Morris
The most numerous immigrant groups reported in Mount Morris came from Europe (55 | 1.9%), Italy (49 | 1.7%), Southern Europe (49 | 1.7%), Asia (7 | 0.3%), and Philippines (7 | 0.3%), together accounting for 5.9% of all Mount Morris residents.
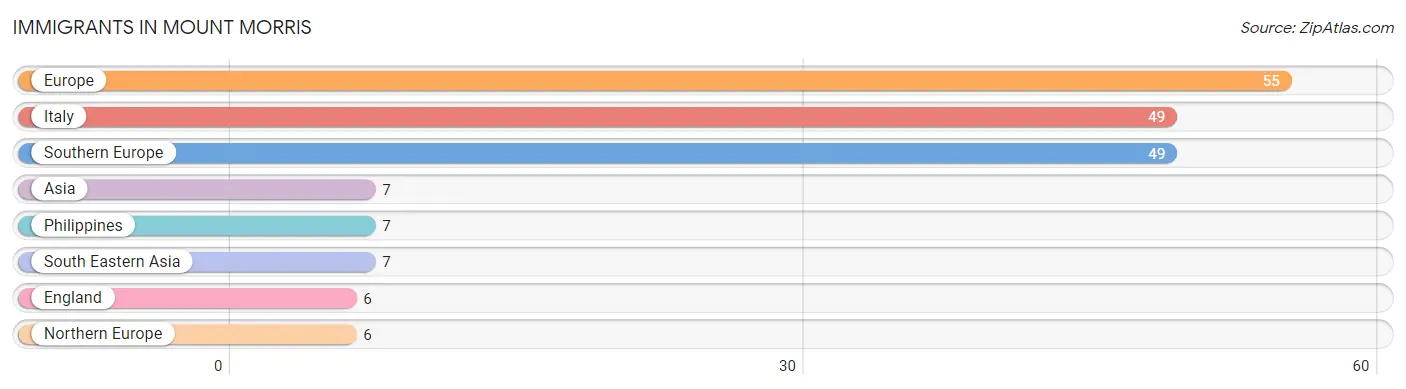
| Immigration Origin | # Population | % Population |
| Asia | 7 | 0.3% |
| England | 6 | 0.2% |
| Europe | 55 | 1.9% |
| Italy | 49 | 1.7% |
| Northern Europe | 6 | 0.2% |
| Philippines | 7 | 0.3% |
| South Eastern Asia | 7 | 0.3% |
| Southern Europe | 49 | 1.7% | View All 8 Rows |
Sex and Age in Mount Morris
Sex and Age in Mount Morris
The most populous age groups in Mount Morris are 70 to 74 Years (177 | 13.9%) for men and Under 5 Years (260 | 16.5%) for women.
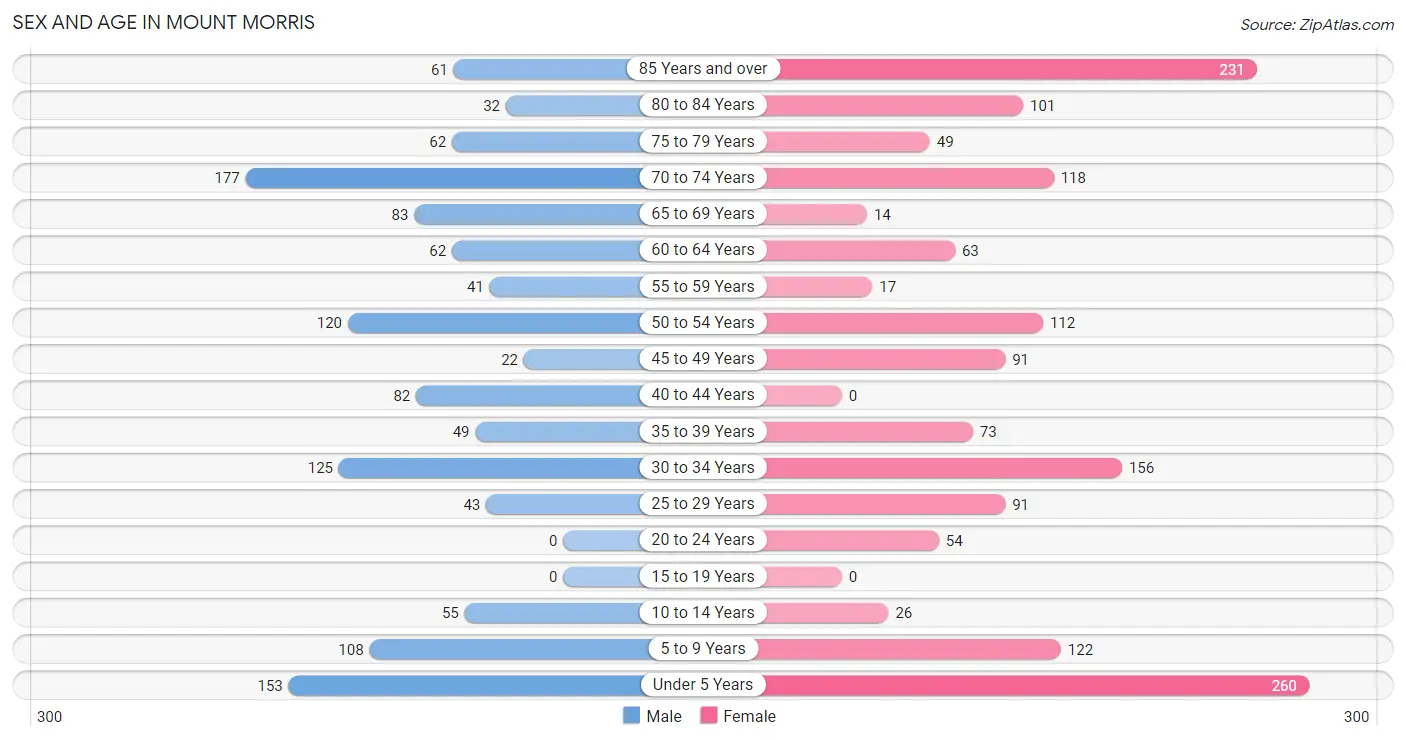
| Age Bracket | Male | Female |
| Under 5 Years | 153 (12.0%) | 260 (16.5%) |
| 5 to 9 Years | 108 (8.5%) | 122 (7.7%) |
| 10 to 14 Years | 55 (4.3%) | 26 (1.7%) |
| 15 to 19 Years | 0 (0.0%) | 0 (0.0%) |
| 20 to 24 Years | 0 (0.0%) | 54 (3.4%) |
| 25 to 29 Years | 43 (3.4%) | 91 (5.8%) |
| 30 to 34 Years | 125 (9.8%) | 156 (9.9%) |
| 35 to 39 Years | 49 (3.8%) | 73 (4.6%) |
| 40 to 44 Years | 82 (6.4%) | 0 (0.0%) |
| 45 to 49 Years | 22 (1.7%) | 91 (5.8%) |
| 50 to 54 Years | 120 (9.4%) | 112 (7.1%) |
| 55 to 59 Years | 41 (3.2%) | 17 (1.1%) |
| 60 to 64 Years | 62 (4.9%) | 63 (4.0%) |
| 65 to 69 Years | 83 (6.5%) | 14 (0.9%) |
| 70 to 74 Years | 177 (13.9%) | 118 (7.5%) |
| 75 to 79 Years | 62 (4.9%) | 49 (3.1%) |
| 80 to 84 Years | 32 (2.5%) | 101 (6.4%) |
| 85 Years and over | 61 (4.8%) | 231 (14.6%) |
| Total | 1,275 (100.0%) | 1,578 (100.0%) |
Families and Households in Mount Morris
Median Family Size in Mount Morris
The median family size in Mount Morris is 3.00 persons per family, with married-couple families (409 | 68.9%) accounting for the largest median family size of 3.11 persons per family. On the other hand, single female/mother families (157 | 26.4%) represent the smallest median family size with 2.69 persons per family.
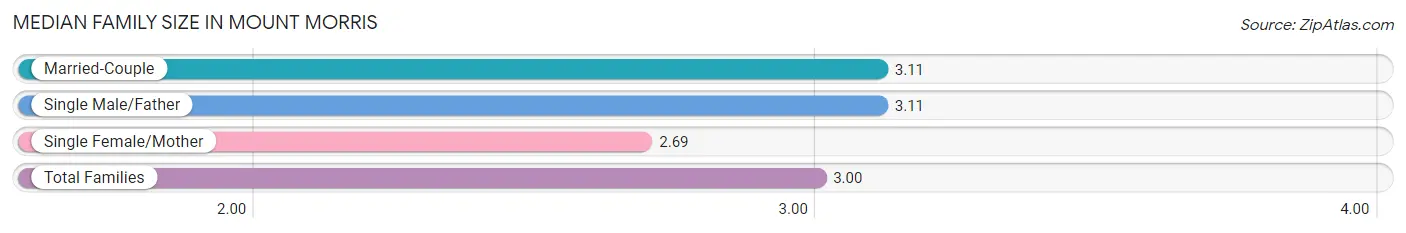
| Family Type | # Families | Family Size |
| Married-Couple | 409 (68.9%) | 3.11 |
| Single Male/Father | 28 (4.7%) | 3.11 |
| Single Female/Mother | 157 (26.4%) | 2.69 |
| Total Families | 594 (100.0%) | 3.00 |
Median Household Size in Mount Morris
The median household size in Mount Morris is 1.95 persons per household, with single female/mother households (157 | 11.2%) accounting for the largest median household size of 3.36 persons per household. non-family households (807 | 57.6%) represent the smallest median household size with 1.06 persons per household.
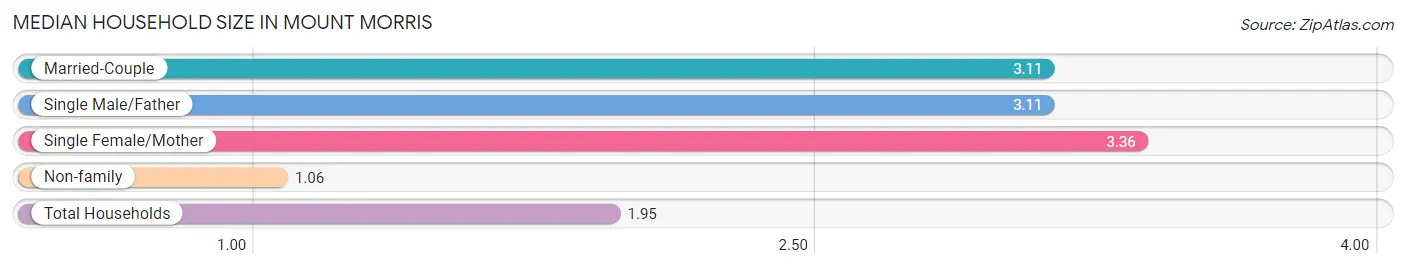
| Household Type | # Households | Household Size |
| Married-Couple | 409 (29.2%) | 3.11 |
| Single Male/Father | 28 (2.0%) | 3.11 |
| Single Female/Mother | 157 (11.2%) | 3.36 |
| Non-family | 807 (57.6%) | 1.06 |
| Total Households | 1,401 (100.0%) | 1.95 |
Household Size by Marriage Status in Mount Morris
Out of a total of 1,401 households in Mount Morris, 594 (42.4%) are family households, while 807 (57.6%) are nonfamily households. The most numerous type of family households are 2-person households, comprising 347, and the most common type of nonfamily households are 1-person households, comprising 756.
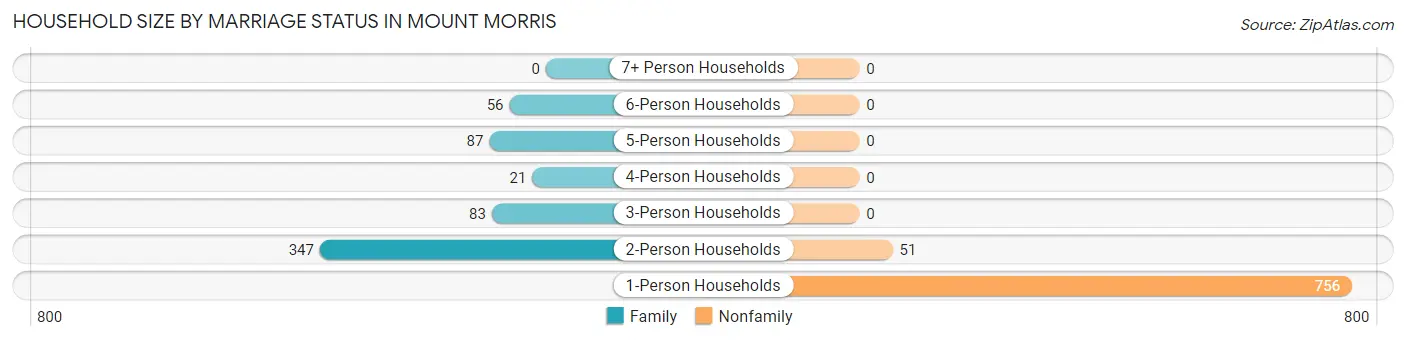
| Household Size | Family Households | Nonfamily Households |
| 1-Person Households | - | 756 (54.0%) |
| 2-Person Households | 347 (24.8%) | 51 (3.6%) |
| 3-Person Households | 83 (5.9%) | 0 (0.0%) |
| 4-Person Households | 21 (1.5%) | 0 (0.0%) |
| 5-Person Households | 87 (6.2%) | 0 (0.0%) |
| 6-Person Households | 56 (4.0%) | 0 (0.0%) |
| 7+ Person Households | 0 (0.0%) | 0 (0.0%) |
| Total | 594 (42.4%) | 807 (57.6%) |
Female Fertility in Mount Morris
Fertility by Age in Mount Morris
Average fertility rate in Mount Morris is 149.0 births per 1,000 women. Women in the age bracket of 20 to 34 years have the highest fertility rate with 179.0 births per 1,000 women. Women in the age bracket of 20 to 34 years acount for 65.8% of all women with births.
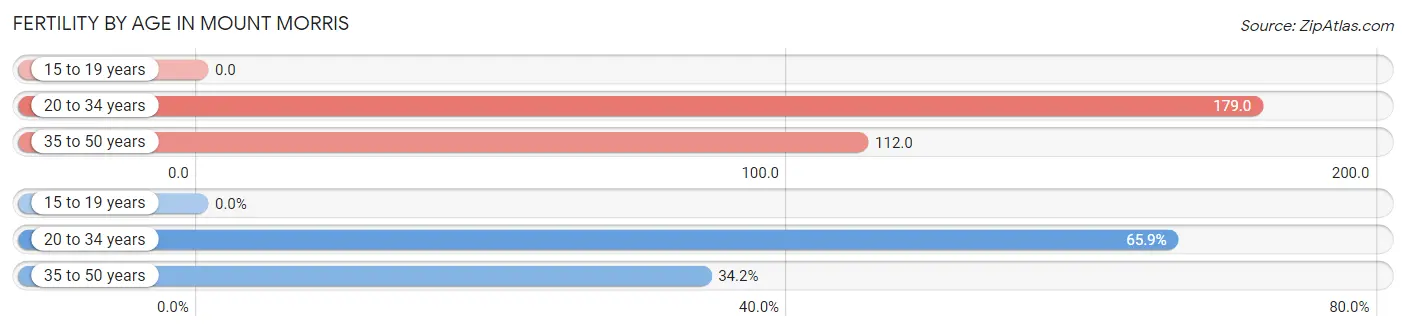
| Age Bracket | Women with Births | Births / 1,000 Women |
| 15 to 19 years | 0 (0.0%) | 0.0 |
| 20 to 34 years | 54 (65.8%) | 179.0 |
| 35 to 50 years | 28 (34.2%) | 112.0 |
| Total | 82 (100.0%) | 149.0 |
Fertility by Age by Marriage Status in Mount Morris
59.8% of women with births (82) in Mount Morris are married. The highest percentage of unmarried women with births falls into 20 to 34 years age bracket with 61.1% of them unmarried at the time of birth, while the lowest percentage of unmarried women with births belong to 35 to 50 years age bracket with 0.0% of them unmarried.
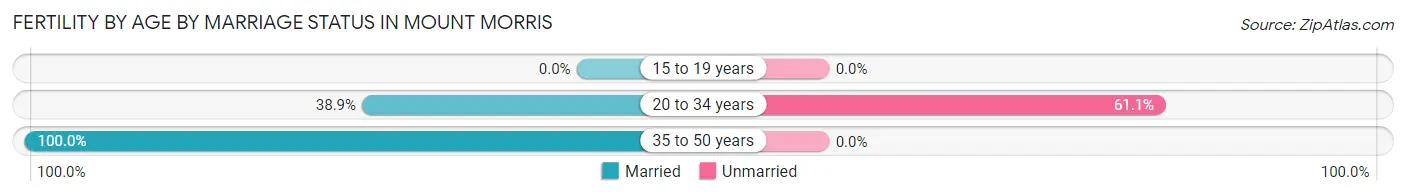
| Age Bracket | Married | Unmarried |
| 15 to 19 years | 0 (0.0%) | 0 (0.0%) |
| 20 to 34 years | 21 (38.9%) | 33 (61.1%) |
| 35 to 50 years | 28 (100.0%) | 0 (0.0%) |
| Total | 49 (59.8%) | 33 (40.2%) |
Fertility by Education in Mount Morris
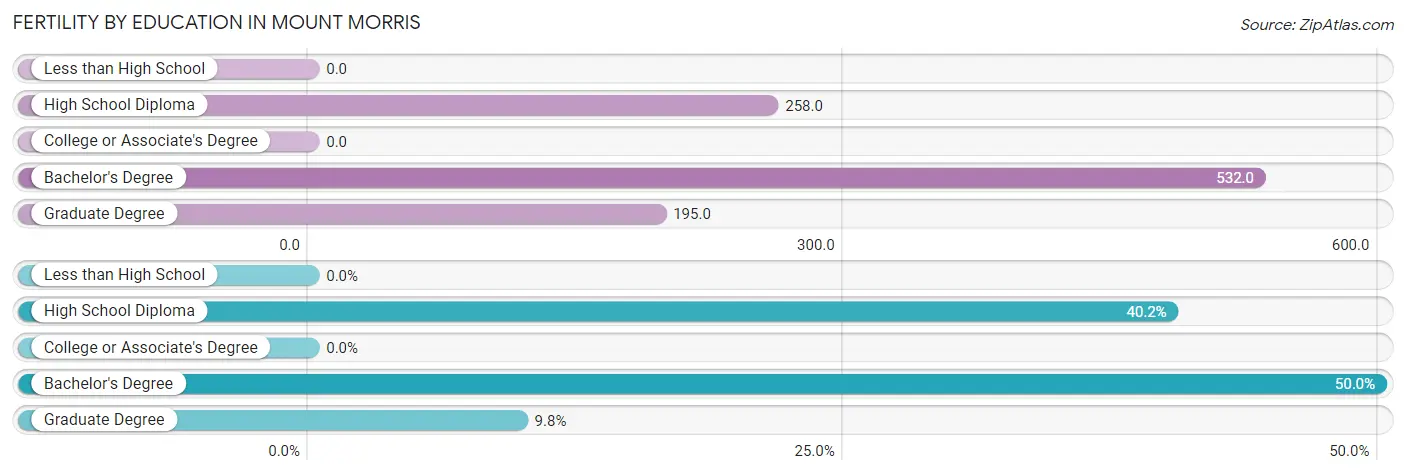
| Educational Attainment | Women with Births | Births / 1,000 Women |
| Less than High School | 0 (0.0%) | 0.0 |
| High School Diploma | 33 (40.2%) | 258.0 |
| College or Associate's Degree | 0 (0.0%) | 0.0 |
| Bachelor's Degree | 41 (50.0%) | 532.0 |
| Graduate Degree | 8 (9.8%) | 195.0 |
| Total | 82 (100.0%) | 149.0 |
Fertility by Education by Marriage Status in Mount Morris
40.2% of women with births in Mount Morris are unmarried. Women with the educational attainment of bachelor's degree are most likely to be married with 100.0% of them married at childbirth, while women with the educational attainment of high school diploma are least likely to be married with 100.0% of them unmarried at childbirth.
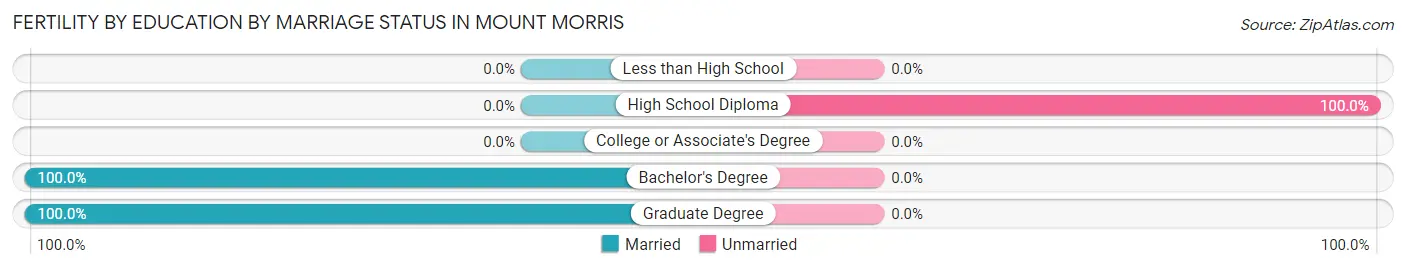
| Educational Attainment | Married | Unmarried |
| Less than High School | 0 (0.0%) | 0 (0.0%) |
| High School Diploma | 0 (0.0%) | 33 (100.0%) |
| College or Associate's Degree | 0 (0.0%) | 0 (0.0%) |
| Bachelor's Degree | 41 (100.0%) | 0 (0.0%) |
| Graduate Degree | 8 (100.0%) | 0 (0.0%) |
| Total | 49 (59.8%) | 33 (40.2%) |
Employment Characteristics in Mount Morris
Employment by Class of Employer in Mount Morris
Among the 1,157 employed individuals in Mount Morris, private company employees (946 | 81.8%), not-for-profit organizations (94 | 8.1%), and self-employed (not incorporated) (68 | 5.9%) make up the most common classes of employment.
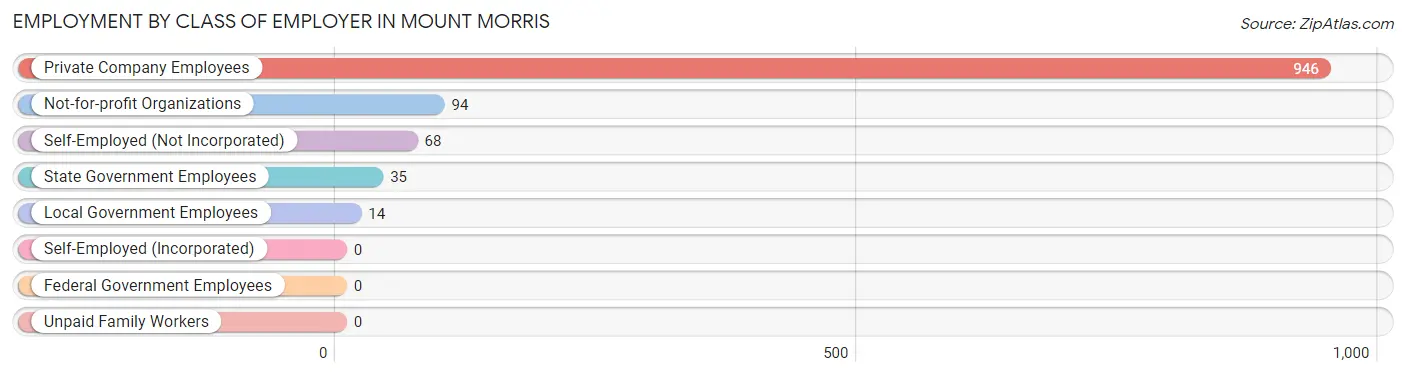
| Employer Class | # Employees | % Employees |
| Private Company Employees | 946 | 81.8% |
| Self-Employed (Incorporated) | 0 | 0.0% |
| Self-Employed (Not Incorporated) | 68 | 5.9% |
| Not-for-profit Organizations | 94 | 8.1% |
| Local Government Employees | 14 | 1.2% |
| State Government Employees | 35 | 3.0% |
| Federal Government Employees | 0 | 0.0% |
| Unpaid Family Workers | 0 | 0.0% |
| Total | 1,157 | 100.0% |
Employment Status by Age in Mount Morris
According to the labor force statistics for Mount Morris, out of the total population over 16 years of age (2,129), 59.5% or 1,267 individuals are in the labor force, with 5.0% or 63 of them unemployed. The age group with the highest labor force participation rate is 20 to 24 years, with 100.0% or 54 individuals in the labor force. Within the labor force, the 30 to 34 years age range has the highest percentage of unemployed individuals, with 24.1% or 63 of them being unemployed.
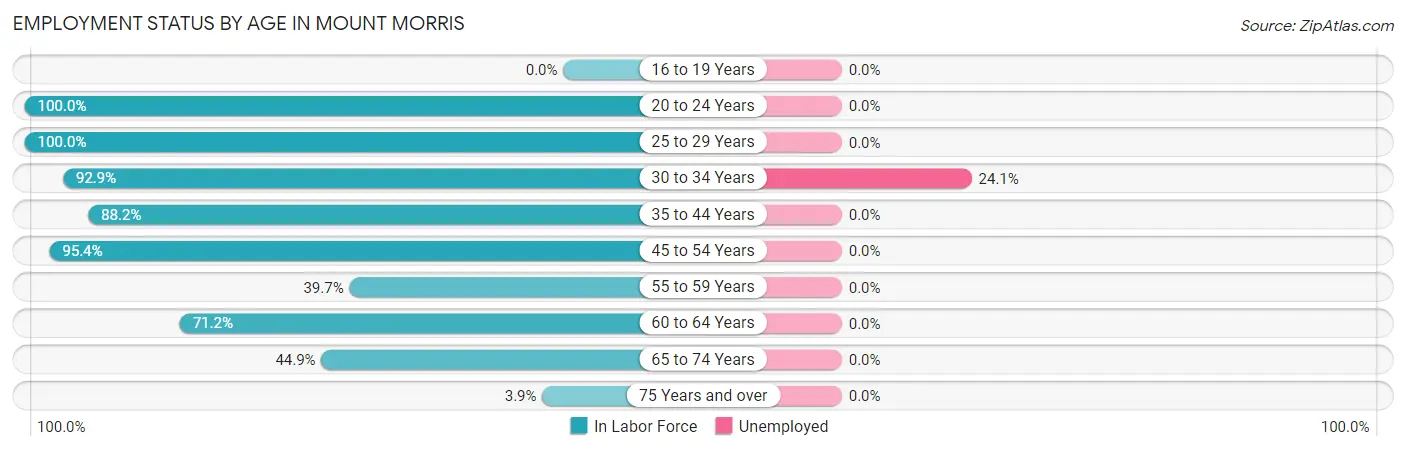
| Age Bracket | In Labor Force | Unemployed |
| 16 to 19 Years | 0 (0.0%) | 0 (0.0%) |
| 20 to 24 Years | 54 (100.0%) | 0 (0.0%) |
| 25 to 29 Years | 134 (100.0%) | 0 (0.0%) |
| 30 to 34 Years | 261 (92.9%) | 63 (24.1%) |
| 35 to 44 Years | 180 (88.2%) | 0 (0.0%) |
| 45 to 54 Years | 329 (95.4%) | 0 (0.0%) |
| 55 to 59 Years | 23 (39.7%) | 0 (0.0%) |
| 60 to 64 Years | 89 (71.2%) | 0 (0.0%) |
| 65 to 74 Years | 176 (44.9%) | 0 (0.0%) |
| 75 Years and over | 21 (3.9%) | 0 (0.0%) |
| Total | 1,267 (59.5%) | 63 (5.0%) |
Employment Status by Educational Attainment in Mount Morris
According to labor force statistics for Mount Morris, 88.6% of individuals (1,016) out of the total population between 25 and 64 years of age (1,147) are in the labor force, with 6.2% or 63 of them being unemployed. The group with the highest labor force participation rate are those with the educational attainment of less than high school, with 100.0% or 109 individuals in the labor force. Within the labor force, individuals with high school diploma education have the highest percentage of unemployment, with 13.5% or 33 of them being unemployed.
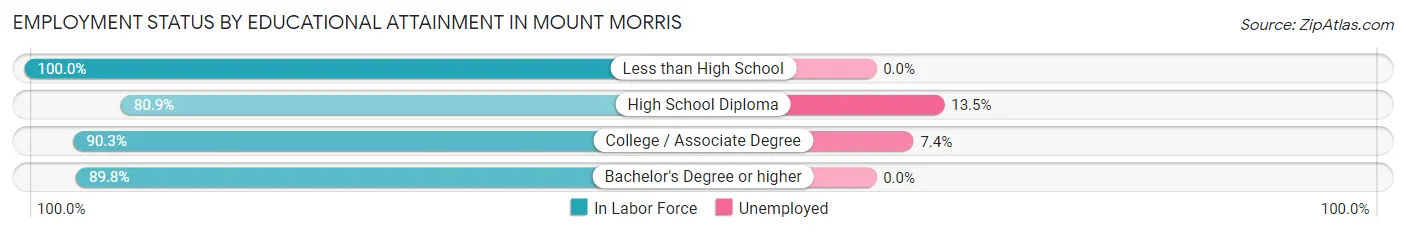
| Educational Attainment | In Labor Force | Unemployed |
| Less than High School | 109 (100.0%) | 0 (0.0%) |
| High School Diploma | 245 (80.9%) | 41 (13.5%) |
| College / Associate Degree | 408 (90.3%) | 33 (7.4%) |
| Bachelor's Degree or higher | 254 (89.8%) | 0 (0.0%) |
| Total | 1,016 (88.6%) | 71 (6.2%) |
Employment Occupations by Sex in Mount Morris
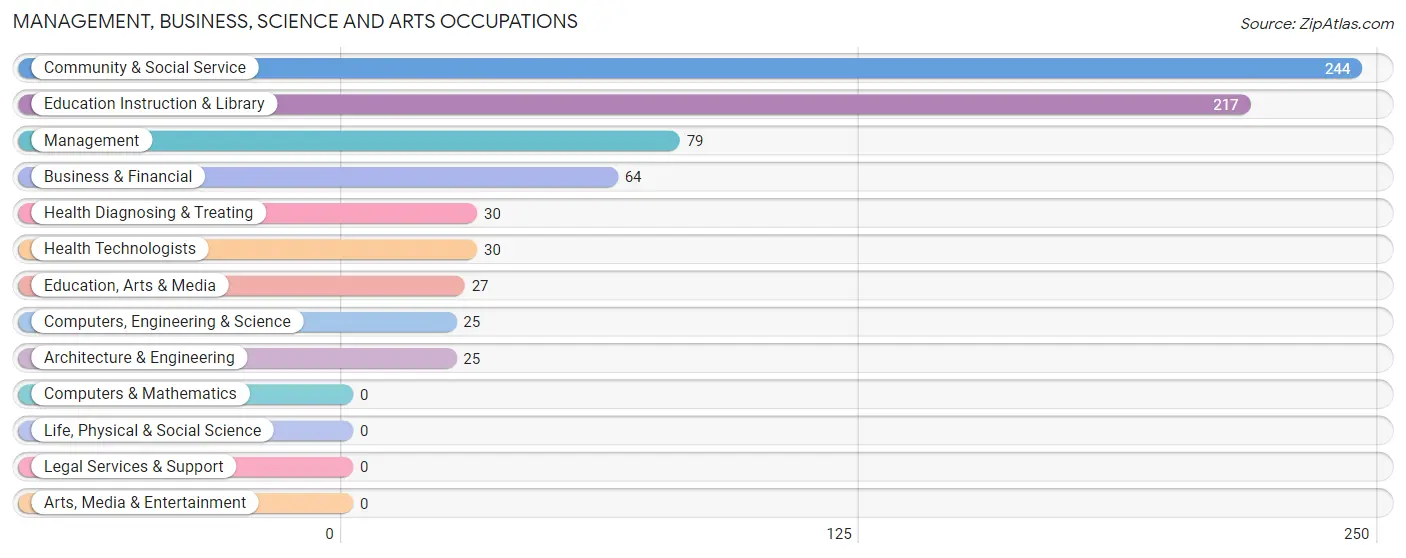
Management, Business, Science and Arts Occupations
The most common Management, Business, Science and Arts occupations in Mount Morris are Community & Social Service (244 | 20.3%), Education Instruction & Library (217 | 18.0%), Management (79 | 6.6%), Business & Financial (64 | 5.3%), and Health Diagnosing & Treating (30 | 2.5%).
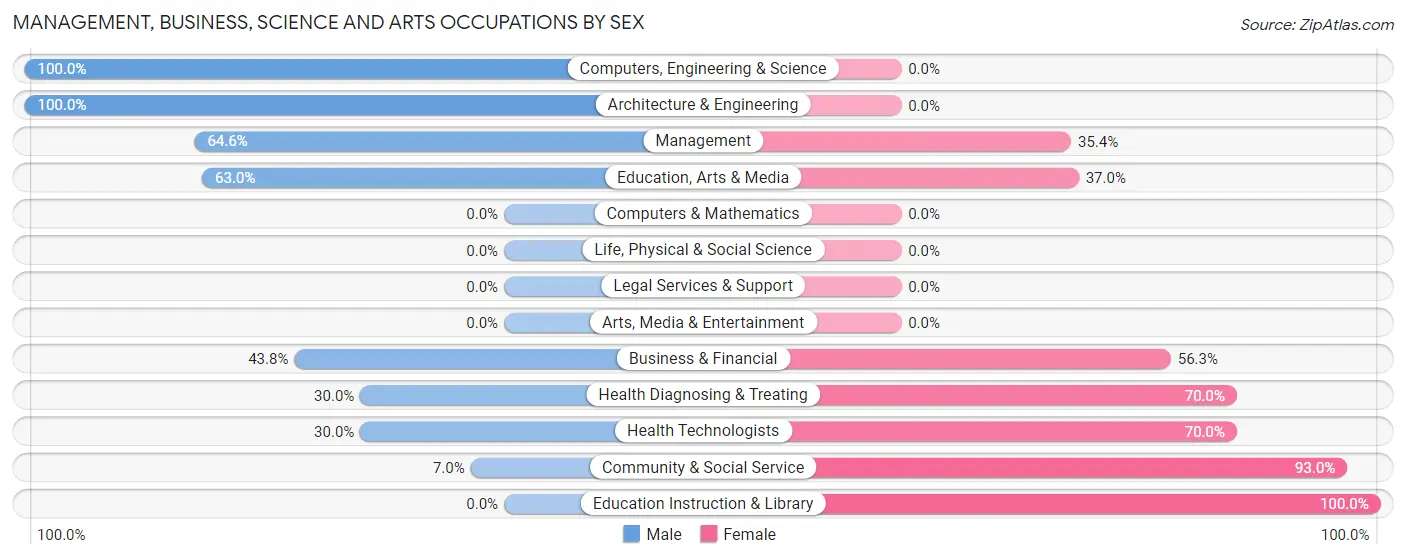
Management, Business, Science and Arts Occupations by Sex
Within the Management, Business, Science and Arts occupations in Mount Morris, the most male-oriented occupations are Computers, Engineering & Science (100.0%), Architecture & Engineering (100.0%), and Management (64.6%), while the most female-oriented occupations are Education Instruction & Library (100.0%), Community & Social Service (93.0%), and Health Diagnosing & Treating (70.0%).
| Occupation | Male | Female |
| Management | 51 (64.6%) | 28 (35.4%) |
| Business & Financial | 28 (43.8%) | 36 (56.2%) |
| Computers, Engineering & Science | 25 (100.0%) | 0 (0.0%) |
| Computers & Mathematics | 0 (0.0%) | 0 (0.0%) |
| Architecture & Engineering | 25 (100.0%) | 0 (0.0%) |
| Life, Physical & Social Science | 0 (0.0%) | 0 (0.0%) |
| Community & Social Service | 17 (7.0%) | 227 (93.0%) |
| Education, Arts & Media | 17 (63.0%) | 10 (37.0%) |
| Legal Services & Support | 0 (0.0%) | 0 (0.0%) |
| Education Instruction & Library | 0 (0.0%) | 217 (100.0%) |
| Arts, Media & Entertainment | 0 (0.0%) | 0 (0.0%) |
| Health Diagnosing & Treating | 9 (30.0%) | 21 (70.0%) |
| Health Technologists | 9 (30.0%) | 21 (70.0%) |
| Total (Category) | 130 (29.4%) | 312 (70.6%) |
| Total (Overall) | 668 (55.5%) | 536 (44.5%) |
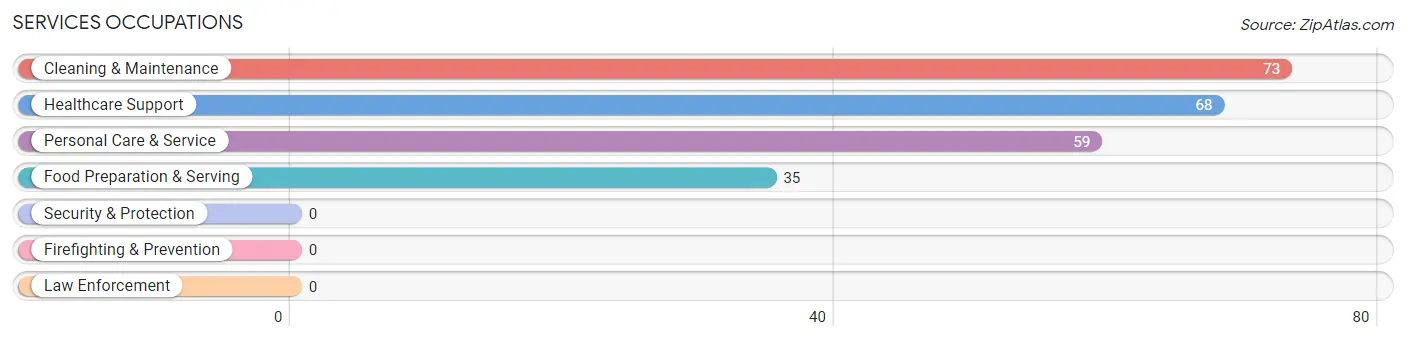
Services Occupations
The most common Services occupations in Mount Morris are Cleaning & Maintenance (73 | 6.1%), Healthcare Support (68 | 5.7%), Personal Care & Service (59 | 4.9%), and Food Preparation & Serving (35 | 2.9%).
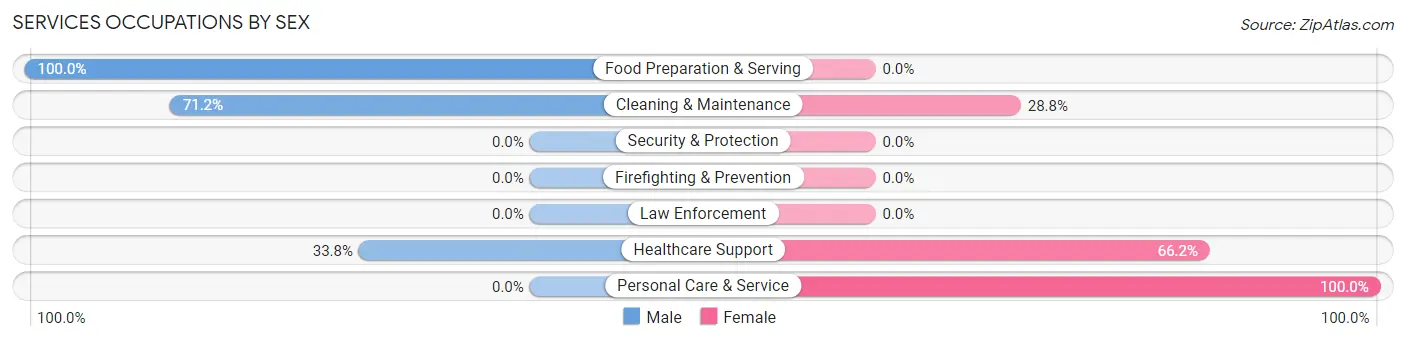
Services Occupations by Sex
Within the Services occupations in Mount Morris, the most male-oriented occupations are Food Preparation & Serving (100.0%), Cleaning & Maintenance (71.2%), and Healthcare Support (33.8%), while the most female-oriented occupations are Personal Care & Service (100.0%), Healthcare Support (66.2%), and Cleaning & Maintenance (28.8%).
| Occupation | Male | Female |
| Healthcare Support | 23 (33.8%) | 45 (66.2%) |
| Security & Protection | 0 (0.0%) | 0 (0.0%) |
| Firefighting & Prevention | 0 (0.0%) | 0 (0.0%) |
| Law Enforcement | 0 (0.0%) | 0 (0.0%) |
| Food Preparation & Serving | 35 (100.0%) | 0 (0.0%) |
| Cleaning & Maintenance | 52 (71.2%) | 21 (28.8%) |
| Personal Care & Service | 0 (0.0%) | 59 (100.0%) |
| Total (Category) | 110 (46.8%) | 125 (53.2%) |
| Total (Overall) | 668 (55.5%) | 536 (44.5%) |
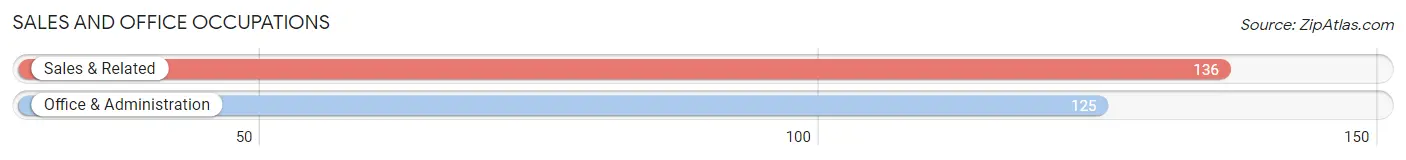
Sales and Office Occupations
The most common Sales and Office occupations in Mount Morris are Sales & Related (136 | 11.3%), and Office & Administration (125 | 10.4%).
Sales and Office Occupations by Sex
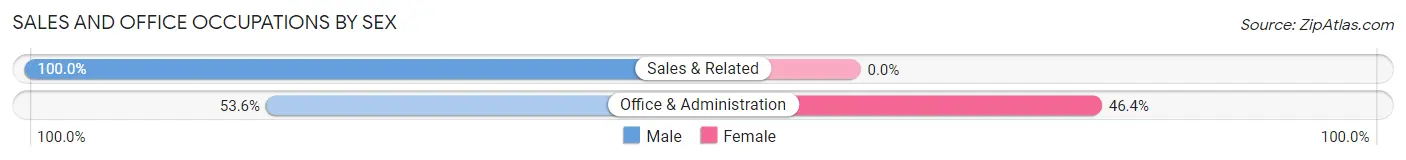
| Occupation | Male | Female |
| Sales & Related | 136 (100.0%) | 0 (0.0%) |
| Office & Administration | 67 (53.6%) | 58 (46.4%) |
| Total (Category) | 203 (77.8%) | 58 (22.2%) |
| Total (Overall) | 668 (55.5%) | 536 (44.5%) |
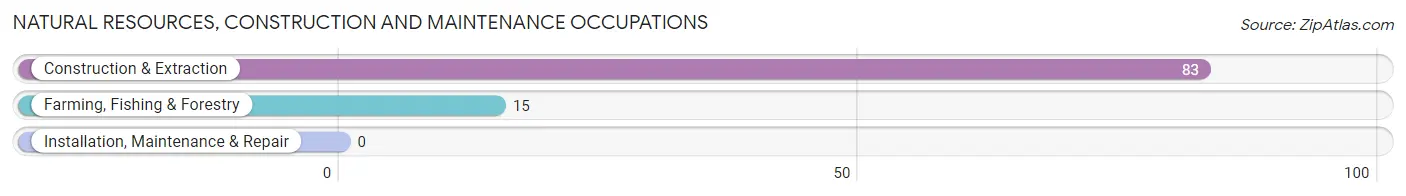
Natural Resources, Construction and Maintenance Occupations
The most common Natural Resources, Construction and Maintenance occupations in Mount Morris are Construction & Extraction (83 | 6.9%), and Farming, Fishing & Forestry (15 | 1.3%).
Natural Resources, Construction and Maintenance Occupations by Sex
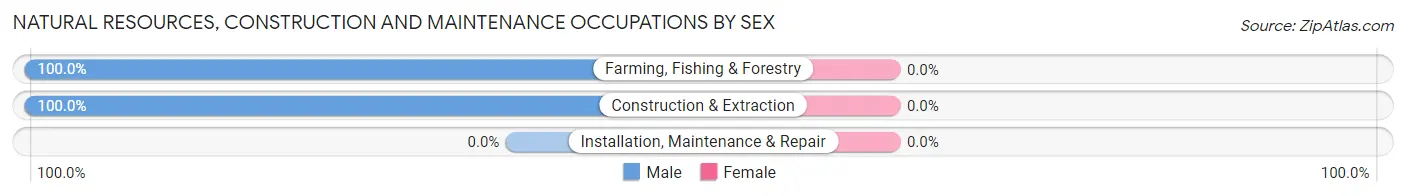
| Occupation | Male | Female |
| Farming, Fishing & Forestry | 15 (100.0%) | 0 (0.0%) |
| Construction & Extraction | 83 (100.0%) | 0 (0.0%) |
| Installation, Maintenance & Repair | 0 (0.0%) | 0 (0.0%) |
| Total (Category) | 98 (100.0%) | 0 (0.0%) |
| Total (Overall) | 668 (55.5%) | 536 (44.5%) |
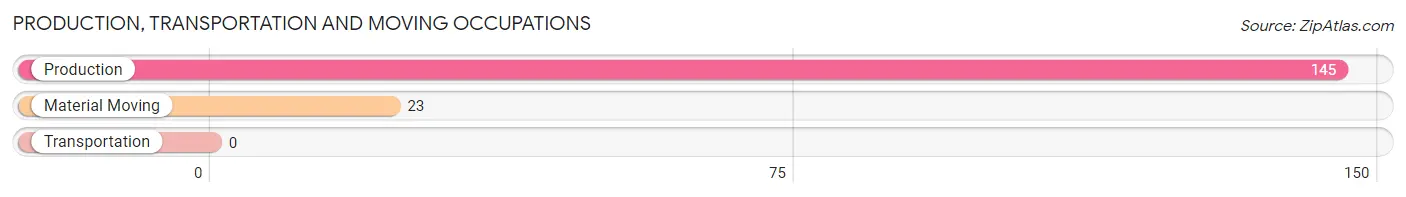
Production, Transportation and Moving Occupations
The most common Production, Transportation and Moving occupations in Mount Morris are Production (145 | 12.0%), and Material Moving (23 | 1.9%).
Production, Transportation and Moving Occupations by Sex
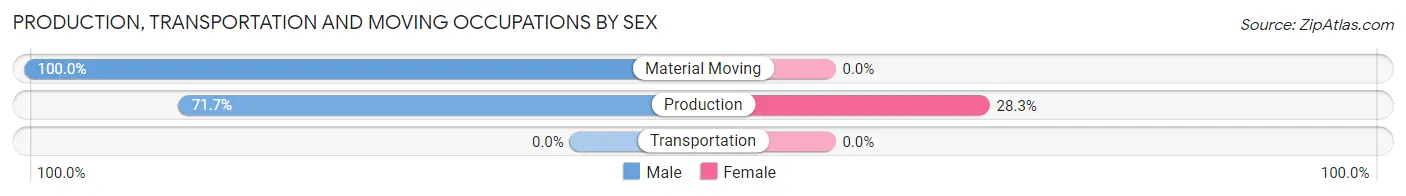
| Occupation | Male | Female |
| Production | 104 (71.7%) | 41 (28.3%) |
| Transportation | 0 (0.0%) | 0 (0.0%) |
| Material Moving | 23 (100.0%) | 0 (0.0%) |
| Total (Category) | 127 (75.6%) | 41 (24.4%) |
| Total (Overall) | 668 (55.5%) | 536 (44.5%) |
Employment Industries by Sex in Mount Morris
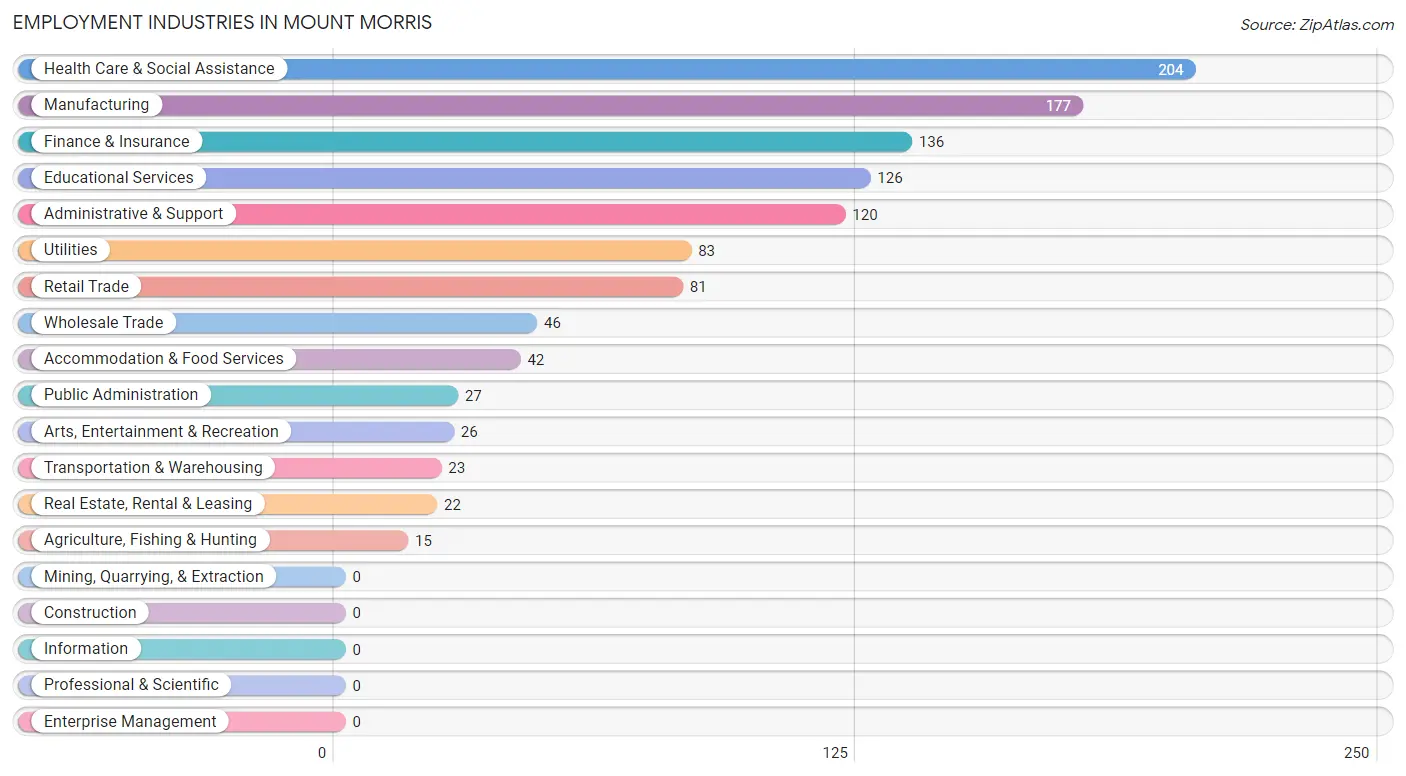
Employment Industries in Mount Morris
The major employment industries in Mount Morris include Health Care & Social Assistance (204 | 16.9%), Manufacturing (177 | 14.7%), Finance & Insurance (136 | 11.3%), Educational Services (126 | 10.5%), and Administrative & Support (120 | 10.0%).
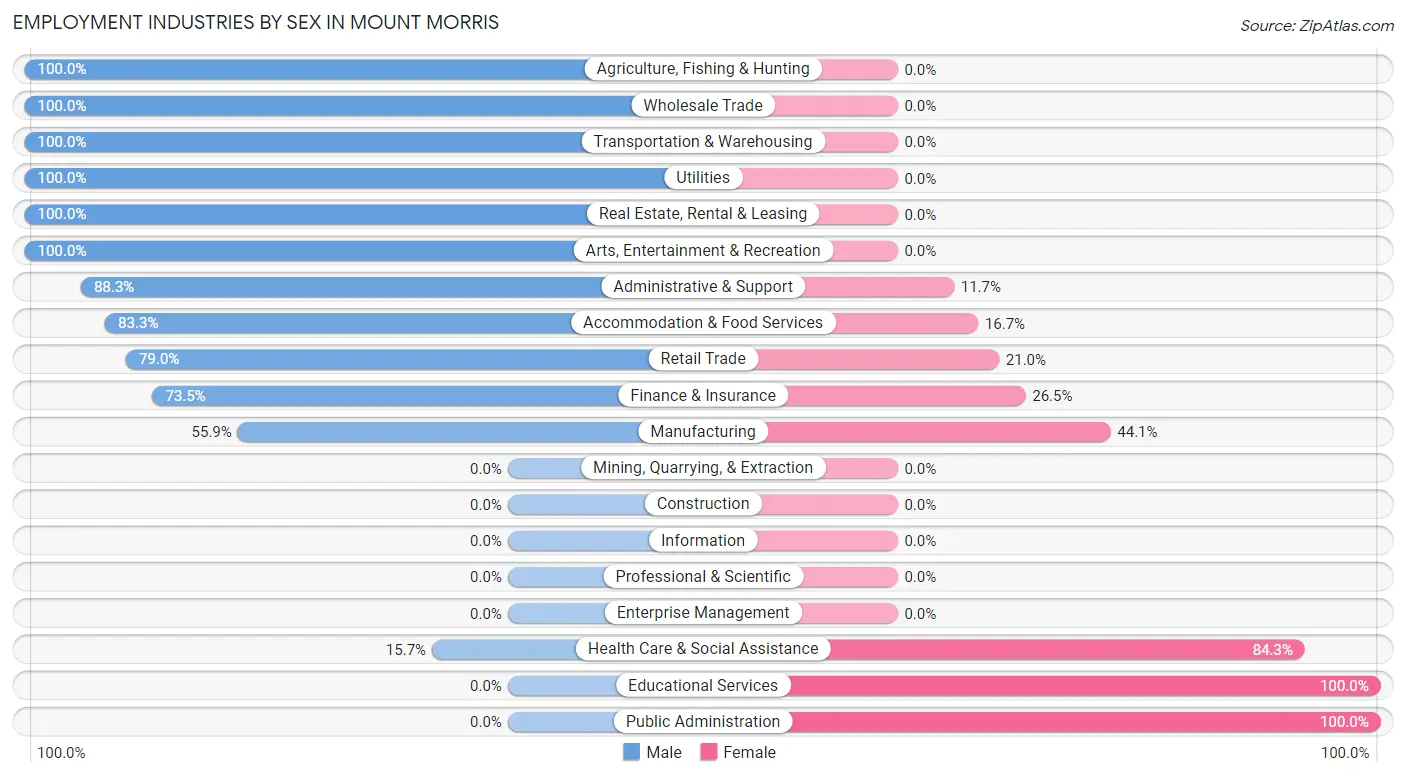
Employment Industries by Sex in Mount Morris
The Mount Morris industries that see more men than women are Agriculture, Fishing & Hunting (100.0%), Wholesale Trade (100.0%), and Transportation & Warehousing (100.0%), whereas the industries that tend to have a higher number of women are Educational Services (100.0%), Public Administration (100.0%), and Health Care & Social Assistance (84.3%).
| Industry | Male | Female |
| Agriculture, Fishing & Hunting | 15 (100.0%) | 0 (0.0%) |
| Mining, Quarrying, & Extraction | 0 (0.0%) | 0 (0.0%) |
| Construction | 0 (0.0%) | 0 (0.0%) |
| Manufacturing | 99 (55.9%) | 78 (44.1%) |
| Wholesale Trade | 46 (100.0%) | 0 (0.0%) |
| Retail Trade | 64 (79.0%) | 17 (21.0%) |
| Transportation & Warehousing | 23 (100.0%) | 0 (0.0%) |
| Utilities | 83 (100.0%) | 0 (0.0%) |
| Information | 0 (0.0%) | 0 (0.0%) |
| Finance & Insurance | 100 (73.5%) | 36 (26.5%) |
| Real Estate, Rental & Leasing | 22 (100.0%) | 0 (0.0%) |
| Professional & Scientific | 0 (0.0%) | 0 (0.0%) |
| Enterprise Management | 0 (0.0%) | 0 (0.0%) |
| Administrative & Support | 106 (88.3%) | 14 (11.7%) |
| Educational Services | 0 (0.0%) | 126 (100.0%) |
| Health Care & Social Assistance | 32 (15.7%) | 172 (84.3%) |
| Arts, Entertainment & Recreation | 26 (100.0%) | 0 (0.0%) |
| Accommodation & Food Services | 35 (83.3%) | 7 (16.7%) |
| Public Administration | 0 (0.0%) | 27 (100.0%) |
| Total | 668 (55.5%) | 536 (44.5%) |
Education in Mount Morris
School Enrollment in Mount Morris
The most common levels of schooling among the 564 students in Mount Morris are nursery / preschool (204 | 36.2%), elementary school (90 | 16.0%), and middle school (81 | 14.4%).
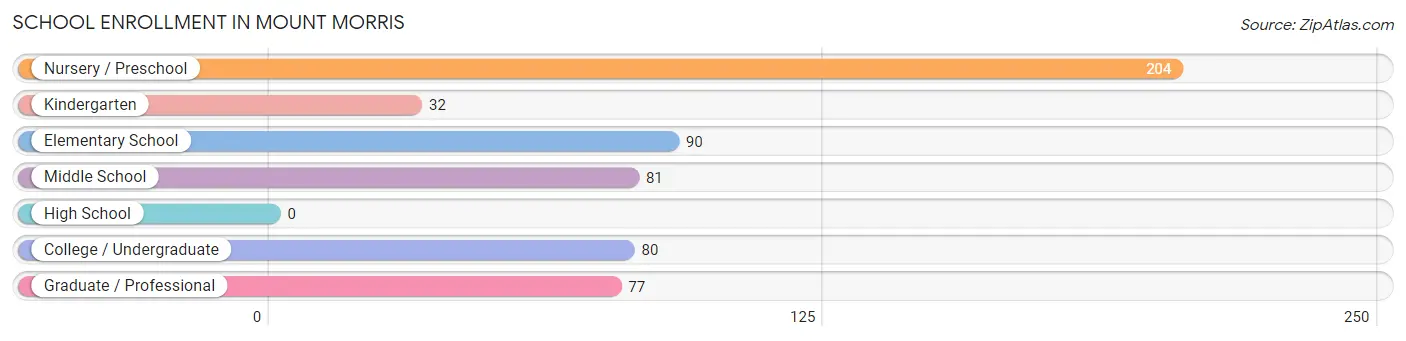
| School Level | # Students | % Students |
| Nursery / Preschool | 204 | 36.2% |
| Kindergarten | 32 | 5.7% |
| Elementary School | 90 | 16.0% |
| Middle School | 81 | 14.4% |
| High School | 0 | 0.0% |
| College / Undergraduate | 80 | 14.2% |
| Graduate / Professional | 77 | 13.7% |
| Total | 564 | 100.0% |
School Enrollment by Age by Funding Source in Mount Morris
Out of a total of 564 students who are enrolled in schools in Mount Morris, 43 (7.6%) attend a private institution, while the remaining 521 (92.4%) are enrolled in public schools. The age group of 35 years and over has the highest likelihood of being enrolled in private schools, with 23 (25.0% in the age bracket) enrolled. Conversely, the age group of 5 to 9 year old has the lowest likelihood of being enrolled in a private school, with 191 (100.0% in the age bracket) attending a public institution.
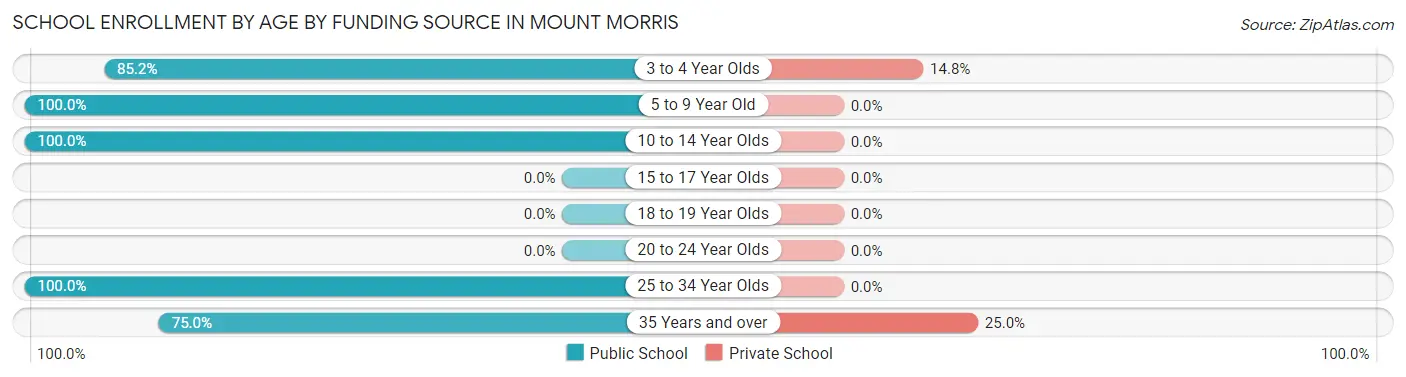
| Age Bracket | Public School | Private School |
| 3 to 4 Year Olds | 115 (85.2%) | 20 (14.8%) |
| 5 to 9 Year Old | 191 (100.0%) | 0 (0.0%) |
| 10 to 14 Year Olds | 81 (100.0%) | 0 (0.0%) |
| 15 to 17 Year Olds | 0 (0.0%) | 0 (0.0%) |
| 18 to 19 Year Olds | 0 (0.0%) | 0 (0.0%) |
| 20 to 24 Year Olds | 0 (0.0%) | 0 (0.0%) |
| 25 to 34 Year Olds | 65 (100.0%) | 0 (0.0%) |
| 35 Years and over | 69 (75.0%) | 23 (25.0%) |
| Total | 521 (92.4%) | 43 (7.6%) |
Educational Attainment by Field of Study in Mount Morris
Business (110 | 23.4%), education (106 | 22.6%), liberal arts & history (71 | 15.1%), social sciences (52 | 11.1%), and science & technology (50 | 10.6%) are the most common fields of study among 470 individuals in Mount Morris who have obtained a bachelor's degree or higher.
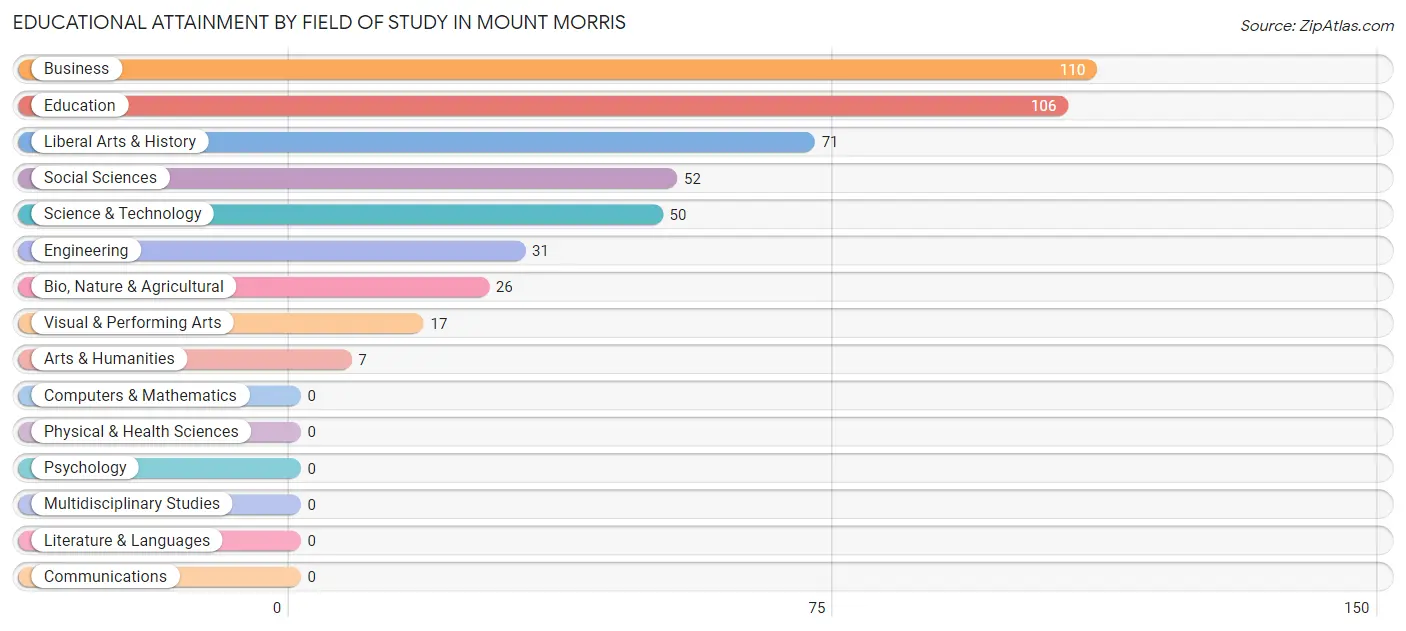
| Field of Study | # Graduates | % Graduates |
| Computers & Mathematics | 0 | 0.0% |
| Bio, Nature & Agricultural | 26 | 5.5% |
| Physical & Health Sciences | 0 | 0.0% |
| Psychology | 0 | 0.0% |
| Social Sciences | 52 | 11.1% |
| Engineering | 31 | 6.6% |
| Multidisciplinary Studies | 0 | 0.0% |
| Science & Technology | 50 | 10.6% |
| Business | 110 | 23.4% |
| Education | 106 | 22.6% |
| Literature & Languages | 0 | 0.0% |
| Liberal Arts & History | 71 | 15.1% |
| Visual & Performing Arts | 17 | 3.6% |
| Communications | 0 | 0.0% |
| Arts & Humanities | 7 | 1.5% |
| Total | 470 | 100.0% |
Transportation & Commute in Mount Morris
Vehicle Availability by Sex in Mount Morris
The most prevalent vehicle ownership categories in Mount Morris are males with 2 vehicles (302, accounting for 47.0%) and females with 2 vehicles (161, making up 58.6%).
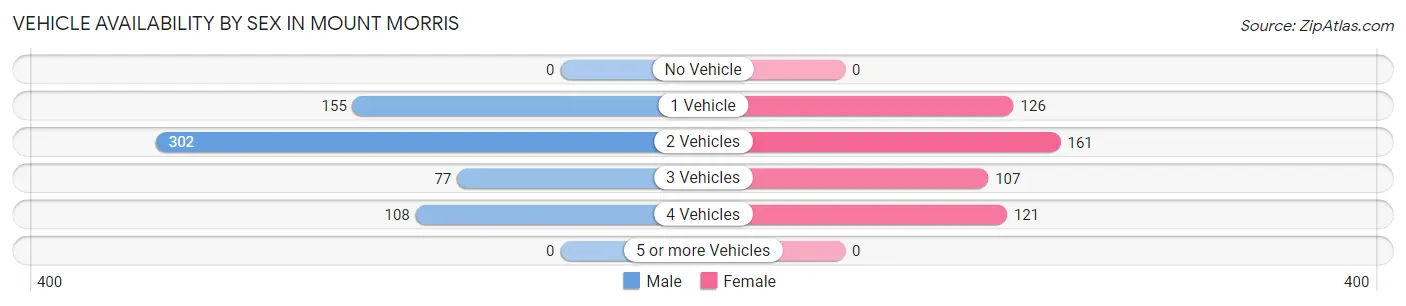
| Vehicles Available | Male | Female |
| No Vehicle | 0 (0.0%) | 0 (0.0%) |
| 1 Vehicle | 155 (24.1%) | 126 (24.5%) |
| 2 Vehicles | 302 (47.0%) | 161 (31.3%) |
| 3 Vehicles | 77 (12.0%) | 107 (20.8%) |
| 4 Vehicles | 108 (16.8%) | 121 (23.5%) |
| 5 or more Vehicles | 0 (0.0%) | 0 (0.0%) |
| Total | 642 (100.0%) | 515 (100.0%) |
Commute Time in Mount Morris
The most frequently occuring commute durations in Mount Morris are 15 to 19 minutes (309 commuters, 27.7%), 10 to 14 minutes (218 commuters, 19.5%), and 25 to 29 minutes (90 commuters, 8.1%).
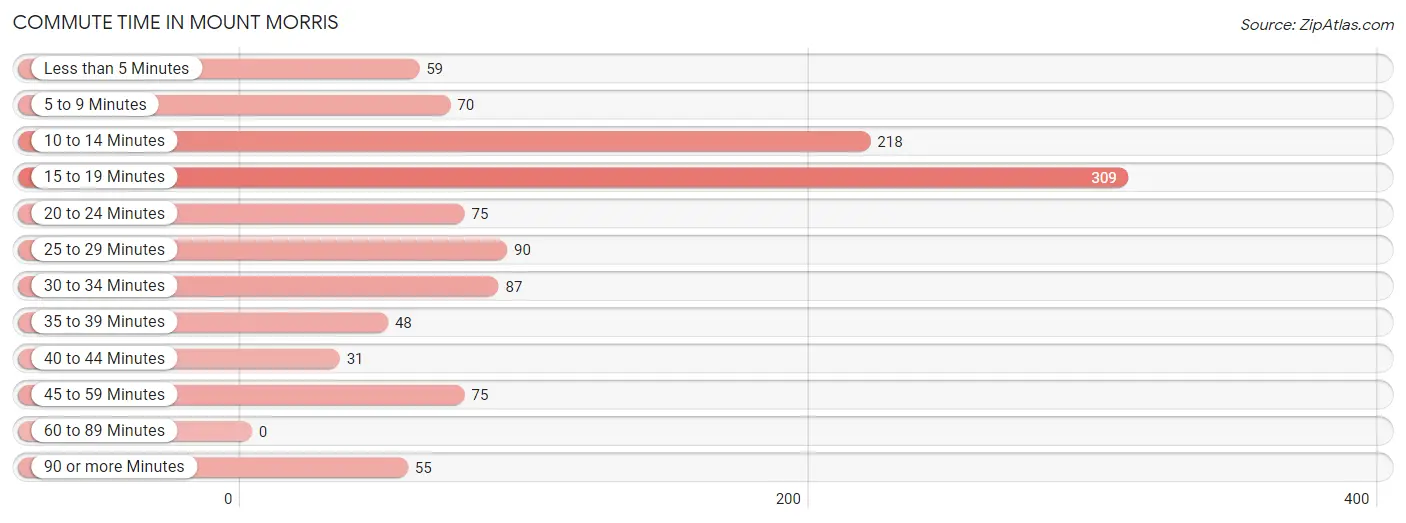
| Commute Time | # Commuters | % Commuters |
| Less than 5 Minutes | 59 | 5.3% |
| 5 to 9 Minutes | 70 | 6.3% |
| 10 to 14 Minutes | 218 | 19.5% |
| 15 to 19 Minutes | 309 | 27.7% |
| 20 to 24 Minutes | 75 | 6.7% |
| 25 to 29 Minutes | 90 | 8.1% |
| 30 to 34 Minutes | 87 | 7.8% |
| 35 to 39 Minutes | 48 | 4.3% |
| 40 to 44 Minutes | 31 | 2.8% |
| 45 to 59 Minutes | 75 | 6.7% |
| 60 to 89 Minutes | 0 | 0.0% |
| 90 or more Minutes | 55 | 4.9% |
Commute Time by Sex in Mount Morris
The most common commute times in Mount Morris are 15 to 19 minutes (195 commuters, 32.4%) for males and 10 to 14 minutes (133 commuters, 25.8%) for females.
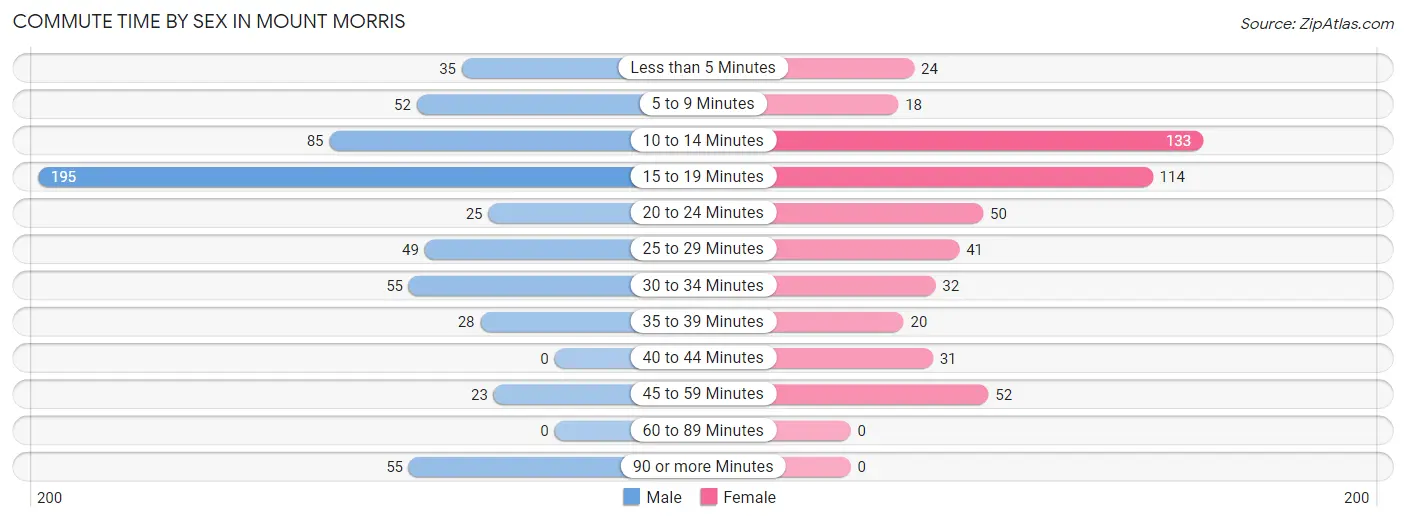
| Commute Time | Male | Female |
| Less than 5 Minutes | 35 (5.8%) | 24 (4.7%) |
| 5 to 9 Minutes | 52 (8.6%) | 18 (3.5%) |
| 10 to 14 Minutes | 85 (14.1%) | 133 (25.8%) |
| 15 to 19 Minutes | 195 (32.4%) | 114 (22.1%) |
| 20 to 24 Minutes | 25 (4.2%) | 50 (9.7%) |
| 25 to 29 Minutes | 49 (8.1%) | 41 (8.0%) |
| 30 to 34 Minutes | 55 (9.1%) | 32 (6.2%) |
| 35 to 39 Minutes | 28 (4.6%) | 20 (3.9%) |
| 40 to 44 Minutes | 0 (0.0%) | 31 (6.0%) |
| 45 to 59 Minutes | 23 (3.8%) | 52 (10.1%) |
| 60 to 89 Minutes | 0 (0.0%) | 0 (0.0%) |
| 90 or more Minutes | 55 (9.1%) | 0 (0.0%) |
Time of Departure to Work by Sex in Mount Morris
The most frequent times of departure to work in Mount Morris are 4:00 PM to 11:59 PM (137, 22.8%) for males and 7:30 AM to 7:59 AM (159, 30.9%) for females.
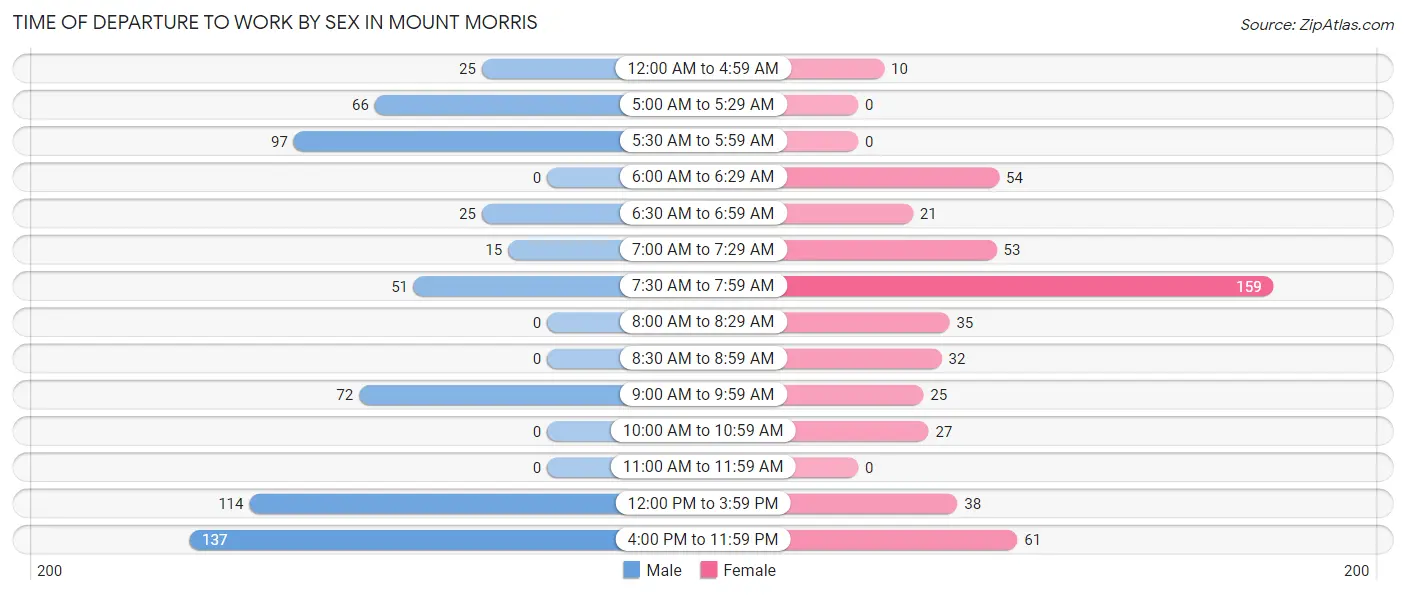
| Time of Departure | Male | Female |
| 12:00 AM to 4:59 AM | 25 (4.2%) | 10 (1.9%) |
| 5:00 AM to 5:29 AM | 66 (11.0%) | 0 (0.0%) |
| 5:30 AM to 5:59 AM | 97 (16.1%) | 0 (0.0%) |
| 6:00 AM to 6:29 AM | 0 (0.0%) | 54 (10.5%) |
| 6:30 AM to 6:59 AM | 25 (4.2%) | 21 (4.1%) |
| 7:00 AM to 7:29 AM | 15 (2.5%) | 53 (10.3%) |
| 7:30 AM to 7:59 AM | 51 (8.5%) | 159 (30.9%) |
| 8:00 AM to 8:29 AM | 0 (0.0%) | 35 (6.8%) |
| 8:30 AM to 8:59 AM | 0 (0.0%) | 32 (6.2%) |
| 9:00 AM to 9:59 AM | 72 (12.0%) | 25 (4.9%) |
| 10:00 AM to 10:59 AM | 0 (0.0%) | 27 (5.2%) |
| 11:00 AM to 11:59 AM | 0 (0.0%) | 0 (0.0%) |
| 12:00 PM to 3:59 PM | 114 (18.9%) | 38 (7.4%) |
| 4:00 PM to 11:59 PM | 137 (22.8%) | 61 (11.8%) |
| Total | 602 (100.0%) | 515 (100.0%) |
Housing Occupancy in Mount Morris
Occupancy by Ownership in Mount Morris
Of the total 1,401 dwellings in Mount Morris, owner-occupied units account for 925 (66.0%), while renter-occupied units make up 476 (34.0%).
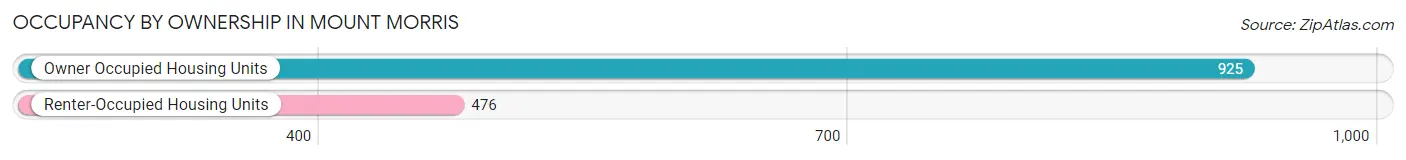
| Occupancy | # Housing Units | % Housing Units |
| Owner Occupied Housing Units | 925 | 66.0% |
| Renter-Occupied Housing Units | 476 | 34.0% |
| Total Occupied Housing Units | 1,401 | 100.0% |
Occupancy by Household Size in Mount Morris
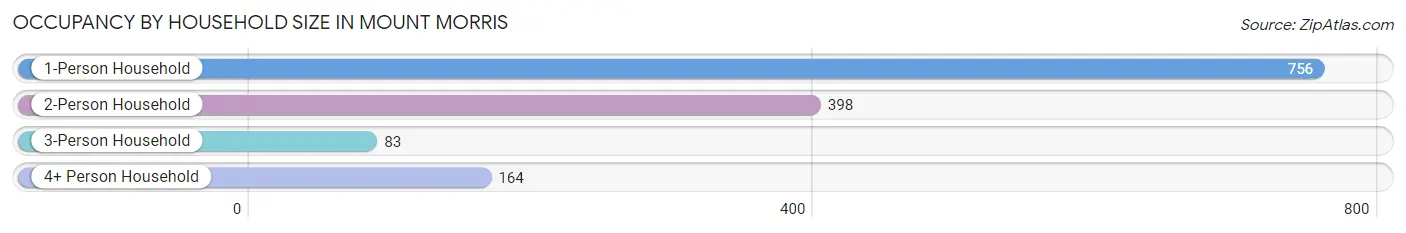
| Household Size | # Housing Units | % Housing Units |
| 1-Person Household | 756 | 54.0% |
| 2-Person Household | 398 | 28.4% |
| 3-Person Household | 83 | 5.9% |
| 4+ Person Household | 164 | 11.7% |
| Total Housing Units | 1,401 | 100.0% |
Occupancy by Ownership by Household Size in Mount Morris
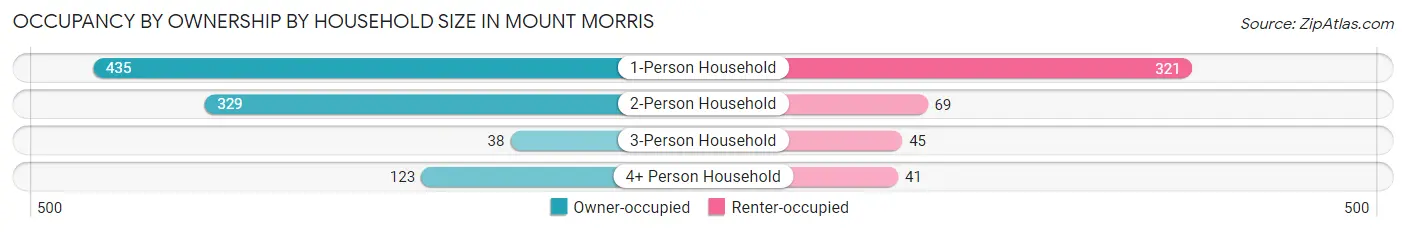
| Household Size | Owner-occupied | Renter-occupied |
| 1-Person Household | 435 (57.5%) | 321 (42.5%) |
| 2-Person Household | 329 (82.7%) | 69 (17.3%) |
| 3-Person Household | 38 (45.8%) | 45 (54.2%) |
| 4+ Person Household | 123 (75.0%) | 41 (25.0%) |
| Total Housing Units | 925 (66.0%) | 476 (34.0%) |
Occupancy by Educational Attainment in Mount Morris
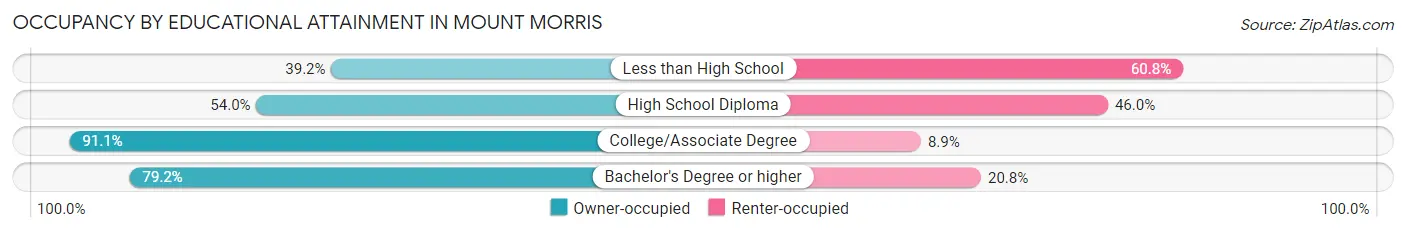
| Household Size | Owner-occupied | Renter-occupied |
| Less than High School | 105 (39.2%) | 163 (60.8%) |
| High School Diploma | 261 (54.0%) | 222 (46.0%) |
| College/Associate Degree | 338 (91.1%) | 33 (8.9%) |
| Bachelor's Degree or higher | 221 (79.2%) | 58 (20.8%) |
Occupancy by Age of Householder in Mount Morris
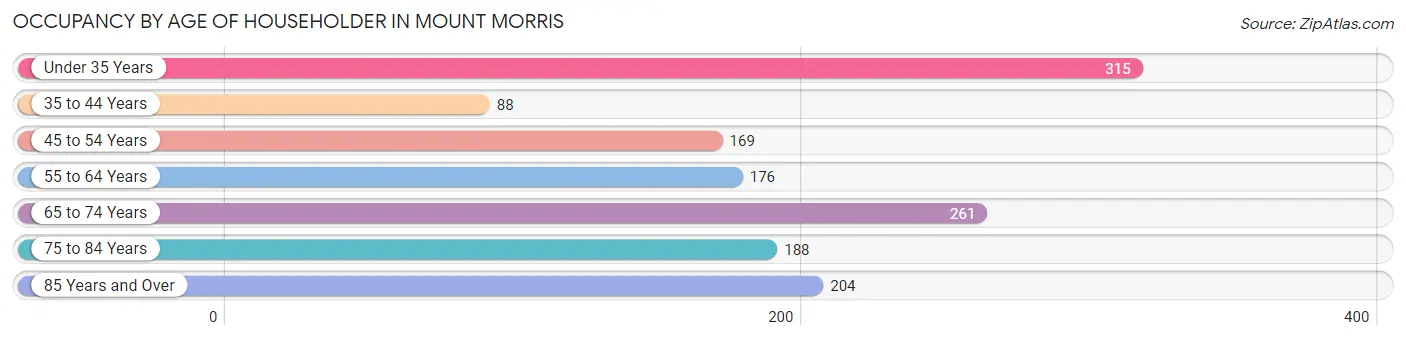
| Age Bracket | # Households | % Households |
| Under 35 Years | 315 | 22.5% |
| 35 to 44 Years | 88 | 6.3% |
| 45 to 54 Years | 169 | 12.1% |
| 55 to 64 Years | 176 | 12.6% |
| 65 to 74 Years | 261 | 18.6% |
| 75 to 84 Years | 188 | 13.4% |
| 85 Years and Over | 204 | 14.6% |
| Total | 1,401 | 100.0% |
Housing Finances in Mount Morris
Median Income by Occupancy in Mount Morris
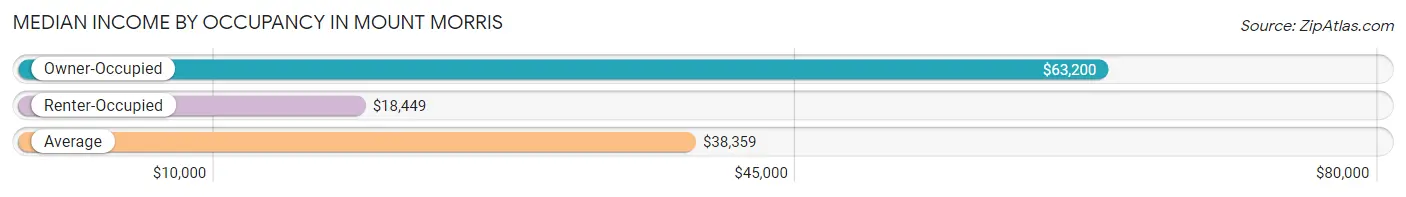
| Occupancy Type | # Households | Median Income |
| Owner-Occupied | 925 (66.0%) | $63,200 |
| Renter-Occupied | 476 (34.0%) | $18,449 |
| Average | 1,401 (100.0%) | $38,359 |
Occupancy by Householder Income Bracket in Mount Morris
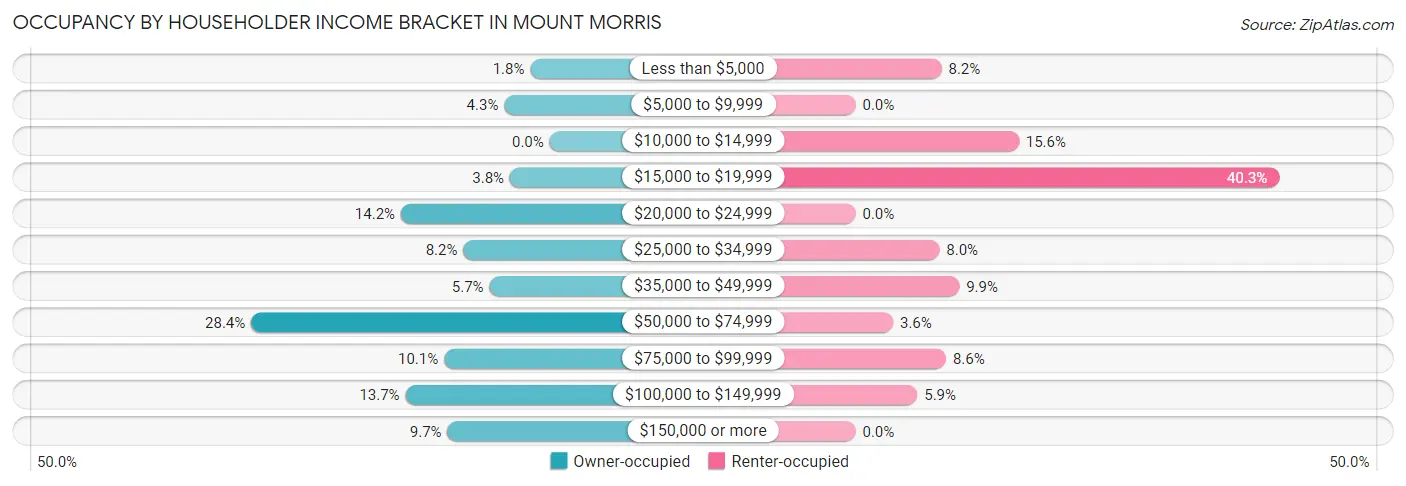
| Income Bracket | Owner-occupied | Renter-occupied |
| Less than $5,000 | 17 (1.8%) | 39 (8.2%) |
| $5,000 to $9,999 | 40 (4.3%) | 0 (0.0%) |
| $10,000 to $14,999 | 0 (0.0%) | 74 (15.5%) |
| $15,000 to $19,999 | 35 (3.8%) | 192 (40.3%) |
| $20,000 to $24,999 | 131 (14.2%) | 0 (0.0%) |
| $25,000 to $34,999 | 76 (8.2%) | 38 (8.0%) |
| $35,000 to $49,999 | 53 (5.7%) | 47 (9.9%) |
| $50,000 to $74,999 | 263 (28.4%) | 17 (3.6%) |
| $75,000 to $99,999 | 93 (10.1%) | 41 (8.6%) |
| $100,000 to $149,999 | 127 (13.7%) | 28 (5.9%) |
| $150,000 or more | 90 (9.7%) | 0 (0.0%) |
| Total | 925 (100.0%) | 476 (100.0%) |
Monthly Housing Cost Tiers in Mount Morris
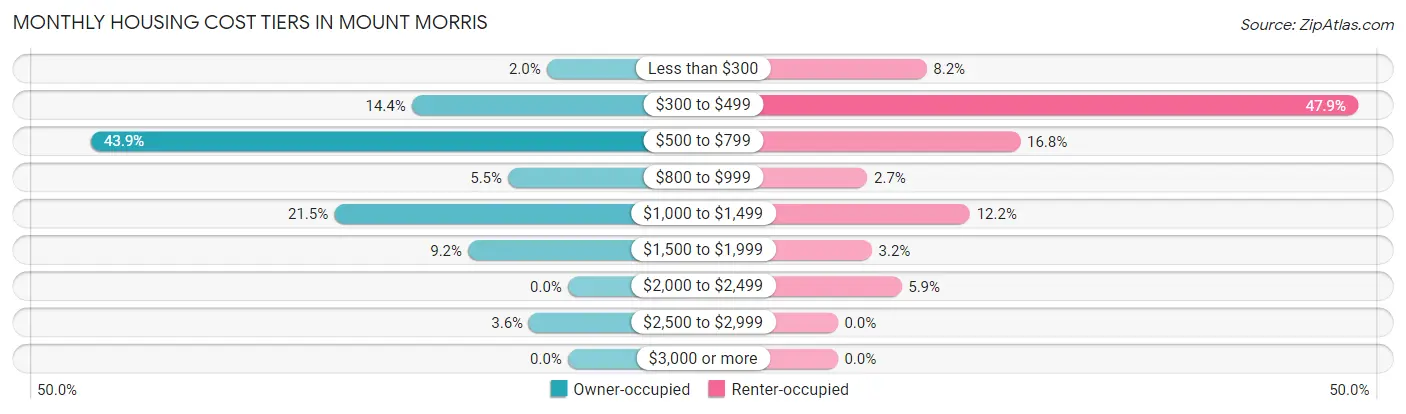
| Monthly Cost | Owner-occupied | Renter-occupied |
| Less than $300 | 18 (1.9%) | 39 (8.2%) |
| $300 to $499 | 133 (14.4%) | 228 (47.9%) |
| $500 to $799 | 406 (43.9%) | 80 (16.8%) |
| $800 to $999 | 51 (5.5%) | 13 (2.7%) |
| $1,000 to $1,499 | 199 (21.5%) | 58 (12.2%) |
| $1,500 to $1,999 | 85 (9.2%) | 15 (3.2%) |
| $2,000 to $2,499 | 0 (0.0%) | 28 (5.9%) |
| $2,500 to $2,999 | 33 (3.6%) | 0 (0.0%) |
| $3,000 or more | 0 (0.0%) | 0 (0.0%) |
| Total | 925 (100.0%) | 476 (100.0%) |
Physical Housing Characteristics in Mount Morris
Housing Structures in Mount Morris
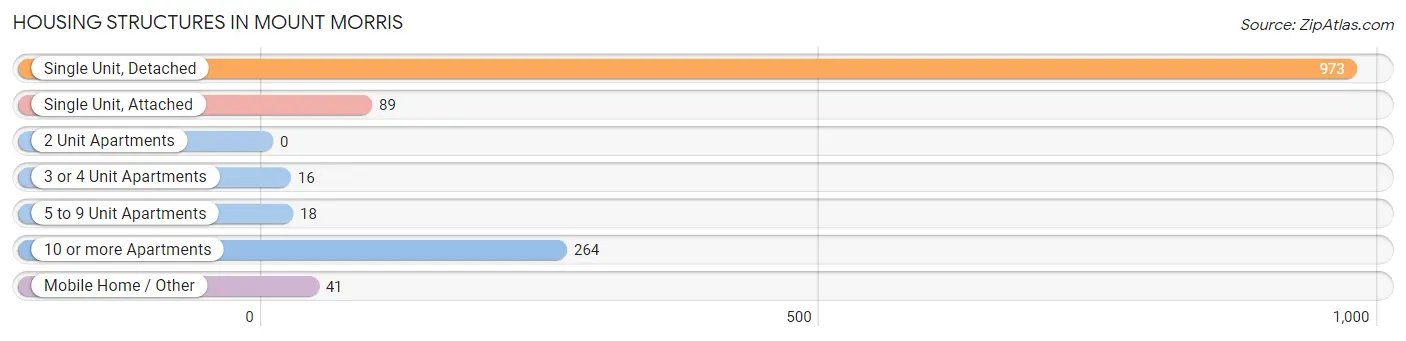
| Structure Type | # Housing Units | % Housing Units |
| Single Unit, Detached | 973 | 69.5% |
| Single Unit, Attached | 89 | 6.4% |
| 2 Unit Apartments | 0 | 0.0% |
| 3 or 4 Unit Apartments | 16 | 1.1% |
| 5 to 9 Unit Apartments | 18 | 1.3% |
| 10 or more Apartments | 264 | 18.8% |
| Mobile Home / Other | 41 | 2.9% |
| Total | 1,401 | 100.0% |
Housing Structures by Occupancy in Mount Morris
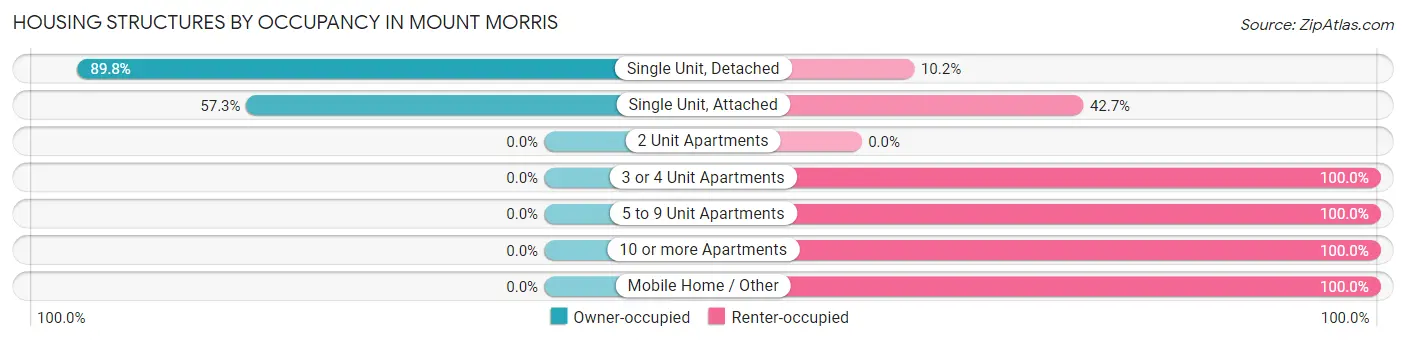
| Structure Type | Owner-occupied | Renter-occupied |
| Single Unit, Detached | 874 (89.8%) | 99 (10.2%) |
| Single Unit, Attached | 51 (57.3%) | 38 (42.7%) |
| 2 Unit Apartments | 0 (0.0%) | 0 (0.0%) |
| 3 or 4 Unit Apartments | 0 (0.0%) | 16 (100.0%) |
| 5 to 9 Unit Apartments | 0 (0.0%) | 18 (100.0%) |
| 10 or more Apartments | 0 (0.0%) | 264 (100.0%) |
| Mobile Home / Other | 0 (0.0%) | 41 (100.0%) |
| Total | 925 (66.0%) | 476 (34.0%) |
Housing Structures by Number of Rooms in Mount Morris
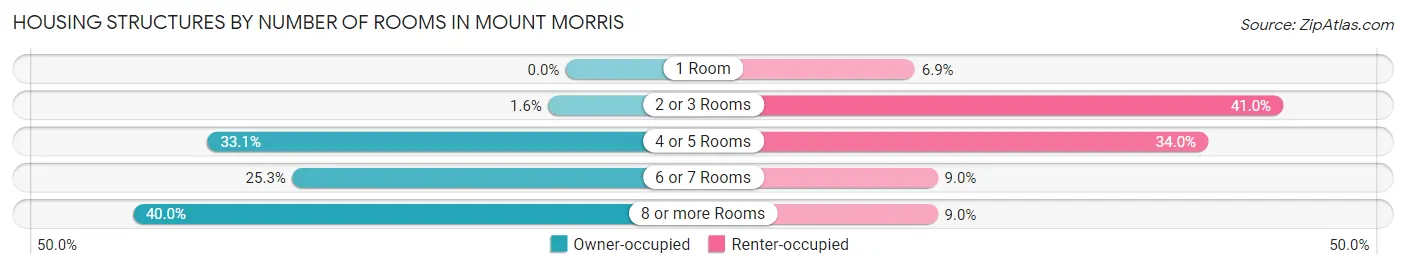
| Number of Rooms | Owner-occupied | Renter-occupied |
| 1 Room | 0 (0.0%) | 33 (6.9%) |
| 2 or 3 Rooms | 15 (1.6%) | 195 (41.0%) |
| 4 or 5 Rooms | 306 (33.1%) | 162 (34.0%) |
| 6 or 7 Rooms | 234 (25.3%) | 43 (9.0%) |
| 8 or more Rooms | 370 (40.0%) | 43 (9.0%) |
| Total | 925 (100.0%) | 476 (100.0%) |
Housing Structure by Heating Type in Mount Morris
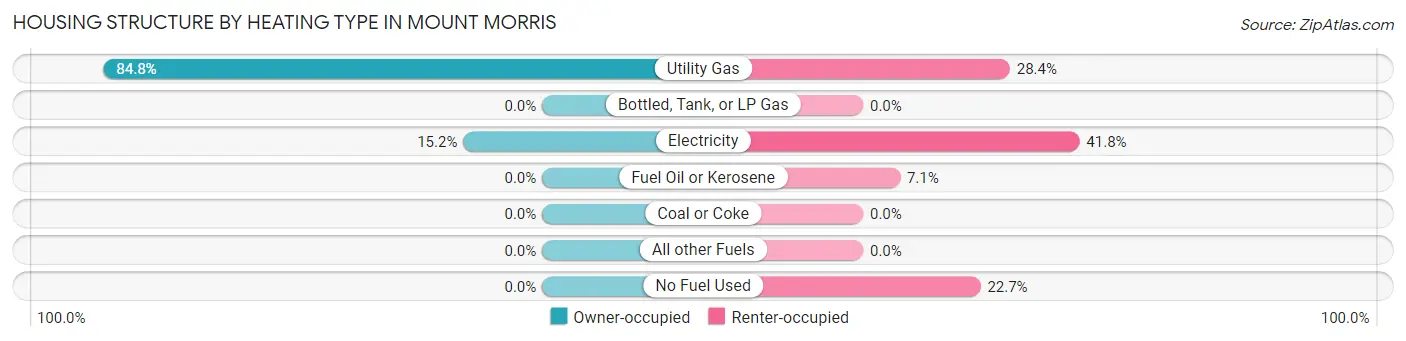
| Heating Type | Owner-occupied | Renter-occupied |
| Utility Gas | 784 (84.8%) | 135 (28.4%) |
| Bottled, Tank, or LP Gas | 0 (0.0%) | 0 (0.0%) |
| Electricity | 141 (15.2%) | 199 (41.8%) |
| Fuel Oil or Kerosene | 0 (0.0%) | 34 (7.1%) |
| Coal or Coke | 0 (0.0%) | 0 (0.0%) |
| All other Fuels | 0 (0.0%) | 0 (0.0%) |
| No Fuel Used | 0 (0.0%) | 108 (22.7%) |
| Total | 925 (100.0%) | 476 (100.0%) |
Household Vehicle Usage in Mount Morris
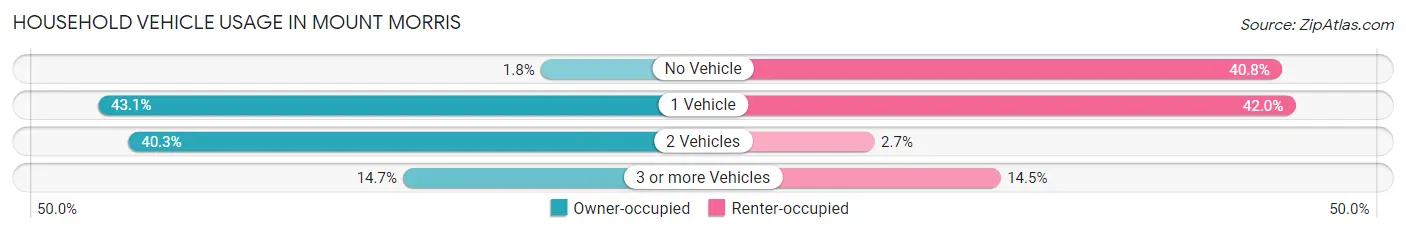
| Vehicles per Household | Owner-occupied | Renter-occupied |
| No Vehicle | 17 (1.8%) | 194 (40.8%) |
| 1 Vehicle | 399 (43.1%) | 200 (42.0%) |
| 2 Vehicles | 373 (40.3%) | 13 (2.7%) |
| 3 or more Vehicles | 136 (14.7%) | 69 (14.5%) |
| Total | 925 (100.0%) | 476 (100.0%) |
Real Estate & Mortgages in Mount Morris
Real Estate and Mortgage Overview in Mount Morris
| Characteristic | Without Mortgage | With Mortgage |
| Housing Units | 434 | 491 |
| Median Property Value | $129,600 | $115,800 |
| Median Household Income | $62,790 | $0 |
| Monthly Housing Costs | $555 | $0 |
| Real Estate Taxes | $2,794 | $54 |
Property Value by Mortgage Status in Mount Morris
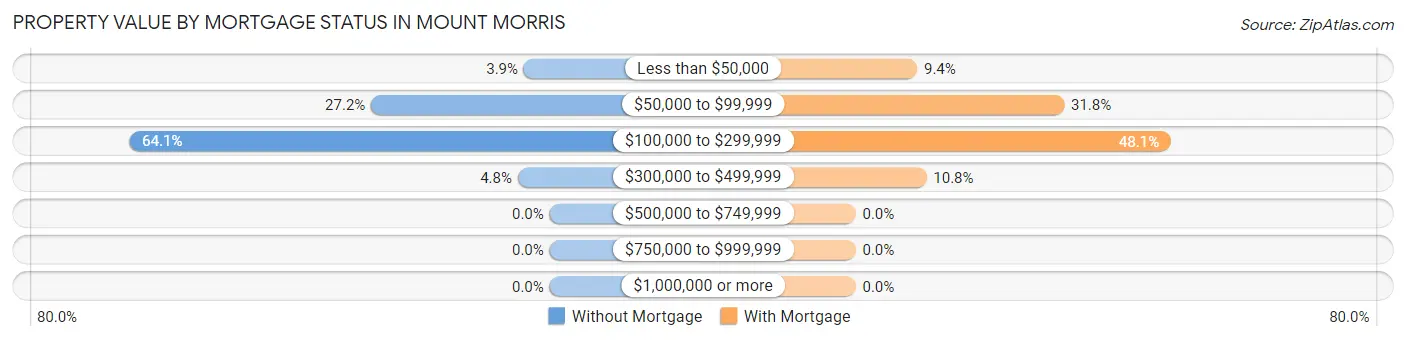
| Property Value | Without Mortgage | With Mortgage |
| Less than $50,000 | 17 (3.9%) | 46 (9.4%) |
| $50,000 to $99,999 | 118 (27.2%) | 156 (31.8%) |
| $100,000 to $299,999 | 278 (64.1%) | 236 (48.1%) |
| $300,000 to $499,999 | 21 (4.8%) | 53 (10.8%) |
| $500,000 to $749,999 | 0 (0.0%) | 0 (0.0%) |
| $750,000 to $999,999 | 0 (0.0%) | 0 (0.0%) |
| $1,000,000 or more | 0 (0.0%) | 0 (0.0%) |
| Total | 434 (100.0%) | 491 (100.0%) |
Household Income by Mortgage Status in Mount Morris
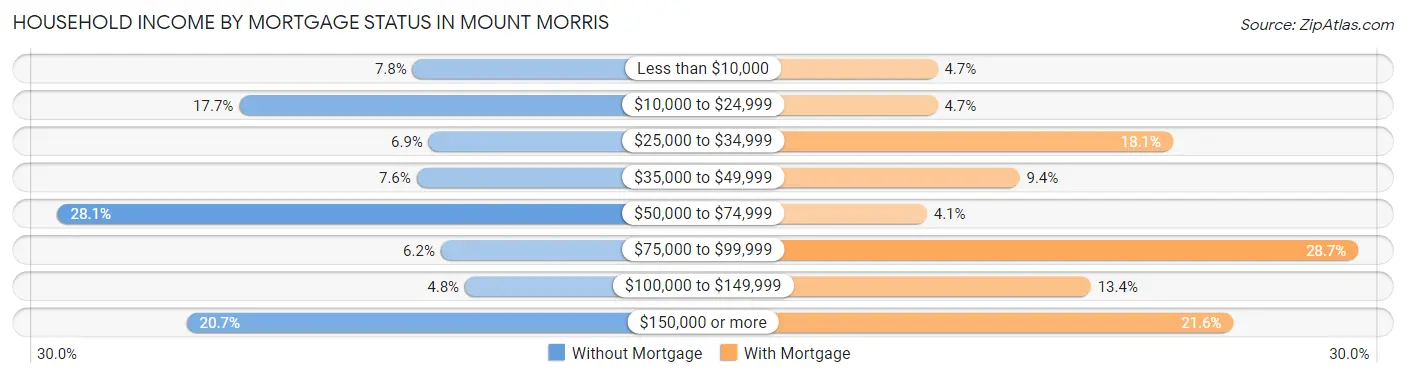
| Household Income | Without Mortgage | With Mortgage |
| Less than $10,000 | 34 (7.8%) | 23 (4.7%) |
| $10,000 to $24,999 | 77 (17.7%) | 23 (4.7%) |
| $25,000 to $34,999 | 30 (6.9%) | 89 (18.1%) |
| $35,000 to $49,999 | 33 (7.6%) | 46 (9.4%) |
| $50,000 to $74,999 | 122 (28.1%) | 20 (4.1%) |
| $75,000 to $99,999 | 27 (6.2%) | 141 (28.7%) |
| $100,000 to $149,999 | 21 (4.8%) | 66 (13.4%) |
| $150,000 or more | 90 (20.7%) | 106 (21.6%) |
| Total | 434 (100.0%) | 491 (100.0%) |
Property Value to Household Income Ratio in Mount Morris
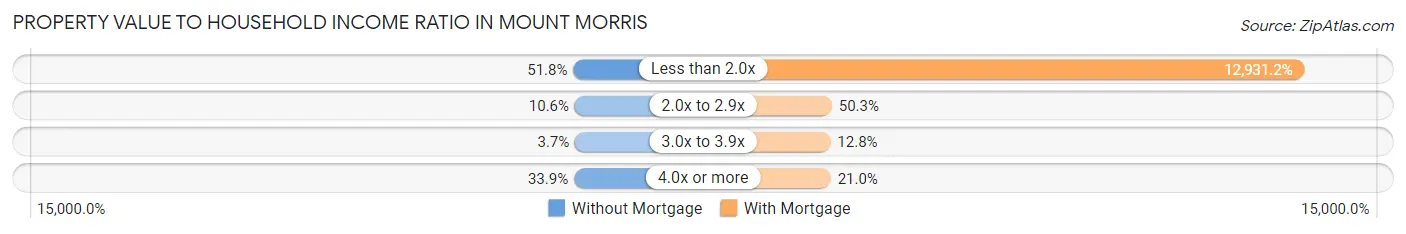
| Value-to-Income Ratio | Without Mortgage | With Mortgage |
| Less than 2.0x | 225 (51.8%) | 63,492 (12,931.2%) |
| 2.0x to 2.9x | 46 (10.6%) | 247 (50.3%) |
| 3.0x to 3.9x | 16 (3.7%) | 63 (12.8%) |
| 4.0x or more | 147 (33.9%) | 103 (21.0%) |
| Total | 434 (100.0%) | 491 (100.0%) |
Real Estate Taxes by Mortgage Status in Mount Morris
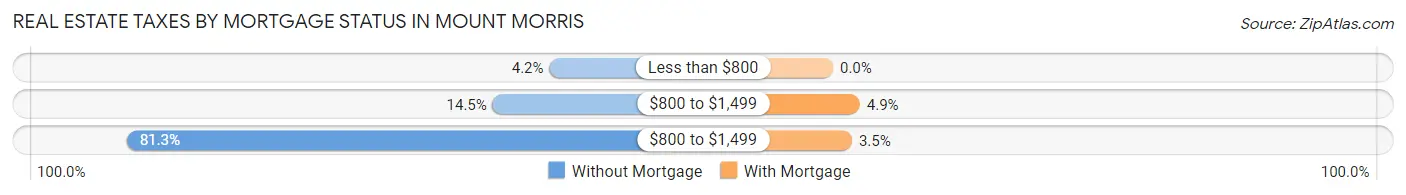
| Property Taxes | Without Mortgage | With Mortgage |
| Less than $800 | 18 (4.2%) | 0 (0.0%) |
| $800 to $1,499 | 63 (14.5%) | 24 (4.9%) |
| $800 to $1,499 | 353 (81.3%) | 17 (3.5%) |
| Total | 434 (100.0%) | 491 (100.0%) |
Health & Disability in Mount Morris
Health Insurance Coverage by Age in Mount Morris
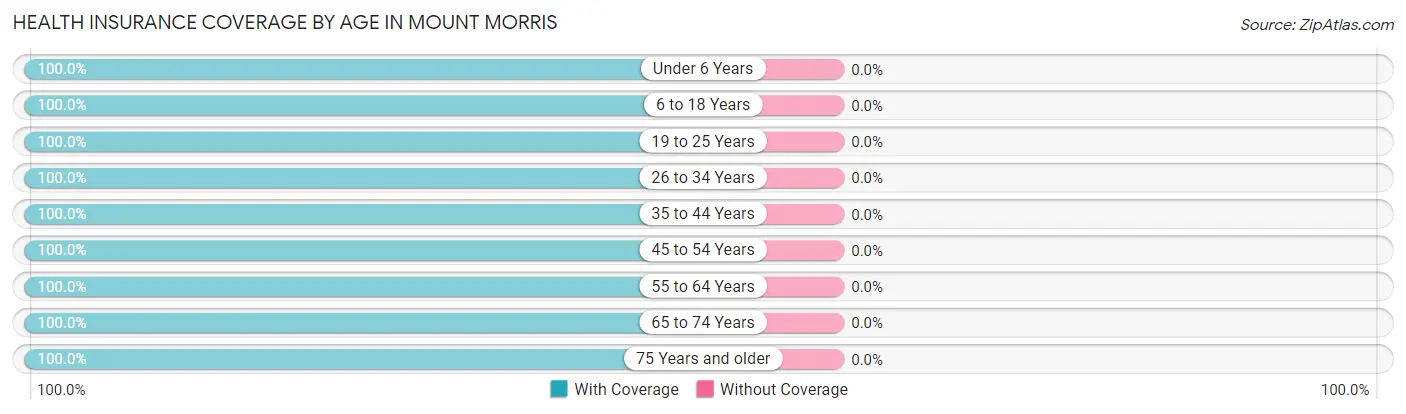
| Age Bracket | With Coverage | Without Coverage |
| Under 6 Years | 482 (100.0%) | 0 (0.0%) |
| 6 to 18 Years | 242 (100.0%) | 0 (0.0%) |
| 19 to 25 Years | 75 (100.0%) | 0 (0.0%) |
| 26 to 34 Years | 394 (100.0%) | 0 (0.0%) |
| 35 to 44 Years | 204 (100.0%) | 0 (0.0%) |
| 45 to 54 Years | 345 (100.0%) | 0 (0.0%) |
| 55 to 64 Years | 176 (100.0%) | 0 (0.0%) |
| 65 to 74 Years | 392 (100.0%) | 0 (0.0%) |
| 75 Years and older | 428 (100.0%) | 0 (0.0%) |
| Total | 2,738 (100.0%) | 0 (0.0%) |
Health Insurance Coverage by Citizenship Status in Mount Morris
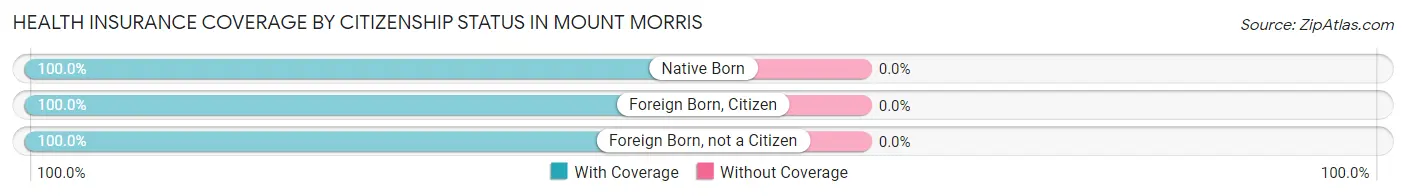
| Citizenship Status | With Coverage | Without Coverage |
| Native Born | 482 (100.0%) | 0 (0.0%) |
| Foreign Born, Citizen | 242 (100.0%) | 0 (0.0%) |
| Foreign Born, not a Citizen | 75 (100.0%) | 0 (0.0%) |
Health Insurance Coverage by Household Income in Mount Morris
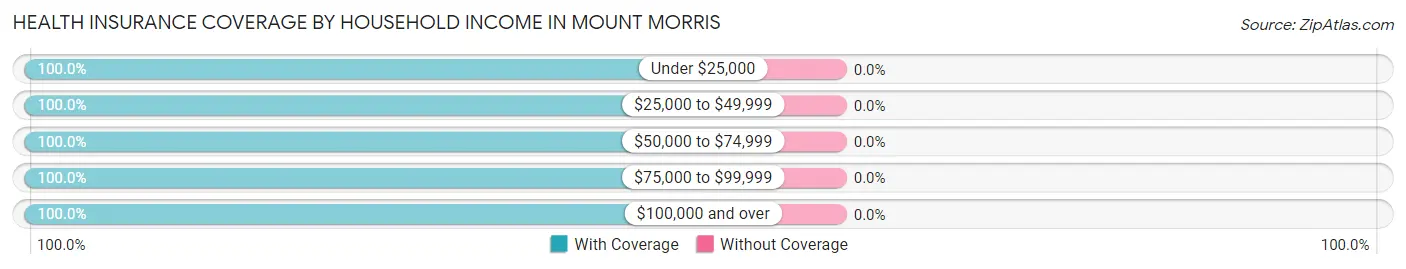
| Household Income | With Coverage | Without Coverage |
| Under $25,000 | 861 (100.0%) | 0 (0.0%) |
| $25,000 to $49,999 | 318 (100.0%) | 0 (0.0%) |
| $50,000 to $74,999 | 422 (100.0%) | 0 (0.0%) |
| $75,000 to $99,999 | 427 (100.0%) | 0 (0.0%) |
| $100,000 and over | 710 (100.0%) | 0 (0.0%) |
Public vs Private Health Insurance Coverage by Age in Mount Morris
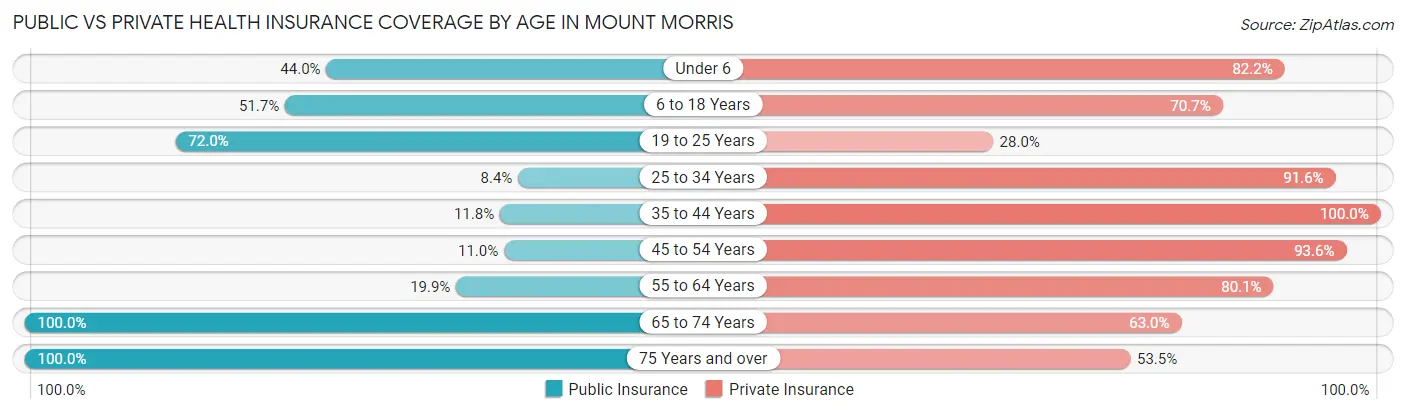
| Age Bracket | Public Insurance | Private Insurance |
| Under 6 | 212 (44.0%) | 396 (82.2%) |
| 6 to 18 Years | 125 (51.6%) | 171 (70.7%) |
| 19 to 25 Years | 54 (72.0%) | 21 (28.0%) |
| 25 to 34 Years | 33 (8.4%) | 361 (91.6%) |
| 35 to 44 Years | 24 (11.8%) | 204 (100.0%) |
| 45 to 54 Years | 38 (11.0%) | 323 (93.6%) |
| 55 to 64 Years | 35 (19.9%) | 141 (80.1%) |
| 65 to 74 Years | 392 (100.0%) | 247 (63.0%) |
| 75 Years and over | 428 (100.0%) | 229 (53.5%) |
| Total | 1,341 (49.0%) | 2,093 (76.4%) |
Disability Status by Sex by Age in Mount Morris
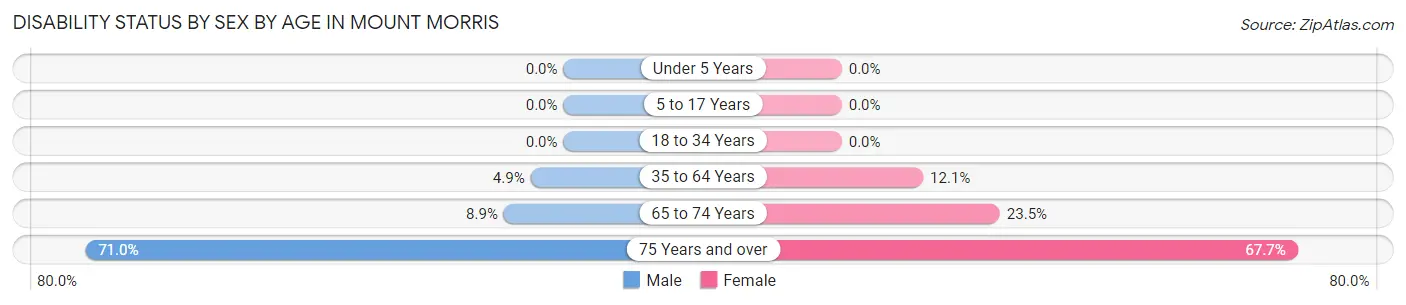
| Age Bracket | Male | Female |
| Under 5 Years | 0 (0.0%) | 0 (0.0%) |
| 5 to 17 Years | 0 (0.0%) | 0 (0.0%) |
| 18 to 34 Years | 0 (0.0%) | 0 (0.0%) |
| 35 to 64 Years | 18 (4.9%) | 43 (12.1%) |
| 65 to 74 Years | 23 (8.8%) | 31 (23.5%) |
| 75 Years and over | 93 (71.0%) | 201 (67.7%) |
Disability Class by Sex by Age in Mount Morris
Disability Class: Hearing Difficulty
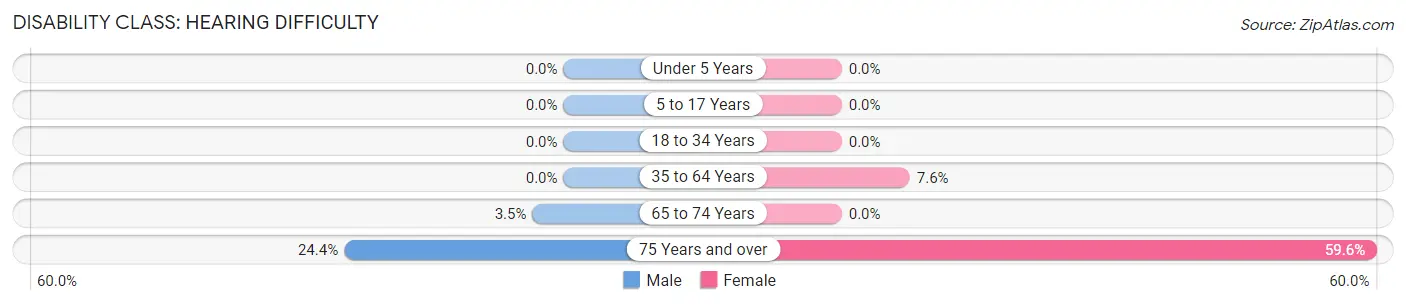
| Age Bracket | Male | Female |
| Under 5 Years | 0 (0.0%) | 0 (0.0%) |
| 5 to 17 Years | 0 (0.0%) | 0 (0.0%) |
| 18 to 34 Years | 0 (0.0%) | 0 (0.0%) |
| 35 to 64 Years | 0 (0.0%) | 27 (7.6%) |
| 65 to 74 Years | 9 (3.5%) | 0 (0.0%) |
| 75 Years and over | 32 (24.4%) | 177 (59.6%) |
Disability Class: Vision Difficulty
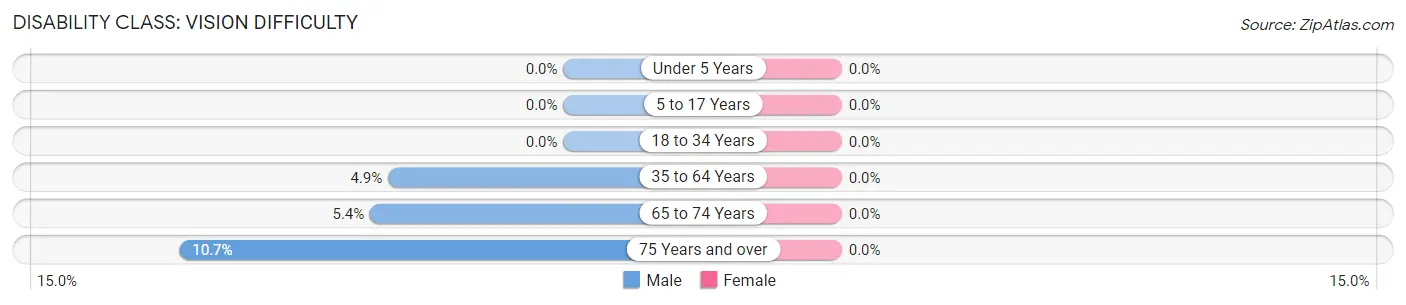
| Age Bracket | Male | Female |
| Under 5 Years | 0 (0.0%) | 0 (0.0%) |
| 5 to 17 Years | 0 (0.0%) | 0 (0.0%) |
| 18 to 34 Years | 0 (0.0%) | 0 (0.0%) |
| 35 to 64 Years | 18 (4.9%) | 0 (0.0%) |
| 65 to 74 Years | 14 (5.4%) | 0 (0.0%) |
| 75 Years and over | 14 (10.7%) | 0 (0.0%) |
Disability Class: Cognitive Difficulty
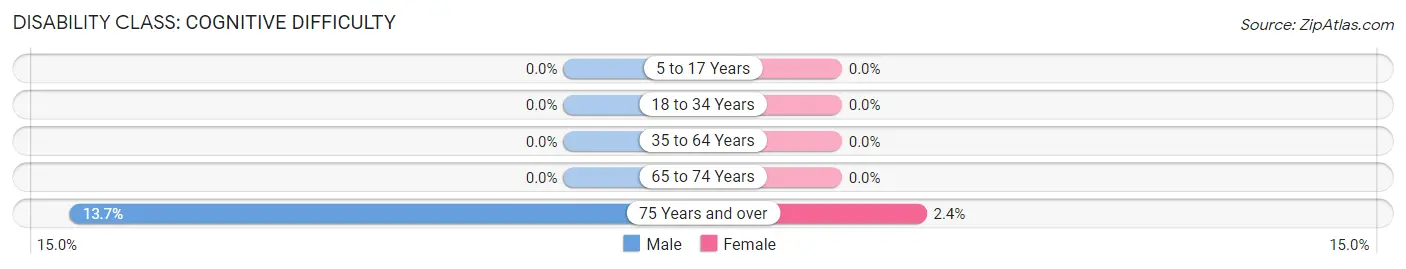
| Age Bracket | Male | Female |
| 5 to 17 Years | 0 (0.0%) | 0 (0.0%) |
| 18 to 34 Years | 0 (0.0%) | 0 (0.0%) |
| 35 to 64 Years | 0 (0.0%) | 0 (0.0%) |
| 65 to 74 Years | 0 (0.0%) | 0 (0.0%) |
| 75 Years and over | 18 (13.7%) | 7 (2.4%) |
Disability Class: Ambulatory Difficulty
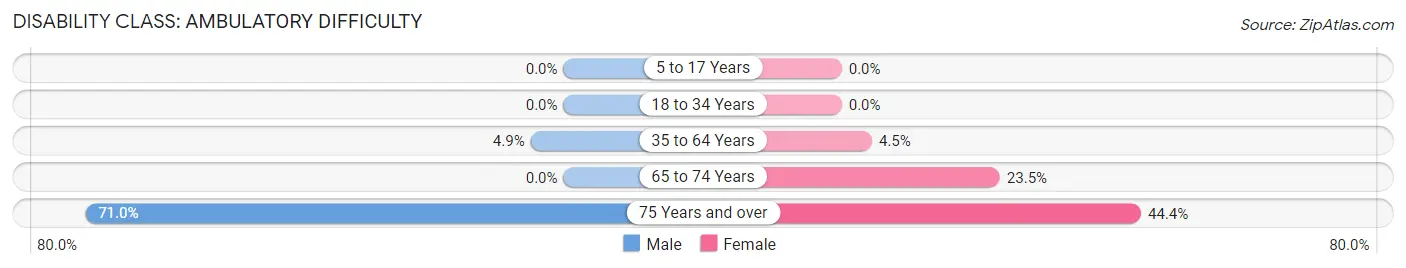
| Age Bracket | Male | Female |
| 5 to 17 Years | 0 (0.0%) | 0 (0.0%) |
| 18 to 34 Years | 0 (0.0%) | 0 (0.0%) |
| 35 to 64 Years | 18 (4.9%) | 16 (4.5%) |
| 65 to 74 Years | 0 (0.0%) | 31 (23.5%) |
| 75 Years and over | 93 (71.0%) | 132 (44.4%) |
Disability Class: Self-Care Difficulty
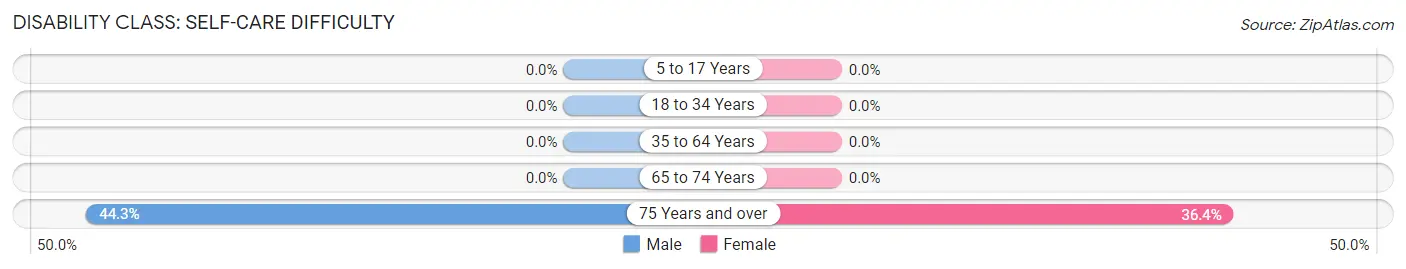
| Age Bracket | Male | Female |
| 5 to 17 Years | 0 (0.0%) | 0 (0.0%) |
| 18 to 34 Years | 0 (0.0%) | 0 (0.0%) |
| 35 to 64 Years | 0 (0.0%) | 0 (0.0%) |
| 65 to 74 Years | 0 (0.0%) | 0 (0.0%) |
| 75 Years and over | 58 (44.3%) | 108 (36.4%) |
Technology Access in Mount Morris
Computing Device Access in Mount Morris
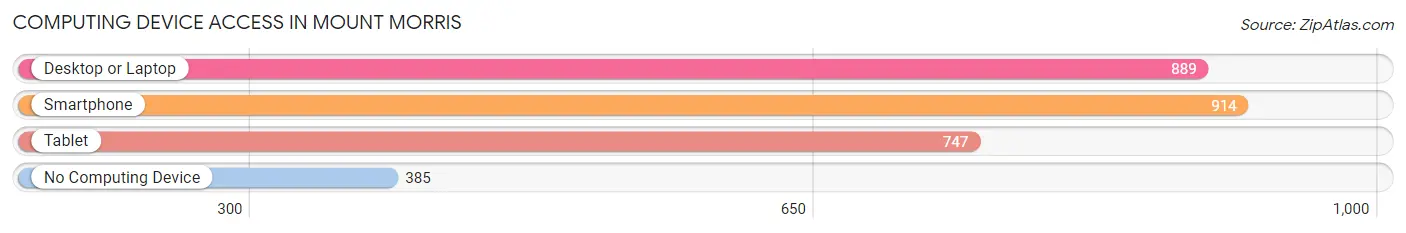
| Device Type | # Households | % Households |
| Desktop or Laptop | 889 | 63.4% |
| Smartphone | 914 | 65.2% |
| Tablet | 747 | 53.3% |
| No Computing Device | 385 | 27.5% |
| Total | 1,401 | 100.0% |
Internet Access in Mount Morris
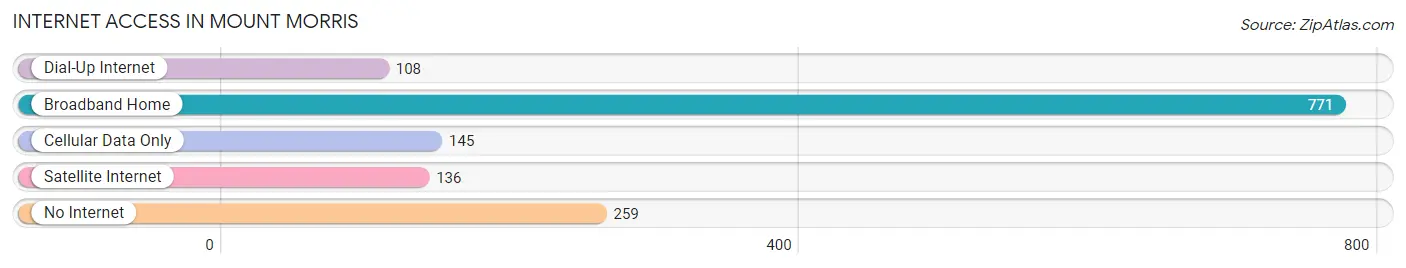
| Internet Type | # Households | % Households |
| Dial-Up Internet | 108 | 7.7% |
| Broadband Home | 771 | 55.0% |
| Cellular Data Only | 145 | 10.3% |
| Satellite Internet | 136 | 9.7% |
| No Internet | 259 | 18.5% |
| Total | 1,401 | 100.0% |
Mount Morris Summary
History
Mount Morris, Illinois is a small village located in Ogle County, Illinois. It is situated on the banks of the Rock River, about 25 miles northwest of Rockford. The village was founded in 1835 by a group of settlers from New York, led by William W. Morris. The village was named after Morris, who was a prominent local businessman and politician.
The village was originally a farming community, but it soon developed into a manufacturing center. In 1845, the first sawmill was built in the village, and by the late 19th century, the village had become a major producer of lumber and other wood products. The village also had a number of other industries, including a brickyard, a flour mill, a woolen mill, and a furniture factory.
In the early 20th century, the village experienced a period of growth and prosperity. The population increased from 1,000 in 1900 to over 3,000 by 1920. During this time, the village was home to a number of businesses, including a bank, a newspaper, a hotel, and several stores.
The Great Depression of the 1930s brought an end to the village’s prosperity. Many of the businesses closed, and the population declined to just over 1,000 by 1940. The village was able to recover somewhat during World War II, when the local industries produced goods for the war effort.
In the post-war years, the village experienced a period of slow growth. The population increased to just over 2,000 by 1970, and the village was able to attract new businesses, including a shopping center and a hospital.
Geography
Mount Morris is located in Ogle County, Illinois, about 25 miles northwest of Rockford. The village is situated on the banks of the Rock River, and is surrounded by rolling hills and farmland. The village is located in the Rock River Valley, which is part of the larger Illinois River Valley.
The village has a total area of 1.2 square miles, all of which is land. The village is located at an elevation of 745 feet above sea level. The climate in the area is characterized by hot, humid summers and cold, snowy winters.
Economy
The economy of Mount Morris is largely based on agriculture and manufacturing. The village is home to a number of small businesses, including a grocery store, a hardware store, and a restaurant. The village also has a number of industrial businesses, including a lumber mill, a furniture factory, and a brickyard.
The village is also home to a number of educational institutions, including a public school district, a community college, and a vocational school.
Demographics
As of the 2010 census, the population of Mount Morris was 2,541. The racial makeup of the village was 97.2% White, 0.7% African American, 0.2% Native American, 0.3% Asian, 0.1% Pacific Islander, 0.7% from other races, and 0.9% from two or more races. Hispanic or Latino of any race were 2.2% of the population.
The median income for a household in the village was $45,938, and the median income for a family was $51,938. The per capita income for the village was $20,938. About 8.2% of families and 10.2% of the population were below the poverty line, including 14.2% of those under age 18 and 5.2% of those age 65 or over.
Common Questions
What is Per Capita Income in Mount Morris?
Per Capita income in Mount Morris is $29,701.
What is the Median Family Income in Mount Morris?
Median Family Income in Mount Morris is $64,139.
What is the Median Household income in Mount Morris?
Median Household Income in Mount Morris is $38,359.
What is Income or Wage Gap in Mount Morris?
Income or Wage Gap in Mount Morris is 13.9%.
Women in Mount Morris earn 86.1 cents for every dollar earned by a man.
What is Inequality or Gini Index in Mount Morris?
Inequality or Gini Index in Mount Morris is 0.45.
What is the Total Population of Mount Morris?
Total Population of Mount Morris is 2,853.
What is the Total Male Population of Mount Morris?
Total Male Population of Mount Morris is 1,275.
What is the Total Female Population of Mount Morris?
Total Female Population of Mount Morris is 1,578.
What is the Ratio of Males per 100 Females in Mount Morris?
There are 80.80 Males per 100 Females in Mount Morris.
What is the Ratio of Females per 100 Males in Mount Morris?
There are 123.76 Females per 100 Males in Mount Morris.
What is the Median Population Age in Mount Morris?
Median Population Age in Mount Morris is 45.7 Years.
What is the Average Family Size in Mount Morris
Average Family Size in Mount Morris is 3.0 People.
What is the Average Household Size in Mount Morris
Average Household Size in Mount Morris is 1.9 People.
How Large is the Labor Force in Mount Morris?
There are 1,267 People in the Labor Forcein in Mount Morris.
What is the Percentage of People in the Labor Force in Mount Morris?
59.5% of People are in the Labor Force in Mount Morris.
What is the Unemployment Rate in Mount Morris?
Unemployment Rate in Mount Morris is 5.0%.