Mount Carroll, IL Map & Demographics
Mount Carroll Map
Mount Carroll Overview
$32,628
PER CAPITA INCOME
$82,000
AVG FAMILY INCOME
$63,992
AVG HOUSEHOLD INCOME
15.9%
WAGE / INCOME GAP [ % ]
84.1¢/ $1
WAGE / INCOME GAP [ $ ]
0.39
INEQUALITY / GINI INDEX
1,560
TOTAL POPULATION
705
MALE POPULATION
855
FEMALE POPULATION
82.46
MALES / 100 FEMALES
121.28
FEMALES / 100 MALES
44.9
MEDIAN AGE
2.8
AVG FAMILY SIZE
2.2
AVG HOUSEHOLD SIZE
862
LABOR FORCE [ PEOPLE ]
66.3%
PERCENT IN LABOR FORCE
2.6%
UNEMPLOYMENT RATE
Mount Carroll Zip Codes
Mount Carroll Area Codes
Income in Mount Carroll
Income Overview in Mount Carroll
Per Capita Income in Mount Carroll is $32,628, while median incomes of families and households are $82,000 and $63,992 respectively.
| Characteristic | Number | Measure |
| Per Capita Income | 1,560 | $32,628 |
| Median Family Income | 412 | $82,000 |
| Mean Family Income | 412 | $88,668 |
| Median Household Income | 669 | $63,992 |
| Mean Household Income | 669 | $75,472 |
| Income Deficit | 412 | $0 |
| Wage / Income Gap (%) | 1,560 | 15.91% |
| Wage / Income Gap ($) | 1,560 | 84.09¢ per $1 |
| Gini / Inequality Index | 1,560 | 0.39 |
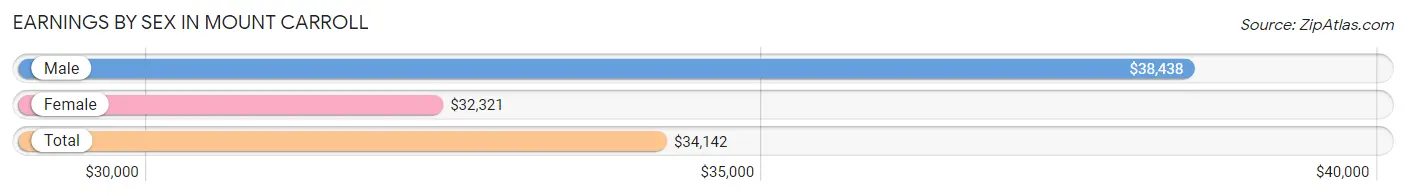
Earnings by Sex in Mount Carroll
Average Earnings in Mount Carroll are $34,142, $38,438 for men and $32,321 for women, a difference of 15.9%.
| Sex | Number | Average Earnings |
| Male | 449 (47.7%) | $38,438 |
| Female | 493 (52.3%) | $32,321 |
| Total | 942 (100.0%) | $34,142 |
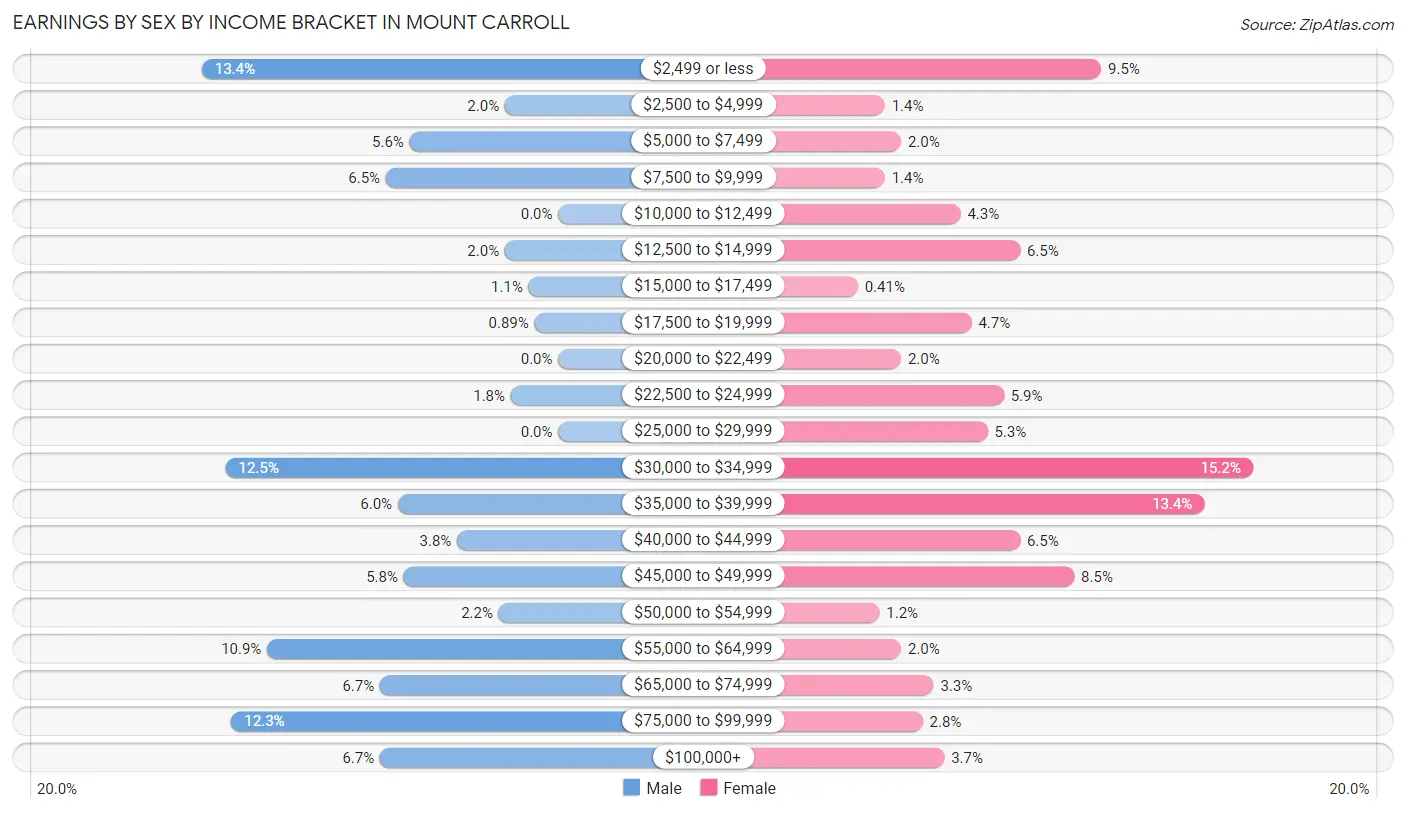
Earnings by Sex by Income Bracket in Mount Carroll
The most common earnings brackets in Mount Carroll are $2,499 or less for men (60 | 13.4%) and $30,000 to $34,999 for women (75 | 15.2%).
| Income | Male | Female |
| $2,499 or less | 60 (13.4%) | 47 (9.5%) |
| $2,500 to $4,999 | 9 (2.0%) | 7 (1.4%) |
| $5,000 to $7,499 | 25 (5.6%) | 10 (2.0%) |
| $7,500 to $9,999 | 29 (6.5%) | 7 (1.4%) |
| $10,000 to $12,499 | 0 (0.0%) | 21 (4.3%) |
| $12,500 to $14,999 | 9 (2.0%) | 32 (6.5%) |
| $15,000 to $17,499 | 5 (1.1%) | 2 (0.4%) |
| $17,500 to $19,999 | 4 (0.9%) | 23 (4.7%) |
| $20,000 to $22,499 | 0 (0.0%) | 10 (2.0%) |
| $22,500 to $24,999 | 8 (1.8%) | 29 (5.9%) |
| $25,000 to $29,999 | 0 (0.0%) | 26 (5.3%) |
| $30,000 to $34,999 | 56 (12.5%) | 75 (15.2%) |
| $35,000 to $39,999 | 27 (6.0%) | 66 (13.4%) |
| $40,000 to $44,999 | 17 (3.8%) | 32 (6.5%) |
| $45,000 to $49,999 | 26 (5.8%) | 42 (8.5%) |
| $50,000 to $54,999 | 10 (2.2%) | 6 (1.2%) |
| $55,000 to $64,999 | 49 (10.9%) | 10 (2.0%) |
| $65,000 to $74,999 | 30 (6.7%) | 16 (3.3%) |
| $75,000 to $99,999 | 55 (12.2%) | 14 (2.8%) |
| $100,000+ | 30 (6.7%) | 18 (3.6%) |
| Total | 449 (100.0%) | 493 (100.0%) |
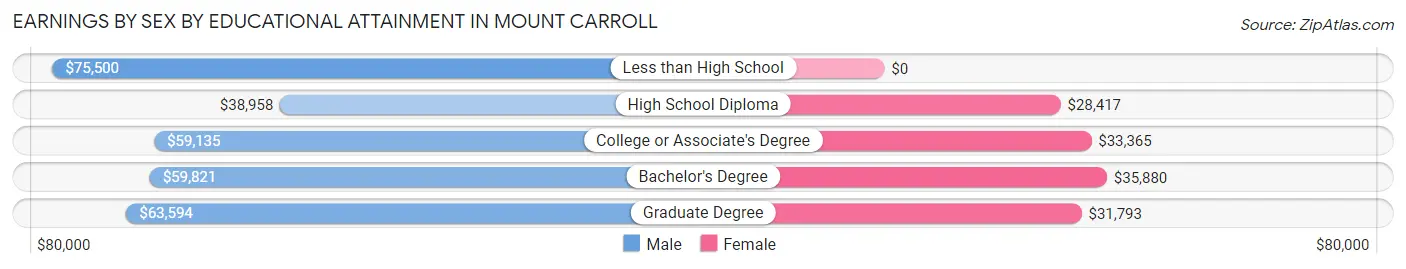
Earnings by Sex by Educational Attainment in Mount Carroll
Average earnings in Mount Carroll are $57,222 for men and $32,143 for women, a difference of 43.8%. Men with an educational attainment of less than high school enjoy the highest average annual earnings of $75,500, while those with high school diploma education earn the least with $38,958. Women with an educational attainment of bachelor's degree earn the most with the average annual earnings of $35,880, while those with high school diploma education have the smallest earnings of $28,417.
| Educational Attainment | Male Income | Female Income |
| Less than High School | $75,500 | $0 |
| High School Diploma | $38,958 | $28,417 |
| College or Associate's Degree | $59,135 | $33,365 |
| Bachelor's Degree | $59,821 | $35,880 |
| Graduate Degree | $63,594 | $31,793 |
| Total | $57,222 | $32,143 |
Family Income in Mount Carroll
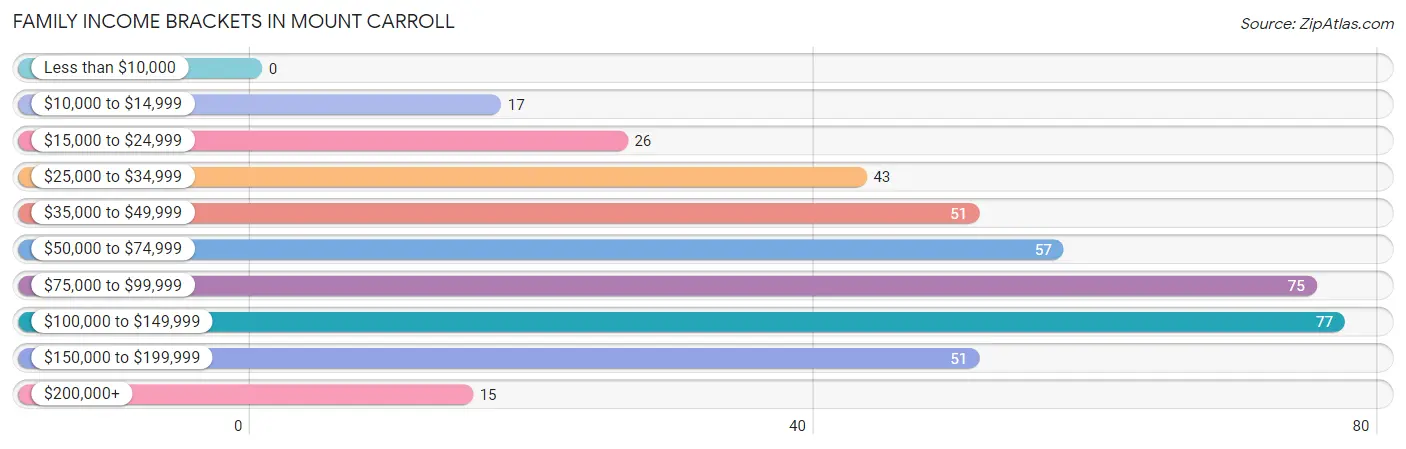
Family Income Brackets in Mount Carroll
According to the Mount Carroll family income data, there are 77 families falling into the $100,000 to $149,999 income range, which is the most common income bracket and makes up 18.7% of all families.
| Income Bracket | # Families | % Families |
| Less than $10,000 | 0 | 0.0% |
| $10,000 to $14,999 | 17 | 4.1% |
| $15,000 to $24,999 | 26 | 6.3% |
| $25,000 to $34,999 | 43 | 10.4% |
| $35,000 to $49,999 | 51 | 12.4% |
| $50,000 to $74,999 | 57 | 13.8% |
| $75,000 to $99,999 | 75 | 18.2% |
| $100,000 to $149,999 | 77 | 18.7% |
| $150,000 to $199,999 | 51 | 12.4% |
| $200,000+ | 15 | 3.6% |
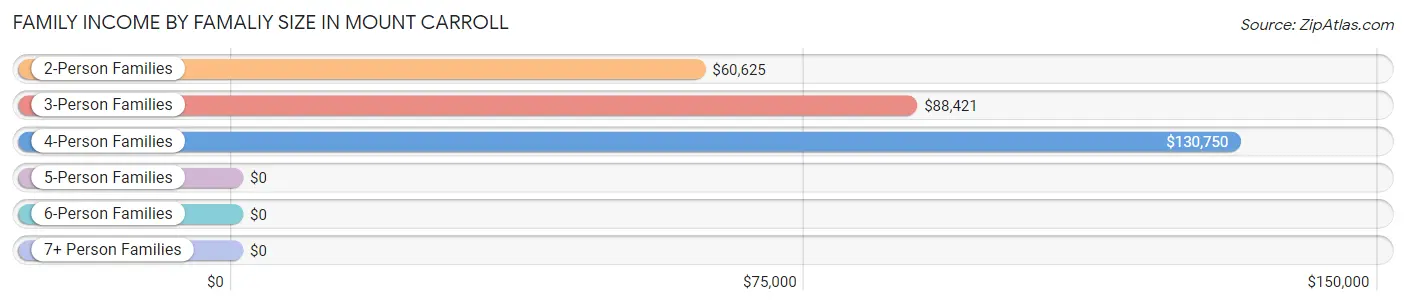
Family Income by Famaliy Size in Mount Carroll
4-person families (65 | 15.8%) account for the highest median family income in Mount Carroll with $130,750 per family, while 4-person families (65 | 15.8%) have the highest median income of $32,688 per family member.
| Income Bracket | # Families | Median Income |
| 2-Person Families | 233 (56.6%) | $60,625 |
| 3-Person Families | 86 (20.9%) | $88,421 |
| 4-Person Families | 65 (15.8%) | $130,750 |
| 5-Person Families | 19 (4.6%) | $0 |
| 6-Person Families | 4 (1.0%) | $0 |
| 7+ Person Families | 5 (1.2%) | $0 |
| Total | 412 (100.0%) | $82,000 |
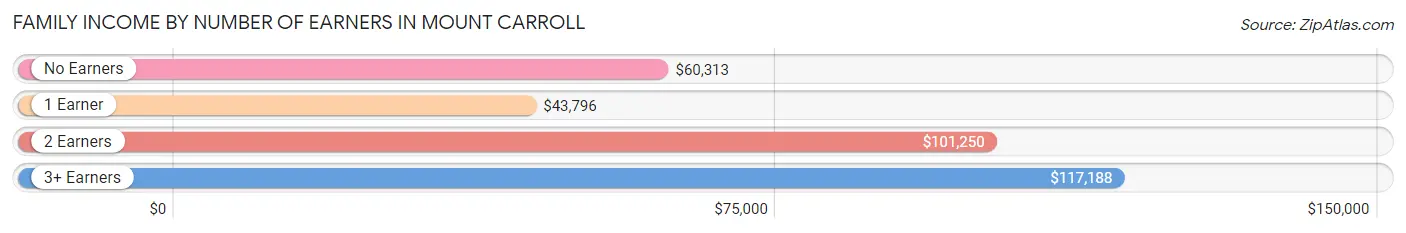
Family Income by Number of Earners in Mount Carroll
The median family income in Mount Carroll is $82,000, with families comprising 3+ earners (45) having the highest median family income of $117,188, while families with 1 earner (140) have the lowest median family income of $43,796, accounting for 10.9% and 34.0% of families, respectively.
| Number of Earners | # Families | Median Income |
| No Earners | 45 (10.9%) | $60,313 |
| 1 Earner | 140 (34.0%) | $43,796 |
| 2 Earners | 182 (44.2%) | $101,250 |
| 3+ Earners | 45 (10.9%) | $117,188 |
| Total | 412 (100.0%) | $82,000 |
Household Income in Mount Carroll
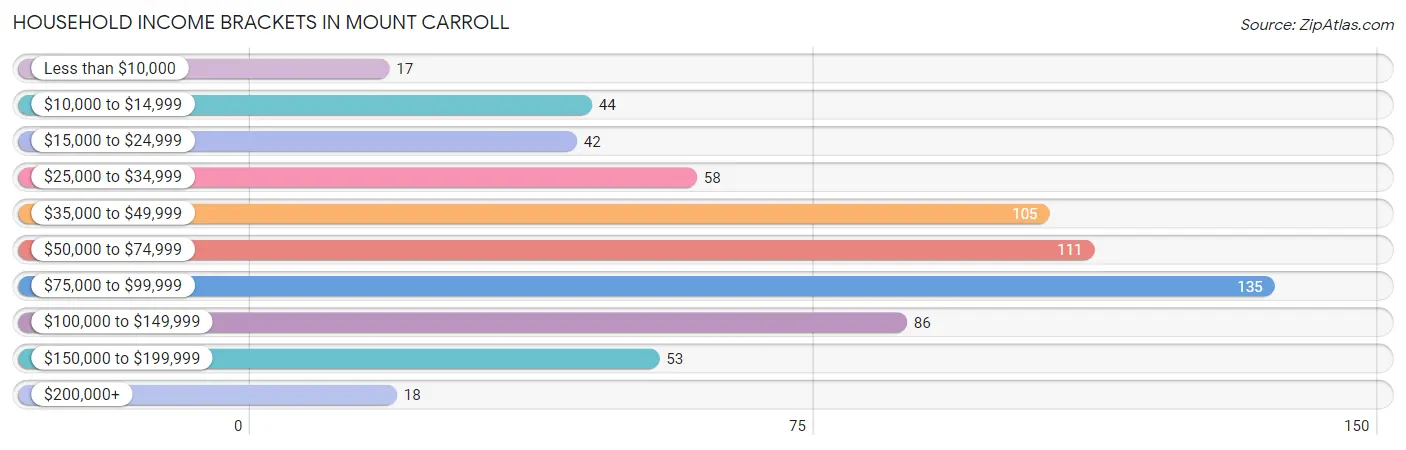
Household Income Brackets in Mount Carroll
With 135 households falling in the category, the $75,000 to $99,999 income range is the most frequent in Mount Carroll, accounting for 20.2% of all households. In contrast, only 17 households (2.5%) fall into the less than $10,000 income bracket, making it the least populous group.
| Income Bracket | # Households | % Households |
| Less than $10,000 | 17 | 2.5% |
| $10,000 to $14,999 | 44 | 6.6% |
| $15,000 to $24,999 | 42 | 6.3% |
| $25,000 to $34,999 | 58 | 8.7% |
| $35,000 to $49,999 | 105 | 15.7% |
| $50,000 to $74,999 | 111 | 16.6% |
| $75,000 to $99,999 | 135 | 20.2% |
| $100,000 to $149,999 | 86 | 12.9% |
| $150,000 to $199,999 | 53 | 7.9% |
| $200,000+ | 18 | 2.7% |
Household Income by Householder Age in Mount Carroll
The median household income in Mount Carroll is $63,992, with the highest median household income of $81,167 found in the 45 to 64 years age bracket for the primary householder. A total of 260 households (38.9%) fall into this category. Meanwhile, the 15 to 24 years age bracket for the primary householder has the lowest median household income of $0, with 41 households (6.1%) in this group.
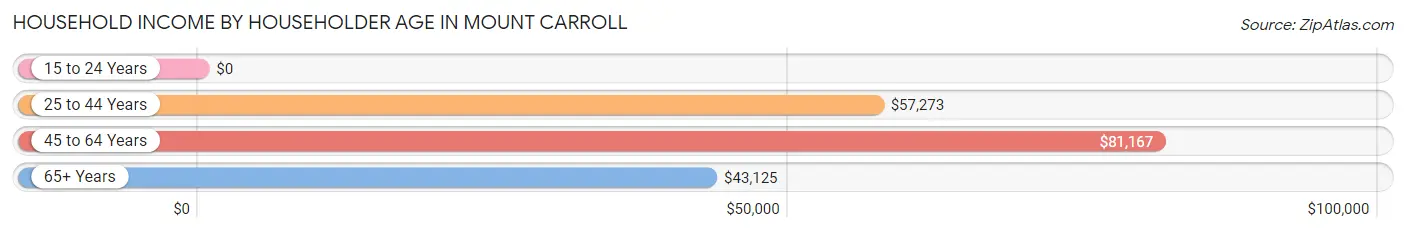
| Income Bracket | # Households | Median Income |
| 15 to 24 Years | 41 (6.1%) | $0 |
| 25 to 44 Years | 184 (27.5%) | $57,273 |
| 45 to 64 Years | 260 (38.9%) | $81,167 |
| 65+ Years | 184 (27.5%) | $43,125 |
| Total | 669 (100.0%) | $63,992 |
Poverty in Mount Carroll
Income Below Poverty by Sex and Age in Mount Carroll
With 6.6% poverty level for males and 11.8% for females among the residents of Mount Carroll, 15 year old males and 5 year old females are the most vulnerable to poverty, with 2 males (50.0%) and 7 females (46.7%) in their respective age groups living below the poverty level.
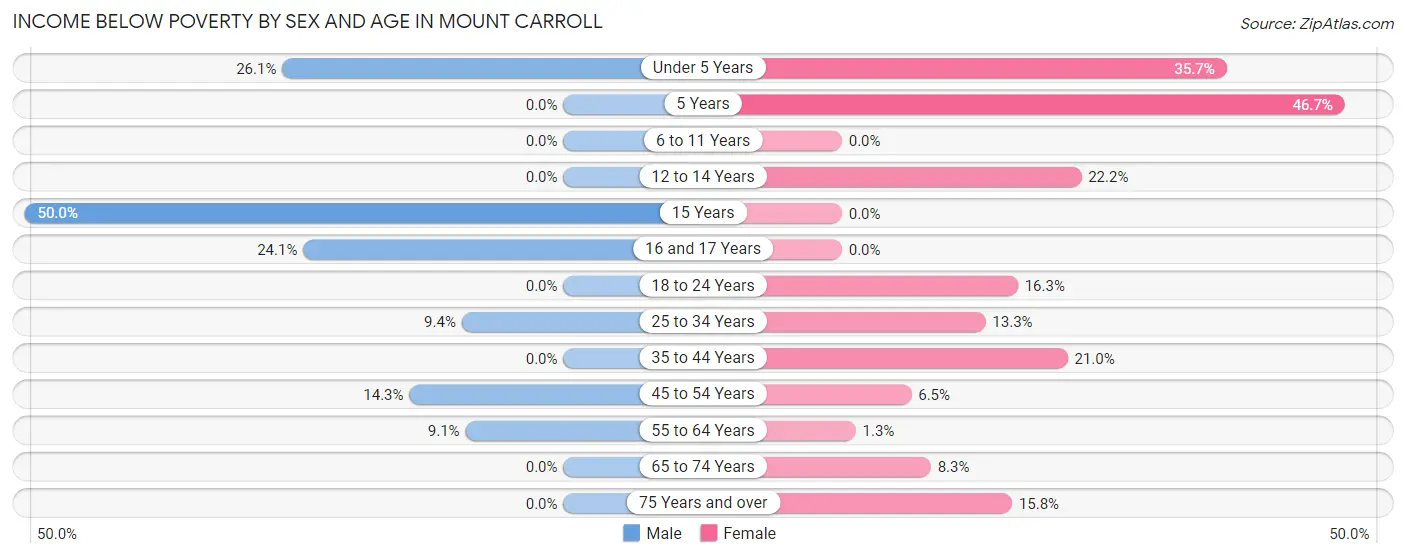
| Age Bracket | Male | Female |
| Under 5 Years | 6 (26.1%) | 10 (35.7%) |
| 5 Years | 0 (0.0%) | 7 (46.7%) |
| 6 to 11 Years | 0 (0.0%) | 0 (0.0%) |
| 12 to 14 Years | 0 (0.0%) | 10 (22.2%) |
| 15 Years | 2 (50.0%) | 0 (0.0%) |
| 16 and 17 Years | 7 (24.1%) | 0 (0.0%) |
| 18 to 24 Years | 0 (0.0%) | 8 (16.3%) |
| 25 to 34 Years | 5 (9.4%) | 14 (13.3%) |
| 35 to 44 Years | 0 (0.0%) | 22 (20.9%) |
| 45 to 54 Years | 15 (14.3%) | 6 (6.5%) |
| 55 to 64 Years | 9 (9.1%) | 2 (1.3%) |
| 65 to 74 Years | 0 (0.0%) | 8 (8.3%) |
| 75 Years and over | 0 (0.0%) | 9 (15.8%) |
| Total | 44 (6.6%) | 96 (11.8%) |
Income Above Poverty by Sex and Age in Mount Carroll
According to the poverty statistics in Mount Carroll, males aged 5 years and females aged 6 to 11 years are the age groups that are most secure financially, with 100.0% of males and 100.0% of females in these age groups living above the poverty line.

| Age Bracket | Male | Female |
| Under 5 Years | 17 (73.9%) | 18 (64.3%) |
| 5 Years | 4 (100.0%) | 8 (53.3%) |
| 6 to 11 Years | 48 (100.0%) | 52 (100.0%) |
| 12 to 14 Years | 27 (100.0%) | 35 (77.8%) |
| 15 Years | 2 (50.0%) | 12 (100.0%) |
| 16 and 17 Years | 22 (75.9%) | 2 (100.0%) |
| 18 to 24 Years | 119 (100.0%) | 41 (83.7%) |
| 25 to 34 Years | 48 (90.6%) | 91 (86.7%) |
| 35 to 44 Years | 46 (100.0%) | 83 (79.0%) |
| 45 to 54 Years | 90 (85.7%) | 87 (93.5%) |
| 55 to 64 Years | 90 (90.9%) | 154 (98.7%) |
| 65 to 74 Years | 78 (100.0%) | 89 (91.7%) |
| 75 Years and over | 36 (100.0%) | 48 (84.2%) |
| Total | 627 (93.4%) | 720 (88.2%) |
Income Below Poverty Among Married-Couple Families in Mount Carroll
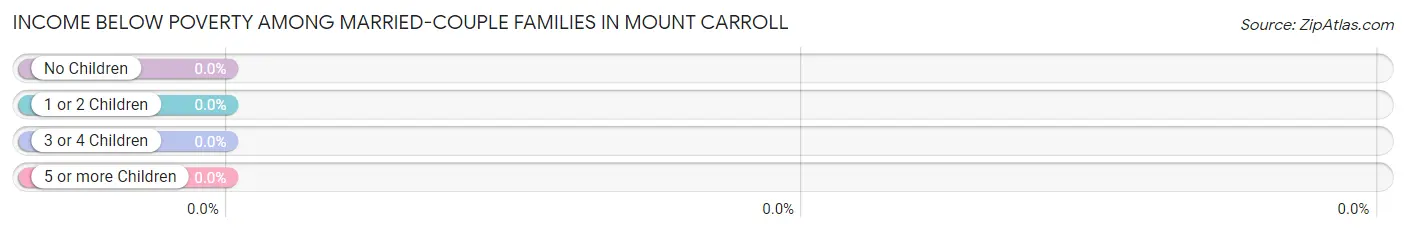
| Children | Above Poverty | Below Poverty |
| No Children | 207 (100.0%) | 0 (0.0%) |
| 1 or 2 Children | 71 (100.0%) | 0 (0.0%) |
| 3 or 4 Children | 10 (100.0%) | 0 (0.0%) |
| 5 or more Children | 5 (100.0%) | 0 (0.0%) |
| Total | 293 (100.0%) | 0 (0.0%) |
Income Below Poverty Among Single-Parent Households in Mount Carroll
According to the poverty data in Mount Carroll, 11.8% or 2 single-father households and 26.5% or 27 single-mother households are living below the poverty line. Among single-father households, those with 1 or 2 children have the highest poverty rate, with 2 households (11.8%) experiencing poverty. Likewise, among single-mother households, those with 3 or 4 children have the highest poverty rate, with 7 households (70.0%) falling below the poverty line.
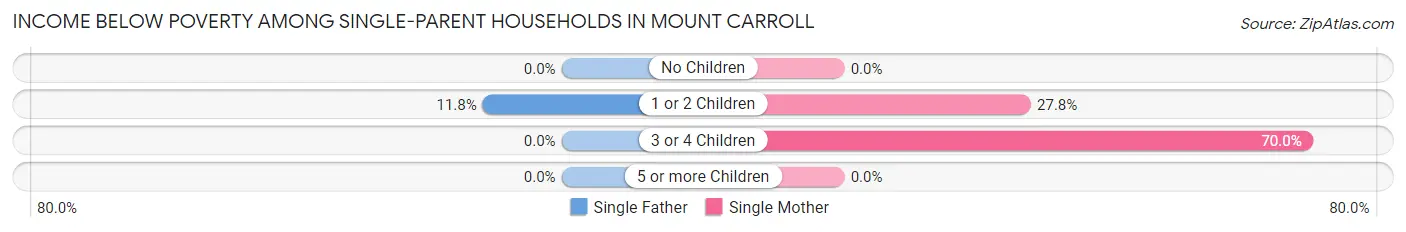
| Children | Single Father | Single Mother |
| No Children | 0 (0.0%) | 0 (0.0%) |
| 1 or 2 Children | 2 (11.8%) | 20 (27.8%) |
| 3 or 4 Children | 0 (0.0%) | 7 (70.0%) |
| 5 or more Children | 0 (0.0%) | 0 (0.0%) |
| Total | 2 (11.8%) | 27 (26.5%) |
Income Below Poverty Among Married-Couple vs Single-Parent Households in Mount Carroll
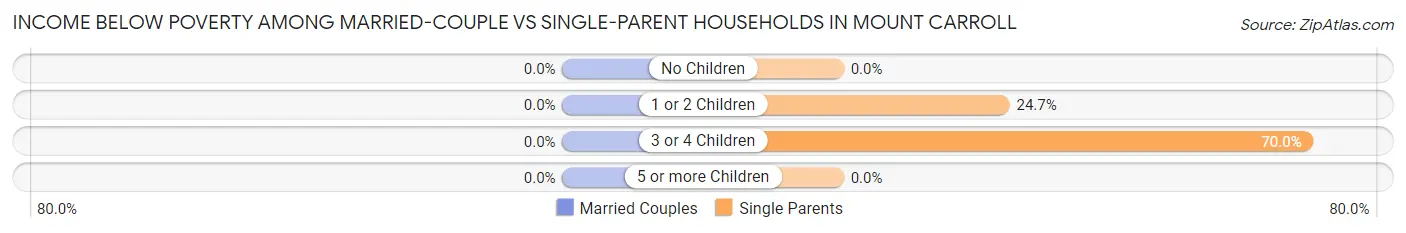
| Children | Married-Couple Families | Single-Parent Households |
| No Children | 0 (0.0%) | 0 (0.0%) |
| 1 or 2 Children | 0 (0.0%) | 22 (24.7%) |
| 3 or 4 Children | 0 (0.0%) | 7 (70.0%) |
| 5 or more Children | 0 (0.0%) | 0 (0.0%) |
| Total | 0 (0.0%) | 29 (24.4%) |
Race in Mount Carroll
The most populous races in Mount Carroll are White / Caucasian (1,473 | 94.4%), Hispanic or Latino (64 | 4.1%), and Two or more Races (32 | 2.1%).
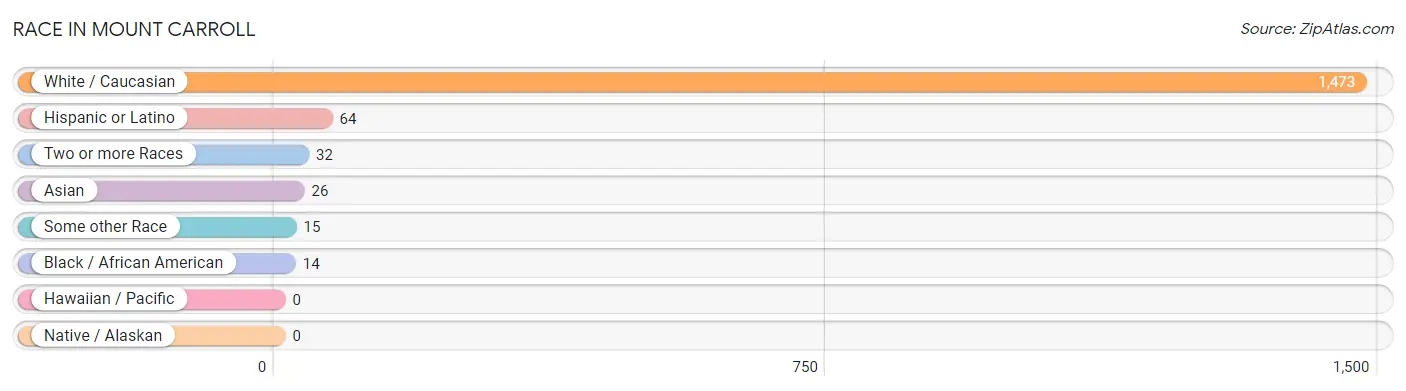
| Race | # Population | % Population |
| Asian | 26 | 1.7% |
| Black / African American | 14 | 0.9% |
| Hawaiian / Pacific | 0 | 0.0% |
| Hispanic or Latino | 64 | 4.1% |
| Native / Alaskan | 0 | 0.0% |
| White / Caucasian | 1,473 | 94.4% |
| Two or more Races | 32 | 2.1% |
| Some other Race | 15 | 1.0% |
| Total | 1,560 | 100.0% |
Ancestry in Mount Carroll
The most populous ancestries reported in Mount Carroll are German (552 | 35.4%), American (194 | 12.4%), Irish (168 | 10.8%), English (134 | 8.6%), and French Canadian (43 | 2.8%), together accounting for 69.9% of all Mount Carroll residents.
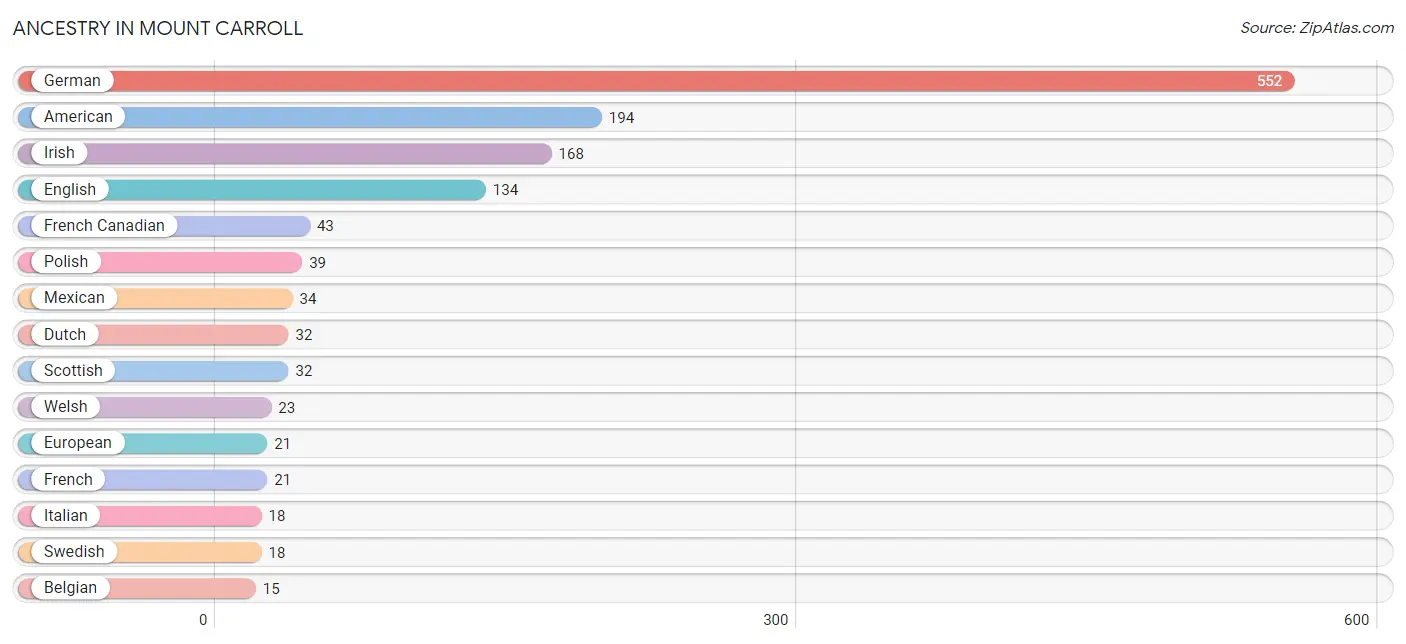
| Ancestry | # Population | % Population |
| American | 194 | 12.4% |
| Austrian | 2 | 0.1% |
| Belgian | 15 | 1.0% |
| British | 3 | 0.2% |
| Canadian | 4 | 0.3% |
| Central American | 5 | 0.3% |
| Croatian | 10 | 0.6% |
| Czech | 10 | 0.6% |
| Danish | 5 | 0.3% |
| Dutch | 32 | 2.1% |
| Eastern European | 8 | 0.5% |
| English | 134 | 8.6% |
| European | 21 | 1.3% |
| French | 21 | 1.3% |
| French Canadian | 43 | 2.8% |
| German | 552 | 35.4% |
| Greek | 2 | 0.1% |
| Hungarian | 13 | 0.8% |
| Indian (Asian) | 4 | 0.3% |
| Irish | 168 | 10.8% |
| Italian | 18 | 1.1% |
| Lithuanian | 6 | 0.4% |
| Mexican | 34 | 2.2% |
| Norwegian | 6 | 0.4% |
| Polish | 39 | 2.5% |
| Puerto Rican | 14 | 0.9% |
| Russian | 7 | 0.4% |
| Salvadoran | 5 | 0.3% |
| Scotch-Irish | 10 | 0.6% |
| Scottish | 32 | 2.1% |
| Sri Lankan | 2 | 0.1% |
| Swedish | 18 | 1.1% |
| Welsh | 23 | 1.5% | View All 33 Rows |
Immigrants in Mount Carroll
The most numerous immigrant groups reported in Mount Carroll came from Asia (26 | 1.7%), Pakistan (20 | 1.3%), South Central Asia (20 | 1.3%), Europe (9 | 0.6%), and Canada (6 | 0.4%), together accounting for 5.2% of all Mount Carroll residents.
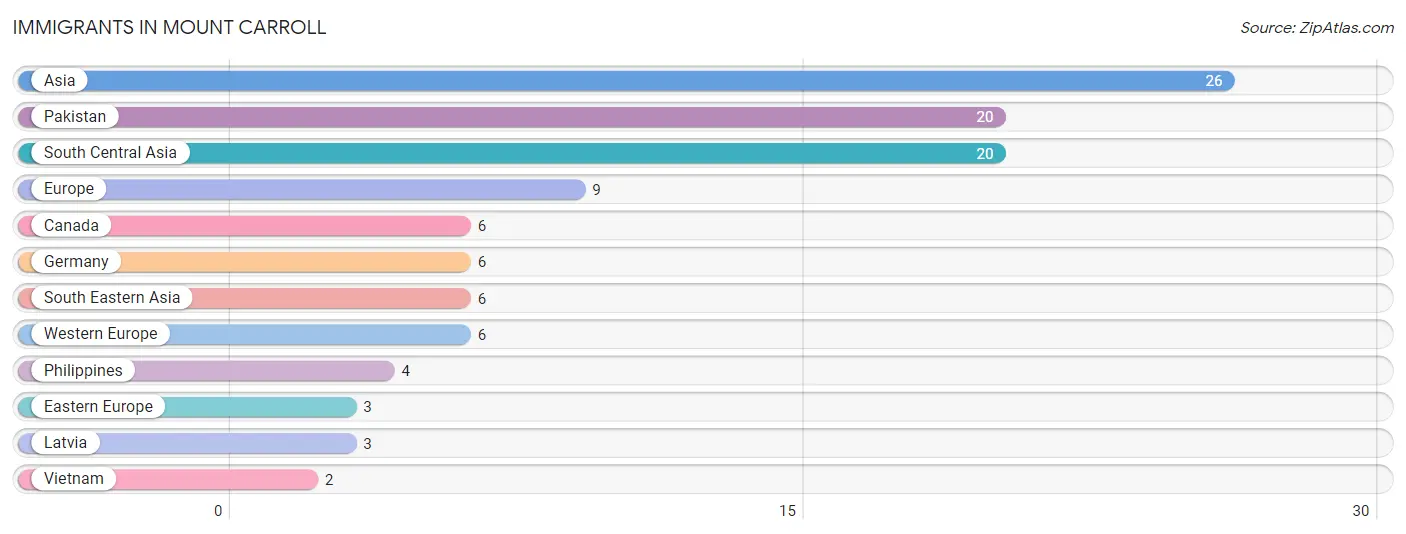
| Immigration Origin | # Population | % Population |
| Asia | 26 | 1.7% |
| Canada | 6 | 0.4% |
| Eastern Europe | 3 | 0.2% |
| Europe | 9 | 0.6% |
| Germany | 6 | 0.4% |
| Latvia | 3 | 0.2% |
| Pakistan | 20 | 1.3% |
| Philippines | 4 | 0.3% |
| South Central Asia | 20 | 1.3% |
| South Eastern Asia | 6 | 0.4% |
| Vietnam | 2 | 0.1% |
| Western Europe | 6 | 0.4% | View All 12 Rows |
Sex and Age in Mount Carroll
Sex and Age in Mount Carroll
The most populous age groups in Mount Carroll are 20 to 24 Years (104 | 14.7%) for men and 60 to 64 Years (94 | 11.0%) for women.
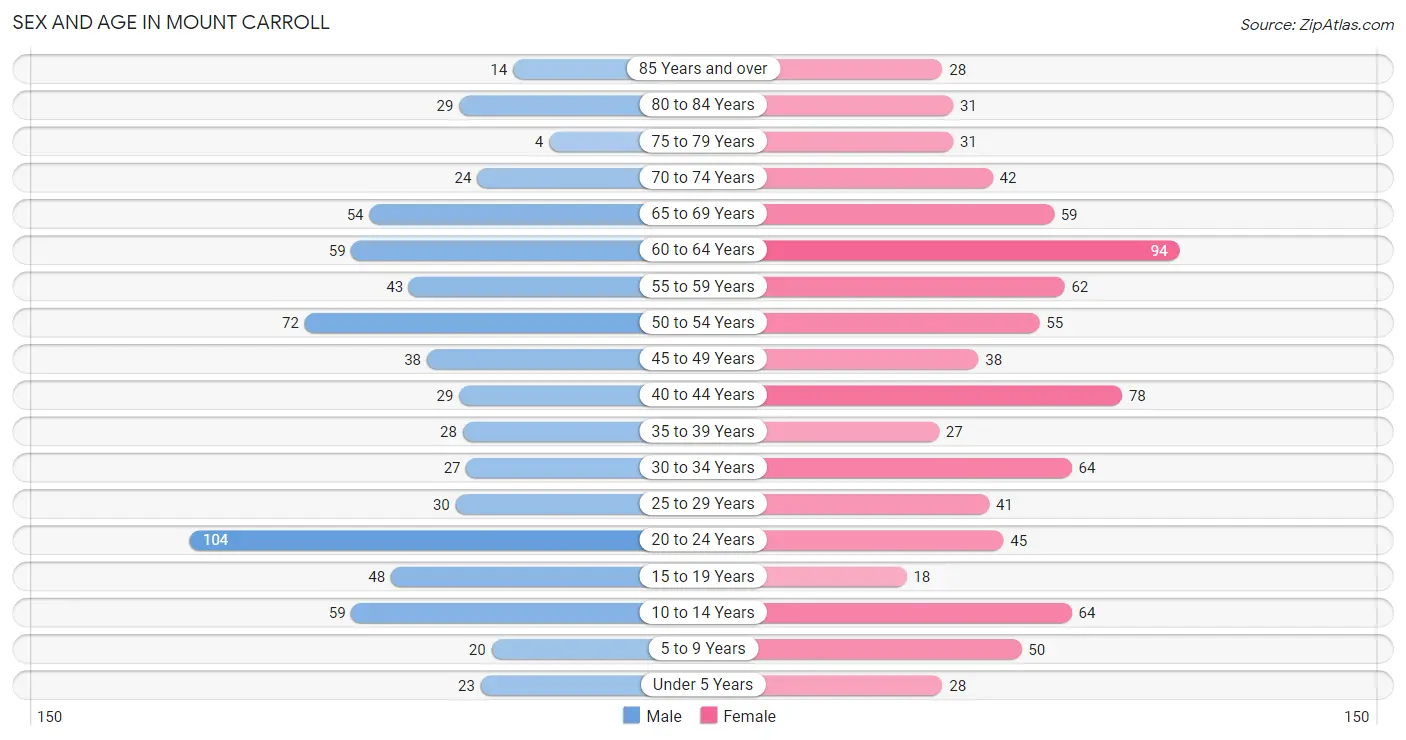
| Age Bracket | Male | Female |
| Under 5 Years | 23 (3.3%) | 28 (3.3%) |
| 5 to 9 Years | 20 (2.8%) | 50 (5.9%) |
| 10 to 14 Years | 59 (8.4%) | 64 (7.5%) |
| 15 to 19 Years | 48 (6.8%) | 18 (2.1%) |
| 20 to 24 Years | 104 (14.7%) | 45 (5.3%) |
| 25 to 29 Years | 30 (4.3%) | 41 (4.8%) |
| 30 to 34 Years | 27 (3.8%) | 64 (7.5%) |
| 35 to 39 Years | 28 (4.0%) | 27 (3.2%) |
| 40 to 44 Years | 29 (4.1%) | 78 (9.1%) |
| 45 to 49 Years | 38 (5.4%) | 38 (4.4%) |
| 50 to 54 Years | 72 (10.2%) | 55 (6.4%) |
| 55 to 59 Years | 43 (6.1%) | 62 (7.2%) |
| 60 to 64 Years | 59 (8.4%) | 94 (11.0%) |
| 65 to 69 Years | 54 (7.7%) | 59 (6.9%) |
| 70 to 74 Years | 24 (3.4%) | 42 (4.9%) |
| 75 to 79 Years | 4 (0.6%) | 31 (3.6%) |
| 80 to 84 Years | 29 (4.1%) | 31 (3.6%) |
| 85 Years and over | 14 (2.0%) | 28 (3.3%) |
| Total | 705 (100.0%) | 855 (100.0%) |
Families and Households in Mount Carroll
Median Family Size in Mount Carroll
The median family size in Mount Carroll is 2.80 persons per family, with married-couple families (293 | 71.1%) accounting for the largest median family size of 3 persons per family. On the other hand, single male/father families (17 | 4.1%) represent the smallest median family size with 1.65 persons per family.
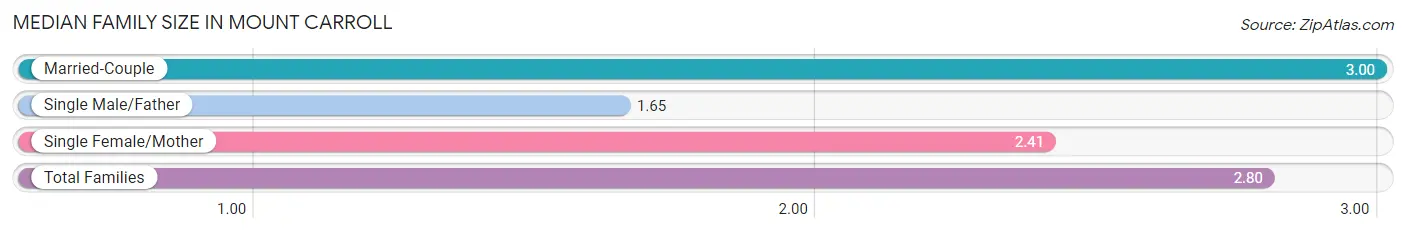
| Family Type | # Families | Family Size |
| Married-Couple | 293 (71.1%) | 3.00 |
| Single Male/Father | 17 (4.1%) | 1.65 |
| Single Female/Mother | 102 (24.8%) | 2.41 |
| Total Families | 412 (100.0%) | 2.80 |
Median Household Size in Mount Carroll
The median household size in Mount Carroll is 2.21 persons per household, with married-couple households (293 | 43.8%) accounting for the largest median household size of 3 persons per household. non-family households (257 | 38.4%) represent the smallest median household size with 1.13 persons per household.
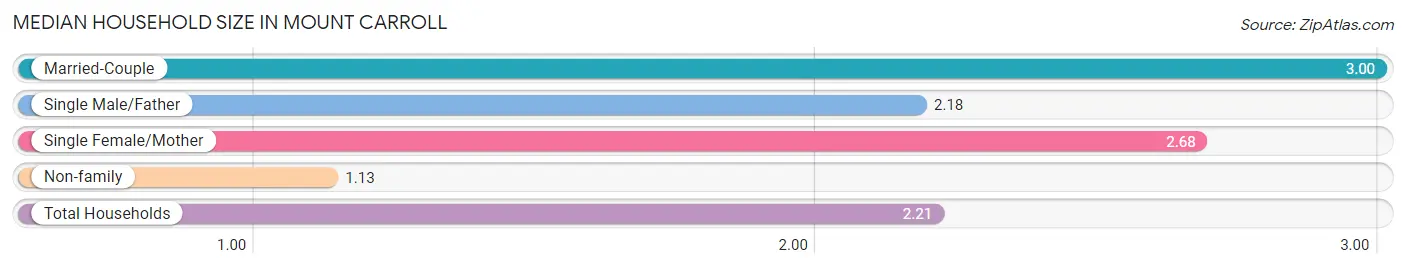
| Household Type | # Households | Household Size |
| Married-Couple | 293 (43.8%) | 3.00 |
| Single Male/Father | 17 (2.5%) | 2.18 |
| Single Female/Mother | 102 (15.2%) | 2.68 |
| Non-family | 257 (38.4%) | 1.13 |
| Total Households | 669 (100.0%) | 2.21 |
Household Size by Marriage Status in Mount Carroll
Out of a total of 669 households in Mount Carroll, 412 (61.6%) are family households, while 257 (38.4%) are nonfamily households. The most numerous type of family households are 2-person households, comprising 215, and the most common type of nonfamily households are 1-person households, comprising 228.
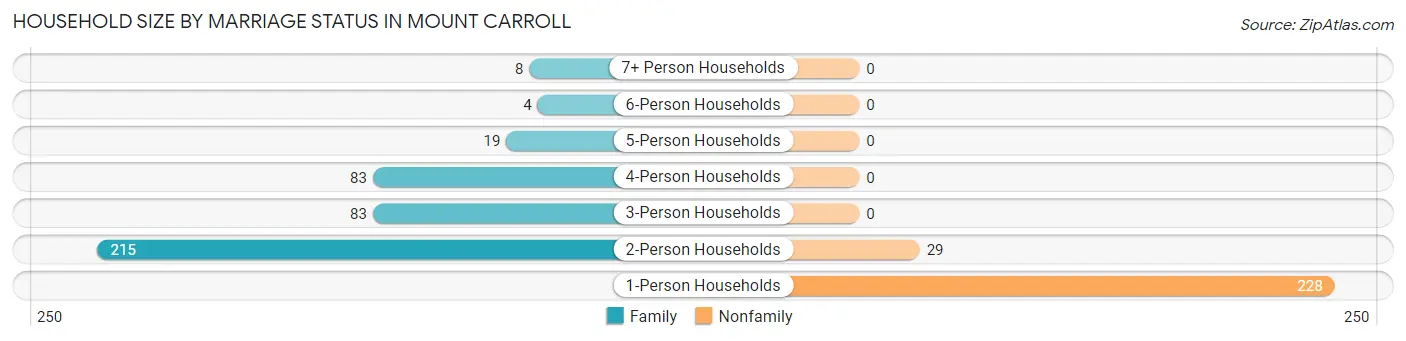
| Household Size | Family Households | Nonfamily Households |
| 1-Person Households | - | 228 (34.1%) |
| 2-Person Households | 215 (32.1%) | 29 (4.3%) |
| 3-Person Households | 83 (12.4%) | 0 (0.0%) |
| 4-Person Households | 83 (12.4%) | 0 (0.0%) |
| 5-Person Households | 19 (2.8%) | 0 (0.0%) |
| 6-Person Households | 4 (0.6%) | 0 (0.0%) |
| 7+ Person Households | 8 (1.2%) | 0 (0.0%) |
| Total | 412 (61.6%) | 257 (38.4%) |
Female Fertility in Mount Carroll
Fertility by Age in Mount Carroll
Average fertility rate in Mount Carroll is 106.0 births per 1,000 women. Women in the age bracket of 20 to 34 years have the highest fertility rate with 127.0 births per 1,000 women. Women in the age bracket of 20 to 34 years acount for 55.9% of all women with births.
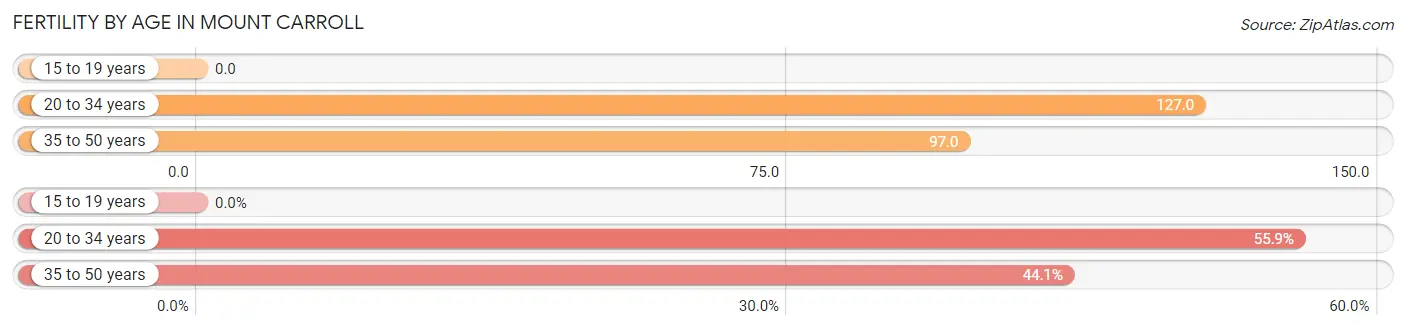
| Age Bracket | Women with Births | Births / 1,000 Women |
| 15 to 19 years | 0 (0.0%) | 0.0 |
| 20 to 34 years | 19 (55.9%) | 127.0 |
| 35 to 50 years | 15 (44.1%) | 97.0 |
| Total | 34 (100.0%) | 106.0 |
Fertility by Age by Marriage Status in Mount Carroll
52.9% of women with births (34) in Mount Carroll are married. The highest percentage of unmarried women with births falls into 20 to 34 years age bracket with 84.2% of them unmarried at the time of birth, while the lowest percentage of unmarried women with births belong to 35 to 50 years age bracket with 0.0% of them unmarried.
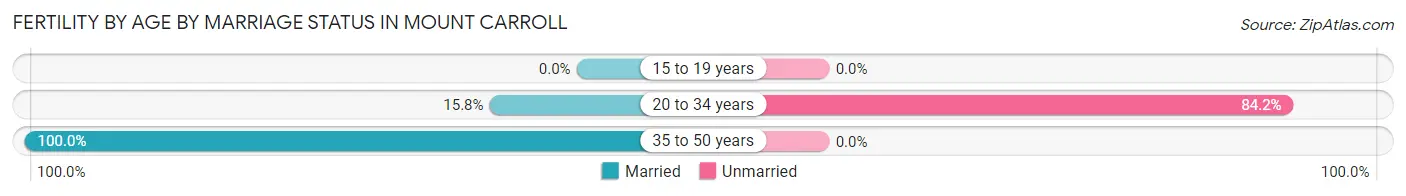
| Age Bracket | Married | Unmarried |
| 15 to 19 years | 0 (0.0%) | 0 (0.0%) |
| 20 to 34 years | 3 (15.8%) | 16 (84.2%) |
| 35 to 50 years | 15 (100.0%) | 0 (0.0%) |
| Total | 18 (52.9%) | 16 (47.1%) |
Fertility by Education in Mount Carroll
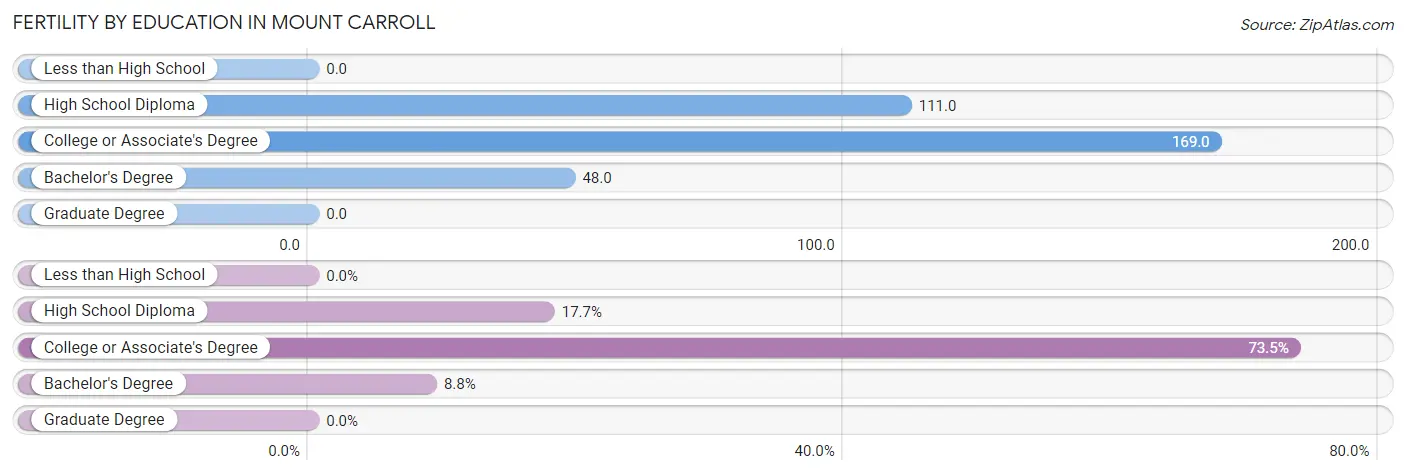
| Educational Attainment | Women with Births | Births / 1,000 Women |
| Less than High School | 0 (0.0%) | 0.0 |
| High School Diploma | 6 (17.6%) | 111.0 |
| College or Associate's Degree | 25 (73.5%) | 169.0 |
| Bachelor's Degree | 3 (8.8%) | 48.0 |
| Graduate Degree | 0 (0.0%) | 0.0 |
| Total | 34 (100.0%) | 106.0 |
Fertility by Education by Marriage Status in Mount Carroll
47.1% of women with births in Mount Carroll are unmarried. Women with the educational attainment of bachelor's degree are most likely to be married with 100.0% of them married at childbirth, while women with the educational attainment of high school diploma are least likely to be married with 66.7% of them unmarried at childbirth.
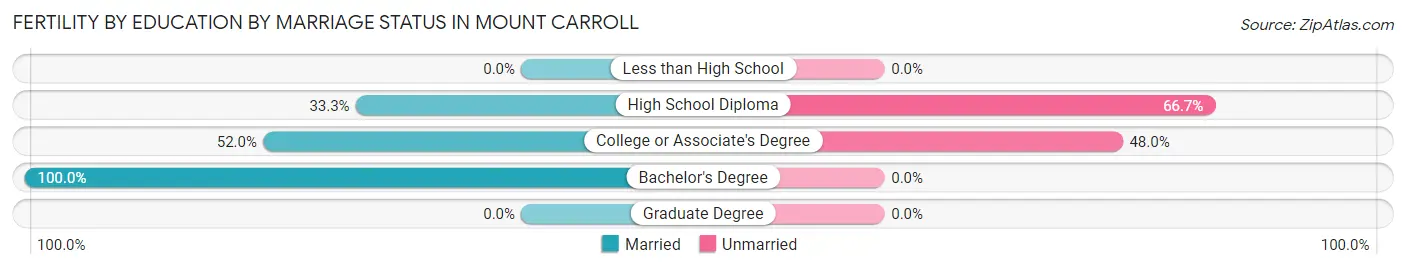
| Educational Attainment | Married | Unmarried |
| Less than High School | 0 (0.0%) | 0 (0.0%) |
| High School Diploma | 2 (33.3%) | 4 (66.7%) |
| College or Associate's Degree | 13 (52.0%) | 12 (48.0%) |
| Bachelor's Degree | 3 (100.0%) | 0 (0.0%) |
| Graduate Degree | 0 (0.0%) | 0 (0.0%) |
| Total | 18 (52.9%) | 16 (47.1%) |
Employment Characteristics in Mount Carroll
Employment by Class of Employer in Mount Carroll
Among the 836 employed individuals in Mount Carroll, private company employees (536 | 64.1%), local government employees (88 | 10.5%), and not-for-profit organizations (63 | 7.5%) make up the most common classes of employment.
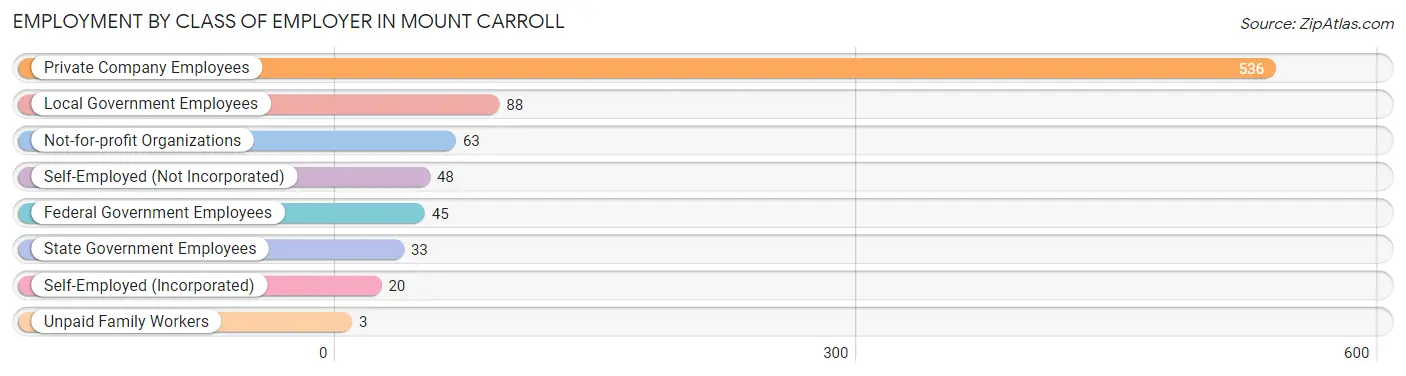
| Employer Class | # Employees | % Employees |
| Private Company Employees | 536 | 64.1% |
| Self-Employed (Incorporated) | 20 | 2.4% |
| Self-Employed (Not Incorporated) | 48 | 5.7% |
| Not-for-profit Organizations | 63 | 7.5% |
| Local Government Employees | 88 | 10.5% |
| State Government Employees | 33 | 4.0% |
| Federal Government Employees | 45 | 5.4% |
| Unpaid Family Workers | 3 | 0.4% |
| Total | 836 | 100.0% |
Employment Status by Age in Mount Carroll
According to the labor force statistics for Mount Carroll, out of the total population over 16 years of age (1,300), 66.3% or 862 individuals are in the labor force, with 2.6% or 22 of them unemployed. The age group with the highest labor force participation rate is 30 to 34 years, with 95.6% or 87 individuals in the labor force. Within the labor force, the 20 to 24 years age range has the highest percentage of unemployed individuals, with 8.5% or 10 of them being unemployed.
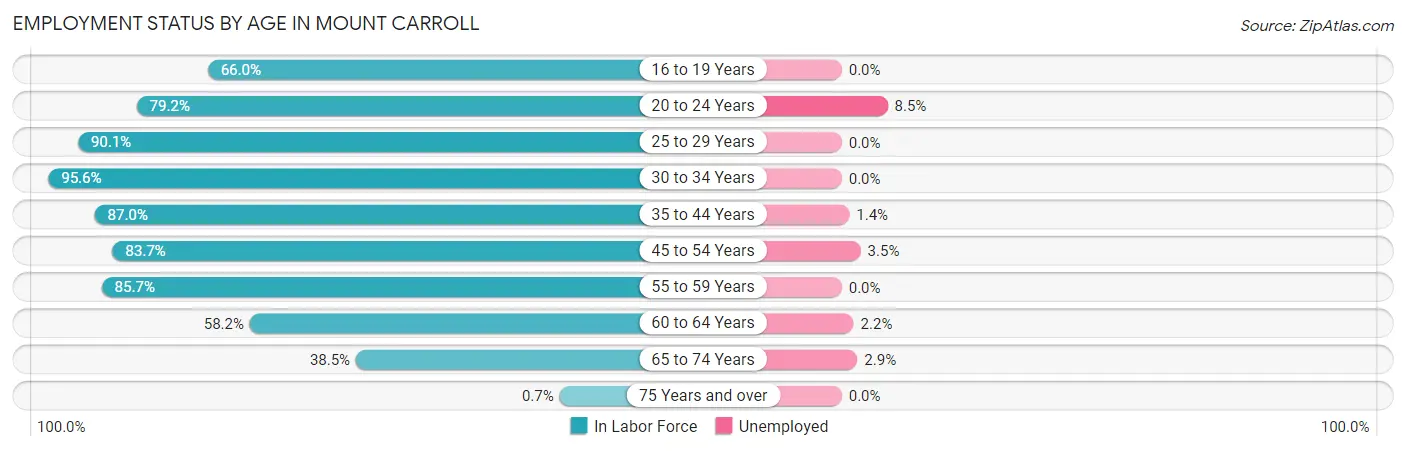
| Age Bracket | In Labor Force | Unemployed |
| 16 to 19 Years | 33 (66.0%) | 0 (0.0%) |
| 20 to 24 Years | 118 (79.2%) | 10 (8.5%) |
| 25 to 29 Years | 64 (90.1%) | 0 (0.0%) |
| 30 to 34 Years | 87 (95.6%) | 0 (0.0%) |
| 35 to 44 Years | 141 (87.0%) | 2 (1.4%) |
| 45 to 54 Years | 170 (83.7%) | 6 (3.5%) |
| 55 to 59 Years | 90 (85.7%) | 0 (0.0%) |
| 60 to 64 Years | 89 (58.2%) | 2 (2.2%) |
| 65 to 74 Years | 69 (38.5%) | 2 (2.9%) |
| 75 Years and over | 1 (0.7%) | 0 (0.0%) |
| Total | 862 (66.3%) | 22 (2.6%) |
Employment Status by Educational Attainment in Mount Carroll
According to labor force statistics for Mount Carroll, 81.7% of individuals (641) out of the total population between 25 and 64 years of age (785) are in the labor force, with 1.6% or 10 of them being unemployed. The group with the highest labor force participation rate are those with the educational attainment of high school diploma, with 84.4% or 227 individuals in the labor force. Within the labor force, individuals with college / associate degree education have the highest percentage of unemployment, with 3.3% or 7 of them being unemployed.
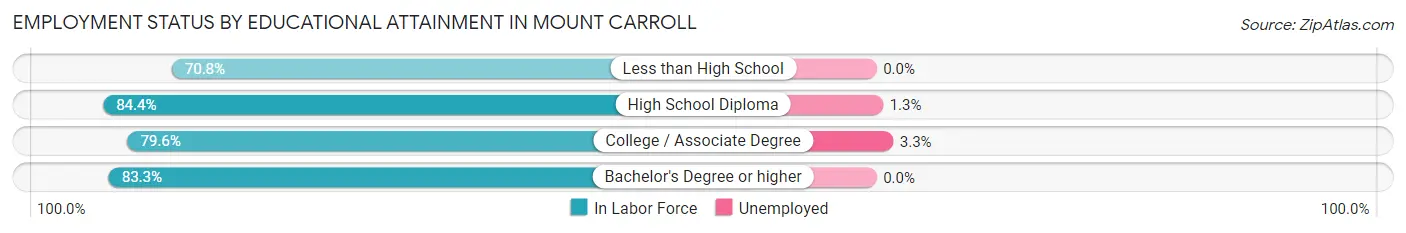
| Educational Attainment | In Labor Force | Unemployed |
| Less than High School | 34 (70.8%) | 0 (0.0%) |
| High School Diploma | 227 (84.4%) | 3 (1.3%) |
| College / Associate Degree | 211 (79.6%) | 9 (3.3%) |
| Bachelor's Degree or higher | 169 (83.3%) | 0 (0.0%) |
| Total | 641 (81.7%) | 13 (1.6%) |
Employment Occupations by Sex in Mount Carroll
Management, Business, Science and Arts Occupations
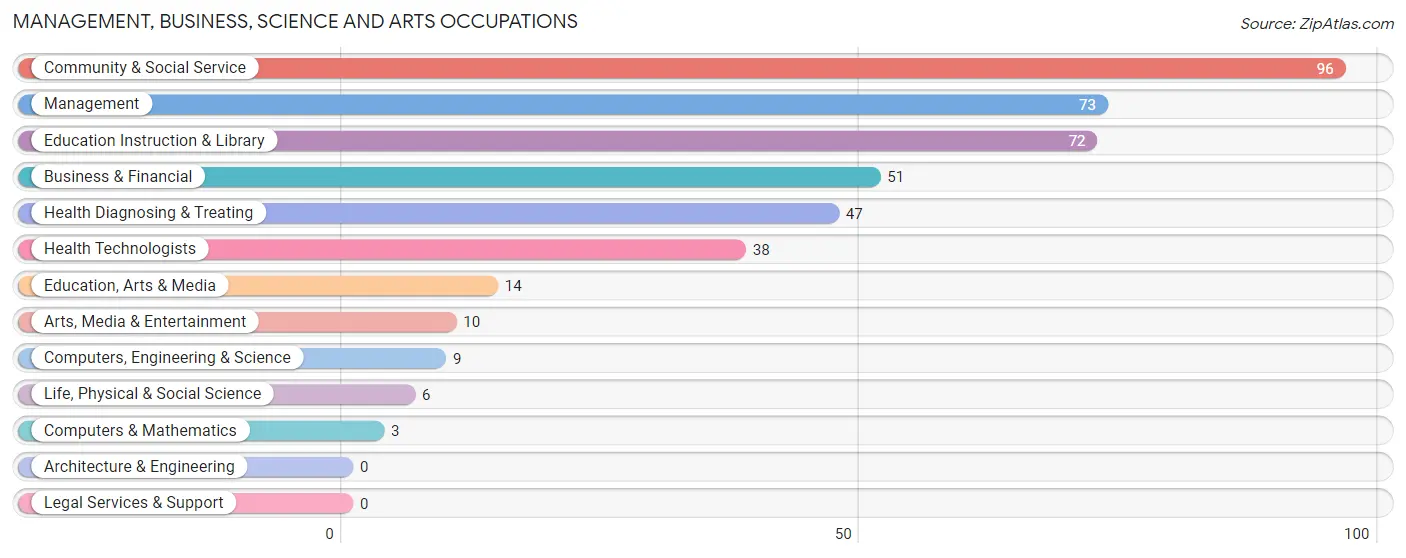
The most common Management, Business, Science and Arts occupations in Mount Carroll are Community & Social Service (96 | 11.4%), Management (73 | 8.7%), Education Instruction & Library (72 | 8.6%), Business & Financial (51 | 6.1%), and Health Diagnosing & Treating (47 | 5.6%).
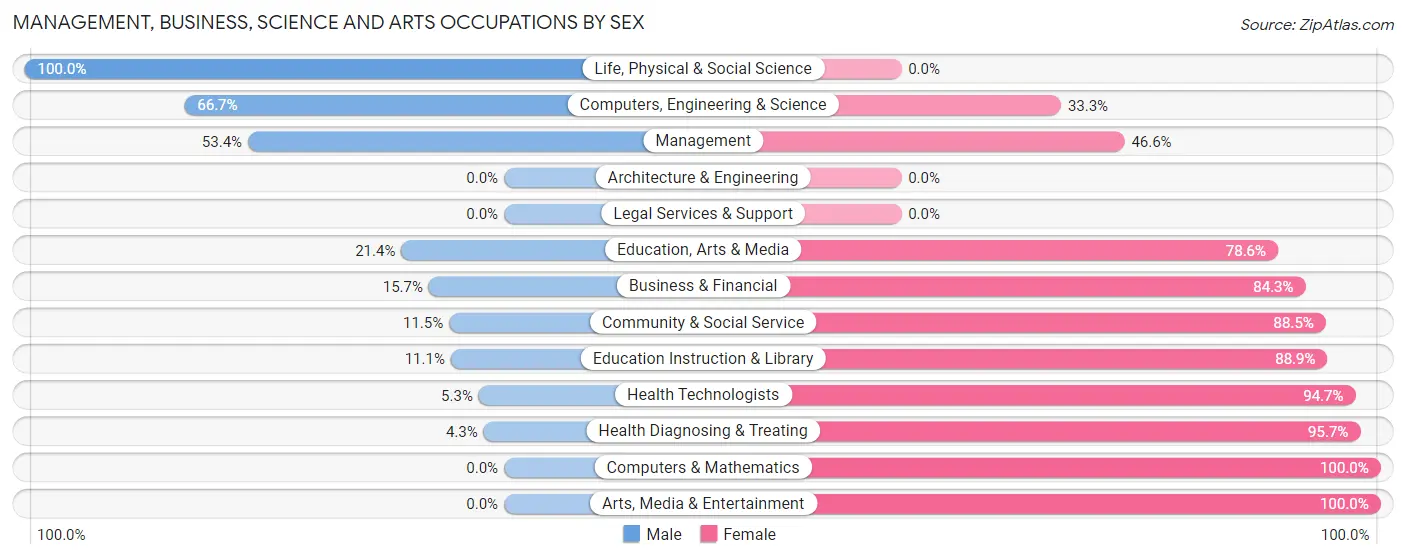
Management, Business, Science and Arts Occupations by Sex
Within the Management, Business, Science and Arts occupations in Mount Carroll, the most male-oriented occupations are Life, Physical & Social Science (100.0%), Computers, Engineering & Science (66.7%), and Management (53.4%), while the most female-oriented occupations are Computers & Mathematics (100.0%), Arts, Media & Entertainment (100.0%), and Health Diagnosing & Treating (95.7%).
| Occupation | Male | Female |
| Management | 39 (53.4%) | 34 (46.6%) |
| Business & Financial | 8 (15.7%) | 43 (84.3%) |
| Computers, Engineering & Science | 6 (66.7%) | 3 (33.3%) |
| Computers & Mathematics | 0 (0.0%) | 3 (100.0%) |
| Architecture & Engineering | 0 (0.0%) | 0 (0.0%) |
| Life, Physical & Social Science | 6 (100.0%) | 0 (0.0%) |
| Community & Social Service | 11 (11.5%) | 85 (88.5%) |
| Education, Arts & Media | 3 (21.4%) | 11 (78.6%) |
| Legal Services & Support | 0 (0.0%) | 0 (0.0%) |
| Education Instruction & Library | 8 (11.1%) | 64 (88.9%) |
| Arts, Media & Entertainment | 0 (0.0%) | 10 (100.0%) |
| Health Diagnosing & Treating | 2 (4.3%) | 45 (95.7%) |
| Health Technologists | 2 (5.3%) | 36 (94.7%) |
| Total (Category) | 66 (23.9%) | 210 (76.1%) |
| Total (Overall) | 378 (45.0%) | 462 (55.0%) |
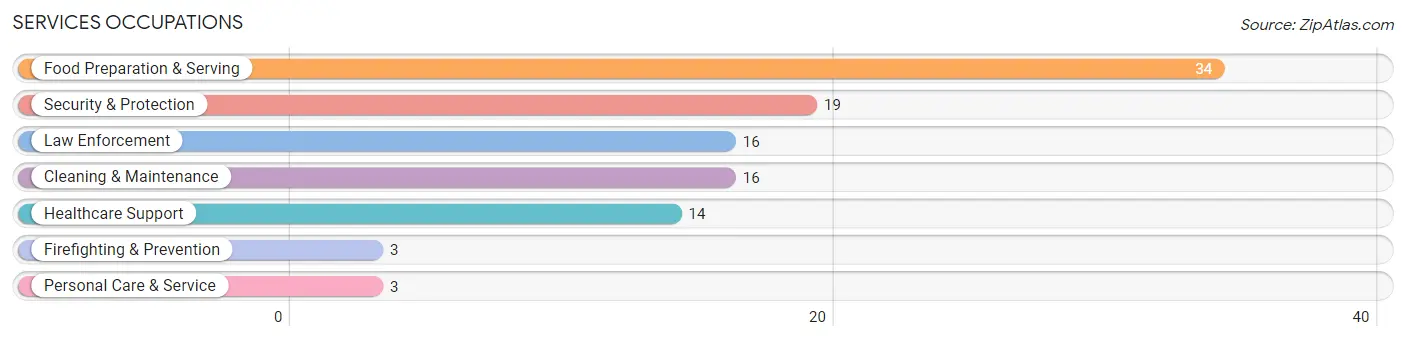
Services Occupations
The most common Services occupations in Mount Carroll are Food Preparation & Serving (34 | 4.1%), Security & Protection (19 | 2.3%), Law Enforcement (16 | 1.9%), Cleaning & Maintenance (16 | 1.9%), and Healthcare Support (14 | 1.7%).
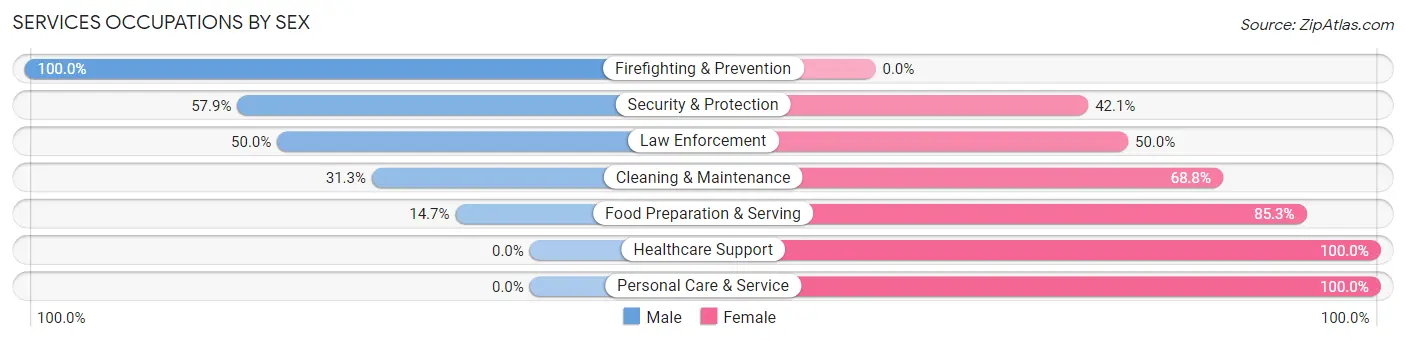
Services Occupations by Sex
Within the Services occupations in Mount Carroll, the most male-oriented occupations are Firefighting & Prevention (100.0%), Security & Protection (57.9%), and Law Enforcement (50.0%), while the most female-oriented occupations are Healthcare Support (100.0%), Personal Care & Service (100.0%), and Food Preparation & Serving (85.3%).
| Occupation | Male | Female |
| Healthcare Support | 0 (0.0%) | 14 (100.0%) |
| Security & Protection | 11 (57.9%) | 8 (42.1%) |
| Firefighting & Prevention | 3 (100.0%) | 0 (0.0%) |
| Law Enforcement | 8 (50.0%) | 8 (50.0%) |
| Food Preparation & Serving | 5 (14.7%) | 29 (85.3%) |
| Cleaning & Maintenance | 5 (31.2%) | 11 (68.8%) |
| Personal Care & Service | 0 (0.0%) | 3 (100.0%) |
| Total (Category) | 21 (24.4%) | 65 (75.6%) |
| Total (Overall) | 378 (45.0%) | 462 (55.0%) |
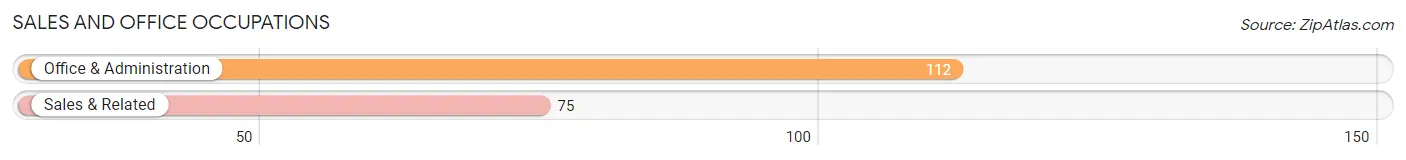
Sales and Office Occupations
The most common Sales and Office occupations in Mount Carroll are Office & Administration (112 | 13.3%), and Sales & Related (75 | 8.9%).
Sales and Office Occupations by Sex
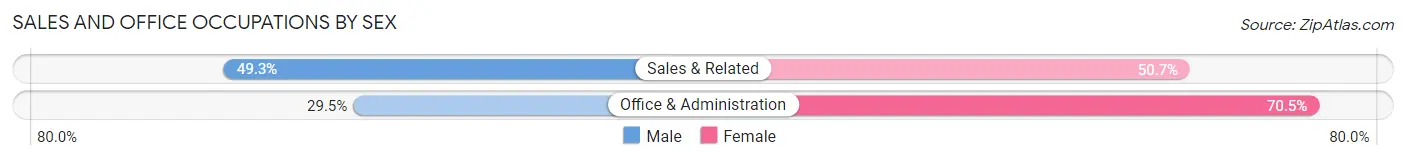
| Occupation | Male | Female |
| Sales & Related | 37 (49.3%) | 38 (50.7%) |
| Office & Administration | 33 (29.5%) | 79 (70.5%) |
| Total (Category) | 70 (37.4%) | 117 (62.6%) |
| Total (Overall) | 378 (45.0%) | 462 (55.0%) |
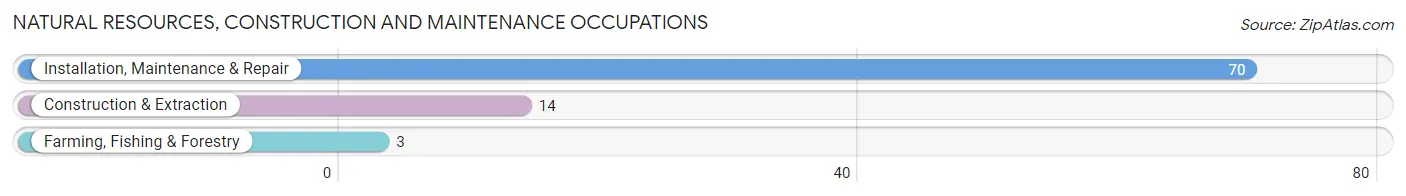
Natural Resources, Construction and Maintenance Occupations
The most common Natural Resources, Construction and Maintenance occupations in Mount Carroll are Installation, Maintenance & Repair (70 | 8.3%), Construction & Extraction (14 | 1.7%), and Farming, Fishing & Forestry (3 | 0.4%).
Natural Resources, Construction and Maintenance Occupations by Sex
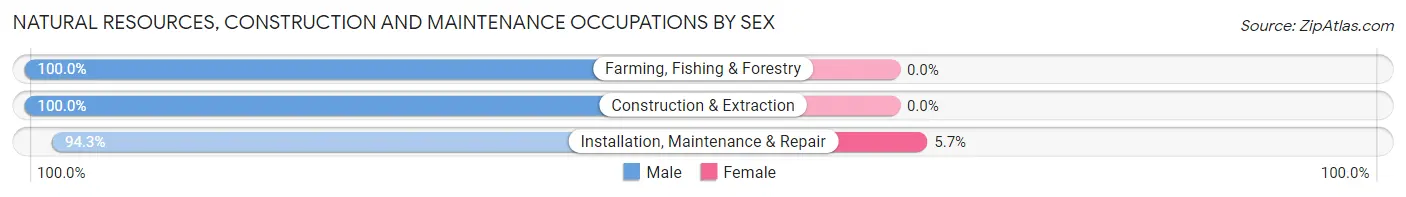
| Occupation | Male | Female |
| Farming, Fishing & Forestry | 3 (100.0%) | 0 (0.0%) |
| Construction & Extraction | 14 (100.0%) | 0 (0.0%) |
| Installation, Maintenance & Repair | 66 (94.3%) | 4 (5.7%) |
| Total (Category) | 83 (95.4%) | 4 (4.6%) |
| Total (Overall) | 378 (45.0%) | 462 (55.0%) |
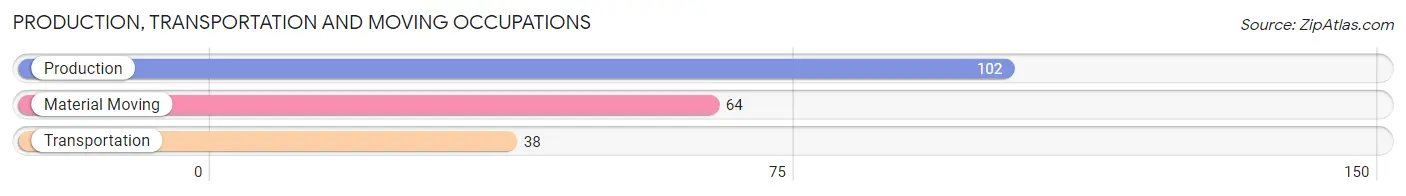
Production, Transportation and Moving Occupations
The most common Production, Transportation and Moving occupations in Mount Carroll are Production (102 | 12.1%), Material Moving (64 | 7.6%), and Transportation (38 | 4.5%).
Production, Transportation and Moving Occupations by Sex
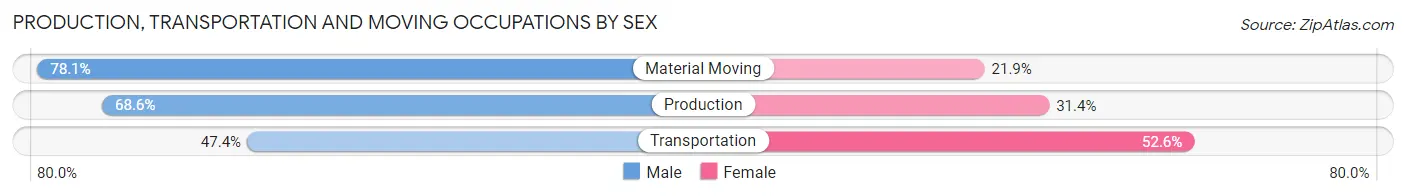
| Occupation | Male | Female |
| Production | 70 (68.6%) | 32 (31.4%) |
| Transportation | 18 (47.4%) | 20 (52.6%) |
| Material Moving | 50 (78.1%) | 14 (21.9%) |
| Total (Category) | 138 (67.6%) | 66 (32.4%) |
| Total (Overall) | 378 (45.0%) | 462 (55.0%) |
Employment Industries by Sex in Mount Carroll
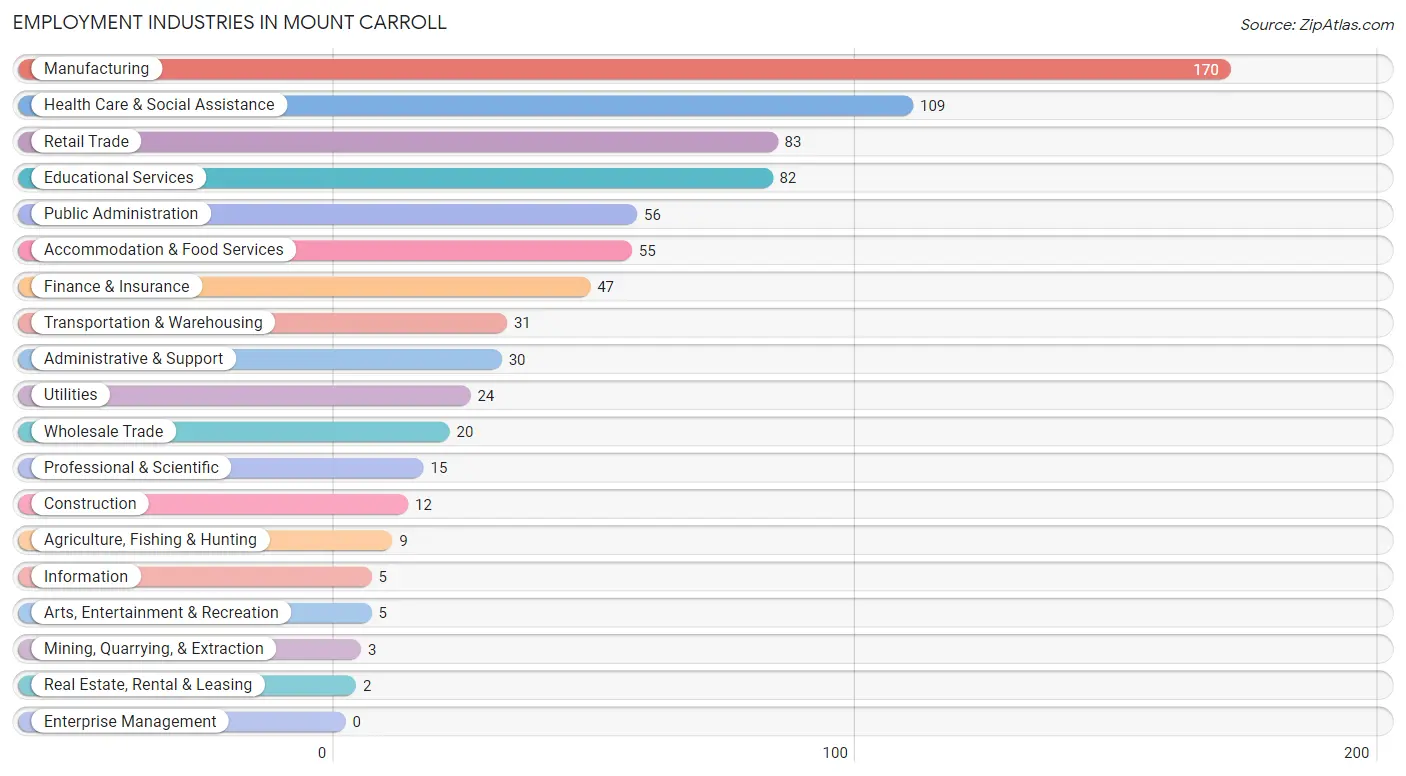
Employment Industries in Mount Carroll
The major employment industries in Mount Carroll include Manufacturing (170 | 20.2%), Health Care & Social Assistance (109 | 13.0%), Retail Trade (83 | 9.9%), Educational Services (82 | 9.8%), and Public Administration (56 | 6.7%).
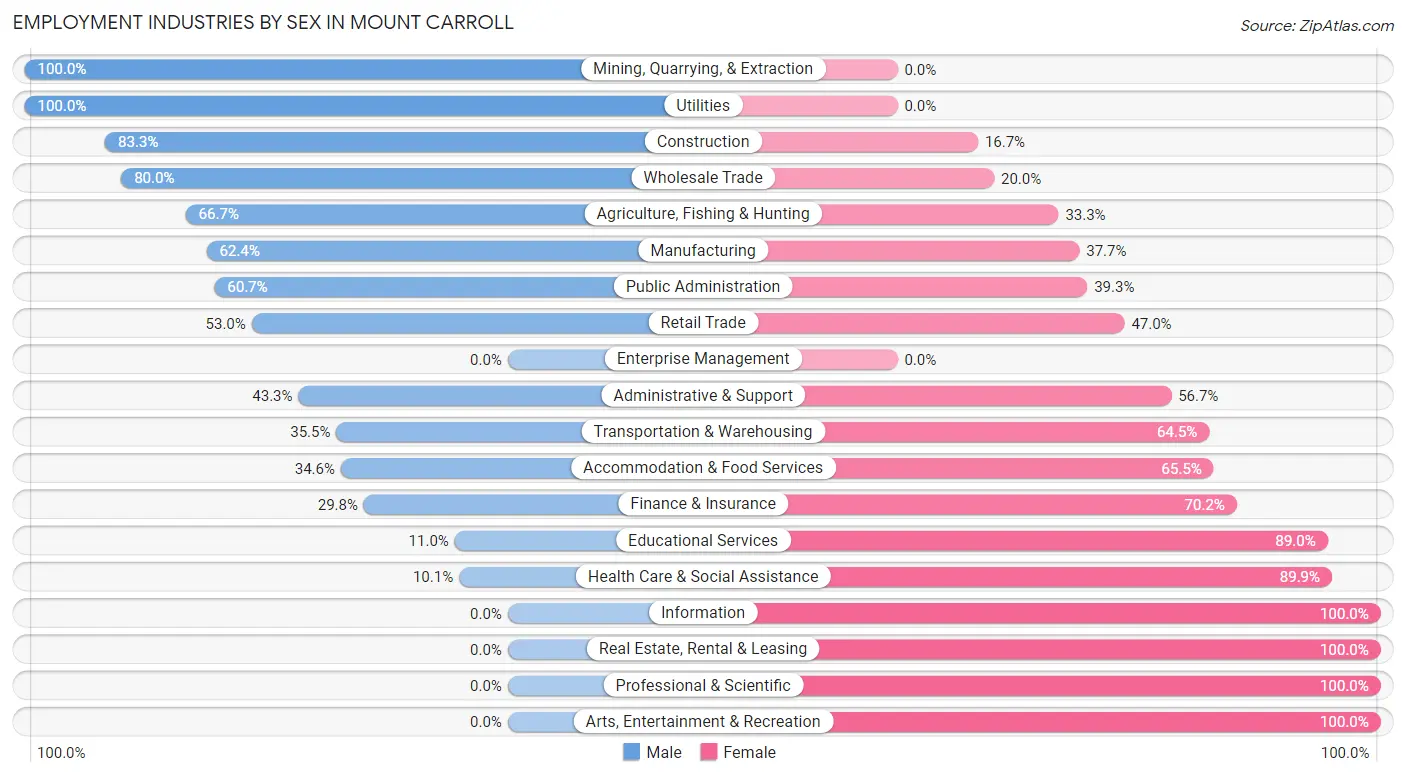
Employment Industries by Sex in Mount Carroll
The Mount Carroll industries that see more men than women are Mining, Quarrying, & Extraction (100.0%), Utilities (100.0%), and Construction (83.3%), whereas the industries that tend to have a higher number of women are Information (100.0%), Real Estate, Rental & Leasing (100.0%), and Professional & Scientific (100.0%).
| Industry | Male | Female |
| Agriculture, Fishing & Hunting | 6 (66.7%) | 3 (33.3%) |
| Mining, Quarrying, & Extraction | 3 (100.0%) | 0 (0.0%) |
| Construction | 10 (83.3%) | 2 (16.7%) |
| Manufacturing | 106 (62.4%) | 64 (37.7%) |
| Wholesale Trade | 16 (80.0%) | 4 (20.0%) |
| Retail Trade | 44 (53.0%) | 39 (47.0%) |
| Transportation & Warehousing | 11 (35.5%) | 20 (64.5%) |
| Utilities | 24 (100.0%) | 0 (0.0%) |
| Information | 0 (0.0%) | 5 (100.0%) |
| Finance & Insurance | 14 (29.8%) | 33 (70.2%) |
| Real Estate, Rental & Leasing | 0 (0.0%) | 2 (100.0%) |
| Professional & Scientific | 0 (0.0%) | 15 (100.0%) |
| Enterprise Management | 0 (0.0%) | 0 (0.0%) |
| Administrative & Support | 13 (43.3%) | 17 (56.7%) |
| Educational Services | 9 (11.0%) | 73 (89.0%) |
| Health Care & Social Assistance | 11 (10.1%) | 98 (89.9%) |
| Arts, Entertainment & Recreation | 0 (0.0%) | 5 (100.0%) |
| Accommodation & Food Services | 19 (34.5%) | 36 (65.4%) |
| Public Administration | 34 (60.7%) | 22 (39.3%) |
| Total | 378 (45.0%) | 462 (55.0%) |
Education in Mount Carroll
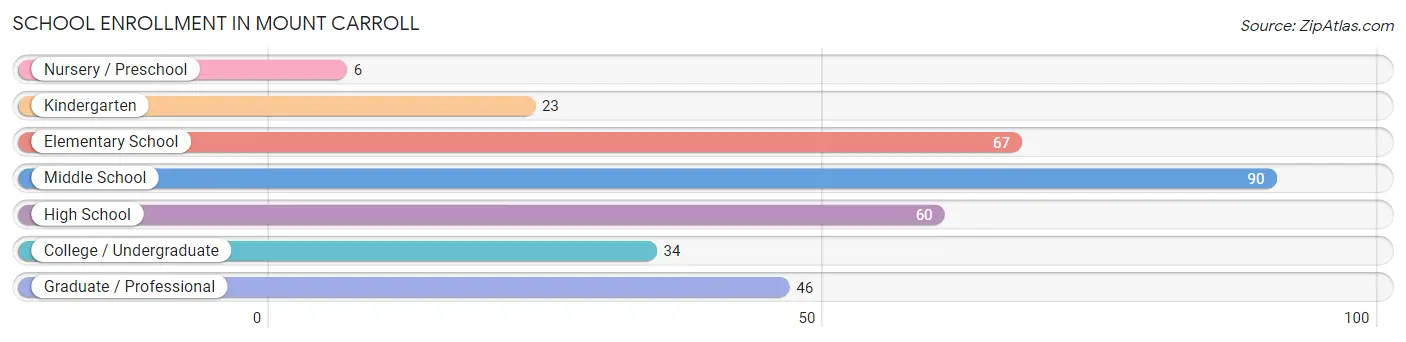
School Enrollment in Mount Carroll
The most common levels of schooling among the 326 students in Mount Carroll are middle school (90 | 27.6%), elementary school (67 | 20.5%), and high school (60 | 18.4%).
| School Level | # Students | % Students |
| Nursery / Preschool | 6 | 1.8% |
| Kindergarten | 23 | 7.1% |
| Elementary School | 67 | 20.5% |
| Middle School | 90 | 27.6% |
| High School | 60 | 18.4% |
| College / Undergraduate | 34 | 10.4% |
| Graduate / Professional | 46 | 14.1% |
| Total | 326 | 100.0% |
School Enrollment by Age by Funding Source in Mount Carroll
Out of a total of 326 students who are enrolled in schools in Mount Carroll, 40 (12.3%) attend a private institution, while the remaining 286 (87.7%) are enrolled in public schools. The age group of 25 to 34 year olds has the highest likelihood of being enrolled in private schools, with 27 (50.9% in the age bracket) enrolled. Conversely, the age group of 3 to 4 year olds has the lowest likelihood of being enrolled in a private school, with 6 (100.0% in the age bracket) attending a public institution.
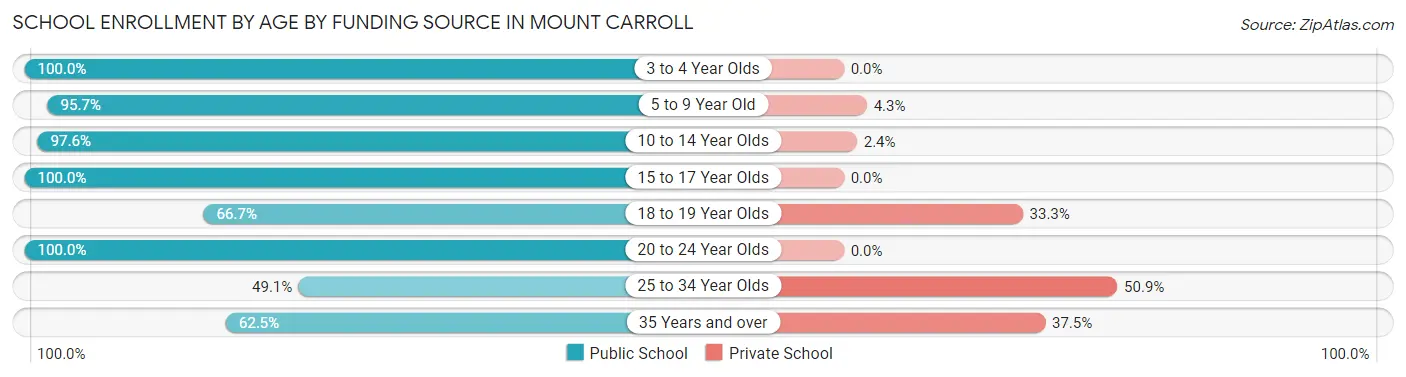
| Age Bracket | Public School | Private School |
| 3 to 4 Year Olds | 6 (100.0%) | 0 (0.0%) |
| 5 to 9 Year Old | 67 (95.7%) | 3 (4.3%) |
| 10 to 14 Year Olds | 120 (97.6%) | 3 (2.4%) |
| 15 to 17 Year Olds | 40 (100.0%) | 0 (0.0%) |
| 18 to 19 Year Olds | 8 (66.7%) | 4 (33.3%) |
| 20 to 24 Year Olds | 14 (100.0%) | 0 (0.0%) |
| 25 to 34 Year Olds | 26 (49.1%) | 27 (50.9%) |
| 35 Years and over | 5 (62.5%) | 3 (37.5%) |
| Total | 286 (87.7%) | 40 (12.3%) |
Educational Attainment by Field of Study in Mount Carroll
Education (79 | 23.6%), science & technology (47 | 14.1%), visual & performing arts (36 | 10.8%), arts & humanities (36 | 10.8%), and liberal arts & history (32 | 9.6%) are the most common fields of study among 334 individuals in Mount Carroll who have obtained a bachelor's degree or higher.
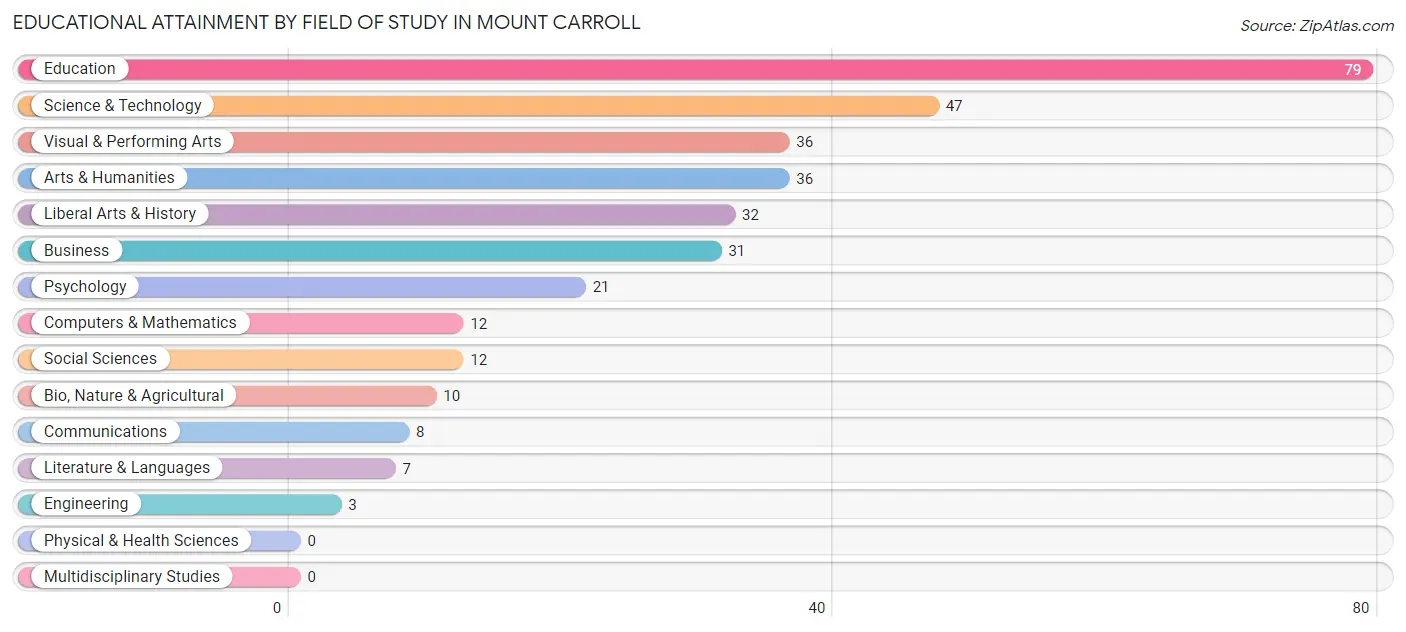
| Field of Study | # Graduates | % Graduates |
| Computers & Mathematics | 12 | 3.6% |
| Bio, Nature & Agricultural | 10 | 3.0% |
| Physical & Health Sciences | 0 | 0.0% |
| Psychology | 21 | 6.3% |
| Social Sciences | 12 | 3.6% |
| Engineering | 3 | 0.9% |
| Multidisciplinary Studies | 0 | 0.0% |
| Science & Technology | 47 | 14.1% |
| Business | 31 | 9.3% |
| Education | 79 | 23.6% |
| Literature & Languages | 7 | 2.1% |
| Liberal Arts & History | 32 | 9.6% |
| Visual & Performing Arts | 36 | 10.8% |
| Communications | 8 | 2.4% |
| Arts & Humanities | 36 | 10.8% |
| Total | 334 | 100.0% |
Transportation & Commute in Mount Carroll
Vehicle Availability by Sex in Mount Carroll
The most prevalent vehicle ownership categories in Mount Carroll are males with 2 vehicles (151, accounting for 40.0%) and females with 2 vehicles (153, making up 33.0%).
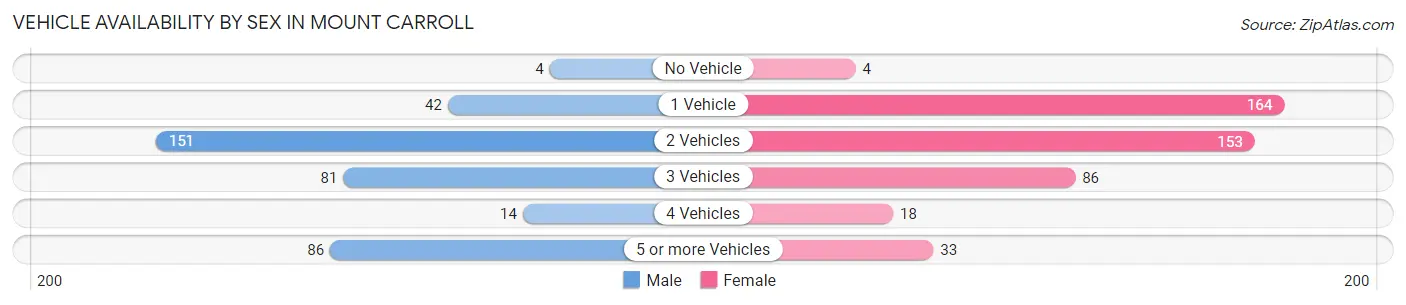
| Vehicles Available | Male | Female |
| No Vehicle | 4 (1.1%) | 4 (0.9%) |
| 1 Vehicle | 42 (11.1%) | 164 (35.8%) |
| 2 Vehicles | 151 (40.0%) | 153 (33.4%) |
| 3 Vehicles | 81 (21.4%) | 86 (18.8%) |
| 4 Vehicles | 14 (3.7%) | 18 (3.9%) |
| 5 or more Vehicles | 86 (22.8%) | 33 (7.2%) |
| Total | 378 (100.0%) | 458 (100.0%) |
Commute Time in Mount Carroll
The most frequently occuring commute durations in Mount Carroll are 15 to 19 minutes (182 commuters, 23.6%), less than 5 minutes (120 commuters, 15.6%), and 5 to 9 minutes (93 commuters, 12.1%).
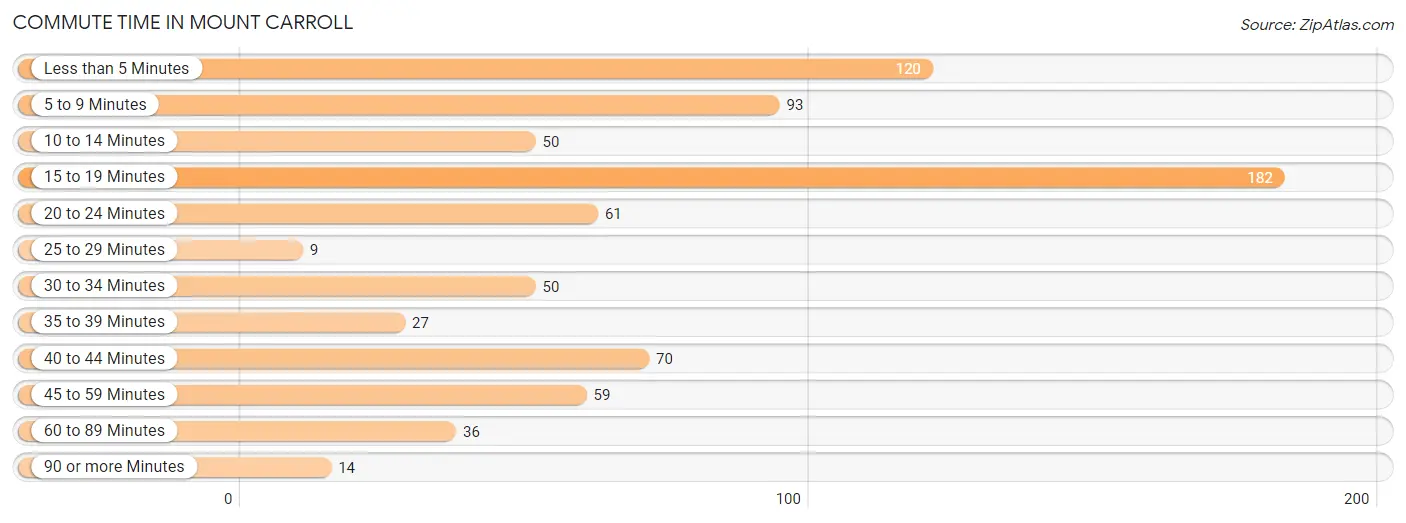
| Commute Time | # Commuters | % Commuters |
| Less than 5 Minutes | 120 | 15.6% |
| 5 to 9 Minutes | 93 | 12.1% |
| 10 to 14 Minutes | 50 | 6.5% |
| 15 to 19 Minutes | 182 | 23.6% |
| 20 to 24 Minutes | 61 | 7.9% |
| 25 to 29 Minutes | 9 | 1.2% |
| 30 to 34 Minutes | 50 | 6.5% |
| 35 to 39 Minutes | 27 | 3.5% |
| 40 to 44 Minutes | 70 | 9.1% |
| 45 to 59 Minutes | 59 | 7.6% |
| 60 to 89 Minutes | 36 | 4.7% |
| 90 or more Minutes | 14 | 1.8% |
Commute Time by Sex in Mount Carroll
The most common commute times in Mount Carroll are 15 to 19 minutes (84 commuters, 23.5%) for males and 15 to 19 minutes (98 commuters, 23.7%) for females.
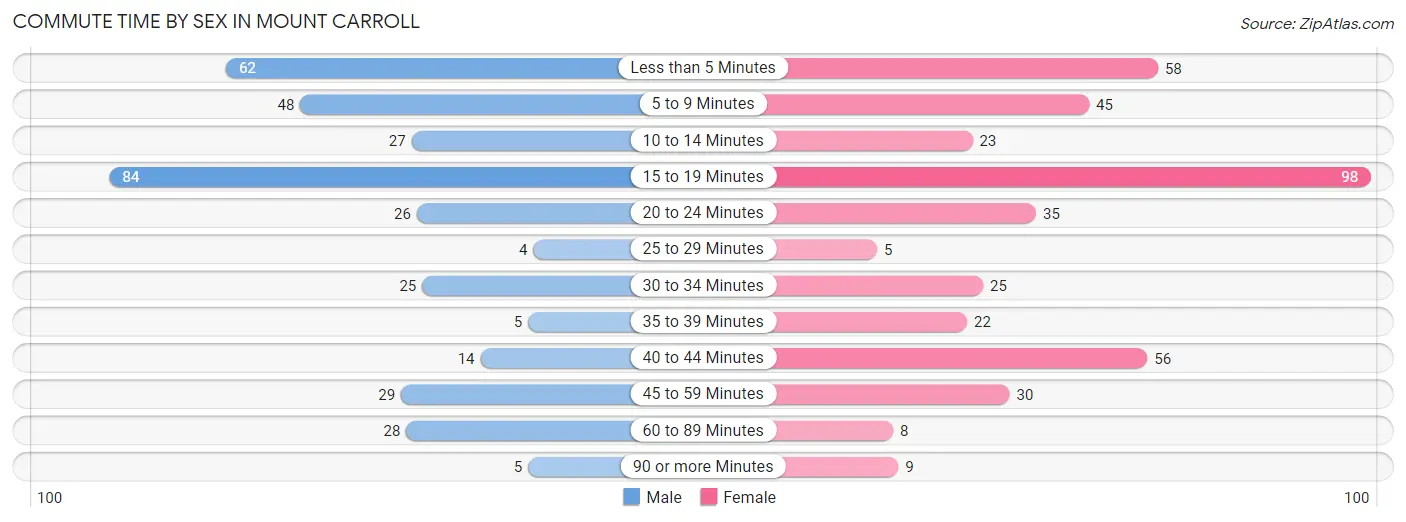
| Commute Time | Male | Female |
| Less than 5 Minutes | 62 (17.4%) | 58 (14.0%) |
| 5 to 9 Minutes | 48 (13.5%) | 45 (10.9%) |
| 10 to 14 Minutes | 27 (7.6%) | 23 (5.6%) |
| 15 to 19 Minutes | 84 (23.5%) | 98 (23.7%) |
| 20 to 24 Minutes | 26 (7.3%) | 35 (8.5%) |
| 25 to 29 Minutes | 4 (1.1%) | 5 (1.2%) |
| 30 to 34 Minutes | 25 (7.0%) | 25 (6.0%) |
| 35 to 39 Minutes | 5 (1.4%) | 22 (5.3%) |
| 40 to 44 Minutes | 14 (3.9%) | 56 (13.5%) |
| 45 to 59 Minutes | 29 (8.1%) | 30 (7.2%) |
| 60 to 89 Minutes | 28 (7.8%) | 8 (1.9%) |
| 90 or more Minutes | 5 (1.4%) | 9 (2.2%) |
Time of Departure to Work by Sex in Mount Carroll
The most frequent times of departure to work in Mount Carroll are 6:30 AM to 6:59 AM (84, 23.5%) for males and 8:00 AM to 8:29 AM (59, 14.2%) for females.
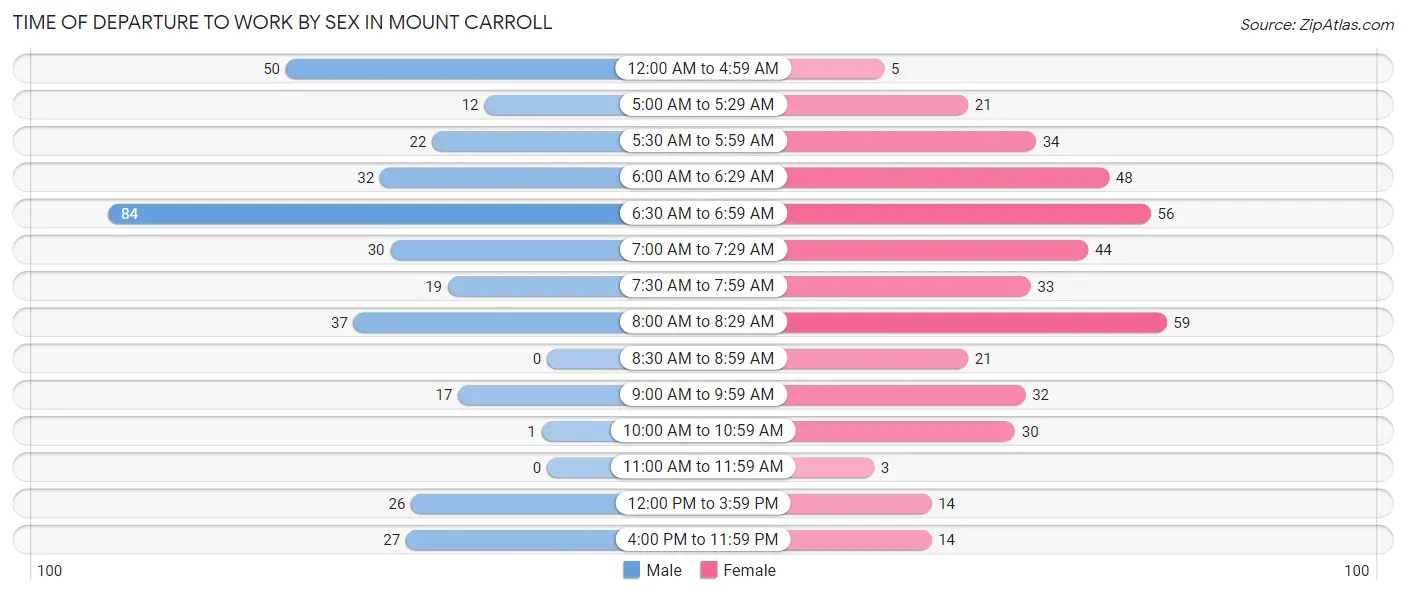
| Time of Departure | Male | Female |
| 12:00 AM to 4:59 AM | 50 (14.0%) | 5 (1.2%) |
| 5:00 AM to 5:29 AM | 12 (3.4%) | 21 (5.1%) |
| 5:30 AM to 5:59 AM | 22 (6.2%) | 34 (8.2%) |
| 6:00 AM to 6:29 AM | 32 (9.0%) | 48 (11.6%) |
| 6:30 AM to 6:59 AM | 84 (23.5%) | 56 (13.5%) |
| 7:00 AM to 7:29 AM | 30 (8.4%) | 44 (10.6%) |
| 7:30 AM to 7:59 AM | 19 (5.3%) | 33 (8.0%) |
| 8:00 AM to 8:29 AM | 37 (10.4%) | 59 (14.2%) |
| 8:30 AM to 8:59 AM | 0 (0.0%) | 21 (5.1%) |
| 9:00 AM to 9:59 AM | 17 (4.8%) | 32 (7.7%) |
| 10:00 AM to 10:59 AM | 1 (0.3%) | 30 (7.2%) |
| 11:00 AM to 11:59 AM | 0 (0.0%) | 3 (0.7%) |
| 12:00 PM to 3:59 PM | 26 (7.3%) | 14 (3.4%) |
| 4:00 PM to 11:59 PM | 27 (7.6%) | 14 (3.4%) |
| Total | 357 (100.0%) | 414 (100.0%) |
Housing Occupancy in Mount Carroll
Occupancy by Ownership in Mount Carroll
Of the total 669 dwellings in Mount Carroll, owner-occupied units account for 496 (74.1%), while renter-occupied units make up 173 (25.9%).
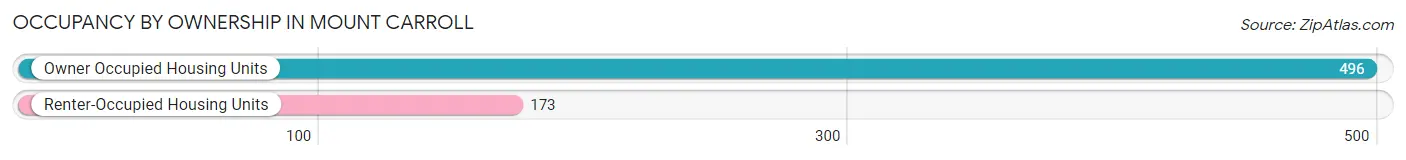
| Occupancy | # Housing Units | % Housing Units |
| Owner Occupied Housing Units | 496 | 74.1% |
| Renter-Occupied Housing Units | 173 | 25.9% |
| Total Occupied Housing Units | 669 | 100.0% |
Occupancy by Household Size in Mount Carroll
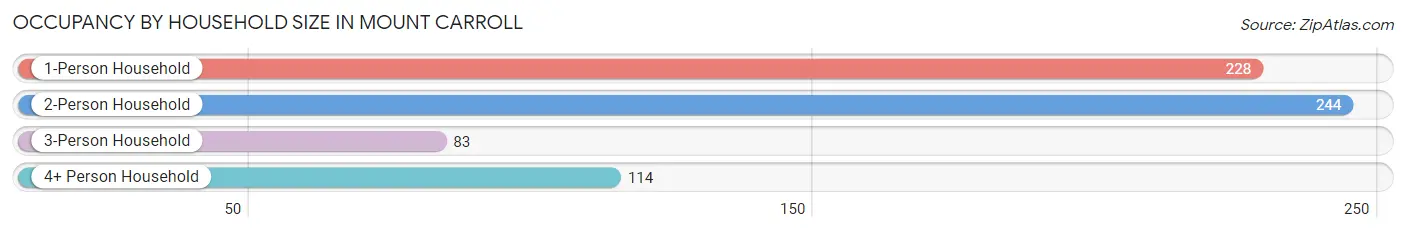
| Household Size | # Housing Units | % Housing Units |
| 1-Person Household | 228 | 34.1% |
| 2-Person Household | 244 | 36.5% |
| 3-Person Household | 83 | 12.4% |
| 4+ Person Household | 114 | 17.0% |
| Total Housing Units | 669 | 100.0% |
Occupancy by Ownership by Household Size in Mount Carroll
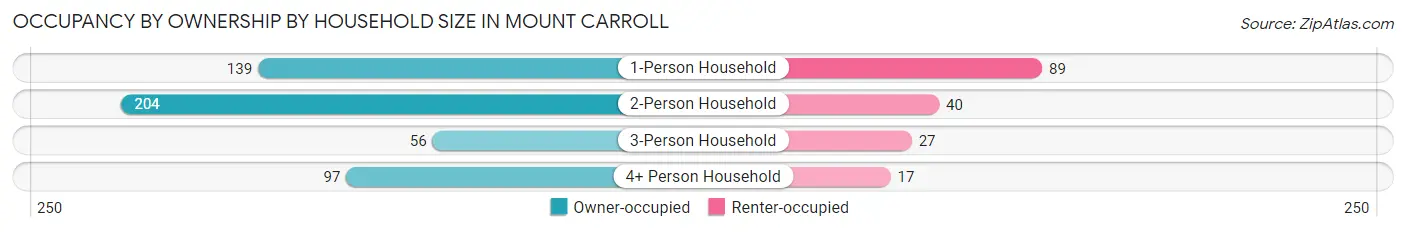
| Household Size | Owner-occupied | Renter-occupied |
| 1-Person Household | 139 (61.0%) | 89 (39.0%) |
| 2-Person Household | 204 (83.6%) | 40 (16.4%) |
| 3-Person Household | 56 (67.5%) | 27 (32.5%) |
| 4+ Person Household | 97 (85.1%) | 17 (14.9%) |
| Total Housing Units | 496 (74.1%) | 173 (25.9%) |
Occupancy by Educational Attainment in Mount Carroll
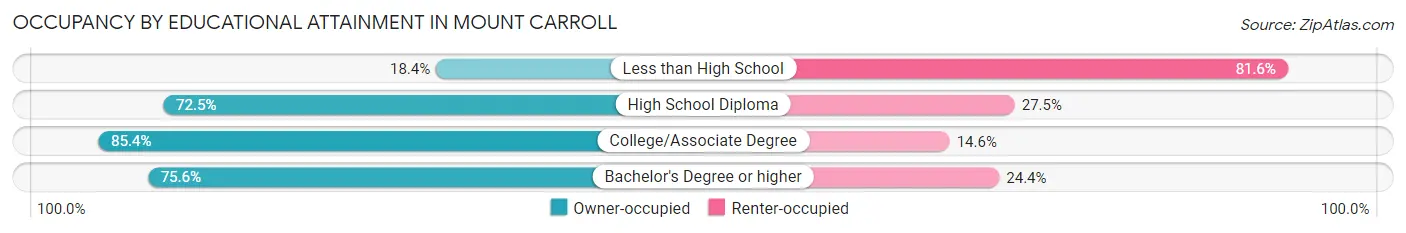
| Household Size | Owner-occupied | Renter-occupied |
| Less than High School | 7 (18.4%) | 31 (81.6%) |
| High School Diploma | 161 (72.5%) | 61 (27.5%) |
| College/Associate Degree | 164 (85.4%) | 28 (14.6%) |
| Bachelor's Degree or higher | 164 (75.6%) | 53 (24.4%) |
Occupancy by Age of Householder in Mount Carroll
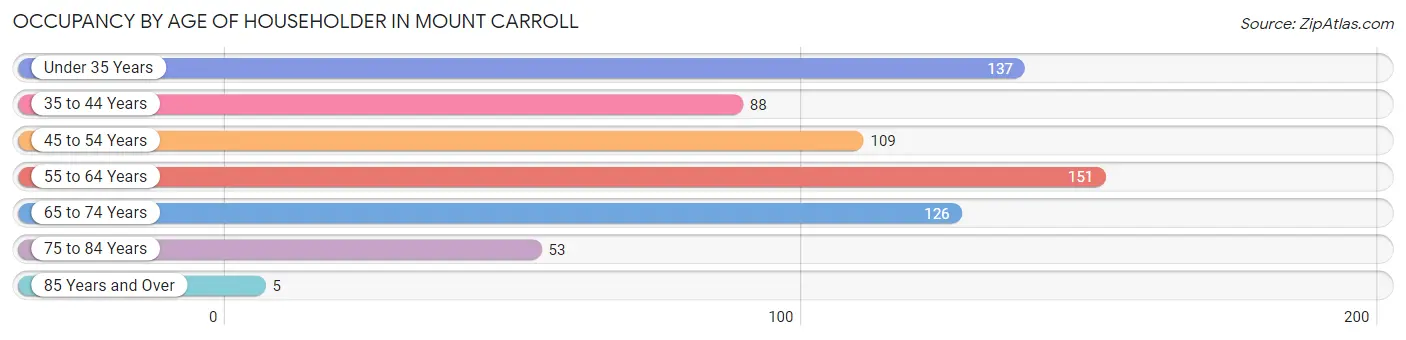
| Age Bracket | # Households | % Households |
| Under 35 Years | 137 | 20.5% |
| 35 to 44 Years | 88 | 13.2% |
| 45 to 54 Years | 109 | 16.3% |
| 55 to 64 Years | 151 | 22.6% |
| 65 to 74 Years | 126 | 18.8% |
| 75 to 84 Years | 53 | 7.9% |
| 85 Years and Over | 5 | 0.7% |
| Total | 669 | 100.0% |
Housing Finances in Mount Carroll
Median Income by Occupancy in Mount Carroll
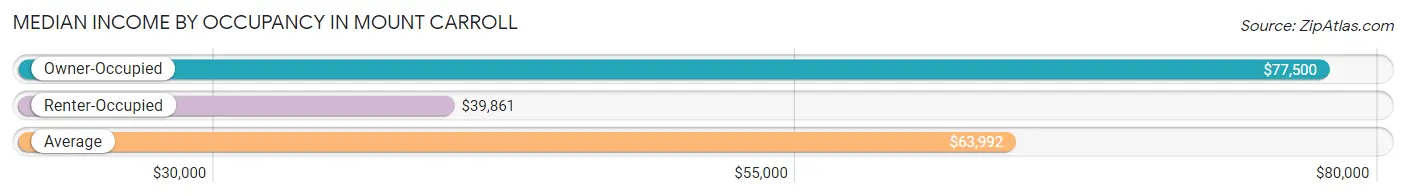
| Occupancy Type | # Households | Median Income |
| Owner-Occupied | 496 (74.1%) | $77,500 |
| Renter-Occupied | 173 (25.9%) | $39,861 |
| Average | 669 (100.0%) | $63,992 |
Occupancy by Householder Income Bracket in Mount Carroll
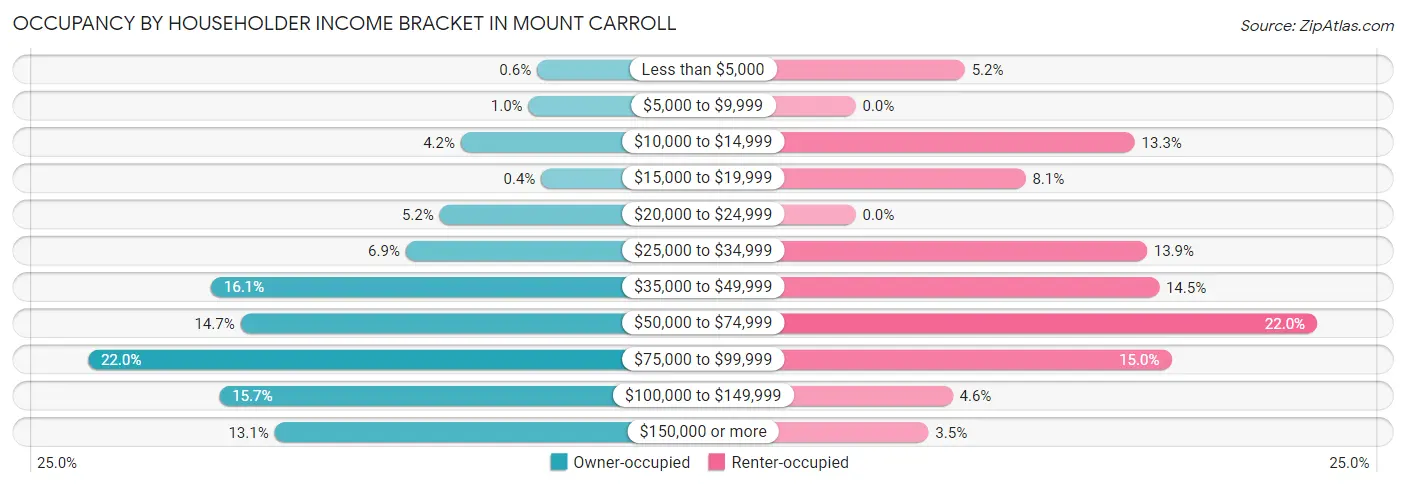
| Income Bracket | Owner-occupied | Renter-occupied |
| Less than $5,000 | 3 (0.6%) | 9 (5.2%) |
| $5,000 to $9,999 | 5 (1.0%) | 0 (0.0%) |
| $10,000 to $14,999 | 21 (4.2%) | 23 (13.3%) |
| $15,000 to $19,999 | 2 (0.4%) | 14 (8.1%) |
| $20,000 to $24,999 | 26 (5.2%) | 0 (0.0%) |
| $25,000 to $34,999 | 34 (6.9%) | 24 (13.9%) |
| $35,000 to $49,999 | 80 (16.1%) | 25 (14.4%) |
| $50,000 to $74,999 | 73 (14.7%) | 38 (22.0%) |
| $75,000 to $99,999 | 109 (22.0%) | 26 (15.0%) |
| $100,000 to $149,999 | 78 (15.7%) | 8 (4.6%) |
| $150,000 or more | 65 (13.1%) | 6 (3.5%) |
| Total | 496 (100.0%) | 173 (100.0%) |
Monthly Housing Cost Tiers in Mount Carroll
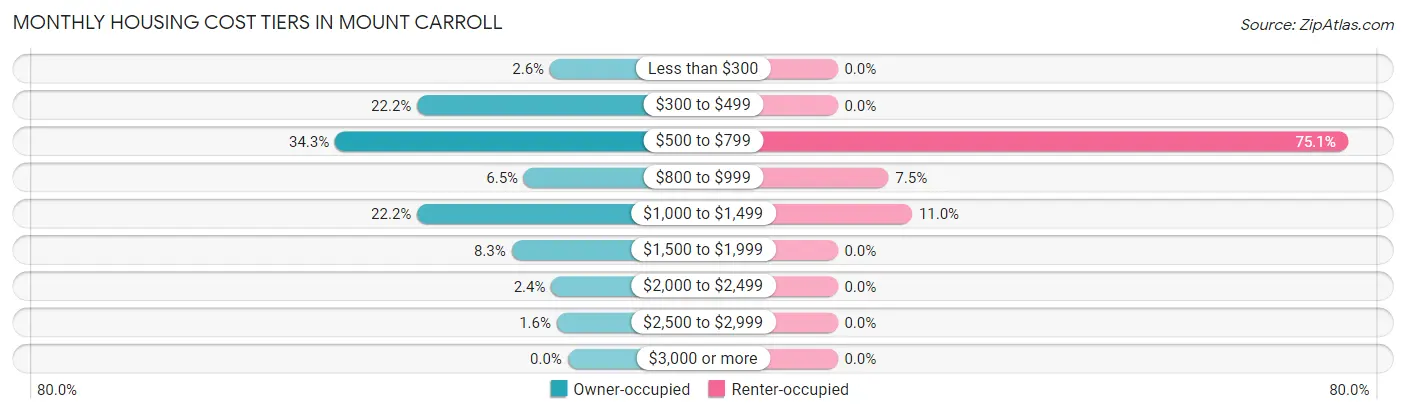
| Monthly Cost | Owner-occupied | Renter-occupied |
| Less than $300 | 13 (2.6%) | 0 (0.0%) |
| $300 to $499 | 110 (22.2%) | 0 (0.0%) |
| $500 to $799 | 170 (34.3%) | 130 (75.1%) |
| $800 to $999 | 32 (6.5%) | 13 (7.5%) |
| $1,000 to $1,499 | 110 (22.2%) | 19 (11.0%) |
| $1,500 to $1,999 | 41 (8.3%) | 0 (0.0%) |
| $2,000 to $2,499 | 12 (2.4%) | 0 (0.0%) |
| $2,500 to $2,999 | 8 (1.6%) | 0 (0.0%) |
| $3,000 or more | 0 (0.0%) | 0 (0.0%) |
| Total | 496 (100.0%) | 173 (100.0%) |
Physical Housing Characteristics in Mount Carroll
Housing Structures in Mount Carroll
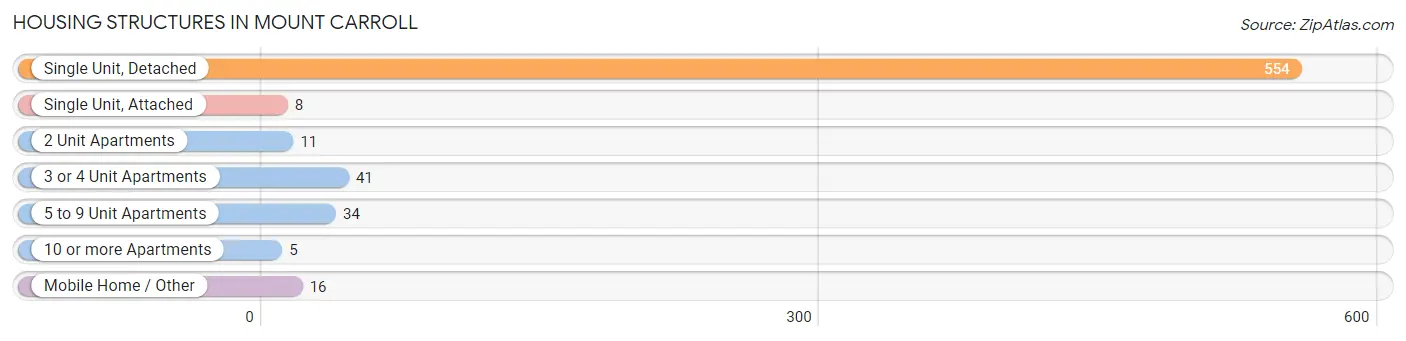
| Structure Type | # Housing Units | % Housing Units |
| Single Unit, Detached | 554 | 82.8% |
| Single Unit, Attached | 8 | 1.2% |
| 2 Unit Apartments | 11 | 1.6% |
| 3 or 4 Unit Apartments | 41 | 6.1% |
| 5 to 9 Unit Apartments | 34 | 5.1% |
| 10 or more Apartments | 5 | 0.7% |
| Mobile Home / Other | 16 | 2.4% |
| Total | 669 | 100.0% |
Housing Structures by Occupancy in Mount Carroll
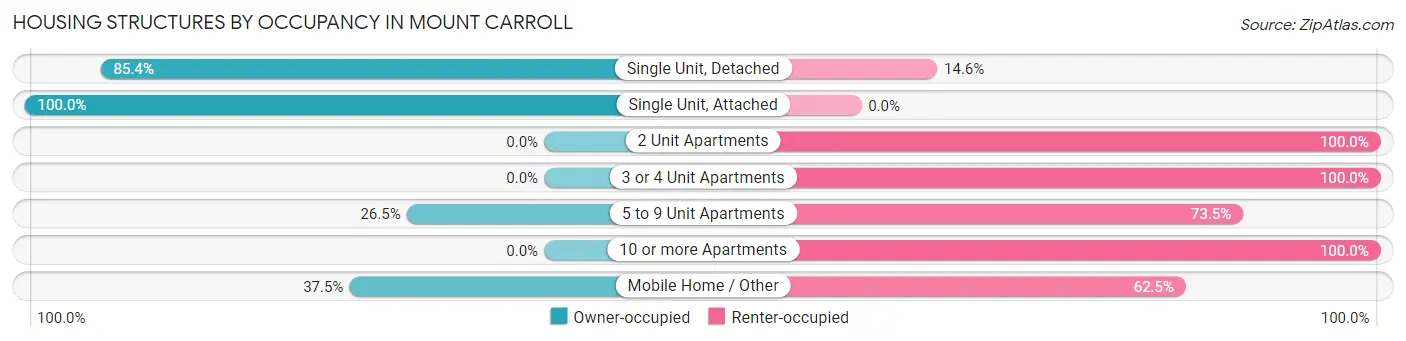
| Structure Type | Owner-occupied | Renter-occupied |
| Single Unit, Detached | 473 (85.4%) | 81 (14.6%) |
| Single Unit, Attached | 8 (100.0%) | 0 (0.0%) |
| 2 Unit Apartments | 0 (0.0%) | 11 (100.0%) |
| 3 or 4 Unit Apartments | 0 (0.0%) | 41 (100.0%) |
| 5 to 9 Unit Apartments | 9 (26.5%) | 25 (73.5%) |
| 10 or more Apartments | 0 (0.0%) | 5 (100.0%) |
| Mobile Home / Other | 6 (37.5%) | 10 (62.5%) |
| Total | 496 (74.1%) | 173 (25.9%) |
Housing Structures by Number of Rooms in Mount Carroll
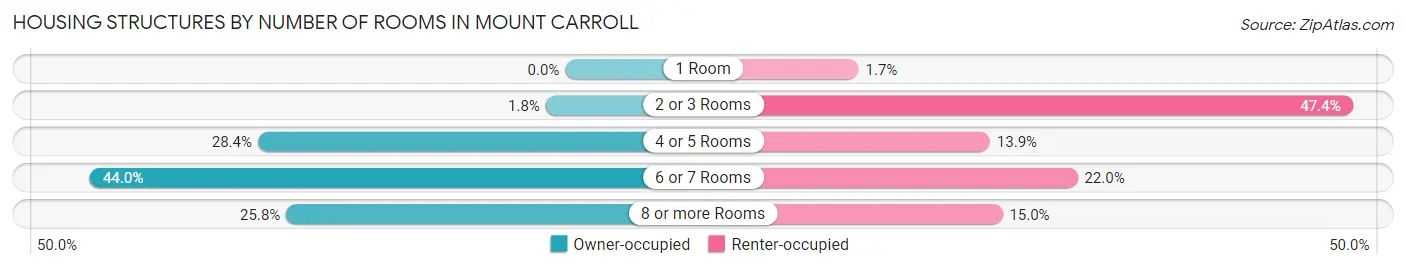
| Number of Rooms | Owner-occupied | Renter-occupied |
| 1 Room | 0 (0.0%) | 3 (1.7%) |
| 2 or 3 Rooms | 9 (1.8%) | 82 (47.4%) |
| 4 or 5 Rooms | 141 (28.4%) | 24 (13.9%) |
| 6 or 7 Rooms | 218 (44.0%) | 38 (22.0%) |
| 8 or more Rooms | 128 (25.8%) | 26 (15.0%) |
| Total | 496 (100.0%) | 173 (100.0%) |
Housing Structure by Heating Type in Mount Carroll
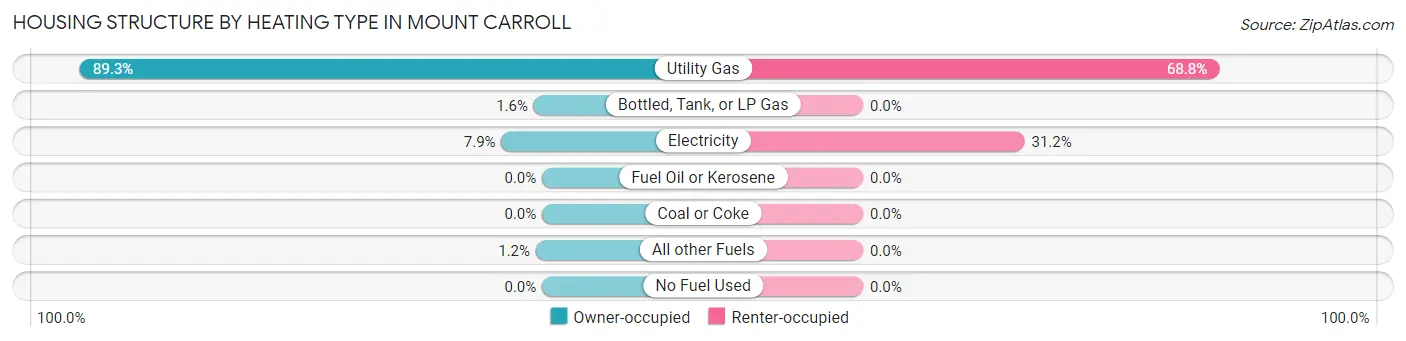
| Heating Type | Owner-occupied | Renter-occupied |
| Utility Gas | 443 (89.3%) | 119 (68.8%) |
| Bottled, Tank, or LP Gas | 8 (1.6%) | 0 (0.0%) |
| Electricity | 39 (7.9%) | 54 (31.2%) |
| Fuel Oil or Kerosene | 0 (0.0%) | 0 (0.0%) |
| Coal or Coke | 0 (0.0%) | 0 (0.0%) |
| All other Fuels | 6 (1.2%) | 0 (0.0%) |
| No Fuel Used | 0 (0.0%) | 0 (0.0%) |
| Total | 496 (100.0%) | 173 (100.0%) |
Household Vehicle Usage in Mount Carroll
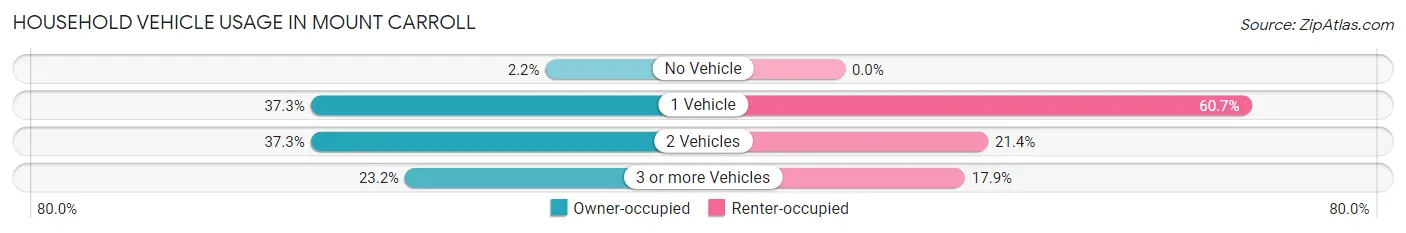
| Vehicles per Household | Owner-occupied | Renter-occupied |
| No Vehicle | 11 (2.2%) | 0 (0.0%) |
| 1 Vehicle | 185 (37.3%) | 105 (60.7%) |
| 2 Vehicles | 185 (37.3%) | 37 (21.4%) |
| 3 or more Vehicles | 115 (23.2%) | 31 (17.9%) |
| Total | 496 (100.0%) | 173 (100.0%) |
Real Estate & Mortgages in Mount Carroll
Real Estate and Mortgage Overview in Mount Carroll
| Characteristic | Without Mortgage | With Mortgage |
| Housing Units | 221 | 275 |
| Median Property Value | $93,400 | $99,700 |
| Median Household Income | $64,531 | $55 |
| Monthly Housing Costs | $487 | $0 |
| Real Estate Taxes | $2,079 | $15 |
Property Value by Mortgage Status in Mount Carroll
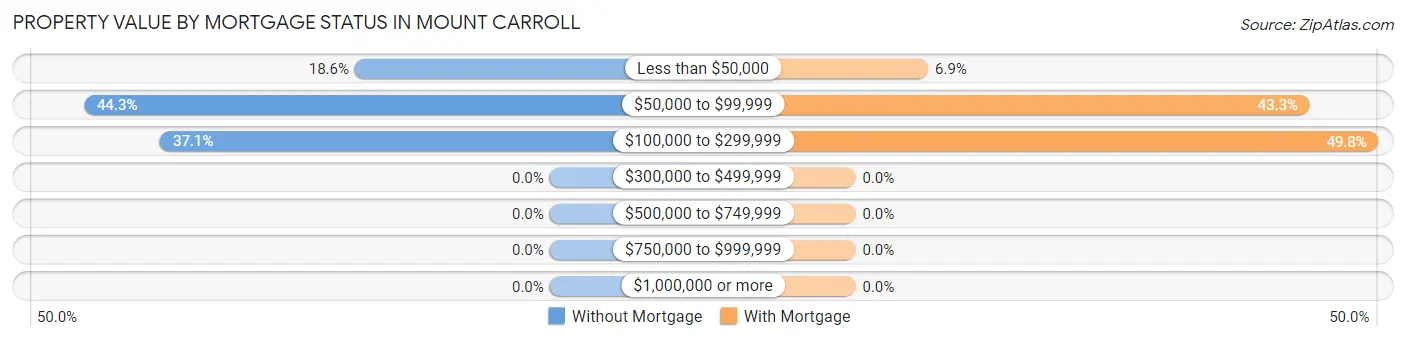
| Property Value | Without Mortgage | With Mortgage |
| Less than $50,000 | 41 (18.5%) | 19 (6.9%) |
| $50,000 to $99,999 | 98 (44.3%) | 119 (43.3%) |
| $100,000 to $299,999 | 82 (37.1%) | 137 (49.8%) |
| $300,000 to $499,999 | 0 (0.0%) | 0 (0.0%) |
| $500,000 to $749,999 | 0 (0.0%) | 0 (0.0%) |
| $750,000 to $999,999 | 0 (0.0%) | 0 (0.0%) |
| $1,000,000 or more | 0 (0.0%) | 0 (0.0%) |
| Total | 221 (100.0%) | 275 (100.0%) |
Household Income by Mortgage Status in Mount Carroll
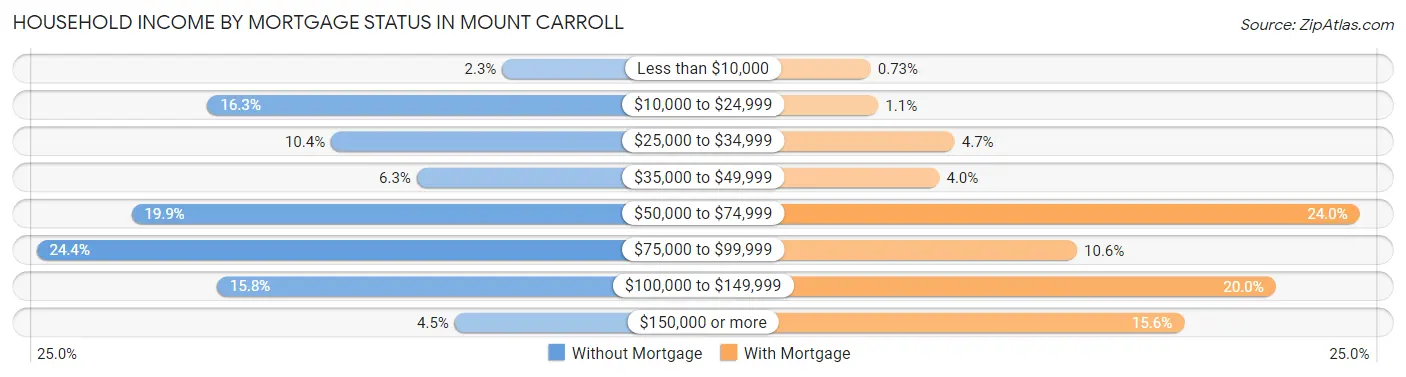
| Household Income | Without Mortgage | With Mortgage |
| Less than $10,000 | 5 (2.3%) | 2 (0.7%) |
| $10,000 to $24,999 | 36 (16.3%) | 3 (1.1%) |
| $25,000 to $34,999 | 23 (10.4%) | 13 (4.7%) |
| $35,000 to $49,999 | 14 (6.3%) | 11 (4.0%) |
| $50,000 to $74,999 | 44 (19.9%) | 66 (24.0%) |
| $75,000 to $99,999 | 54 (24.4%) | 29 (10.5%) |
| $100,000 to $149,999 | 35 (15.8%) | 55 (20.0%) |
| $150,000 or more | 10 (4.5%) | 43 (15.6%) |
| Total | 221 (100.0%) | 275 (100.0%) |
Property Value to Household Income Ratio in Mount Carroll
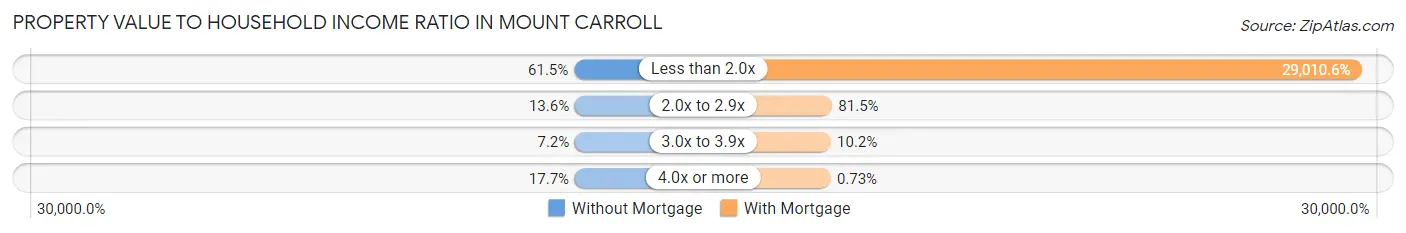
| Value-to-Income Ratio | Without Mortgage | With Mortgage |
| Less than 2.0x | 136 (61.5%) | 79,779 (29,010.6%) |
| 2.0x to 2.9x | 30 (13.6%) | 224 (81.5%) |
| 3.0x to 3.9x | 16 (7.2%) | 28 (10.2%) |
| 4.0x or more | 39 (17.6%) | 2 (0.7%) |
| Total | 221 (100.0%) | 275 (100.0%) |
Real Estate Taxes by Mortgage Status in Mount Carroll
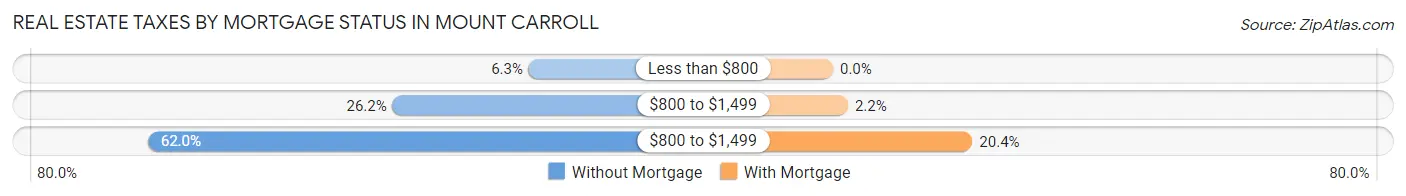
| Property Taxes | Without Mortgage | With Mortgage |
| Less than $800 | 14 (6.3%) | 0 (0.0%) |
| $800 to $1,499 | 58 (26.2%) | 6 (2.2%) |
| $800 to $1,499 | 137 (62.0%) | 56 (20.4%) |
| Total | 221 (100.0%) | 275 (100.0%) |
Health & Disability in Mount Carroll
Health Insurance Coverage by Age in Mount Carroll
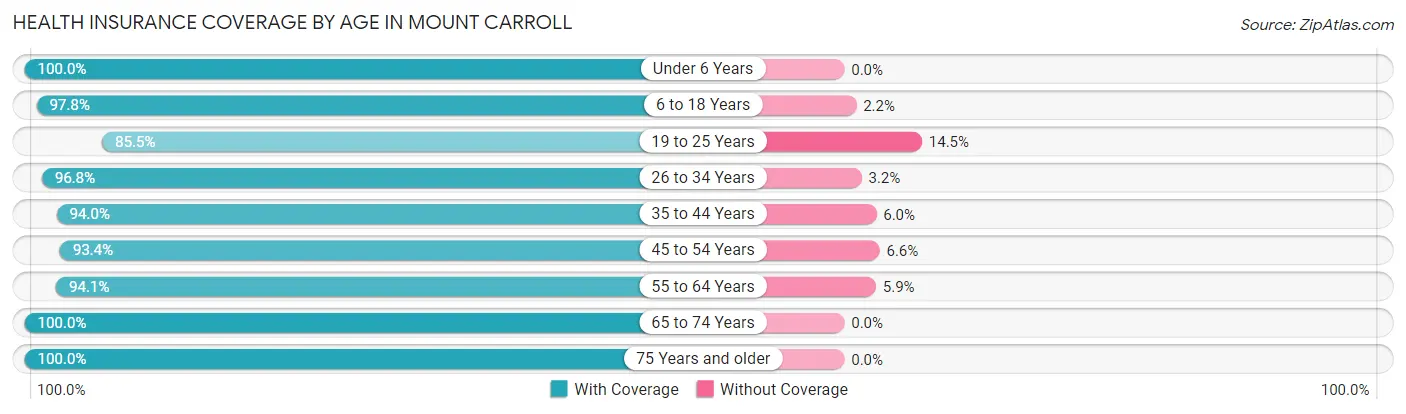
| Age Bracket | With Coverage | Without Coverage |
| Under 6 Years | 70 (100.0%) | 0 (0.0%) |
| 6 to 18 Years | 220 (97.8%) | 5 (2.2%) |
| 19 to 25 Years | 142 (85.5%) | 24 (14.5%) |
| 26 to 34 Years | 151 (96.8%) | 5 (3.2%) |
| 35 to 44 Years | 142 (94.0%) | 9 (6.0%) |
| 45 to 54 Years | 185 (93.4%) | 13 (6.6%) |
| 55 to 64 Years | 240 (94.1%) | 15 (5.9%) |
| 65 to 74 Years | 175 (100.0%) | 0 (0.0%) |
| 75 Years and older | 93 (100.0%) | 0 (0.0%) |
| Total | 1,418 (95.2%) | 71 (4.8%) |
Health Insurance Coverage by Citizenship Status in Mount Carroll
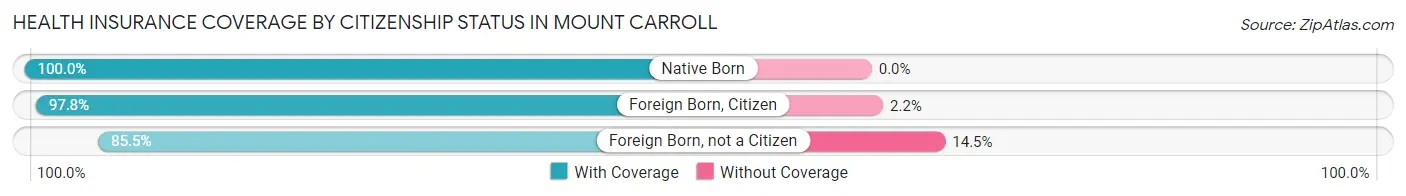
| Citizenship Status | With Coverage | Without Coverage |
| Native Born | 70 (100.0%) | 0 (0.0%) |
| Foreign Born, Citizen | 220 (97.8%) | 5 (2.2%) |
| Foreign Born, not a Citizen | 142 (85.5%) | 24 (14.5%) |
Health Insurance Coverage by Household Income in Mount Carroll
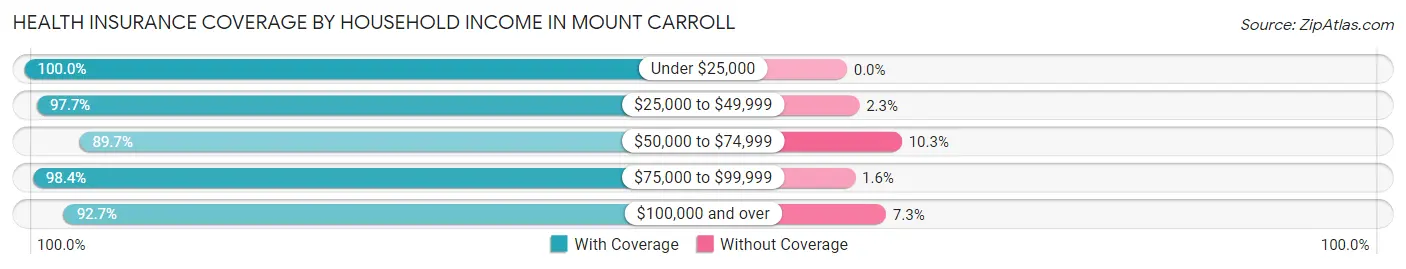
| Household Income | With Coverage | Without Coverage |
| Under $25,000 | 163 (100.0%) | 0 (0.0%) |
| $25,000 to $49,999 | 253 (97.7%) | 6 (2.3%) |
| $50,000 to $74,999 | 183 (89.7%) | 21 (10.3%) |
| $75,000 to $99,999 | 316 (98.4%) | 5 (1.6%) |
| $100,000 and over | 493 (92.7%) | 39 (7.3%) |
Public vs Private Health Insurance Coverage by Age in Mount Carroll
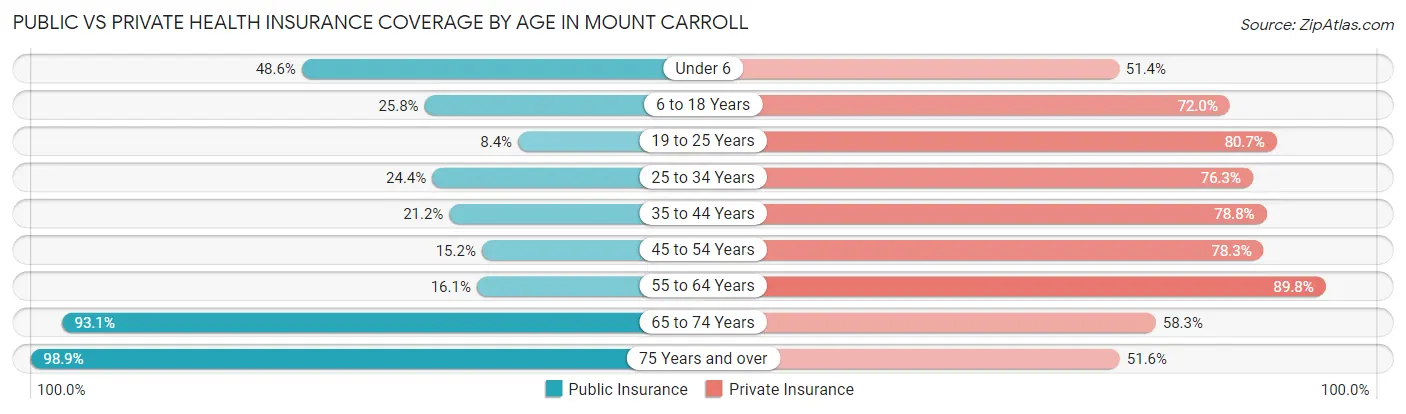
| Age Bracket | Public Insurance | Private Insurance |
| Under 6 | 34 (48.6%) | 36 (51.4%) |
| 6 to 18 Years | 58 (25.8%) | 162 (72.0%) |
| 19 to 25 Years | 14 (8.4%) | 134 (80.7%) |
| 25 to 34 Years | 38 (24.4%) | 119 (76.3%) |
| 35 to 44 Years | 32 (21.2%) | 119 (78.8%) |
| 45 to 54 Years | 30 (15.1%) | 155 (78.3%) |
| 55 to 64 Years | 41 (16.1%) | 229 (89.8%) |
| 65 to 74 Years | 163 (93.1%) | 102 (58.3%) |
| 75 Years and over | 92 (98.9%) | 48 (51.6%) |
| Total | 502 (33.7%) | 1,104 (74.1%) |
Disability Status by Sex by Age in Mount Carroll
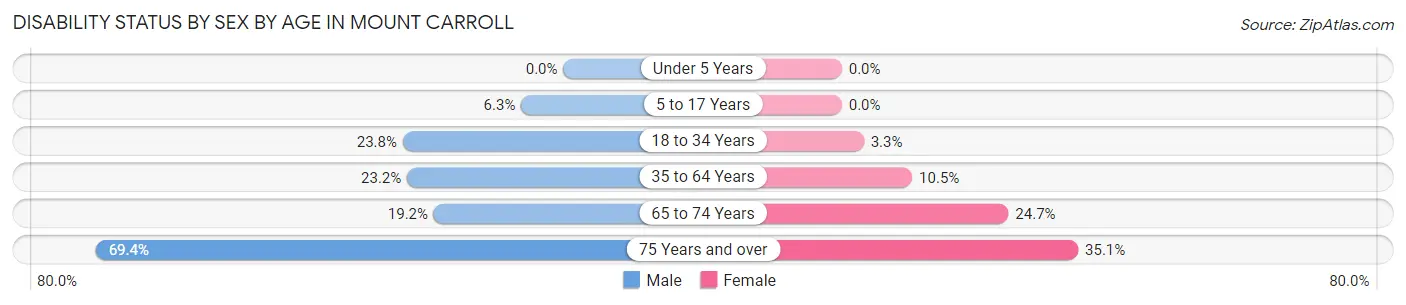
| Age Bracket | Male | Female |
| Under 5 Years | 0 (0.0%) | 0 (0.0%) |
| 5 to 17 Years | 7 (6.2%) | 0 (0.0%) |
| 18 to 34 Years | 41 (23.8%) | 5 (3.3%) |
| 35 to 64 Years | 58 (23.2%) | 37 (10.4%) |
| 65 to 74 Years | 15 (19.2%) | 24 (24.7%) |
| 75 Years and over | 25 (69.4%) | 20 (35.1%) |
Disability Class by Sex by Age in Mount Carroll
Disability Class: Hearing Difficulty
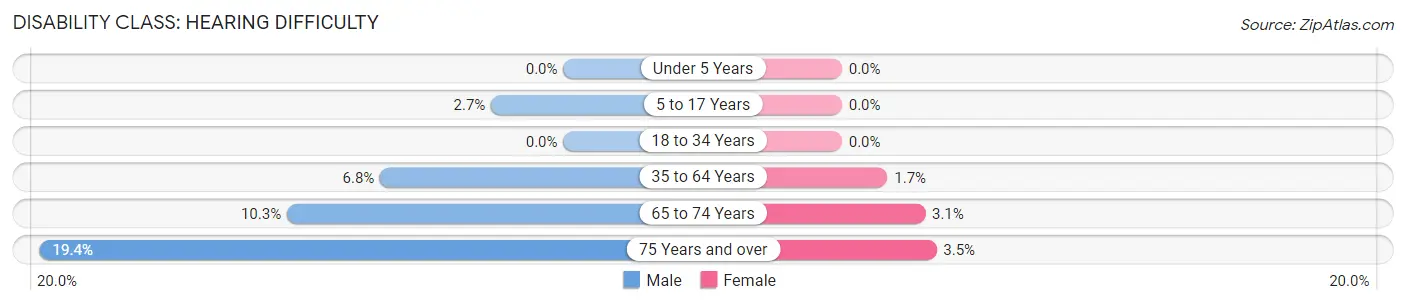
| Age Bracket | Male | Female |
| Under 5 Years | 0 (0.0%) | 0 (0.0%) |
| 5 to 17 Years | 3 (2.7%) | 0 (0.0%) |
| 18 to 34 Years | 0 (0.0%) | 0 (0.0%) |
| 35 to 64 Years | 17 (6.8%) | 6 (1.7%) |
| 65 to 74 Years | 8 (10.3%) | 3 (3.1%) |
| 75 Years and over | 7 (19.4%) | 2 (3.5%) |
Disability Class: Vision Difficulty
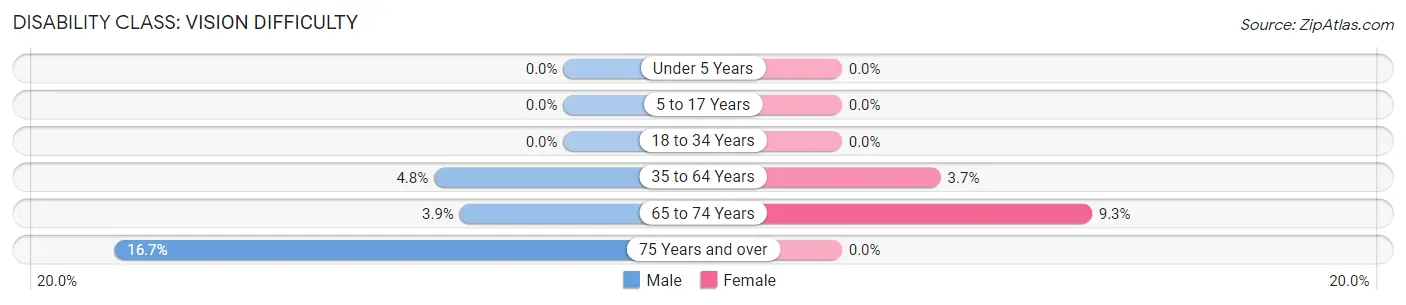
| Age Bracket | Male | Female |
| Under 5 Years | 0 (0.0%) | 0 (0.0%) |
| 5 to 17 Years | 0 (0.0%) | 0 (0.0%) |
| 18 to 34 Years | 0 (0.0%) | 0 (0.0%) |
| 35 to 64 Years | 12 (4.8%) | 13 (3.7%) |
| 65 to 74 Years | 3 (3.8%) | 9 (9.3%) |
| 75 Years and over | 6 (16.7%) | 0 (0.0%) |
Disability Class: Cognitive Difficulty
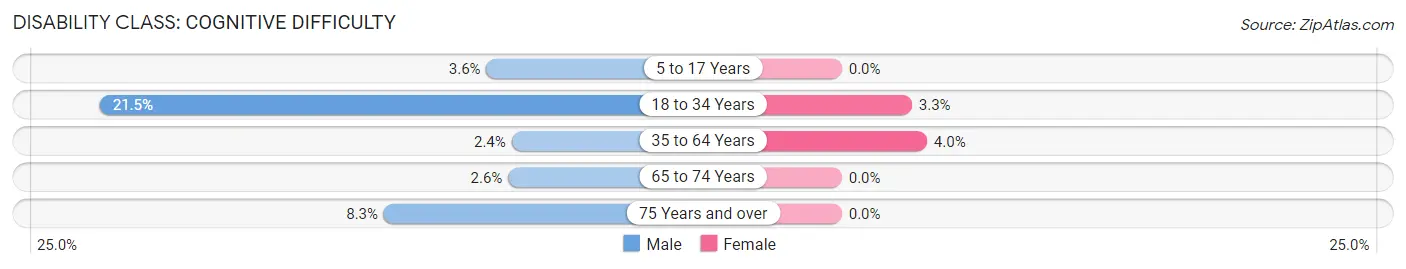
| Age Bracket | Male | Female |
| 5 to 17 Years | 4 (3.6%) | 0 (0.0%) |
| 18 to 34 Years | 37 (21.5%) | 5 (3.3%) |
| 35 to 64 Years | 6 (2.4%) | 14 (4.0%) |
| 65 to 74 Years | 2 (2.6%) | 0 (0.0%) |
| 75 Years and over | 3 (8.3%) | 0 (0.0%) |
Disability Class: Ambulatory Difficulty
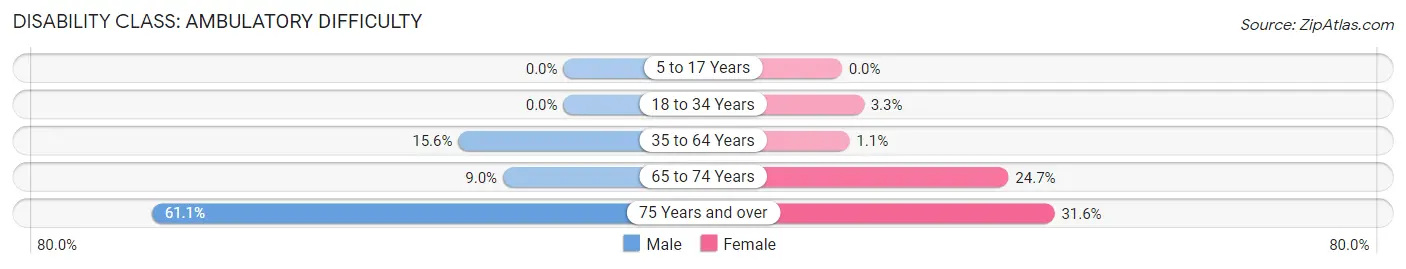
| Age Bracket | Male | Female |
| 5 to 17 Years | 0 (0.0%) | 0 (0.0%) |
| 18 to 34 Years | 0 (0.0%) | 5 (3.3%) |
| 35 to 64 Years | 39 (15.6%) | 4 (1.1%) |
| 65 to 74 Years | 7 (9.0%) | 24 (24.7%) |
| 75 Years and over | 22 (61.1%) | 18 (31.6%) |
Disability Class: Self-Care Difficulty
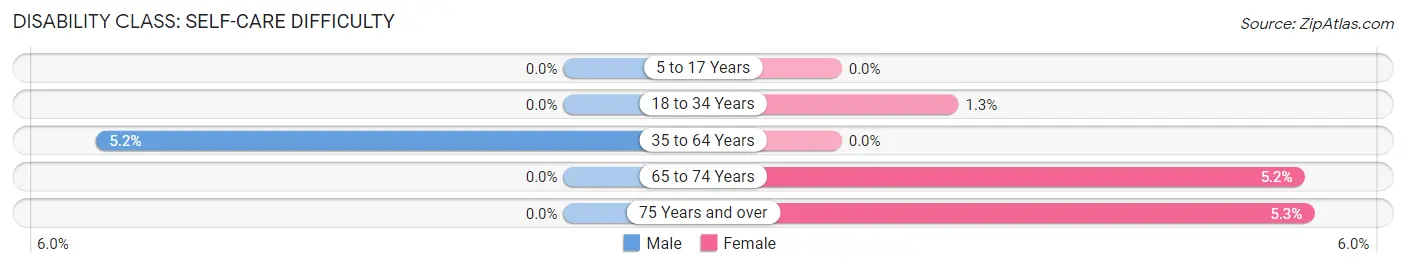
| Age Bracket | Male | Female |
| 5 to 17 Years | 0 (0.0%) | 0 (0.0%) |
| 18 to 34 Years | 0 (0.0%) | 2 (1.3%) |
| 35 to 64 Years | 13 (5.2%) | 0 (0.0%) |
| 65 to 74 Years | 0 (0.0%) | 5 (5.1%) |
| 75 Years and over | 0 (0.0%) | 3 (5.3%) |
Technology Access in Mount Carroll
Computing Device Access in Mount Carroll
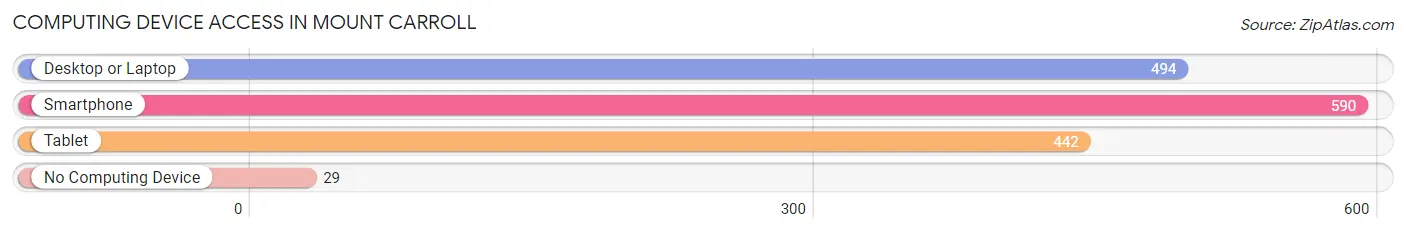
| Device Type | # Households | % Households |
| Desktop or Laptop | 494 | 73.8% |
| Smartphone | 590 | 88.2% |
| Tablet | 442 | 66.1% |
| No Computing Device | 29 | 4.3% |
| Total | 669 | 100.0% |
Internet Access in Mount Carroll
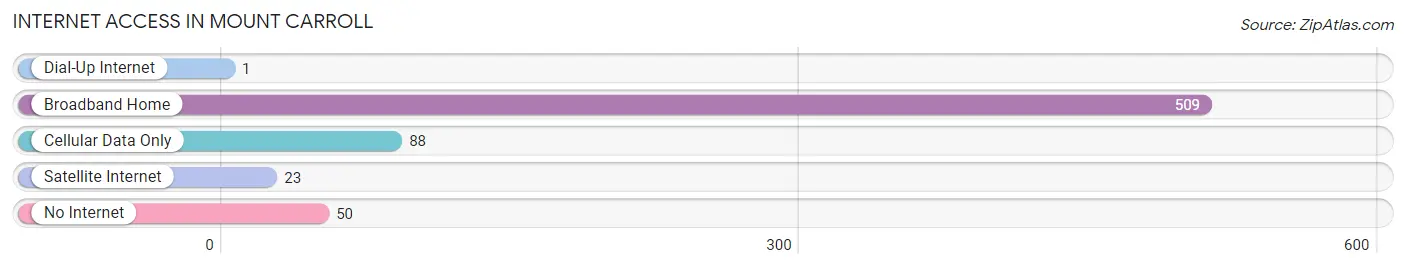
| Internet Type | # Households | % Households |
| Dial-Up Internet | 1 | 0.2% |
| Broadband Home | 509 | 76.1% |
| Cellular Data Only | 88 | 13.2% |
| Satellite Internet | 23 | 3.4% |
| No Internet | 50 | 7.5% |
| Total | 669 | 100.0% |
Mount Carroll Summary
Carroll County, Illinois is located in the northwestern corner of the state, and is bordered by Wisconsin to the north, Iowa to the west, and the Mississippi River to the south. The county seat is Mount Carroll, which is located in the center of the county. The county was established in 1839 and named after Charles Carroll, the last surviving signer of the Declaration of Independence.
History
The area that is now Carroll County was first settled by Native Americans, including the Sauk, Fox, and Kickapoo tribes. The first white settlers arrived in the area in the early 1830s, and the county was officially established in 1839. The county was named after Charles Carroll, the last surviving signer of the Declaration of Independence.
The county was largely agricultural in its early years, with the main crops being wheat, corn, and oats. The first railroad line in the county was built in 1853, connecting Mount Carroll to Freeport. This line was later extended to Galena, and eventually to Chicago.
The county was also home to several small towns, including Lanark, Savanna, and Shannon. The county seat, Mount Carroll, was founded in 1841 and named after Charles Carroll. The town was an important stop on the Underground Railroad, and was home to several prominent abolitionists.
Geography
Carroll County is located in the northwestern corner of Illinois, and is bordered by Wisconsin to the north, Iowa to the west, and the Mississippi River to the south. The county covers an area of 576 square miles, and is mostly rural, with only a few small towns. The terrain is mostly flat, with some rolling hills in the northern part of the county. The highest point in the county is located in the northwest corner, at an elevation of 1,068 feet.
The county is home to several rivers and streams, including the Apple River, the Pecatonica River, and the Rock River. The county is also home to several lakes, including Lake Carroll, Lake Le-Aqua-Na, and Lake Carroll.
Economy
The economy of Carroll County is largely based on agriculture. The main crops grown in the county are corn, soybeans, wheat, and oats. The county is also home to several small businesses, including manufacturing, retail, and tourism.
The county is home to several large employers, including the Lanark-based Lanark Manufacturing Company, the Savanna-based Savanna Manufacturing Company, and the Shannon-based Shannon Manufacturing Company. The county is also home to several small businesses, including restaurants, retail stores, and tourist attractions.
Demographics
As of the 2010 census, the population of Carroll County was 15,387. The population is largely white (96.3%), with small percentages of African American (1.2%), Hispanic (1.1%), and Asian (0.4%) residents. The median household income in the county is $50,845, and the median home value is $117,400.
The county is home to several small towns, including Lanark, Savanna, and Shannon. The county seat, Mount Carroll, is home to 2,845 residents. The town is home to several historic buildings, including the Mount Carroll Courthouse, the Mount Carroll Opera House, and the Mount Carroll Public Library.
Conclusion
Carroll County, Illinois is located in the northwestern corner of the state, and is bordered by Wisconsin to the north, Iowa to the west, and the Mississippi River to the south. The county was established in 1839 and named after Charles Carroll, the last surviving signer of the Declaration of Independence. The county is largely rural, with a population of 15,387 as of the 2010 census. The economy of the county is largely based on agriculture, with the main crops being corn, soybeans, wheat, and oats. The county is also home to several small businesses, including manufacturing, retail, and tourism. The county seat, Mount Carroll, is home to 2,845 residents and is home to several historic buildings.
Common Questions
What is Per Capita Income in Mount Carroll?
Per Capita income in Mount Carroll is $32,628.
What is the Median Family Income in Mount Carroll?
Median Family Income in Mount Carroll is $82,000.
What is the Median Household income in Mount Carroll?
Median Household Income in Mount Carroll is $63,992.
What is Income or Wage Gap in Mount Carroll?
Income or Wage Gap in Mount Carroll is 15.9%.
Women in Mount Carroll earn 84.1 cents for every dollar earned by a man.
What is Inequality or Gini Index in Mount Carroll?
Inequality or Gini Index in Mount Carroll is 0.39.
What is the Total Population of Mount Carroll?
Total Population of Mount Carroll is 1,560.
What is the Total Male Population of Mount Carroll?
Total Male Population of Mount Carroll is 705.
What is the Total Female Population of Mount Carroll?
Total Female Population of Mount Carroll is 855.
What is the Ratio of Males per 100 Females in Mount Carroll?
There are 82.46 Males per 100 Females in Mount Carroll.
What is the Ratio of Females per 100 Males in Mount Carroll?
There are 121.28 Females per 100 Males in Mount Carroll.
What is the Median Population Age in Mount Carroll?
Median Population Age in Mount Carroll is 44.9 Years.
What is the Average Family Size in Mount Carroll
Average Family Size in Mount Carroll is 2.8 People.
What is the Average Household Size in Mount Carroll
Average Household Size in Mount Carroll is 2.2 People.
How Large is the Labor Force in Mount Carroll?
There are 862 People in the Labor Forcein in Mount Carroll.
What is the Percentage of People in the Labor Force in Mount Carroll?
66.3% of People are in the Labor Force in Mount Carroll.
What is the Unemployment Rate in Mount Carroll?
Unemployment Rate in Mount Carroll is 2.6%.