Mount Auburn, IL Map & Demographics
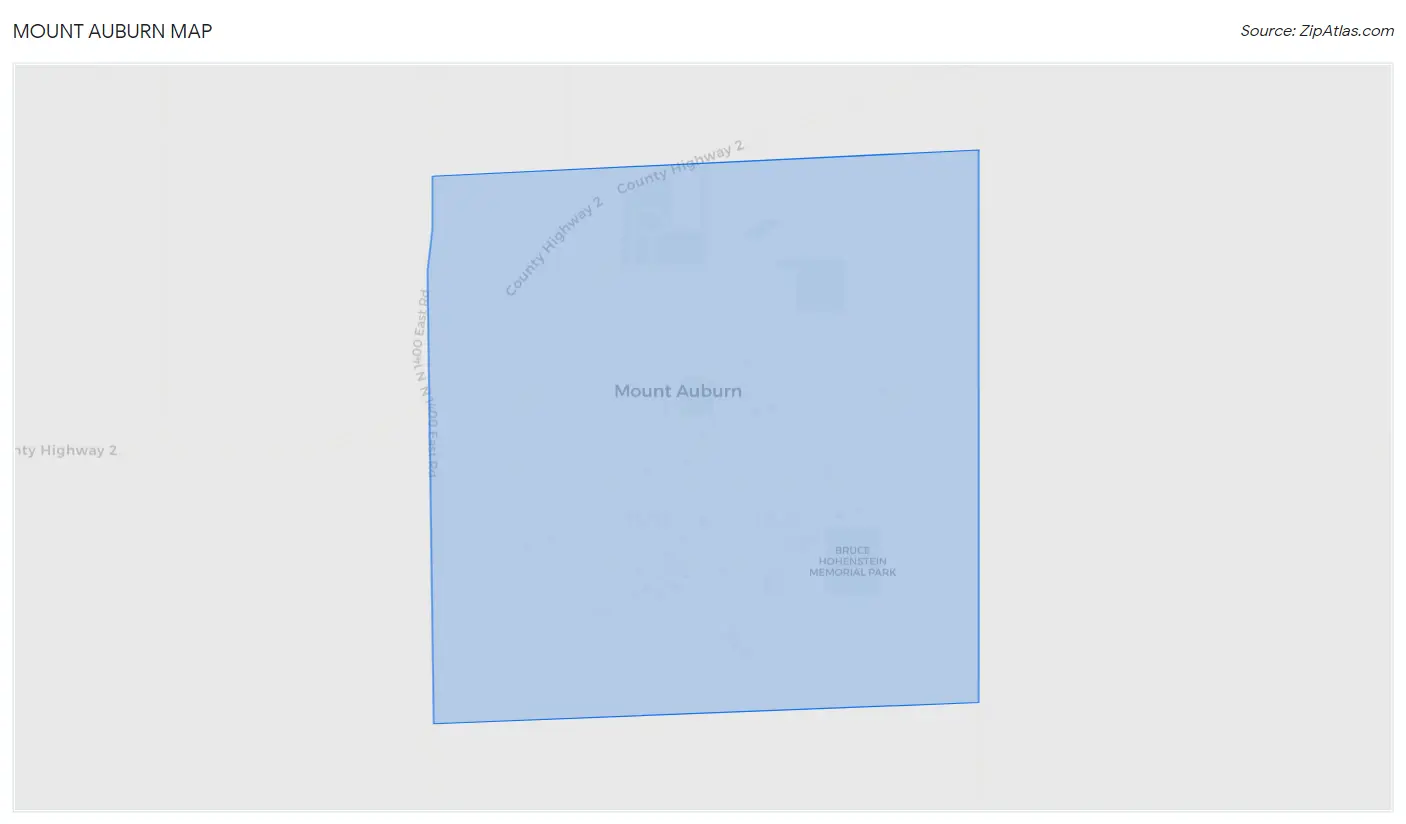
Mount Auburn Map
Mount Auburn Overview
$22,052
PER CAPITA INCOME
$70,417
AVG FAMILY INCOME
$48,750
AVG HOUSEHOLD INCOME
47.1%
WAGE / INCOME GAP [ % ]
52.9¢/ $1
WAGE / INCOME GAP [ $ ]
0.38
INEQUALITY / GINI INDEX
528
TOTAL POPULATION
335
MALE POPULATION
193
FEMALE POPULATION
173.58
MALES / 100 FEMALES
57.61
FEMALES / 100 MALES
38.4
MEDIAN AGE
3.8
AVG FAMILY SIZE
2.8
AVG HOUSEHOLD SIZE
259
LABOR FORCE [ PEOPLE ]
66.1%
PERCENT IN LABOR FORCE
6.6%
UNEMPLOYMENT RATE
Mount Auburn Zip Codes
Mount Auburn Area Codes
Income in Mount Auburn
Income Overview in Mount Auburn
Per Capita Income in Mount Auburn is $22,052, while median incomes of families and households are $70,417 and $48,750 respectively.
| Characteristic | Number | Measure |
| Per Capita Income | 528 | $22,052 |
| Median Family Income | 107 | $70,417 |
| Mean Family Income | 107 | $68,147 |
| Median Household Income | 191 | $48,750 |
| Mean Household Income | 191 | $56,141 |
| Income Deficit | 107 | $0 |
| Wage / Income Gap (%) | 528 | 47.13% |
| Wage / Income Gap ($) | 528 | 52.87¢ per $1 |
| Gini / Inequality Index | 528 | 0.38 |
Earnings by Sex in Mount Auburn
Average Earnings in Mount Auburn are $29,904, $36,250 for men and $19,167 for women, a difference of 47.1%.
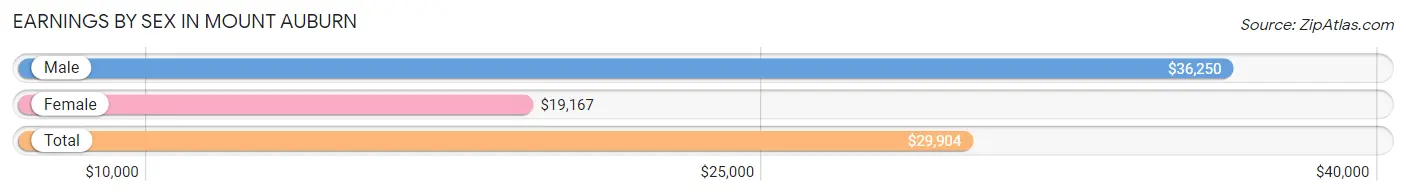
| Sex | Number | Average Earnings |
| Male | 152 (59.4%) | $36,250 |
| Female | 104 (40.6%) | $19,167 |
| Total | 256 (100.0%) | $29,904 |
Earnings by Sex by Income Bracket in Mount Auburn
The most common earnings brackets in Mount Auburn are $10,000 to $12,499 for men (29 | 19.1%) and $35,000 to $39,999 for women (21 | 20.2%).
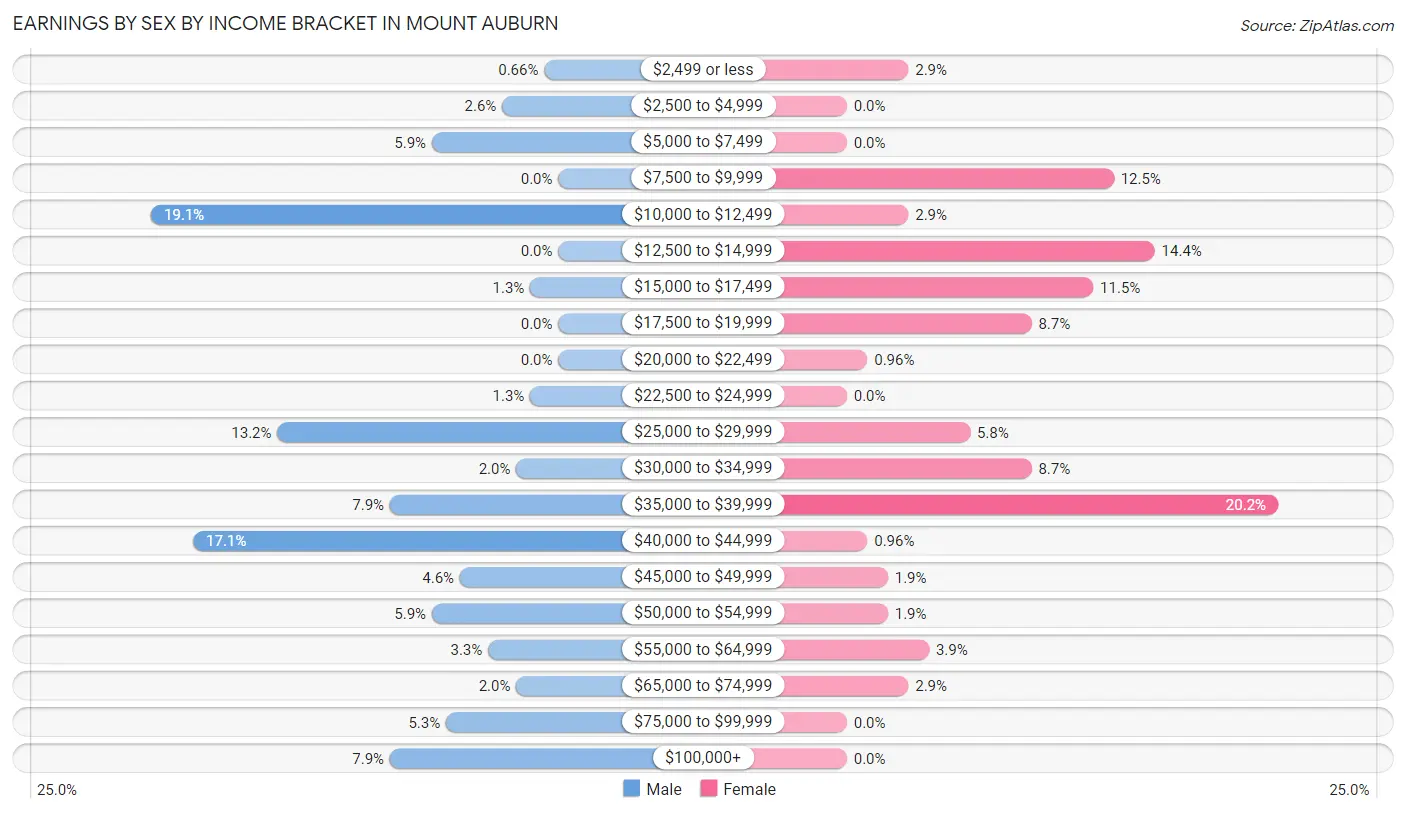
| Income | Male | Female |
| $2,499 or less | 1 (0.7%) | 3 (2.9%) |
| $2,500 to $4,999 | 4 (2.6%) | 0 (0.0%) |
| $5,000 to $7,499 | 9 (5.9%) | 0 (0.0%) |
| $7,500 to $9,999 | 0 (0.0%) | 13 (12.5%) |
| $10,000 to $12,499 | 29 (19.1%) | 3 (2.9%) |
| $12,500 to $14,999 | 0 (0.0%) | 15 (14.4%) |
| $15,000 to $17,499 | 2 (1.3%) | 12 (11.5%) |
| $17,500 to $19,999 | 0 (0.0%) | 9 (8.6%) |
| $20,000 to $22,499 | 0 (0.0%) | 1 (1.0%) |
| $22,500 to $24,999 | 2 (1.3%) | 0 (0.0%) |
| $25,000 to $29,999 | 20 (13.2%) | 6 (5.8%) |
| $30,000 to $34,999 | 3 (2.0%) | 9 (8.6%) |
| $35,000 to $39,999 | 12 (7.9%) | 21 (20.2%) |
| $40,000 to $44,999 | 26 (17.1%) | 1 (1.0%) |
| $45,000 to $49,999 | 7 (4.6%) | 2 (1.9%) |
| $50,000 to $54,999 | 9 (5.9%) | 2 (1.9%) |
| $55,000 to $64,999 | 5 (3.3%) | 4 (3.8%) |
| $65,000 to $74,999 | 3 (2.0%) | 3 (2.9%) |
| $75,000 to $99,999 | 8 (5.3%) | 0 (0.0%) |
| $100,000+ | 12 (7.9%) | 0 (0.0%) |
| Total | 152 (100.0%) | 104 (100.0%) |
Earnings by Sex by Educational Attainment in Mount Auburn
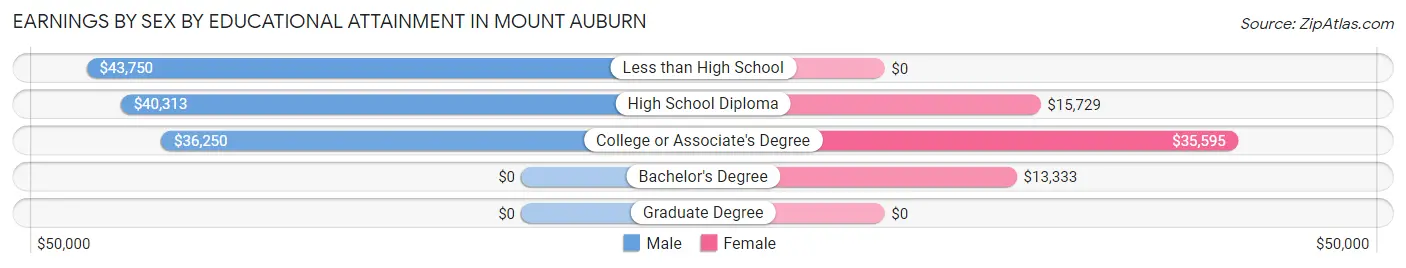
| Educational Attainment | Male Income | Female Income |
| Less than High School | $43,750 | $0 |
| High School Diploma | $40,313 | $15,729 |
| College or Associate's Degree | $36,250 | $35,595 |
| Bachelor's Degree | - | - |
| Graduate Degree | - | - |
| Total | $40,543 | $0 |
Family Income in Mount Auburn
Family Income Brackets in Mount Auburn
According to the Mount Auburn family income data, there are 27 families falling into the $75,000 to $99,999 income range, which is the most common income bracket and makes up 25.2% of all families.
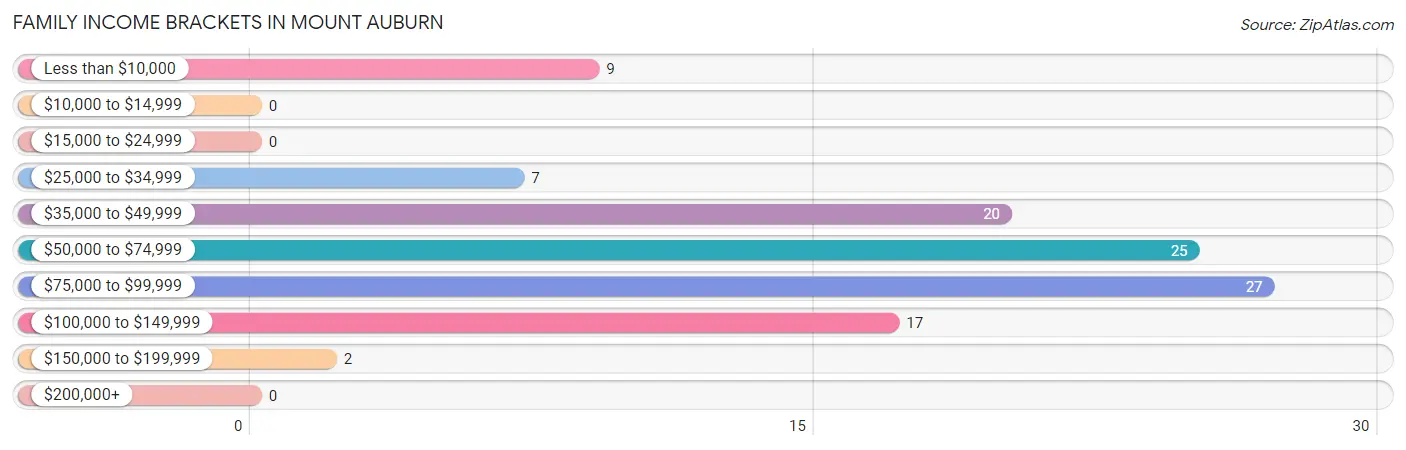
| Income Bracket | # Families | % Families |
| Less than $10,000 | 9 | 8.4% |
| $10,000 to $14,999 | 0 | 0.0% |
| $15,000 to $24,999 | 0 | 0.0% |
| $25,000 to $34,999 | 7 | 6.5% |
| $35,000 to $49,999 | 20 | 18.7% |
| $50,000 to $74,999 | 25 | 23.4% |
| $75,000 to $99,999 | 27 | 25.2% |
| $100,000 to $149,999 | 17 | 15.9% |
| $150,000 to $199,999 | 2 | 1.9% |
| $200,000+ | 0 | 0.0% |
Family Income by Famaliy Size in Mount Auburn
3-person families (21 | 19.6%) account for the highest median family income in Mount Auburn with $78,417 per family, while 3-person families (21 | 19.6%) have the highest median income of $26,139 per family member.
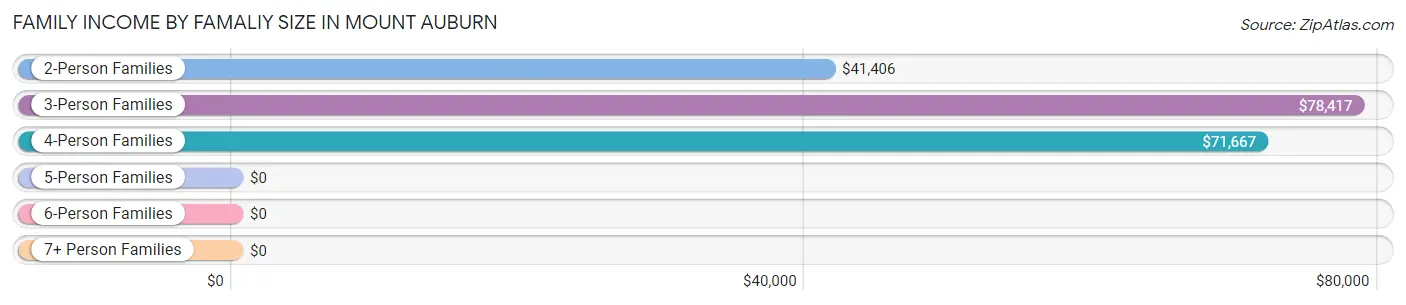
| Income Bracket | # Families | Median Income |
| 2-Person Families | 43 (40.2%) | $41,406 |
| 3-Person Families | 21 (19.6%) | $78,417 |
| 4-Person Families | 22 (20.6%) | $71,667 |
| 5-Person Families | 14 (13.1%) | $0 |
| 6-Person Families | 7 (6.5%) | $0 |
| 7+ Person Families | 0 (0.0%) | $0 |
| Total | 107 (100.0%) | $70,417 |
Family Income by Number of Earners in Mount Auburn
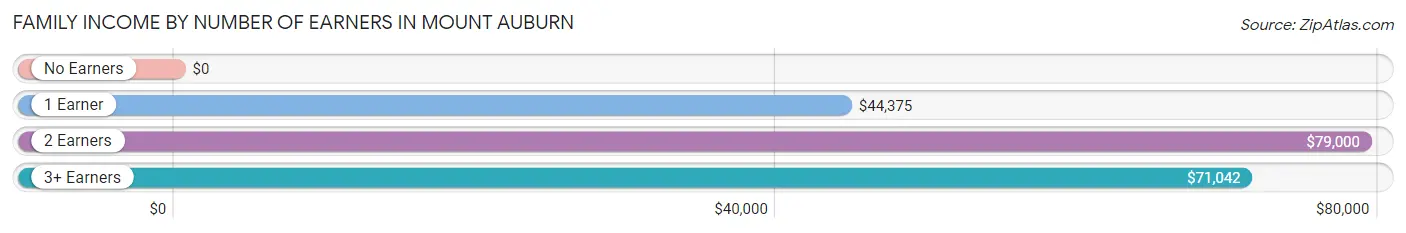
| Number of Earners | # Families | Median Income |
| No Earners | 21 (19.6%) | $0 |
| 1 Earner | 27 (25.2%) | $44,375 |
| 2 Earners | 48 (44.9%) | $79,000 |
| 3+ Earners | 11 (10.3%) | $71,042 |
| Total | 107 (100.0%) | $70,417 |
Household Income in Mount Auburn
Household Income Brackets in Mount Auburn
With 33 households falling in the category, the $50,000 to $74,999 income range is the most frequent in Mount Auburn, accounting for 17.3% of all households.
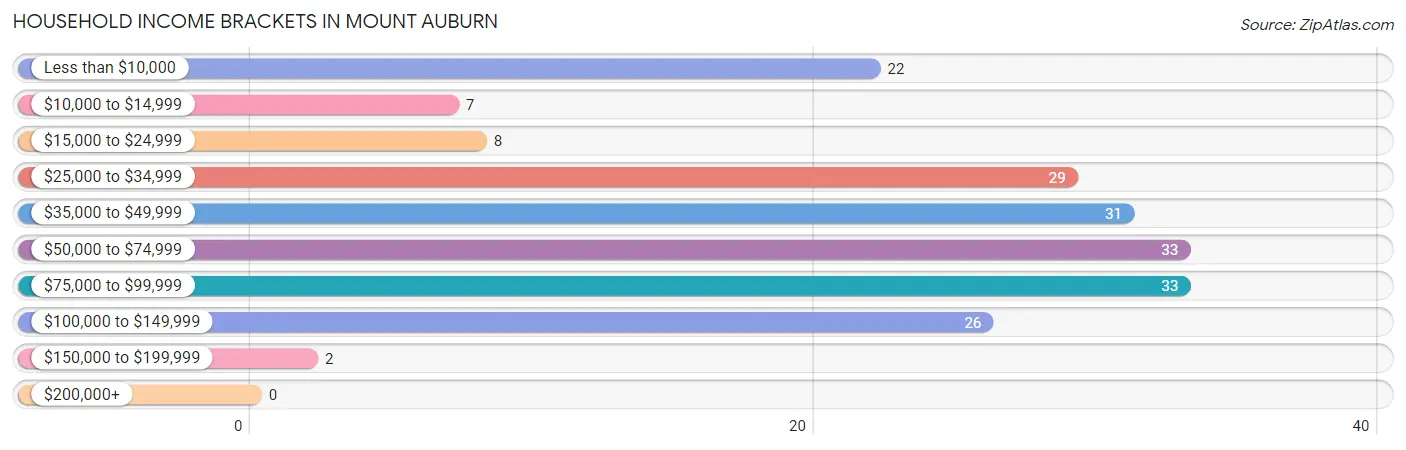
| Income Bracket | # Households | % Households |
| Less than $10,000 | 22 | 11.5% |
| $10,000 to $14,999 | 7 | 3.7% |
| $15,000 to $24,999 | 8 | 4.2% |
| $25,000 to $34,999 | 29 | 15.2% |
| $35,000 to $49,999 | 31 | 16.2% |
| $50,000 to $74,999 | 33 | 17.3% |
| $75,000 to $99,999 | 33 | 17.3% |
| $100,000 to $149,999 | 26 | 13.6% |
| $150,000 to $199,999 | 2 | 1.0% |
| $200,000+ | 0 | 0.0% |
Household Income by Householder Age in Mount Auburn
The median household income in Mount Auburn is $48,750, with the highest median household income of $62,500 found in the 45 to 64 years age bracket for the primary householder. A total of 56 households (29.3%) fall into this category. Meanwhile, the 15 to 24 years age bracket for the primary householder has the lowest median household income of $0, with 2 households (1.1%) in this group.
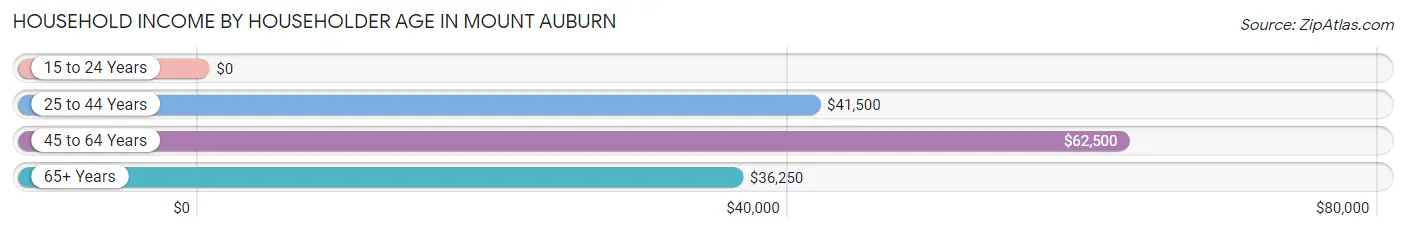
| Income Bracket | # Households | Median Income |
| 15 to 24 Years | 2 (1.1%) | $0 |
| 25 to 44 Years | 76 (39.8%) | $41,500 |
| 45 to 64 Years | 56 (29.3%) | $62,500 |
| 65+ Years | 57 (29.8%) | $36,250 |
| Total | 191 (100.0%) | $48,750 |
Poverty in Mount Auburn
Income Below Poverty by Sex and Age in Mount Auburn
With 12.5% poverty level for males and 11.4% for females among the residents of Mount Auburn, 15 year old males and 25 to 34 year old females are the most vulnerable to poverty, with 3 males (50.0%) and 14 females (60.9%) in their respective age groups living below the poverty level.
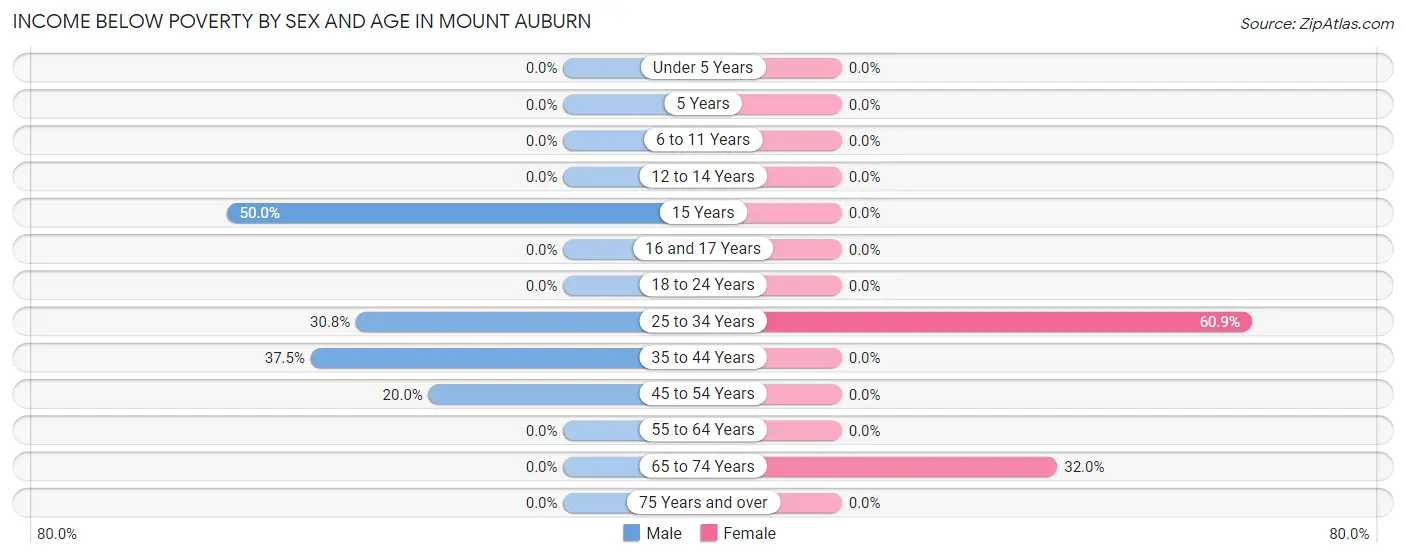
| Age Bracket | Male | Female |
| Under 5 Years | 0 (0.0%) | 0 (0.0%) |
| 5 Years | 0 (0.0%) | 0 (0.0%) |
| 6 to 11 Years | 0 (0.0%) | 0 (0.0%) |
| 12 to 14 Years | 0 (0.0%) | 0 (0.0%) |
| 15 Years | 3 (50.0%) | 0 (0.0%) |
| 16 and 17 Years | 0 (0.0%) | 0 (0.0%) |
| 18 to 24 Years | 0 (0.0%) | 0 (0.0%) |
| 25 to 34 Years | 8 (30.8%) | 14 (60.9%) |
| 35 to 44 Years | 24 (37.5%) | 0 (0.0%) |
| 45 to 54 Years | 7 (20.0%) | 0 (0.0%) |
| 55 to 64 Years | 0 (0.0%) | 0 (0.0%) |
| 65 to 74 Years | 0 (0.0%) | 8 (32.0%) |
| 75 Years and over | 0 (0.0%) | 0 (0.0%) |
| Total | 42 (12.5%) | 22 (11.4%) |
Income Above Poverty by Sex and Age in Mount Auburn
According to the poverty statistics in Mount Auburn, males aged under 5 years and females aged under 5 years are the age groups that are most secure financially, with 100.0% of males and 100.0% of females in these age groups living above the poverty line.
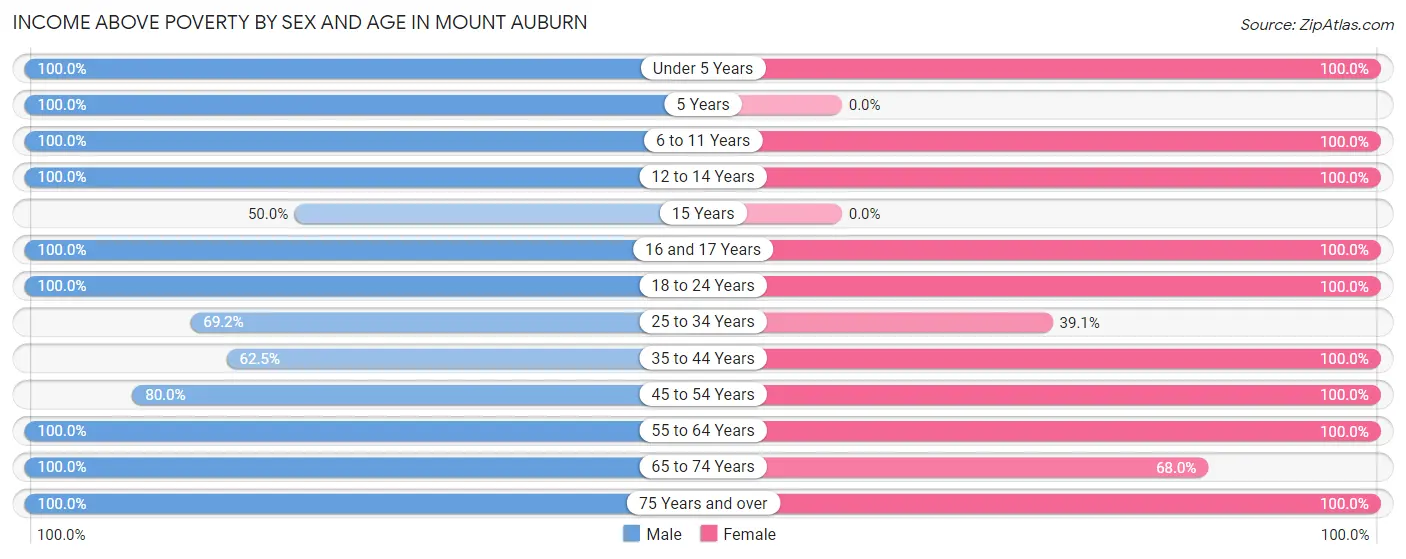
| Age Bracket | Male | Female |
| Under 5 Years | 56 (100.0%) | 8 (100.0%) |
| 5 Years | 3 (100.0%) | 0 (0.0%) |
| 6 to 11 Years | 28 (100.0%) | 8 (100.0%) |
| 12 to 14 Years | 21 (100.0%) | 6 (100.0%) |
| 15 Years | 3 (50.0%) | 0 (0.0%) |
| 16 and 17 Years | 21 (100.0%) | 3 (100.0%) |
| 18 to 24 Years | 28 (100.0%) | 6 (100.0%) |
| 25 to 34 Years | 18 (69.2%) | 9 (39.1%) |
| 35 to 44 Years | 40 (62.5%) | 53 (100.0%) |
| 45 to 54 Years | 28 (80.0%) | 23 (100.0%) |
| 55 to 64 Years | 18 (100.0%) | 25 (100.0%) |
| 65 to 74 Years | 19 (100.0%) | 17 (68.0%) |
| 75 Years and over | 10 (100.0%) | 13 (100.0%) |
| Total | 293 (87.5%) | 171 (88.6%) |
Income Below Poverty Among Married-Couple Families in Mount Auburn
The poverty statistics for married-couple families in Mount Auburn show that 7.3% or 7 of the total 96 families live below the poverty line. Families with no children have the highest poverty rate of 17.9%, comprising of 7 families. On the other hand, families with 1 or 2 children have the lowest poverty rate of 0.0%, which includes 0 families.
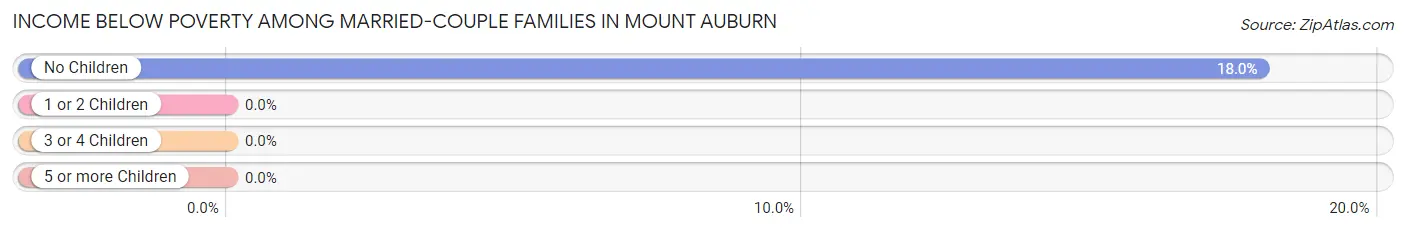
| Children | Above Poverty | Below Poverty |
| No Children | 32 (82.1%) | 7 (17.9%) |
| 1 or 2 Children | 38 (100.0%) | 0 (0.0%) |
| 3 or 4 Children | 19 (100.0%) | 0 (0.0%) |
| 5 or more Children | 0 (0.0%) | 0 (0.0%) |
| Total | 89 (92.7%) | 7 (7.3%) |
Income Below Poverty Among Single-Parent Households in Mount Auburn
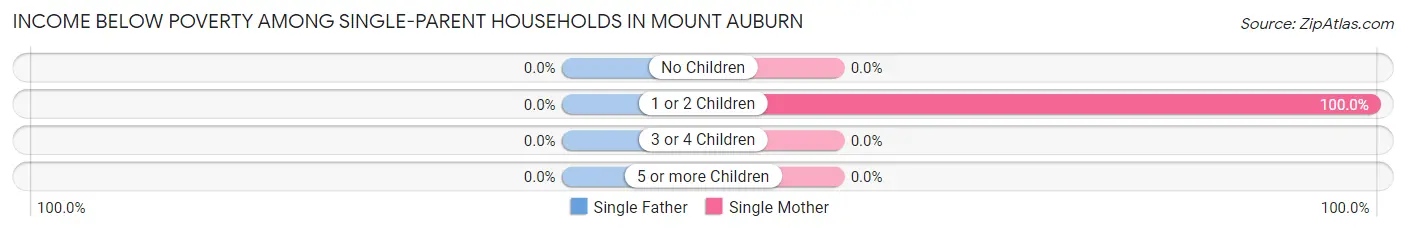
| Children | Single Father | Single Mother |
| No Children | 0 (0.0%) | 0 (0.0%) |
| 1 or 2 Children | 0 (0.0%) | 2 (100.0%) |
| 3 or 4 Children | 0 (0.0%) | 0 (0.0%) |
| 5 or more Children | 0 (0.0%) | 0 (0.0%) |
| Total | 0 (0.0%) | 2 (50.0%) |
Income Below Poverty Among Married-Couple vs Single-Parent Households in Mount Auburn
The poverty data for Mount Auburn shows that 7 of the married-couple family households (7.3%) and 2 of the single-parent households (18.2%) are living below the poverty level. Within the married-couple family households, those with no children have the highest poverty rate, with 7 households (17.9%) falling below the poverty line. Among the single-parent households, those with 1 or 2 children have the highest poverty rate, with 2 household (40.0%) living below poverty.
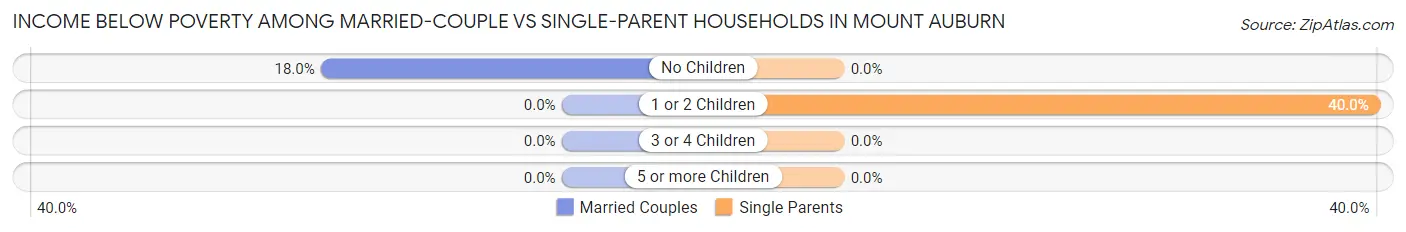
| Children | Married-Couple Families | Single-Parent Households |
| No Children | 7 (17.9%) | 0 (0.0%) |
| 1 or 2 Children | 0 (0.0%) | 2 (40.0%) |
| 3 or 4 Children | 0 (0.0%) | 0 (0.0%) |
| 5 or more Children | 0 (0.0%) | 0 (0.0%) |
| Total | 7 (7.3%) | 2 (18.2%) |
Race in Mount Auburn
The most populous races in Mount Auburn are White / Caucasian (464 | 87.9%), Two or more Races (63 | 11.9%), and Asian (1 | 0.2%).
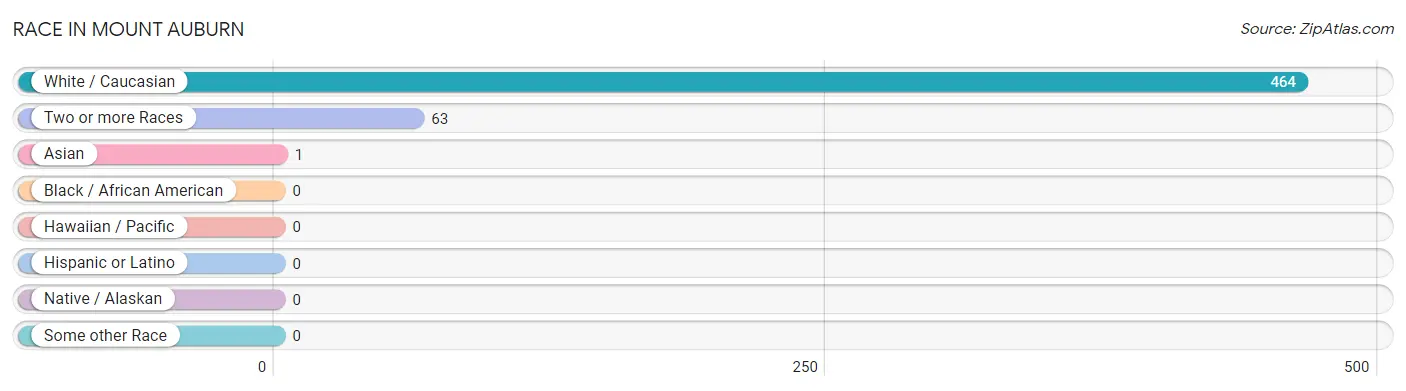
| Race | # Population | % Population |
| Asian | 1 | 0.2% |
| Black / African American | 0 | 0.0% |
| Hawaiian / Pacific | 0 | 0.0% |
| Hispanic or Latino | 0 | 0.0% |
| Native / Alaskan | 0 | 0.0% |
| White / Caucasian | 464 | 87.9% |
| Two or more Races | 63 | 11.9% |
| Some other Race | 0 | 0.0% |
| Total | 528 | 100.0% |
Ancestry in Mount Auburn
The most populous ancestries reported in Mount Auburn are English (83 | 15.7%), German (52 | 9.9%), American (50 | 9.5%), Irish (44 | 8.3%), and Nigerian (42 | 8.0%), together accounting for 51.3% of all Mount Auburn residents.
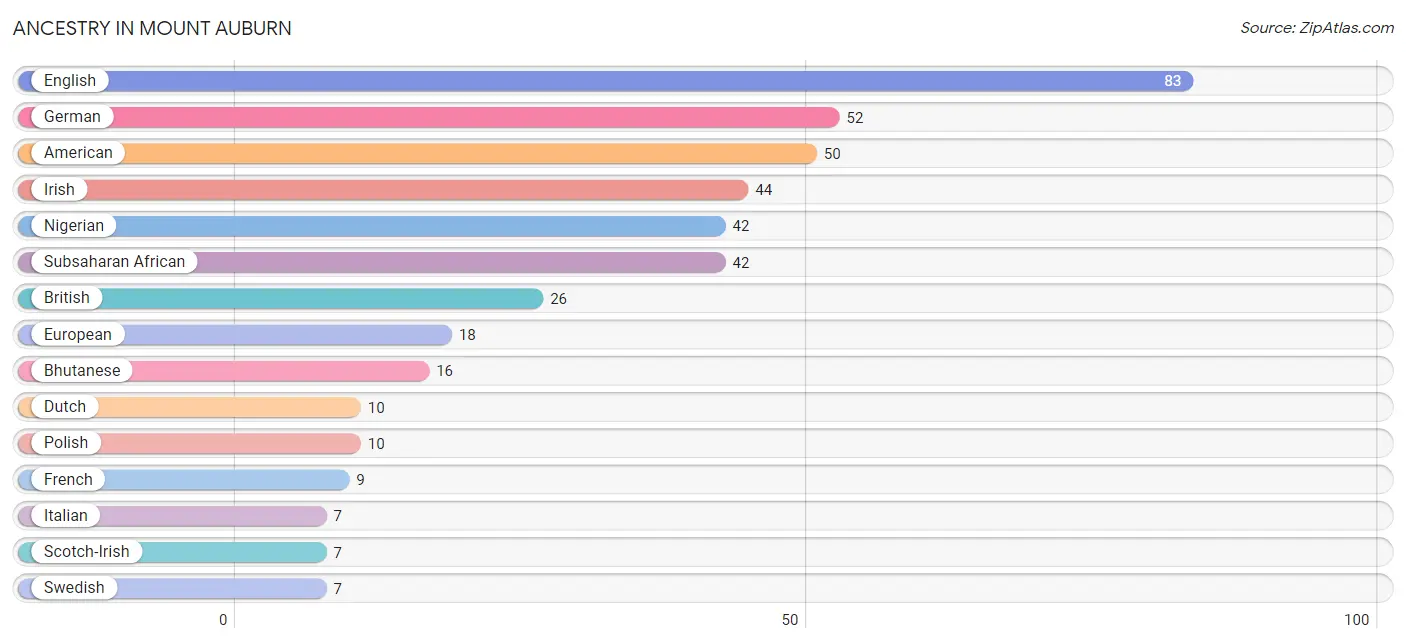
| Ancestry | # Population | % Population |
| American | 50 | 9.5% |
| Bhutanese | 16 | 3.0% |
| British | 26 | 4.9% |
| Dutch | 10 | 1.9% |
| English | 83 | 15.7% |
| European | 18 | 3.4% |
| French | 9 | 1.7% |
| German | 52 | 9.9% |
| Irish | 44 | 8.3% |
| Italian | 7 | 1.3% |
| Nigerian | 42 | 8.0% |
| Norwegian | 6 | 1.1% |
| Polish | 10 | 1.9% |
| Scotch-Irish | 7 | 1.3% |
| Scottish | 1 | 0.2% |
| Subsaharan African | 42 | 8.0% |
| Swedish | 7 | 1.3% | View All 17 Rows |
Immigrants in Mount Auburn
The most numerous immigrant groups reported in Mount Auburn came from Asia (1 | 0.2%), Eastern Asia (1 | 0.2%), and Japan (1 | 0.2%), together accounting for 0.6% of all Mount Auburn residents.
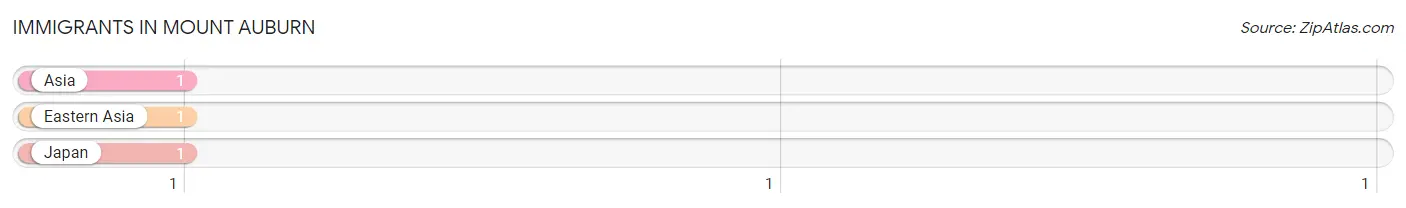
| Immigration Origin | # Population | % Population |
| Asia | 1 | 0.2% |
| Eastern Asia | 1 | 0.2% |
| Japan | 1 | 0.2% | View All 3 Rows |
Sex and Age in Mount Auburn
Sex and Age in Mount Auburn
The most populous age groups in Mount Auburn are Under 5 Years (56 | 16.7%) for men and 35 to 39 Years (29 | 15.0%) for women.
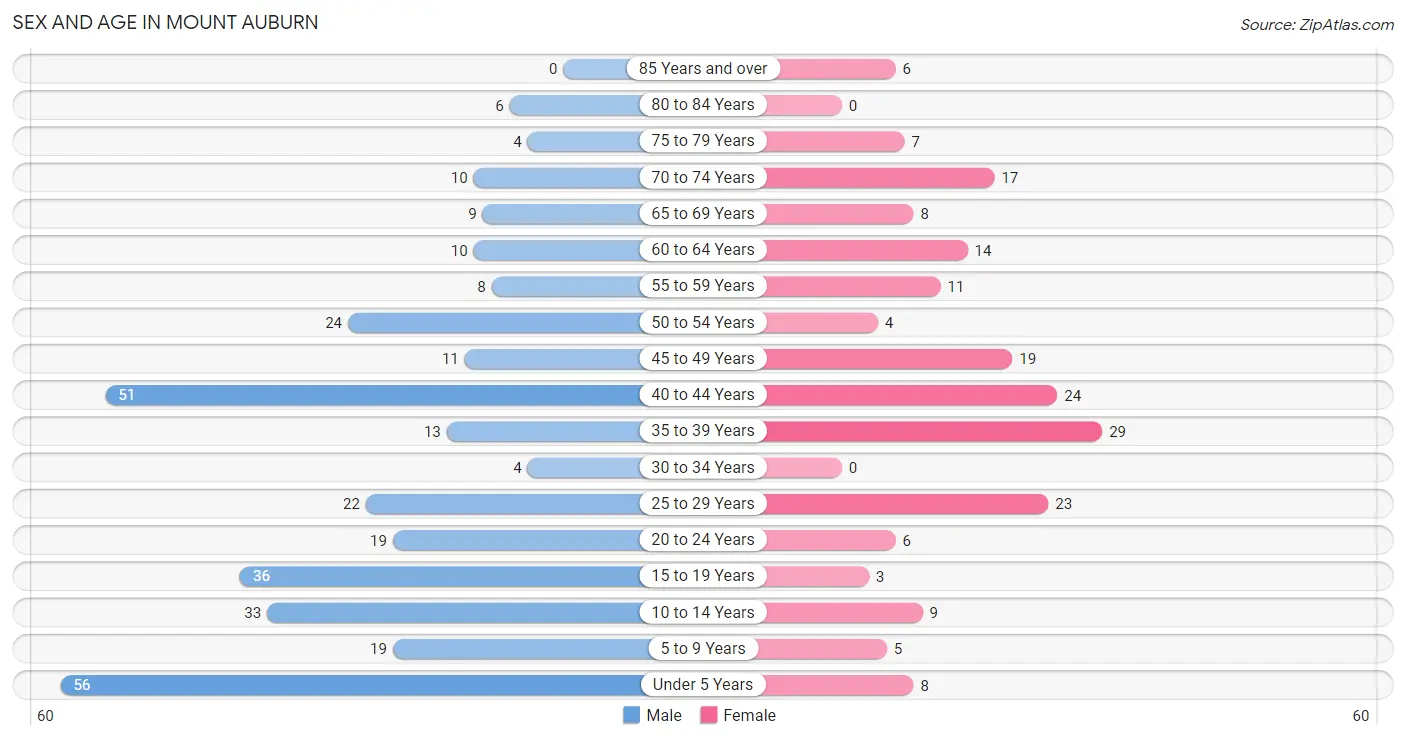
| Age Bracket | Male | Female |
| Under 5 Years | 56 (16.7%) | 8 (4.2%) |
| 5 to 9 Years | 19 (5.7%) | 5 (2.6%) |
| 10 to 14 Years | 33 (9.9%) | 9 (4.7%) |
| 15 to 19 Years | 36 (10.7%) | 3 (1.5%) |
| 20 to 24 Years | 19 (5.7%) | 6 (3.1%) |
| 25 to 29 Years | 22 (6.6%) | 23 (11.9%) |
| 30 to 34 Years | 4 (1.2%) | 0 (0.0%) |
| 35 to 39 Years | 13 (3.9%) | 29 (15.0%) |
| 40 to 44 Years | 51 (15.2%) | 24 (12.4%) |
| 45 to 49 Years | 11 (3.3%) | 19 (9.8%) |
| 50 to 54 Years | 24 (7.2%) | 4 (2.1%) |
| 55 to 59 Years | 8 (2.4%) | 11 (5.7%) |
| 60 to 64 Years | 10 (3.0%) | 14 (7.2%) |
| 65 to 69 Years | 9 (2.7%) | 8 (4.2%) |
| 70 to 74 Years | 10 (3.0%) | 17 (8.8%) |
| 75 to 79 Years | 4 (1.2%) | 7 (3.6%) |
| 80 to 84 Years | 6 (1.8%) | 0 (0.0%) |
| 85 Years and over | 0 (0.0%) | 6 (3.1%) |
| Total | 335 (100.0%) | 193 (100.0%) |
Families and Households in Mount Auburn
Median Family Size in Mount Auburn
The median family size in Mount Auburn is 3.83 persons per family, with married-couple families (96 | 89.7%) accounting for the largest median family size of 3.9 persons per family. On the other hand, single female/mother families (4 | 3.7%) represent the smallest median family size with 2.75 persons per family.
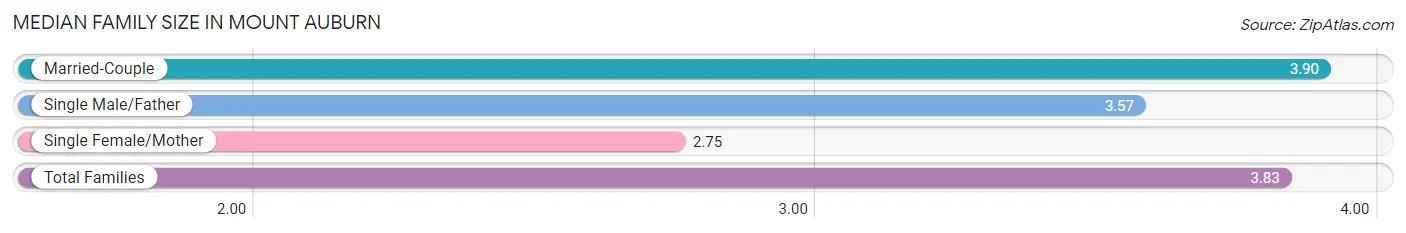
| Family Type | # Families | Family Size |
| Married-Couple | 96 (89.7%) | 3.90 |
| Single Male/Father | 7 (6.5%) | 3.57 |
| Single Female/Mother | 4 (3.7%) | 2.75 |
| Total Families | 107 (100.0%) | 3.83 |
Median Household Size in Mount Auburn
The median household size in Mount Auburn is 2.76 persons per household, with single male/father households (7 | 3.7%) accounting for the largest median household size of 4.14 persons per household. non-family households (84 | 44.0%) represent the smallest median household size with 1.36 persons per household.
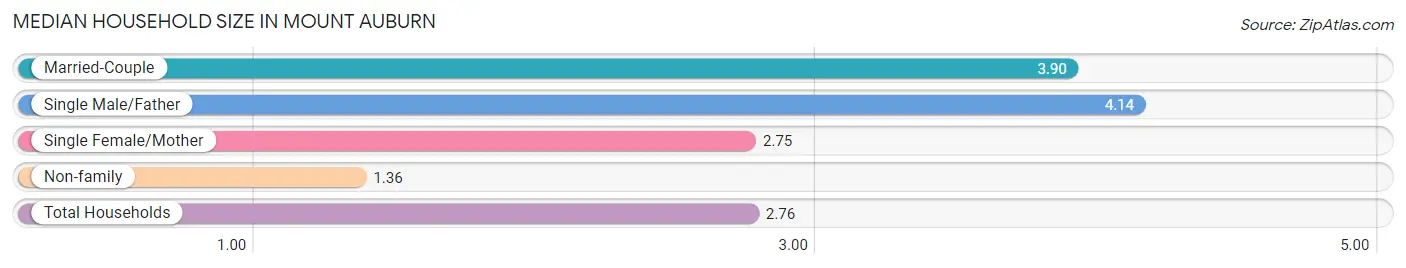
| Household Type | # Households | Household Size |
| Married-Couple | 96 (50.3%) | 3.90 |
| Single Male/Father | 7 (3.7%) | 4.14 |
| Single Female/Mother | 4 (2.1%) | 2.75 |
| Non-family | 84 (44.0%) | 1.36 |
| Total Households | 191 (100.0%) | 2.76 |
Household Size by Marriage Status in Mount Auburn
Out of a total of 191 households in Mount Auburn, 107 (56.0%) are family households, while 84 (44.0%) are nonfamily households. The most numerous type of family households are 2-person households, comprising 40, and the most common type of nonfamily households are 1-person households, comprising 70.
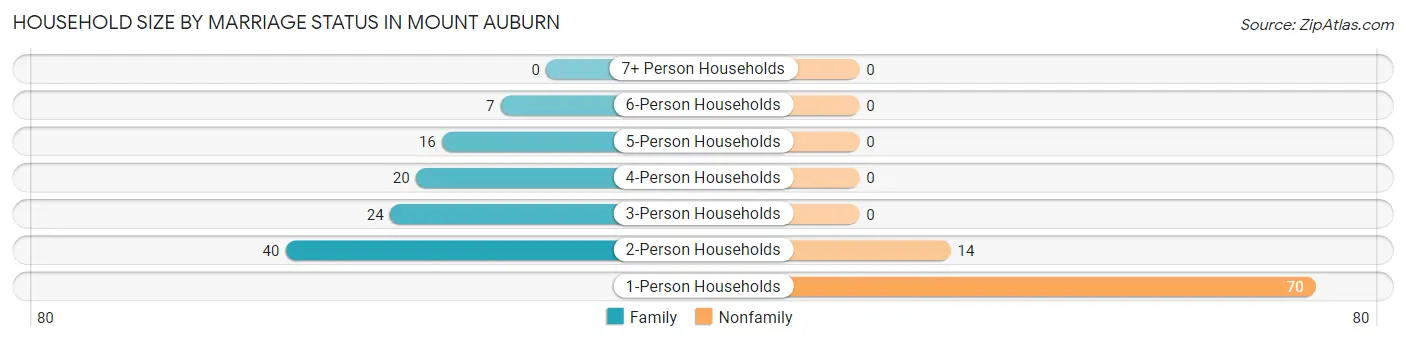
| Household Size | Family Households | Nonfamily Households |
| 1-Person Households | - | 70 (36.6%) |
| 2-Person Households | 40 (20.9%) | 14 (7.3%) |
| 3-Person Households | 24 (12.6%) | 0 (0.0%) |
| 4-Person Households | 20 (10.5%) | 0 (0.0%) |
| 5-Person Households | 16 (8.4%) | 0 (0.0%) |
| 6-Person Households | 7 (3.7%) | 0 (0.0%) |
| 7+ Person Households | 0 (0.0%) | 0 (0.0%) |
| Total | 107 (56.0%) | 84 (44.0%) |
Female Fertility in Mount Auburn
Fertility by Age in Mount Auburn
Average fertility rate in Mount Auburn is 112.0 births per 1,000 women. Women in the age bracket of 35 to 50 years have the highest fertility rate with 120.0 births per 1,000 women. Women in the age bracket of 35 to 50 years acount for 75.0% of all women with births.
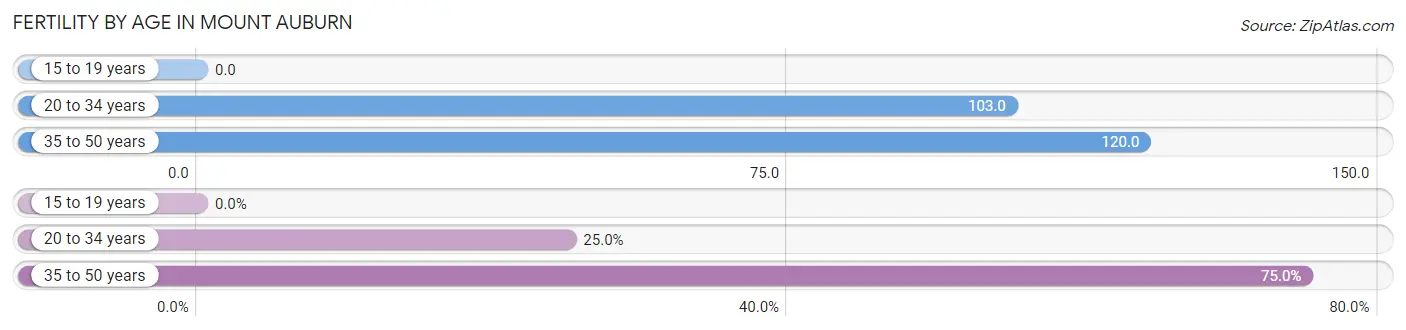
| Age Bracket | Women with Births | Births / 1,000 Women |
| 15 to 19 years | 0 (0.0%) | 0.0 |
| 20 to 34 years | 3 (25.0%) | 103.0 |
| 35 to 50 years | 9 (75.0%) | 120.0 |
| Total | 12 (100.0%) | 112.0 |
Fertility by Age by Marriage Status in Mount Auburn
91.7% of women with births (12) in Mount Auburn are married. The highest percentage of unmarried women with births falls into 20 to 34 years age bracket with 33.3% of them unmarried at the time of birth, while the lowest percentage of unmarried women with births belong to 35 to 50 years age bracket with 0.0% of them unmarried.
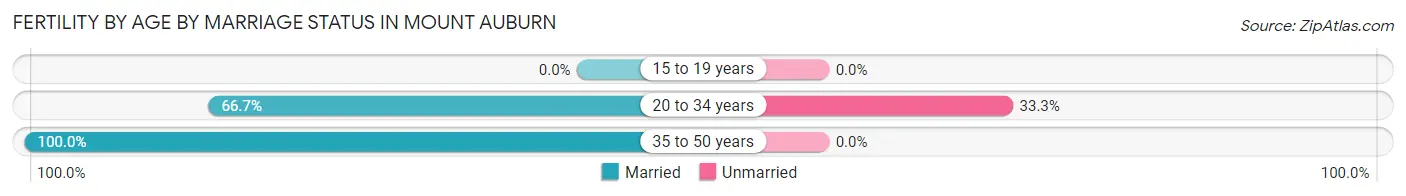
| Age Bracket | Married | Unmarried |
| 15 to 19 years | 0 (0.0%) | 0 (0.0%) |
| 20 to 34 years | 2 (66.7%) | 1 (33.3%) |
| 35 to 50 years | 9 (100.0%) | 0 (0.0%) |
| Total | 11 (91.7%) | 1 (8.3%) |
Fertility by Education in Mount Auburn
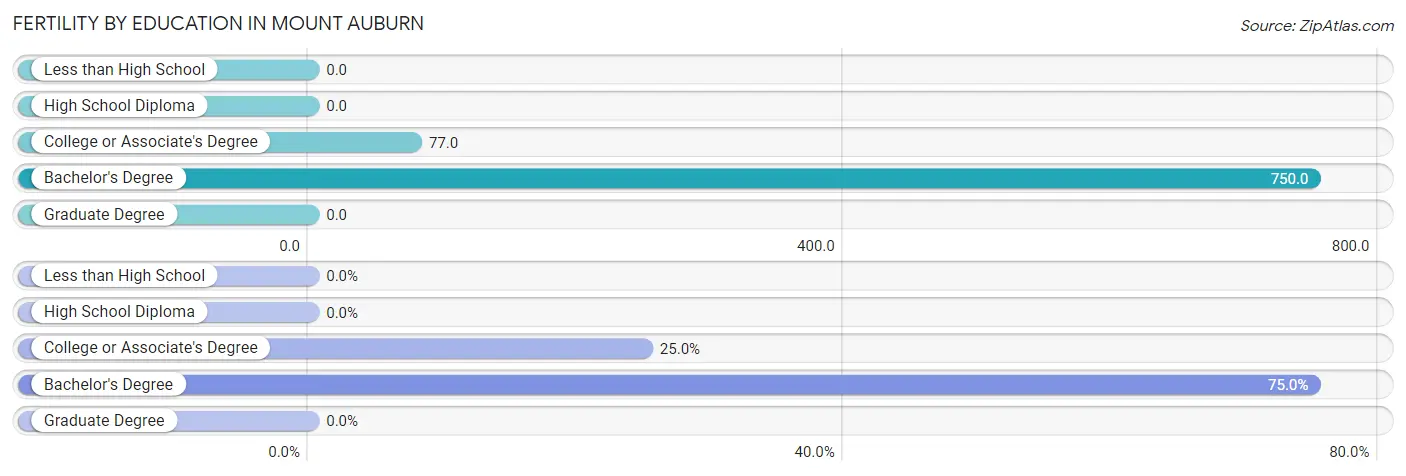
| Educational Attainment | Women with Births | Births / 1,000 Women |
| Less than High School | 0 (0.0%) | 0.0 |
| High School Diploma | 0 (0.0%) | 0.0 |
| College or Associate's Degree | 3 (25.0%) | 77.0 |
| Bachelor's Degree | 9 (75.0%) | 750.0 |
| Graduate Degree | 0 (0.0%) | 0.0 |
| Total | 12 (100.0%) | 112.0 |
Fertility by Education by Marriage Status in Mount Auburn
8.3% of women with births in Mount Auburn are unmarried. Women with the educational attainment of bachelor's degree are most likely to be married with 100.0% of them married at childbirth, while women with the educational attainment of college or associate's degree are least likely to be married with 33.3% of them unmarried at childbirth.
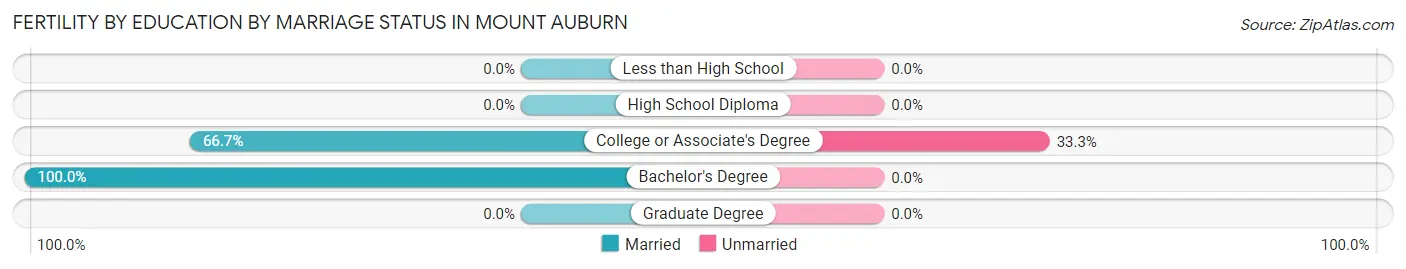
| Educational Attainment | Married | Unmarried |
| Less than High School | 0 (0.0%) | 0 (0.0%) |
| High School Diploma | 0 (0.0%) | 0 (0.0%) |
| College or Associate's Degree | 2 (66.7%) | 1 (33.3%) |
| Bachelor's Degree | 9 (100.0%) | 0 (0.0%) |
| Graduate Degree | 0 (0.0%) | 0 (0.0%) |
| Total | 11 (91.7%) | 1 (8.3%) |
Employment Characteristics in Mount Auburn
Employment by Class of Employer in Mount Auburn
Among the 239 employed individuals in Mount Auburn, private company employees (166 | 69.5%), local government employees (42 | 17.6%), and not-for-profit organizations (19 | 8.0%) make up the most common classes of employment.
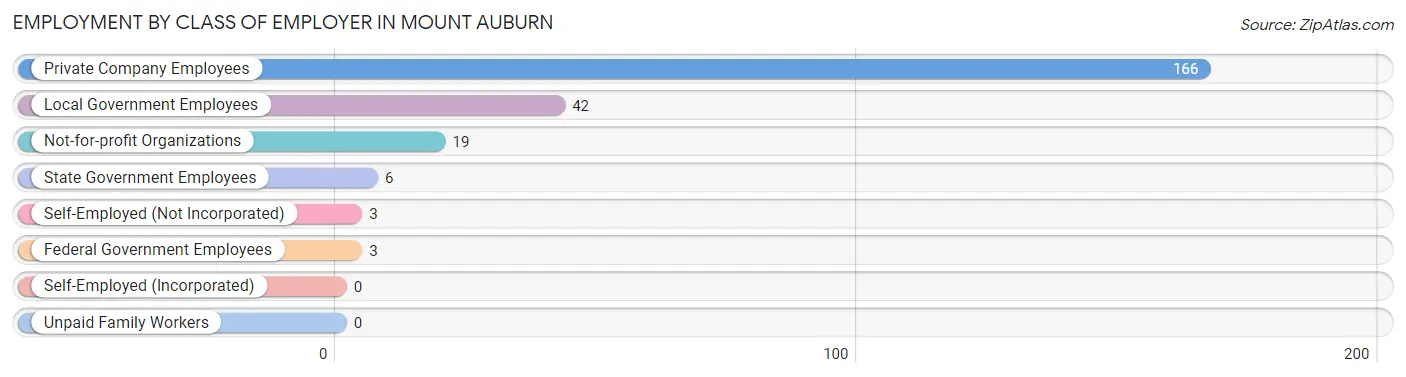
| Employer Class | # Employees | % Employees |
| Private Company Employees | 166 | 69.5% |
| Self-Employed (Incorporated) | 0 | 0.0% |
| Self-Employed (Not Incorporated) | 3 | 1.3% |
| Not-for-profit Organizations | 19 | 8.0% |
| Local Government Employees | 42 | 17.6% |
| State Government Employees | 6 | 2.5% |
| Federal Government Employees | 3 | 1.3% |
| Unpaid Family Workers | 0 | 0.0% |
| Total | 239 | 100.0% |
Employment Status by Age in Mount Auburn
According to the labor force statistics for Mount Auburn, out of the total population over 16 years of age (392), 66.1% or 259 individuals are in the labor force, with 6.6% or 17 of them unemployed. The age group with the highest labor force participation rate is 20 to 24 years, with 100.0% or 25 individuals in the labor force. Within the labor force, the 55 to 59 years age range has the highest percentage of unemployed individuals, with 11.8% or 2 of them being unemployed.
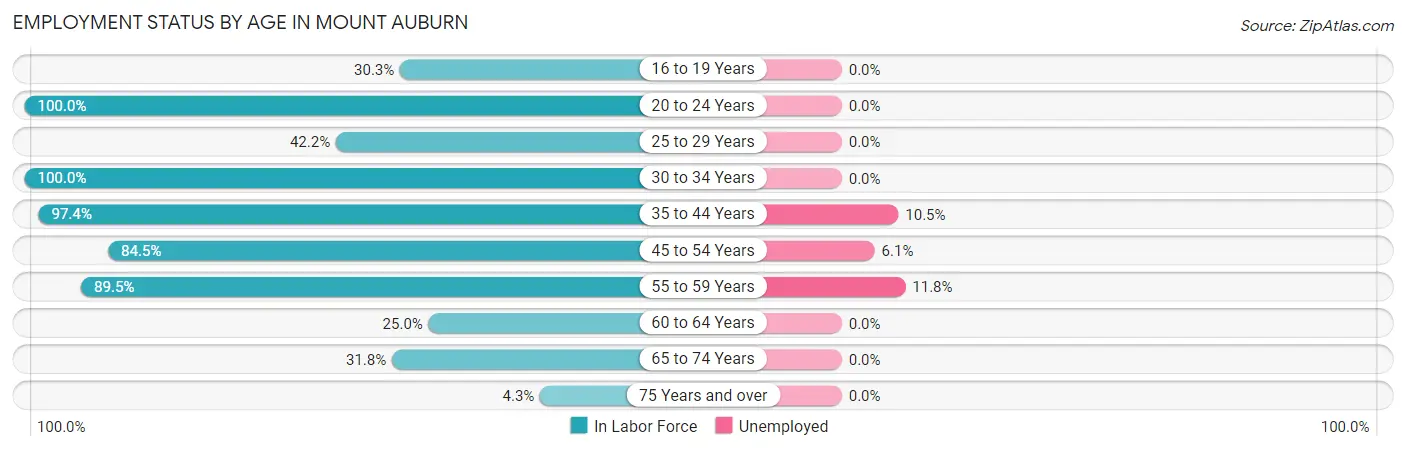
| Age Bracket | In Labor Force | Unemployed |
| 16 to 19 Years | 10 (30.3%) | 0 (0.0%) |
| 20 to 24 Years | 25 (100.0%) | 0 (0.0%) |
| 25 to 29 Years | 19 (42.2%) | 0 (0.0%) |
| 30 to 34 Years | 4 (100.0%) | 0 (0.0%) |
| 35 to 44 Years | 114 (97.4%) | 12 (10.5%) |
| 45 to 54 Years | 49 (84.5%) | 3 (6.1%) |
| 55 to 59 Years | 17 (89.5%) | 2 (11.8%) |
| 60 to 64 Years | 6 (25.0%) | 0 (0.0%) |
| 65 to 74 Years | 14 (31.8%) | 0 (0.0%) |
| 75 Years and over | 1 (4.3%) | 0 (0.0%) |
| Total | 259 (66.1%) | 17 (6.6%) |
Employment Status by Educational Attainment in Mount Auburn
According to labor force statistics for Mount Auburn, 78.3% of individuals (209) out of the total population between 25 and 64 years of age (267) are in the labor force, with 8.1% or 17 of them being unemployed. The group with the highest labor force participation rate are those with the educational attainment of bachelor's degree or higher, with 92.6% or 25 individuals in the labor force. Within the labor force, individuals with bachelor's degree or higher education have the highest percentage of unemployment, with 20.0% or 5 of them being unemployed.
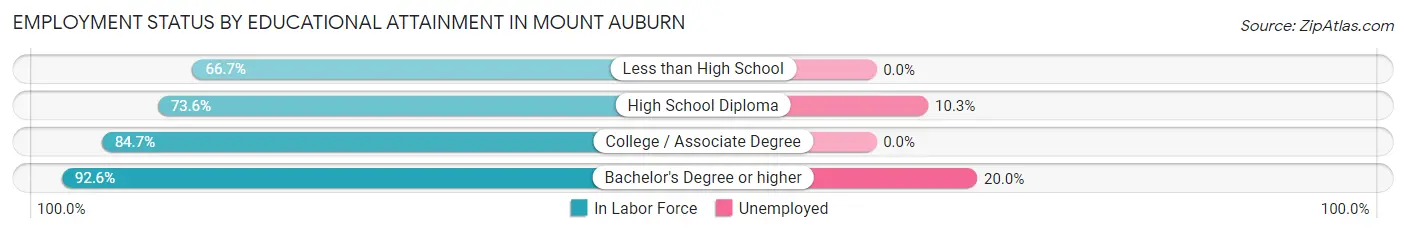
| Educational Attainment | In Labor Force | Unemployed |
| Less than High School | 6 (66.7%) | 0 (0.0%) |
| High School Diploma | 117 (73.6%) | 16 (10.3%) |
| College / Associate Degree | 61 (84.7%) | 0 (0.0%) |
| Bachelor's Degree or higher | 25 (92.6%) | 5 (20.0%) |
| Total | 209 (78.3%) | 22 (8.1%) |
Employment Occupations by Sex in Mount Auburn
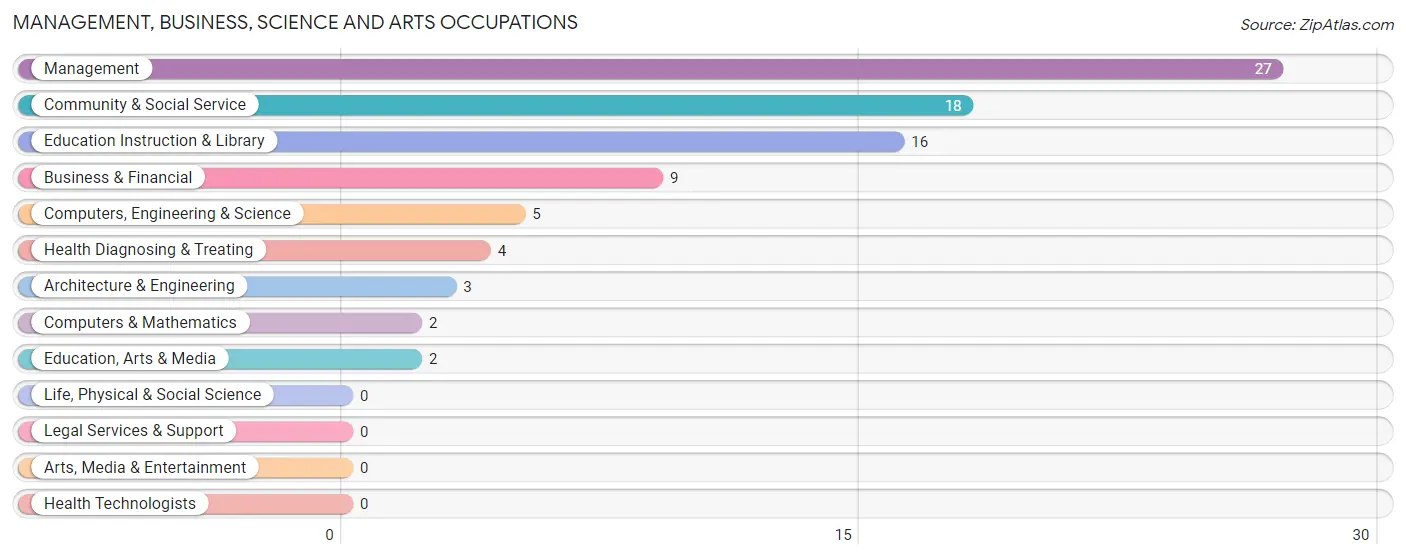
Management, Business, Science and Arts Occupations
The most common Management, Business, Science and Arts occupations in Mount Auburn are Management (27 | 11.2%), Community & Social Service (18 | 7.4%), Education Instruction & Library (16 | 6.6%), Business & Financial (9 | 3.7%), and Computers, Engineering & Science (5 | 2.1%).
Management, Business, Science and Arts Occupations by Sex
Within the Management, Business, Science and Arts occupations in Mount Auburn, the most male-oriented occupations are Computers, Engineering & Science (100.0%), Computers & Mathematics (100.0%), and Architecture & Engineering (100.0%), while the most female-oriented occupations are Business & Financial (100.0%), Community & Social Service (100.0%), and Education, Arts & Media (100.0%).
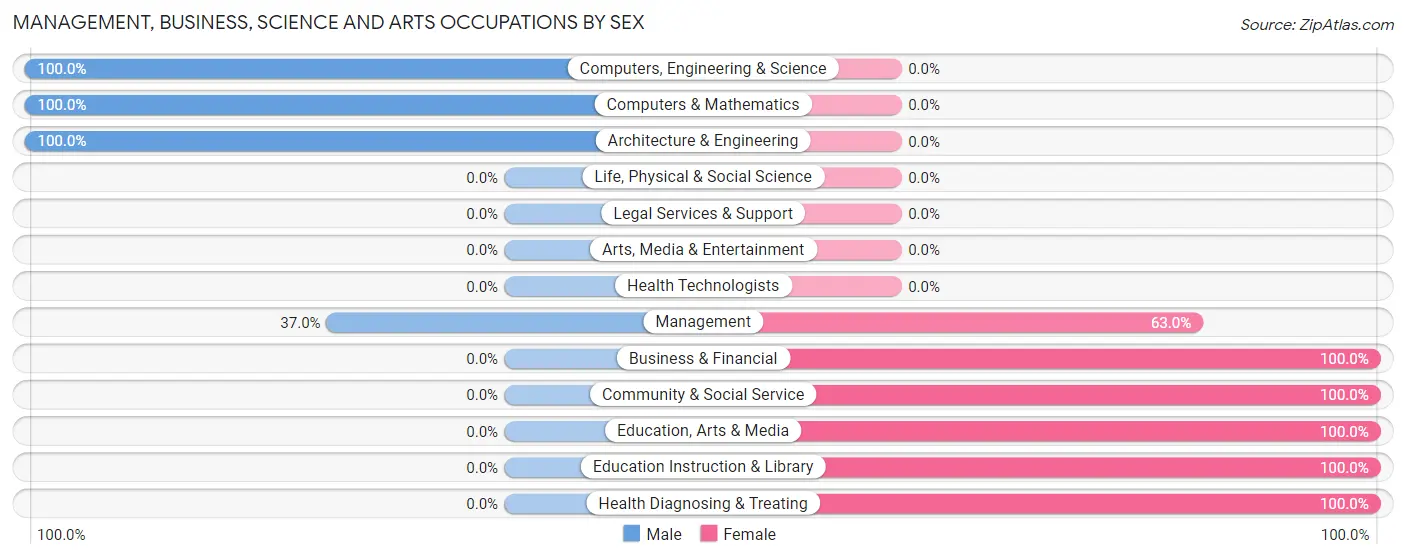
| Occupation | Male | Female |
| Management | 10 (37.0%) | 17 (63.0%) |
| Business & Financial | 0 (0.0%) | 9 (100.0%) |
| Computers, Engineering & Science | 5 (100.0%) | 0 (0.0%) |
| Computers & Mathematics | 2 (100.0%) | 0 (0.0%) |
| Architecture & Engineering | 3 (100.0%) | 0 (0.0%) |
| Life, Physical & Social Science | 0 (0.0%) | 0 (0.0%) |
| Community & Social Service | 0 (0.0%) | 18 (100.0%) |
| Education, Arts & Media | 0 (0.0%) | 2 (100.0%) |
| Legal Services & Support | 0 (0.0%) | 0 (0.0%) |
| Education Instruction & Library | 0 (0.0%) | 16 (100.0%) |
| Arts, Media & Entertainment | 0 (0.0%) | 0 (0.0%) |
| Health Diagnosing & Treating | 0 (0.0%) | 4 (100.0%) |
| Health Technologists | 0 (0.0%) | 0 (0.0%) |
| Total (Category) | 15 (23.8%) | 48 (76.2%) |
| Total (Overall) | 143 (59.1%) | 99 (40.9%) |
Services Occupations
The most common Services occupations in Mount Auburn are Cleaning & Maintenance (33 | 13.6%), Food Preparation & Serving (25 | 10.3%), Healthcare Support (7 | 2.9%), Security & Protection (1 | 0.4%), and Law Enforcement (1 | 0.4%).
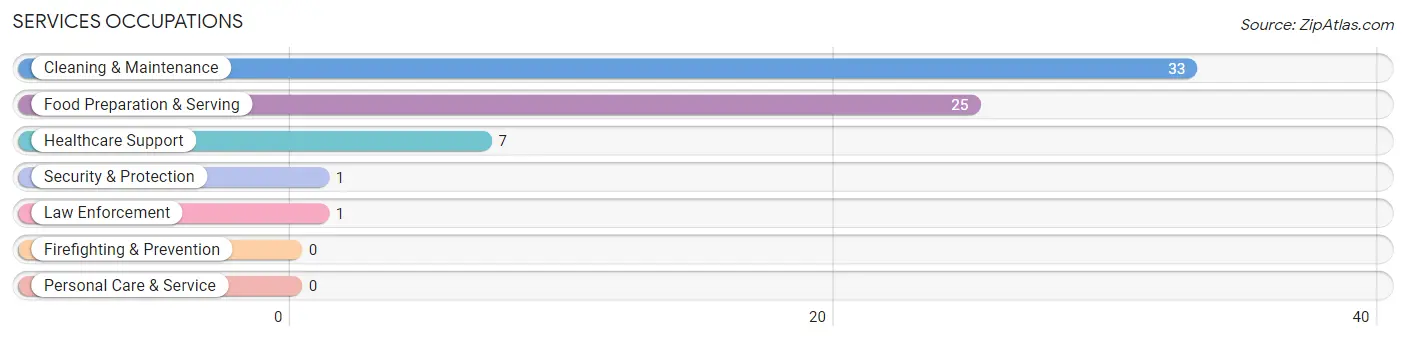
Services Occupations by Sex
Within the Services occupations in Mount Auburn, the most male-oriented occupations are Security & Protection (100.0%), Law Enforcement (100.0%), and Cleaning & Maintenance (100.0%), while the most female-oriented occupations are Healthcare Support (100.0%), and Food Preparation & Serving (44.0%).
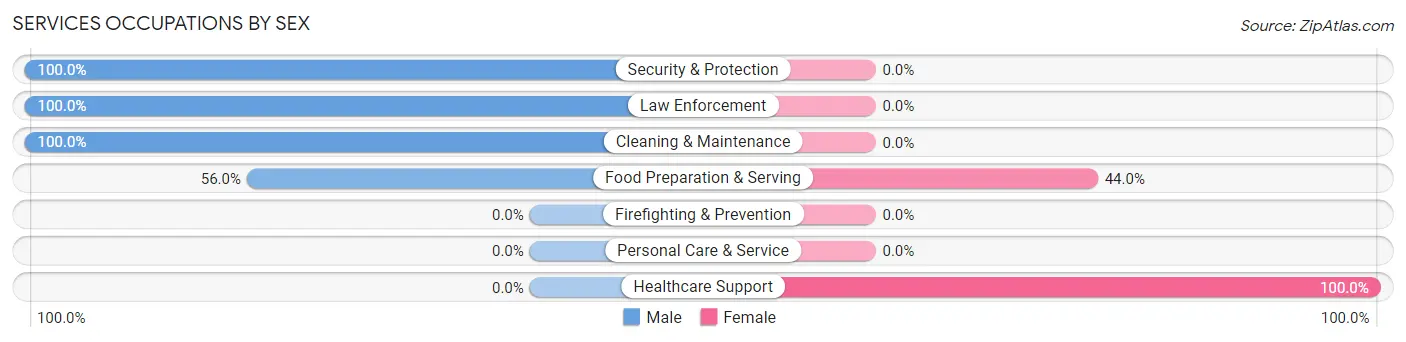
| Occupation | Male | Female |
| Healthcare Support | 0 (0.0%) | 7 (100.0%) |
| Security & Protection | 1 (100.0%) | 0 (0.0%) |
| Firefighting & Prevention | 0 (0.0%) | 0 (0.0%) |
| Law Enforcement | 1 (100.0%) | 0 (0.0%) |
| Food Preparation & Serving | 14 (56.0%) | 11 (44.0%) |
| Cleaning & Maintenance | 33 (100.0%) | 0 (0.0%) |
| Personal Care & Service | 0 (0.0%) | 0 (0.0%) |
| Total (Category) | 48 (72.7%) | 18 (27.3%) |
| Total (Overall) | 143 (59.1%) | 99 (40.9%) |
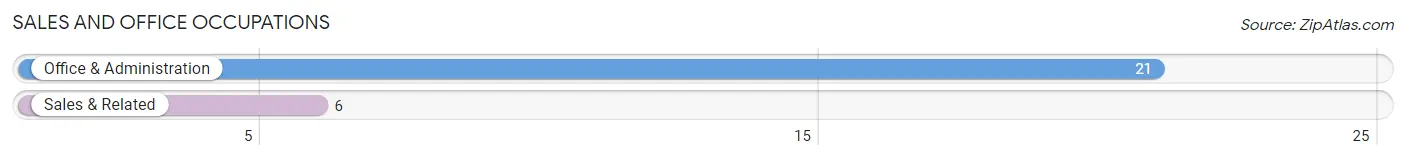
Sales and Office Occupations
The most common Sales and Office occupations in Mount Auburn are Office & Administration (21 | 8.7%), and Sales & Related (6 | 2.5%).
Sales and Office Occupations by Sex
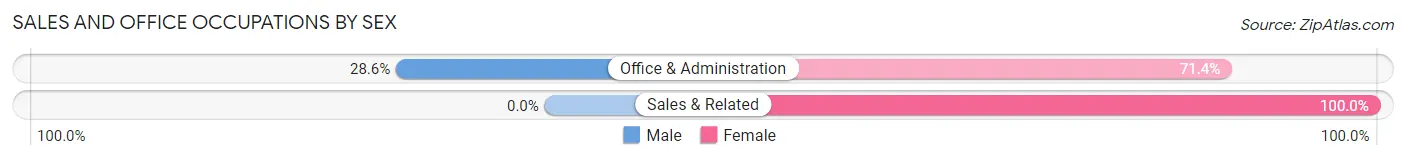
| Occupation | Male | Female |
| Sales & Related | 0 (0.0%) | 6 (100.0%) |
| Office & Administration | 6 (28.6%) | 15 (71.4%) |
| Total (Category) | 6 (22.2%) | 21 (77.8%) |
| Total (Overall) | 143 (59.1%) | 99 (40.9%) |
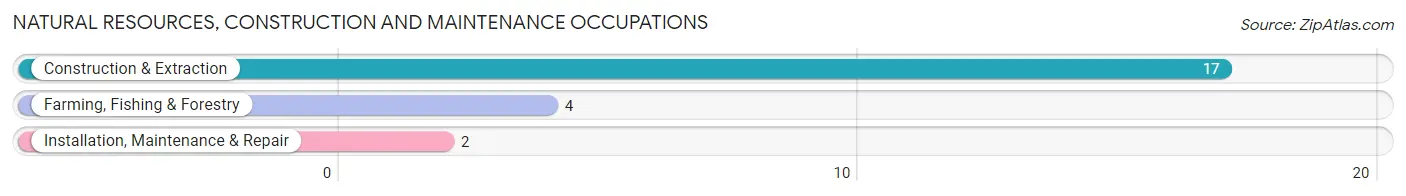
Natural Resources, Construction and Maintenance Occupations
The most common Natural Resources, Construction and Maintenance occupations in Mount Auburn are Construction & Extraction (17 | 7.0%), Farming, Fishing & Forestry (4 | 1.7%), and Installation, Maintenance & Repair (2 | 0.8%).
Natural Resources, Construction and Maintenance Occupations by Sex
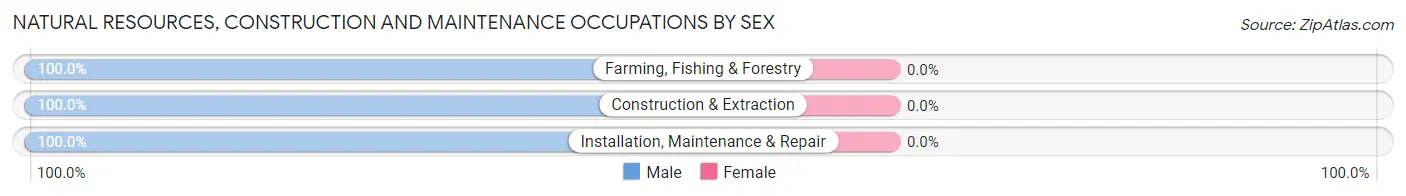
| Occupation | Male | Female |
| Farming, Fishing & Forestry | 4 (100.0%) | 0 (0.0%) |
| Construction & Extraction | 17 (100.0%) | 0 (0.0%) |
| Installation, Maintenance & Repair | 2 (100.0%) | 0 (0.0%) |
| Total (Category) | 23 (100.0%) | 0 (0.0%) |
| Total (Overall) | 143 (59.1%) | 99 (40.9%) |
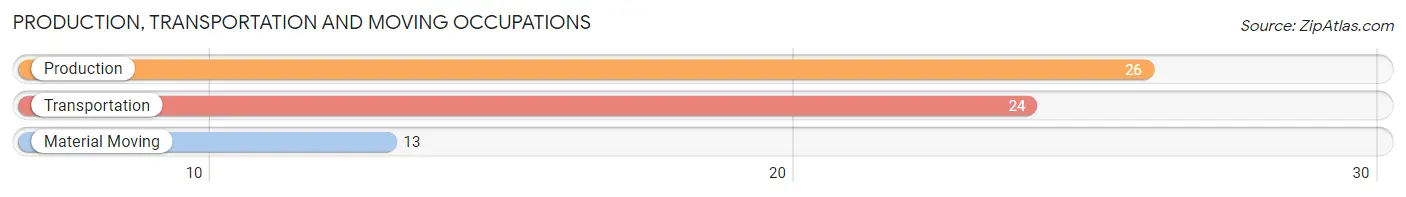
Production, Transportation and Moving Occupations
The most common Production, Transportation and Moving occupations in Mount Auburn are Production (26 | 10.7%), Transportation (24 | 9.9%), and Material Moving (13 | 5.4%).
Production, Transportation and Moving Occupations by Sex
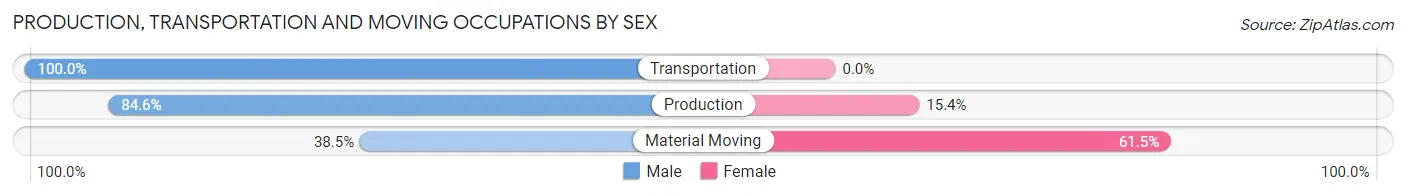
| Occupation | Male | Female |
| Production | 22 (84.6%) | 4 (15.4%) |
| Transportation | 24 (100.0%) | 0 (0.0%) |
| Material Moving | 5 (38.5%) | 8 (61.5%) |
| Total (Category) | 51 (80.9%) | 12 (19.1%) |
| Total (Overall) | 143 (59.1%) | 99 (40.9%) |
Employment Industries by Sex in Mount Auburn
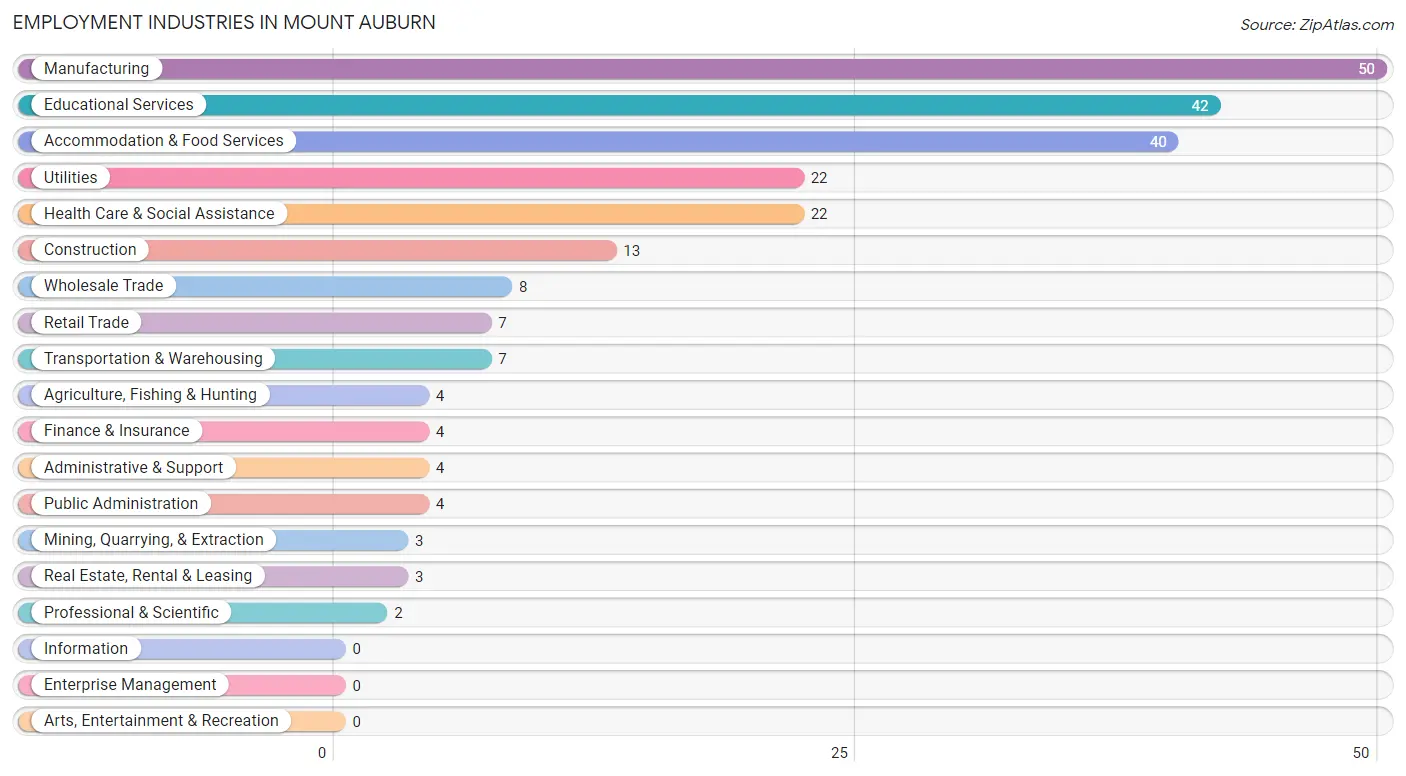
Employment Industries in Mount Auburn
The major employment industries in Mount Auburn include Manufacturing (50 | 20.7%), Educational Services (42 | 17.4%), Accommodation & Food Services (40 | 16.5%), Utilities (22 | 9.1%), and Health Care & Social Assistance (22 | 9.1%).
Employment Industries by Sex in Mount Auburn
The Mount Auburn industries that see more men than women are Agriculture, Fishing & Hunting (100.0%), Mining, Quarrying, & Extraction (100.0%), and Transportation & Warehousing (100.0%), whereas the industries that tend to have a higher number of women are Finance & Insurance (100.0%), Professional & Scientific (100.0%), and Health Care & Social Assistance (90.9%).
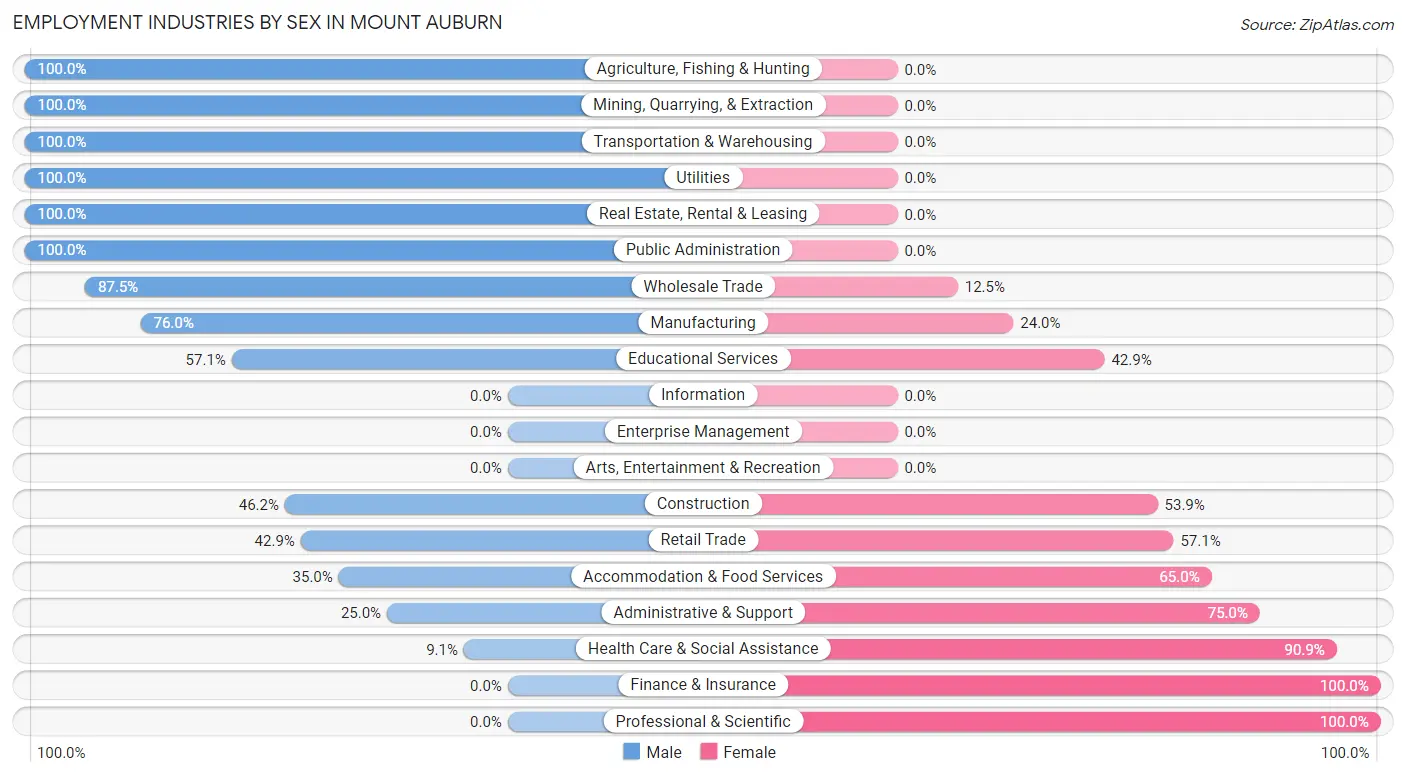
| Industry | Male | Female |
| Agriculture, Fishing & Hunting | 4 (100.0%) | 0 (0.0%) |
| Mining, Quarrying, & Extraction | 3 (100.0%) | 0 (0.0%) |
| Construction | 6 (46.2%) | 7 (53.8%) |
| Manufacturing | 38 (76.0%) | 12 (24.0%) |
| Wholesale Trade | 7 (87.5%) | 1 (12.5%) |
| Retail Trade | 3 (42.9%) | 4 (57.1%) |
| Transportation & Warehousing | 7 (100.0%) | 0 (0.0%) |
| Utilities | 22 (100.0%) | 0 (0.0%) |
| Information | 0 (0.0%) | 0 (0.0%) |
| Finance & Insurance | 0 (0.0%) | 4 (100.0%) |
| Real Estate, Rental & Leasing | 3 (100.0%) | 0 (0.0%) |
| Professional & Scientific | 0 (0.0%) | 2 (100.0%) |
| Enterprise Management | 0 (0.0%) | 0 (0.0%) |
| Administrative & Support | 1 (25.0%) | 3 (75.0%) |
| Educational Services | 24 (57.1%) | 18 (42.9%) |
| Health Care & Social Assistance | 2 (9.1%) | 20 (90.9%) |
| Arts, Entertainment & Recreation | 0 (0.0%) | 0 (0.0%) |
| Accommodation & Food Services | 14 (35.0%) | 26 (65.0%) |
| Public Administration | 4 (100.0%) | 0 (0.0%) |
| Total | 143 (59.1%) | 99 (40.9%) |
Education in Mount Auburn
School Enrollment in Mount Auburn
The most common levels of schooling among the 120 students in Mount Auburn are middle school (45 | 37.5%), high school (31 | 25.8%), and nursery / preschool (22 | 18.3%).
| School Level | # Students | % Students |
| Nursery / Preschool | 22 | 18.3% |
| Kindergarten | 0 | 0.0% |
| Elementary School | 19 | 15.8% |
| Middle School | 45 | 37.5% |
| High School | 31 | 25.8% |
| College / Undergraduate | 3 | 2.5% |
| Graduate / Professional | 0 | 0.0% |
| Total | 120 | 100.0% |
School Enrollment by Age by Funding Source in Mount Auburn
Out of a total of 120 students who are enrolled in schools in Mount Auburn, 3 (2.5%) attend a private institution, while the remaining 117 (97.5%) are enrolled in public schools. The age group of 15 to 17 year olds has the highest likelihood of being enrolled in private schools, with 3 (10.0% in the age bracket) enrolled. Conversely, the age group of 3 to 4 year olds has the lowest likelihood of being enrolled in a private school, with 19 (100.0% in the age bracket) attending a public institution.
| Age Bracket | Public School | Private School |
| 3 to 4 Year Olds | 19 (100.0%) | 0 (0.0%) |
| 5 to 9 Year Old | 22 (100.0%) | 0 (0.0%) |
| 10 to 14 Year Olds | 42 (100.0%) | 0 (0.0%) |
| 15 to 17 Year Olds | 27 (90.0%) | 3 (10.0%) |
| 18 to 19 Year Olds | 4 (100.0%) | 0 (0.0%) |
| 20 to 24 Year Olds | 0 (0.0%) | 0 (0.0%) |
| 25 to 34 Year Olds | 0 (0.0%) | 0 (0.0%) |
| 35 Years and over | 3 (100.0%) | 0 (0.0%) |
| Total | 117 (97.5%) | 3 (2.5%) |
Educational Attainment by Field of Study in Mount Auburn
Business (14 | 35.9%), arts & humanities (7 | 17.9%), computers & mathematics (5 | 12.8%), education (5 | 12.8%), and communications (4 | 10.3%) are the most common fields of study among 39 individuals in Mount Auburn who have obtained a bachelor's degree or higher.
| Field of Study | # Graduates | % Graduates |
| Computers & Mathematics | 5 | 12.8% |
| Bio, Nature & Agricultural | 0 | 0.0% |
| Physical & Health Sciences | 2 | 5.1% |
| Psychology | 0 | 0.0% |
| Social Sciences | 2 | 5.1% |
| Engineering | 0 | 0.0% |
| Multidisciplinary Studies | 0 | 0.0% |
| Science & Technology | 0 | 0.0% |
| Business | 14 | 35.9% |
| Education | 5 | 12.8% |
| Literature & Languages | 0 | 0.0% |
| Liberal Arts & History | 0 | 0.0% |
| Visual & Performing Arts | 0 | 0.0% |
| Communications | 4 | 10.3% |
| Arts & Humanities | 7 | 17.9% |
| Total | 39 | 100.0% |
Transportation & Commute in Mount Auburn
Vehicle Availability by Sex in Mount Auburn
The most prevalent vehicle ownership categories in Mount Auburn are males with 2 vehicles (66, accounting for 46.2%) and females with 2 vehicles (46, making up 68.8%).
| Vehicles Available | Male | Female |
| No Vehicle | 0 (0.0%) | 2 (2.1%) |
| 1 Vehicle | 5 (3.5%) | 9 (9.4%) |
| 2 Vehicles | 66 (46.2%) | 46 (47.9%) |
| 3 Vehicles | 32 (22.4%) | 30 (31.2%) |
| 4 Vehicles | 32 (22.4%) | 6 (6.2%) |
| 5 or more Vehicles | 8 (5.6%) | 3 (3.1%) |
| Total | 143 (100.0%) | 96 (100.0%) |
Commute Time in Mount Auburn
The most frequently occuring commute durations in Mount Auburn are 30 to 34 minutes (51 commuters, 21.7%), 45 to 59 minutes (46 commuters, 19.6%), and 25 to 29 minutes (43 commuters, 18.3%).
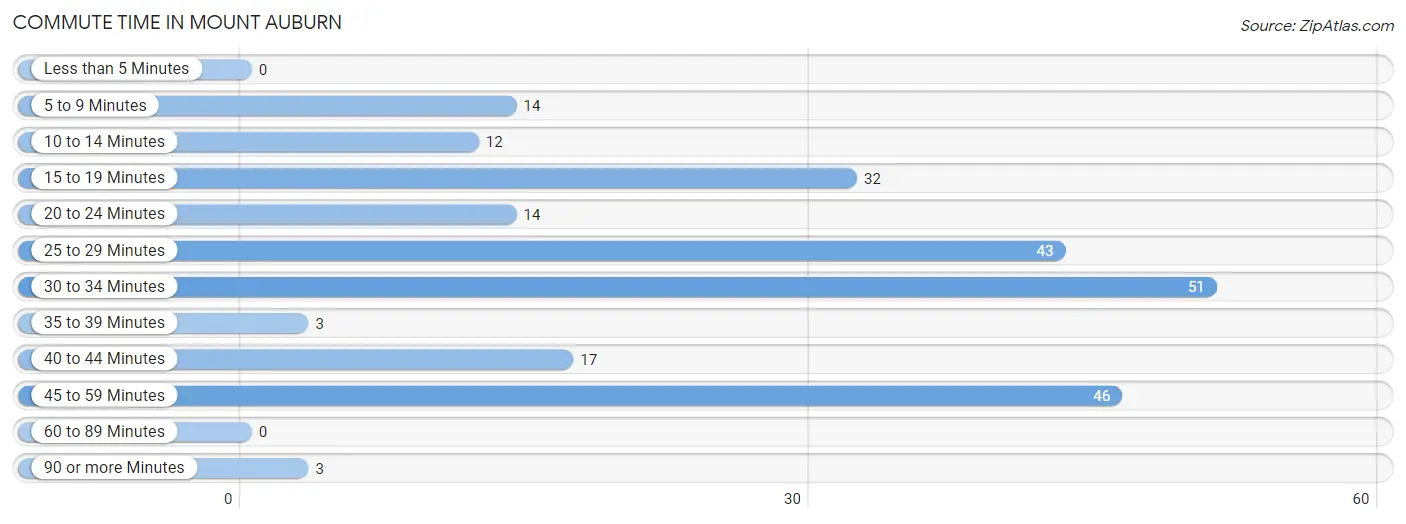
| Commute Time | # Commuters | % Commuters |
| Less than 5 Minutes | 0 | 0.0% |
| 5 to 9 Minutes | 14 | 6.0% |
| 10 to 14 Minutes | 12 | 5.1% |
| 15 to 19 Minutes | 32 | 13.6% |
| 20 to 24 Minutes | 14 | 6.0% |
| 25 to 29 Minutes | 43 | 18.3% |
| 30 to 34 Minutes | 51 | 21.7% |
| 35 to 39 Minutes | 3 | 1.3% |
| 40 to 44 Minutes | 17 | 7.2% |
| 45 to 59 Minutes | 46 | 19.6% |
| 60 to 89 Minutes | 0 | 0.0% |
| 90 or more Minutes | 3 | 1.3% |
Commute Time by Sex in Mount Auburn
The most common commute times in Mount Auburn are 45 to 59 minutes (39 commuters, 27.7%) for males and 15 to 19 minutes (30 commuters, 31.9%) for females.
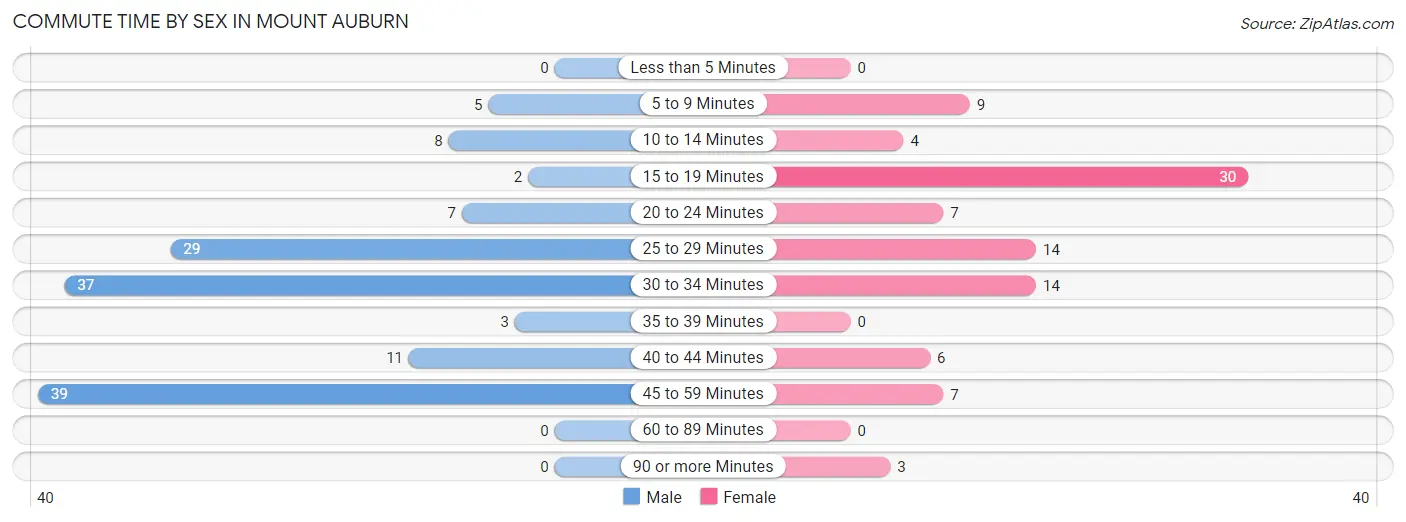
| Commute Time | Male | Female |
| Less than 5 Minutes | 0 (0.0%) | 0 (0.0%) |
| 5 to 9 Minutes | 5 (3.5%) | 9 (9.6%) |
| 10 to 14 Minutes | 8 (5.7%) | 4 (4.3%) |
| 15 to 19 Minutes | 2 (1.4%) | 30 (31.9%) |
| 20 to 24 Minutes | 7 (5.0%) | 7 (7.4%) |
| 25 to 29 Minutes | 29 (20.6%) | 14 (14.9%) |
| 30 to 34 Minutes | 37 (26.2%) | 14 (14.9%) |
| 35 to 39 Minutes | 3 (2.1%) | 0 (0.0%) |
| 40 to 44 Minutes | 11 (7.8%) | 6 (6.4%) |
| 45 to 59 Minutes | 39 (27.7%) | 7 (7.4%) |
| 60 to 89 Minutes | 0 (0.0%) | 0 (0.0%) |
| 90 or more Minutes | 0 (0.0%) | 3 (3.2%) |
Time of Departure to Work by Sex in Mount Auburn
The most frequent times of departure to work in Mount Auburn are 6:00 AM to 6:29 AM (31, 22.0%) for males and 7:00 AM to 7:29 AM (22, 23.4%) for females.
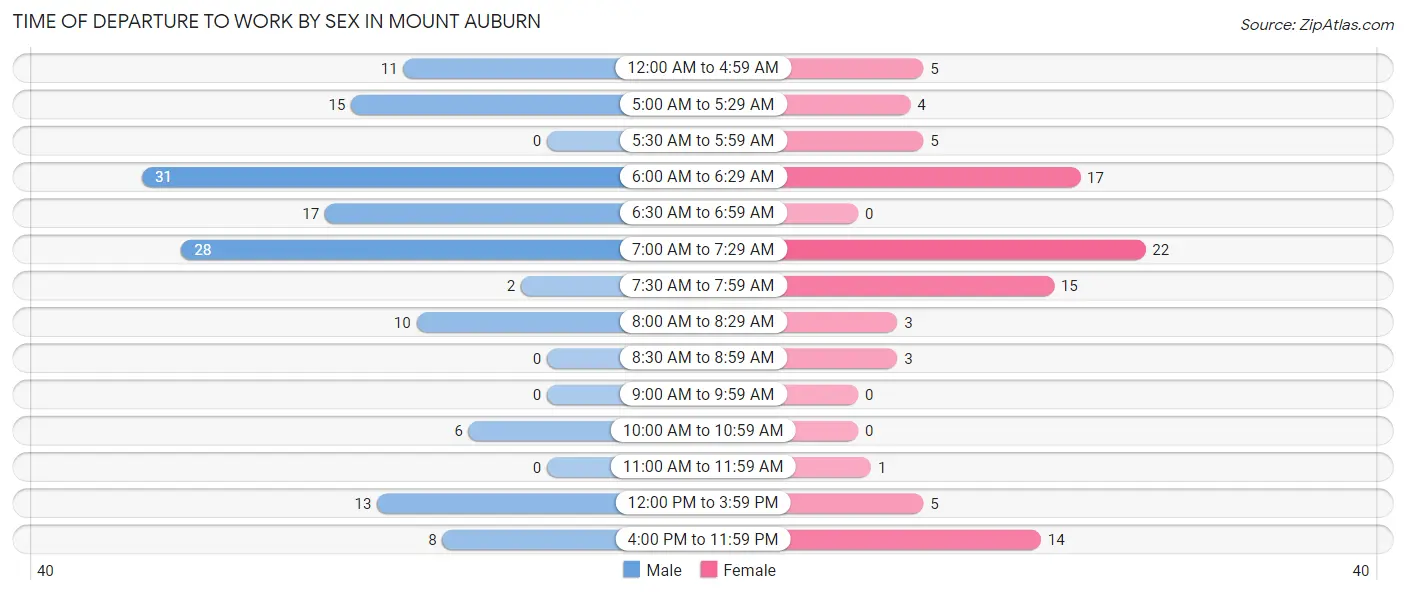
| Time of Departure | Male | Female |
| 12:00 AM to 4:59 AM | 11 (7.8%) | 5 (5.3%) |
| 5:00 AM to 5:29 AM | 15 (10.6%) | 4 (4.3%) |
| 5:30 AM to 5:59 AM | 0 (0.0%) | 5 (5.3%) |
| 6:00 AM to 6:29 AM | 31 (22.0%) | 17 (18.1%) |
| 6:30 AM to 6:59 AM | 17 (12.1%) | 0 (0.0%) |
| 7:00 AM to 7:29 AM | 28 (19.9%) | 22 (23.4%) |
| 7:30 AM to 7:59 AM | 2 (1.4%) | 15 (16.0%) |
| 8:00 AM to 8:29 AM | 10 (7.1%) | 3 (3.2%) |
| 8:30 AM to 8:59 AM | 0 (0.0%) | 3 (3.2%) |
| 9:00 AM to 9:59 AM | 0 (0.0%) | 0 (0.0%) |
| 10:00 AM to 10:59 AM | 6 (4.3%) | 0 (0.0%) |
| 11:00 AM to 11:59 AM | 0 (0.0%) | 1 (1.1%) |
| 12:00 PM to 3:59 PM | 13 (9.2%) | 5 (5.3%) |
| 4:00 PM to 11:59 PM | 8 (5.7%) | 14 (14.9%) |
| Total | 141 (100.0%) | 94 (100.0%) |
Housing Occupancy in Mount Auburn
Occupancy by Ownership in Mount Auburn
Of the total 191 dwellings in Mount Auburn, owner-occupied units account for 182 (95.3%), while renter-occupied units make up 9 (4.7%).
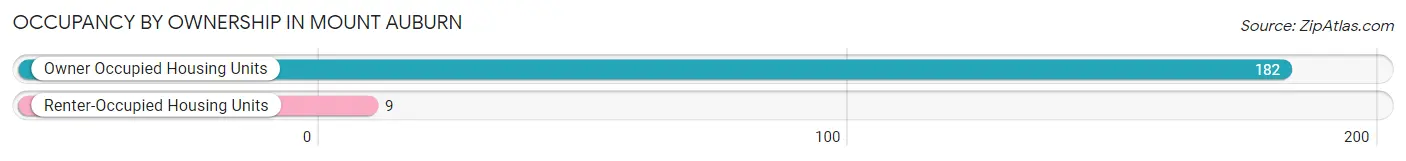
| Occupancy | # Housing Units | % Housing Units |
| Owner Occupied Housing Units | 182 | 95.3% |
| Renter-Occupied Housing Units | 9 | 4.7% |
| Total Occupied Housing Units | 191 | 100.0% |
Occupancy by Household Size in Mount Auburn
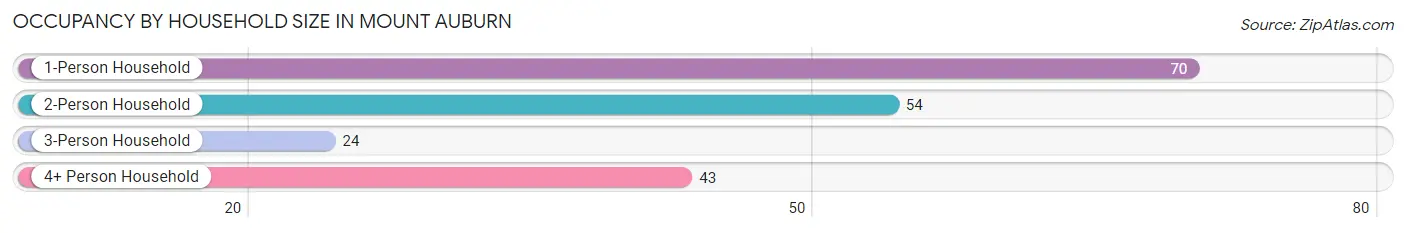
| Household Size | # Housing Units | % Housing Units |
| 1-Person Household | 70 | 36.6% |
| 2-Person Household | 54 | 28.3% |
| 3-Person Household | 24 | 12.6% |
| 4+ Person Household | 43 | 22.5% |
| Total Housing Units | 191 | 100.0% |
Occupancy by Ownership by Household Size in Mount Auburn
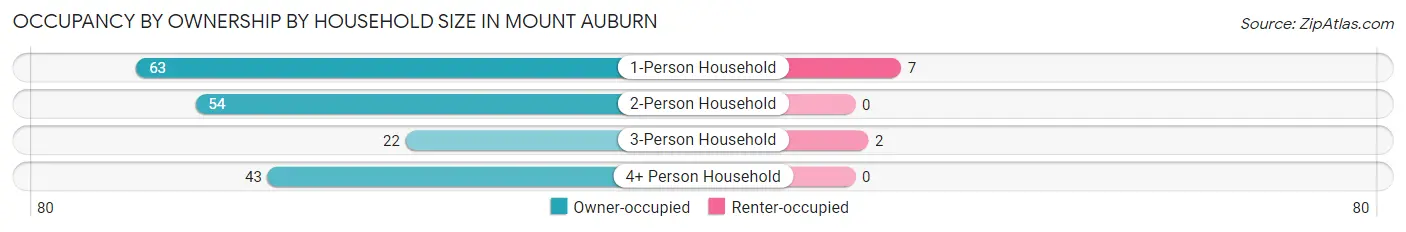
| Household Size | Owner-occupied | Renter-occupied |
| 1-Person Household | 63 (90.0%) | 7 (10.0%) |
| 2-Person Household | 54 (100.0%) | 0 (0.0%) |
| 3-Person Household | 22 (91.7%) | 2 (8.3%) |
| 4+ Person Household | 43 (100.0%) | 0 (0.0%) |
| Total Housing Units | 182 (95.3%) | 9 (4.7%) |
Occupancy by Educational Attainment in Mount Auburn
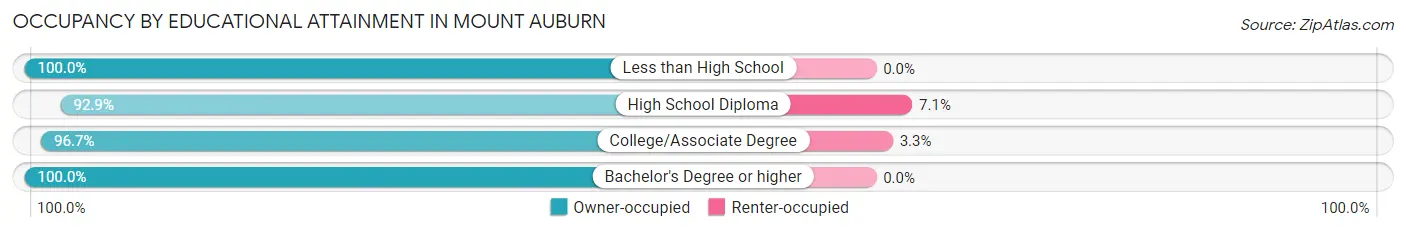
| Household Size | Owner-occupied | Renter-occupied |
| Less than High School | 4 (100.0%) | 0 (0.0%) |
| High School Diploma | 91 (92.9%) | 7 (7.1%) |
| College/Associate Degree | 59 (96.7%) | 2 (3.3%) |
| Bachelor's Degree or higher | 28 (100.0%) | 0 (0.0%) |
Occupancy by Age of Householder in Mount Auburn
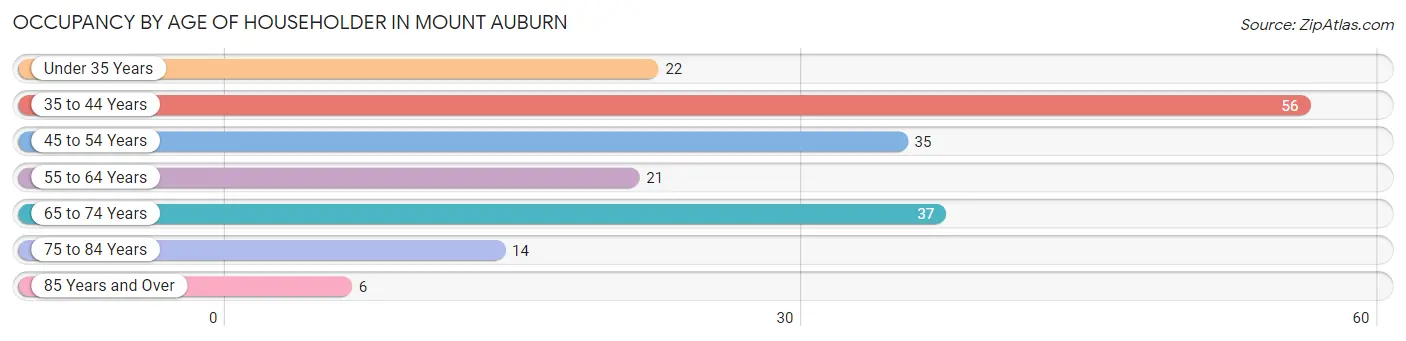
| Age Bracket | # Households | % Households |
| Under 35 Years | 22 | 11.5% |
| 35 to 44 Years | 56 | 29.3% |
| 45 to 54 Years | 35 | 18.3% |
| 55 to 64 Years | 21 | 11.0% |
| 65 to 74 Years | 37 | 19.4% |
| 75 to 84 Years | 14 | 7.3% |
| 85 Years and Over | 6 | 3.1% |
| Total | 191 | 100.0% |
Housing Finances in Mount Auburn
Median Income by Occupancy in Mount Auburn
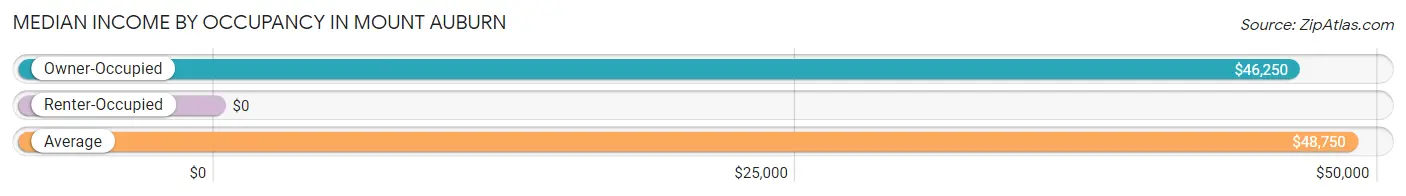
| Occupancy Type | # Households | Median Income |
| Owner-Occupied | 182 (95.3%) | $46,250 |
| Renter-Occupied | 9 (4.7%) | $0 |
| Average | 191 (100.0%) | $48,750 |
Occupancy by Householder Income Bracket in Mount Auburn
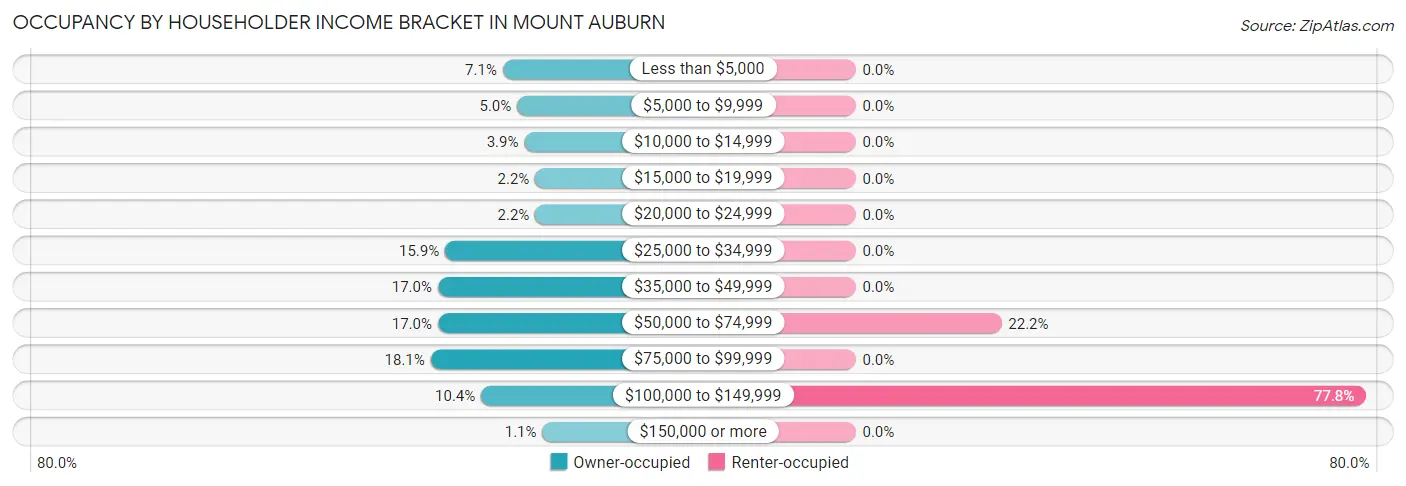
| Income Bracket | Owner-occupied | Renter-occupied |
| Less than $5,000 | 13 (7.1%) | 0 (0.0%) |
| $5,000 to $9,999 | 9 (5.0%) | 0 (0.0%) |
| $10,000 to $14,999 | 7 (3.8%) | 0 (0.0%) |
| $15,000 to $19,999 | 4 (2.2%) | 0 (0.0%) |
| $20,000 to $24,999 | 4 (2.2%) | 0 (0.0%) |
| $25,000 to $34,999 | 29 (15.9%) | 0 (0.0%) |
| $35,000 to $49,999 | 31 (17.0%) | 0 (0.0%) |
| $50,000 to $74,999 | 31 (17.0%) | 2 (22.2%) |
| $75,000 to $99,999 | 33 (18.1%) | 0 (0.0%) |
| $100,000 to $149,999 | 19 (10.4%) | 7 (77.8%) |
| $150,000 or more | 2 (1.1%) | 0 (0.0%) |
| Total | 182 (100.0%) | 9 (100.0%) |
Monthly Housing Cost Tiers in Mount Auburn
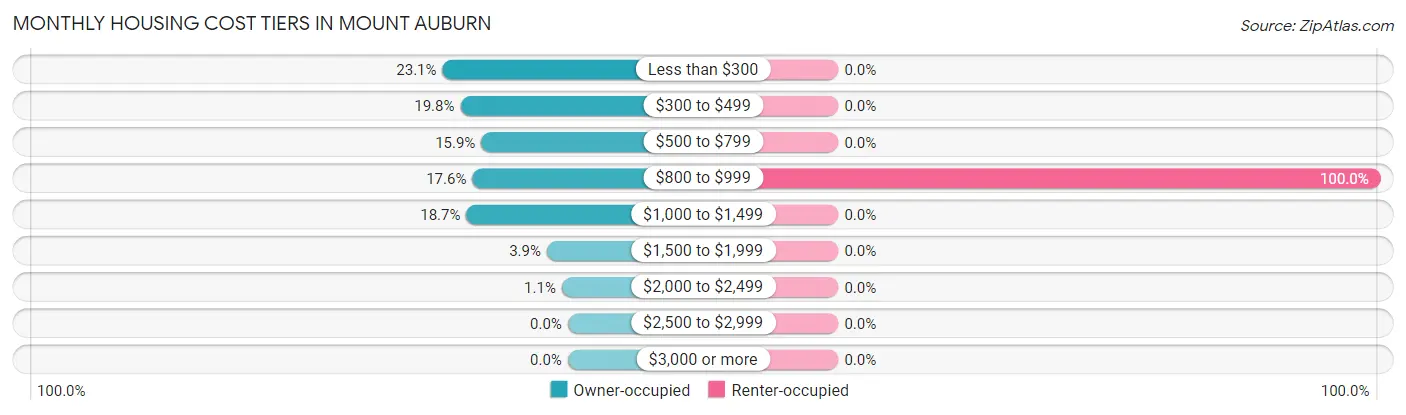
| Monthly Cost | Owner-occupied | Renter-occupied |
| Less than $300 | 42 (23.1%) | 0 (0.0%) |
| $300 to $499 | 36 (19.8%) | 0 (0.0%) |
| $500 to $799 | 29 (15.9%) | 0 (0.0%) |
| $800 to $999 | 32 (17.6%) | 9 (100.0%) |
| $1,000 to $1,499 | 34 (18.7%) | 0 (0.0%) |
| $1,500 to $1,999 | 7 (3.8%) | 0 (0.0%) |
| $2,000 to $2,499 | 2 (1.1%) | 0 (0.0%) |
| $2,500 to $2,999 | 0 (0.0%) | 0 (0.0%) |
| $3,000 or more | 0 (0.0%) | 0 (0.0%) |
| Total | 182 (100.0%) | 9 (100.0%) |
Physical Housing Characteristics in Mount Auburn
Housing Structures in Mount Auburn
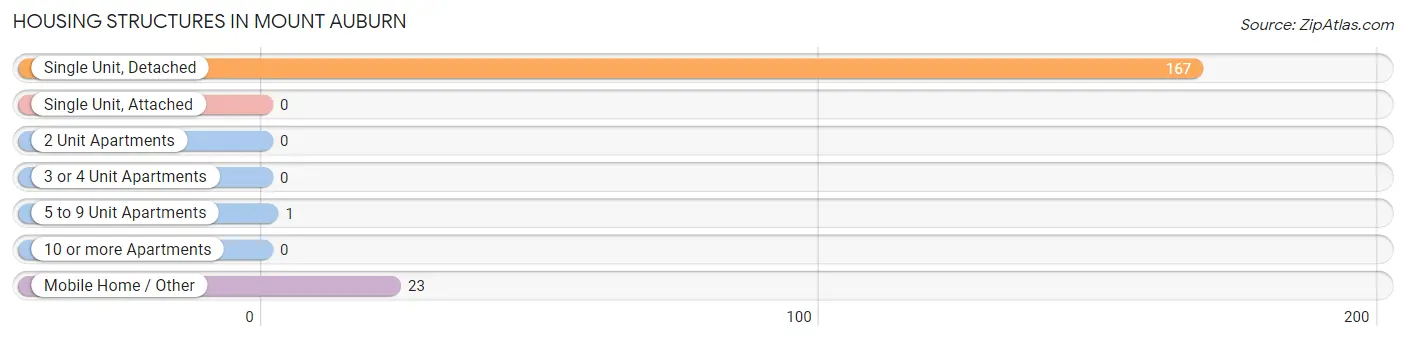
| Structure Type | # Housing Units | % Housing Units |
| Single Unit, Detached | 167 | 87.4% |
| Single Unit, Attached | 0 | 0.0% |
| 2 Unit Apartments | 0 | 0.0% |
| 3 or 4 Unit Apartments | 0 | 0.0% |
| 5 to 9 Unit Apartments | 1 | 0.5% |
| 10 or more Apartments | 0 | 0.0% |
| Mobile Home / Other | 23 | 12.0% |
| Total | 191 | 100.0% |
Housing Structures by Occupancy in Mount Auburn
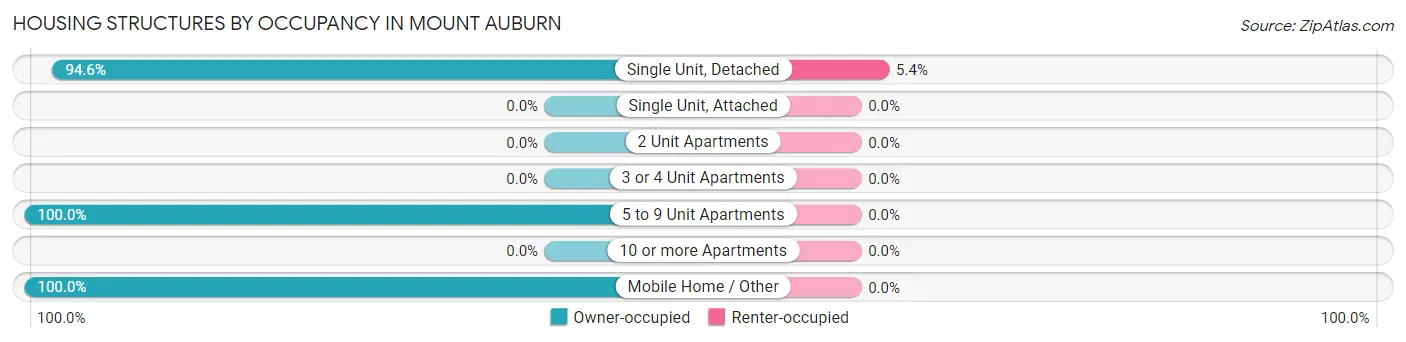
| Structure Type | Owner-occupied | Renter-occupied |
| Single Unit, Detached | 158 (94.6%) | 9 (5.4%) |
| Single Unit, Attached | 0 (0.0%) | 0 (0.0%) |
| 2 Unit Apartments | 0 (0.0%) | 0 (0.0%) |
| 3 or 4 Unit Apartments | 0 (0.0%) | 0 (0.0%) |
| 5 to 9 Unit Apartments | 1 (100.0%) | 0 (0.0%) |
| 10 or more Apartments | 0 (0.0%) | 0 (0.0%) |
| Mobile Home / Other | 23 (100.0%) | 0 (0.0%) |
| Total | 182 (95.3%) | 9 (4.7%) |
Housing Structures by Number of Rooms in Mount Auburn
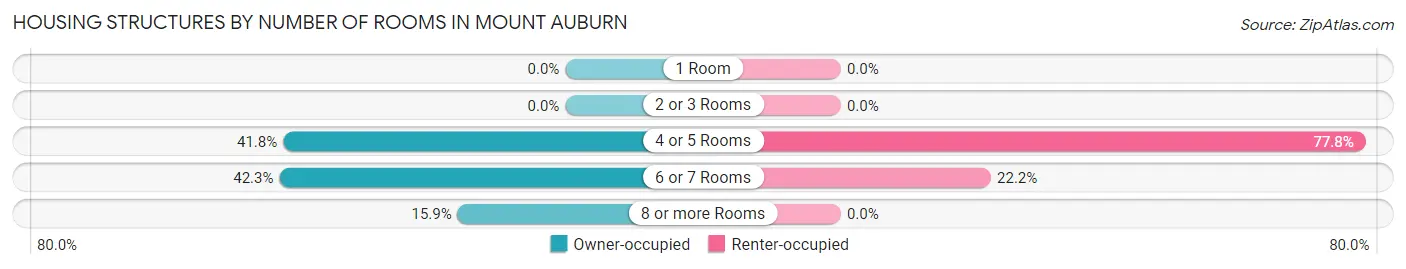
| Number of Rooms | Owner-occupied | Renter-occupied |
| 1 Room | 0 (0.0%) | 0 (0.0%) |
| 2 or 3 Rooms | 0 (0.0%) | 0 (0.0%) |
| 4 or 5 Rooms | 76 (41.8%) | 7 (77.8%) |
| 6 or 7 Rooms | 77 (42.3%) | 2 (22.2%) |
| 8 or more Rooms | 29 (15.9%) | 0 (0.0%) |
| Total | 182 (100.0%) | 9 (100.0%) |
Housing Structure by Heating Type in Mount Auburn
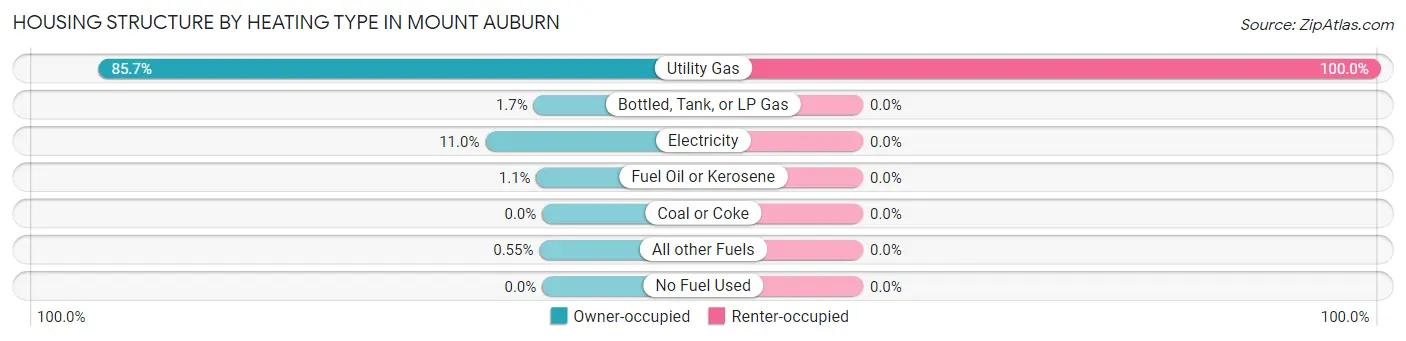
| Heating Type | Owner-occupied | Renter-occupied |
| Utility Gas | 156 (85.7%) | 9 (100.0%) |
| Bottled, Tank, or LP Gas | 3 (1.7%) | 0 (0.0%) |
| Electricity | 20 (11.0%) | 0 (0.0%) |
| Fuel Oil or Kerosene | 2 (1.1%) | 0 (0.0%) |
| Coal or Coke | 0 (0.0%) | 0 (0.0%) |
| All other Fuels | 1 (0.5%) | 0 (0.0%) |
| No Fuel Used | 0 (0.0%) | 0 (0.0%) |
| Total | 182 (100.0%) | 9 (100.0%) |
Household Vehicle Usage in Mount Auburn
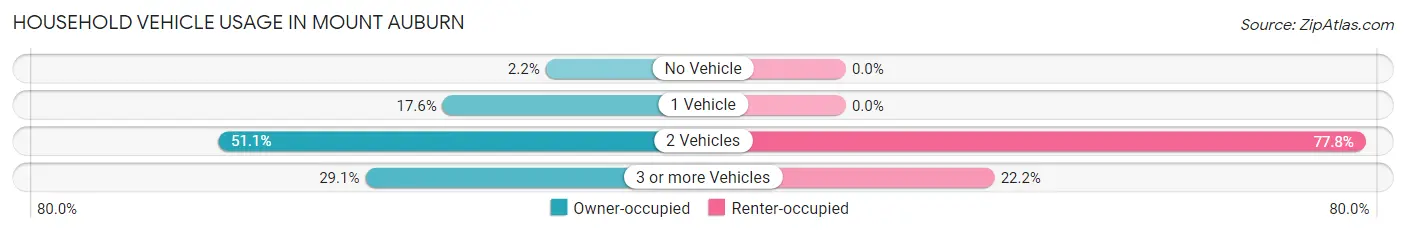
| Vehicles per Household | Owner-occupied | Renter-occupied |
| No Vehicle | 4 (2.2%) | 0 (0.0%) |
| 1 Vehicle | 32 (17.6%) | 0 (0.0%) |
| 2 Vehicles | 93 (51.1%) | 7 (77.8%) |
| 3 or more Vehicles | 53 (29.1%) | 2 (22.2%) |
| Total | 182 (100.0%) | 9 (100.0%) |
Real Estate & Mortgages in Mount Auburn
Real Estate and Mortgage Overview in Mount Auburn
| Characteristic | Without Mortgage | With Mortgage |
| Housing Units | 87 | 95 |
| Median Property Value | $73,400 | $92,800 |
| Median Household Income | $36,250 | $2 |
| Monthly Housing Costs | $307 | $0 |
| Real Estate Taxes | $838 | $0 |
Property Value by Mortgage Status in Mount Auburn
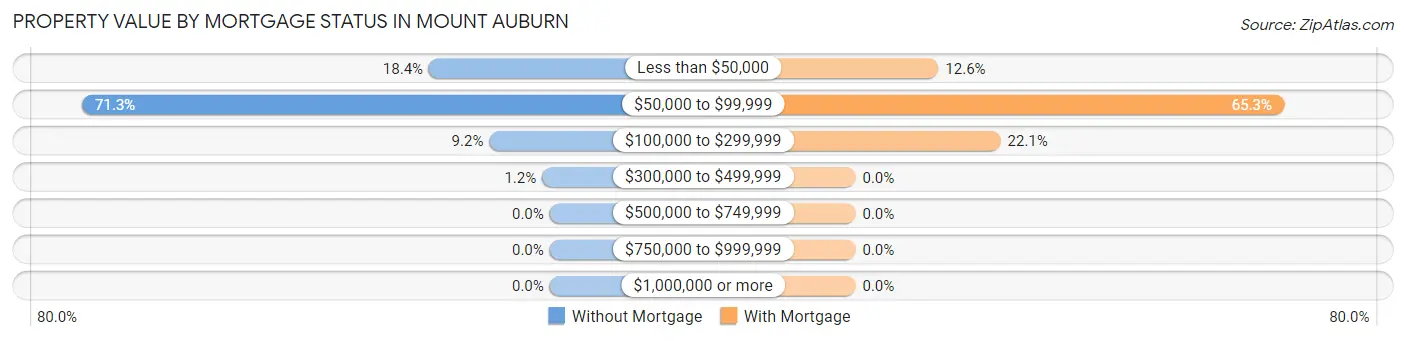
| Property Value | Without Mortgage | With Mortgage |
| Less than $50,000 | 16 (18.4%) | 12 (12.6%) |
| $50,000 to $99,999 | 62 (71.3%) | 62 (65.3%) |
| $100,000 to $299,999 | 8 (9.2%) | 21 (22.1%) |
| $300,000 to $499,999 | 1 (1.1%) | 0 (0.0%) |
| $500,000 to $749,999 | 0 (0.0%) | 0 (0.0%) |
| $750,000 to $999,999 | 0 (0.0%) | 0 (0.0%) |
| $1,000,000 or more | 0 (0.0%) | 0 (0.0%) |
| Total | 87 (100.0%) | 95 (100.0%) |
Household Income by Mortgage Status in Mount Auburn
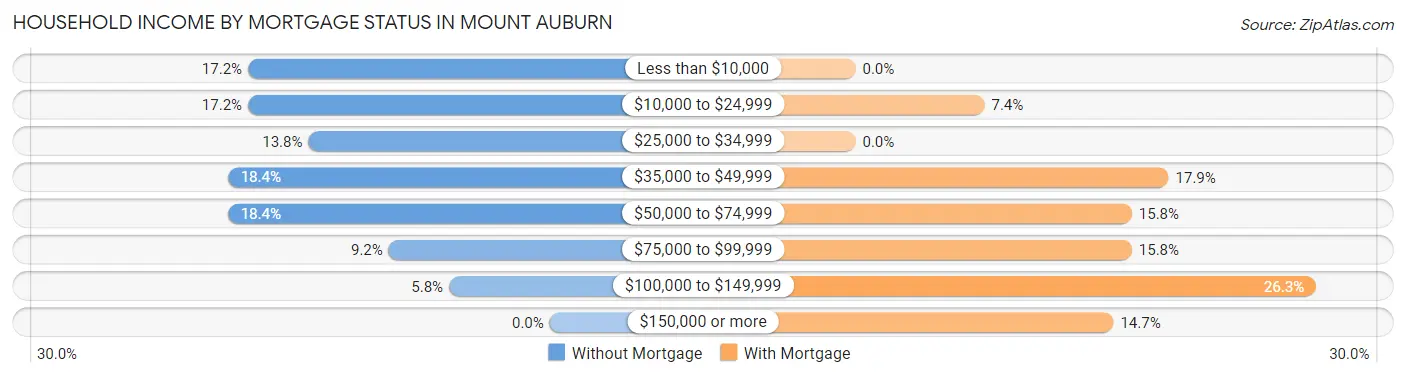
| Household Income | Without Mortgage | With Mortgage |
| Less than $10,000 | 15 (17.2%) | 0 (0.0%) |
| $10,000 to $24,999 | 15 (17.2%) | 7 (7.4%) |
| $25,000 to $34,999 | 12 (13.8%) | 0 (0.0%) |
| $35,000 to $49,999 | 16 (18.4%) | 17 (17.9%) |
| $50,000 to $74,999 | 16 (18.4%) | 15 (15.8%) |
| $75,000 to $99,999 | 8 (9.2%) | 15 (15.8%) |
| $100,000 to $149,999 | 5 (5.8%) | 25 (26.3%) |
| $150,000 or more | 0 (0.0%) | 14 (14.7%) |
| Total | 87 (100.0%) | 95 (100.0%) |
Property Value to Household Income Ratio in Mount Auburn
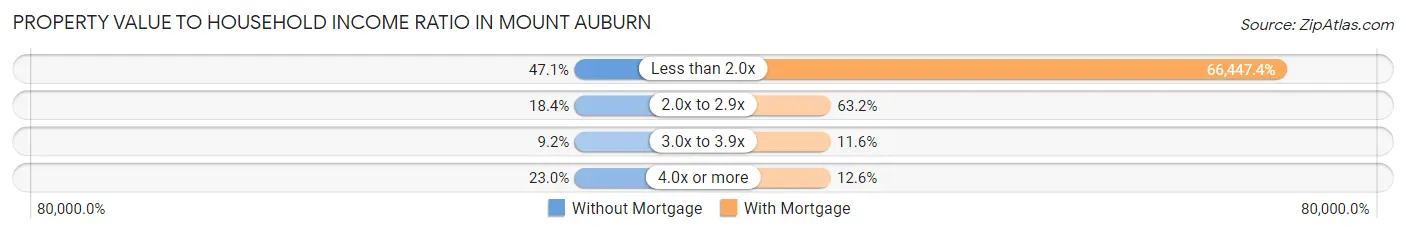
| Value-to-Income Ratio | Without Mortgage | With Mortgage |
| Less than 2.0x | 41 (47.1%) | 63,125 (66,447.4%) |
| 2.0x to 2.9x | 16 (18.4%) | 60 (63.2%) |
| 3.0x to 3.9x | 8 (9.2%) | 11 (11.6%) |
| 4.0x or more | 20 (23.0%) | 12 (12.6%) |
| Total | 87 (100.0%) | 95 (100.0%) |
Real Estate Taxes by Mortgage Status in Mount Auburn
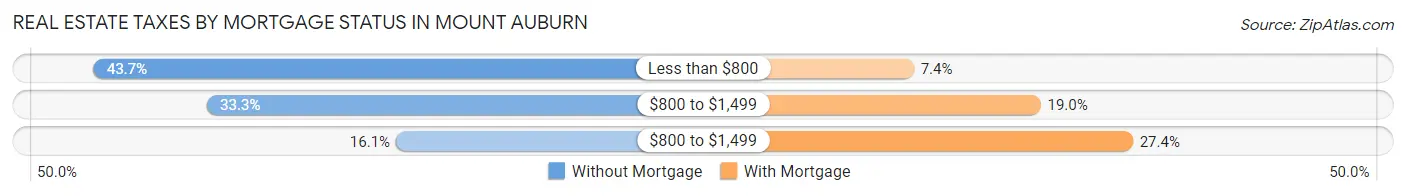
| Property Taxes | Without Mortgage | With Mortgage |
| Less than $800 | 38 (43.7%) | 7 (7.4%) |
| $800 to $1,499 | 29 (33.3%) | 18 (19.0%) |
| $800 to $1,499 | 14 (16.1%) | 26 (27.4%) |
| Total | 87 (100.0%) | 95 (100.0%) |
Health & Disability in Mount Auburn
Health Insurance Coverage by Age in Mount Auburn
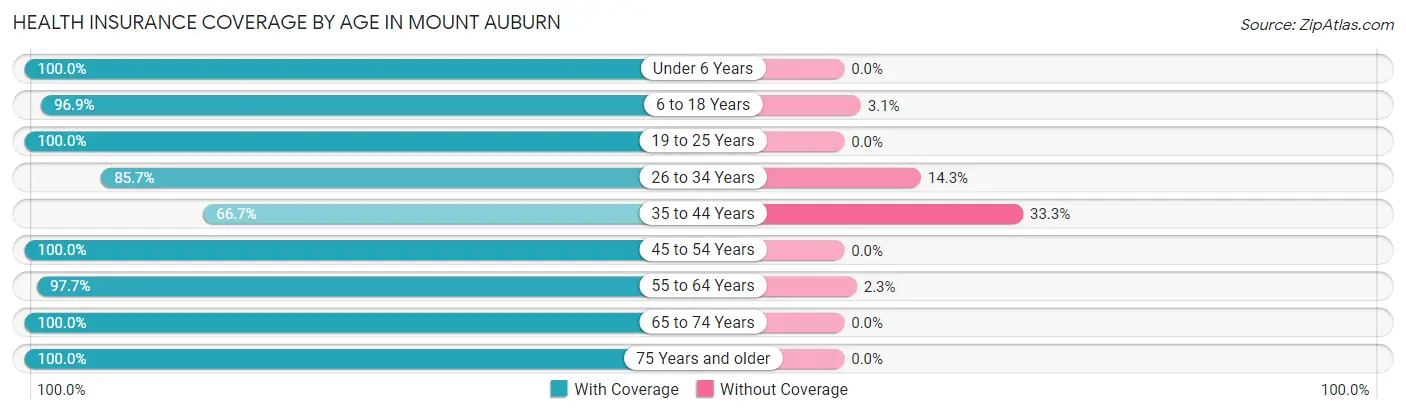
| Age Bracket | With Coverage | Without Coverage |
| Under 6 Years | 67 (100.0%) | 0 (0.0%) |
| 6 to 18 Years | 94 (96.9%) | 3 (3.1%) |
| 19 to 25 Years | 30 (100.0%) | 0 (0.0%) |
| 26 to 34 Years | 42 (85.7%) | 7 (14.3%) |
| 35 to 44 Years | 78 (66.7%) | 39 (33.3%) |
| 45 to 54 Years | 58 (100.0%) | 0 (0.0%) |
| 55 to 64 Years | 42 (97.7%) | 1 (2.3%) |
| 65 to 74 Years | 44 (100.0%) | 0 (0.0%) |
| 75 Years and older | 23 (100.0%) | 0 (0.0%) |
| Total | 478 (90.5%) | 50 (9.5%) |
Health Insurance Coverage by Citizenship Status in Mount Auburn
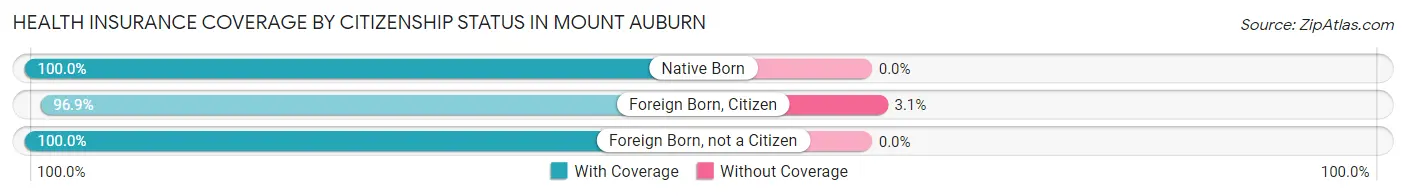
| Citizenship Status | With Coverage | Without Coverage |
| Native Born | 67 (100.0%) | 0 (0.0%) |
| Foreign Born, Citizen | 94 (96.9%) | 3 (3.1%) |
| Foreign Born, not a Citizen | 30 (100.0%) | 0 (0.0%) |
Health Insurance Coverage by Household Income in Mount Auburn
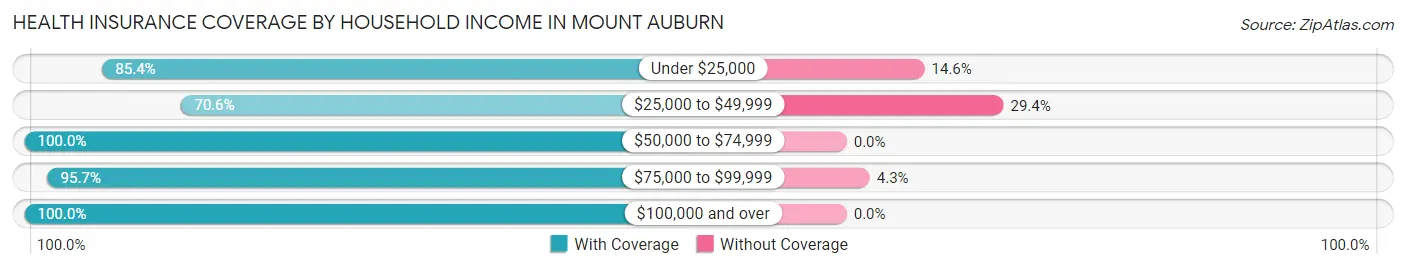
| Household Income | With Coverage | Without Coverage |
| Under $25,000 | 41 (85.4%) | 7 (14.6%) |
| $25,000 to $49,999 | 89 (70.6%) | 37 (29.4%) |
| $50,000 to $74,999 | 113 (100.0%) | 0 (0.0%) |
| $75,000 to $99,999 | 133 (95.7%) | 6 (4.3%) |
| $100,000 and over | 102 (100.0%) | 0 (0.0%) |
Public vs Private Health Insurance Coverage by Age in Mount Auburn
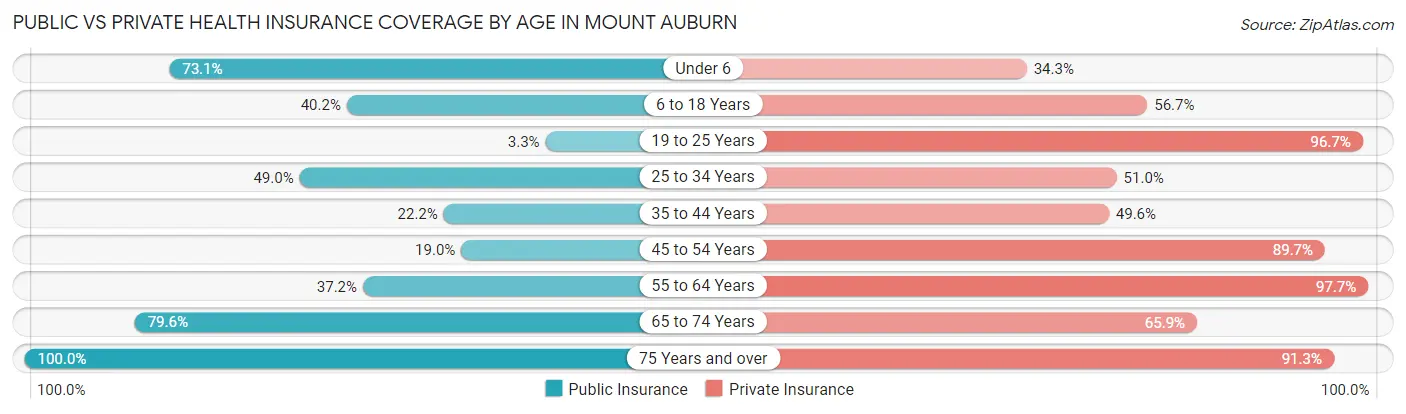
| Age Bracket | Public Insurance | Private Insurance |
| Under 6 | 49 (73.1%) | 23 (34.3%) |
| 6 to 18 Years | 39 (40.2%) | 55 (56.7%) |
| 19 to 25 Years | 1 (3.3%) | 29 (96.7%) |
| 25 to 34 Years | 24 (49.0%) | 25 (51.0%) |
| 35 to 44 Years | 26 (22.2%) | 58 (49.6%) |
| 45 to 54 Years | 11 (19.0%) | 52 (89.7%) |
| 55 to 64 Years | 16 (37.2%) | 42 (97.7%) |
| 65 to 74 Years | 35 (79.5%) | 29 (65.9%) |
| 75 Years and over | 23 (100.0%) | 21 (91.3%) |
| Total | 224 (42.4%) | 334 (63.3%) |
Disability Status by Sex by Age in Mount Auburn
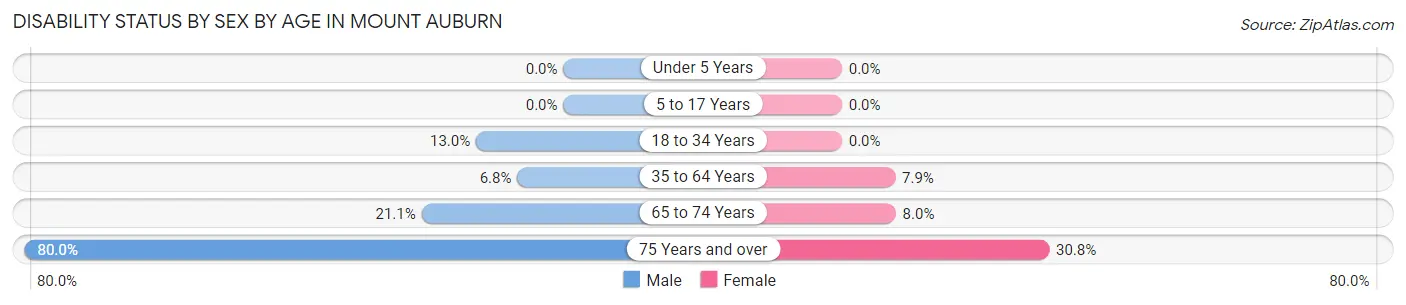
| Age Bracket | Male | Female |
| Under 5 Years | 0 (0.0%) | 0 (0.0%) |
| 5 to 17 Years | 0 (0.0%) | 0 (0.0%) |
| 18 to 34 Years | 7 (13.0%) | 0 (0.0%) |
| 35 to 64 Years | 8 (6.8%) | 8 (7.9%) |
| 65 to 74 Years | 4 (21.0%) | 2 (8.0%) |
| 75 Years and over | 8 (80.0%) | 4 (30.8%) |
Disability Class by Sex by Age in Mount Auburn
Disability Class: Hearing Difficulty
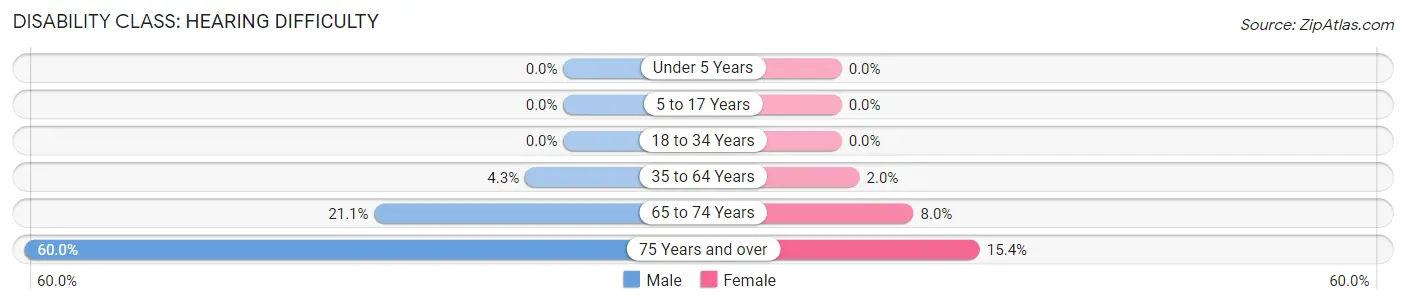
| Age Bracket | Male | Female |
| Under 5 Years | 0 (0.0%) | 0 (0.0%) |
| 5 to 17 Years | 0 (0.0%) | 0 (0.0%) |
| 18 to 34 Years | 0 (0.0%) | 0 (0.0%) |
| 35 to 64 Years | 5 (4.3%) | 2 (2.0%) |
| 65 to 74 Years | 4 (21.0%) | 2 (8.0%) |
| 75 Years and over | 6 (60.0%) | 2 (15.4%) |
Disability Class: Vision Difficulty
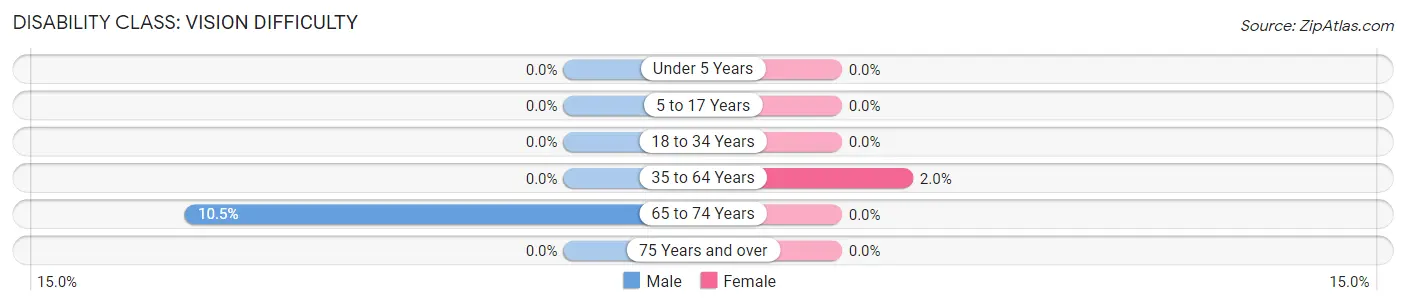
| Age Bracket | Male | Female |
| Under 5 Years | 0 (0.0%) | 0 (0.0%) |
| 5 to 17 Years | 0 (0.0%) | 0 (0.0%) |
| 18 to 34 Years | 0 (0.0%) | 0 (0.0%) |
| 35 to 64 Years | 0 (0.0%) | 2 (2.0%) |
| 65 to 74 Years | 2 (10.5%) | 0 (0.0%) |
| 75 Years and over | 0 (0.0%) | 0 (0.0%) |
Disability Class: Cognitive Difficulty
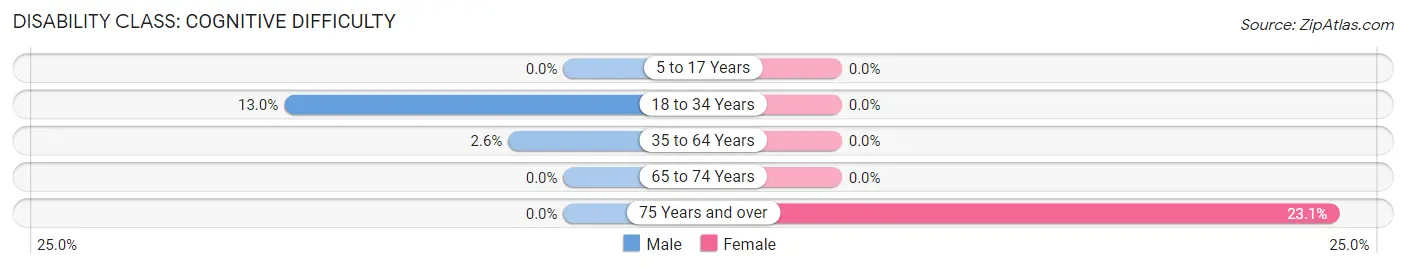
| Age Bracket | Male | Female |
| 5 to 17 Years | 0 (0.0%) | 0 (0.0%) |
| 18 to 34 Years | 7 (13.0%) | 0 (0.0%) |
| 35 to 64 Years | 3 (2.6%) | 0 (0.0%) |
| 65 to 74 Years | 0 (0.0%) | 0 (0.0%) |
| 75 Years and over | 0 (0.0%) | 3 (23.1%) |
Disability Class: Ambulatory Difficulty
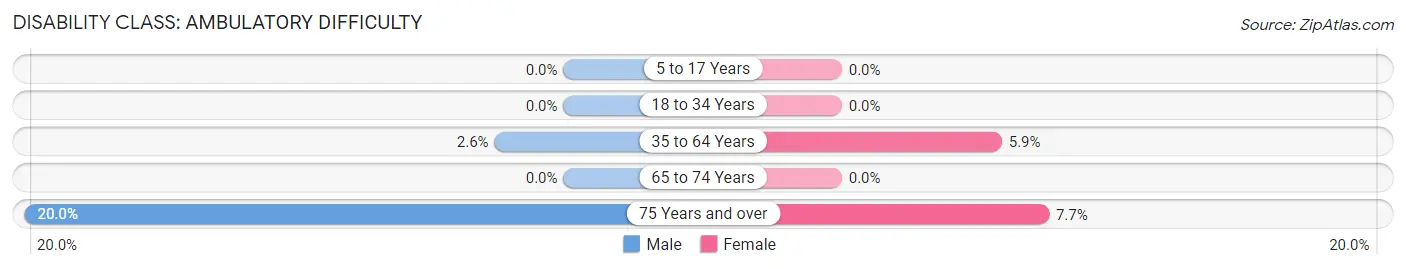
| Age Bracket | Male | Female |
| 5 to 17 Years | 0 (0.0%) | 0 (0.0%) |
| 18 to 34 Years | 0 (0.0%) | 0 (0.0%) |
| 35 to 64 Years | 3 (2.6%) | 6 (5.9%) |
| 65 to 74 Years | 0 (0.0%) | 0 (0.0%) |
| 75 Years and over | 2 (20.0%) | 1 (7.7%) |
Disability Class: Self-Care Difficulty
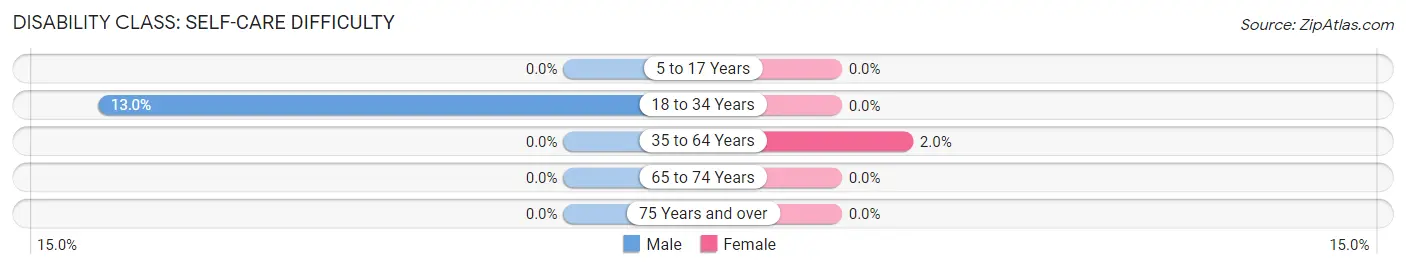
| Age Bracket | Male | Female |
| 5 to 17 Years | 0 (0.0%) | 0 (0.0%) |
| 18 to 34 Years | 7 (13.0%) | 0 (0.0%) |
| 35 to 64 Years | 0 (0.0%) | 2 (2.0%) |
| 65 to 74 Years | 0 (0.0%) | 0 (0.0%) |
| 75 Years and over | 0 (0.0%) | 0 (0.0%) |
Technology Access in Mount Auburn
Computing Device Access in Mount Auburn
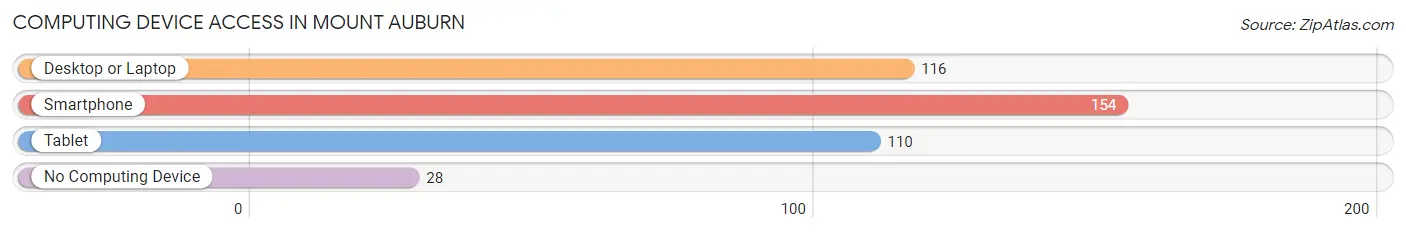
| Device Type | # Households | % Households |
| Desktop or Laptop | 116 | 60.7% |
| Smartphone | 154 | 80.6% |
| Tablet | 110 | 57.6% |
| No Computing Device | 28 | 14.7% |
| Total | 191 | 100.0% |
Internet Access in Mount Auburn
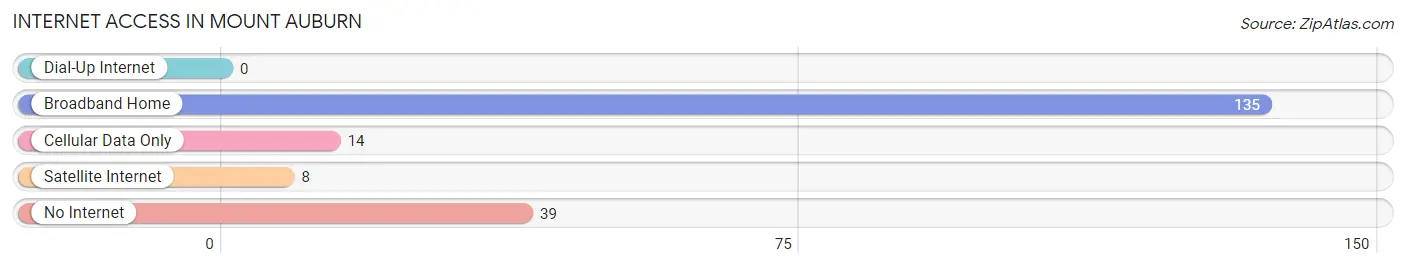
| Internet Type | # Households | % Households |
| Dial-Up Internet | 0 | 0.0% |
| Broadband Home | 135 | 70.7% |
| Cellular Data Only | 14 | 7.3% |
| Satellite Internet | 8 | 4.2% |
| No Internet | 39 | 20.4% |
| Total | 191 | 100.0% |
Mount Auburn Summary
Auburn, Illinois is a small village located in the central part of the state, in the county of Sangamon. It is situated on the banks of the Sangamon River, and is part of the Springfield Metropolitan Statistical Area. The village has a population of approximately 1,000 people, and is home to a variety of businesses, including a grocery store, a bank, a post office, and a few restaurants.
History
The area that is now Auburn was first settled in 1819 by a group of settlers from Kentucky. The village was originally known as “Hickory Grove”, and was later renamed “Auburn” in 1837. The name was chosen in honor of the town of Auburn, New York, which was the birthplace of the first settler in the area.
The village was incorporated in 1867, and the first mayor was elected in 1868. The village grew slowly over the years, and by the turn of the century, it had a population of around 500 people.
In the early 1900s, the village was home to a variety of businesses, including a flour mill, a sawmill, a blacksmith shop, and a general store. The village also had a school, a post office, and a few churches.
Geography
Auburn is located in the central part of the state, in the county of Sangamon. It is situated on the banks of the Sangamon River, and is part of the Springfield Metropolitan Statistical Area. The village has a total area of 0.7 square miles, all of which is land.
The village is located in a rural area, and is surrounded by farmland. The nearest major city is Springfield, which is located about 20 miles to the north.
Economy
The economy of Auburn is largely based on agriculture. The village is home to a variety of farms, which produce a variety of crops, including corn, soybeans, and wheat. The village also has a few small businesses, including a grocery store, a bank, a post office, and a few restaurants.
Demographics
As of the 2010 census, the population of Auburn was 1,000 people. The racial makeup of the village was 97.2% White, 0.7% African American, 0.2% Native American, 0.2% Asian, 0.2% from other races, and 1.7% from two or more races. Hispanic or Latino of any race were 0.7% of the population.
The median income for a household in the village was $45,000, and the median income for a family was $50,000. The per capita income for the village was $20,000. About 8.3% of families and 10.3% of the population were below the poverty line, including 14.3% of those under age 18 and none of those age 65 or over.
Conclusion
Auburn, Illinois is a small village located in the central part of the state, in the county of Sangamon. It is situated on the banks of the Sangamon River, and is part of the Springfield Metropolitan Statistical Area. The village has a population of approximately 1,000 people, and is home to a variety of businesses, including a grocery store, a bank, a post office, and a few restaurants. The economy of Auburn is largely based on agriculture, and the village is home to a variety of farms, which produce a variety of crops. The racial makeup of the village is predominantly White, with a small percentage of African American, Native American, and Asian residents. The median income for a household in the village is $45,000, and the median income for a family is $50,000.
Common Questions
What is Per Capita Income in Mount Auburn?
Per Capita income in Mount Auburn is $22,052.
What is the Median Family Income in Mount Auburn?
Median Family Income in Mount Auburn is $70,417.
What is the Median Household income in Mount Auburn?
Median Household Income in Mount Auburn is $48,750.
What is Income or Wage Gap in Mount Auburn?
Income or Wage Gap in Mount Auburn is 47.1%.
Women in Mount Auburn earn 52.9 cents for every dollar earned by a man.
What is Inequality or Gini Index in Mount Auburn?
Inequality or Gini Index in Mount Auburn is 0.38.
What is the Total Population of Mount Auburn?
Total Population of Mount Auburn is 528.
What is the Total Male Population of Mount Auburn?
Total Male Population of Mount Auburn is 335.
What is the Total Female Population of Mount Auburn?
Total Female Population of Mount Auburn is 193.
What is the Ratio of Males per 100 Females in Mount Auburn?
There are 173.58 Males per 100 Females in Mount Auburn.
What is the Ratio of Females per 100 Males in Mount Auburn?
There are 57.61 Females per 100 Males in Mount Auburn.
What is the Median Population Age in Mount Auburn?
Median Population Age in Mount Auburn is 38.4 Years.
What is the Average Family Size in Mount Auburn
Average Family Size in Mount Auburn is 3.8 People.
What is the Average Household Size in Mount Auburn
Average Household Size in Mount Auburn is 2.8 People.
How Large is the Labor Force in Mount Auburn?
There are 259 People in the Labor Forcein in Mount Auburn.
What is the Percentage of People in the Labor Force in Mount Auburn?
66.1% of People are in the Labor Force in Mount Auburn.
What is the Unemployment Rate in Mount Auburn?
Unemployment Rate in Mount Auburn is 6.6%.