Monticello, IL Map & Demographics
Monticello Map
Monticello Overview
$38,878
PER CAPITA INCOME
$97,228
AVG FAMILY INCOME
$78,295
AVG HOUSEHOLD INCOME
38.0%
WAGE / INCOME GAP [ % ]
62.0¢/ $1
WAGE / INCOME GAP [ $ ]
0.37
INEQUALITY / GINI INDEX
6,337
TOTAL POPULATION
2,979
MALE POPULATION
3,358
FEMALE POPULATION
88.71
MALES / 100 FEMALES
112.72
FEMALES / 100 MALES
40.5
MEDIAN AGE
2.9
AVG FAMILY SIZE
2.4
AVG HOUSEHOLD SIZE
3,207
LABOR FORCE [ PEOPLE ]
62.8%
PERCENT IN LABOR FORCE
1.7%
UNEMPLOYMENT RATE
Monticello Zip Codes
Monticello Area Codes
Income in Monticello
Income Overview in Monticello
Per Capita Income in Monticello is $38,878, while median incomes of families and households are $97,228 and $78,295 respectively.
| Characteristic | Number | Measure |
| Per Capita Income | 6,337 | $38,878 |
| Median Family Income | 1,748 | $97,228 |
| Mean Family Income | 1,748 | $106,249 |
| Median Household Income | 2,636 | $78,295 |
| Mean Household Income | 2,636 | $90,473 |
| Income Deficit | 1,748 | $0 |
| Wage / Income Gap (%) | 6,337 | 37.96% |
| Wage / Income Gap ($) | 6,337 | 62.04¢ per $1 |
| Gini / Inequality Index | 6,337 | 0.37 |
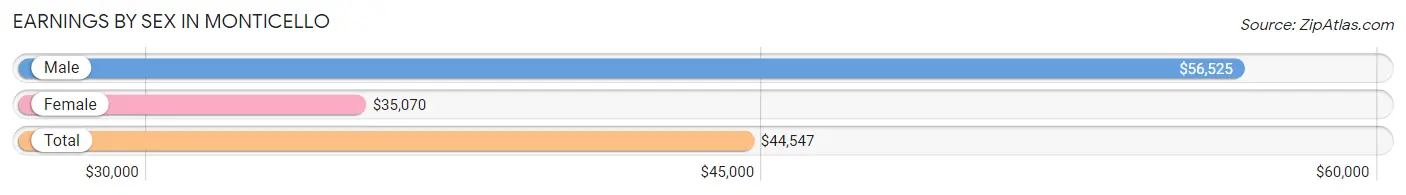
Earnings by Sex in Monticello
Average Earnings in Monticello are $44,547, $56,525 for men and $35,070 for women, a difference of 38.0%.
| Sex | Number | Average Earnings |
| Male | 1,735 (51.6%) | $56,525 |
| Female | 1,630 (48.4%) | $35,070 |
| Total | 3,365 (100.0%) | $44,547 |
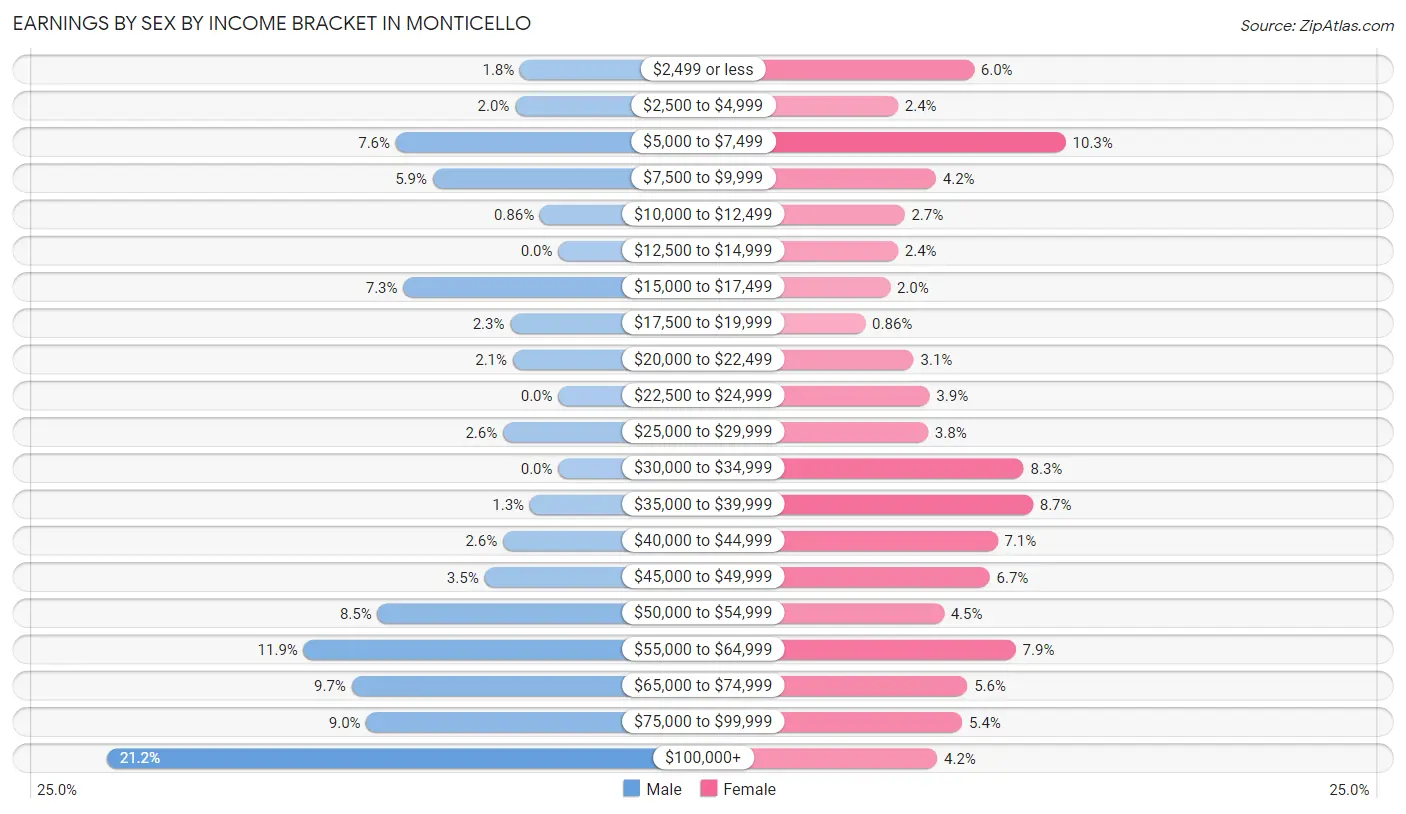
Earnings by Sex by Income Bracket in Monticello
The most common earnings brackets in Monticello are $100,000+ for men (367 | 21.1%) and $5,000 to $7,499 for women (167 | 10.2%).
| Income | Male | Female |
| $2,499 or less | 31 (1.8%) | 97 (5.9%) |
| $2,500 to $4,999 | 35 (2.0%) | 39 (2.4%) |
| $5,000 to $7,499 | 132 (7.6%) | 167 (10.2%) |
| $7,500 to $9,999 | 102 (5.9%) | 68 (4.2%) |
| $10,000 to $12,499 | 15 (0.9%) | 44 (2.7%) |
| $12,500 to $14,999 | 0 (0.0%) | 39 (2.4%) |
| $15,000 to $17,499 | 126 (7.3%) | 33 (2.0%) |
| $17,500 to $19,999 | 39 (2.2%) | 14 (0.9%) |
| $20,000 to $22,499 | 37 (2.1%) | 51 (3.1%) |
| $22,500 to $24,999 | 0 (0.0%) | 63 (3.9%) |
| $25,000 to $29,999 | 45 (2.6%) | 62 (3.8%) |
| $30,000 to $34,999 | 0 (0.0%) | 135 (8.3%) |
| $35,000 to $39,999 | 23 (1.3%) | 142 (8.7%) |
| $40,000 to $44,999 | 45 (2.6%) | 115 (7.1%) |
| $45,000 to $49,999 | 60 (3.5%) | 109 (6.7%) |
| $50,000 to $54,999 | 147 (8.5%) | 74 (4.5%) |
| $55,000 to $64,999 | 207 (11.9%) | 129 (7.9%) |
| $65,000 to $74,999 | 168 (9.7%) | 92 (5.6%) |
| $75,000 to $99,999 | 156 (9.0%) | 88 (5.4%) |
| $100,000+ | 367 (21.1%) | 69 (4.2%) |
| Total | 1,735 (100.0%) | 1,630 (100.0%) |
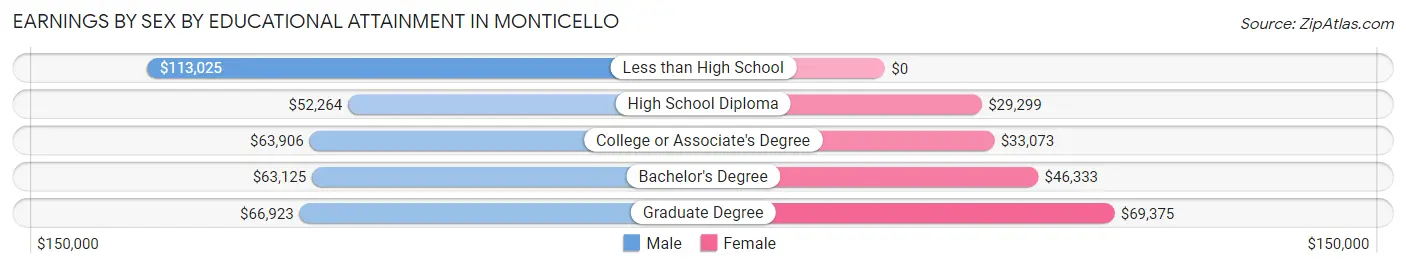
Earnings by Sex by Educational Attainment in Monticello
Average earnings in Monticello are $60,775 for men and $40,036 for women, a difference of 34.1%. Men with an educational attainment of less than high school enjoy the highest average annual earnings of $113,025, while those with high school diploma education earn the least with $52,264. Women with an educational attainment of graduate degree earn the most with the average annual earnings of $69,375, while those with high school diploma education have the smallest earnings of $29,299.
| Educational Attainment | Male Income | Female Income |
| Less than High School | $113,025 | $0 |
| High School Diploma | $52,264 | $29,299 |
| College or Associate's Degree | $63,906 | $33,073 |
| Bachelor's Degree | $63,125 | $46,333 |
| Graduate Degree | $66,923 | $69,375 |
| Total | $60,775 | $40,036 |
Family Income in Monticello
Family Income Brackets in Monticello
According to the Monticello family income data, there are 559 families falling into the $100,000 to $149,999 income range, which is the most common income bracket and makes up 32.0% of all families.
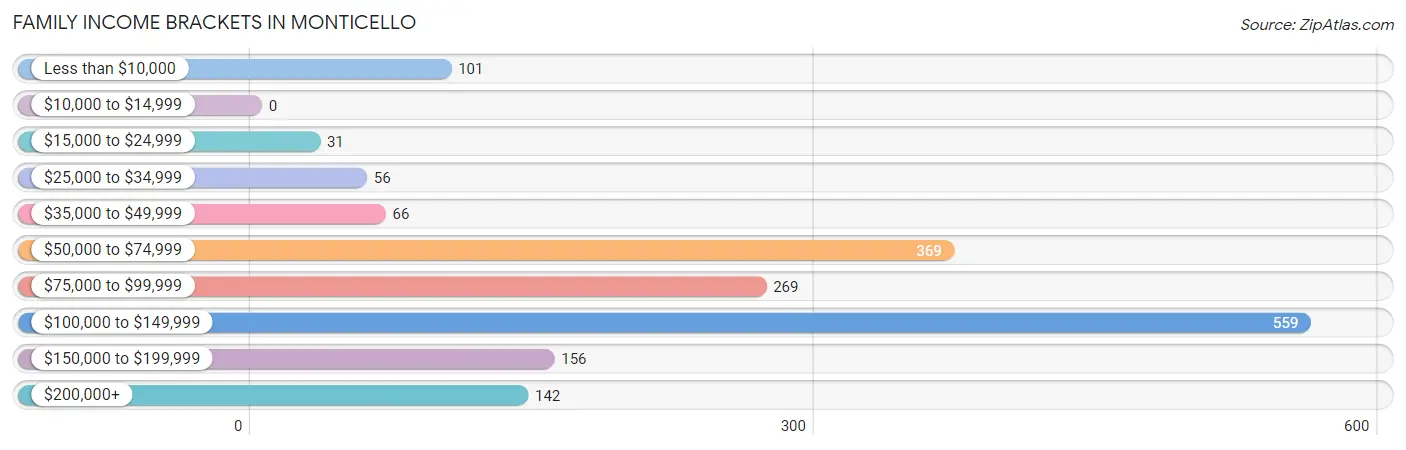
| Income Bracket | # Families | % Families |
| Less than $10,000 | 101 | 5.8% |
| $10,000 to $14,999 | 0 | 0.0% |
| $15,000 to $24,999 | 31 | 1.8% |
| $25,000 to $34,999 | 56 | 3.2% |
| $35,000 to $49,999 | 66 | 3.8% |
| $50,000 to $74,999 | 369 | 21.1% |
| $75,000 to $99,999 | 269 | 15.4% |
| $100,000 to $149,999 | 559 | 32.0% |
| $150,000 to $199,999 | 156 | 8.9% |
| $200,000+ | 142 | 8.1% |
Family Income by Famaliy Size in Monticello
5-person families (172 | 9.8%) account for the highest median family income in Monticello with $135,724 per family, while 2-person families (1,012 | 57.9%) have the highest median income of $44,540 per family member.
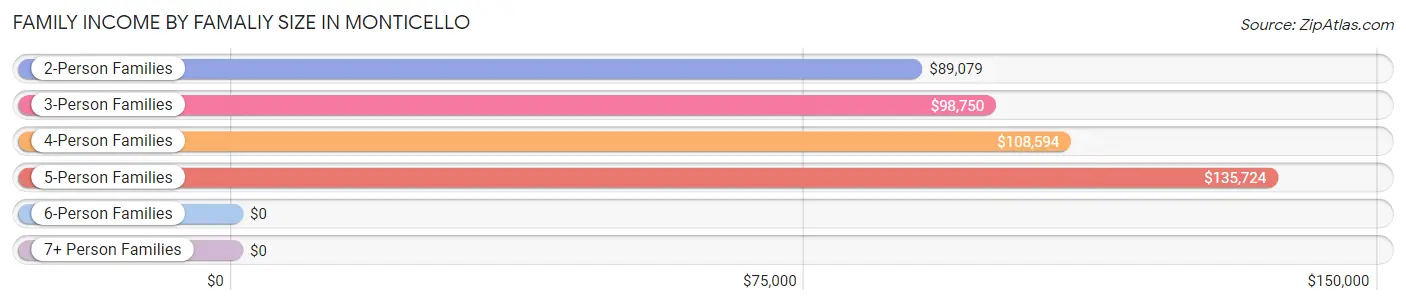
| Income Bracket | # Families | Median Income |
| 2-Person Families | 1,012 (57.9%) | $89,079 |
| 3-Person Families | 349 (20.0%) | $98,750 |
| 4-Person Families | 215 (12.3%) | $108,594 |
| 5-Person Families | 172 (9.8%) | $135,724 |
| 6-Person Families | 0 (0.0%) | $0 |
| 7+ Person Families | 0 (0.0%) | $0 |
| Total | 1,748 (100.0%) | $97,228 |
Family Income by Number of Earners in Monticello
The median family income in Monticello is $97,228, with families comprising 3+ earners (178) having the highest median family income of $147,661, while families with no earners (300) have the lowest median family income of $69,934, accounting for 10.2% and 17.2% of families, respectively.
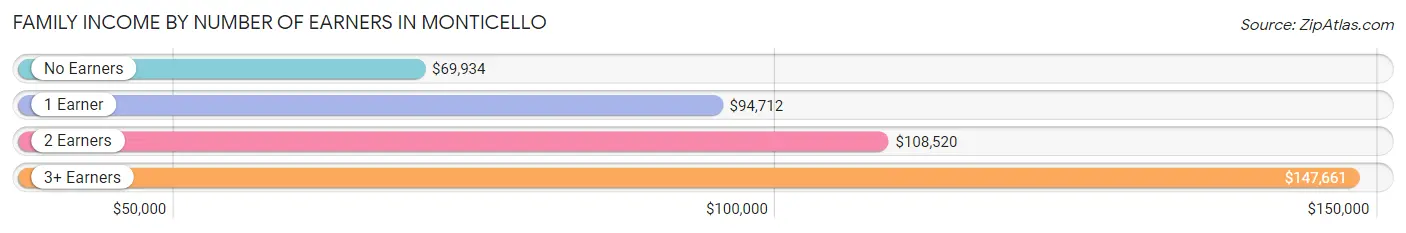
| Number of Earners | # Families | Median Income |
| No Earners | 300 (17.2%) | $69,934 |
| 1 Earner | 403 (23.1%) | $94,712 |
| 2 Earners | 867 (49.6%) | $108,520 |
| 3+ Earners | 178 (10.2%) | $147,661 |
| Total | 1,748 (100.0%) | $97,228 |
Household Income in Monticello
Household Income Brackets in Monticello
With 693 households falling in the category, the $100,000 to $149,999 income range is the most frequent in Monticello, accounting for 26.3% of all households. In contrast, only 55 households (2.1%) fall into the $10,000 to $14,999 income bracket, making it the least populous group.
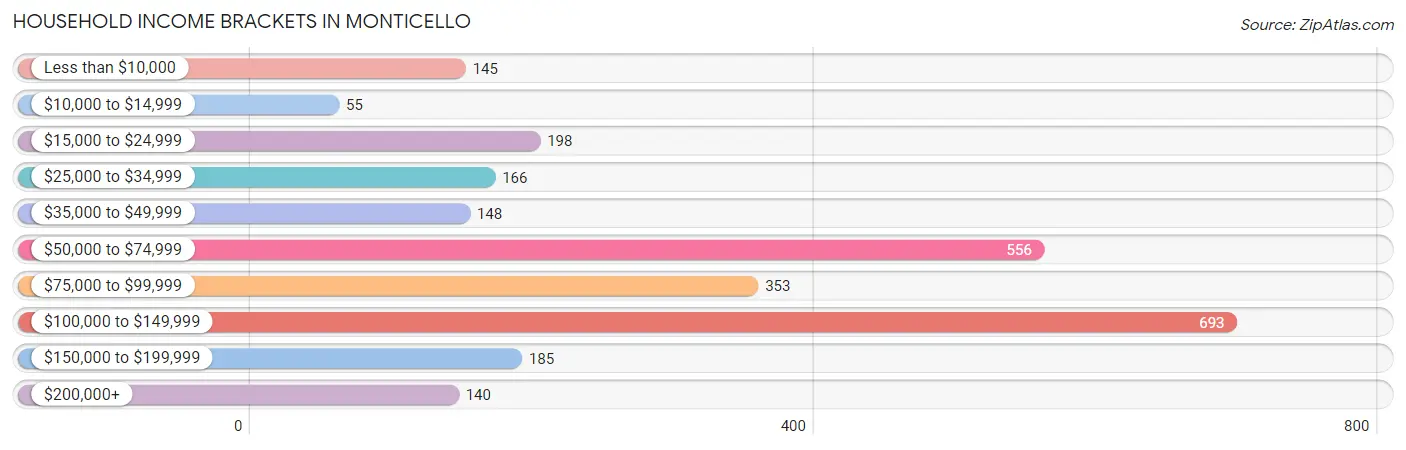
| Income Bracket | # Households | % Households |
| Less than $10,000 | 145 | 5.5% |
| $10,000 to $14,999 | 55 | 2.1% |
| $15,000 to $24,999 | 198 | 7.5% |
| $25,000 to $34,999 | 166 | 6.3% |
| $35,000 to $49,999 | 148 | 5.6% |
| $50,000 to $74,999 | 556 | 21.1% |
| $75,000 to $99,999 | 353 | 13.4% |
| $100,000 to $149,999 | 693 | 26.3% |
| $150,000 to $199,999 | 185 | 7.0% |
| $200,000+ | 140 | 5.3% |
Household Income by Householder Age in Monticello
The median household income in Monticello is $78,295, with the highest median household income of $102,609 found in the 25 to 44 years age bracket for the primary householder. A total of 728 households (27.6%) fall into this category. Meanwhile, the 15 to 24 years age bracket for the primary householder has the lowest median household income of $0, with 68 households (2.6%) in this group.
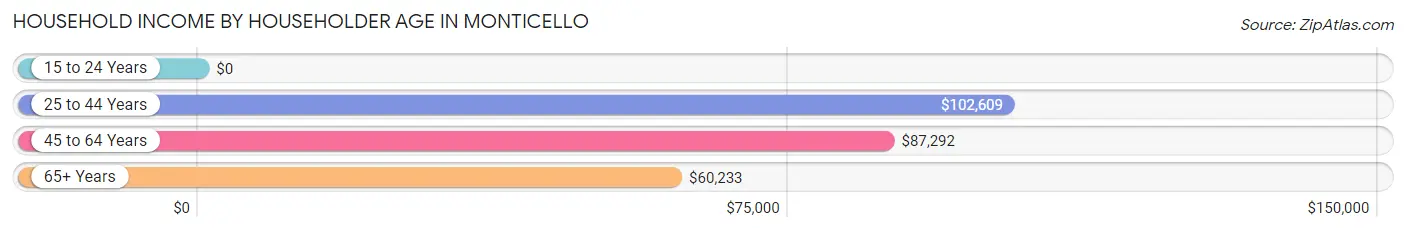
| Income Bracket | # Households | Median Income |
| 15 to 24 Years | 68 (2.6%) | $0 |
| 25 to 44 Years | 728 (27.6%) | $102,609 |
| 45 to 64 Years | 911 (34.6%) | $87,292 |
| 65+ Years | 929 (35.2%) | $60,233 |
| Total | 2,636 (100.0%) | $78,295 |
Poverty in Monticello
Income Below Poverty by Sex and Age in Monticello
With 7.0% poverty level for males and 9.7% for females among the residents of Monticello, under 5 year old males and 16 and 17 year old females are the most vulnerable to poverty, with 43 males (28.9%) and 26 females (27.4%) in their respective age groups living below the poverty level.
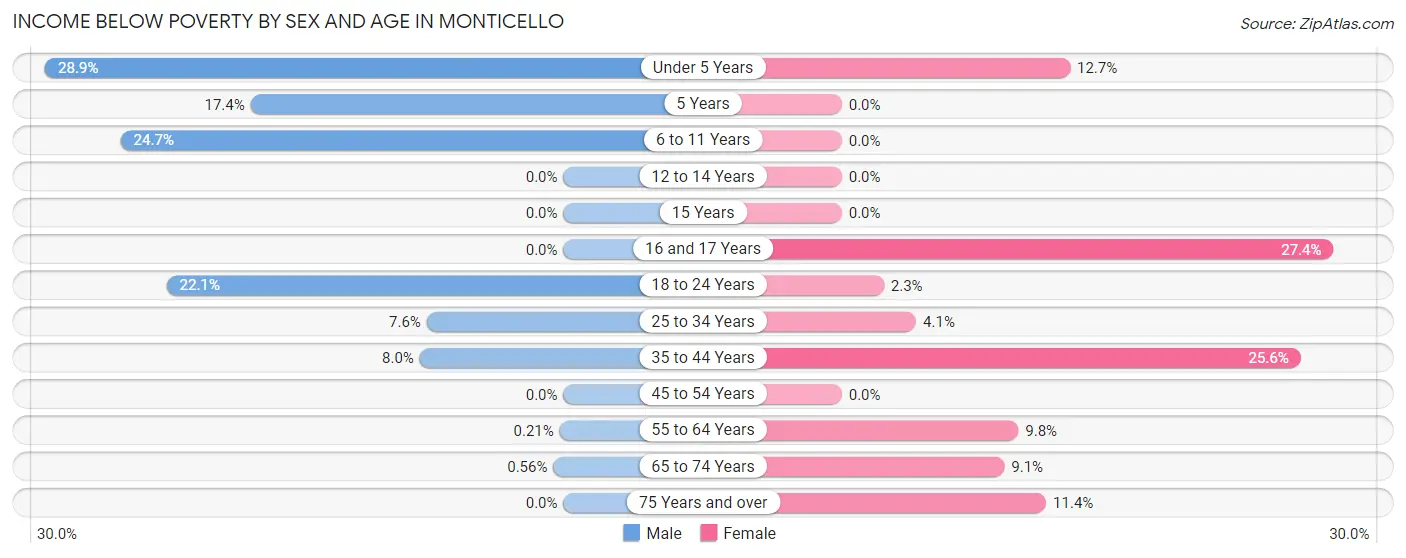
| Age Bracket | Male | Female |
| Under 5 Years | 43 (28.9%) | 30 (12.7%) |
| 5 Years | 27 (17.4%) | 0 (0.0%) |
| 6 to 11 Years | 35 (24.6%) | 0 (0.0%) |
| 12 to 14 Years | 0 (0.0%) | 0 (0.0%) |
| 15 Years | 0 (0.0%) | 0 (0.0%) |
| 16 and 17 Years | 0 (0.0%) | 26 (27.4%) |
| 18 to 24 Years | 36 (22.1%) | 5 (2.3%) |
| 25 to 34 Years | 37 (7.6%) | 19 (4.1%) |
| 35 to 44 Years | 28 (8.0%) | 105 (25.6%) |
| 45 to 54 Years | 0 (0.0%) | 0 (0.0%) |
| 55 to 64 Years | 1 (0.2%) | 57 (9.8%) |
| 65 to 74 Years | 2 (0.6%) | 39 (9.0%) |
| 75 Years and over | 0 (0.0%) | 43 (11.4%) |
| Total | 209 (7.0%) | 324 (9.7%) |
Income Above Poverty by Sex and Age in Monticello
According to the poverty statistics in Monticello, males aged 12 to 14 years and females aged 5 years are the age groups that are most secure financially, with 100.0% of males and 100.0% of females in these age groups living above the poverty line.
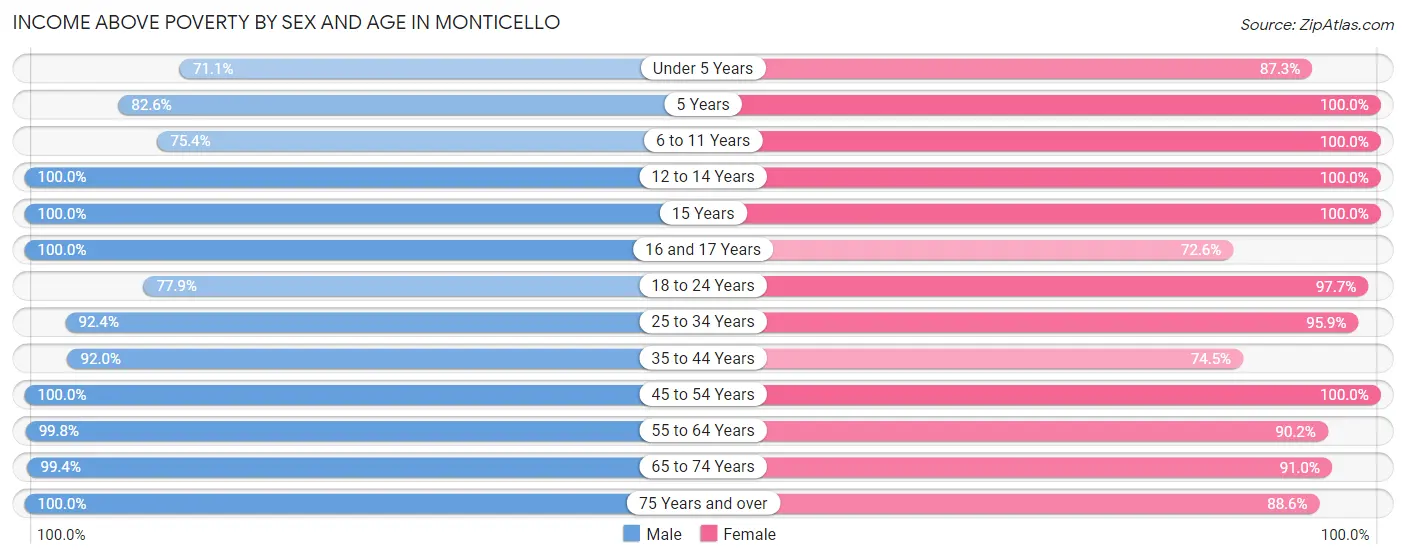
| Age Bracket | Male | Female |
| Under 5 Years | 106 (71.1%) | 206 (87.3%) |
| 5 Years | 128 (82.6%) | 29 (100.0%) |
| 6 to 11 Years | 107 (75.3%) | 278 (100.0%) |
| 12 to 14 Years | 79 (100.0%) | 31 (100.0%) |
| 15 Years | 106 (100.0%) | 24 (100.0%) |
| 16 and 17 Years | 18 (100.0%) | 69 (72.6%) |
| 18 to 24 Years | 127 (77.9%) | 209 (97.7%) |
| 25 to 34 Years | 449 (92.4%) | 440 (95.9%) |
| 35 to 44 Years | 322 (92.0%) | 306 (74.5%) |
| 45 to 54 Years | 219 (100.0%) | 179 (100.0%) |
| 55 to 64 Years | 467 (99.8%) | 523 (90.2%) |
| 65 to 74 Years | 354 (99.4%) | 392 (90.9%) |
| 75 Years and over | 281 (100.0%) | 335 (88.6%) |
| Total | 2,763 (93.0%) | 3,021 (90.3%) |
Income Below Poverty Among Married-Couple Families in Monticello
The poverty statistics for married-couple families in Monticello show that 2.7% or 39 of the total 1,453 families live below the poverty line. Families with 1 or 2 children have the highest poverty rate of 8.7%, comprising of 39 families. On the other hand, families with no children have the lowest poverty rate of 0.0%, which includes 0 families.
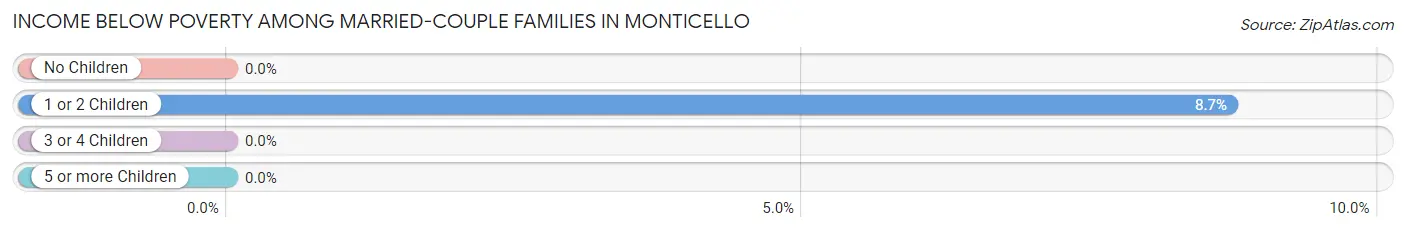
| Children | Above Poverty | Below Poverty |
| No Children | 883 (100.0%) | 0 (0.0%) |
| 1 or 2 Children | 409 (91.3%) | 39 (8.7%) |
| 3 or 4 Children | 122 (100.0%) | 0 (0.0%) |
| 5 or more Children | 0 (0.0%) | 0 (0.0%) |
| Total | 1,414 (97.3%) | 39 (2.7%) |
Income Below Poverty Among Single-Parent Households in Monticello
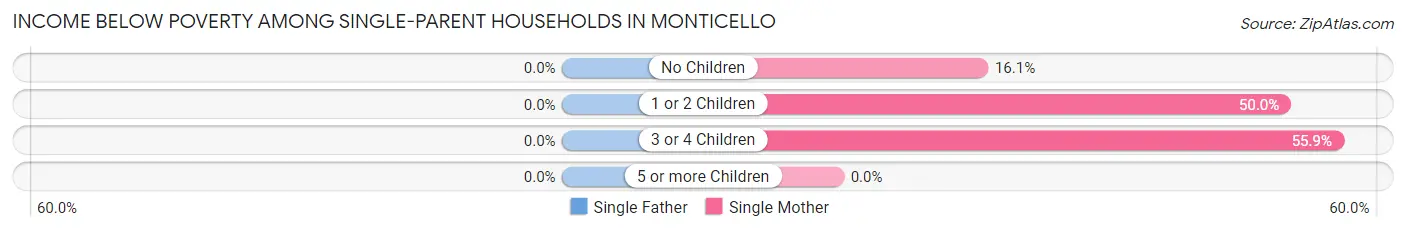
| Children | Single Father | Single Mother |
| No Children | 0 (0.0%) | 25 (16.1%) |
| 1 or 2 Children | 0 (0.0%) | 18 (50.0%) |
| 3 or 4 Children | 0 (0.0%) | 19 (55.9%) |
| 5 or more Children | 0 (0.0%) | 0 (0.0%) |
| Total | 0 (0.0%) | 62 (27.6%) |
Income Below Poverty Among Married-Couple vs Single-Parent Households in Monticello
The poverty data for Monticello shows that 39 of the married-couple family households (2.7%) and 62 of the single-parent households (21.0%) are living below the poverty level. Within the married-couple family households, those with 1 or 2 children have the highest poverty rate, with 39 households (8.7%) falling below the poverty line. Among the single-parent households, those with 3 or 4 children have the highest poverty rate, with 19 household (55.9%) living below poverty.
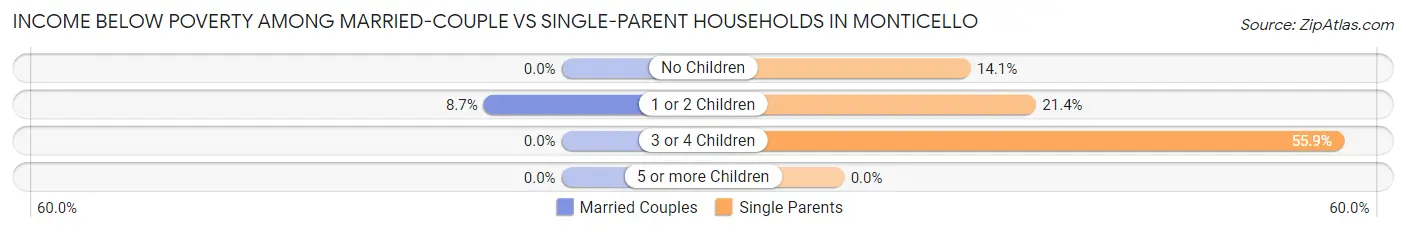
| Children | Married-Couple Families | Single-Parent Households |
| No Children | 0 (0.0%) | 25 (14.1%) |
| 1 or 2 Children | 39 (8.7%) | 18 (21.4%) |
| 3 or 4 Children | 0 (0.0%) | 19 (55.9%) |
| 5 or more Children | 0 (0.0%) | 0 (0.0%) |
| Total | 39 (2.7%) | 62 (21.0%) |
Race in Monticello
The most populous races in Monticello are White / Caucasian (6,085 | 96.0%), Two or more Races (167 | 2.6%), and Hispanic or Latino (105 | 1.7%).
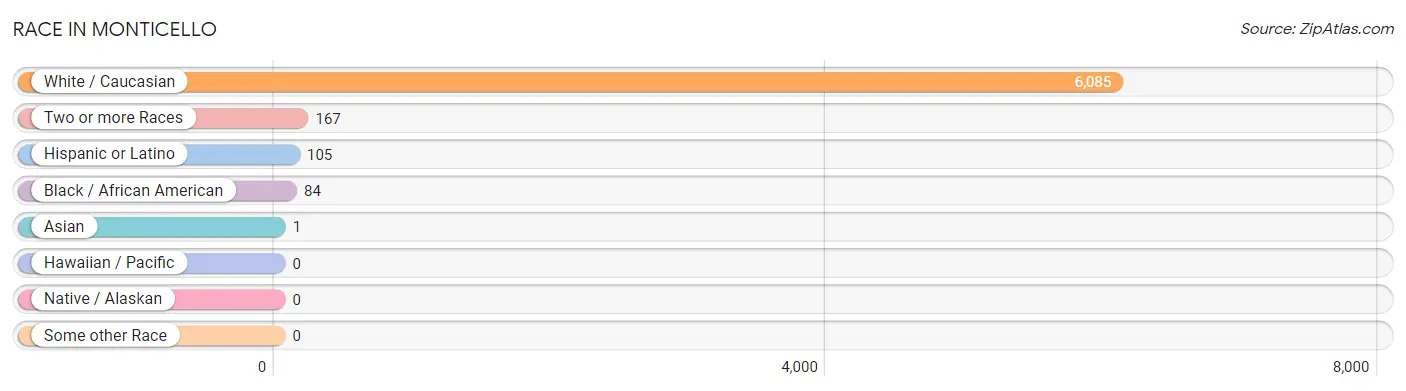
| Race | # Population | % Population |
| Asian | 1 | 0.0% |
| Black / African American | 84 | 1.3% |
| Hawaiian / Pacific | 0 | 0.0% |
| Hispanic or Latino | 105 | 1.7% |
| Native / Alaskan | 0 | 0.0% |
| White / Caucasian | 6,085 | 96.0% |
| Two or more Races | 167 | 2.6% |
| Some other Race | 0 | 0.0% |
| Total | 6,337 | 100.0% |
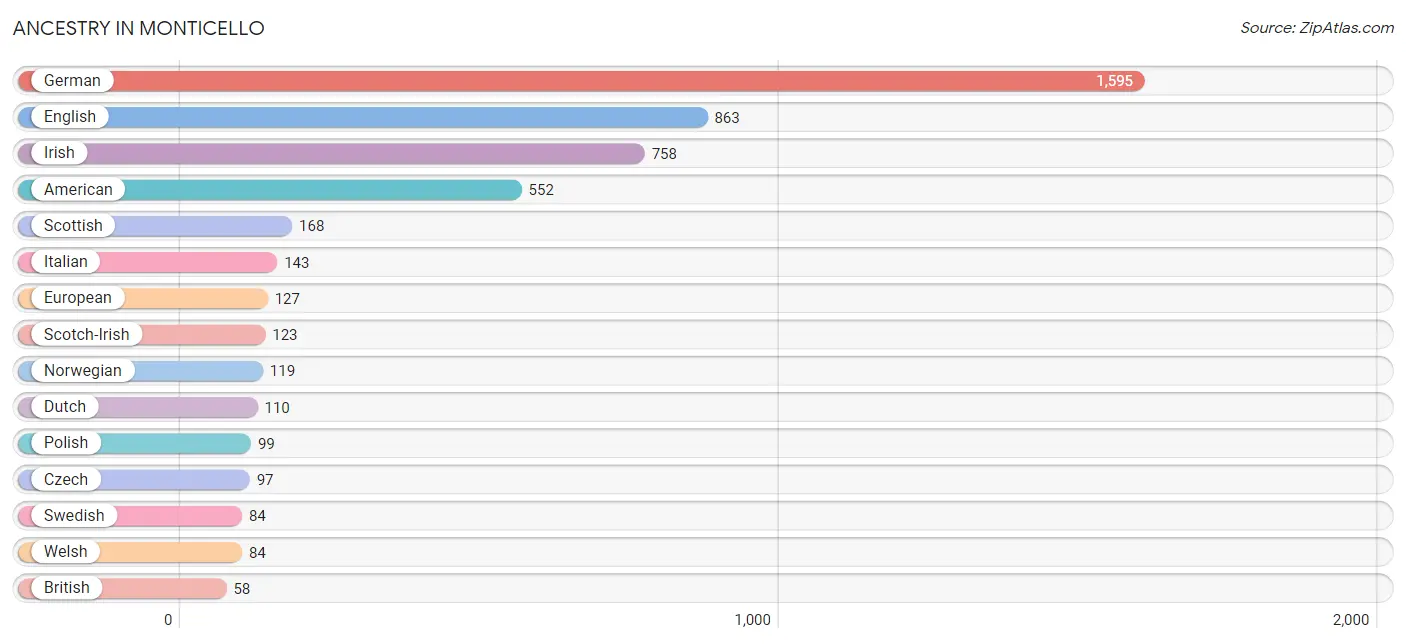
Ancestry in Monticello
The most populous ancestries reported in Monticello are German (1,595 | 25.2%), English (863 | 13.6%), Irish (758 | 12.0%), American (552 | 8.7%), and Scottish (168 | 2.6%), together accounting for 62.1% of all Monticello residents.
| Ancestry | # Population | % Population |
| Alsatian | 15 | 0.2% |
| American | 552 | 8.7% |
| Austrian | 30 | 0.5% |
| Bhutanese | 1 | 0.0% |
| British | 58 | 0.9% |
| Canadian | 16 | 0.3% |
| Central American Indian | 50 | 0.8% |
| Czech | 97 | 1.5% |
| Czechoslovakian | 16 | 0.3% |
| Dutch | 110 | 1.7% |
| English | 863 | 13.6% |
| European | 127 | 2.0% |
| French | 36 | 0.6% |
| German | 1,595 | 25.2% |
| Greek | 30 | 0.5% |
| Hungarian | 41 | 0.6% |
| Irish | 758 | 12.0% |
| Italian | 143 | 2.3% |
| Mexican | 34 | 0.5% |
| Norwegian | 119 | 1.9% |
| Polish | 99 | 1.6% |
| Portuguese | 46 | 0.7% |
| Puerto Rican | 50 | 0.8% |
| Russian | 47 | 0.7% |
| Scotch-Irish | 123 | 1.9% |
| Scottish | 168 | 2.6% |
| Spaniard | 21 | 0.3% |
| Swedish | 84 | 1.3% |
| Swiss | 26 | 0.4% |
| Welsh | 84 | 1.3% | View All 30 Rows |
Immigrants in Monticello
The most numerous immigrant groups reported in Monticello came from Europe (21 | 0.3%), Southern Europe (21 | 0.3%), and Spain (21 | 0.3%), together accounting for 1.0% of all Monticello residents.
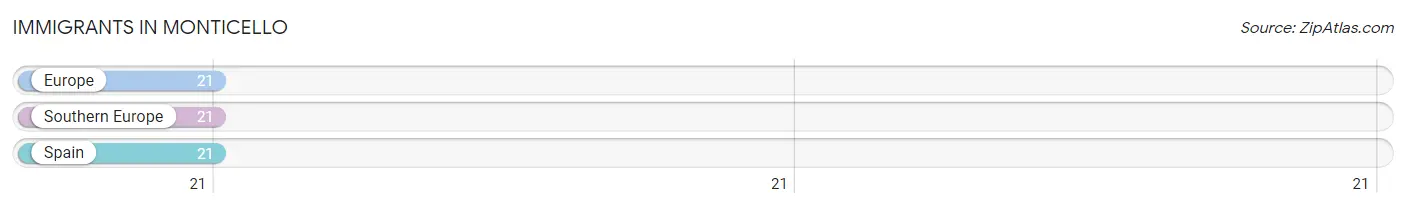
| Immigration Origin | # Population | % Population |
| Europe | 21 | 0.3% |
| Southern Europe | 21 | 0.3% |
| Spain | 21 | 0.3% | View All 3 Rows |
Sex and Age in Monticello
Sex and Age in Monticello
The most populous age groups in Monticello are 5 to 9 Years (297 | 10.0%) for men and 60 to 64 Years (302 | 9.0%) for women.
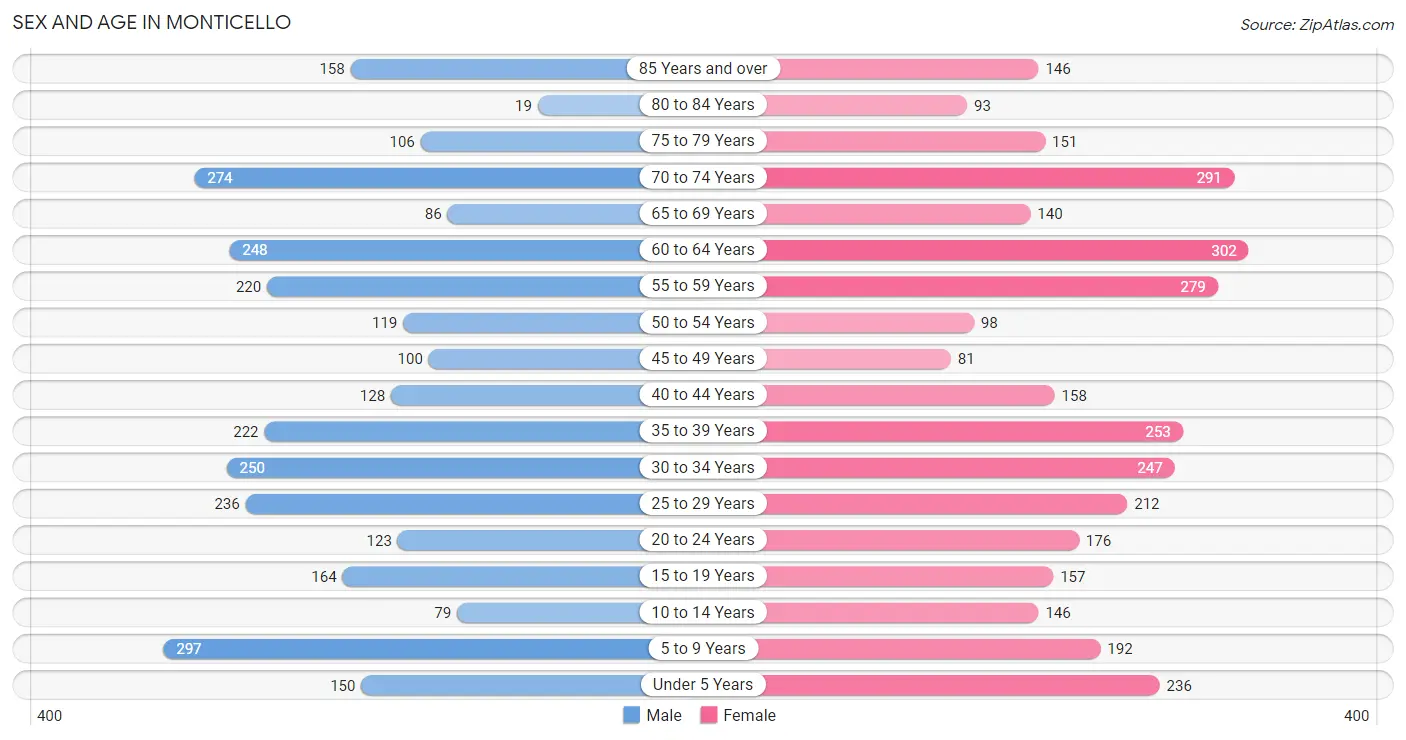
| Age Bracket | Male | Female |
| Under 5 Years | 150 (5.0%) | 236 (7.0%) |
| 5 to 9 Years | 297 (10.0%) | 192 (5.7%) |
| 10 to 14 Years | 79 (2.6%) | 146 (4.3%) |
| 15 to 19 Years | 164 (5.5%) | 157 (4.7%) |
| 20 to 24 Years | 123 (4.1%) | 176 (5.2%) |
| 25 to 29 Years | 236 (7.9%) | 212 (6.3%) |
| 30 to 34 Years | 250 (8.4%) | 247 (7.4%) |
| 35 to 39 Years | 222 (7.4%) | 253 (7.5%) |
| 40 to 44 Years | 128 (4.3%) | 158 (4.7%) |
| 45 to 49 Years | 100 (3.4%) | 81 (2.4%) |
| 50 to 54 Years | 119 (4.0%) | 98 (2.9%) |
| 55 to 59 Years | 220 (7.4%) | 279 (8.3%) |
| 60 to 64 Years | 248 (8.3%) | 302 (9.0%) |
| 65 to 69 Years | 86 (2.9%) | 140 (4.2%) |
| 70 to 74 Years | 274 (9.2%) | 291 (8.7%) |
| 75 to 79 Years | 106 (3.6%) | 151 (4.5%) |
| 80 to 84 Years | 19 (0.6%) | 93 (2.8%) |
| 85 Years and over | 158 (5.3%) | 146 (4.3%) |
| Total | 2,979 (100.0%) | 3,358 (100.0%) |
Families and Households in Monticello
Median Family Size in Monticello
The median family size in Monticello is 2.90 persons per family, with single female/mother families (225 | 12.9%) accounting for the largest median family size of 2.96 persons per family. On the other hand, single male/father families (70 | 4.0%) represent the smallest median family size with 2.19 persons per family.
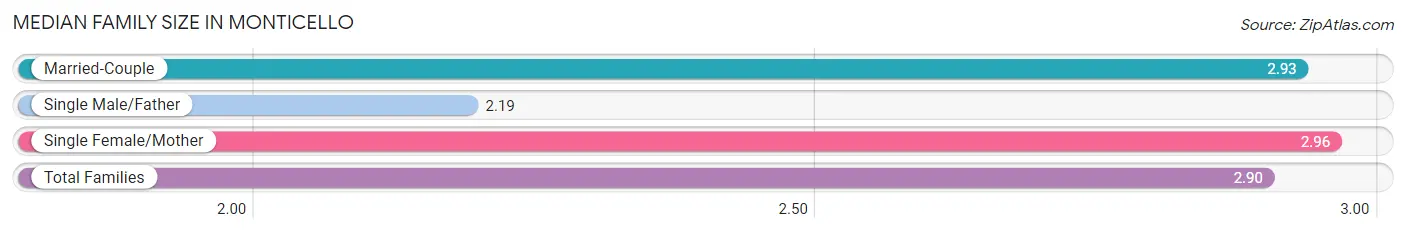
| Family Type | # Families | Family Size |
| Married-Couple | 1,453 (83.1%) | 2.93 |
| Single Male/Father | 70 (4.0%) | 2.19 |
| Single Female/Mother | 225 (12.9%) | 2.96 |
| Total Families | 1,748 (100.0%) | 2.90 |
Median Household Size in Monticello
The median household size in Monticello is 2.38 persons per household, with single female/mother households (225 | 8.5%) accounting for the largest median household size of 3.21 persons per household. non-family households (888 | 33.7%) represent the smallest median household size with 1.18 persons per household.
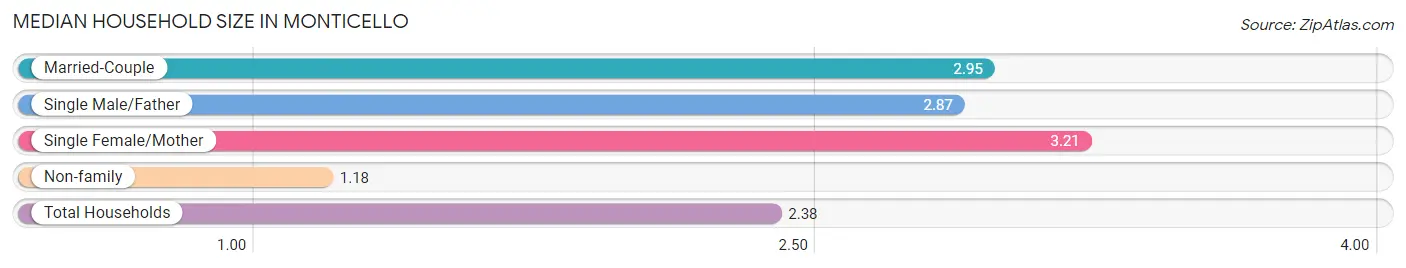
| Household Type | # Households | Household Size |
| Married-Couple | 1,453 (55.1%) | 2.95 |
| Single Male/Father | 70 (2.7%) | 2.87 |
| Single Female/Mother | 225 (8.5%) | 3.21 |
| Non-family | 888 (33.7%) | 1.18 |
| Total Households | 2,636 (100.0%) | 2.38 |
Household Size by Marriage Status in Monticello
Out of a total of 2,636 households in Monticello, 1,748 (66.3%) are family households, while 888 (33.7%) are nonfamily households. The most numerous type of family households are 2-person households, comprising 872, and the most common type of nonfamily households are 1-person households, comprising 798.
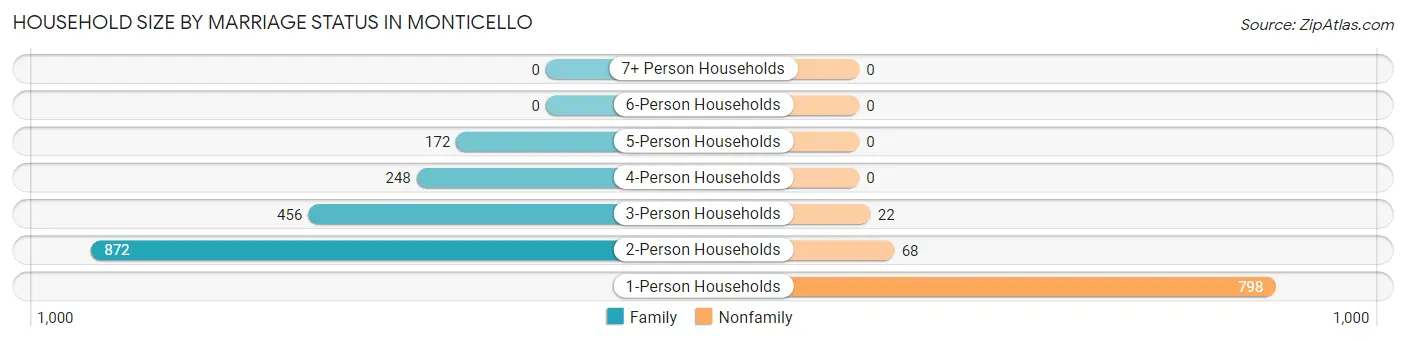
| Household Size | Family Households | Nonfamily Households |
| 1-Person Households | - | 798 (30.3%) |
| 2-Person Households | 872 (33.1%) | 68 (2.6%) |
| 3-Person Households | 456 (17.3%) | 22 (0.8%) |
| 4-Person Households | 248 (9.4%) | 0 (0.0%) |
| 5-Person Households | 172 (6.5%) | 0 (0.0%) |
| 6-Person Households | 0 (0.0%) | 0 (0.0%) |
| 7+ Person Households | 0 (0.0%) | 0 (0.0%) |
| Total | 1,748 (66.3%) | 888 (33.7%) |
Female Fertility in Monticello
Fertility by Age in Monticello
Average fertility rate in Monticello is 15.0 births per 1,000 women. Women in the age bracket of 20 to 34 years have the highest fertility rate with 30.0 births per 1,000 women. Women in the age bracket of 20 to 34 years acount for 100.0% of all women with births.
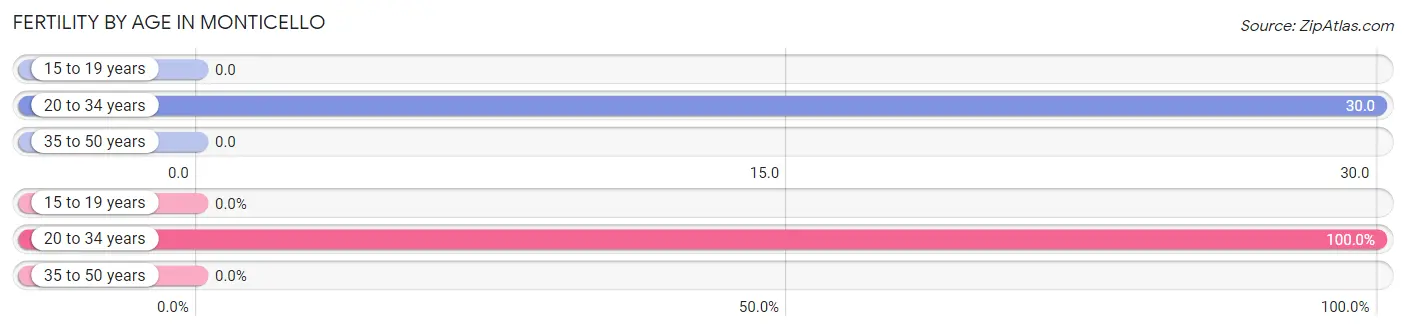
| Age Bracket | Women with Births | Births / 1,000 Women |
| 15 to 19 years | 0 (0.0%) | 0.0 |
| 20 to 34 years | 19 (100.0%) | 30.0 |
| 35 to 50 years | 0 (0.0%) | 0.0 |
| Total | 19 (100.0%) | 15.0 |
Fertility by Age by Marriage Status in Monticello
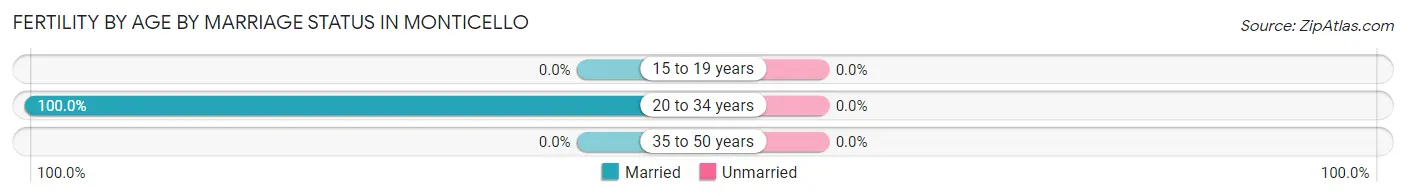
| Age Bracket | Married | Unmarried |
| 15 to 19 years | 0 (0.0%) | 0 (0.0%) |
| 20 to 34 years | 19 (100.0%) | 0 (0.0%) |
| 35 to 50 years | 0 (0.0%) | 0 (0.0%) |
| Total | 19 (100.0%) | 0 (0.0%) |
Fertility by Education in Monticello
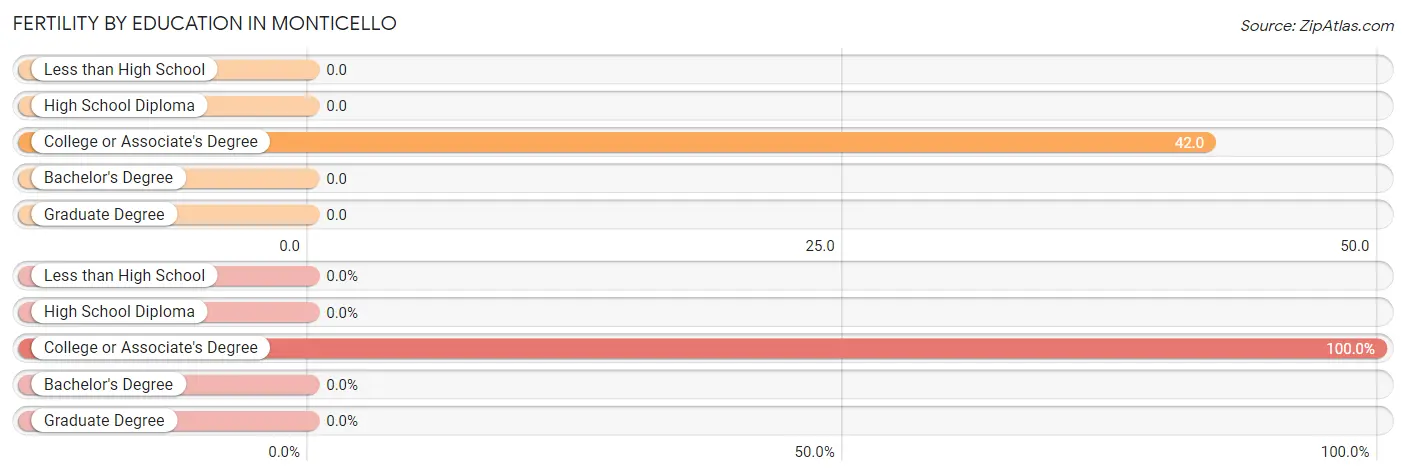
| Educational Attainment | Women with Births | Births / 1,000 Women |
| Less than High School | 0 (0.0%) | 0.0 |
| High School Diploma | 0 (0.0%) | 0.0 |
| College or Associate's Degree | 19 (100.0%) | 42.0 |
| Bachelor's Degree | 0 (0.0%) | 0.0 |
| Graduate Degree | 0 (0.0%) | 0.0 |
| Total | 19 (100.0%) | 15.0 |
Fertility by Education by Marriage Status in Monticello
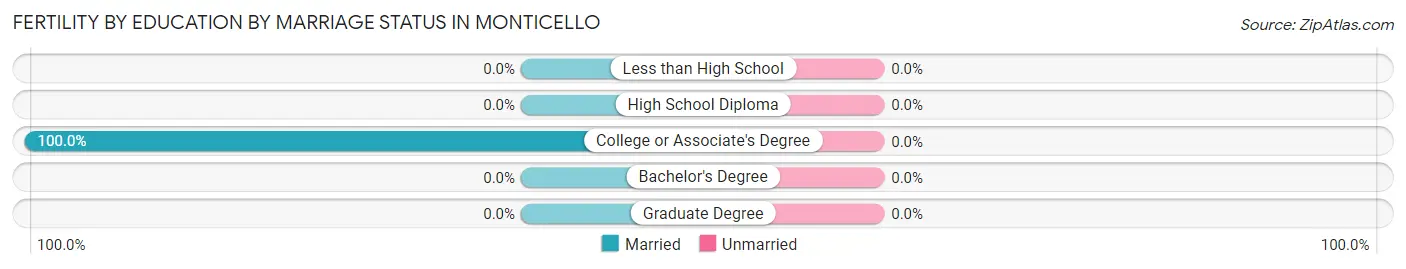
| Educational Attainment | Married | Unmarried |
| Less than High School | 0 (0.0%) | 0 (0.0%) |
| High School Diploma | 0 (0.0%) | 0 (0.0%) |
| College or Associate's Degree | 19 (100.0%) | 0 (0.0%) |
| Bachelor's Degree | 0 (0.0%) | 0 (0.0%) |
| Graduate Degree | 0 (0.0%) | 0 (0.0%) |
| Total | 19 (100.0%) | 0 (0.0%) |
Employment Characteristics in Monticello
Employment by Class of Employer in Monticello
Among the 3,142 employed individuals in Monticello, private company employees (1,757 | 55.9%), not-for-profit organizations (428 | 13.6%), and state government employees (407 | 13.0%) make up the most common classes of employment.
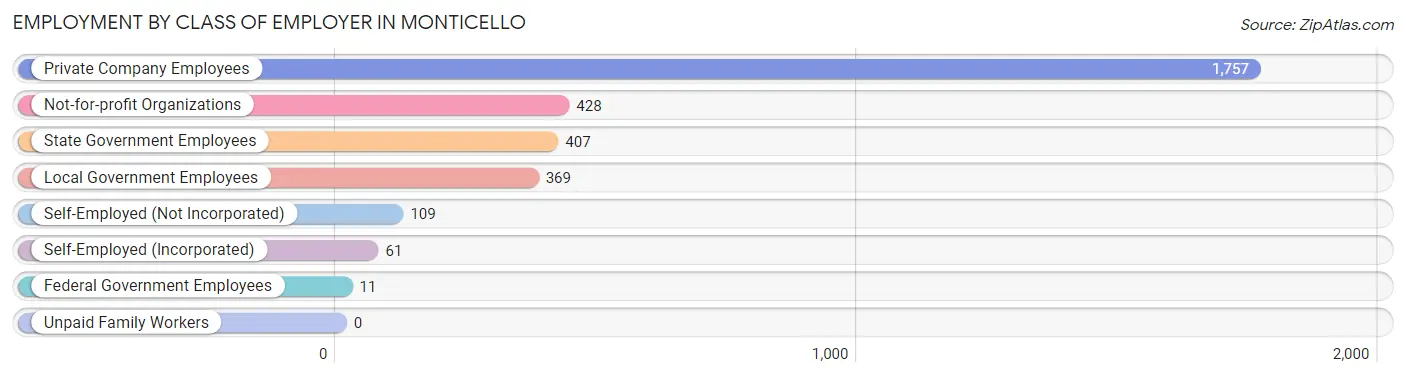
| Employer Class | # Employees | % Employees |
| Private Company Employees | 1,757 | 55.9% |
| Self-Employed (Incorporated) | 61 | 1.9% |
| Self-Employed (Not Incorporated) | 109 | 3.5% |
| Not-for-profit Organizations | 428 | 13.6% |
| Local Government Employees | 369 | 11.7% |
| State Government Employees | 407 | 13.0% |
| Federal Government Employees | 11 | 0.4% |
| Unpaid Family Workers | 0 | 0.0% |
| Total | 3,142 | 100.0% |
Employment Status by Age in Monticello
According to the labor force statistics for Monticello, out of the total population over 16 years of age (5,107), 62.8% or 3,207 individuals are in the labor force, with 1.7% or 55 of them unemployed. The age group with the highest labor force participation rate is 45 to 54 years, with 99.7% or 397 individuals in the labor force. Within the labor force, the 45 to 54 years age range has the highest percentage of unemployed individuals, with 4.0% or 16 of them being unemployed.
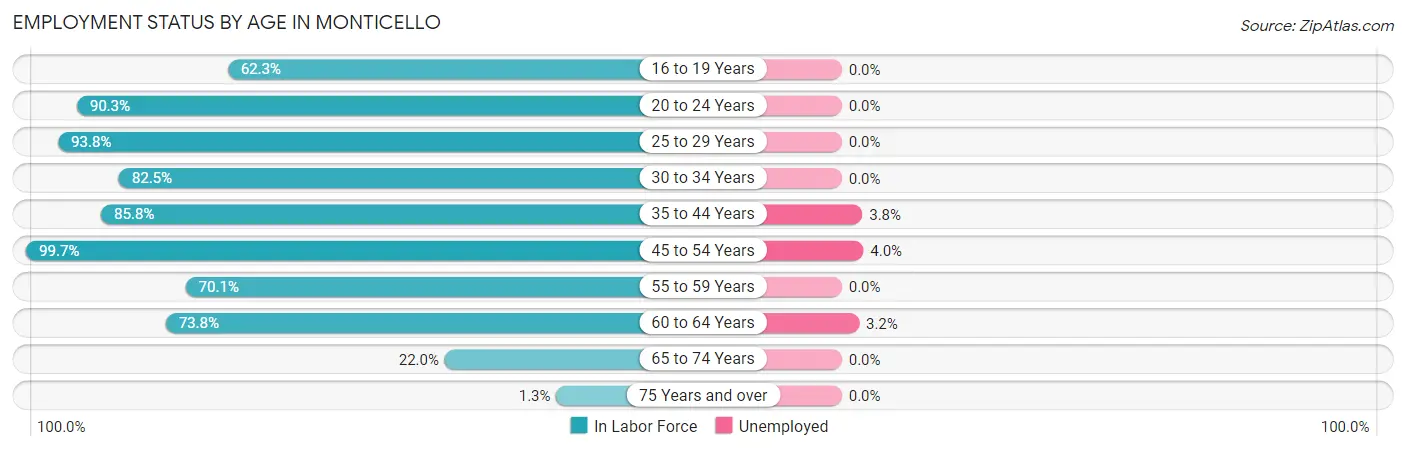
| Age Bracket | In Labor Force | Unemployed |
| 16 to 19 Years | 119 (62.3%) | 0 (0.0%) |
| 20 to 24 Years | 270 (90.3%) | 0 (0.0%) |
| 25 to 29 Years | 420 (93.8%) | 0 (0.0%) |
| 30 to 34 Years | 410 (82.5%) | 0 (0.0%) |
| 35 to 44 Years | 653 (85.8%) | 25 (3.8%) |
| 45 to 54 Years | 397 (99.7%) | 16 (4.0%) |
| 55 to 59 Years | 350 (70.1%) | 0 (0.0%) |
| 60 to 64 Years | 406 (73.8%) | 13 (3.2%) |
| 65 to 74 Years | 174 (22.0%) | 0 (0.0%) |
| 75 Years and over | 9 (1.3%) | 0 (0.0%) |
| Total | 3,207 (62.8%) | 55 (1.7%) |
Employment Status by Educational Attainment in Monticello
According to labor force statistics for Monticello, 83.6% of individuals (2,636) out of the total population between 25 and 64 years of age (3,153) are in the labor force, with 2.0% or 53 of them being unemployed. The group with the highest labor force participation rate are those with the educational attainment of college / associate degree, with 92.2% or 880 individuals in the labor force. Within the labor force, individuals with high school diploma education have the highest percentage of unemployment, with 6.2% or 25 of them being unemployed.
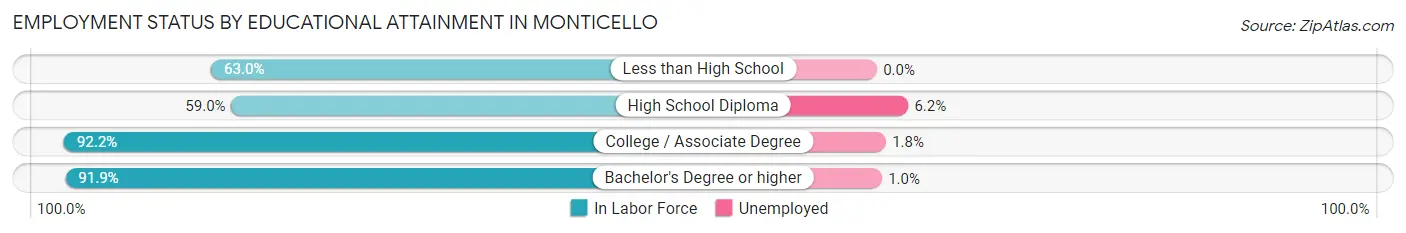
| Educational Attainment | In Labor Force | Unemployed |
| Less than High School | 87 (63.0%) | 0 (0.0%) |
| High School Diploma | 405 (59.0%) | 43 (6.2%) |
| College / Associate Degree | 880 (92.2%) | 17 (1.8%) |
| Bachelor's Degree or higher | 1,264 (91.9%) | 14 (1.0%) |
| Total | 2,636 (83.6%) | 63 (2.0%) |
Employment Occupations by Sex in Monticello
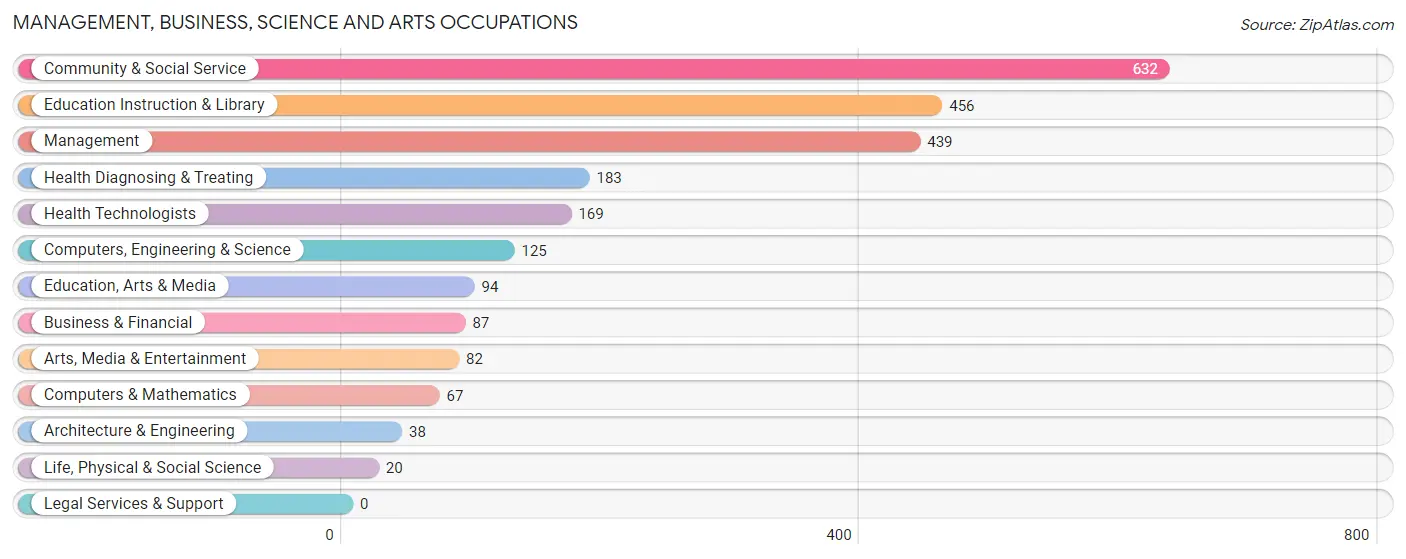
Management, Business, Science and Arts Occupations
The most common Management, Business, Science and Arts occupations in Monticello are Community & Social Service (632 | 20.0%), Education Instruction & Library (456 | 14.5%), Management (439 | 13.9%), Health Diagnosing & Treating (183 | 5.8%), and Health Technologists (169 | 5.4%).
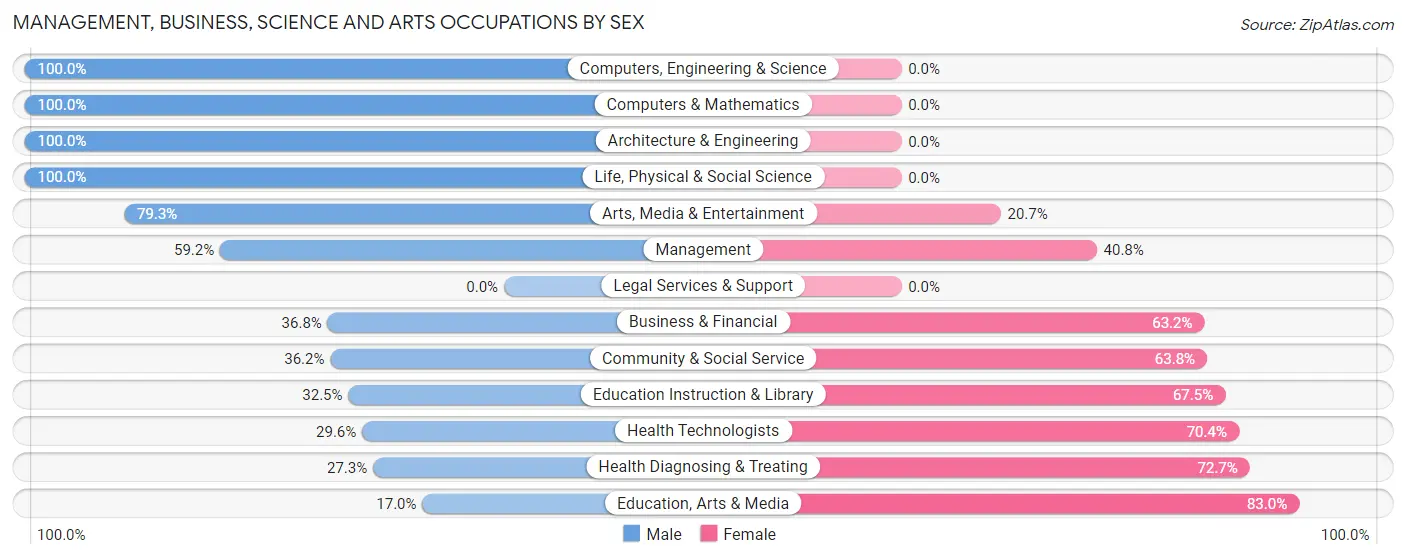
Management, Business, Science and Arts Occupations by Sex
Within the Management, Business, Science and Arts occupations in Monticello, the most male-oriented occupations are Computers, Engineering & Science (100.0%), Computers & Mathematics (100.0%), and Architecture & Engineering (100.0%), while the most female-oriented occupations are Education, Arts & Media (83.0%), Health Diagnosing & Treating (72.7%), and Health Technologists (70.4%).
| Occupation | Male | Female |
| Management | 260 (59.2%) | 179 (40.8%) |
| Business & Financial | 32 (36.8%) | 55 (63.2%) |
| Computers, Engineering & Science | 125 (100.0%) | 0 (0.0%) |
| Computers & Mathematics | 67 (100.0%) | 0 (0.0%) |
| Architecture & Engineering | 38 (100.0%) | 0 (0.0%) |
| Life, Physical & Social Science | 20 (100.0%) | 0 (0.0%) |
| Community & Social Service | 229 (36.2%) | 403 (63.8%) |
| Education, Arts & Media | 16 (17.0%) | 78 (83.0%) |
| Legal Services & Support | 0 (0.0%) | 0 (0.0%) |
| Education Instruction & Library | 148 (32.5%) | 308 (67.5%) |
| Arts, Media & Entertainment | 65 (79.3%) | 17 (20.7%) |
| Health Diagnosing & Treating | 50 (27.3%) | 133 (72.7%) |
| Health Technologists | 50 (29.6%) | 119 (70.4%) |
| Total (Category) | 696 (47.5%) | 770 (52.5%) |
| Total (Overall) | 1,647 (52.2%) | 1,507 (47.8%) |
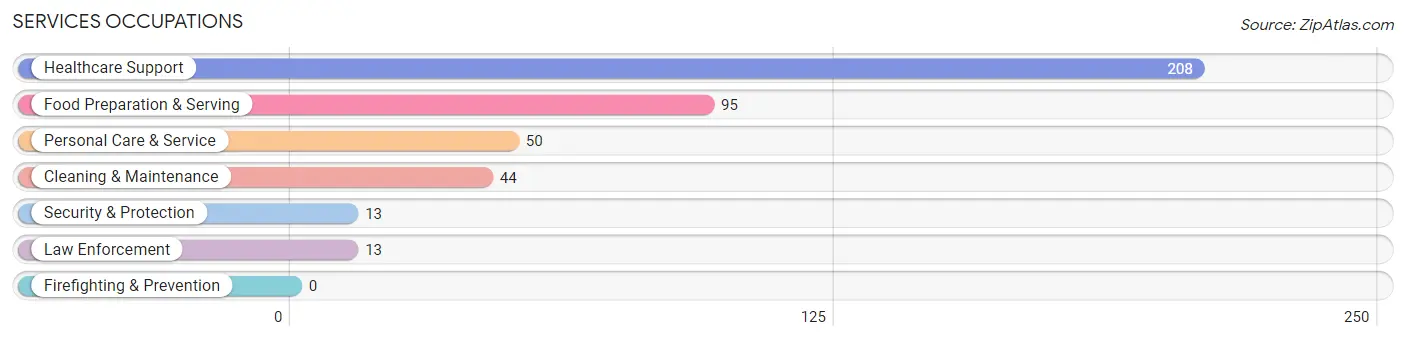
Services Occupations
The most common Services occupations in Monticello are Healthcare Support (208 | 6.6%), Food Preparation & Serving (95 | 3.0%), Personal Care & Service (50 | 1.6%), Cleaning & Maintenance (44 | 1.4%), and Security & Protection (13 | 0.4%).
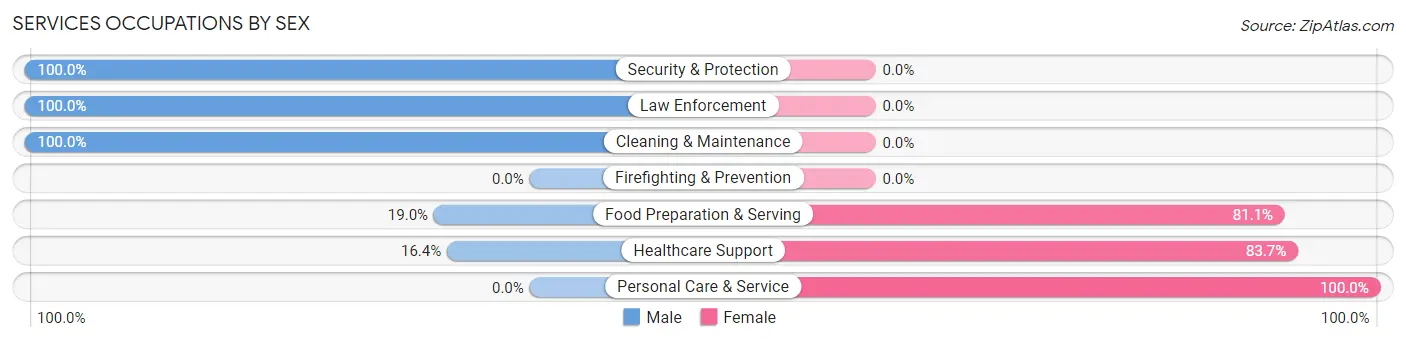
Services Occupations by Sex
Within the Services occupations in Monticello, the most male-oriented occupations are Security & Protection (100.0%), Law Enforcement (100.0%), and Cleaning & Maintenance (100.0%), while the most female-oriented occupations are Personal Care & Service (100.0%), Healthcare Support (83.7%), and Food Preparation & Serving (81.0%).
| Occupation | Male | Female |
| Healthcare Support | 34 (16.4%) | 174 (83.7%) |
| Security & Protection | 13 (100.0%) | 0 (0.0%) |
| Firefighting & Prevention | 0 (0.0%) | 0 (0.0%) |
| Law Enforcement | 13 (100.0%) | 0 (0.0%) |
| Food Preparation & Serving | 18 (19.0%) | 77 (81.0%) |
| Cleaning & Maintenance | 44 (100.0%) | 0 (0.0%) |
| Personal Care & Service | 0 (0.0%) | 50 (100.0%) |
| Total (Category) | 109 (26.6%) | 301 (73.4%) |
| Total (Overall) | 1,647 (52.2%) | 1,507 (47.8%) |
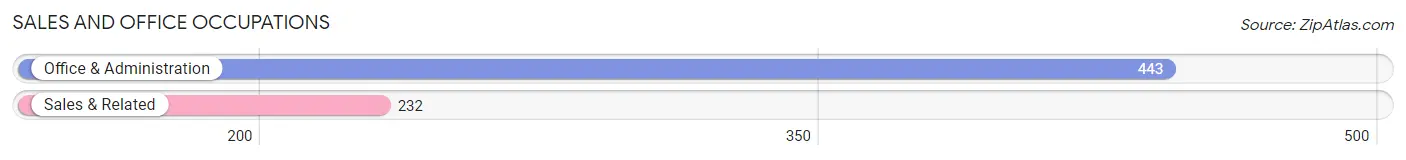
Sales and Office Occupations
The most common Sales and Office occupations in Monticello are Office & Administration (443 | 14.1%), and Sales & Related (232 | 7.4%).
Sales and Office Occupations by Sex
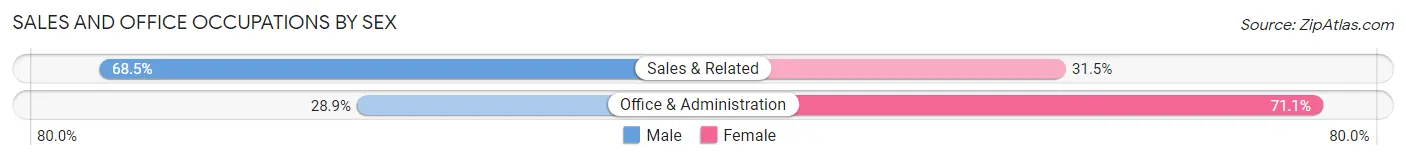
| Occupation | Male | Female |
| Sales & Related | 159 (68.5%) | 73 (31.5%) |
| Office & Administration | 128 (28.9%) | 315 (71.1%) |
| Total (Category) | 287 (42.5%) | 388 (57.5%) |
| Total (Overall) | 1,647 (52.2%) | 1,507 (47.8%) |
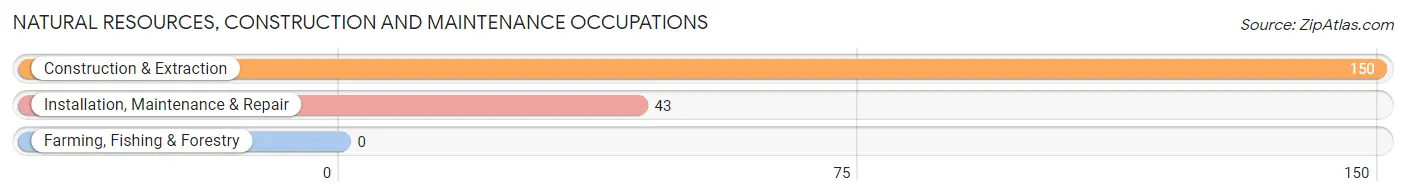
Natural Resources, Construction and Maintenance Occupations
The most common Natural Resources, Construction and Maintenance occupations in Monticello are Construction & Extraction (150 | 4.8%), and Installation, Maintenance & Repair (43 | 1.4%).
Natural Resources, Construction and Maintenance Occupations by Sex
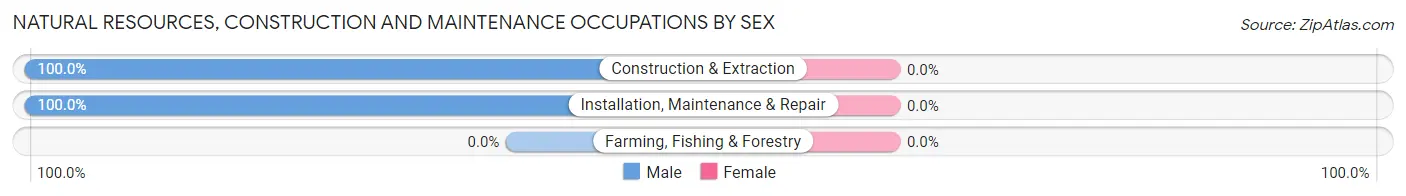
| Occupation | Male | Female |
| Farming, Fishing & Forestry | 0 (0.0%) | 0 (0.0%) |
| Construction & Extraction | 150 (100.0%) | 0 (0.0%) |
| Installation, Maintenance & Repair | 43 (100.0%) | 0 (0.0%) |
| Total (Category) | 193 (100.0%) | 0 (0.0%) |
| Total (Overall) | 1,647 (52.2%) | 1,507 (47.8%) |
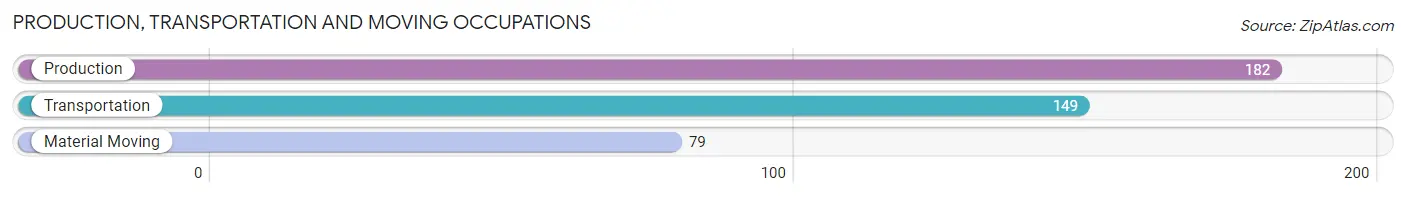
Production, Transportation and Moving Occupations
The most common Production, Transportation and Moving occupations in Monticello are Production (182 | 5.8%), Transportation (149 | 4.7%), and Material Moving (79 | 2.5%).
Production, Transportation and Moving Occupations by Sex
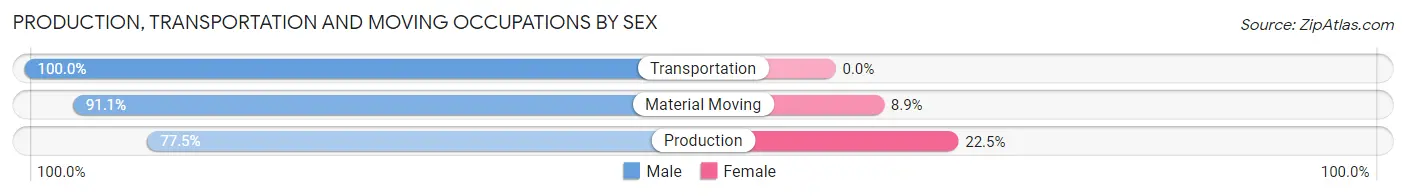
| Occupation | Male | Female |
| Production | 141 (77.5%) | 41 (22.5%) |
| Transportation | 149 (100.0%) | 0 (0.0%) |
| Material Moving | 72 (91.1%) | 7 (8.9%) |
| Total (Category) | 362 (88.3%) | 48 (11.7%) |
| Total (Overall) | 1,647 (52.2%) | 1,507 (47.8%) |
Employment Industries by Sex in Monticello
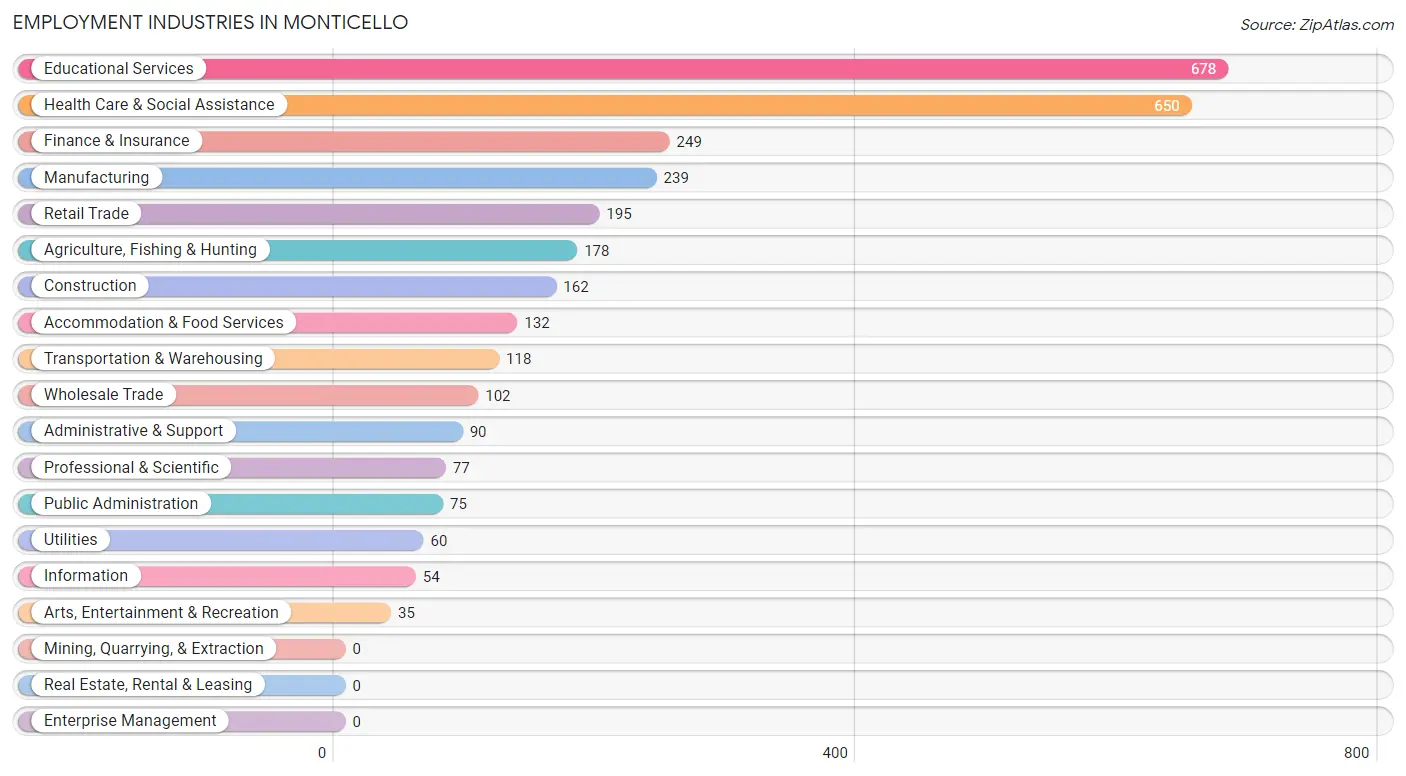
Employment Industries in Monticello
The major employment industries in Monticello include Educational Services (678 | 21.5%), Health Care & Social Assistance (650 | 20.6%), Finance & Insurance (249 | 7.9%), Manufacturing (239 | 7.6%), and Retail Trade (195 | 6.2%).
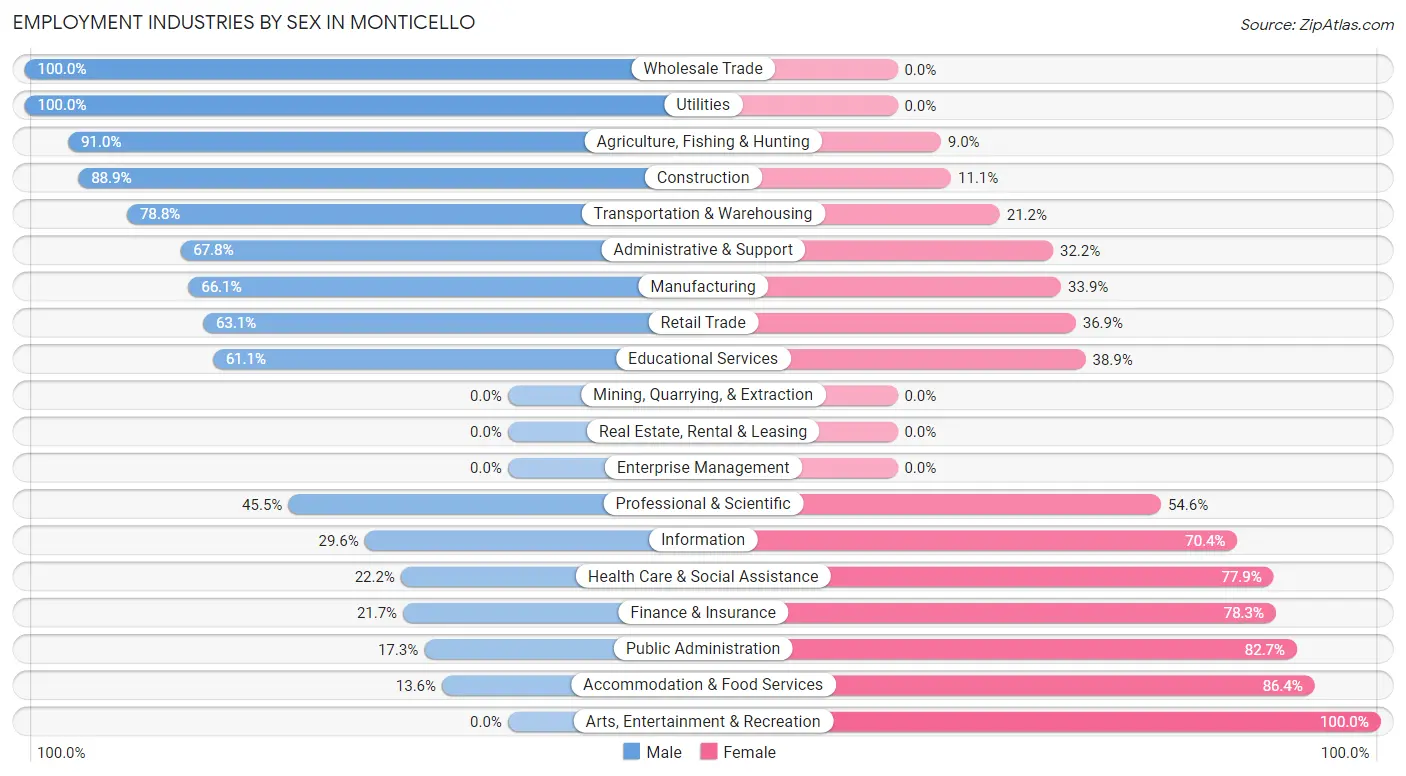
Employment Industries by Sex in Monticello
The Monticello industries that see more men than women are Wholesale Trade (100.0%), Utilities (100.0%), and Agriculture, Fishing & Hunting (91.0%), whereas the industries that tend to have a higher number of women are Arts, Entertainment & Recreation (100.0%), Accommodation & Food Services (86.4%), and Public Administration (82.7%).
| Industry | Male | Female |
| Agriculture, Fishing & Hunting | 162 (91.0%) | 16 (9.0%) |
| Mining, Quarrying, & Extraction | 0 (0.0%) | 0 (0.0%) |
| Construction | 144 (88.9%) | 18 (11.1%) |
| Manufacturing | 158 (66.1%) | 81 (33.9%) |
| Wholesale Trade | 102 (100.0%) | 0 (0.0%) |
| Retail Trade | 123 (63.1%) | 72 (36.9%) |
| Transportation & Warehousing | 93 (78.8%) | 25 (21.2%) |
| Utilities | 60 (100.0%) | 0 (0.0%) |
| Information | 16 (29.6%) | 38 (70.4%) |
| Finance & Insurance | 54 (21.7%) | 195 (78.3%) |
| Real Estate, Rental & Leasing | 0 (0.0%) | 0 (0.0%) |
| Professional & Scientific | 35 (45.5%) | 42 (54.5%) |
| Enterprise Management | 0 (0.0%) | 0 (0.0%) |
| Administrative & Support | 61 (67.8%) | 29 (32.2%) |
| Educational Services | 414 (61.1%) | 264 (38.9%) |
| Health Care & Social Assistance | 144 (22.2%) | 506 (77.8%) |
| Arts, Entertainment & Recreation | 0 (0.0%) | 35 (100.0%) |
| Accommodation & Food Services | 18 (13.6%) | 114 (86.4%) |
| Public Administration | 13 (17.3%) | 62 (82.7%) |
| Total | 1,647 (52.2%) | 1,507 (47.8%) |
Education in Monticello
School Enrollment in Monticello
The most common levels of schooling among the 1,144 students in Monticello are elementary school (297 | 26.0%), high school (222 | 19.4%), and middle school (218 | 19.1%).
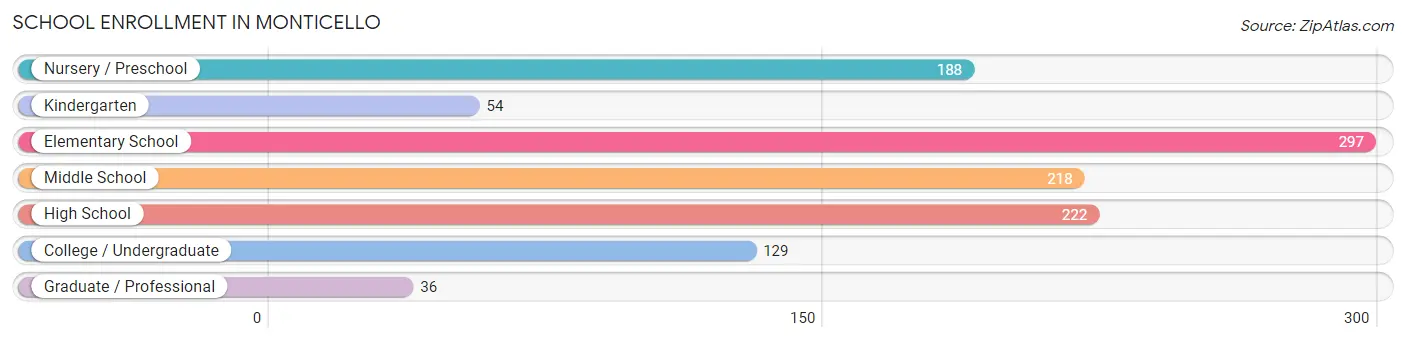
| School Level | # Students | % Students |
| Nursery / Preschool | 188 | 16.4% |
| Kindergarten | 54 | 4.7% |
| Elementary School | 297 | 26.0% |
| Middle School | 218 | 19.1% |
| High School | 222 | 19.4% |
| College / Undergraduate | 129 | 11.3% |
| Graduate / Professional | 36 | 3.2% |
| Total | 1,144 | 100.0% |
School Enrollment by Age by Funding Source in Monticello
Out of a total of 1,144 students who are enrolled in schools in Monticello, 125 (10.9%) attend a private institution, while the remaining 1,019 (89.1%) are enrolled in public schools. The age group of 35 years and over has the highest likelihood of being enrolled in private schools, with 37 (69.8% in the age bracket) enrolled. Conversely, the age group of 3 to 4 year olds has the lowest likelihood of being enrolled in a private school, with 62 (100.0% in the age bracket) attending a public institution.
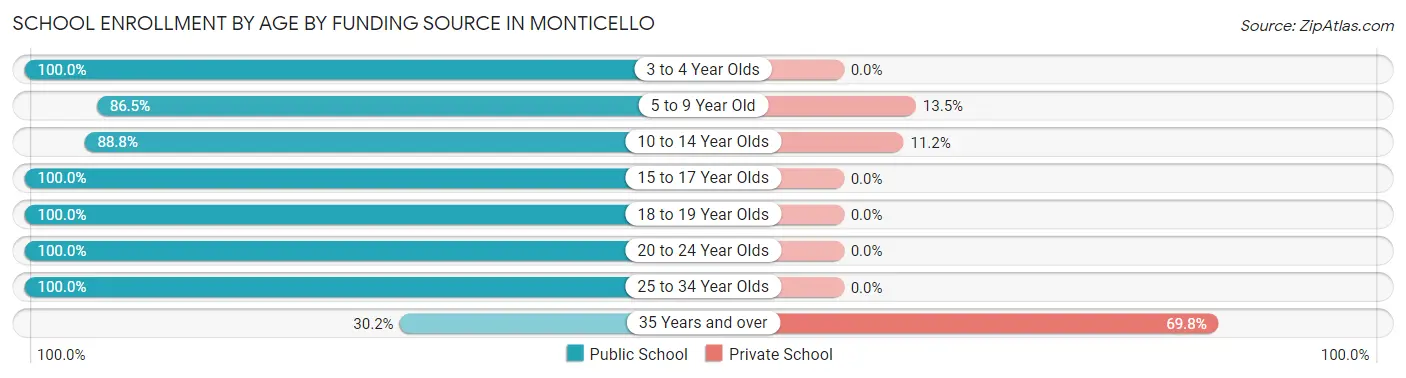
| Age Bracket | Public School | Private School |
| 3 to 4 Year Olds | 62 (100.0%) | 0 (0.0%) |
| 5 to 9 Year Old | 405 (86.5%) | 63 (13.5%) |
| 10 to 14 Year Olds | 199 (88.8%) | 25 (11.2%) |
| 15 to 17 Year Olds | 225 (100.0%) | 0 (0.0%) |
| 18 to 19 Year Olds | 19 (100.0%) | 0 (0.0%) |
| 20 to 24 Year Olds | 75 (100.0%) | 0 (0.0%) |
| 25 to 34 Year Olds | 18 (100.0%) | 0 (0.0%) |
| 35 Years and over | 16 (30.2%) | 37 (69.8%) |
| Total | 1,019 (89.1%) | 125 (10.9%) |
Educational Attainment by Field of Study in Monticello
Education (418 | 22.3%), bio, nature & agricultural (263 | 14.0%), business (196 | 10.4%), social sciences (169 | 9.0%), and literature & languages (142 | 7.6%) are the most common fields of study among 1,879 individuals in Monticello who have obtained a bachelor's degree or higher.
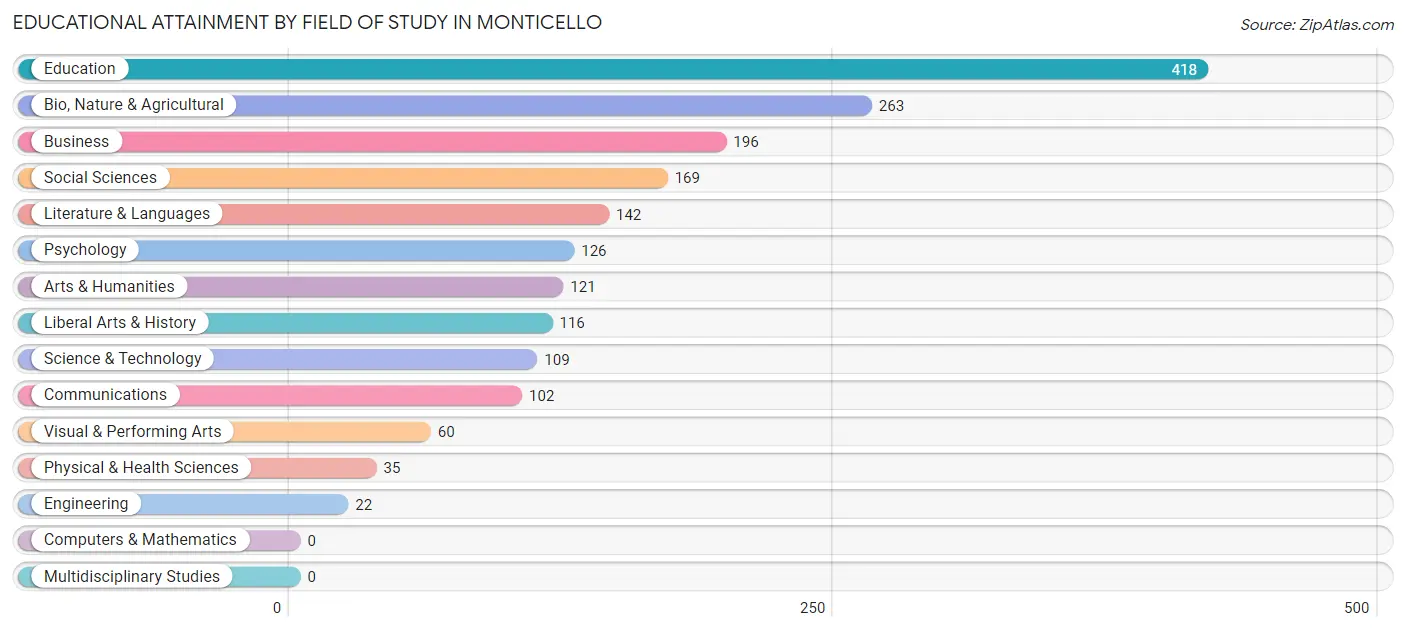
| Field of Study | # Graduates | % Graduates |
| Computers & Mathematics | 0 | 0.0% |
| Bio, Nature & Agricultural | 263 | 14.0% |
| Physical & Health Sciences | 35 | 1.9% |
| Psychology | 126 | 6.7% |
| Social Sciences | 169 | 9.0% |
| Engineering | 22 | 1.2% |
| Multidisciplinary Studies | 0 | 0.0% |
| Science & Technology | 109 | 5.8% |
| Business | 196 | 10.4% |
| Education | 418 | 22.3% |
| Literature & Languages | 142 | 7.6% |
| Liberal Arts & History | 116 | 6.2% |
| Visual & Performing Arts | 60 | 3.2% |
| Communications | 102 | 5.4% |
| Arts & Humanities | 121 | 6.4% |
| Total | 1,879 | 100.0% |
Transportation & Commute in Monticello
Vehicle Availability by Sex in Monticello
The most prevalent vehicle ownership categories in Monticello are males with 2 vehicles (891, accounting for 54.8%) and females with 2 vehicles (808, making up 59.3%).
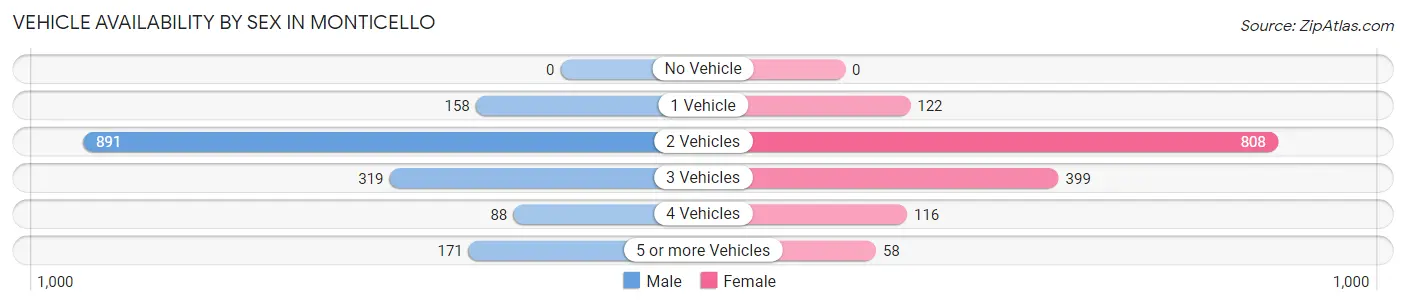
| Vehicles Available | Male | Female |
| No Vehicle | 0 (0.0%) | 0 (0.0%) |
| 1 Vehicle | 158 (9.7%) | 122 (8.1%) |
| 2 Vehicles | 891 (54.8%) | 808 (53.8%) |
| 3 Vehicles | 319 (19.6%) | 399 (26.6%) |
| 4 Vehicles | 88 (5.4%) | 116 (7.7%) |
| 5 or more Vehicles | 171 (10.5%) | 58 (3.9%) |
| Total | 1,627 (100.0%) | 1,503 (100.0%) |
Commute Time in Monticello
The most frequently occuring commute durations in Monticello are 30 to 34 minutes (729 commuters, 25.4%), 20 to 24 minutes (427 commuters, 14.8%), and less than 5 minutes (385 commuters, 13.4%).
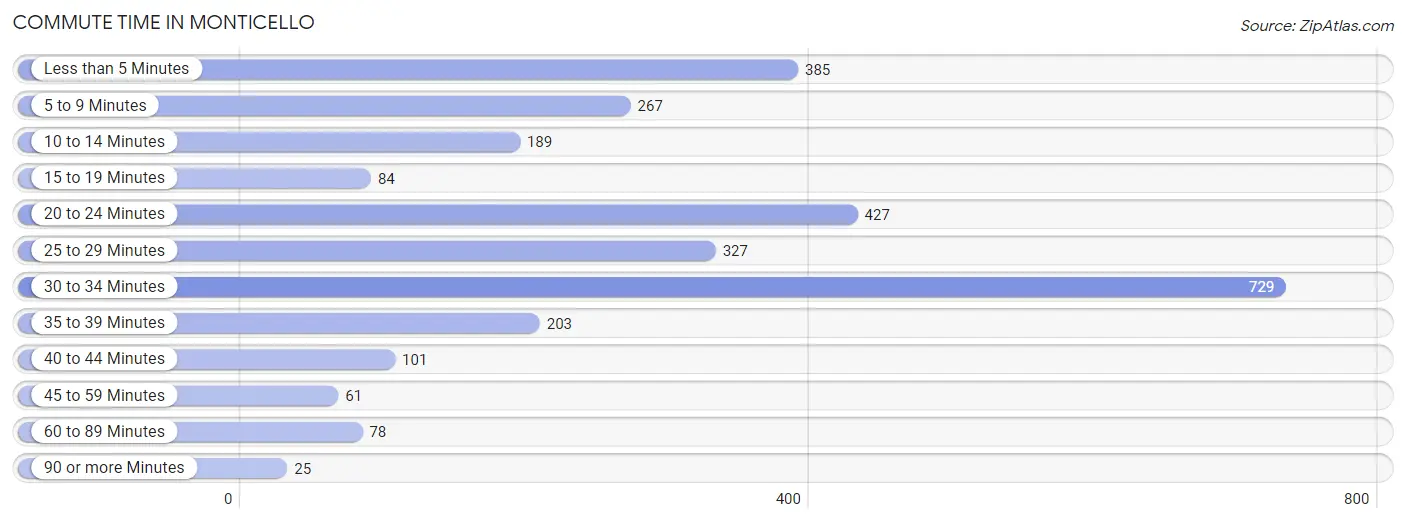
| Commute Time | # Commuters | % Commuters |
| Less than 5 Minutes | 385 | 13.4% |
| 5 to 9 Minutes | 267 | 9.3% |
| 10 to 14 Minutes | 189 | 6.6% |
| 15 to 19 Minutes | 84 | 2.9% |
| 20 to 24 Minutes | 427 | 14.8% |
| 25 to 29 Minutes | 327 | 11.4% |
| 30 to 34 Minutes | 729 | 25.4% |
| 35 to 39 Minutes | 203 | 7.1% |
| 40 to 44 Minutes | 101 | 3.5% |
| 45 to 59 Minutes | 61 | 2.1% |
| 60 to 89 Minutes | 78 | 2.7% |
| 90 or more Minutes | 25 | 0.9% |
Commute Time by Sex in Monticello
The most common commute times in Monticello are 30 to 34 minutes (465 commuters, 29.8%) for males and less than 5 minutes (281 commuters, 21.4%) for females.
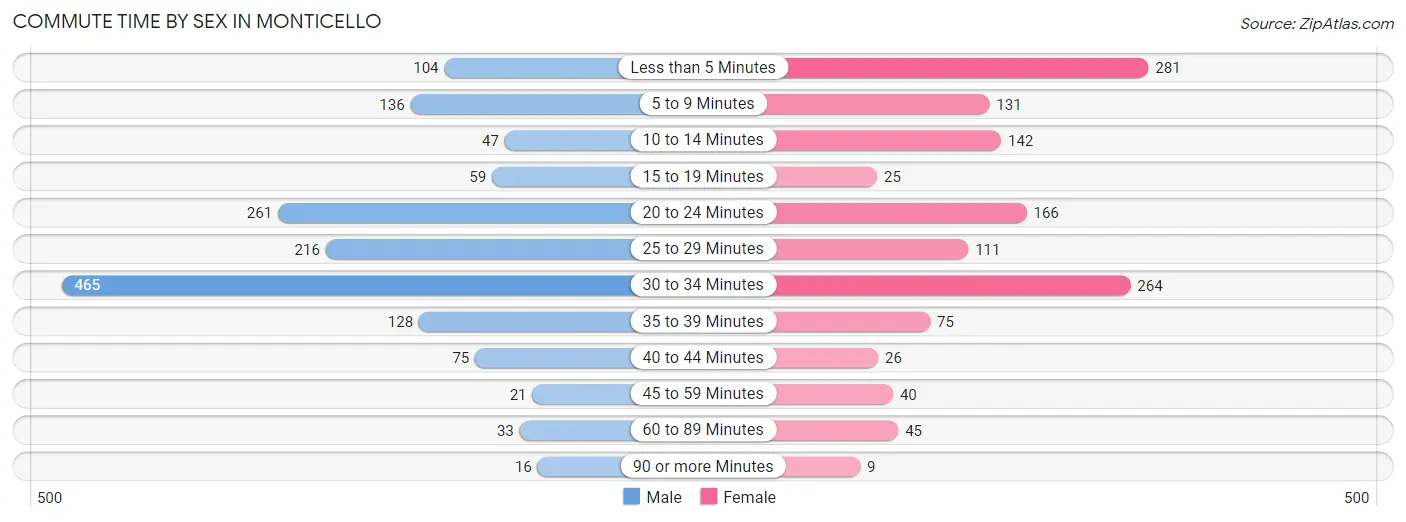
| Commute Time | Male | Female |
| Less than 5 Minutes | 104 (6.7%) | 281 (21.4%) |
| 5 to 9 Minutes | 136 (8.7%) | 131 (10.0%) |
| 10 to 14 Minutes | 47 (3.0%) | 142 (10.8%) |
| 15 to 19 Minutes | 59 (3.8%) | 25 (1.9%) |
| 20 to 24 Minutes | 261 (16.7%) | 166 (12.6%) |
| 25 to 29 Minutes | 216 (13.8%) | 111 (8.4%) |
| 30 to 34 Minutes | 465 (29.8%) | 264 (20.1%) |
| 35 to 39 Minutes | 128 (8.2%) | 75 (5.7%) |
| 40 to 44 Minutes | 75 (4.8%) | 26 (2.0%) |
| 45 to 59 Minutes | 21 (1.3%) | 40 (3.0%) |
| 60 to 89 Minutes | 33 (2.1%) | 45 (3.4%) |
| 90 or more Minutes | 16 (1.0%) | 9 (0.7%) |
Time of Departure to Work by Sex in Monticello
The most frequent times of departure to work in Monticello are 7:00 AM to 7:29 AM (431, 27.6%) for males and 7:00 AM to 7:29 AM (369, 28.1%) for females.
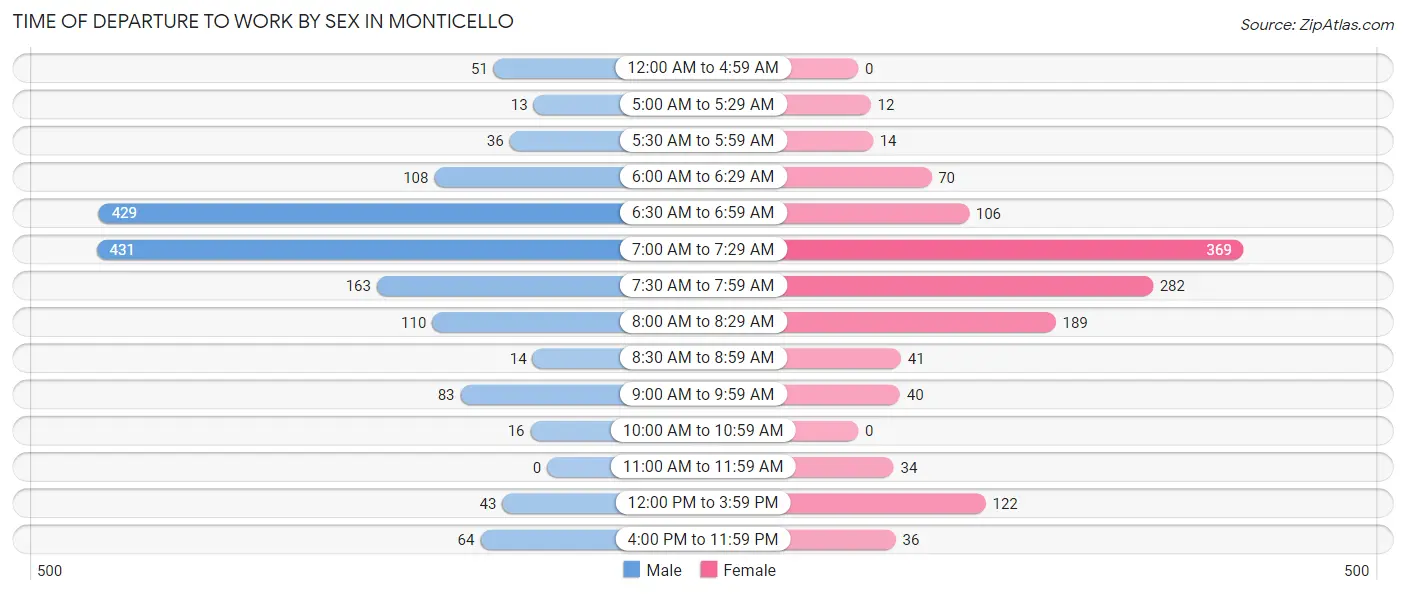
| Time of Departure | Male | Female |
| 12:00 AM to 4:59 AM | 51 (3.3%) | 0 (0.0%) |
| 5:00 AM to 5:29 AM | 13 (0.8%) | 12 (0.9%) |
| 5:30 AM to 5:59 AM | 36 (2.3%) | 14 (1.1%) |
| 6:00 AM to 6:29 AM | 108 (6.9%) | 70 (5.3%) |
| 6:30 AM to 6:59 AM | 429 (27.5%) | 106 (8.1%) |
| 7:00 AM to 7:29 AM | 431 (27.6%) | 369 (28.1%) |
| 7:30 AM to 7:59 AM | 163 (10.4%) | 282 (21.4%) |
| 8:00 AM to 8:29 AM | 110 (7.0%) | 189 (14.4%) |
| 8:30 AM to 8:59 AM | 14 (0.9%) | 41 (3.1%) |
| 9:00 AM to 9:59 AM | 83 (5.3%) | 40 (3.0%) |
| 10:00 AM to 10:59 AM | 16 (1.0%) | 0 (0.0%) |
| 11:00 AM to 11:59 AM | 0 (0.0%) | 34 (2.6%) |
| 12:00 PM to 3:59 PM | 43 (2.8%) | 122 (9.3%) |
| 4:00 PM to 11:59 PM | 64 (4.1%) | 36 (2.7%) |
| Total | 1,561 (100.0%) | 1,315 (100.0%) |
Housing Occupancy in Monticello
Occupancy by Ownership in Monticello
Of the total 2,636 dwellings in Monticello, owner-occupied units account for 2,130 (80.8%), while renter-occupied units make up 506 (19.2%).
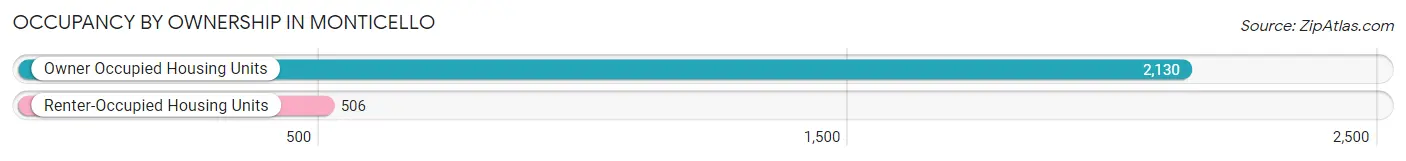
| Occupancy | # Housing Units | % Housing Units |
| Owner Occupied Housing Units | 2,130 | 80.8% |
| Renter-Occupied Housing Units | 506 | 19.2% |
| Total Occupied Housing Units | 2,636 | 100.0% |
Occupancy by Household Size in Monticello
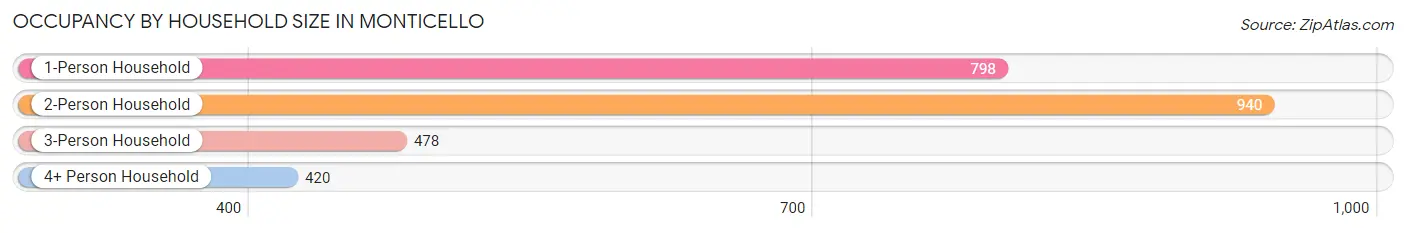
| Household Size | # Housing Units | % Housing Units |
| 1-Person Household | 798 | 30.3% |
| 2-Person Household | 940 | 35.7% |
| 3-Person Household | 478 | 18.1% |
| 4+ Person Household | 420 | 15.9% |
| Total Housing Units | 2,636 | 100.0% |
Occupancy by Ownership by Household Size in Monticello
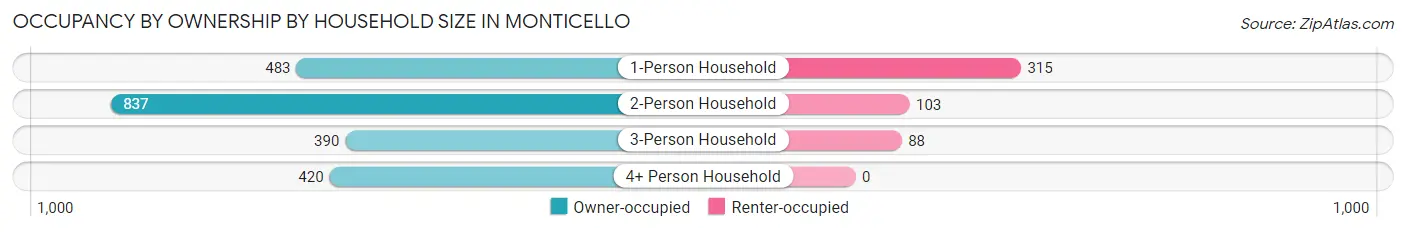
| Household Size | Owner-occupied | Renter-occupied |
| 1-Person Household | 483 (60.5%) | 315 (39.5%) |
| 2-Person Household | 837 (89.0%) | 103 (11.0%) |
| 3-Person Household | 390 (81.6%) | 88 (18.4%) |
| 4+ Person Household | 420 (100.0%) | 0 (0.0%) |
| Total Housing Units | 2,130 (80.8%) | 506 (19.2%) |
Occupancy by Educational Attainment in Monticello
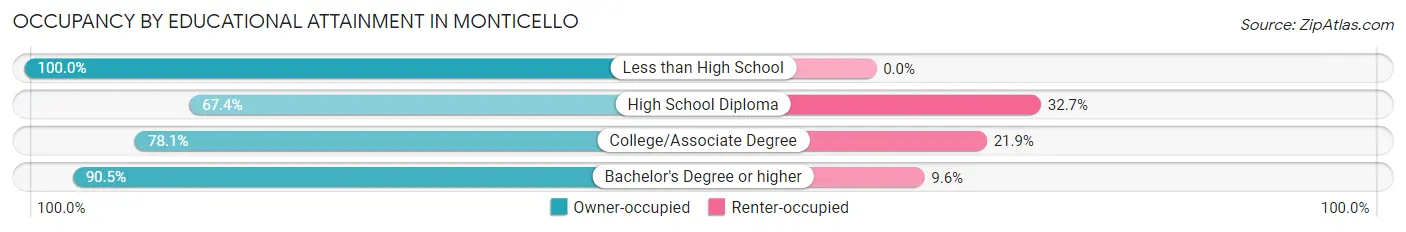
| Household Size | Owner-occupied | Renter-occupied |
| Less than High School | 79 (100.0%) | 0 (0.0%) |
| High School Diploma | 495 (67.3%) | 240 (32.7%) |
| College/Associate Degree | 581 (78.1%) | 163 (21.9%) |
| Bachelor's Degree or higher | 975 (90.4%) | 103 (9.6%) |
Occupancy by Age of Householder in Monticello
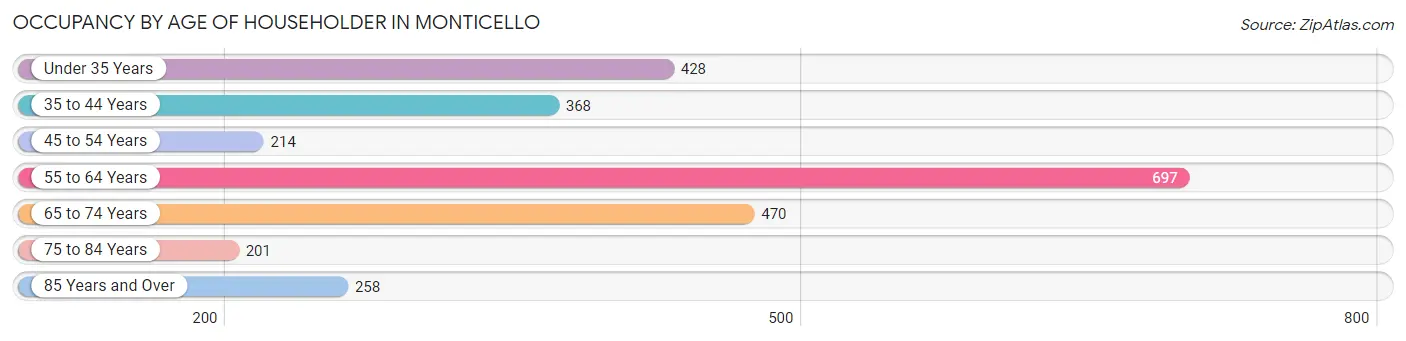
| Age Bracket | # Households | % Households |
| Under 35 Years | 428 | 16.2% |
| 35 to 44 Years | 368 | 14.0% |
| 45 to 54 Years | 214 | 8.1% |
| 55 to 64 Years | 697 | 26.4% |
| 65 to 74 Years | 470 | 17.8% |
| 75 to 84 Years | 201 | 7.6% |
| 85 Years and Over | 258 | 9.8% |
| Total | 2,636 | 100.0% |
Housing Finances in Monticello
Median Income by Occupancy in Monticello
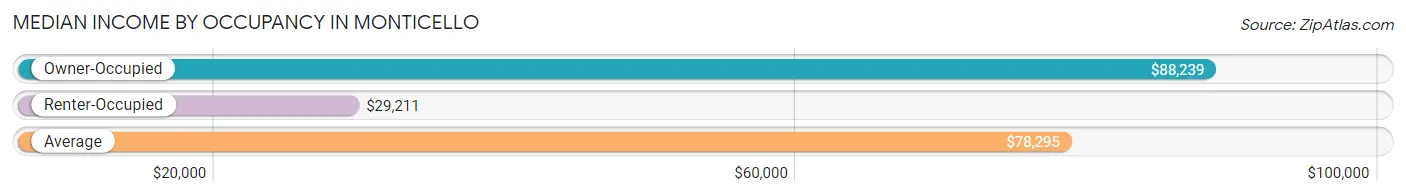
| Occupancy Type | # Households | Median Income |
| Owner-Occupied | 2,130 (80.8%) | $88,239 |
| Renter-Occupied | 506 (19.2%) | $29,211 |
| Average | 2,636 (100.0%) | $78,295 |
Occupancy by Householder Income Bracket in Monticello
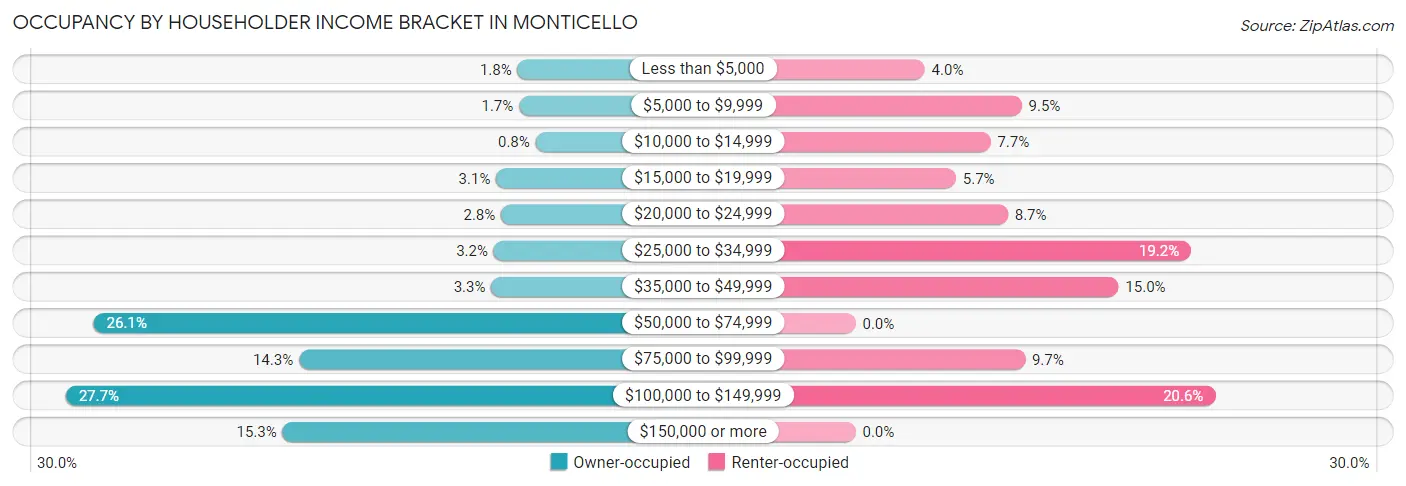
| Income Bracket | Owner-occupied | Renter-occupied |
| Less than $5,000 | 39 (1.8%) | 20 (4.0%) |
| $5,000 to $9,999 | 37 (1.7%) | 48 (9.5%) |
| $10,000 to $14,999 | 17 (0.8%) | 39 (7.7%) |
| $15,000 to $19,999 | 65 (3.0%) | 29 (5.7%) |
| $20,000 to $24,999 | 59 (2.8%) | 44 (8.7%) |
| $25,000 to $34,999 | 68 (3.2%) | 97 (19.2%) |
| $35,000 to $49,999 | 71 (3.3%) | 76 (15.0%) |
| $50,000 to $74,999 | 555 (26.1%) | 0 (0.0%) |
| $75,000 to $99,999 | 305 (14.3%) | 49 (9.7%) |
| $100,000 to $149,999 | 589 (27.7%) | 104 (20.5%) |
| $150,000 or more | 325 (15.3%) | 0 (0.0%) |
| Total | 2,130 (100.0%) | 506 (100.0%) |
Monthly Housing Cost Tiers in Monticello
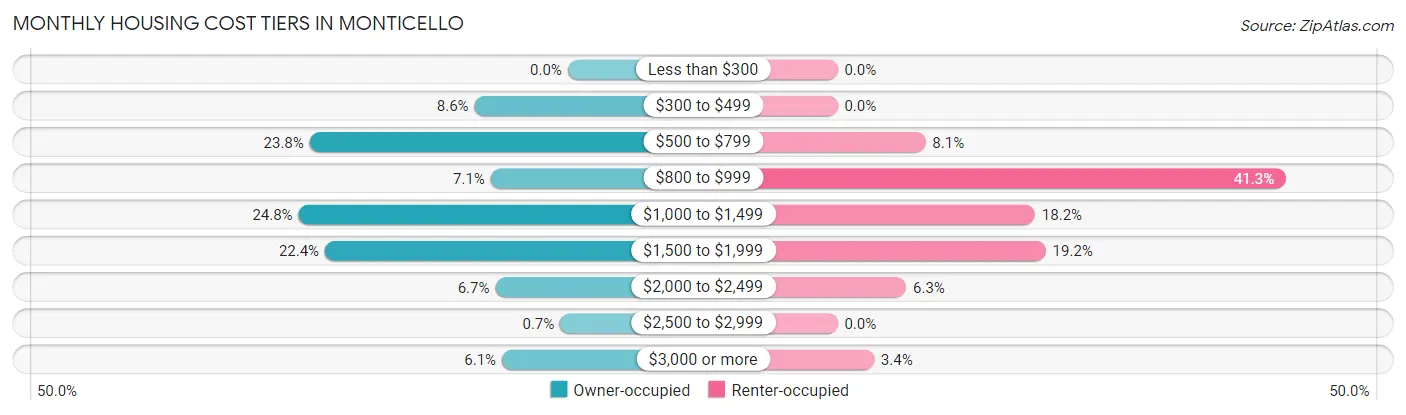
| Monthly Cost | Owner-occupied | Renter-occupied |
| Less than $300 | 0 (0.0%) | 0 (0.0%) |
| $300 to $499 | 183 (8.6%) | 0 (0.0%) |
| $500 to $799 | 506 (23.8%) | 41 (8.1%) |
| $800 to $999 | 151 (7.1%) | 209 (41.3%) |
| $1,000 to $1,499 | 528 (24.8%) | 92 (18.2%) |
| $1,500 to $1,999 | 476 (22.4%) | 97 (19.2%) |
| $2,000 to $2,499 | 142 (6.7%) | 32 (6.3%) |
| $2,500 to $2,999 | 15 (0.7%) | 0 (0.0%) |
| $3,000 or more | 129 (6.1%) | 17 (3.4%) |
| Total | 2,130 (100.0%) | 506 (100.0%) |
Physical Housing Characteristics in Monticello
Housing Structures in Monticello
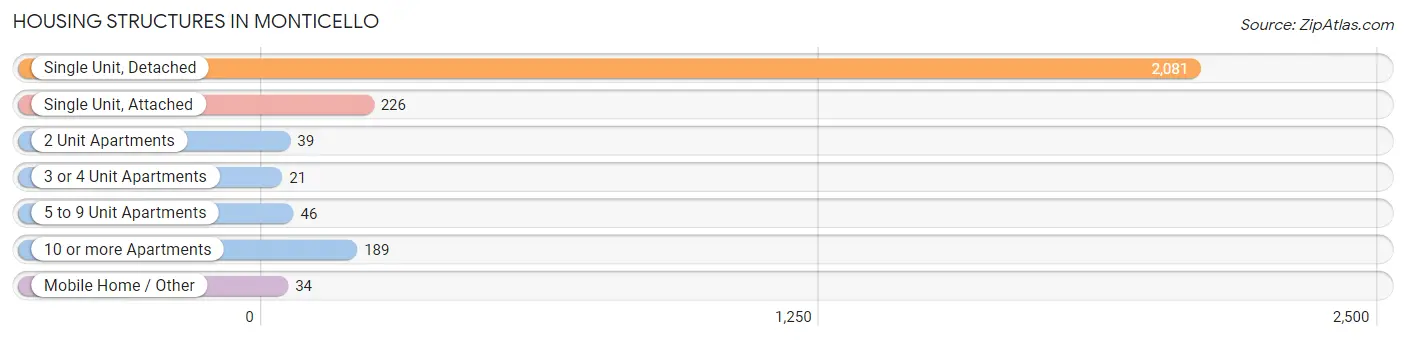
| Structure Type | # Housing Units | % Housing Units |
| Single Unit, Detached | 2,081 | 78.9% |
| Single Unit, Attached | 226 | 8.6% |
| 2 Unit Apartments | 39 | 1.5% |
| 3 or 4 Unit Apartments | 21 | 0.8% |
| 5 to 9 Unit Apartments | 46 | 1.8% |
| 10 or more Apartments | 189 | 7.2% |
| Mobile Home / Other | 34 | 1.3% |
| Total | 2,636 | 100.0% |
Housing Structures by Occupancy in Monticello
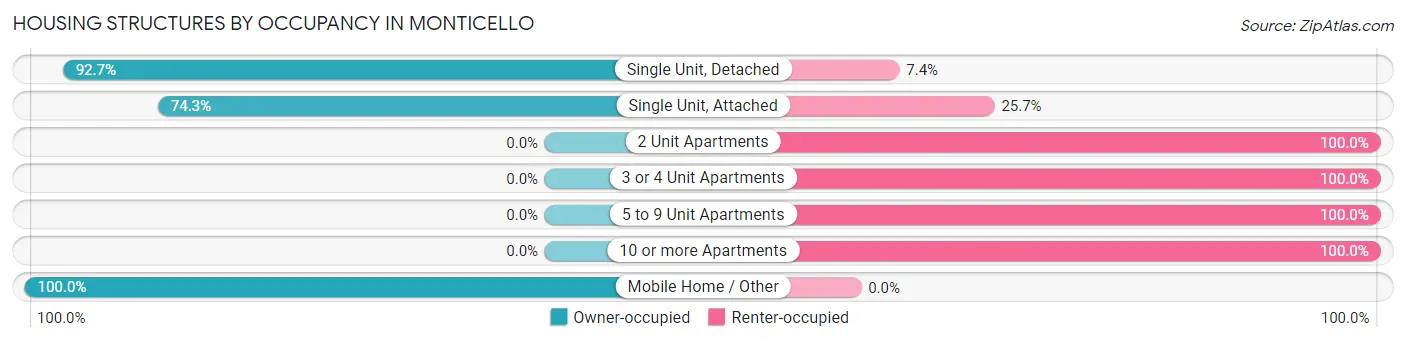
| Structure Type | Owner-occupied | Renter-occupied |
| Single Unit, Detached | 1,928 (92.6%) | 153 (7.3%) |
| Single Unit, Attached | 168 (74.3%) | 58 (25.7%) |
| 2 Unit Apartments | 0 (0.0%) | 39 (100.0%) |
| 3 or 4 Unit Apartments | 0 (0.0%) | 21 (100.0%) |
| 5 to 9 Unit Apartments | 0 (0.0%) | 46 (100.0%) |
| 10 or more Apartments | 0 (0.0%) | 189 (100.0%) |
| Mobile Home / Other | 34 (100.0%) | 0 (0.0%) |
| Total | 2,130 (80.8%) | 506 (19.2%) |
Housing Structures by Number of Rooms in Monticello
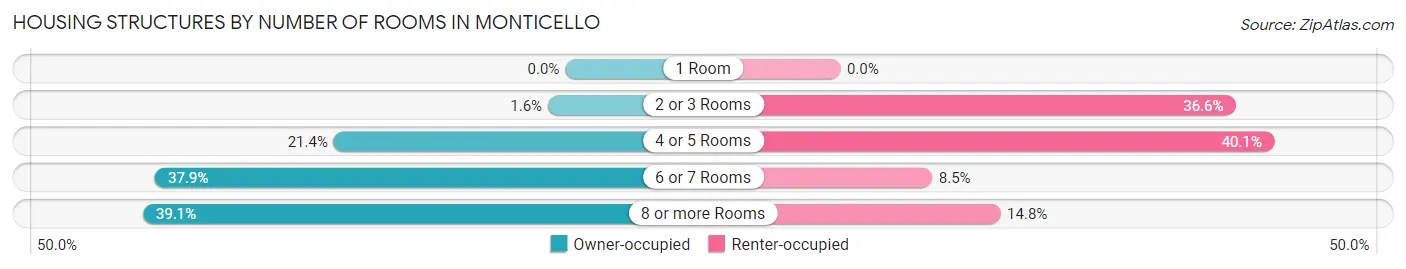
| Number of Rooms | Owner-occupied | Renter-occupied |
| 1 Room | 0 (0.0%) | 0 (0.0%) |
| 2 or 3 Rooms | 34 (1.6%) | 185 (36.6%) |
| 4 or 5 Rooms | 456 (21.4%) | 203 (40.1%) |
| 6 or 7 Rooms | 808 (37.9%) | 43 (8.5%) |
| 8 or more Rooms | 832 (39.1%) | 75 (14.8%) |
| Total | 2,130 (100.0%) | 506 (100.0%) |
Housing Structure by Heating Type in Monticello
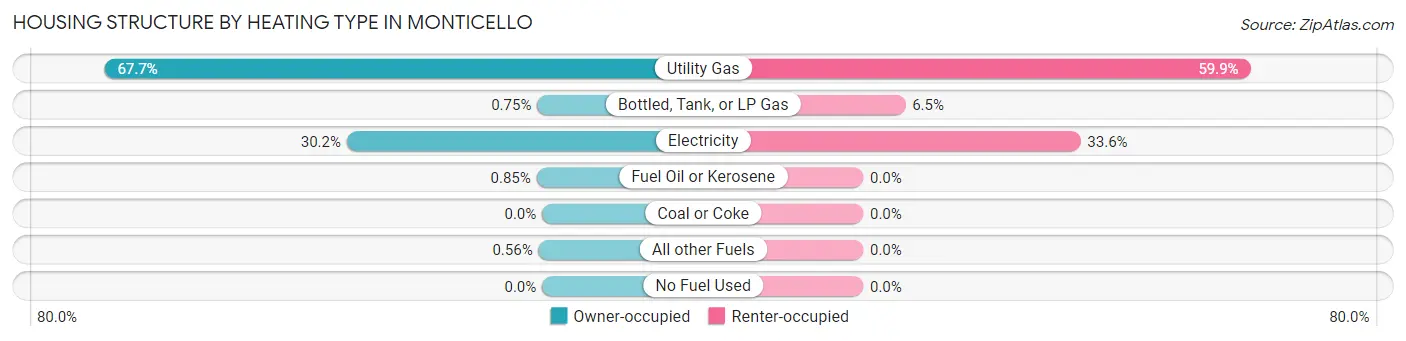
| Heating Type | Owner-occupied | Renter-occupied |
| Utility Gas | 1,441 (67.6%) | 303 (59.9%) |
| Bottled, Tank, or LP Gas | 16 (0.7%) | 33 (6.5%) |
| Electricity | 643 (30.2%) | 170 (33.6%) |
| Fuel Oil or Kerosene | 18 (0.9%) | 0 (0.0%) |
| Coal or Coke | 0 (0.0%) | 0 (0.0%) |
| All other Fuels | 12 (0.6%) | 0 (0.0%) |
| No Fuel Used | 0 (0.0%) | 0 (0.0%) |
| Total | 2,130 (100.0%) | 506 (100.0%) |
Household Vehicle Usage in Monticello
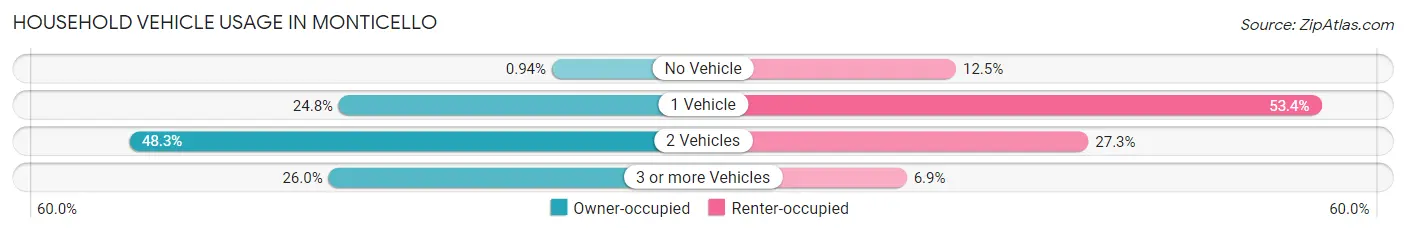
| Vehicles per Household | Owner-occupied | Renter-occupied |
| No Vehicle | 20 (0.9%) | 63 (12.4%) |
| 1 Vehicle | 528 (24.8%) | 270 (53.4%) |
| 2 Vehicles | 1,029 (48.3%) | 138 (27.3%) |
| 3 or more Vehicles | 553 (26.0%) | 35 (6.9%) |
| Total | 2,130 (100.0%) | 506 (100.0%) |
Real Estate & Mortgages in Monticello
Real Estate and Mortgage Overview in Monticello
| Characteristic | Without Mortgage | With Mortgage |
| Housing Units | 747 | 1,383 |
| Median Property Value | $197,300 | $196,700 |
| Median Household Income | $67,688 | $172 |
| Monthly Housing Costs | $574 | $129 |
| Real Estate Taxes | $2,658 | $0 |
Property Value by Mortgage Status in Monticello
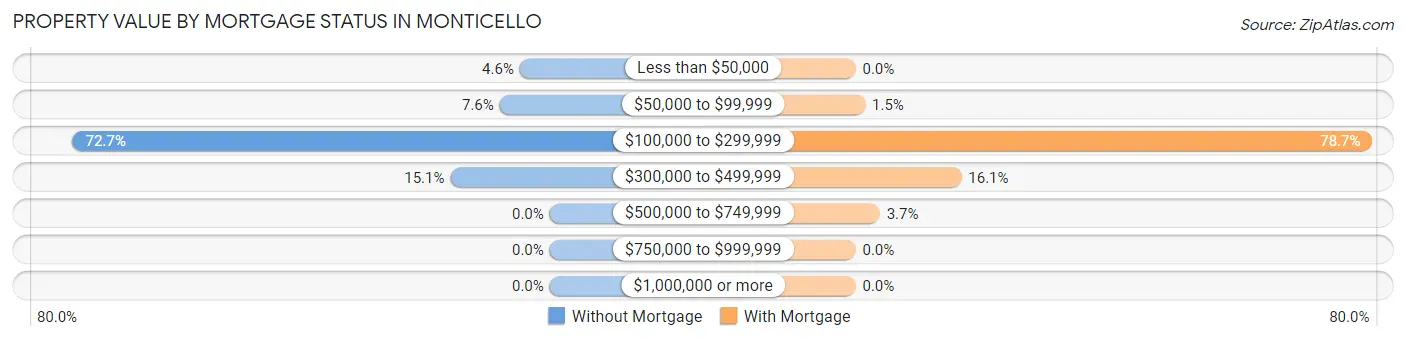
| Property Value | Without Mortgage | With Mortgage |
| Less than $50,000 | 34 (4.5%) | 0 (0.0%) |
| $50,000 to $99,999 | 57 (7.6%) | 20 (1.5%) |
| $100,000 to $299,999 | 543 (72.7%) | 1,089 (78.7%) |
| $300,000 to $499,999 | 113 (15.1%) | 223 (16.1%) |
| $500,000 to $749,999 | 0 (0.0%) | 51 (3.7%) |
| $750,000 to $999,999 | 0 (0.0%) | 0 (0.0%) |
| $1,000,000 or more | 0 (0.0%) | 0 (0.0%) |
| Total | 747 (100.0%) | 1,383 (100.0%) |
Household Income by Mortgage Status in Monticello
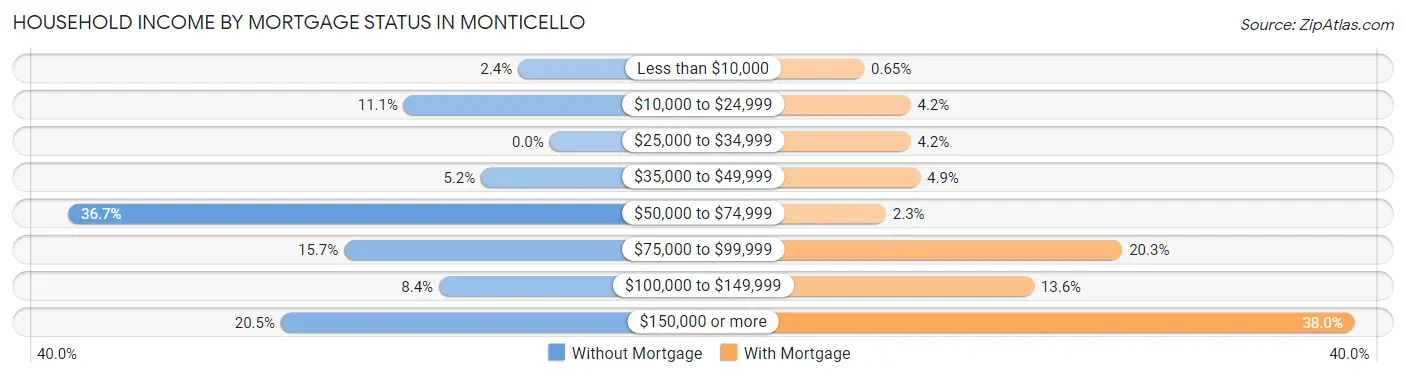
| Household Income | Without Mortgage | With Mortgage |
| Less than $10,000 | 18 (2.4%) | 9 (0.6%) |
| $10,000 to $24,999 | 83 (11.1%) | 58 (4.2%) |
| $25,000 to $34,999 | 0 (0.0%) | 58 (4.2%) |
| $35,000 to $49,999 | 39 (5.2%) | 68 (4.9%) |
| $50,000 to $74,999 | 274 (36.7%) | 32 (2.3%) |
| $75,000 to $99,999 | 117 (15.7%) | 281 (20.3%) |
| $100,000 to $149,999 | 63 (8.4%) | 188 (13.6%) |
| $150,000 or more | 153 (20.5%) | 526 (38.0%) |
| Total | 747 (100.0%) | 1,383 (100.0%) |
Property Value to Household Income Ratio in Monticello
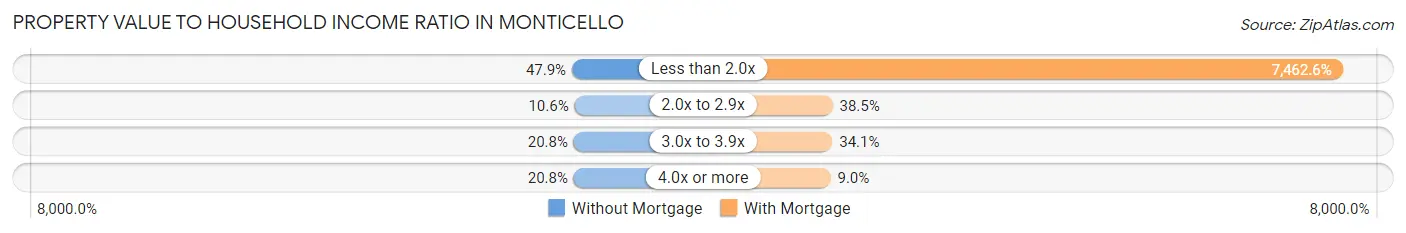
| Value-to-Income Ratio | Without Mortgage | With Mortgage |
| Less than 2.0x | 358 (47.9%) | 103,207 (7,462.6%) |
| 2.0x to 2.9x | 79 (10.6%) | 533 (38.5%) |
| 3.0x to 3.9x | 155 (20.7%) | 472 (34.1%) |
| 4.0x or more | 155 (20.7%) | 125 (9.0%) |
| Total | 747 (100.0%) | 1,383 (100.0%) |
Real Estate Taxes by Mortgage Status in Monticello
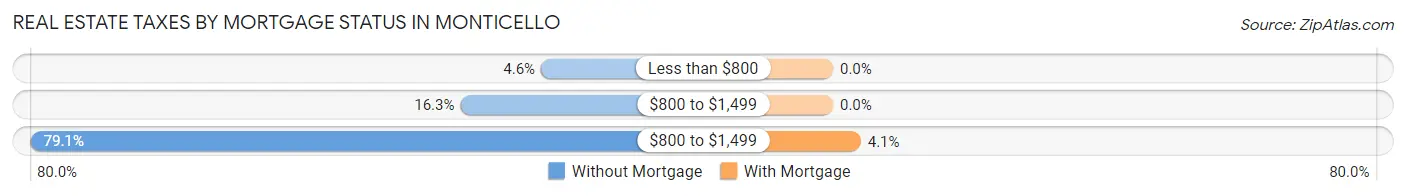
| Property Taxes | Without Mortgage | With Mortgage |
| Less than $800 | 34 (4.5%) | 0 (0.0%) |
| $800 to $1,499 | 122 (16.3%) | 0 (0.0%) |
| $800 to $1,499 | 591 (79.1%) | 56 (4.1%) |
| Total | 747 (100.0%) | 1,383 (100.0%) |
Health & Disability in Monticello
Health Insurance Coverage by Age in Monticello
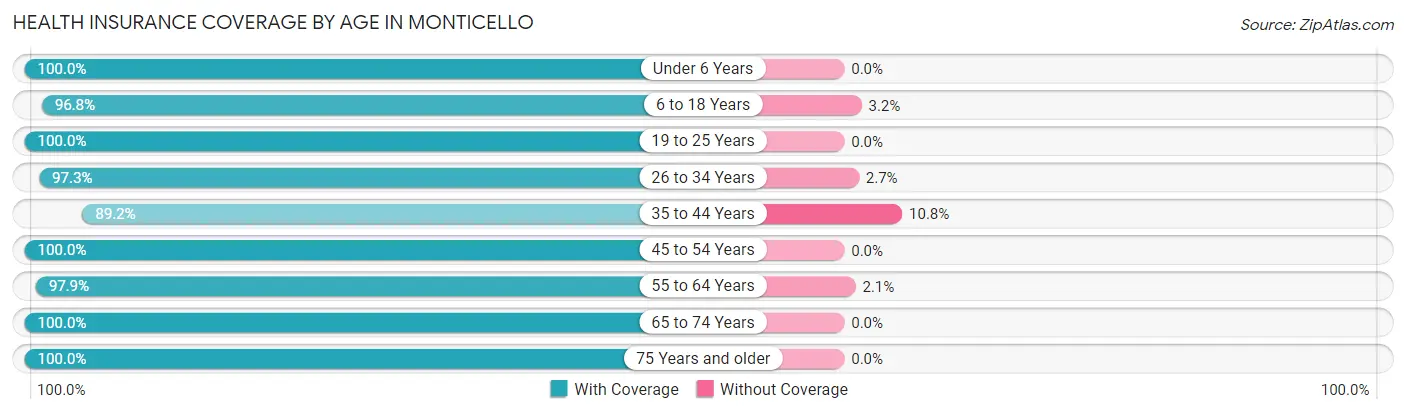
| Age Bracket | With Coverage | Without Coverage |
| Under 6 Years | 570 (100.0%) | 0 (0.0%) |
| 6 to 18 Years | 785 (96.8%) | 26 (3.2%) |
| 19 to 25 Years | 403 (100.0%) | 0 (0.0%) |
| 26 to 34 Years | 857 (97.3%) | 24 (2.7%) |
| 35 to 44 Years | 679 (89.2%) | 82 (10.8%) |
| 45 to 54 Years | 398 (100.0%) | 0 (0.0%) |
| 55 to 64 Years | 1,026 (97.9%) | 22 (2.1%) |
| 65 to 74 Years | 787 (100.0%) | 0 (0.0%) |
| 75 Years and older | 659 (100.0%) | 0 (0.0%) |
| Total | 6,164 (97.6%) | 154 (2.4%) |
Health Insurance Coverage by Citizenship Status in Monticello
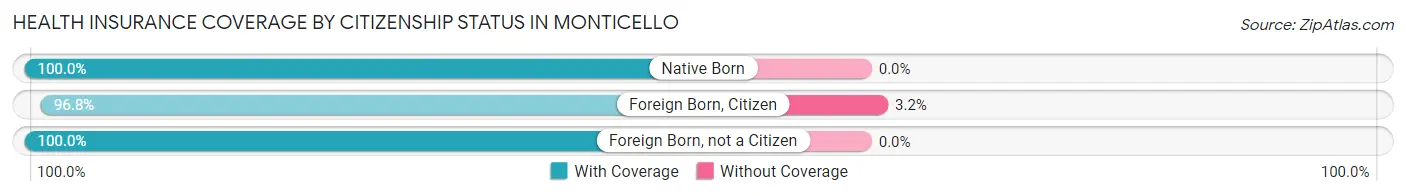
| Citizenship Status | With Coverage | Without Coverage |
| Native Born | 570 (100.0%) | 0 (0.0%) |
| Foreign Born, Citizen | 785 (96.8%) | 26 (3.2%) |
| Foreign Born, not a Citizen | 403 (100.0%) | 0 (0.0%) |
Health Insurance Coverage by Household Income in Monticello
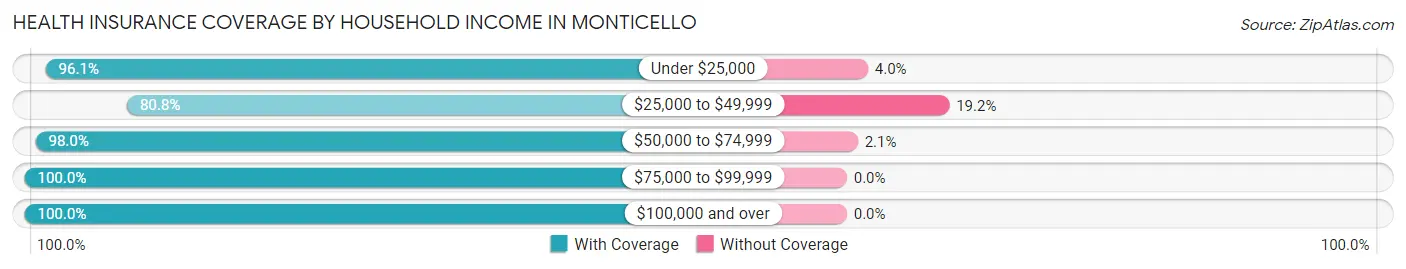
| Household Income | With Coverage | Without Coverage |
| Under $25,000 | 632 (96.1%) | 26 (4.0%) |
| $25,000 to $49,999 | 438 (80.8%) | 104 (19.2%) |
| $50,000 to $74,999 | 1,146 (98.0%) | 24 (2.1%) |
| $75,000 to $99,999 | 969 (100.0%) | 0 (0.0%) |
| $100,000 and over | 2,928 (100.0%) | 0 (0.0%) |
Public vs Private Health Insurance Coverage by Age in Monticello
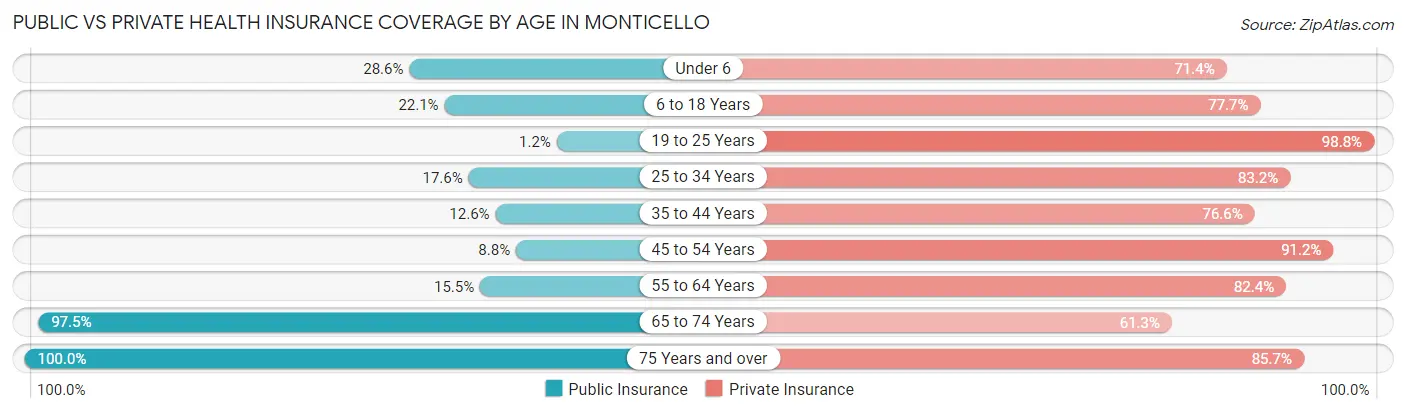
| Age Bracket | Public Insurance | Private Insurance |
| Under 6 | 163 (28.6%) | 407 (71.4%) |
| 6 to 18 Years | 179 (22.1%) | 630 (77.7%) |
| 19 to 25 Years | 5 (1.2%) | 398 (98.8%) |
| 25 to 34 Years | 155 (17.6%) | 733 (83.2%) |
| 35 to 44 Years | 96 (12.6%) | 583 (76.6%) |
| 45 to 54 Years | 35 (8.8%) | 363 (91.2%) |
| 55 to 64 Years | 162 (15.5%) | 864 (82.4%) |
| 65 to 74 Years | 767 (97.5%) | 482 (61.3%) |
| 75 Years and over | 659 (100.0%) | 565 (85.7%) |
| Total | 2,221 (35.1%) | 5,025 (79.5%) |
Disability Status by Sex by Age in Monticello
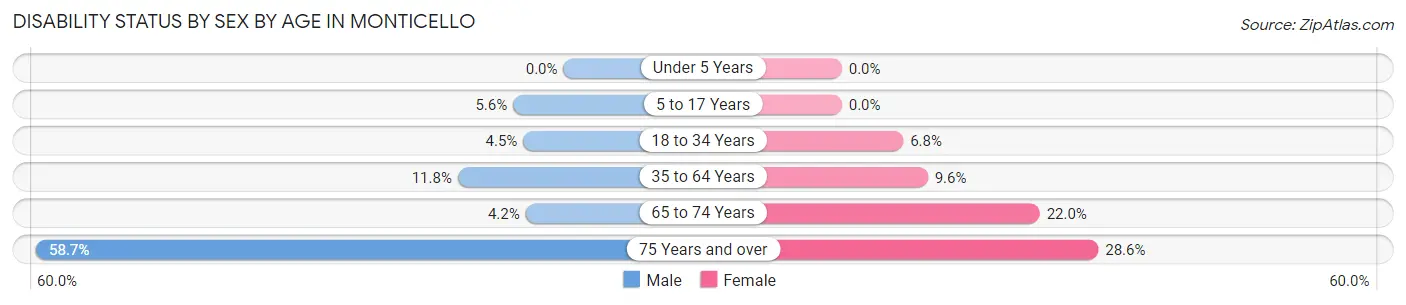
| Age Bracket | Male | Female |
| Under 5 Years | 0 (0.0%) | 0 (0.0%) |
| 5 to 17 Years | 28 (5.6%) | 0 (0.0%) |
| 18 to 34 Years | 29 (4.5%) | 46 (6.8%) |
| 35 to 64 Years | 122 (11.8%) | 112 (9.6%) |
| 65 to 74 Years | 15 (4.2%) | 95 (22.0%) |
| 75 Years and over | 165 (58.7%) | 108 (28.6%) |
Disability Class by Sex by Age in Monticello
Disability Class: Hearing Difficulty
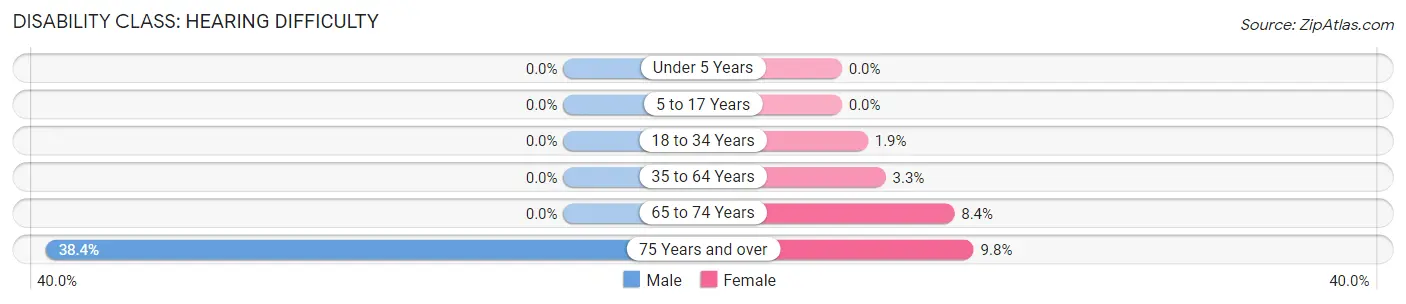
| Age Bracket | Male | Female |
| Under 5 Years | 0 (0.0%) | 0 (0.0%) |
| 5 to 17 Years | 0 (0.0%) | 0 (0.0%) |
| 18 to 34 Years | 0 (0.0%) | 13 (1.9%) |
| 35 to 64 Years | 0 (0.0%) | 38 (3.3%) |
| 65 to 74 Years | 0 (0.0%) | 36 (8.4%) |
| 75 Years and over | 108 (38.4%) | 37 (9.8%) |
Disability Class: Vision Difficulty
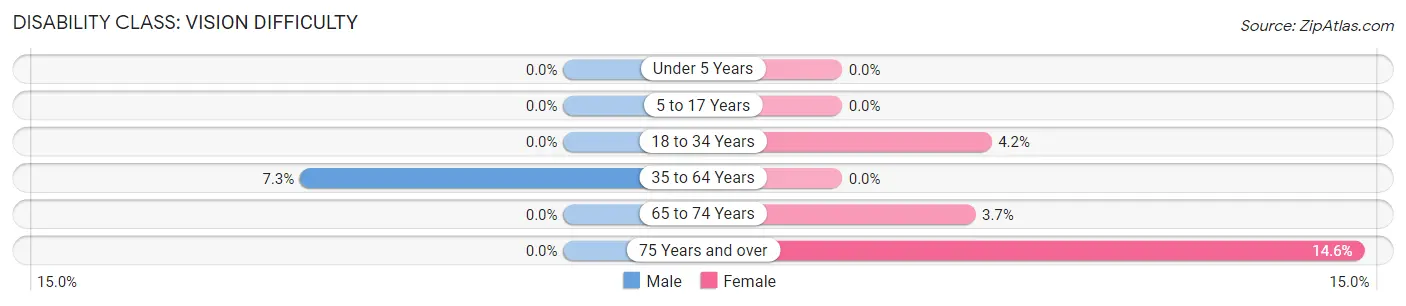
| Age Bracket | Male | Female |
| Under 5 Years | 0 (0.0%) | 0 (0.0%) |
| 5 to 17 Years | 0 (0.0%) | 0 (0.0%) |
| 18 to 34 Years | 0 (0.0%) | 28 (4.2%) |
| 35 to 64 Years | 76 (7.3%) | 0 (0.0%) |
| 65 to 74 Years | 0 (0.0%) | 16 (3.7%) |
| 75 Years and over | 0 (0.0%) | 55 (14.5%) |
Disability Class: Cognitive Difficulty
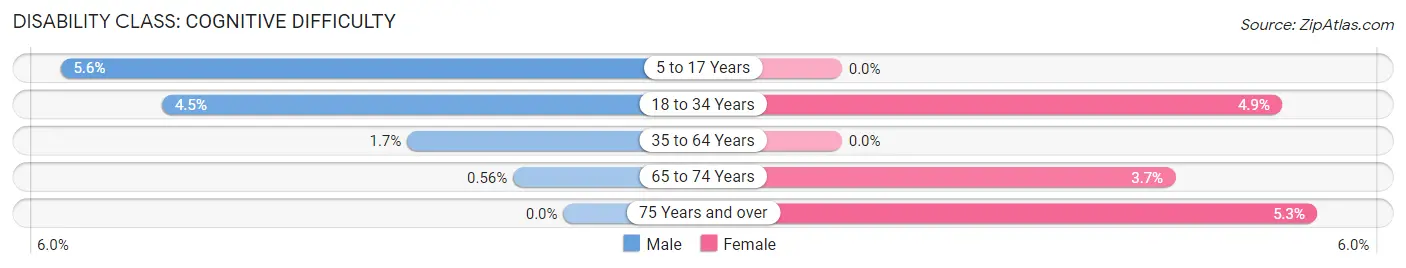
| Age Bracket | Male | Female |
| 5 to 17 Years | 28 (5.6%) | 0 (0.0%) |
| 18 to 34 Years | 29 (4.5%) | 33 (4.9%) |
| 35 to 64 Years | 18 (1.7%) | 0 (0.0%) |
| 65 to 74 Years | 2 (0.6%) | 16 (3.7%) |
| 75 Years and over | 0 (0.0%) | 20 (5.3%) |
Disability Class: Ambulatory Difficulty
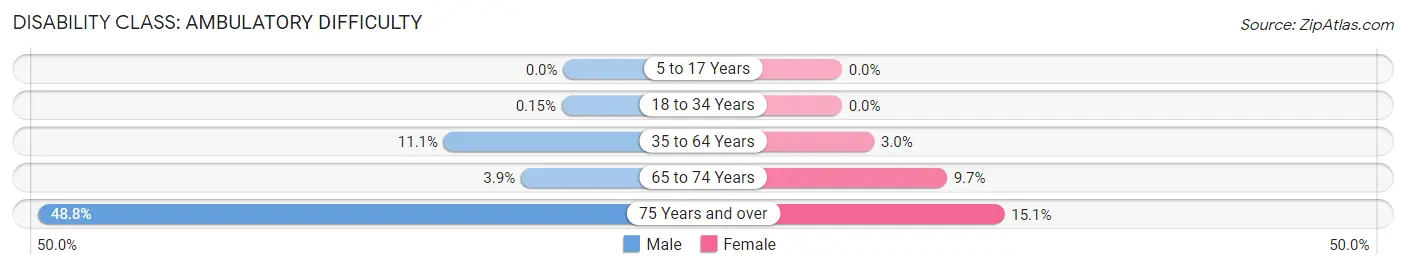
| Age Bracket | Male | Female |
| 5 to 17 Years | 0 (0.0%) | 0 (0.0%) |
| 18 to 34 Years | 1 (0.2%) | 0 (0.0%) |
| 35 to 64 Years | 115 (11.1%) | 35 (3.0%) |
| 65 to 74 Years | 14 (3.9%) | 42 (9.7%) |
| 75 Years and over | 137 (48.7%) | 57 (15.1%) |
Disability Class: Self-Care Difficulty
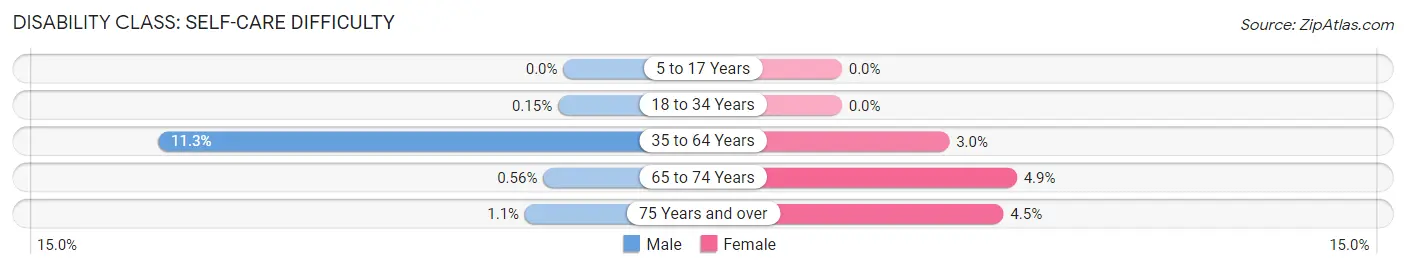
| Age Bracket | Male | Female |
| 5 to 17 Years | 0 (0.0%) | 0 (0.0%) |
| 18 to 34 Years | 1 (0.2%) | 0 (0.0%) |
| 35 to 64 Years | 117 (11.3%) | 35 (3.0%) |
| 65 to 74 Years | 2 (0.6%) | 21 (4.9%) |
| 75 Years and over | 3 (1.1%) | 17 (4.5%) |
Technology Access in Monticello
Computing Device Access in Monticello
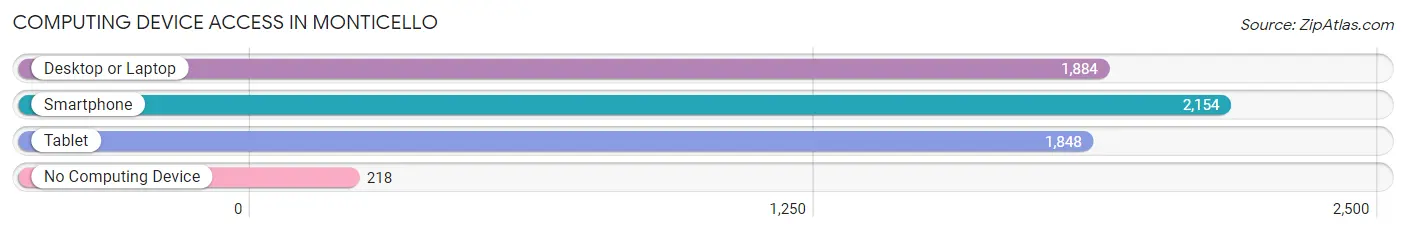
| Device Type | # Households | % Households |
| Desktop or Laptop | 1,884 | 71.5% |
| Smartphone | 2,154 | 81.7% |
| Tablet | 1,848 | 70.1% |
| No Computing Device | 218 | 8.3% |
| Total | 2,636 | 100.0% |
Internet Access in Monticello
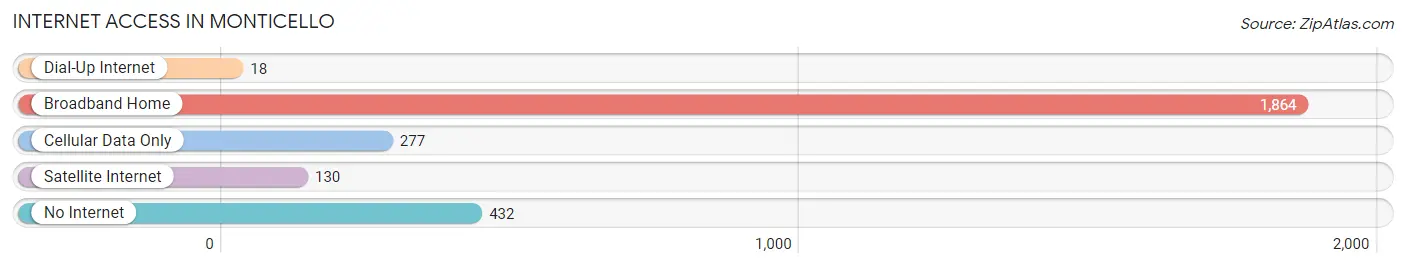
| Internet Type | # Households | % Households |
| Dial-Up Internet | 18 | 0.7% |
| Broadband Home | 1,864 | 70.7% |
| Cellular Data Only | 277 | 10.5% |
| Satellite Internet | 130 | 4.9% |
| No Internet | 432 | 16.4% |
| Total | 2,636 | 100.0% |
Monticello Summary
Monticello, Illinois is a small city located in Piatt County, Illinois. It is situated in the heart of the state, about 25 miles south of Champaign and about 90 miles south of Chicago. The city has a population of 5,091 as of the 2010 census, and is the county seat of Piatt County.
History
Monticello was founded in 1837 by William Piatt, a prominent local landowner. The city was named after the estate of Thomas Jefferson, Monticello, which was located in Virginia. The city was incorporated in 1855 and has since grown to become the county seat of Piatt County.
Monticello has a rich history of industry and commerce. In the late 19th century, the city was home to several factories, including a flour mill, a sawmill, a brickyard, and a furniture factory. The city also had a thriving agricultural industry, with many farmers growing corn, wheat, and other crops.
In the early 20th century, Monticello was home to several automobile manufacturers, including the Monticello Motor Car Company and the Monticello Automobile Company. The city also had a thriving coal mining industry, with several mines located in the area.
Geography
Monticello is located in the center of Piatt County, Illinois. The city is situated on the Sangamon River, which flows through the city and is a major tributary of the Illinois River. The city is surrounded by rolling hills and farmland, and is located about 25 miles south of Champaign and about 90 miles south of Chicago.
The climate in Monticello is typical of the Midwest, with hot summers and cold winters. The average temperature in the summer is around 75 degrees Fahrenheit, and the average temperature in the winter is around 25 degrees Fahrenheit.
Economy
Monticello has a diverse economy, with a variety of industries and businesses. The city is home to several manufacturing companies, including a furniture factory, a printing company, and a plastics manufacturer. The city also has a thriving agricultural industry, with many farmers growing corn, wheat, and other crops.
The city is also home to several retail stores, restaurants, and other businesses. The city is also home to several medical facilities, including a hospital and several clinics.
Demographics
As of the 2010 census, Monticello had a population of 5,091. The racial makeup of the city was 95.3% White, 0.7% African American, 0.3% Native American, 0.7% Asian, 0.1% Pacific Islander, 1.2% from other races, and 1.9% from two or more races. Hispanic or Latino of any race were 3.2% of the population.
The median household income in Monticello was $41,944, and the median family income was $50,917. The per capita income in the city was $20,945. About 11.2% of families and 14.2% of the population were below the poverty line, including 19.2% of those under age 18 and 8.2% of those age 65 or over.
Common Questions
What is Per Capita Income in Monticello?
Per Capita income in Monticello is $38,878.
What is the Median Family Income in Monticello?
Median Family Income in Monticello is $97,228.
What is the Median Household income in Monticello?
Median Household Income in Monticello is $78,295.
What is Income or Wage Gap in Monticello?
Income or Wage Gap in Monticello is 38.0%.
Women in Monticello earn 62.0 cents for every dollar earned by a man.
What is Inequality or Gini Index in Monticello?
Inequality or Gini Index in Monticello is 0.37.
What is the Total Population of Monticello?
Total Population of Monticello is 6,337.
What is the Total Male Population of Monticello?
Total Male Population of Monticello is 2,979.
What is the Total Female Population of Monticello?
Total Female Population of Monticello is 3,358.
What is the Ratio of Males per 100 Females in Monticello?
There are 88.71 Males per 100 Females in Monticello.
What is the Ratio of Females per 100 Males in Monticello?
There are 112.72 Females per 100 Males in Monticello.
What is the Median Population Age in Monticello?
Median Population Age in Monticello is 40.5 Years.
What is the Average Family Size in Monticello
Average Family Size in Monticello is 2.9 People.
What is the Average Household Size in Monticello
Average Household Size in Monticello is 2.4 People.
How Large is the Labor Force in Monticello?
There are 3,207 People in the Labor Forcein in Monticello.
What is the Percentage of People in the Labor Force in Monticello?
62.8% of People are in the Labor Force in Monticello.
What is the Unemployment Rate in Monticello?
Unemployment Rate in Monticello is 1.7%.