Milton, IL Map & Demographics
Milton Map
Milton Overview
$20,960
PER CAPITA INCOME
$46,071
AVG FAMILY INCOME
$45,893
AVG HOUSEHOLD INCOME
0.33
INEQUALITY / GINI INDEX
215
TOTAL POPULATION
108
MALE POPULATION
107
FEMALE POPULATION
100.93
MALES / 100 FEMALES
99.07
FEMALES / 100 MALES
49.3
MEDIAN AGE
2.9
AVG FAMILY SIZE
2.6
AVG HOUSEHOLD SIZE
57
LABOR FORCE [ PEOPLE ]
34.3%
PERCENT IN LABOR FORCE
Milton Zip Codes
Milton Area Codes
Income in Milton
Income Overview in Milton
Per Capita Income in Milton is $20,960, while median incomes of families and households are $46,071 and $45,893 respectively.
| Characteristic | Number | Measure |
| Per Capita Income | 215 | $20,960 |
| Median Family Income | 66 | $46,071 |
| Mean Family Income | 66 | $53,597 |
| Median Household Income | 82 | $45,893 |
| Mean Household Income | 82 | $53,430 |
| Income Deficit | 66 | $0 |
| Wage / Income Gap (%) | 215 | 0.00% |
| Wage / Income Gap ($) | 215 | 100.00¢ per $1 |
| Gini / Inequality Index | 215 | 0.33 |
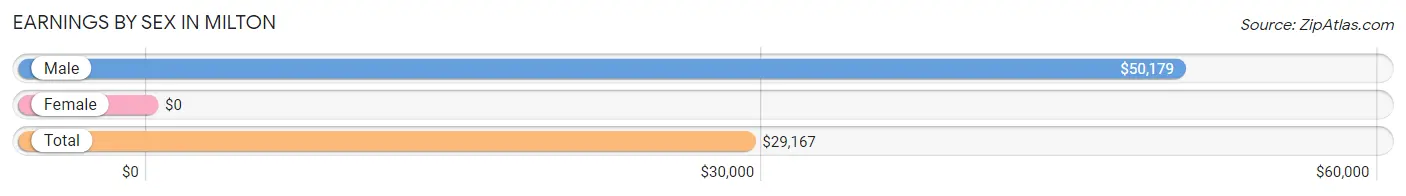
Earnings by Sex in Milton
| Sex | Number | Average Earnings |
| Male | 43 (65.1%) | $50,179 |
| Female | 23 (34.8%) | $0 |
| Total | 66 (100.0%) | $29,167 |
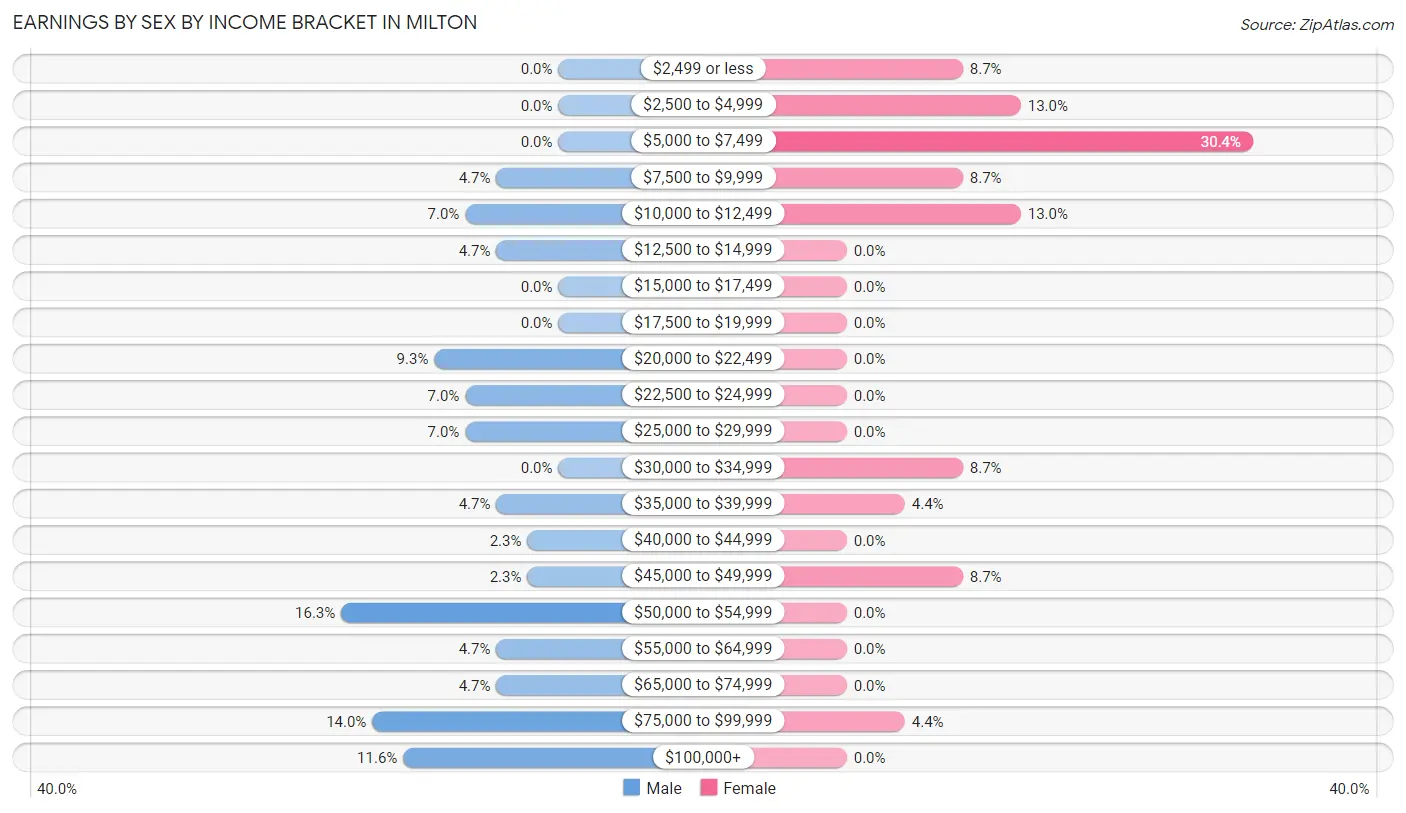
Earnings by Sex by Income Bracket in Milton
The most common earnings brackets in Milton are $50,000 to $54,999 for men (7 | 16.3%) and $5,000 to $7,499 for women (7 | 30.4%).
| Income | Male | Female |
| $2,499 or less | 0 (0.0%) | 2 (8.7%) |
| $2,500 to $4,999 | 0 (0.0%) | 3 (13.0%) |
| $5,000 to $7,499 | 0 (0.0%) | 7 (30.4%) |
| $7,500 to $9,999 | 2 (4.6%) | 2 (8.7%) |
| $10,000 to $12,499 | 3 (7.0%) | 3 (13.0%) |
| $12,500 to $14,999 | 2 (4.6%) | 0 (0.0%) |
| $15,000 to $17,499 | 0 (0.0%) | 0 (0.0%) |
| $17,500 to $19,999 | 0 (0.0%) | 0 (0.0%) |
| $20,000 to $22,499 | 4 (9.3%) | 0 (0.0%) |
| $22,500 to $24,999 | 3 (7.0%) | 0 (0.0%) |
| $25,000 to $29,999 | 3 (7.0%) | 0 (0.0%) |
| $30,000 to $34,999 | 0 (0.0%) | 2 (8.7%) |
| $35,000 to $39,999 | 2 (4.6%) | 1 (4.3%) |
| $40,000 to $44,999 | 1 (2.3%) | 0 (0.0%) |
| $45,000 to $49,999 | 1 (2.3%) | 2 (8.7%) |
| $50,000 to $54,999 | 7 (16.3%) | 0 (0.0%) |
| $55,000 to $64,999 | 2 (4.6%) | 0 (0.0%) |
| $65,000 to $74,999 | 2 (4.6%) | 0 (0.0%) |
| $75,000 to $99,999 | 6 (14.0%) | 1 (4.3%) |
| $100,000+ | 5 (11.6%) | 0 (0.0%) |
| Total | 43 (100.0%) | 23 (100.0%) |
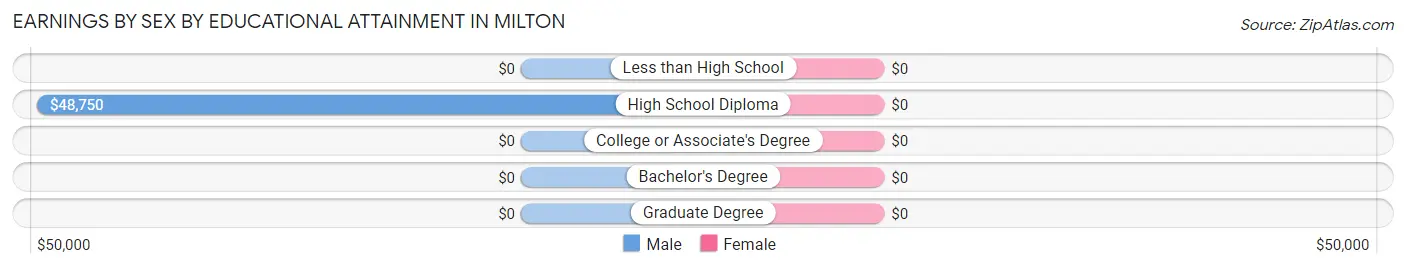
Earnings by Sex by Educational Attainment in Milton
| Educational Attainment | Male Income | Female Income |
| Less than High School | - | - |
| High School Diploma | $48,750 | $0 |
| College or Associate's Degree | - | - |
| Bachelor's Degree | - | - |
| Graduate Degree | - | - |
| Total | $52,500 | $0 |
Family Income in Milton
Family Income Brackets in Milton
According to the Milton family income data, there are 21 families falling into the $35,000 to $49,999 income range, which is the most common income bracket and makes up 31.8% of all families.
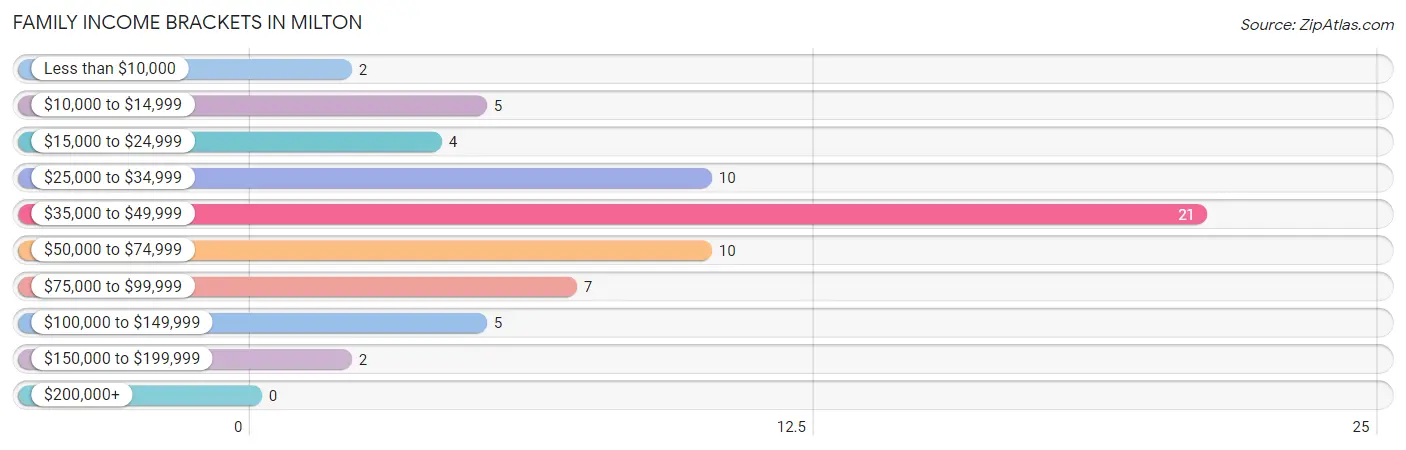
| Income Bracket | # Families | % Families |
| Less than $10,000 | 2 | 3.0% |
| $10,000 to $14,999 | 5 | 7.6% |
| $15,000 to $24,999 | 4 | 6.1% |
| $25,000 to $34,999 | 10 | 15.2% |
| $35,000 to $49,999 | 21 | 31.8% |
| $50,000 to $74,999 | 10 | 15.2% |
| $75,000 to $99,999 | 7 | 10.6% |
| $100,000 to $149,999 | 5 | 7.6% |
| $150,000 to $199,999 | 2 | 3.0% |
| $200,000+ | 0 | 0.0% |
Family Income by Famaliy Size in Milton
3-person families (16 | 24.2%) account for the highest median family income in Milton with $58,929 per family, while 2-person families (43 | 65.1%) have the highest median income of $22,991 per family member.
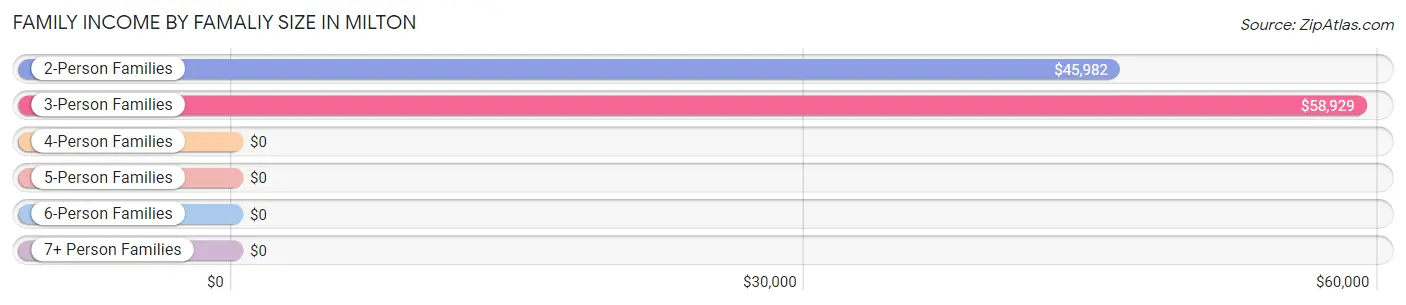
| Income Bracket | # Families | Median Income |
| 2-Person Families | 43 (65.1%) | $45,982 |
| 3-Person Families | 16 (24.2%) | $58,929 |
| 4-Person Families | 2 (3.0%) | $0 |
| 5-Person Families | 5 (7.6%) | $0 |
| 6-Person Families | 0 (0.0%) | $0 |
| 7+ Person Families | 0 (0.0%) | $0 |
| Total | 66 (100.0%) | $46,071 |
Family Income by Number of Earners in Milton
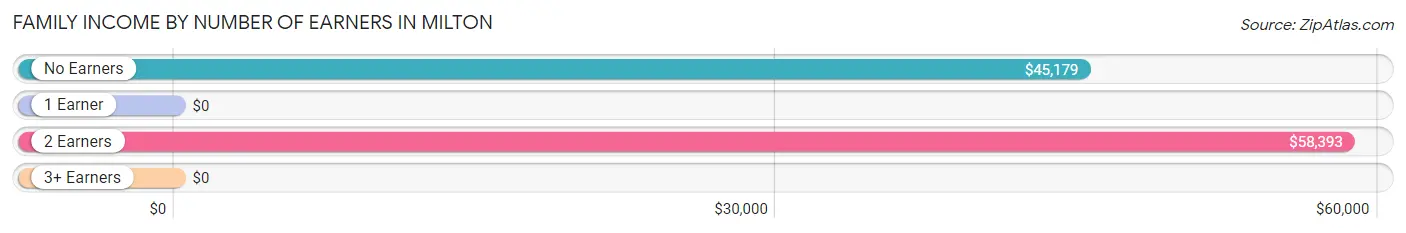
| Number of Earners | # Families | Median Income |
| No Earners | 32 (48.5%) | $45,179 |
| 1 Earner | 21 (31.8%) | $0 |
| 2 Earners | 9 (13.6%) | $58,393 |
| 3+ Earners | 4 (6.1%) | $0 |
| Total | 66 (100.0%) | $46,071 |
Household Income in Milton
Household Income Brackets in Milton
With 28 households falling in the category, the $35,000 to $49,999 income range is the most frequent in Milton, accounting for 34.2% of all households.
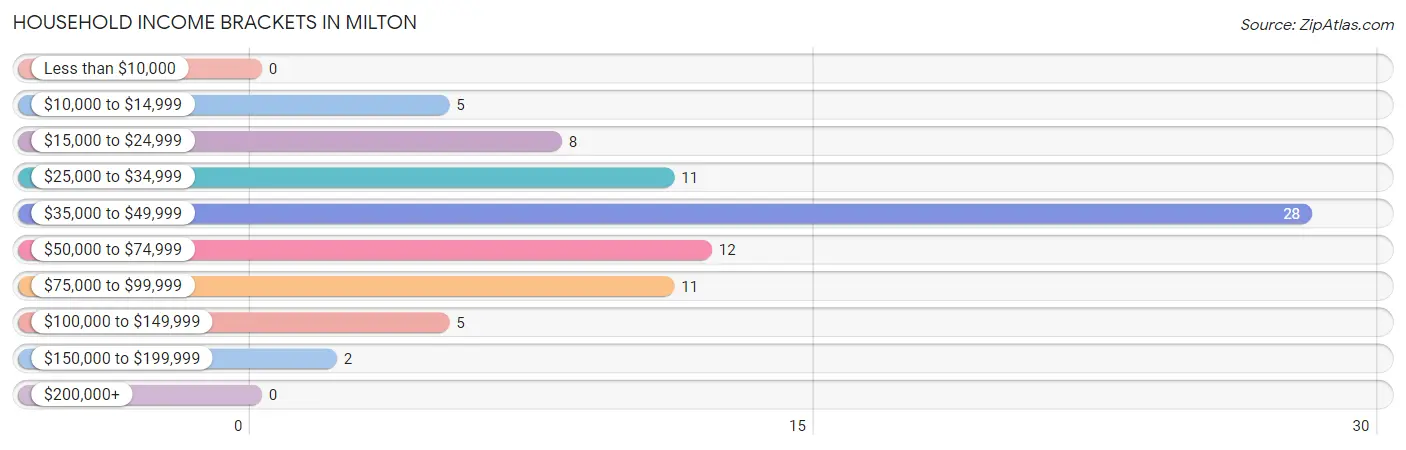
| Income Bracket | # Households | % Households |
| Less than $10,000 | 0 | 0.0% |
| $10,000 to $14,999 | 5 | 6.1% |
| $15,000 to $24,999 | 8 | 9.8% |
| $25,000 to $34,999 | 11 | 13.4% |
| $35,000 to $49,999 | 28 | 34.1% |
| $50,000 to $74,999 | 12 | 14.6% |
| $75,000 to $99,999 | 11 | 13.4% |
| $100,000 to $149,999 | 5 | 6.1% |
| $150,000 to $199,999 | 2 | 2.4% |
| $200,000+ | 0 | 0.0% |
Household Income by Householder Age in Milton
The median household income in Milton is $45,893, with the highest median household income of $88,750 found in the 25 to 44 years age bracket for the primary householder. A total of 12 households (14.6%) fall into this category. Meanwhile, the 45 to 64 years age bracket for the primary householder has the lowest median household income of $34,250, with 25 households (30.5%) in this group.
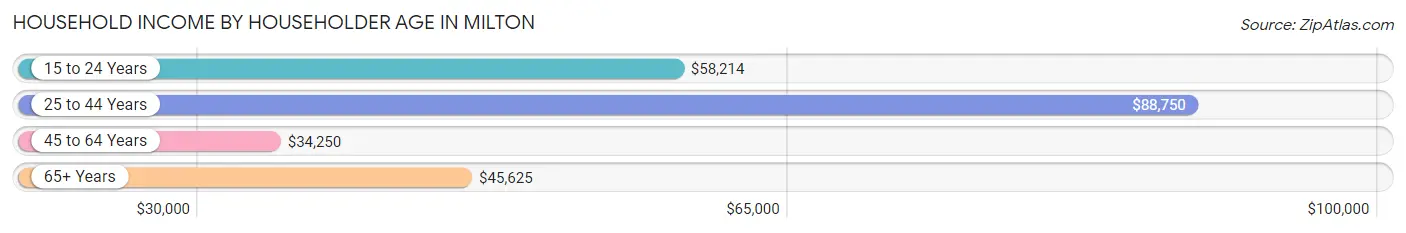
| Income Bracket | # Households | Median Income |
| 15 to 24 Years | 10 (12.2%) | $58,214 |
| 25 to 44 Years | 12 (14.6%) | $88,750 |
| 45 to 64 Years | 25 (30.5%) | $34,250 |
| 65+ Years | 35 (42.7%) | $45,625 |
| Total | 82 (100.0%) | $45,893 |
Poverty in Milton
Income Below Poverty by Sex and Age in Milton
With 25.0% poverty level for males and 37.4% for females among the residents of Milton, 15 year old males and 12 to 14 year old females are the most vulnerable to poverty, with 4 males (100.0%) and 6 females (100.0%) in their respective age groups living below the poverty level.
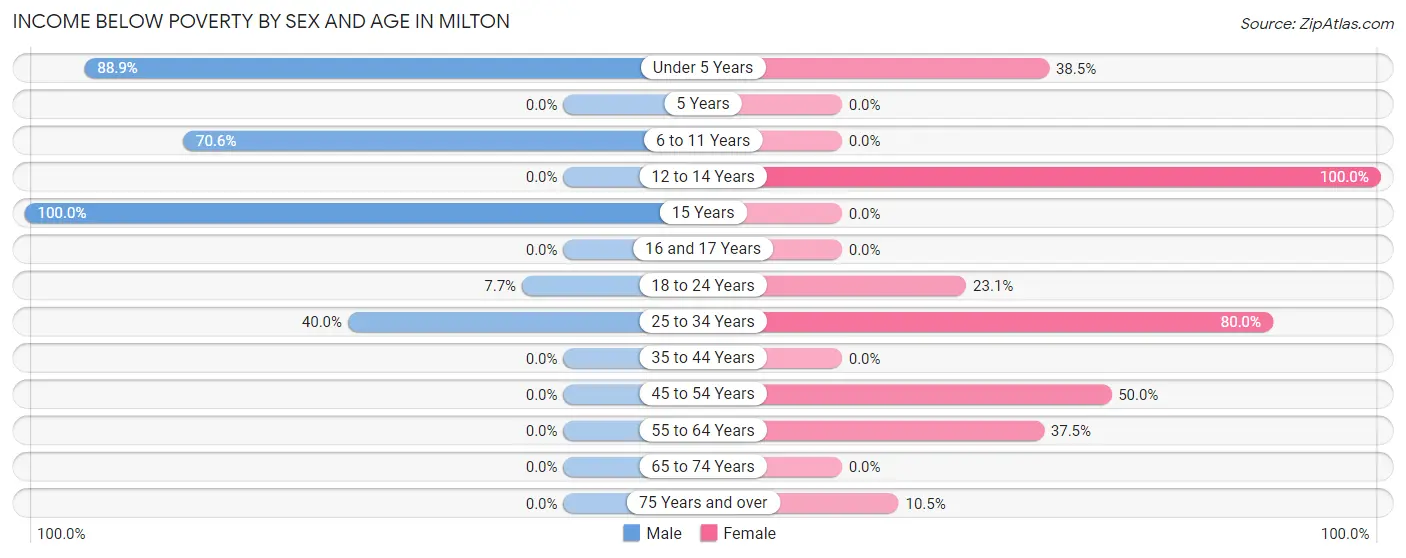
| Age Bracket | Male | Female |
| Under 5 Years | 8 (88.9%) | 5 (38.5%) |
| 5 Years | 0 (0.0%) | 0 (0.0%) |
| 6 to 11 Years | 12 (70.6%) | 0 (0.0%) |
| 12 to 14 Years | 0 (0.0%) | 6 (100.0%) |
| 15 Years | 4 (100.0%) | 0 (0.0%) |
| 16 and 17 Years | 0 (0.0%) | 0 (0.0%) |
| 18 to 24 Years | 1 (7.7%) | 3 (23.1%) |
| 25 to 34 Years | 2 (40.0%) | 16 (80.0%) |
| 35 to 44 Years | 0 (0.0%) | 0 (0.0%) |
| 45 to 54 Years | 0 (0.0%) | 2 (50.0%) |
| 55 to 64 Years | 0 (0.0%) | 6 (37.5%) |
| 65 to 74 Years | 0 (0.0%) | 0 (0.0%) |
| 75 Years and over | 0 (0.0%) | 2 (10.5%) |
| Total | 27 (25.0%) | 40 (37.4%) |
Income Above Poverty by Sex and Age in Milton
According to the poverty statistics in Milton, males aged 35 to 44 years and females aged 35 to 44 years are the age groups that are most secure financially, with 100.0% of males and 100.0% of females in these age groups living above the poverty line.
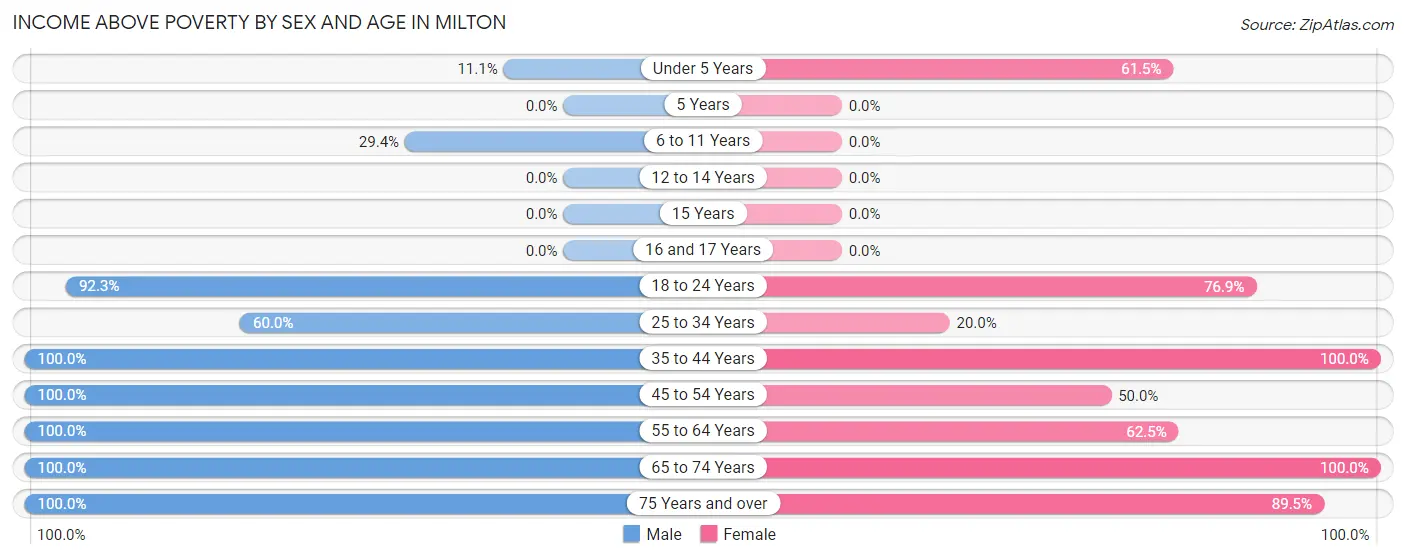
| Age Bracket | Male | Female |
| Under 5 Years | 1 (11.1%) | 8 (61.5%) |
| 5 Years | 0 (0.0%) | 0 (0.0%) |
| 6 to 11 Years | 5 (29.4%) | 0 (0.0%) |
| 12 to 14 Years | 0 (0.0%) | 0 (0.0%) |
| 15 Years | 0 (0.0%) | 0 (0.0%) |
| 16 and 17 Years | 0 (0.0%) | 0 (0.0%) |
| 18 to 24 Years | 12 (92.3%) | 10 (76.9%) |
| 25 to 34 Years | 3 (60.0%) | 4 (20.0%) |
| 35 to 44 Years | 5 (100.0%) | 2 (100.0%) |
| 45 to 54 Years | 9 (100.0%) | 2 (50.0%) |
| 55 to 64 Years | 14 (100.0%) | 10 (62.5%) |
| 65 to 74 Years | 9 (100.0%) | 14 (100.0%) |
| 75 Years and over | 23 (100.0%) | 17 (89.5%) |
| Total | 81 (75.0%) | 67 (62.6%) |
Income Below Poverty Among Married-Couple Families in Milton
The poverty statistics for married-couple families in Milton show that 2.2% or 1 of the total 46 families live below the poverty line. Families with 1 or 2 children have the highest poverty rate of 12.5%, comprising of 1 families. On the other hand, families with no children have the lowest poverty rate of 0.0%, which includes 0 families.
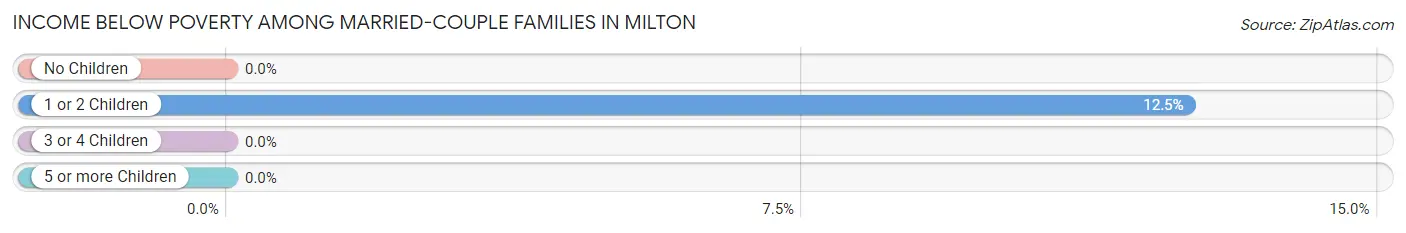
| Children | Above Poverty | Below Poverty |
| No Children | 38 (100.0%) | 0 (0.0%) |
| 1 or 2 Children | 7 (87.5%) | 1 (12.5%) |
| 3 or 4 Children | 0 (0.0%) | 0 (0.0%) |
| 5 or more Children | 0 (0.0%) | 0 (0.0%) |
| Total | 45 (97.8%) | 1 (2.2%) |
Income Below Poverty Among Single-Parent Households in Milton
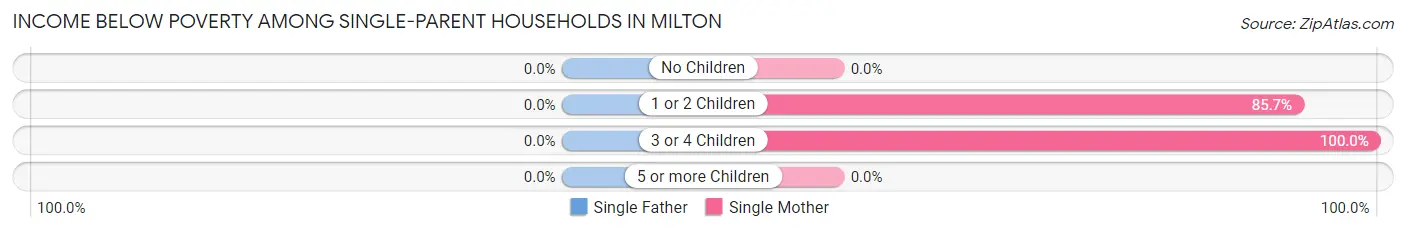
| Children | Single Father | Single Mother |
| No Children | 0 (0.0%) | 0 (0.0%) |
| 1 or 2 Children | 0 (0.0%) | 6 (85.7%) |
| 3 or 4 Children | 0 (0.0%) | 5 (100.0%) |
| 5 or more Children | 0 (0.0%) | 0 (0.0%) |
| Total | 0 (0.0%) | 11 (91.7%) |
Income Below Poverty Among Married-Couple vs Single-Parent Households in Milton
The poverty data for Milton shows that 1 of the married-couple family households (2.2%) and 11 of the single-parent households (55.0%) are living below the poverty level. Within the married-couple family households, those with 1 or 2 children have the highest poverty rate, with 1 households (12.5%) falling below the poverty line. Among the single-parent households, those with 3 or 4 children have the highest poverty rate, with 5 household (100.0%) living below poverty.
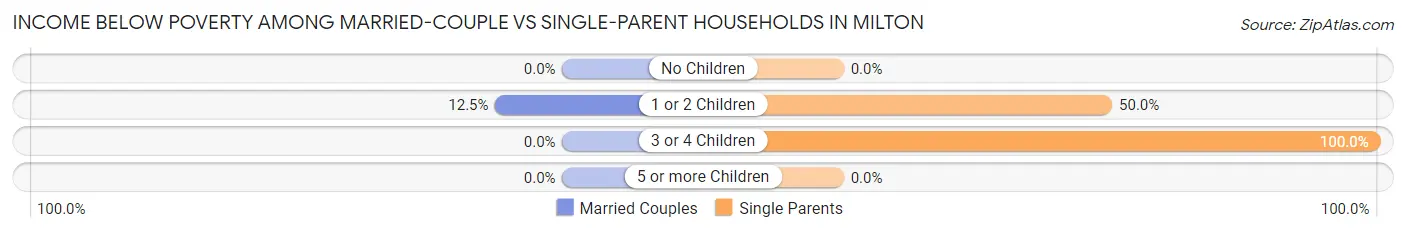
| Children | Married-Couple Families | Single-Parent Households |
| No Children | 0 (0.0%) | 0 (0.0%) |
| 1 or 2 Children | 1 (12.5%) | 6 (50.0%) |
| 3 or 4 Children | 0 (0.0%) | 5 (100.0%) |
| 5 or more Children | 0 (0.0%) | 0 (0.0%) |
| Total | 1 (2.2%) | 11 (55.0%) |
Race in Milton
The most populous races in Milton are White / Caucasian (207 | 96.3%), Hispanic or Latino (5 | 2.3%), and Native / Alaskan (4 | 1.9%).
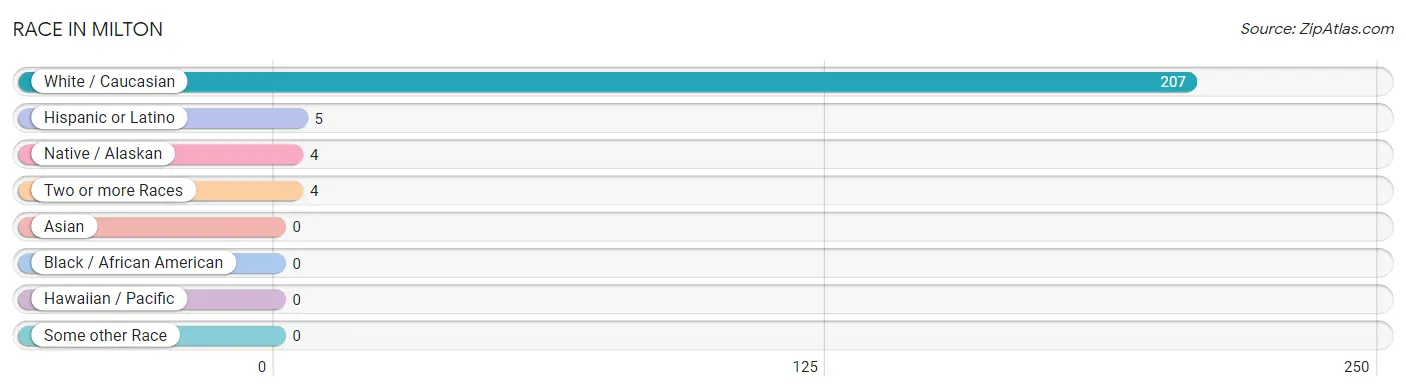
| Race | # Population | % Population |
| Asian | 0 | 0.0% |
| Black / African American | 0 | 0.0% |
| Hawaiian / Pacific | 0 | 0.0% |
| Hispanic or Latino | 5 | 2.3% |
| Native / Alaskan | 4 | 1.9% |
| White / Caucasian | 207 | 96.3% |
| Two or more Races | 4 | 1.9% |
| Some other Race | 0 | 0.0% |
| Total | 215 | 100.0% |
Ancestry in Milton
The most populous ancestries reported in Milton are German (39 | 18.1%), Irish (29 | 13.5%), European (26 | 12.1%), American (22 | 10.2%), and English (21 | 9.8%), together accounting for 63.7% of all Milton residents.
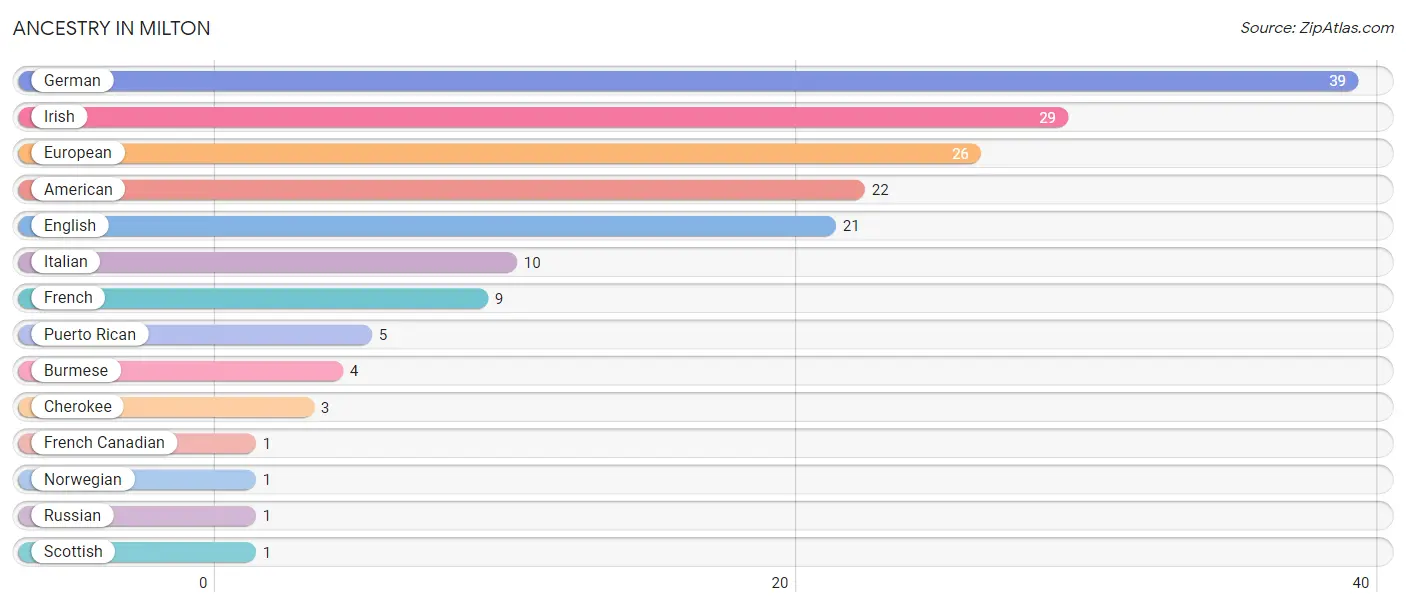
| Ancestry | # Population | % Population |
| American | 22 | 10.2% |
| Burmese | 4 | 1.9% |
| Cherokee | 3 | 1.4% |
| English | 21 | 9.8% |
| European | 26 | 12.1% |
| French | 9 | 4.2% |
| French Canadian | 1 | 0.5% |
| German | 39 | 18.1% |
| Irish | 29 | 13.5% |
| Italian | 10 | 4.6% |
| Norwegian | 1 | 0.5% |
| Puerto Rican | 5 | 2.3% |
| Russian | 1 | 0.5% |
| Scottish | 1 | 0.5% | View All 14 Rows |
Immigrants in Milton

| Immigration Origin | # Population | % Population | View All 0 Rows |
Sex and Age in Milton
Sex and Age in Milton
The most populous age groups in Milton are 80 to 84 Years (14 | 13.0%) for men and 75 to 79 Years (19 | 17.8%) for women.
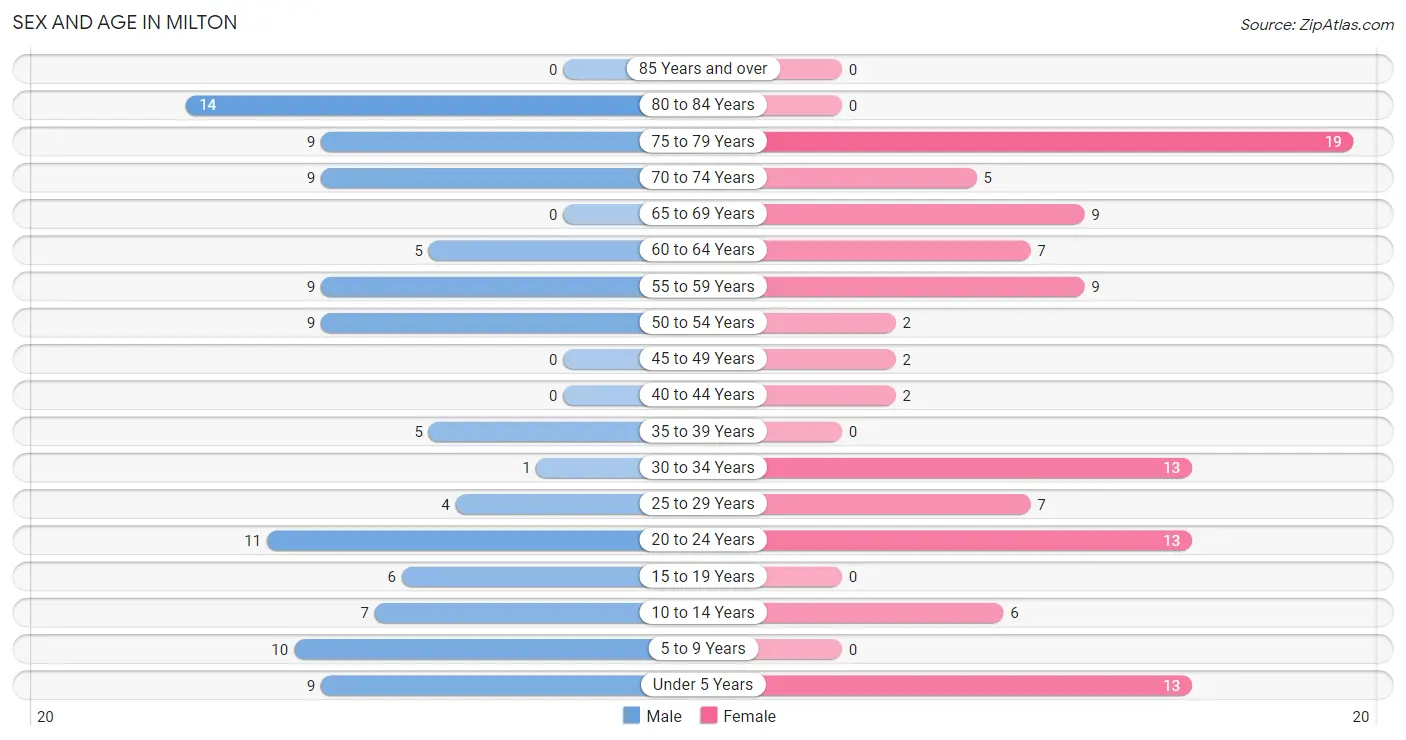
| Age Bracket | Male | Female |
| Under 5 Years | 9 (8.3%) | 13 (12.1%) |
| 5 to 9 Years | 10 (9.3%) | 0 (0.0%) |
| 10 to 14 Years | 7 (6.5%) | 6 (5.6%) |
| 15 to 19 Years | 6 (5.6%) | 0 (0.0%) |
| 20 to 24 Years | 11 (10.2%) | 13 (12.1%) |
| 25 to 29 Years | 4 (3.7%) | 7 (6.5%) |
| 30 to 34 Years | 1 (0.9%) | 13 (12.1%) |
| 35 to 39 Years | 5 (4.6%) | 0 (0.0%) |
| 40 to 44 Years | 0 (0.0%) | 2 (1.9%) |
| 45 to 49 Years | 0 (0.0%) | 2 (1.9%) |
| 50 to 54 Years | 9 (8.3%) | 2 (1.9%) |
| 55 to 59 Years | 9 (8.3%) | 9 (8.4%) |
| 60 to 64 Years | 5 (4.6%) | 7 (6.5%) |
| 65 to 69 Years | 0 (0.0%) | 9 (8.4%) |
| 70 to 74 Years | 9 (8.3%) | 5 (4.7%) |
| 75 to 79 Years | 9 (8.3%) | 19 (17.8%) |
| 80 to 84 Years | 14 (13.0%) | 0 (0.0%) |
| 85 Years and over | 0 (0.0%) | 0 (0.0%) |
| Total | 108 (100.0%) | 107 (100.0%) |
Families and Households in Milton
Median Family Size in Milton
The median family size in Milton is 2.89 persons per family, with single female/mother families (12 | 18.2%) accounting for the largest median family size of 4.75 persons per family. On the other hand, married-couple families (46 | 69.7%) represent the smallest median family size with 2.48 persons per family.
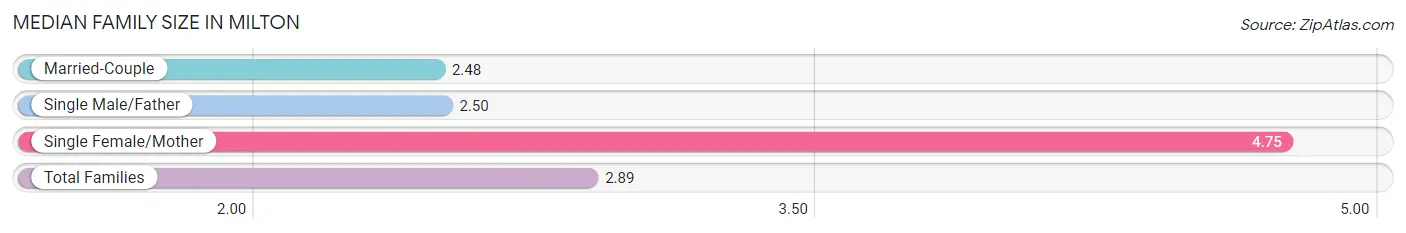
| Family Type | # Families | Family Size |
| Married-Couple | 46 (69.7%) | 2.48 |
| Single Male/Father | 8 (12.1%) | 2.50 |
| Single Female/Mother | 12 (18.2%) | 4.75 |
| Total Families | 66 (100.0%) | 2.89 |
Median Household Size in Milton
The median household size in Milton is 2.62 persons per household, with single female/mother households (12 | 14.6%) accounting for the largest median household size of 4.92 persons per household. non-family households (16 | 19.5%) represent the smallest median household size with 1.06 persons per household.
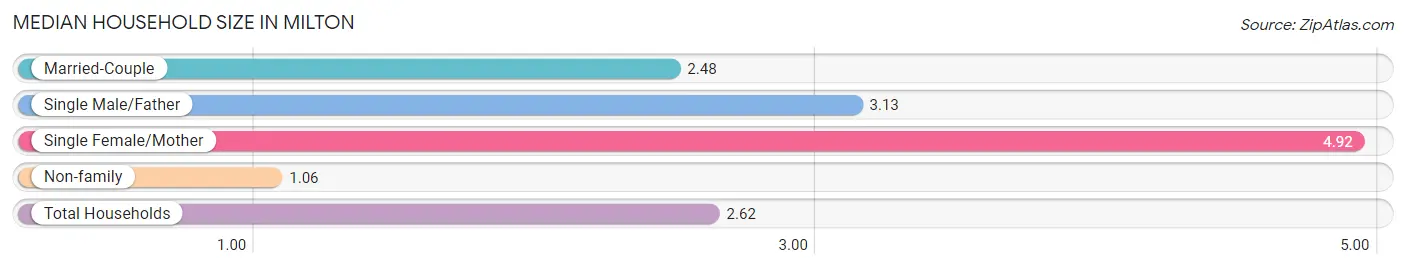
| Household Type | # Households | Household Size |
| Married-Couple | 46 (56.1%) | 2.48 |
| Single Male/Father | 8 (9.8%) | 3.13 |
| Single Female/Mother | 12 (14.6%) | 4.92 |
| Non-family | 16 (19.5%) | 1.06 |
| Total Households | 82 (100.0%) | 2.62 |
Household Size by Marriage Status in Milton
Out of a total of 82 households in Milton, 66 (80.5%) are family households, while 16 (19.5%) are nonfamily households. The most numerous type of family households are 2-person households, comprising 34, and the most common type of nonfamily households are 1-person households, comprising 14.
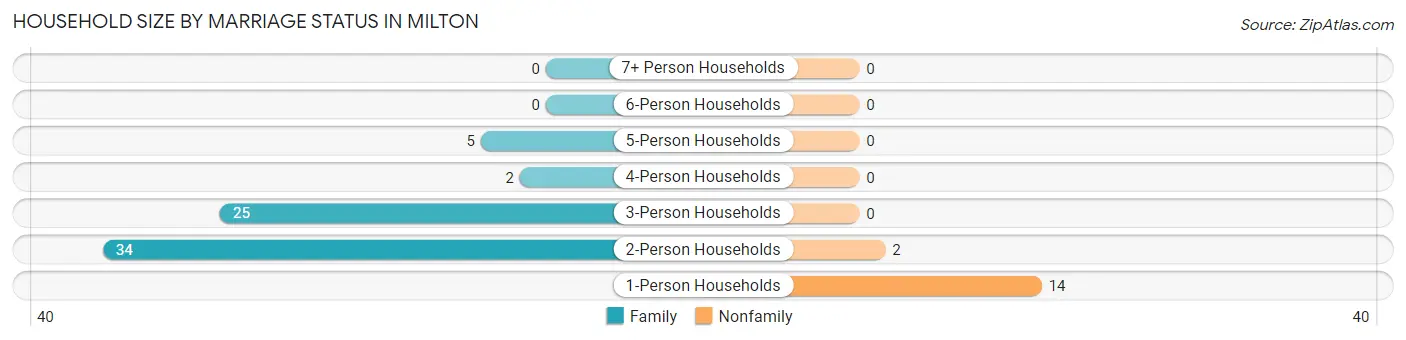
| Household Size | Family Households | Nonfamily Households |
| 1-Person Households | - | 14 (17.1%) |
| 2-Person Households | 34 (41.5%) | 2 (2.4%) |
| 3-Person Households | 25 (30.5%) | 0 (0.0%) |
| 4-Person Households | 2 (2.4%) | 0 (0.0%) |
| 5-Person Households | 5 (6.1%) | 0 (0.0%) |
| 6-Person Households | 0 (0.0%) | 0 (0.0%) |
| 7+ Person Households | 0 (0.0%) | 0 (0.0%) |
| Total | 66 (80.5%) | 16 (19.5%) |
Female Fertility in Milton
Fertility by Age in Milton
Average fertility rate in Milton is 81.0 births per 1,000 women. Women in the age bracket of 20 to 34 years have the highest fertility rate with 91.0 births per 1,000 women. Women in the age bracket of 20 to 34 years acount for 100.0% of all women with births.
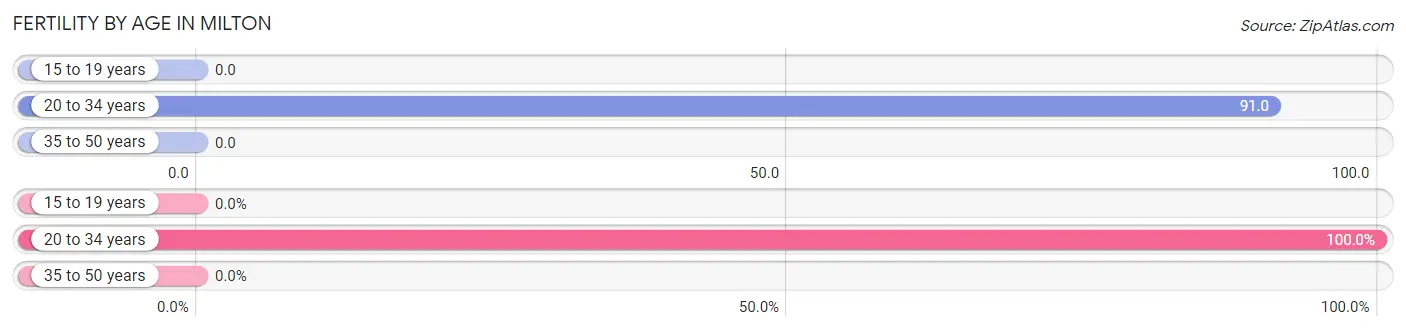
| Age Bracket | Women with Births | Births / 1,000 Women |
| 15 to 19 years | 0 (0.0%) | 0.0 |
| 20 to 34 years | 3 (100.0%) | 91.0 |
| 35 to 50 years | 0 (0.0%) | 0.0 |
| Total | 3 (100.0%) | 81.0 |
Fertility by Age by Marriage Status in Milton
33.3% of women with births (3) in Milton are married. The highest percentage of unmarried women with births falls into 20 to 34 years age bracket with 66.7% of them unmarried at the time of birth, while the lowest percentage of unmarried women with births belong to 20 to 34 years age bracket with 66.7% of them unmarried.
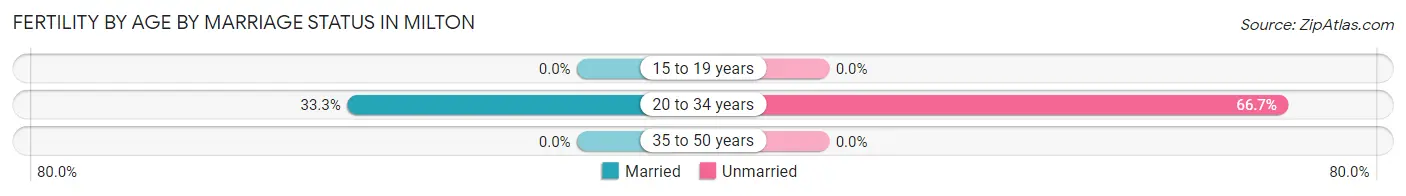
| Age Bracket | Married | Unmarried |
| 15 to 19 years | 0 (0.0%) | 0 (0.0%) |
| 20 to 34 years | 1 (33.3%) | 2 (66.7%) |
| 35 to 50 years | 0 (0.0%) | 0 (0.0%) |
| Total | 1 (33.3%) | 2 (66.7%) |
Fertility by Education in Milton
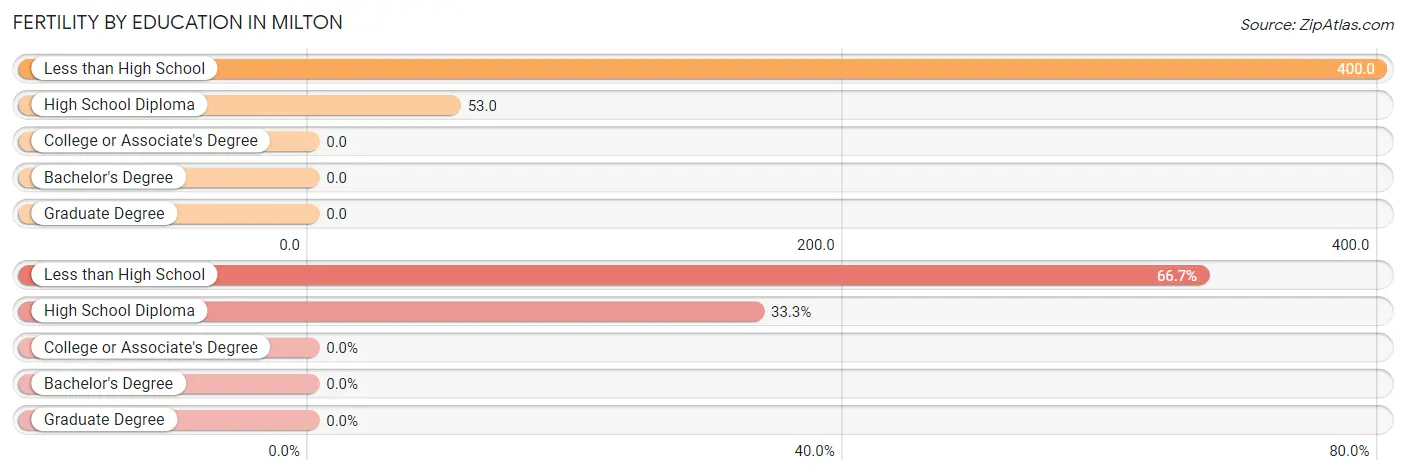
| Educational Attainment | Women with Births | Births / 1,000 Women |
| Less than High School | 2 (66.7%) | 400.0 |
| High School Diploma | 1 (33.3%) | 53.0 |
| College or Associate's Degree | 0 (0.0%) | 0.0 |
| Bachelor's Degree | 0 (0.0%) | 0.0 |
| Graduate Degree | 0 (0.0%) | 0.0 |
| Total | 3 (100.0%) | 81.0 |
Fertility by Education by Marriage Status in Milton
66.7% of women with births in Milton are unmarried. Women with the educational attainment of high school diploma are most likely to be married with 100.0% of them married at childbirth, while women with the educational attainment of less than high school are least likely to be married with 100.0% of them unmarried at childbirth.
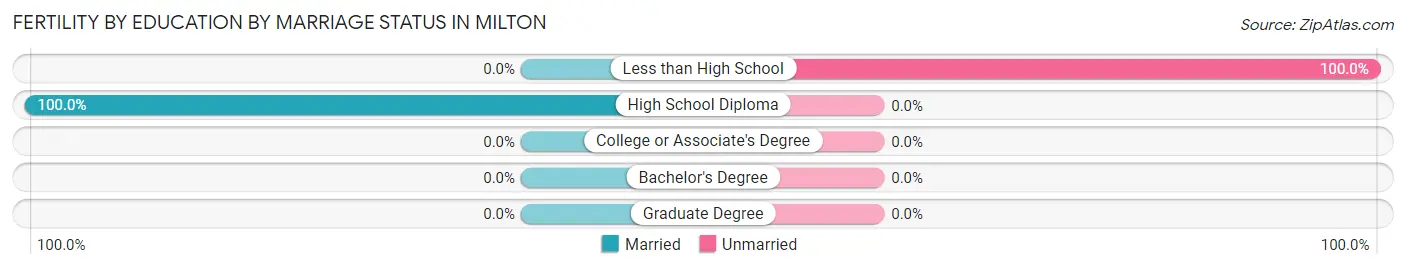
| Educational Attainment | Married | Unmarried |
| Less than High School | 0 (0.0%) | 2 (100.0%) |
| High School Diploma | 1 (100.0%) | 0 (0.0%) |
| College or Associate's Degree | 0 (0.0%) | 0 (0.0%) |
| Bachelor's Degree | 0 (0.0%) | 0 (0.0%) |
| Graduate Degree | 0 (0.0%) | 0 (0.0%) |
| Total | 1 (33.3%) | 2 (66.7%) |
Employment Characteristics in Milton
Employment by Class of Employer in Milton
Among the 57 employed individuals in Milton, private company employees (46 | 80.7%), not-for-profit organizations (5 | 8.8%), and self-employed (not incorporated) (3 | 5.3%) make up the most common classes of employment.
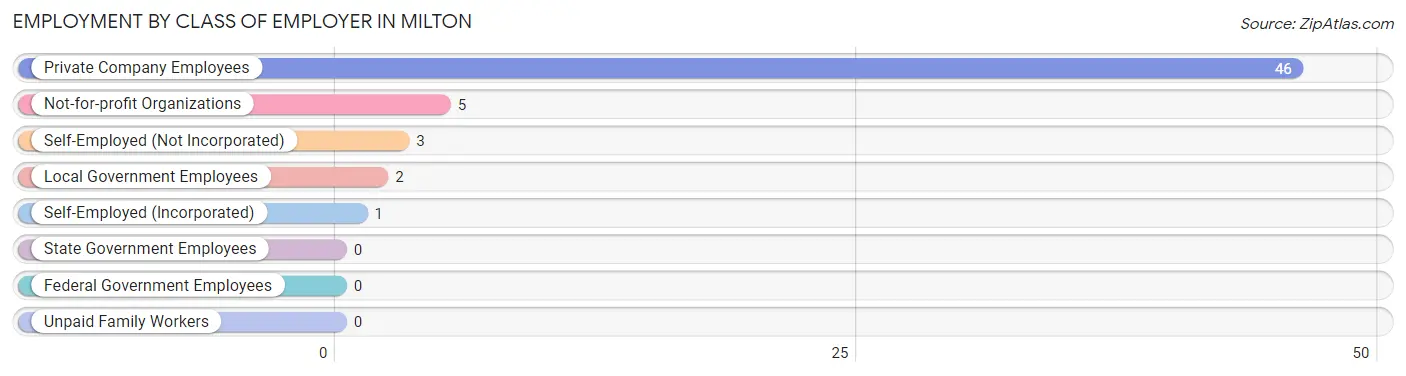
| Employer Class | # Employees | % Employees |
| Private Company Employees | 46 | 80.7% |
| Self-Employed (Incorporated) | 1 | 1.8% |
| Self-Employed (Not Incorporated) | 3 | 5.3% |
| Not-for-profit Organizations | 5 | 8.8% |
| Local Government Employees | 2 | 3.5% |
| State Government Employees | 0 | 0.0% |
| Federal Government Employees | 0 | 0.0% |
| Unpaid Family Workers | 0 | 0.0% |
| Total | 57 | 100.0% |
Employment Status by Age in Milton
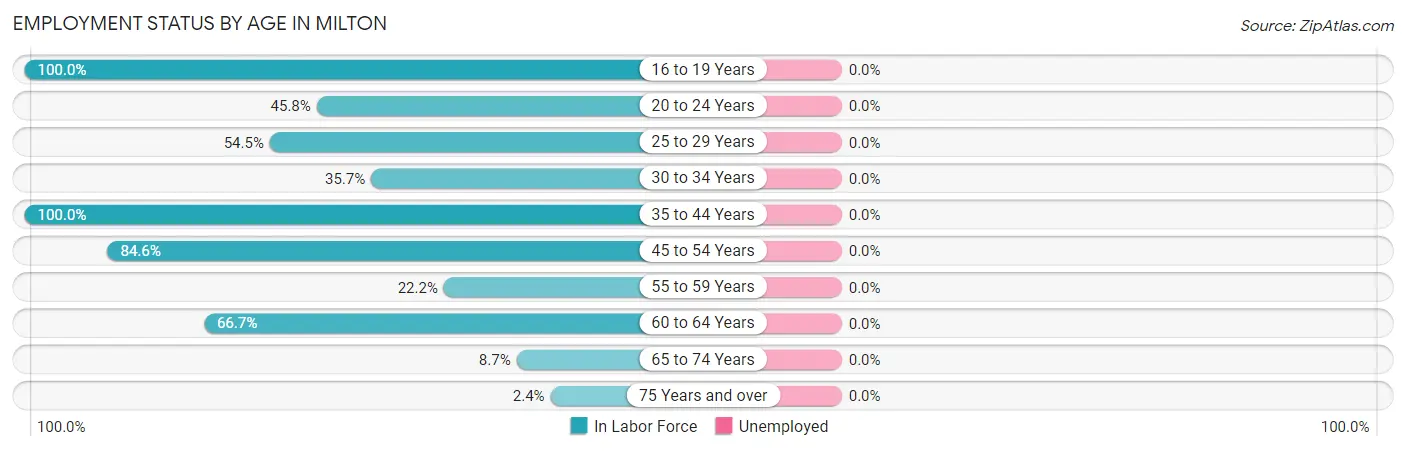
| Age Bracket | In Labor Force | Unemployed |
| 16 to 19 Years | 2 (100.0%) | 0 (0.0%) |
| 20 to 24 Years | 11 (45.8%) | 0 (0.0%) |
| 25 to 29 Years | 6 (54.5%) | 0 (0.0%) |
| 30 to 34 Years | 5 (35.7%) | 0 (0.0%) |
| 35 to 44 Years | 7 (100.0%) | 0 (0.0%) |
| 45 to 54 Years | 11 (84.6%) | 0 (0.0%) |
| 55 to 59 Years | 4 (22.2%) | 0 (0.0%) |
| 60 to 64 Years | 8 (66.7%) | 0 (0.0%) |
| 65 to 74 Years | 2 (8.7%) | 0 (0.0%) |
| 75 Years and over | 1 (2.4%) | 0 (0.0%) |
| Total | 57 (34.3%) | 0 (0.0%) |
Employment Status by Educational Attainment in Milton
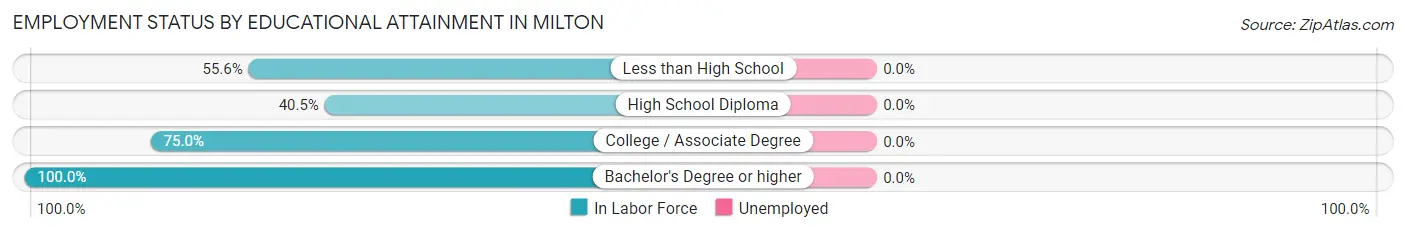
| Educational Attainment | In Labor Force | Unemployed |
| Less than High School | 10 (55.6%) | 0 (0.0%) |
| High School Diploma | 15 (40.5%) | 0 (0.0%) |
| College / Associate Degree | 12 (75.0%) | 0 (0.0%) |
| Bachelor's Degree or higher | 4 (100.0%) | 0 (0.0%) |
| Total | 41 (54.7%) | 0 (0.0%) |
Employment Occupations by Sex in Milton
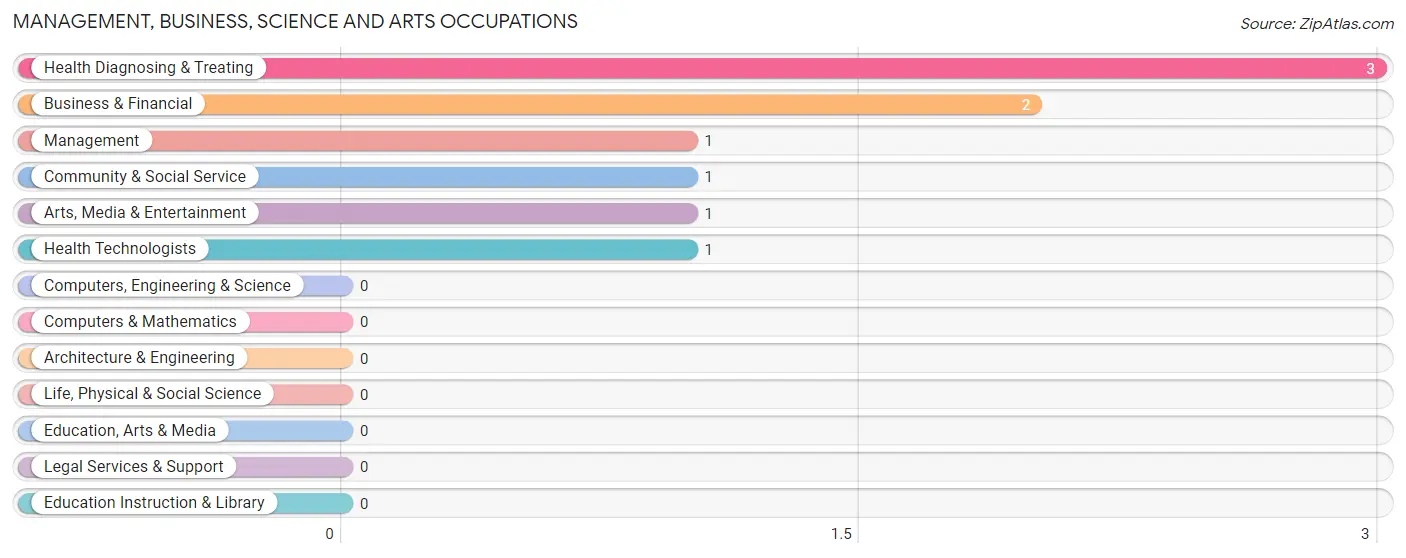
Management, Business, Science and Arts Occupations
The most common Management, Business, Science and Arts occupations in Milton are Health Diagnosing & Treating (3 | 5.3%), Business & Financial (2 | 3.5%), Management (1 | 1.8%), Community & Social Service (1 | 1.8%), and Arts, Media & Entertainment (1 | 1.8%).
Management, Business, Science and Arts Occupations by Sex
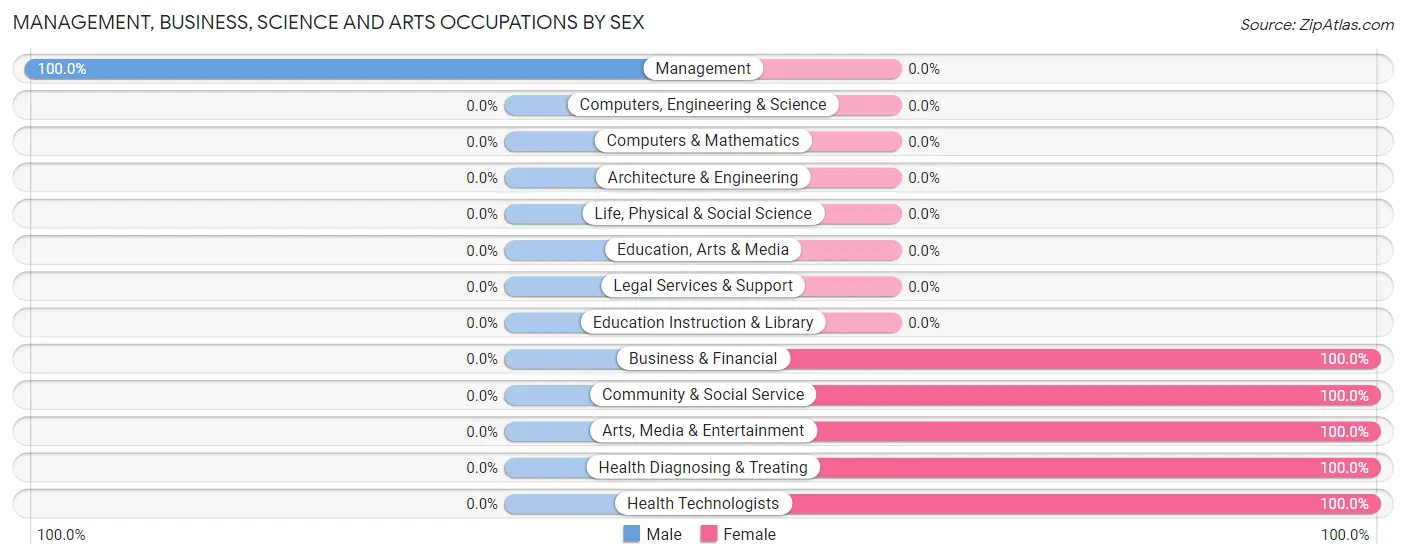
| Occupation | Male | Female |
| Management | 1 (100.0%) | 0 (0.0%) |
| Business & Financial | 0 (0.0%) | 2 (100.0%) |
| Computers, Engineering & Science | 0 (0.0%) | 0 (0.0%) |
| Computers & Mathematics | 0 (0.0%) | 0 (0.0%) |
| Architecture & Engineering | 0 (0.0%) | 0 (0.0%) |
| Life, Physical & Social Science | 0 (0.0%) | 0 (0.0%) |
| Community & Social Service | 0 (0.0%) | 1 (100.0%) |
| Education, Arts & Media | 0 (0.0%) | 0 (0.0%) |
| Legal Services & Support | 0 (0.0%) | 0 (0.0%) |
| Education Instruction & Library | 0 (0.0%) | 0 (0.0%) |
| Arts, Media & Entertainment | 0 (0.0%) | 1 (100.0%) |
| Health Diagnosing & Treating | 0 (0.0%) | 3 (100.0%) |
| Health Technologists | 0 (0.0%) | 1 (100.0%) |
| Total (Category) | 1 (14.3%) | 6 (85.7%) |
| Total (Overall) | 43 (75.4%) | 14 (24.6%) |
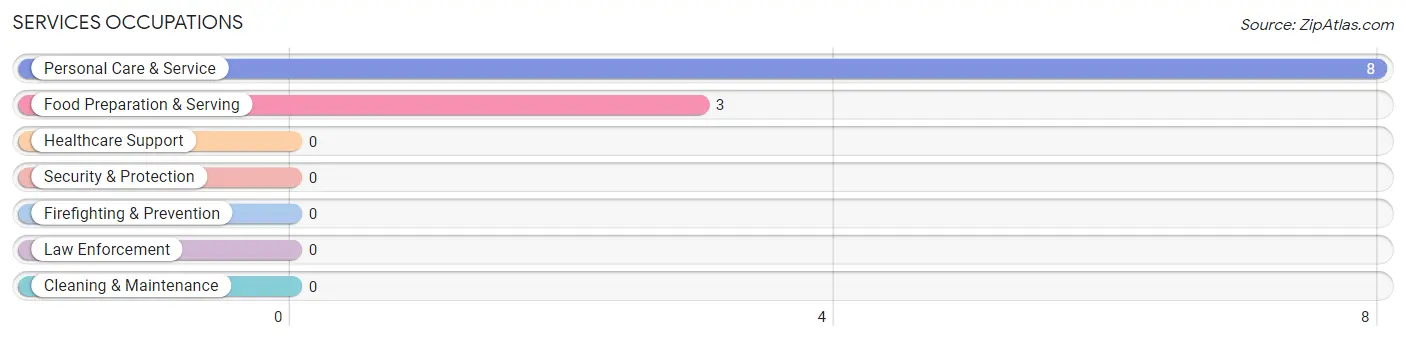
Services Occupations
The most common Services occupations in Milton are Personal Care & Service (8 | 14.0%), and Food Preparation & Serving (3 | 5.3%).
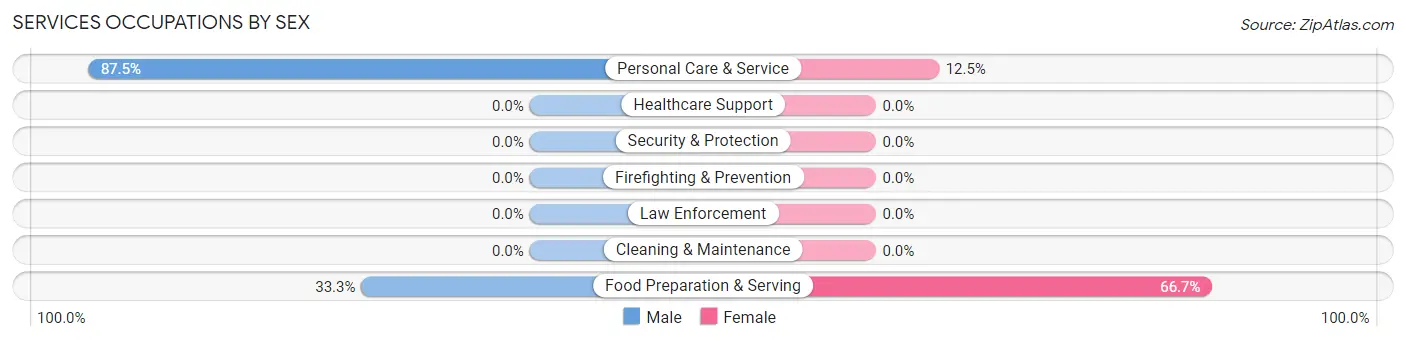
Services Occupations by Sex
Within the Services occupations in Milton, the most male-oriented occupations are Personal Care & Service (87.5%), and Food Preparation & Serving (33.3%), while the most female-oriented occupations are Food Preparation & Serving (66.7%), and Personal Care & Service (12.5%).
| Occupation | Male | Female |
| Healthcare Support | 0 (0.0%) | 0 (0.0%) |
| Security & Protection | 0 (0.0%) | 0 (0.0%) |
| Firefighting & Prevention | 0 (0.0%) | 0 (0.0%) |
| Law Enforcement | 0 (0.0%) | 0 (0.0%) |
| Food Preparation & Serving | 1 (33.3%) | 2 (66.7%) |
| Cleaning & Maintenance | 0 (0.0%) | 0 (0.0%) |
| Personal Care & Service | 7 (87.5%) | 1 (12.5%) |
| Total (Category) | 8 (72.7%) | 3 (27.3%) |
| Total (Overall) | 43 (75.4%) | 14 (24.6%) |
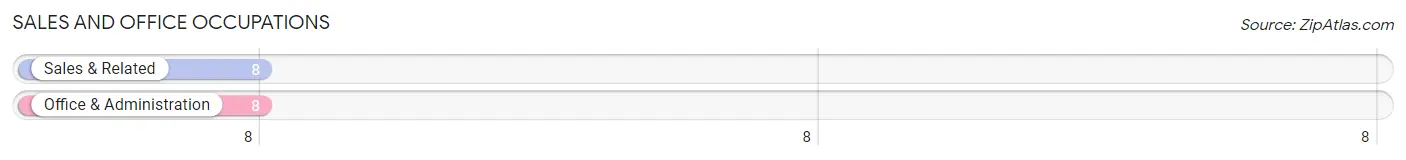
Sales and Office Occupations
The most common Sales and Office occupations in Milton are Sales & Related (8 | 14.0%), and Office & Administration (8 | 14.0%).
Sales and Office Occupations by Sex

| Occupation | Male | Female |
| Sales & Related | 8 (100.0%) | 0 (0.0%) |
| Office & Administration | 3 (37.5%) | 5 (62.5%) |
| Total (Category) | 11 (68.8%) | 5 (31.2%) |
| Total (Overall) | 43 (75.4%) | 14 (24.6%) |
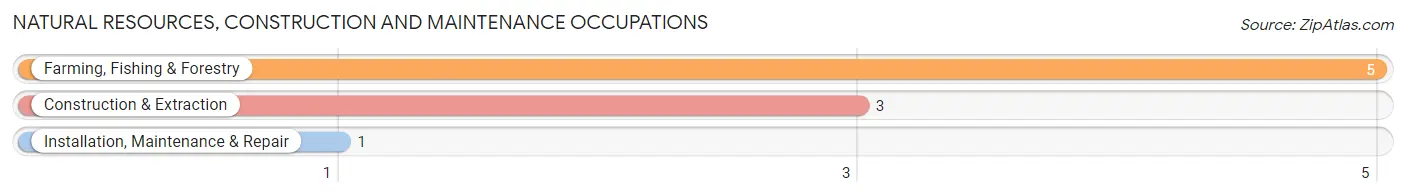
Natural Resources, Construction and Maintenance Occupations
The most common Natural Resources, Construction and Maintenance occupations in Milton are Farming, Fishing & Forestry (5 | 8.8%), Construction & Extraction (3 | 5.3%), and Installation, Maintenance & Repair (1 | 1.8%).
Natural Resources, Construction and Maintenance Occupations by Sex
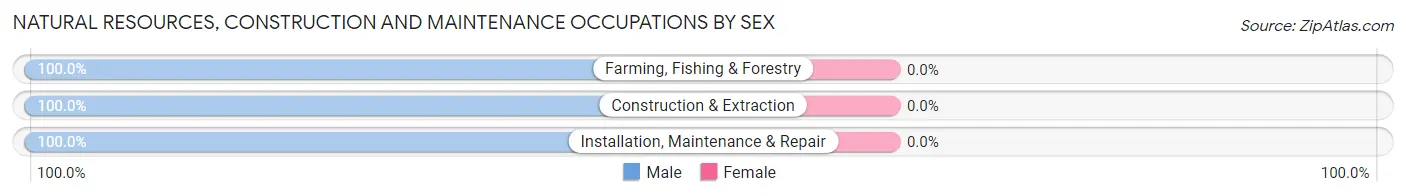
| Occupation | Male | Female |
| Farming, Fishing & Forestry | 5 (100.0%) | 0 (0.0%) |
| Construction & Extraction | 3 (100.0%) | 0 (0.0%) |
| Installation, Maintenance & Repair | 1 (100.0%) | 0 (0.0%) |
| Total (Category) | 9 (100.0%) | 0 (0.0%) |
| Total (Overall) | 43 (75.4%) | 14 (24.6%) |
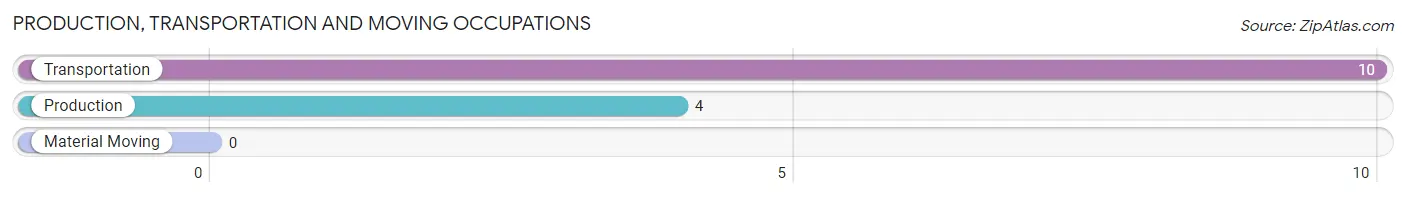
Production, Transportation and Moving Occupations
The most common Production, Transportation and Moving occupations in Milton are Transportation (10 | 17.5%), and Production (4 | 7.0%).
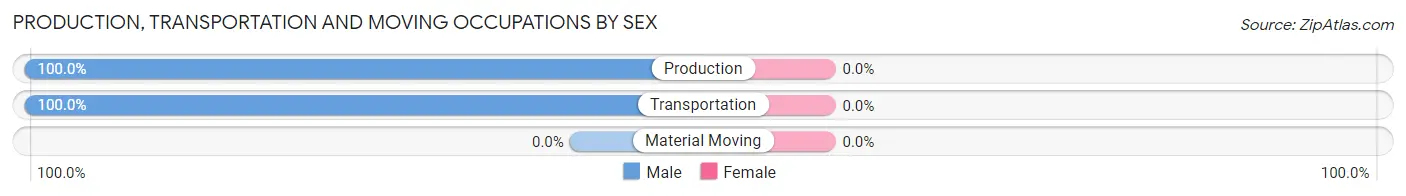
Production, Transportation and Moving Occupations by Sex
| Occupation | Male | Female |
| Production | 4 (100.0%) | 0 (0.0%) |
| Transportation | 10 (100.0%) | 0 (0.0%) |
| Material Moving | 0 (0.0%) | 0 (0.0%) |
| Total (Category) | 14 (100.0%) | 0 (0.0%) |
| Total (Overall) | 43 (75.4%) | 14 (24.6%) |
Employment Industries by Sex in Milton
Employment Industries in Milton
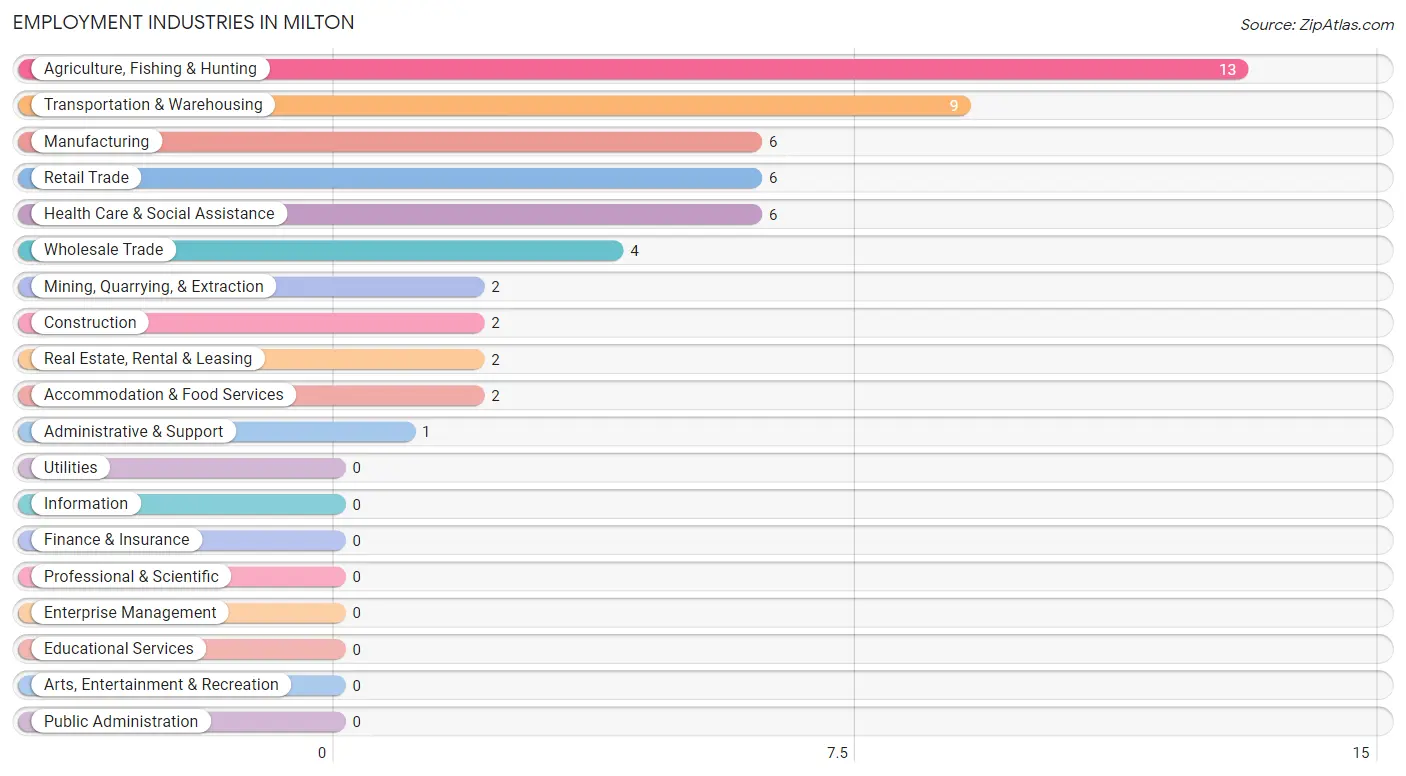
The major employment industries in Milton include Agriculture, Fishing & Hunting (13 | 22.8%), Transportation & Warehousing (9 | 15.8%), Manufacturing (6 | 10.5%), Retail Trade (6 | 10.5%), and Health Care & Social Assistance (6 | 10.5%).
Employment Industries by Sex in Milton
The Milton industries that see more men than women are Agriculture, Fishing & Hunting (100.0%), Mining, Quarrying, & Extraction (100.0%), and Construction (100.0%), whereas the industries that tend to have a higher number of women are Health Care & Social Assistance (100.0%), Accommodation & Food Services (100.0%), and Wholesale Trade (50.0%).
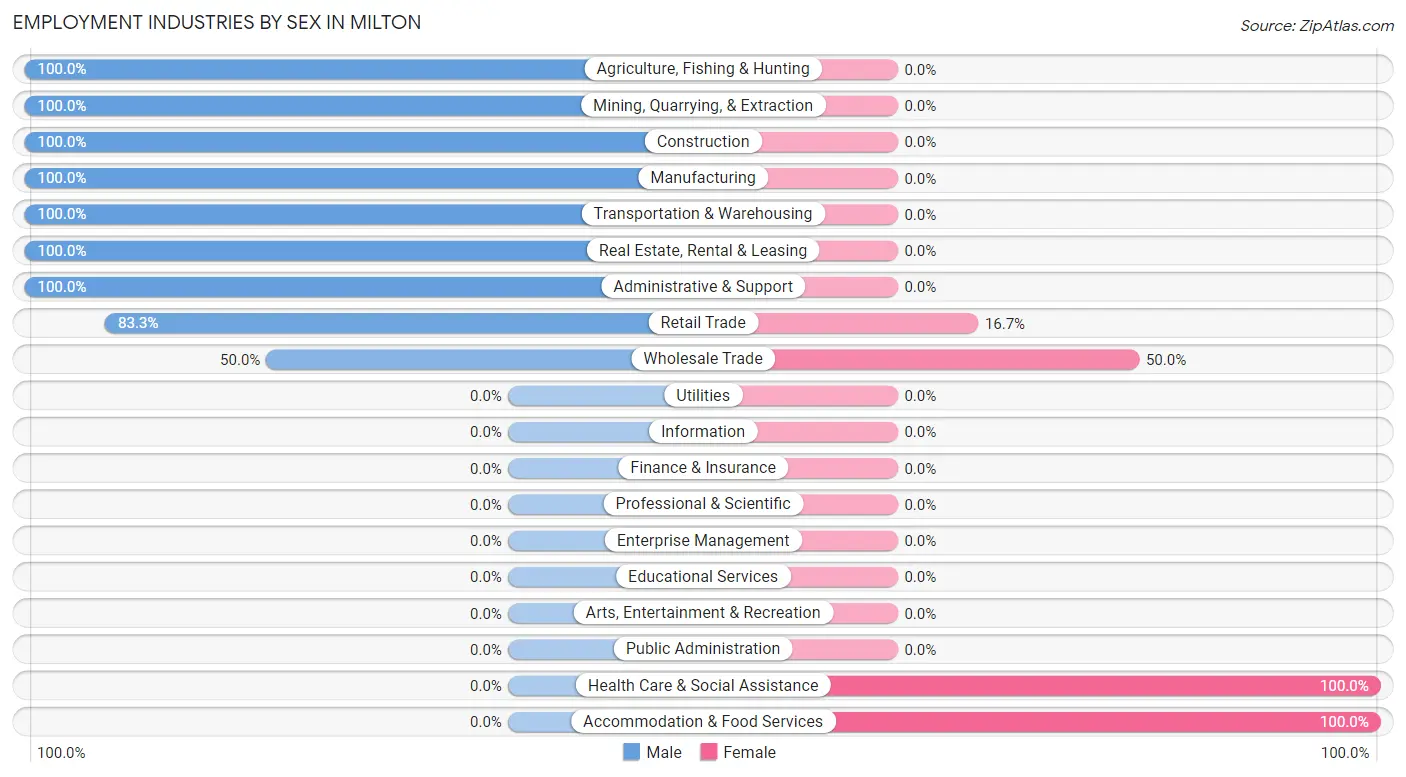
| Industry | Male | Female |
| Agriculture, Fishing & Hunting | 13 (100.0%) | 0 (0.0%) |
| Mining, Quarrying, & Extraction | 2 (100.0%) | 0 (0.0%) |
| Construction | 2 (100.0%) | 0 (0.0%) |
| Manufacturing | 6 (100.0%) | 0 (0.0%) |
| Wholesale Trade | 2 (50.0%) | 2 (50.0%) |
| Retail Trade | 5 (83.3%) | 1 (16.7%) |
| Transportation & Warehousing | 9 (100.0%) | 0 (0.0%) |
| Utilities | 0 (0.0%) | 0 (0.0%) |
| Information | 0 (0.0%) | 0 (0.0%) |
| Finance & Insurance | 0 (0.0%) | 0 (0.0%) |
| Real Estate, Rental & Leasing | 2 (100.0%) | 0 (0.0%) |
| Professional & Scientific | 0 (0.0%) | 0 (0.0%) |
| Enterprise Management | 0 (0.0%) | 0 (0.0%) |
| Administrative & Support | 1 (100.0%) | 0 (0.0%) |
| Educational Services | 0 (0.0%) | 0 (0.0%) |
| Health Care & Social Assistance | 0 (0.0%) | 6 (100.0%) |
| Arts, Entertainment & Recreation | 0 (0.0%) | 0 (0.0%) |
| Accommodation & Food Services | 0 (0.0%) | 2 (100.0%) |
| Public Administration | 0 (0.0%) | 0 (0.0%) |
| Total | 43 (75.4%) | 14 (24.6%) |
Education in Milton
School Enrollment in Milton
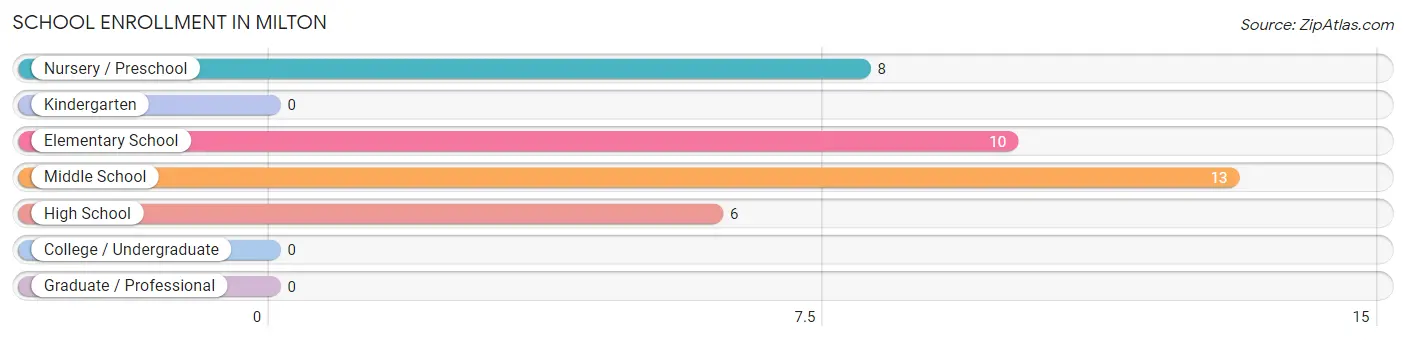
The most common levels of schooling among the 37 students in Milton are middle school (13 | 35.1%), elementary school (10 | 27.0%), and nursery / preschool (8 | 21.6%).
| School Level | # Students | % Students |
| Nursery / Preschool | 8 | 21.6% |
| Kindergarten | 0 | 0.0% |
| Elementary School | 10 | 27.0% |
| Middle School | 13 | 35.1% |
| High School | 6 | 16.2% |
| College / Undergraduate | 0 | 0.0% |
| Graduate / Professional | 0 | 0.0% |
| Total | 37 | 100.0% |
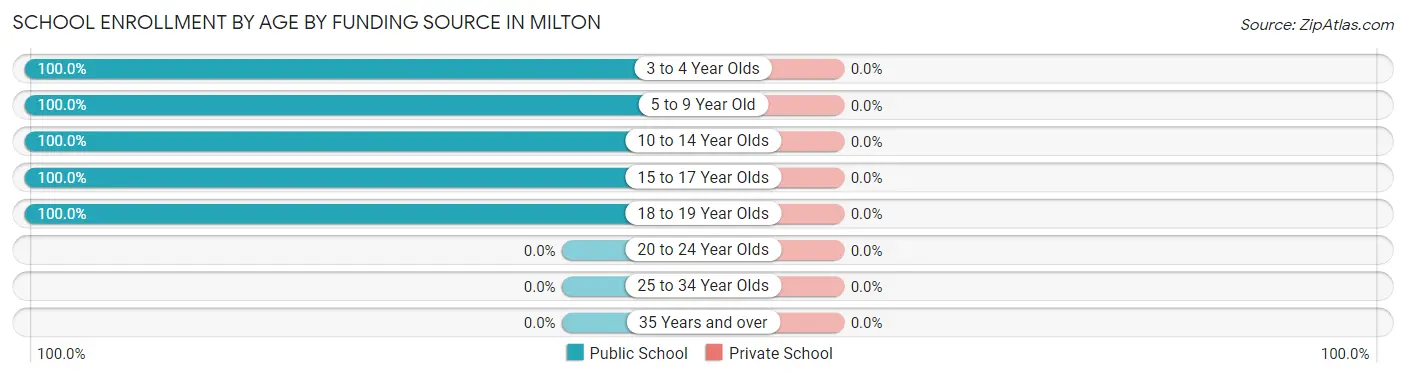
School Enrollment by Age by Funding Source in Milton
| Age Bracket | Public School | Private School |
| 3 to 4 Year Olds | 8 (100.0%) | 0 (0.0%) |
| 5 to 9 Year Old | 10 (100.0%) | 0 (0.0%) |
| 10 to 14 Year Olds | 13 (100.0%) | 0 (0.0%) |
| 15 to 17 Year Olds | 4 (100.0%) | 0 (0.0%) |
| 18 to 19 Year Olds | 2 (100.0%) | 0 (0.0%) |
| 20 to 24 Year Olds | 0 (0.0%) | 0 (0.0%) |
| 25 to 34 Year Olds | 0 (0.0%) | 0 (0.0%) |
| 35 Years and over | 0 (0.0%) | 0 (0.0%) |
| Total | 37 (100.0%) | 0 (0.0%) |
Educational Attainment by Field of Study in Milton
Bio, nature & agricultural (2 | 50.0%), science & technology (1 | 25.0%), and business (1 | 25.0%) are the most common fields of study among 4 individuals in Milton who have obtained a bachelor's degree or higher.
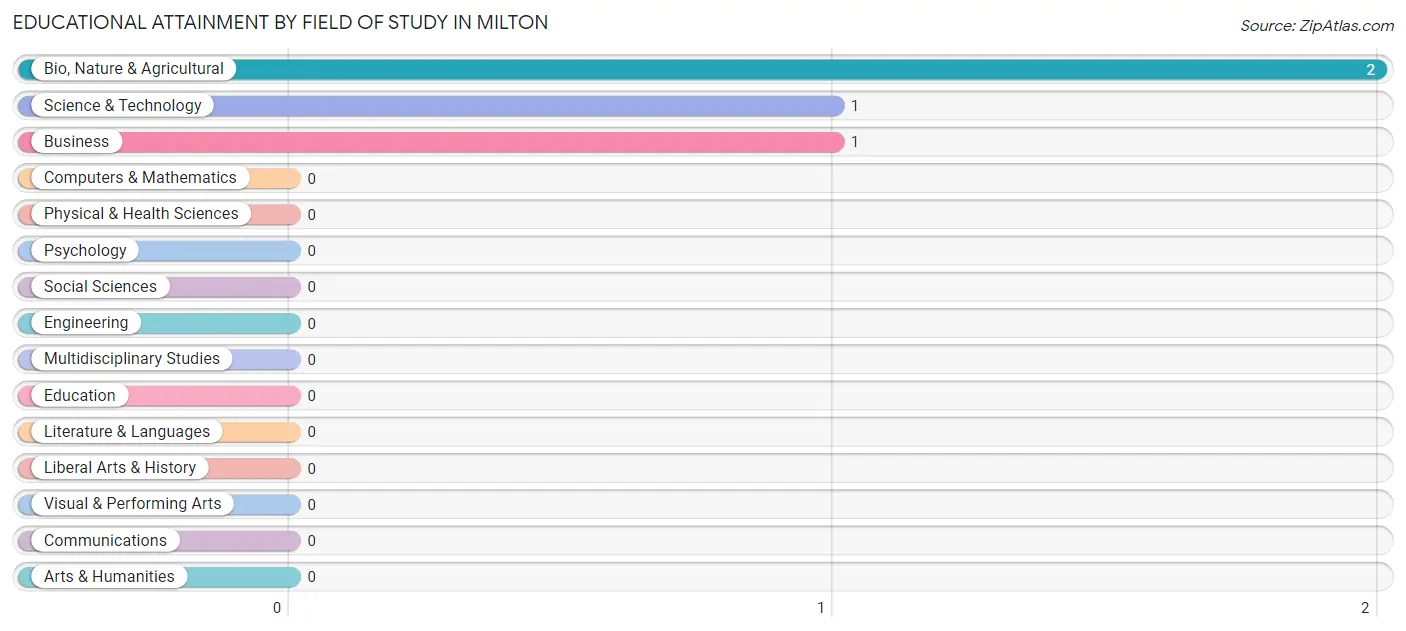
| Field of Study | # Graduates | % Graduates |
| Computers & Mathematics | 0 | 0.0% |
| Bio, Nature & Agricultural | 2 | 50.0% |
| Physical & Health Sciences | 0 | 0.0% |
| Psychology | 0 | 0.0% |
| Social Sciences | 0 | 0.0% |
| Engineering | 0 | 0.0% |
| Multidisciplinary Studies | 0 | 0.0% |
| Science & Technology | 1 | 25.0% |
| Business | 1 | 25.0% |
| Education | 0 | 0.0% |
| Literature & Languages | 0 | 0.0% |
| Liberal Arts & History | 0 | 0.0% |
| Visual & Performing Arts | 0 | 0.0% |
| Communications | 0 | 0.0% |
| Arts & Humanities | 0 | 0.0% |
| Total | 4 | 100.0% |
Transportation & Commute in Milton
Vehicle Availability by Sex in Milton
The most prevalent vehicle ownership categories in Milton are males with 3 vehicles (26, accounting for 60.5%) and females with 3 vehicles (5, making up 185.7%).
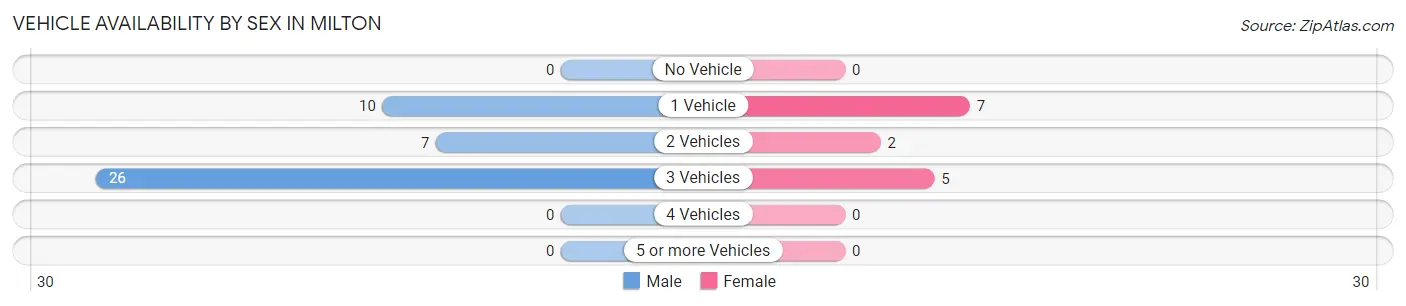
| Vehicles Available | Male | Female |
| No Vehicle | 0 (0.0%) | 0 (0.0%) |
| 1 Vehicle | 10 (23.3%) | 7 (50.0%) |
| 2 Vehicles | 7 (16.3%) | 2 (14.3%) |
| 3 Vehicles | 26 (60.5%) | 5 (35.7%) |
| 4 Vehicles | 0 (0.0%) | 0 (0.0%) |
| 5 or more Vehicles | 0 (0.0%) | 0 (0.0%) |
| Total | 43 (100.0%) | 14 (100.0%) |
Commute Time in Milton
The most frequently occuring commute durations in Milton are 30 to 34 minutes (10 commuters, 17.9%), 20 to 24 minutes (9 commuters, 16.1%), and 45 to 59 minutes (9 commuters, 16.1%).
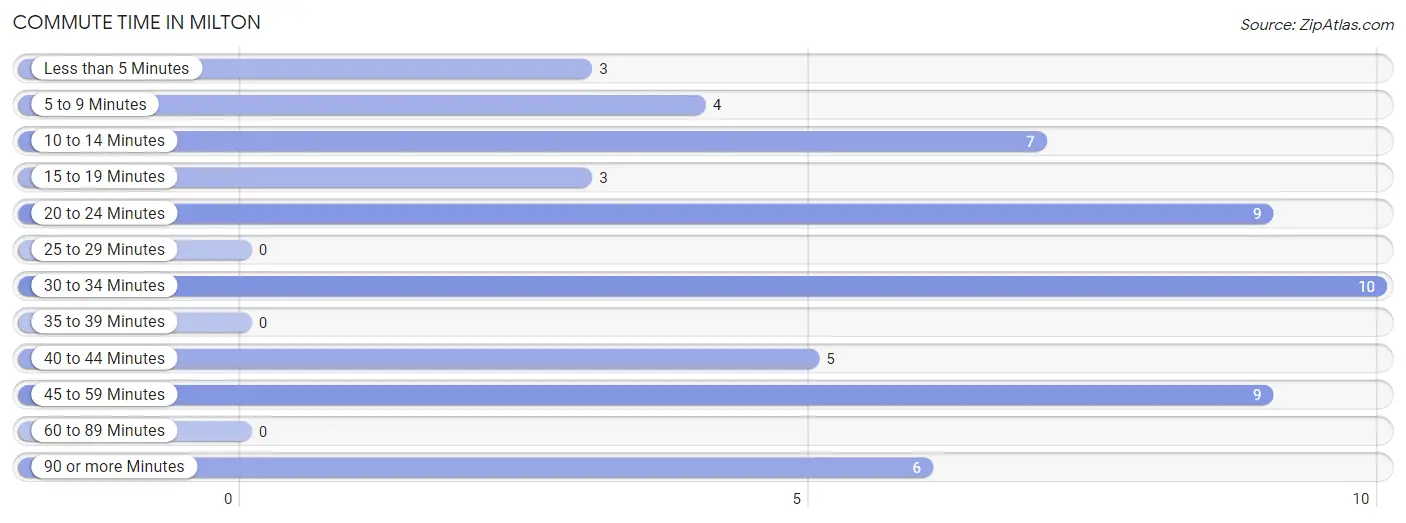
| Commute Time | # Commuters | % Commuters |
| Less than 5 Minutes | 3 | 5.4% |
| 5 to 9 Minutes | 4 | 7.1% |
| 10 to 14 Minutes | 7 | 12.5% |
| 15 to 19 Minutes | 3 | 5.4% |
| 20 to 24 Minutes | 9 | 16.1% |
| 25 to 29 Minutes | 0 | 0.0% |
| 30 to 34 Minutes | 10 | 17.9% |
| 35 to 39 Minutes | 0 | 0.0% |
| 40 to 44 Minutes | 5 | 8.9% |
| 45 to 59 Minutes | 9 | 16.1% |
| 60 to 89 Minutes | 0 | 0.0% |
| 90 or more Minutes | 6 | 10.7% |
Commute Time by Sex in Milton
The most common commute times in Milton are 30 to 34 minutes (9 commuters, 20.9%) for males and 45 to 59 minutes (4 commuters, 30.8%) for females.
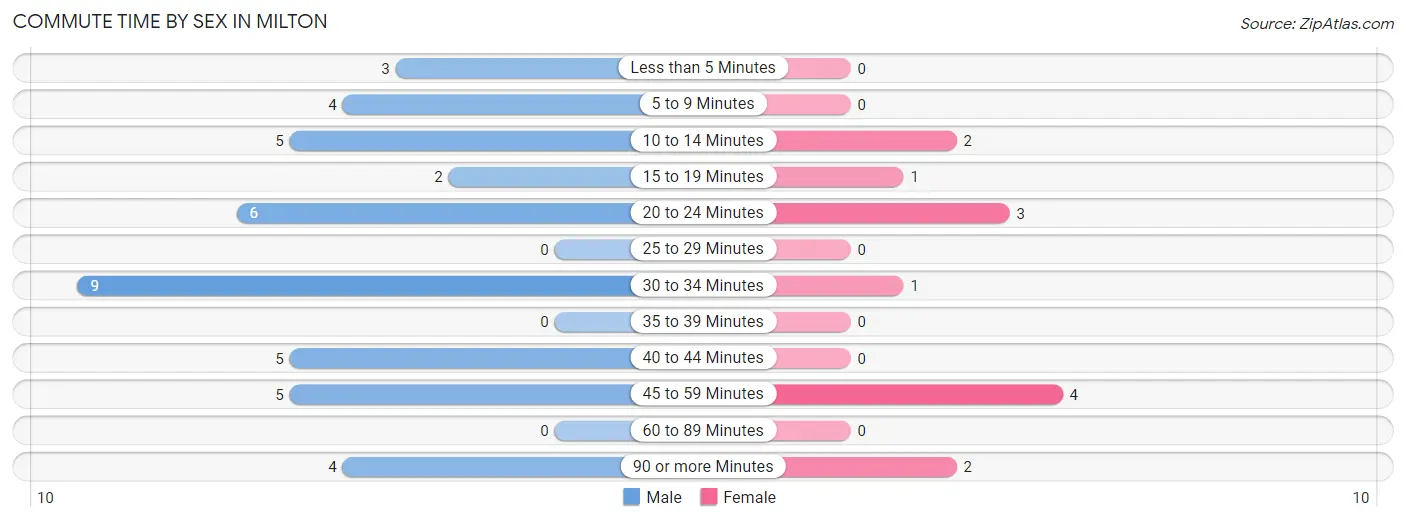
| Commute Time | Male | Female |
| Less than 5 Minutes | 3 (7.0%) | 0 (0.0%) |
| 5 to 9 Minutes | 4 (9.3%) | 0 (0.0%) |
| 10 to 14 Minutes | 5 (11.6%) | 2 (15.4%) |
| 15 to 19 Minutes | 2 (4.6%) | 1 (7.7%) |
| 20 to 24 Minutes | 6 (14.0%) | 3 (23.1%) |
| 25 to 29 Minutes | 0 (0.0%) | 0 (0.0%) |
| 30 to 34 Minutes | 9 (20.9%) | 1 (7.7%) |
| 35 to 39 Minutes | 0 (0.0%) | 0 (0.0%) |
| 40 to 44 Minutes | 5 (11.6%) | 0 (0.0%) |
| 45 to 59 Minutes | 5 (11.6%) | 4 (30.8%) |
| 60 to 89 Minutes | 0 (0.0%) | 0 (0.0%) |
| 90 or more Minutes | 4 (9.3%) | 2 (15.4%) |
Time of Departure to Work by Sex in Milton
The most frequent times of departure to work in Milton are 12:00 AM to 4:59 AM (22, 51.2%) for males and 8:00 AM to 8:29 AM (3, 23.1%) for females.
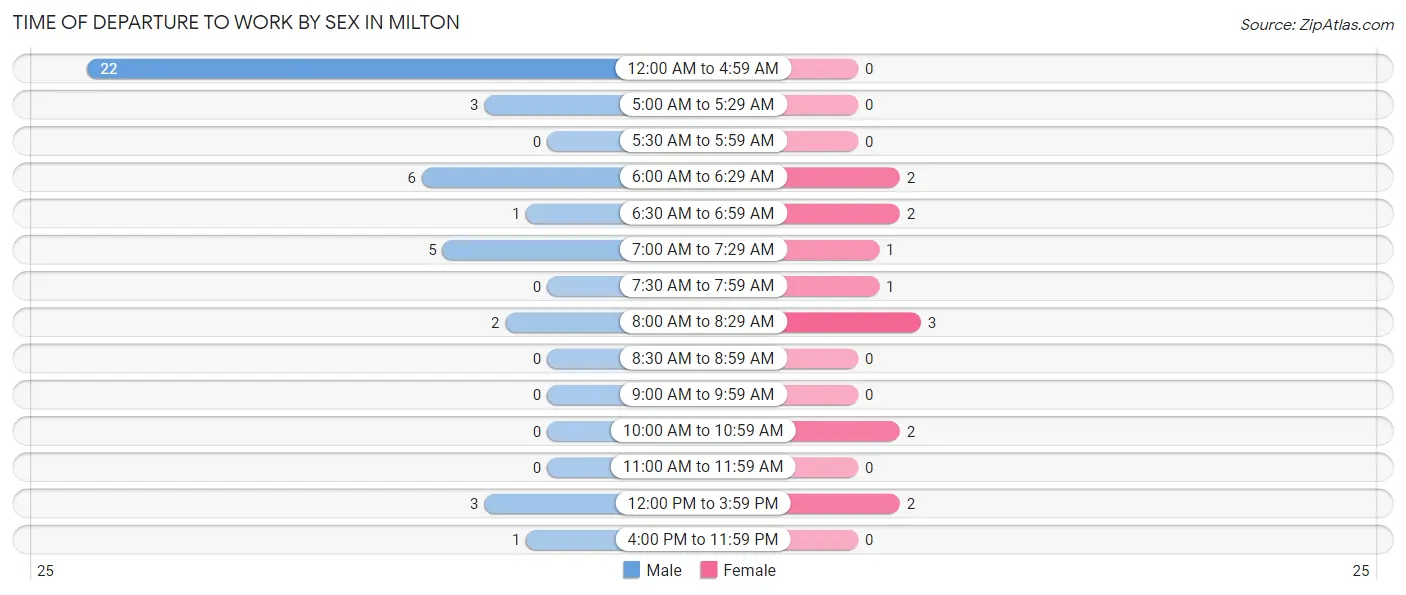
| Time of Departure | Male | Female |
| 12:00 AM to 4:59 AM | 22 (51.2%) | 0 (0.0%) |
| 5:00 AM to 5:29 AM | 3 (7.0%) | 0 (0.0%) |
| 5:30 AM to 5:59 AM | 0 (0.0%) | 0 (0.0%) |
| 6:00 AM to 6:29 AM | 6 (14.0%) | 2 (15.4%) |
| 6:30 AM to 6:59 AM | 1 (2.3%) | 2 (15.4%) |
| 7:00 AM to 7:29 AM | 5 (11.6%) | 1 (7.7%) |
| 7:30 AM to 7:59 AM | 0 (0.0%) | 1 (7.7%) |
| 8:00 AM to 8:29 AM | 2 (4.6%) | 3 (23.1%) |
| 8:30 AM to 8:59 AM | 0 (0.0%) | 0 (0.0%) |
| 9:00 AM to 9:59 AM | 0 (0.0%) | 0 (0.0%) |
| 10:00 AM to 10:59 AM | 0 (0.0%) | 2 (15.4%) |
| 11:00 AM to 11:59 AM | 0 (0.0%) | 0 (0.0%) |
| 12:00 PM to 3:59 PM | 3 (7.0%) | 2 (15.4%) |
| 4:00 PM to 11:59 PM | 1 (2.3%) | 0 (0.0%) |
| Total | 43 (100.0%) | 13 (100.0%) |
Housing Occupancy in Milton
Occupancy by Ownership in Milton
Of the total 82 dwellings in Milton, owner-occupied units account for 69 (84.2%), while renter-occupied units make up 13 (15.9%).
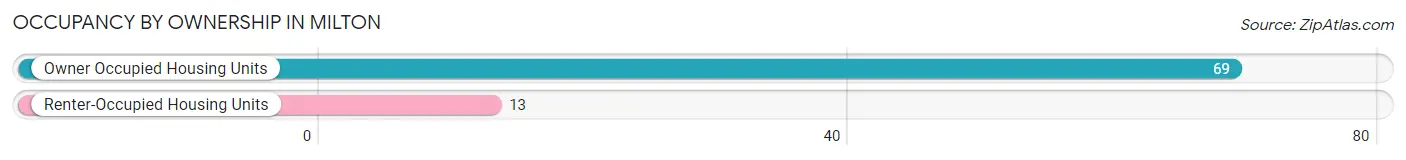
| Occupancy | # Housing Units | % Housing Units |
| Owner Occupied Housing Units | 69 | 84.2% |
| Renter-Occupied Housing Units | 13 | 15.9% |
| Total Occupied Housing Units | 82 | 100.0% |
Occupancy by Household Size in Milton
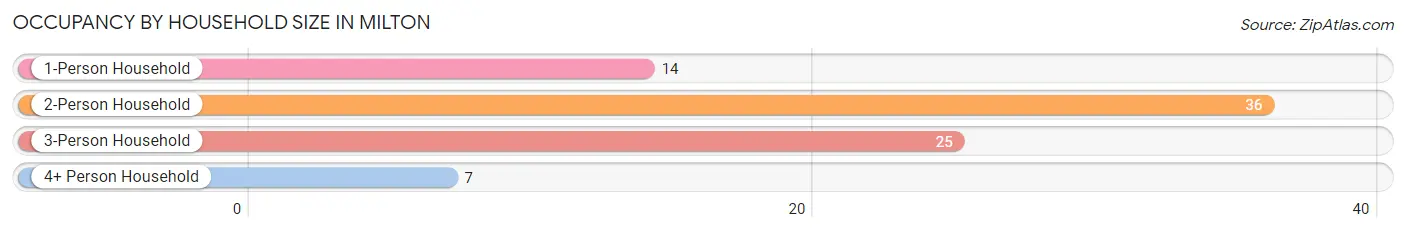
| Household Size | # Housing Units | % Housing Units |
| 1-Person Household | 14 | 17.1% |
| 2-Person Household | 36 | 43.9% |
| 3-Person Household | 25 | 30.5% |
| 4+ Person Household | 7 | 8.5% |
| Total Housing Units | 82 | 100.0% |
Occupancy by Ownership by Household Size in Milton
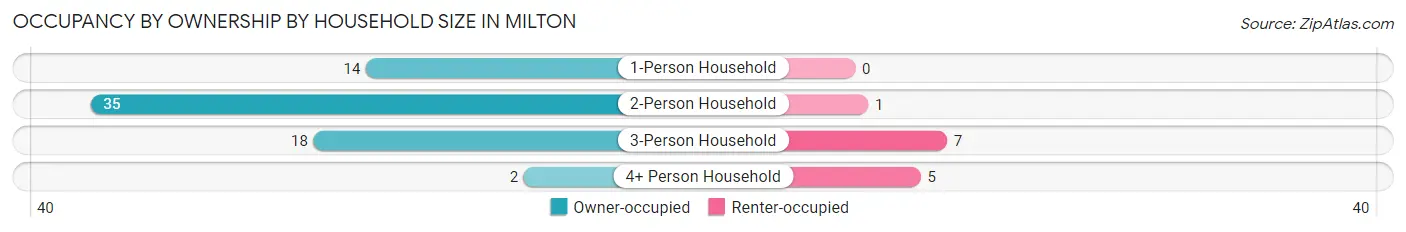
| Household Size | Owner-occupied | Renter-occupied |
| 1-Person Household | 14 (100.0%) | 0 (0.0%) |
| 2-Person Household | 35 (97.2%) | 1 (2.8%) |
| 3-Person Household | 18 (72.0%) | 7 (28.0%) |
| 4+ Person Household | 2 (28.6%) | 5 (71.4%) |
| Total Housing Units | 69 (84.2%) | 13 (15.9%) |
Occupancy by Educational Attainment in Milton
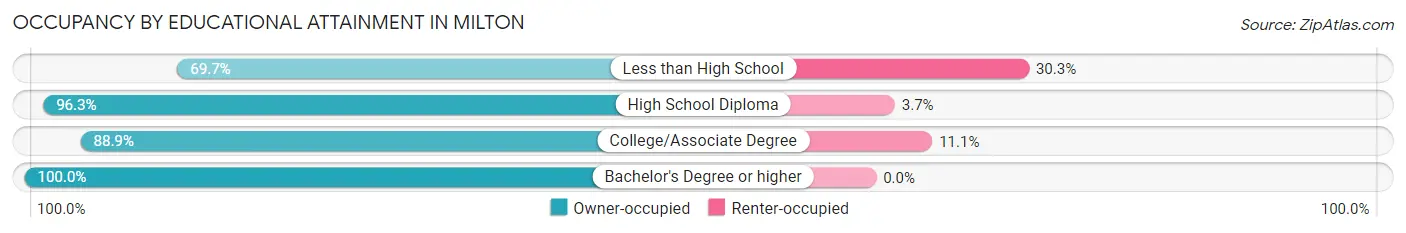
| Household Size | Owner-occupied | Renter-occupied |
| Less than High School | 23 (69.7%) | 10 (30.3%) |
| High School Diploma | 26 (96.3%) | 1 (3.7%) |
| College/Associate Degree | 16 (88.9%) | 2 (11.1%) |
| Bachelor's Degree or higher | 4 (100.0%) | 0 (0.0%) |
Occupancy by Age of Householder in Milton
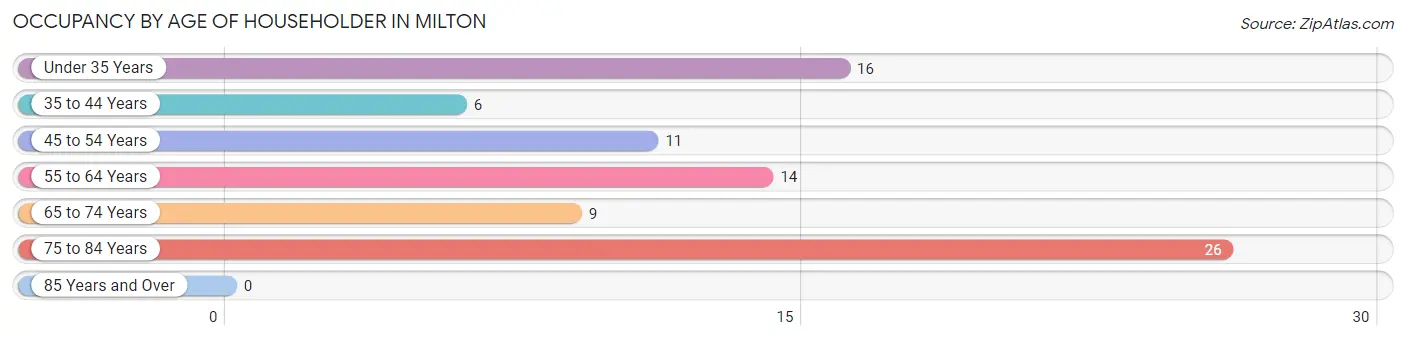
| Age Bracket | # Households | % Households |
| Under 35 Years | 16 | 19.5% |
| 35 to 44 Years | 6 | 7.3% |
| 45 to 54 Years | 11 | 13.4% |
| 55 to 64 Years | 14 | 17.1% |
| 65 to 74 Years | 9 | 11.0% |
| 75 to 84 Years | 26 | 31.7% |
| 85 Years and Over | 0 | 0.0% |
| Total | 82 | 100.0% |
Housing Finances in Milton
Median Income by Occupancy in Milton
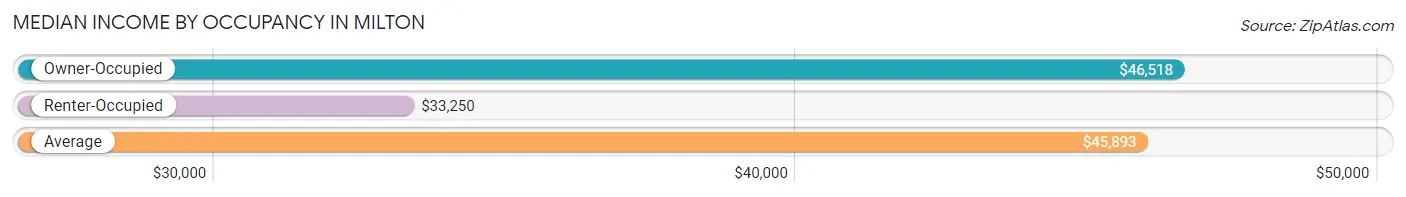
| Occupancy Type | # Households | Median Income |
| Owner-Occupied | 69 (84.2%) | $46,518 |
| Renter-Occupied | 13 (15.9%) | $33,250 |
| Average | 82 (100.0%) | $45,893 |
Occupancy by Householder Income Bracket in Milton
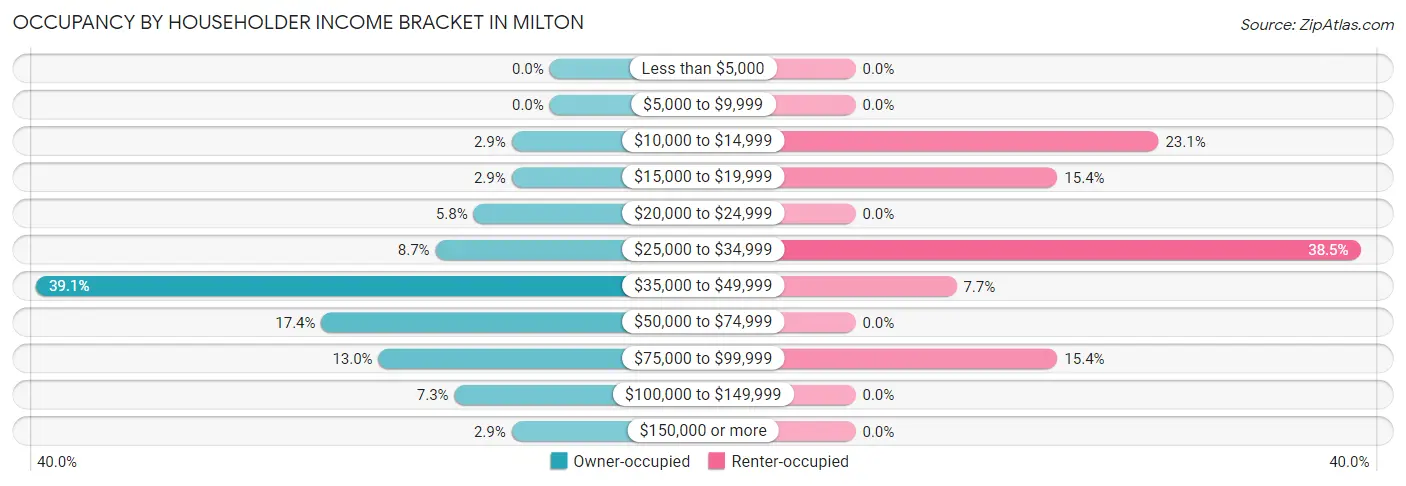
| Income Bracket | Owner-occupied | Renter-occupied |
| Less than $5,000 | 0 (0.0%) | 0 (0.0%) |
| $5,000 to $9,999 | 0 (0.0%) | 0 (0.0%) |
| $10,000 to $14,999 | 2 (2.9%) | 3 (23.1%) |
| $15,000 to $19,999 | 2 (2.9%) | 2 (15.4%) |
| $20,000 to $24,999 | 4 (5.8%) | 0 (0.0%) |
| $25,000 to $34,999 | 6 (8.7%) | 5 (38.5%) |
| $35,000 to $49,999 | 27 (39.1%) | 1 (7.7%) |
| $50,000 to $74,999 | 12 (17.4%) | 0 (0.0%) |
| $75,000 to $99,999 | 9 (13.0%) | 2 (15.4%) |
| $100,000 to $149,999 | 5 (7.2%) | 0 (0.0%) |
| $150,000 or more | 2 (2.9%) | 0 (0.0%) |
| Total | 69 (100.0%) | 13 (100.0%) |
Monthly Housing Cost Tiers in Milton
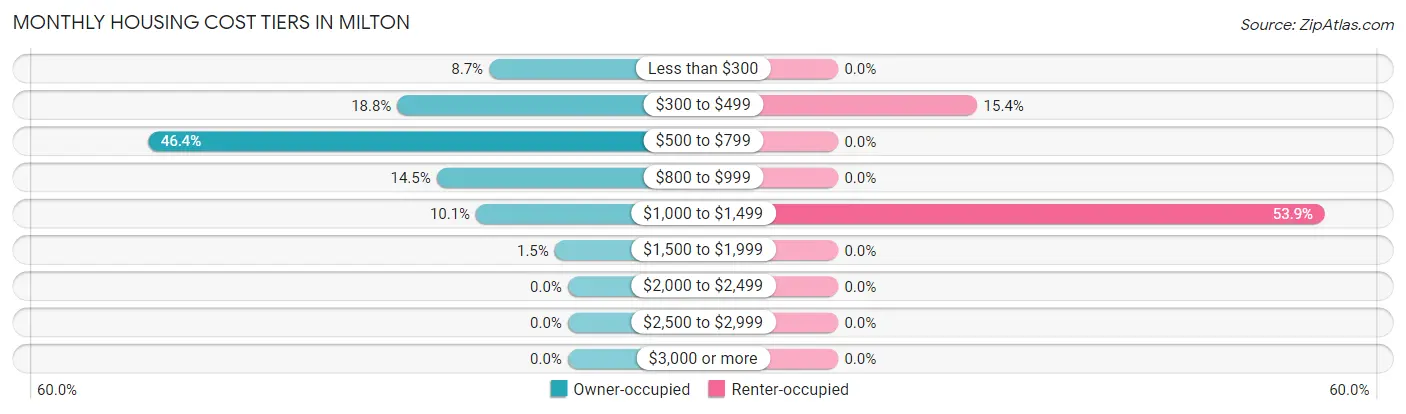
| Monthly Cost | Owner-occupied | Renter-occupied |
| Less than $300 | 6 (8.7%) | 0 (0.0%) |
| $300 to $499 | 13 (18.8%) | 2 (15.4%) |
| $500 to $799 | 32 (46.4%) | 0 (0.0%) |
| $800 to $999 | 10 (14.5%) | 0 (0.0%) |
| $1,000 to $1,499 | 7 (10.1%) | 7 (53.8%) |
| $1,500 to $1,999 | 1 (1.5%) | 0 (0.0%) |
| $2,000 to $2,499 | 0 (0.0%) | 0 (0.0%) |
| $2,500 to $2,999 | 0 (0.0%) | 0 (0.0%) |
| $3,000 or more | 0 (0.0%) | 0 (0.0%) |
| Total | 69 (100.0%) | 13 (100.0%) |
Physical Housing Characteristics in Milton
Housing Structures in Milton
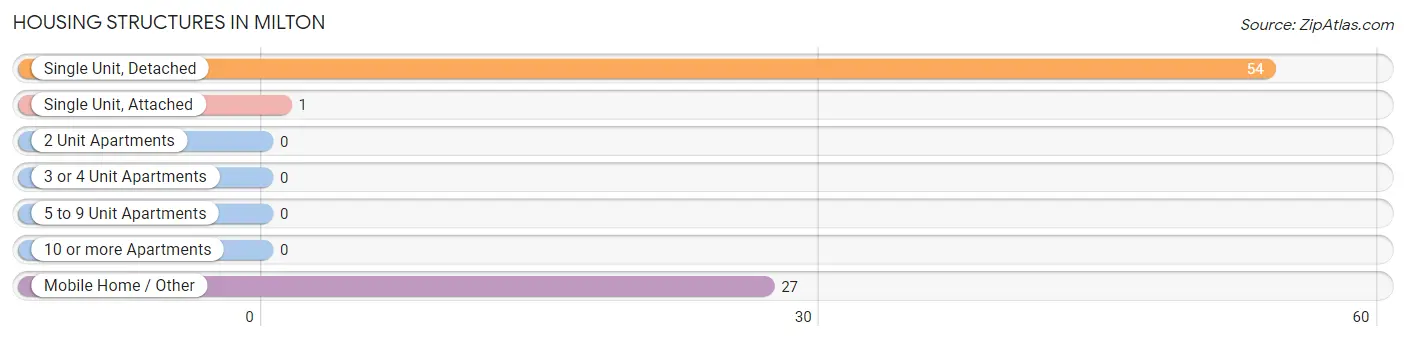
| Structure Type | # Housing Units | % Housing Units |
| Single Unit, Detached | 54 | 65.8% |
| Single Unit, Attached | 1 | 1.2% |
| 2 Unit Apartments | 0 | 0.0% |
| 3 or 4 Unit Apartments | 0 | 0.0% |
| 5 to 9 Unit Apartments | 0 | 0.0% |
| 10 or more Apartments | 0 | 0.0% |
| Mobile Home / Other | 27 | 32.9% |
| Total | 82 | 100.0% |
Housing Structures by Occupancy in Milton
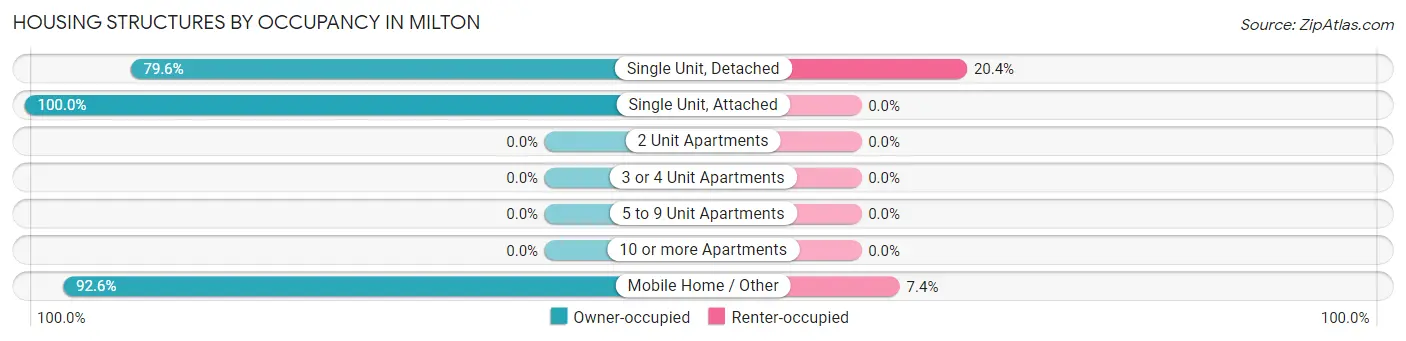
| Structure Type | Owner-occupied | Renter-occupied |
| Single Unit, Detached | 43 (79.6%) | 11 (20.4%) |
| Single Unit, Attached | 1 (100.0%) | 0 (0.0%) |
| 2 Unit Apartments | 0 (0.0%) | 0 (0.0%) |
| 3 or 4 Unit Apartments | 0 (0.0%) | 0 (0.0%) |
| 5 to 9 Unit Apartments | 0 (0.0%) | 0 (0.0%) |
| 10 or more Apartments | 0 (0.0%) | 0 (0.0%) |
| Mobile Home / Other | 25 (92.6%) | 2 (7.4%) |
| Total | 69 (84.2%) | 13 (15.9%) |
Housing Structures by Number of Rooms in Milton
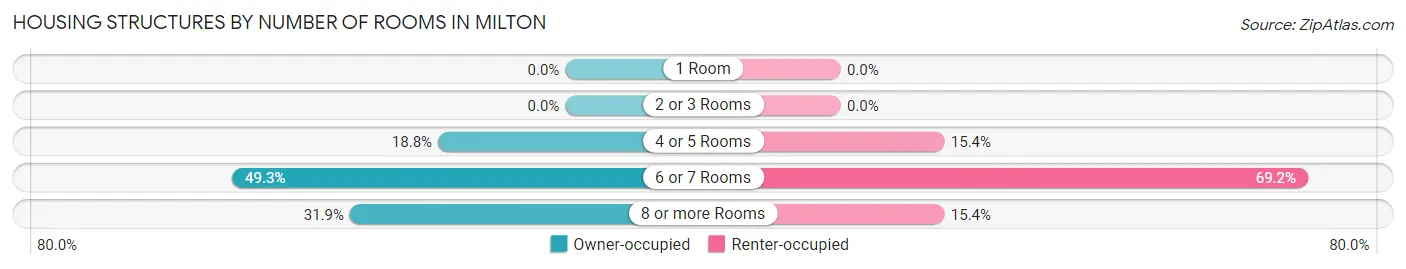
| Number of Rooms | Owner-occupied | Renter-occupied |
| 1 Room | 0 (0.0%) | 0 (0.0%) |
| 2 or 3 Rooms | 0 (0.0%) | 0 (0.0%) |
| 4 or 5 Rooms | 13 (18.8%) | 2 (15.4%) |
| 6 or 7 Rooms | 34 (49.3%) | 9 (69.2%) |
| 8 or more Rooms | 22 (31.9%) | 2 (15.4%) |
| Total | 69 (100.0%) | 13 (100.0%) |
Housing Structure by Heating Type in Milton
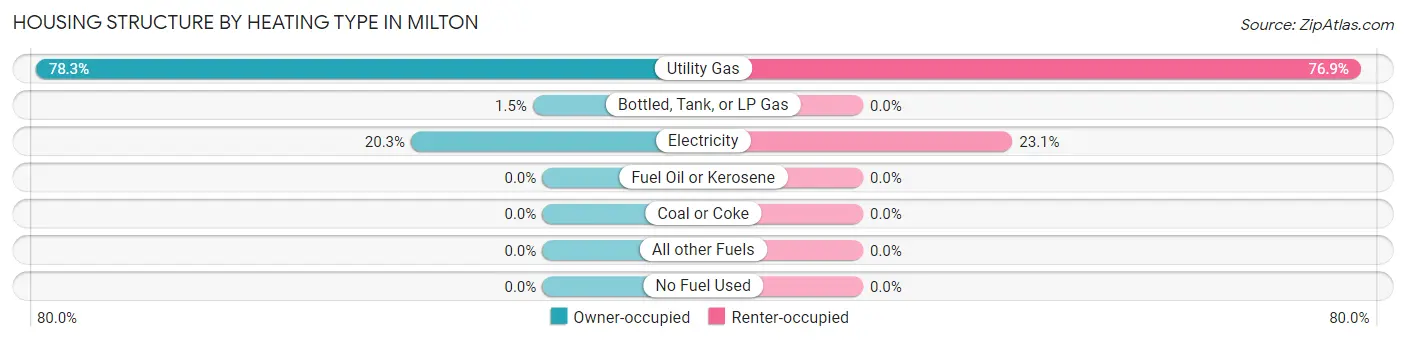
| Heating Type | Owner-occupied | Renter-occupied |
| Utility Gas | 54 (78.3%) | 10 (76.9%) |
| Bottled, Tank, or LP Gas | 1 (1.5%) | 0 (0.0%) |
| Electricity | 14 (20.3%) | 3 (23.1%) |
| Fuel Oil or Kerosene | 0 (0.0%) | 0 (0.0%) |
| Coal or Coke | 0 (0.0%) | 0 (0.0%) |
| All other Fuels | 0 (0.0%) | 0 (0.0%) |
| No Fuel Used | 0 (0.0%) | 0 (0.0%) |
| Total | 69 (100.0%) | 13 (100.0%) |
Household Vehicle Usage in Milton
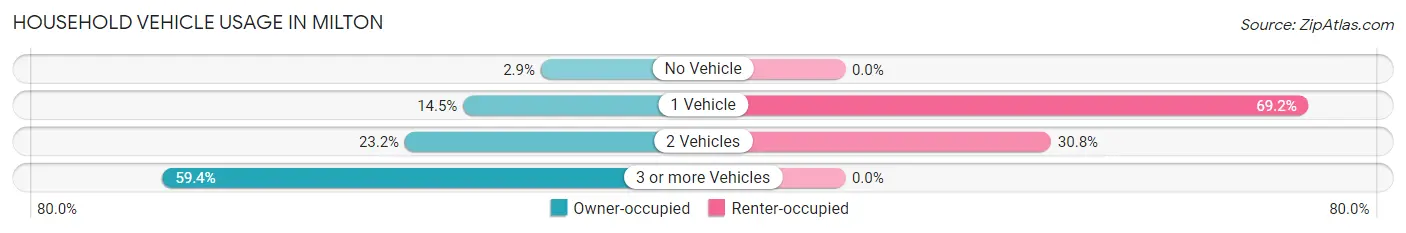
| Vehicles per Household | Owner-occupied | Renter-occupied |
| No Vehicle | 2 (2.9%) | 0 (0.0%) |
| 1 Vehicle | 10 (14.5%) | 9 (69.2%) |
| 2 Vehicles | 16 (23.2%) | 4 (30.8%) |
| 3 or more Vehicles | 41 (59.4%) | 0 (0.0%) |
| Total | 69 (100.0%) | 13 (100.0%) |
Real Estate & Mortgages in Milton
Real Estate and Mortgage Overview in Milton
| Characteristic | Without Mortgage | With Mortgage |
| Housing Units | 23 | 46 |
| Median Property Value | $61,300 | $95,000 |
| Median Household Income | $35,938 | $2 |
| Monthly Housing Costs | $408 | $0 |
| Real Estate Taxes | $1,375 | $1 |
Property Value by Mortgage Status in Milton
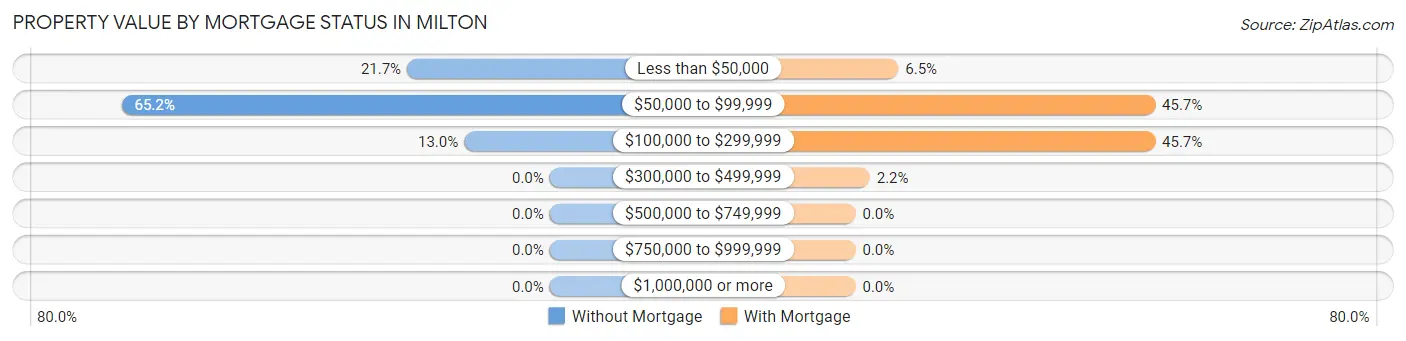
| Property Value | Without Mortgage | With Mortgage |
| Less than $50,000 | 5 (21.7%) | 3 (6.5%) |
| $50,000 to $99,999 | 15 (65.2%) | 21 (45.7%) |
| $100,000 to $299,999 | 3 (13.0%) | 21 (45.7%) |
| $300,000 to $499,999 | 0 (0.0%) | 1 (2.2%) |
| $500,000 to $749,999 | 0 (0.0%) | 0 (0.0%) |
| $750,000 to $999,999 | 0 (0.0%) | 0 (0.0%) |
| $1,000,000 or more | 0 (0.0%) | 0 (0.0%) |
| Total | 23 (100.0%) | 46 (100.0%) |
Household Income by Mortgage Status in Milton
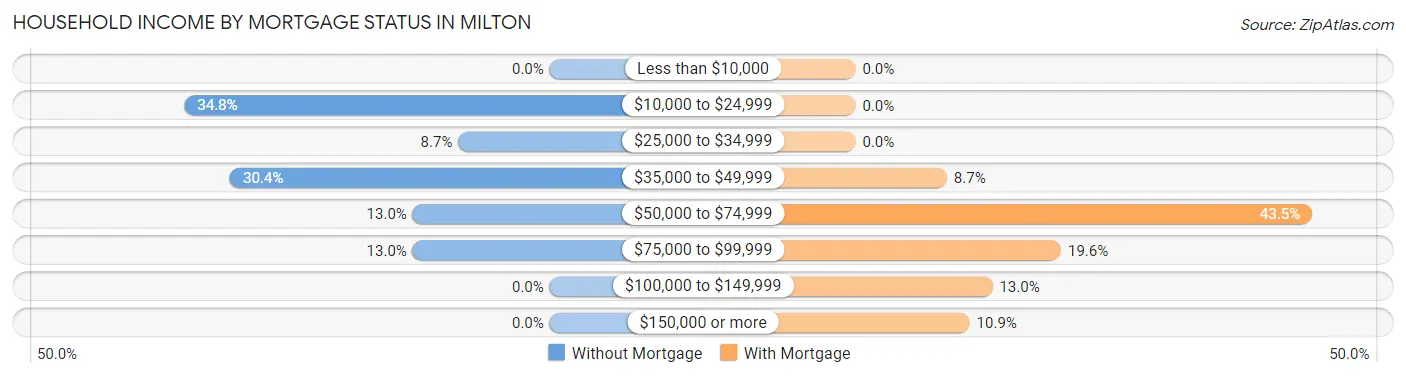
| Household Income | Without Mortgage | With Mortgage |
| Less than $10,000 | 0 (0.0%) | 0 (0.0%) |
| $10,000 to $24,999 | 8 (34.8%) | 0 (0.0%) |
| $25,000 to $34,999 | 2 (8.7%) | 0 (0.0%) |
| $35,000 to $49,999 | 7 (30.4%) | 4 (8.7%) |
| $50,000 to $74,999 | 3 (13.0%) | 20 (43.5%) |
| $75,000 to $99,999 | 3 (13.0%) | 9 (19.6%) |
| $100,000 to $149,999 | 0 (0.0%) | 6 (13.0%) |
| $150,000 or more | 0 (0.0%) | 5 (10.9%) |
| Total | 23 (100.0%) | 46 (100.0%) |
Property Value to Household Income Ratio in Milton
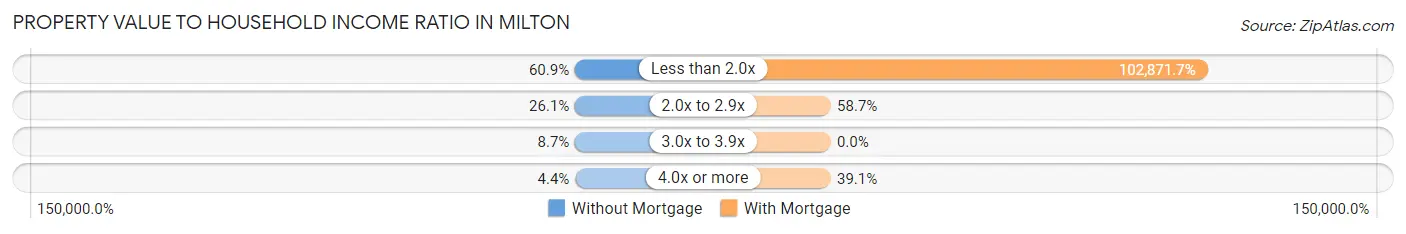
| Value-to-Income Ratio | Without Mortgage | With Mortgage |
| Less than 2.0x | 14 (60.9%) | 47,321 (102,871.7%) |
| 2.0x to 2.9x | 6 (26.1%) | 27 (58.7%) |
| 3.0x to 3.9x | 2 (8.7%) | 0 (0.0%) |
| 4.0x or more | 1 (4.3%) | 18 (39.1%) |
| Total | 23 (100.0%) | 46 (100.0%) |
Real Estate Taxes by Mortgage Status in Milton
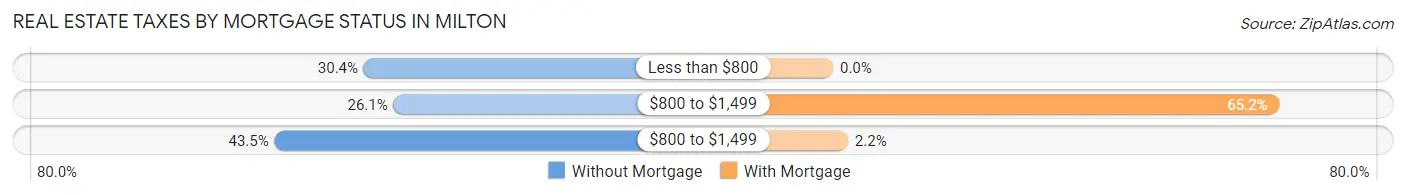
| Property Taxes | Without Mortgage | With Mortgage |
| Less than $800 | 7 (30.4%) | 0 (0.0%) |
| $800 to $1,499 | 6 (26.1%) | 30 (65.2%) |
| $800 to $1,499 | 10 (43.5%) | 1 (2.2%) |
| Total | 23 (100.0%) | 46 (100.0%) |
Health & Disability in Milton
Health Insurance Coverage by Age in Milton
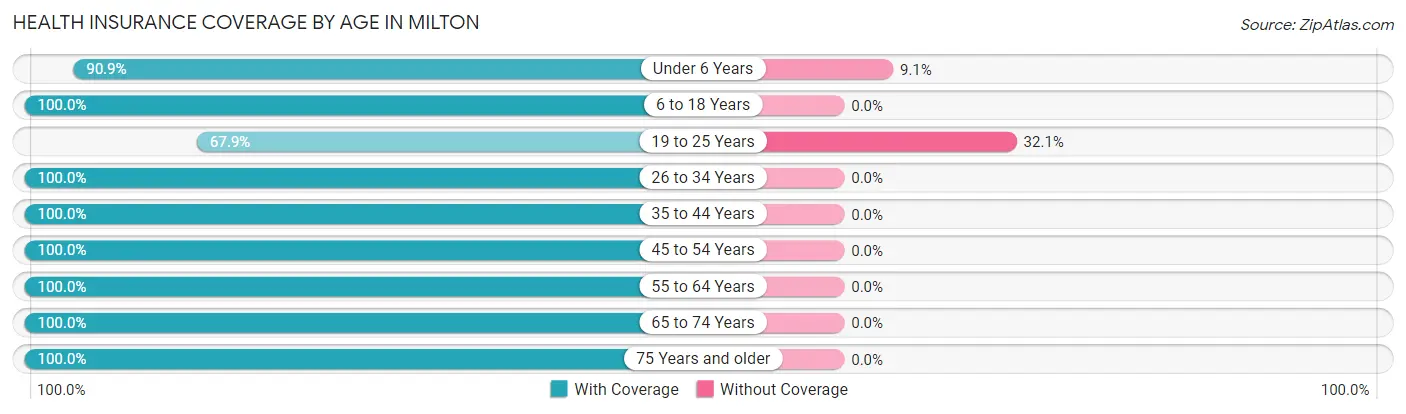
| Age Bracket | With Coverage | Without Coverage |
| Under 6 Years | 20 (90.9%) | 2 (9.1%) |
| 6 to 18 Years | 29 (100.0%) | 0 (0.0%) |
| 19 to 25 Years | 19 (67.9%) | 9 (32.1%) |
| 26 to 34 Years | 21 (100.0%) | 0 (0.0%) |
| 35 to 44 Years | 7 (100.0%) | 0 (0.0%) |
| 45 to 54 Years | 13 (100.0%) | 0 (0.0%) |
| 55 to 64 Years | 30 (100.0%) | 0 (0.0%) |
| 65 to 74 Years | 23 (100.0%) | 0 (0.0%) |
| 75 Years and older | 42 (100.0%) | 0 (0.0%) |
| Total | 204 (94.9%) | 11 (5.1%) |
Health Insurance Coverage by Citizenship Status in Milton
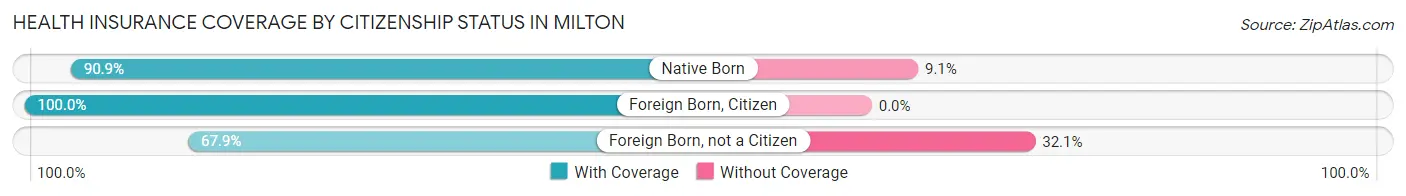
| Citizenship Status | With Coverage | Without Coverage |
| Native Born | 20 (90.9%) | 2 (9.1%) |
| Foreign Born, Citizen | 29 (100.0%) | 0 (0.0%) |
| Foreign Born, not a Citizen | 19 (67.9%) | 9 (32.1%) |
Health Insurance Coverage by Household Income in Milton
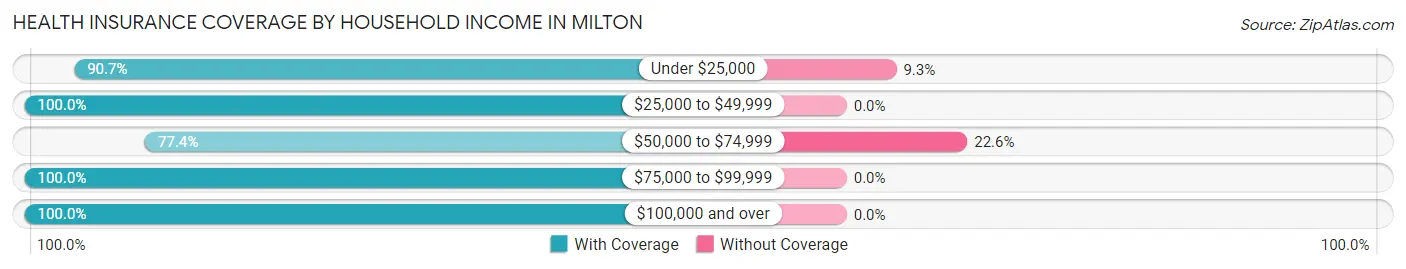
| Household Income | With Coverage | Without Coverage |
| Under $25,000 | 39 (90.7%) | 4 (9.3%) |
| $25,000 to $49,999 | 93 (100.0%) | 0 (0.0%) |
| $50,000 to $74,999 | 24 (77.4%) | 7 (22.6%) |
| $75,000 to $99,999 | 29 (100.0%) | 0 (0.0%) |
| $100,000 and over | 19 (100.0%) | 0 (0.0%) |
Public vs Private Health Insurance Coverage by Age in Milton
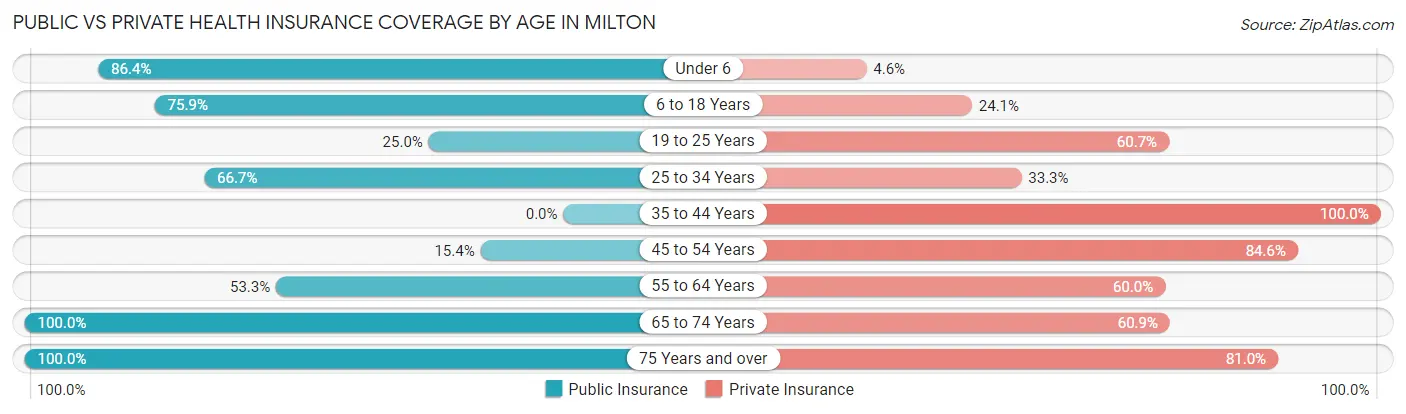
| Age Bracket | Public Insurance | Private Insurance |
| Under 6 | 19 (86.4%) | 1 (4.5%) |
| 6 to 18 Years | 22 (75.9%) | 7 (24.1%) |
| 19 to 25 Years | 7 (25.0%) | 17 (60.7%) |
| 25 to 34 Years | 14 (66.7%) | 7 (33.3%) |
| 35 to 44 Years | 0 (0.0%) | 7 (100.0%) |
| 45 to 54 Years | 2 (15.4%) | 11 (84.6%) |
| 55 to 64 Years | 16 (53.3%) | 18 (60.0%) |
| 65 to 74 Years | 23 (100.0%) | 14 (60.9%) |
| 75 Years and over | 42 (100.0%) | 34 (80.9%) |
| Total | 145 (67.4%) | 116 (53.9%) |
Disability Status by Sex by Age in Milton
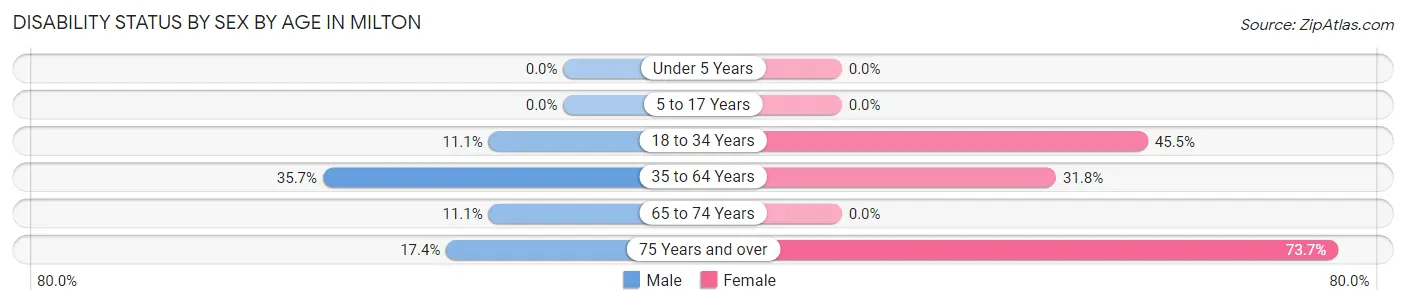
| Age Bracket | Male | Female |
| Under 5 Years | 0 (0.0%) | 0 (0.0%) |
| 5 to 17 Years | 0 (0.0%) | 0 (0.0%) |
| 18 to 34 Years | 2 (11.1%) | 15 (45.5%) |
| 35 to 64 Years | 10 (35.7%) | 7 (31.8%) |
| 65 to 74 Years | 1 (11.1%) | 0 (0.0%) |
| 75 Years and over | 4 (17.4%) | 14 (73.7%) |
Disability Class by Sex by Age in Milton
Disability Class: Hearing Difficulty
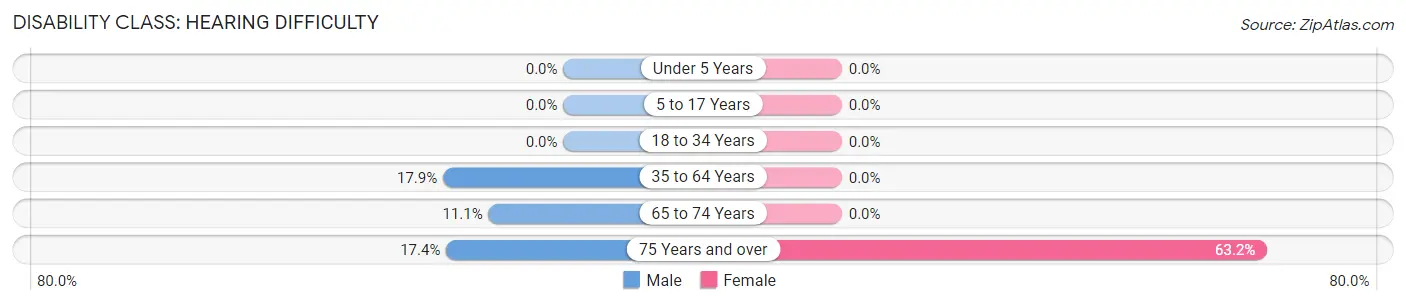
| Age Bracket | Male | Female |
| Under 5 Years | 0 (0.0%) | 0 (0.0%) |
| 5 to 17 Years | 0 (0.0%) | 0 (0.0%) |
| 18 to 34 Years | 0 (0.0%) | 0 (0.0%) |
| 35 to 64 Years | 5 (17.9%) | 0 (0.0%) |
| 65 to 74 Years | 1 (11.1%) | 0 (0.0%) |
| 75 Years and over | 4 (17.4%) | 12 (63.2%) |
Disability Class: Vision Difficulty
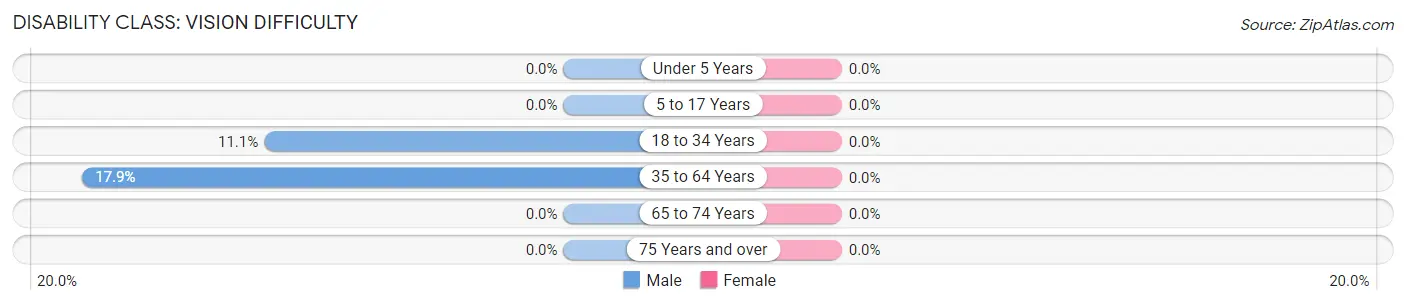
| Age Bracket | Male | Female |
| Under 5 Years | 0 (0.0%) | 0 (0.0%) |
| 5 to 17 Years | 0 (0.0%) | 0 (0.0%) |
| 18 to 34 Years | 2 (11.1%) | 0 (0.0%) |
| 35 to 64 Years | 5 (17.9%) | 0 (0.0%) |
| 65 to 74 Years | 0 (0.0%) | 0 (0.0%) |
| 75 Years and over | 0 (0.0%) | 0 (0.0%) |
Disability Class: Cognitive Difficulty
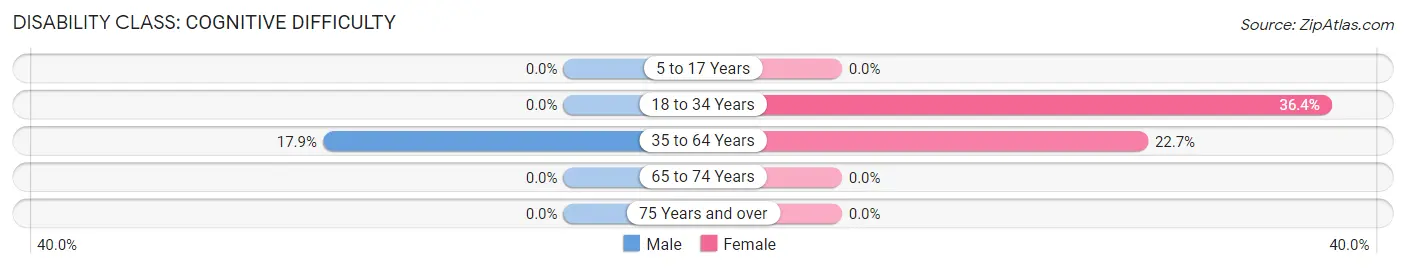
| Age Bracket | Male | Female |
| 5 to 17 Years | 0 (0.0%) | 0 (0.0%) |
| 18 to 34 Years | 0 (0.0%) | 12 (36.4%) |
| 35 to 64 Years | 5 (17.9%) | 5 (22.7%) |
| 65 to 74 Years | 0 (0.0%) | 0 (0.0%) |
| 75 Years and over | 0 (0.0%) | 0 (0.0%) |
Disability Class: Ambulatory Difficulty
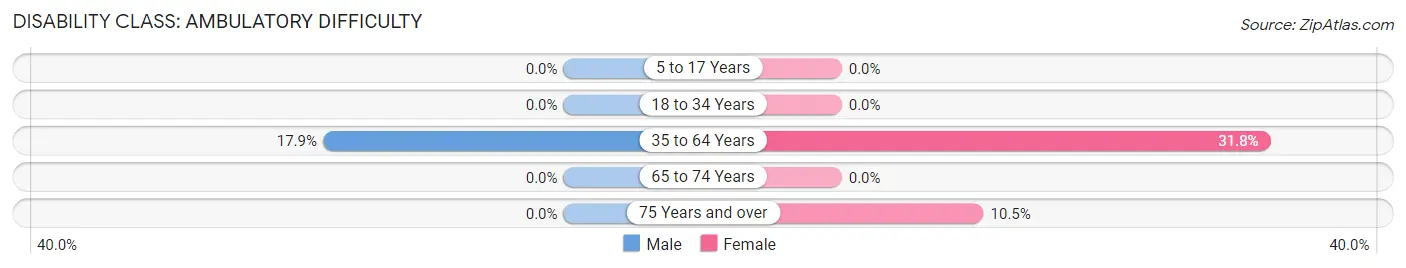
| Age Bracket | Male | Female |
| 5 to 17 Years | 0 (0.0%) | 0 (0.0%) |
| 18 to 34 Years | 0 (0.0%) | 0 (0.0%) |
| 35 to 64 Years | 5 (17.9%) | 7 (31.8%) |
| 65 to 74 Years | 0 (0.0%) | 0 (0.0%) |
| 75 Years and over | 0 (0.0%) | 2 (10.5%) |
Disability Class: Self-Care Difficulty
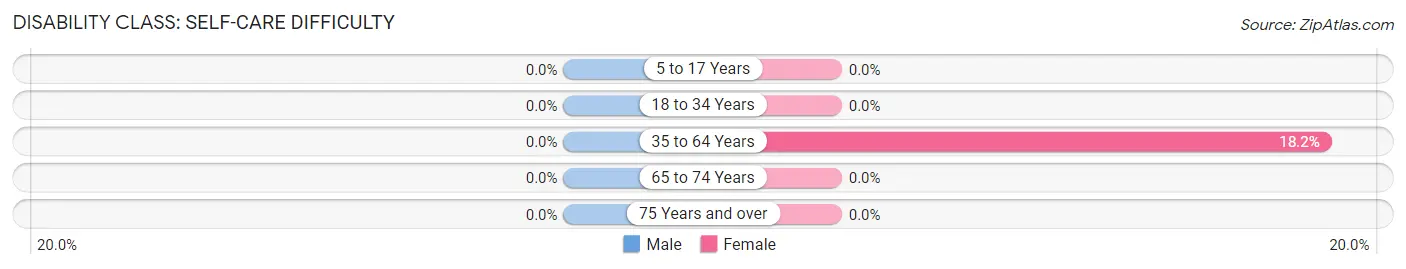
| Age Bracket | Male | Female |
| 5 to 17 Years | 0 (0.0%) | 0 (0.0%) |
| 18 to 34 Years | 0 (0.0%) | 0 (0.0%) |
| 35 to 64 Years | 0 (0.0%) | 4 (18.2%) |
| 65 to 74 Years | 0 (0.0%) | 0 (0.0%) |
| 75 Years and over | 0 (0.0%) | 0 (0.0%) |
Technology Access in Milton
Computing Device Access in Milton
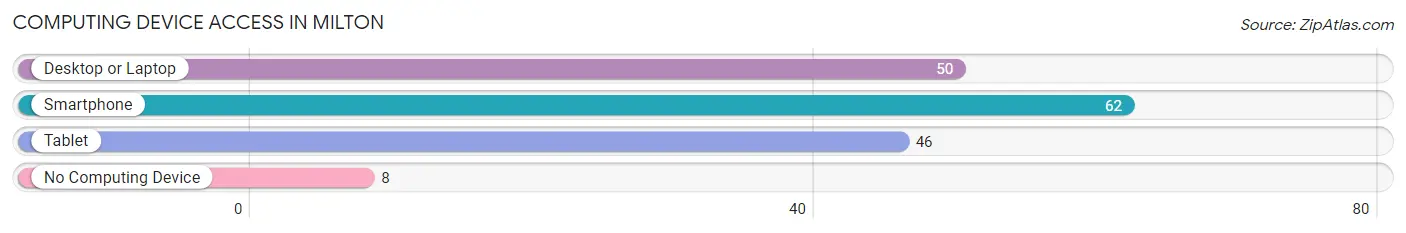
| Device Type | # Households | % Households |
| Desktop or Laptop | 50 | 61.0% |
| Smartphone | 62 | 75.6% |
| Tablet | 46 | 56.1% |
| No Computing Device | 8 | 9.8% |
| Total | 82 | 100.0% |
Internet Access in Milton
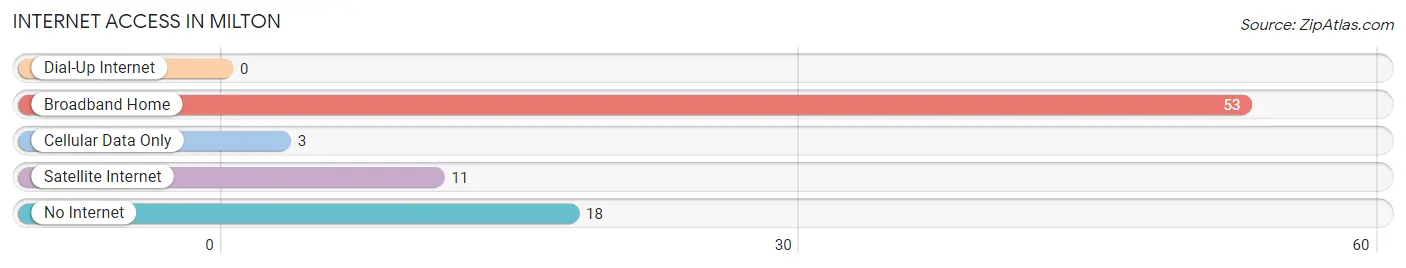
| Internet Type | # Households | % Households |
| Dial-Up Internet | 0 | 0.0% |
| Broadband Home | 53 | 64.6% |
| Cellular Data Only | 3 | 3.7% |
| Satellite Internet | 11 | 13.4% |
| No Internet | 18 | 22.0% |
| Total | 82 | 100.0% |
Milton Summary
Milton, Illinois is a small village located in the northern part of the state, in Kane County. It is situated on the Fox River, about 40 miles west of Chicago. The village has a population of about 2,000 people, and is part of the larger Fox Valley region.
History
Milton was first settled in 1835 by a group of settlers from New York. The village was originally known as “Milton Station”, and was named after the poet John Milton. The village was incorporated in 1867, and the first post office was established in 1868.
In the late 19th century, Milton was a thriving agricultural community, with a variety of crops being grown in the area. The village was also home to several mills, which provided employment for many of the residents.
In the early 20th century, Milton began to experience a period of growth and development. The village was connected to the Chicago and Northwestern Railroad in 1906, and the Fox River was dammed in 1908, creating a lake that is now known as Lake Milton.
Geography
Milton is located in northern Illinois, in Kane County. It is situated on the Fox River, about 40 miles west of Chicago. The village is surrounded by rolling hills and farmland, and is part of the larger Fox Valley region.
The village has a total area of 1.2 square miles, all of which is land. The climate is humid continental, with hot summers and cold winters. The average annual temperature is around 50 degrees Fahrenheit.
Economy
Milton’s economy is largely based on agriculture and manufacturing. The village is home to several small businesses, including a grocery store, a hardware store, and a few restaurants.
The village is also home to several large employers, including a manufacturing plant and a distribution center. The village is also home to a number of small farms, which produce a variety of crops, including corn, soybeans, and wheat.
Demographics
As of the 2010 census, Milton had a population of 2,000 people. The racial makeup of the village was 94.2% White, 1.2% African American, 0.4% Native American, 0.8% Asian, and 3.4% from other races.
The median household income in Milton was $50,000, and the median family income was $60,000. The per capita income was $25,000. About 8.5% of the population was below the poverty line.
Milton is a small village with a rich history and a diverse economy. The village is home to a variety of businesses, and is part of the larger Fox Valley region. The village has a population of about 2,000 people, and is a great place to live and work.
Common Questions
What is Per Capita Income in Milton?
Per Capita income in Milton is $20,960.
What is the Median Family Income in Milton?
Median Family Income in Milton is $46,071.
What is the Median Household income in Milton?
Median Household Income in Milton is $45,893.
What is Inequality or Gini Index in Milton?
Inequality or Gini Index in Milton is 0.33.
What is the Total Population of Milton?
Total Population of Milton is 215.
What is the Total Male Population of Milton?
Total Male Population of Milton is 108.
What is the Total Female Population of Milton?
Total Female Population of Milton is 107.
What is the Ratio of Males per 100 Females in Milton?
There are 100.93 Males per 100 Females in Milton.
What is the Ratio of Females per 100 Males in Milton?
There are 99.07 Females per 100 Males in Milton.
What is the Median Population Age in Milton?
Median Population Age in Milton is 49.3 Years.
What is the Average Family Size in Milton
Average Family Size in Milton is 2.9 People.
What is the Average Household Size in Milton
Average Household Size in Milton is 2.6 People.
How Large is the Labor Force in Milton?
There are 57 People in the Labor Forcein in Milton.
What is the Percentage of People in the Labor Force in Milton?
34.3% of People are in the Labor Force in Milton.