Macon, IL Map & Demographics
Macon Map
Macon Overview
$34,272
PER CAPITA INCOME
$76,579
AVG FAMILY INCOME
$64,412
AVG HOUSEHOLD INCOME
41.1%
WAGE / INCOME GAP [ % ]
58.9¢/ $1
WAGE / INCOME GAP [ $ ]
0.35
INEQUALITY / GINI INDEX
1,080
TOTAL POPULATION
523
MALE POPULATION
557
FEMALE POPULATION
93.90
MALES / 100 FEMALES
106.50
FEMALES / 100 MALES
46.4
MEDIAN AGE
2.8
AVG FAMILY SIZE
2.2
AVG HOUSEHOLD SIZE
536
LABOR FORCE [ PEOPLE ]
60.3%
PERCENT IN LABOR FORCE
2.4%
UNEMPLOYMENT RATE
Macon Zip Codes
Macon Area Codes
Income in Macon
Income Overview in Macon
Per Capita Income in Macon is $34,272, while median incomes of families and households are $76,579 and $64,412 respectively.
| Characteristic | Number | Measure |
| Per Capita Income | 1,080 | $34,272 |
| Median Family Income | 324 | $76,579 |
| Mean Family Income | 324 | $89,068 |
| Median Household Income | 482 | $64,412 |
| Mean Household Income | 482 | $76,760 |
| Income Deficit | 324 | $0 |
| Wage / Income Gap (%) | 1,080 | 41.07% |
| Wage / Income Gap ($) | 1,080 | 58.93¢ per $1 |
| Gini / Inequality Index | 1,080 | 0.35 |
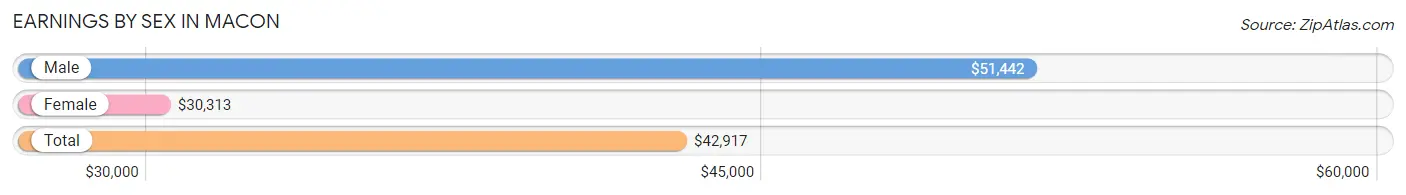
Earnings by Sex in Macon
Average Earnings in Macon are $42,917, $51,442 for men and $30,313 for women, a difference of 41.1%.
| Sex | Number | Average Earnings |
| Male | 270 (46.3%) | $51,442 |
| Female | 313 (53.7%) | $30,313 |
| Total | 583 (100.0%) | $42,917 |
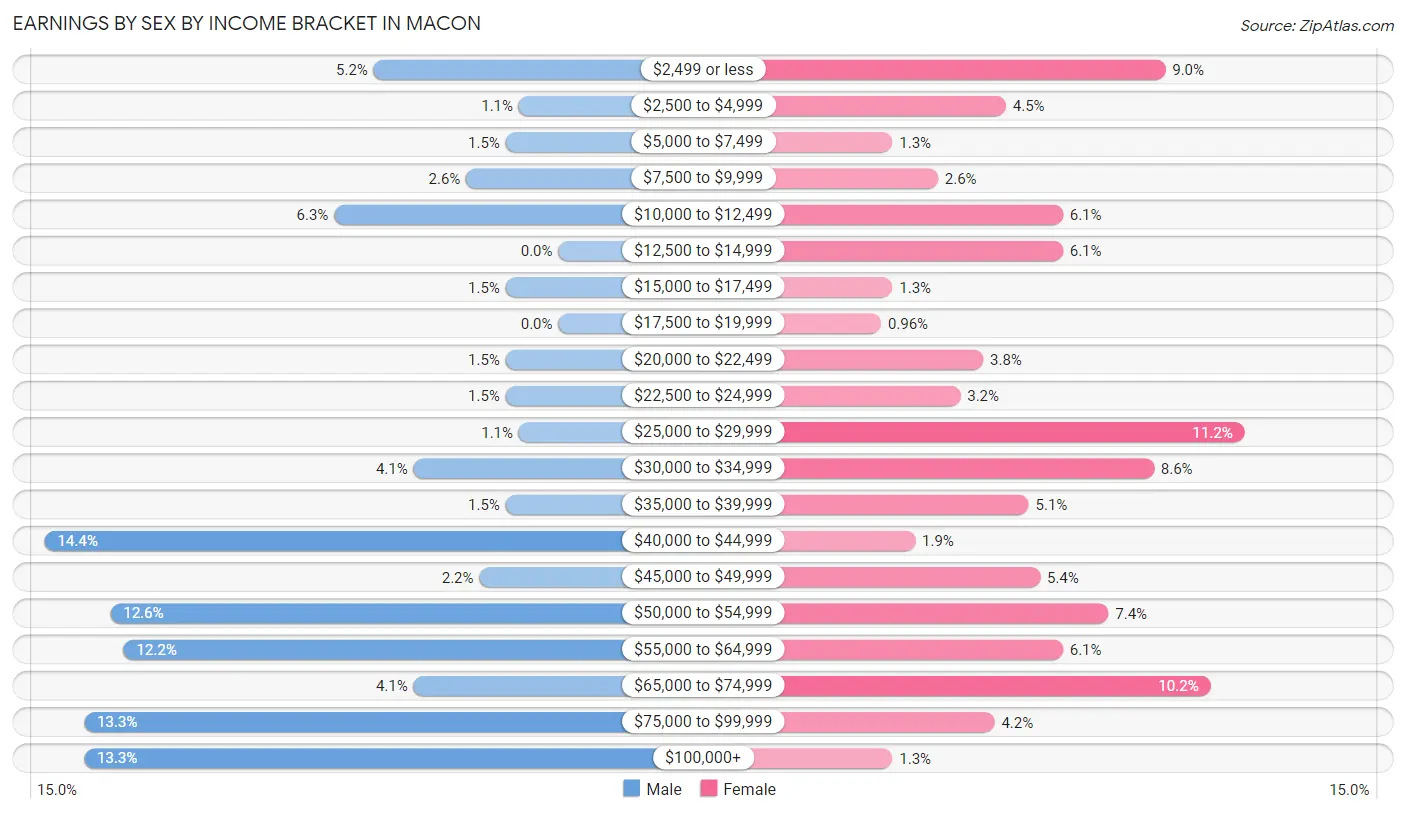
Earnings by Sex by Income Bracket in Macon
The most common earnings brackets in Macon are $40,000 to $44,999 for men (39 | 14.4%) and $25,000 to $29,999 for women (35 | 11.2%).
| Income | Male | Female |
| $2,499 or less | 14 (5.2%) | 28 (8.9%) |
| $2,500 to $4,999 | 3 (1.1%) | 14 (4.5%) |
| $5,000 to $7,499 | 4 (1.5%) | 4 (1.3%) |
| $7,500 to $9,999 | 7 (2.6%) | 8 (2.6%) |
| $10,000 to $12,499 | 17 (6.3%) | 19 (6.1%) |
| $12,500 to $14,999 | 0 (0.0%) | 19 (6.1%) |
| $15,000 to $17,499 | 4 (1.5%) | 4 (1.3%) |
| $17,500 to $19,999 | 0 (0.0%) | 3 (1.0%) |
| $20,000 to $22,499 | 4 (1.5%) | 12 (3.8%) |
| $22,500 to $24,999 | 4 (1.5%) | 10 (3.2%) |
| $25,000 to $29,999 | 3 (1.1%) | 35 (11.2%) |
| $30,000 to $34,999 | 11 (4.1%) | 27 (8.6%) |
| $35,000 to $39,999 | 4 (1.5%) | 16 (5.1%) |
| $40,000 to $44,999 | 39 (14.4%) | 6 (1.9%) |
| $45,000 to $49,999 | 6 (2.2%) | 17 (5.4%) |
| $50,000 to $54,999 | 34 (12.6%) | 23 (7.3%) |
| $55,000 to $64,999 | 33 (12.2%) | 19 (6.1%) |
| $65,000 to $74,999 | 11 (4.1%) | 32 (10.2%) |
| $75,000 to $99,999 | 36 (13.3%) | 13 (4.2%) |
| $100,000+ | 36 (13.3%) | 4 (1.3%) |
| Total | 270 (100.0%) | 313 (100.0%) |
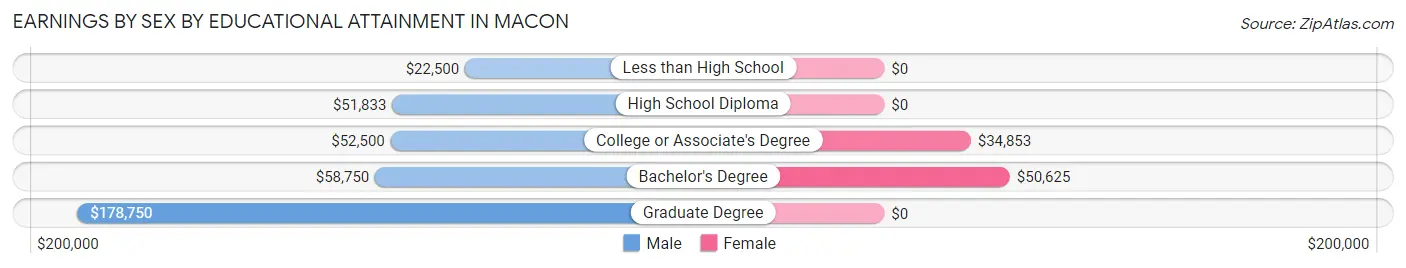
Earnings by Sex by Educational Attainment in Macon
Average earnings in Macon are $51,923 for men and $33,587 for women, a difference of 35.3%. Men with an educational attainment of graduate degree enjoy the highest average annual earnings of $178,750, while those with less than high school education earn the least with $22,500. Women with an educational attainment of bachelor's degree earn the most with the average annual earnings of $50,625, while those with college or associate's degree education have the smallest earnings of $34,853.
| Educational Attainment | Male Income | Female Income |
| Less than High School | $22,500 | $0 |
| High School Diploma | $51,833 | $0 |
| College or Associate's Degree | $52,500 | $34,853 |
| Bachelor's Degree | $58,750 | $50,625 |
| Graduate Degree | $178,750 | $0 |
| Total | $51,923 | $33,587 |
Family Income in Macon
Family Income Brackets in Macon
According to the Macon family income data, there are 95 families falling into the $100,000 to $149,999 income range, which is the most common income bracket and makes up 29.3% of all families. Conversely, the $10,000 to $14,999 income bracket is the least frequent group with only 3 families (0.9%) belonging to this category.
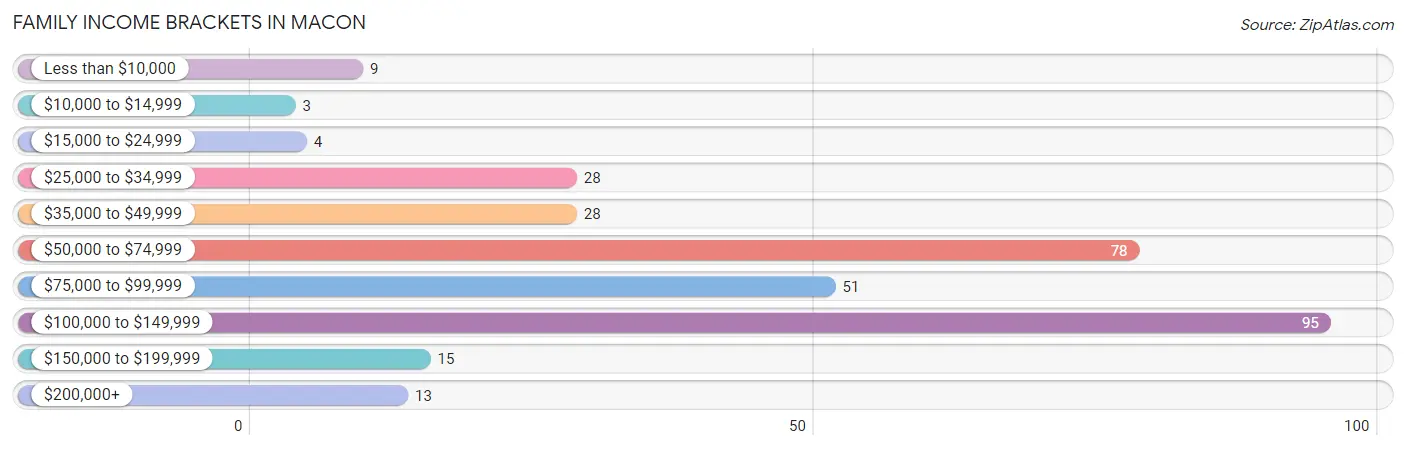
| Income Bracket | # Families | % Families |
| Less than $10,000 | 9 | 2.8% |
| $10,000 to $14,999 | 3 | 0.9% |
| $15,000 to $24,999 | 4 | 1.2% |
| $25,000 to $34,999 | 28 | 8.6% |
| $35,000 to $49,999 | 28 | 8.6% |
| $50,000 to $74,999 | 78 | 24.1% |
| $75,000 to $99,999 | 51 | 15.7% |
| $100,000 to $149,999 | 95 | 29.3% |
| $150,000 to $199,999 | 15 | 4.6% |
| $200,000+ | 13 | 4.0% |
Family Income by Famaliy Size in Macon
5-person families (36 | 11.1%) account for the highest median family income in Macon with $125,833 per family, while 2-person families (199 | 61.4%) have the highest median income of $31,054 per family member.
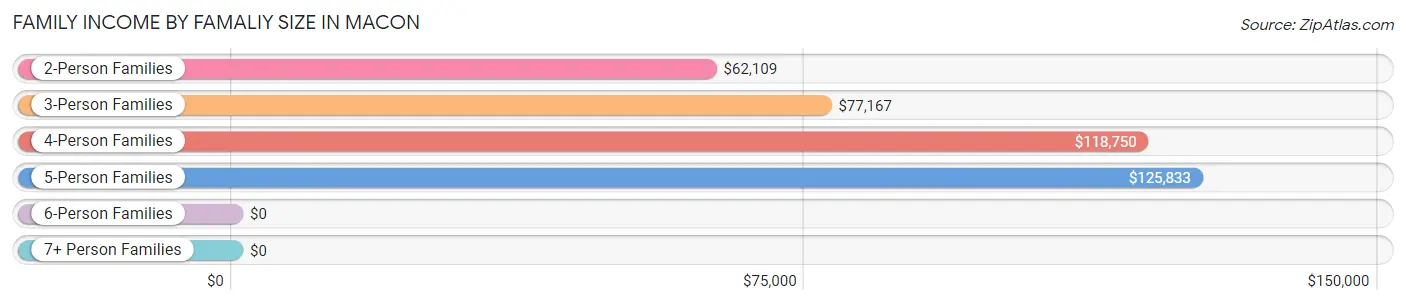
| Income Bracket | # Families | Median Income |
| 2-Person Families | 199 (61.4%) | $62,109 |
| 3-Person Families | 60 (18.5%) | $77,167 |
| 4-Person Families | 27 (8.3%) | $118,750 |
| 5-Person Families | 36 (11.1%) | $125,833 |
| 6-Person Families | 2 (0.6%) | $0 |
| 7+ Person Families | 0 (0.0%) | $0 |
| Total | 324 (100.0%) | $76,579 |
Family Income by Number of Earners in Macon
The median family income in Macon is $76,579, with families comprising 3+ earners (26) having the highest median family income of $123,611, while families with 1 earner (65) have the lowest median family income of $45,417, accounting for 8.0% and 20.1% of families, respectively.
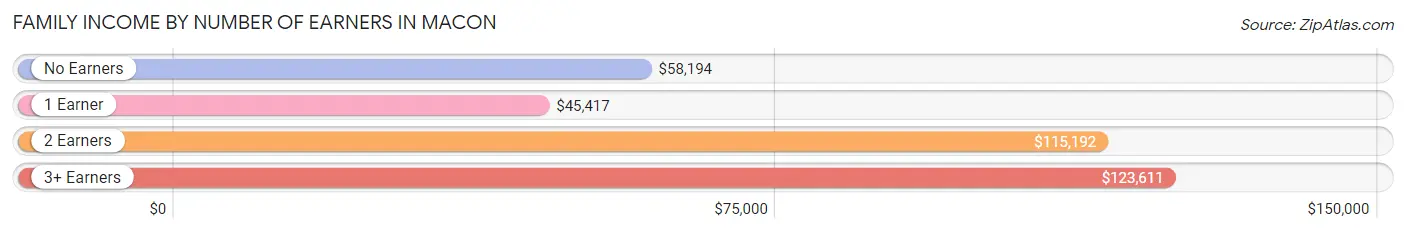
| Number of Earners | # Families | Median Income |
| No Earners | 61 (18.8%) | $58,194 |
| 1 Earner | 65 (20.1%) | $45,417 |
| 2 Earners | 172 (53.1%) | $115,192 |
| 3+ Earners | 26 (8.0%) | $123,611 |
| Total | 324 (100.0%) | $76,579 |
Household Income in Macon
Household Income Brackets in Macon
With 131 households falling in the category, the $50,000 to $74,999 income range is the most frequent in Macon, accounting for 27.2% of all households. In contrast, only 13 households (2.7%) fall into the $15,000 to $24,999 income bracket, making it the least populous group.
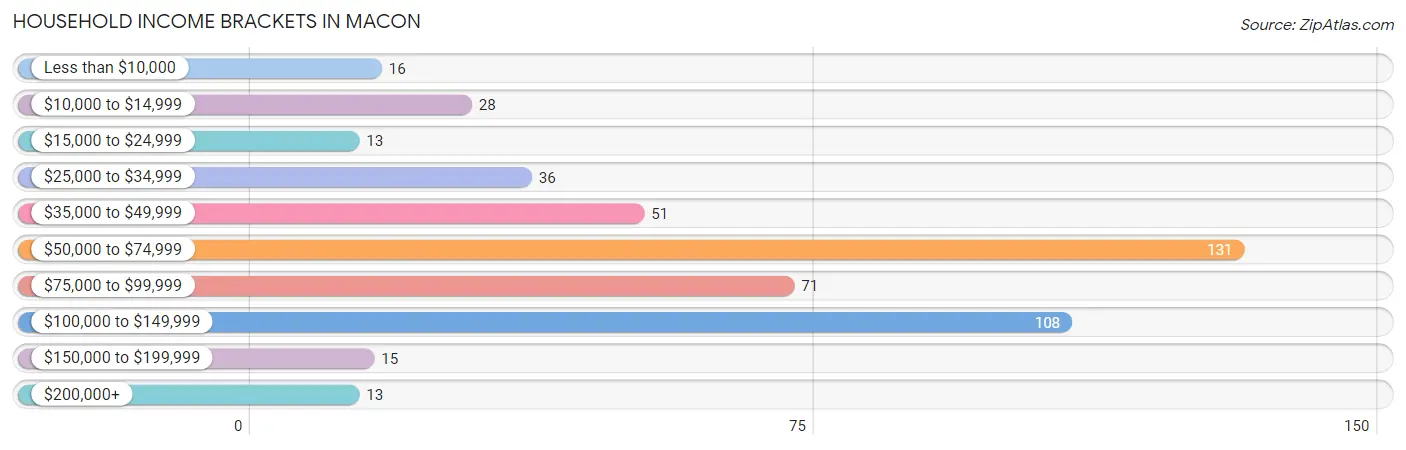
| Income Bracket | # Households | % Households |
| Less than $10,000 | 16 | 3.3% |
| $10,000 to $14,999 | 28 | 5.8% |
| $15,000 to $24,999 | 13 | 2.7% |
| $25,000 to $34,999 | 36 | 7.5% |
| $35,000 to $49,999 | 51 | 10.6% |
| $50,000 to $74,999 | 131 | 27.2% |
| $75,000 to $99,999 | 71 | 14.7% |
| $100,000 to $149,999 | 108 | 22.4% |
| $150,000 to $199,999 | 15 | 3.1% |
| $200,000+ | 13 | 2.7% |
Household Income by Householder Age in Macon
The median household income in Macon is $64,412, with the highest median household income of $82,500 found in the 45 to 64 years age bracket for the primary householder. A total of 166 households (34.4%) fall into this category. Meanwhile, the 15 to 24 years age bracket for the primary householder has the lowest median household income of $32,500, with 14 households (2.9%) in this group.
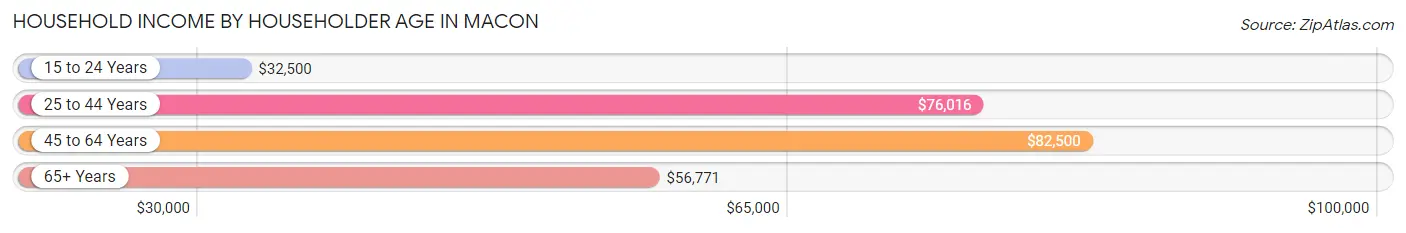
| Income Bracket | # Households | Median Income |
| 15 to 24 Years | 14 (2.9%) | $32,500 |
| 25 to 44 Years | 149 (30.9%) | $76,016 |
| 45 to 64 Years | 166 (34.4%) | $82,500 |
| 65+ Years | 153 (31.7%) | $56,771 |
| Total | 482 (100.0%) | $64,412 |
Poverty in Macon
Income Below Poverty by Sex and Age in Macon
With 7.7% poverty level for males and 3.6% for females among the residents of Macon, 25 to 34 year old males and 45 to 54 year old females are the most vulnerable to poverty, with 20 males (25.3%) and 14 females (23.7%) in their respective age groups living below the poverty level.
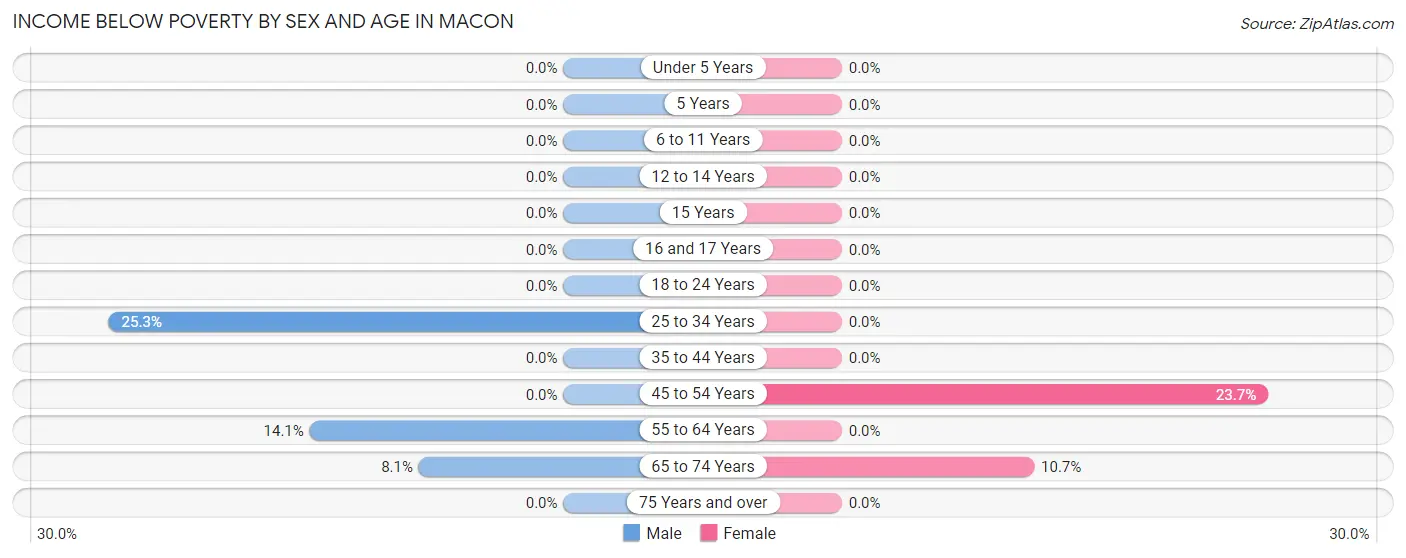
| Age Bracket | Male | Female |
| Under 5 Years | 0 (0.0%) | 0 (0.0%) |
| 5 Years | 0 (0.0%) | 0 (0.0%) |
| 6 to 11 Years | 0 (0.0%) | 0 (0.0%) |
| 12 to 14 Years | 0 (0.0%) | 0 (0.0%) |
| 15 Years | 0 (0.0%) | 0 (0.0%) |
| 16 and 17 Years | 0 (0.0%) | 0 (0.0%) |
| 18 to 24 Years | 0 (0.0%) | 0 (0.0%) |
| 25 to 34 Years | 20 (25.3%) | 0 (0.0%) |
| 35 to 44 Years | 0 (0.0%) | 0 (0.0%) |
| 45 to 54 Years | 0 (0.0%) | 14 (23.7%) |
| 55 to 64 Years | 13 (14.1%) | 0 (0.0%) |
| 65 to 74 Years | 7 (8.1%) | 6 (10.7%) |
| 75 Years and over | 0 (0.0%) | 0 (0.0%) |
| Total | 40 (7.7%) | 20 (3.6%) |
Income Above Poverty by Sex and Age in Macon
According to the poverty statistics in Macon, males aged under 5 years and females aged under 5 years are the age groups that are most secure financially, with 100.0% of males and 100.0% of females in these age groups living above the poverty line.
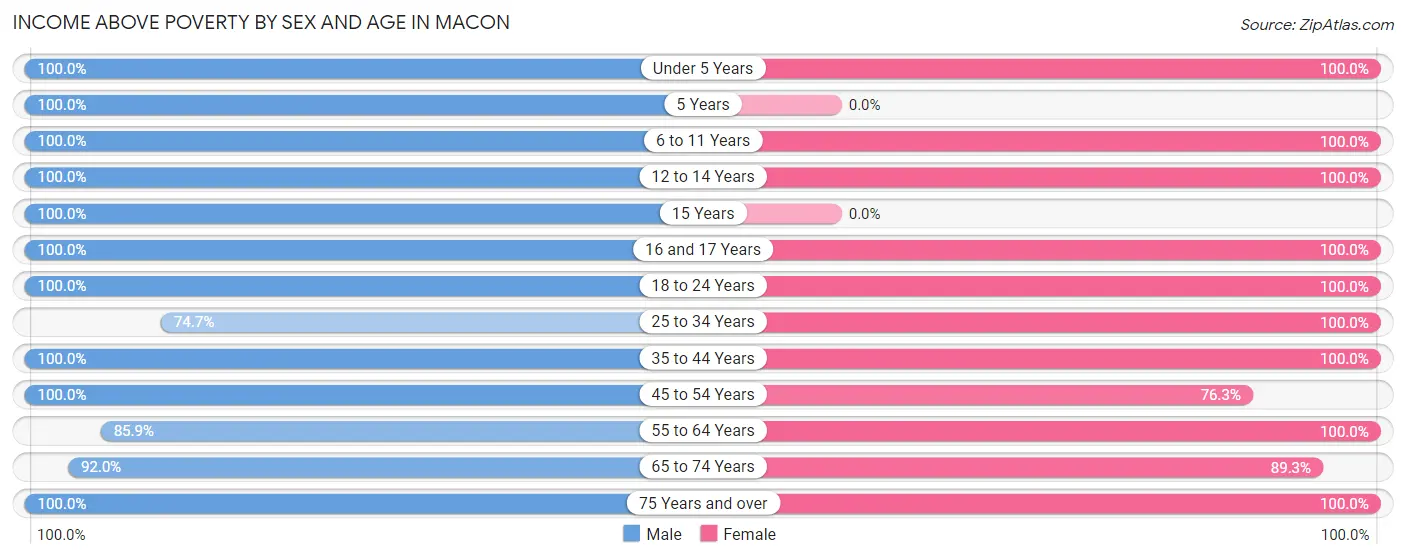
| Age Bracket | Male | Female |
| Under 5 Years | 9 (100.0%) | 49 (100.0%) |
| 5 Years | 6 (100.0%) | 0 (0.0%) |
| 6 to 11 Years | 28 (100.0%) | 42 (100.0%) |
| 12 to 14 Years | 25 (100.0%) | 8 (100.0%) |
| 15 Years | 22 (100.0%) | 0 (0.0%) |
| 16 and 17 Years | 28 (100.0%) | 4 (100.0%) |
| 18 to 24 Years | 4 (100.0%) | 36 (100.0%) |
| 25 to 34 Years | 59 (74.7%) | 98 (100.0%) |
| 35 to 44 Years | 46 (100.0%) | 41 (100.0%) |
| 45 to 54 Years | 53 (100.0%) | 45 (76.3%) |
| 55 to 64 Years | 79 (85.9%) | 88 (100.0%) |
| 65 to 74 Years | 80 (91.9%) | 50 (89.3%) |
| 75 Years and over | 42 (100.0%) | 76 (100.0%) |
| Total | 481 (92.3%) | 537 (96.4%) |
Income Below Poverty Among Married-Couple Families in Macon
The poverty statistics for married-couple families in Macon show that 4.4% or 12 of the total 273 families live below the poverty line. Families with no children have the highest poverty rate of 6.9%, comprising of 12 families. On the other hand, families with 1 or 2 children have the lowest poverty rate of 0.0%, which includes 0 families.
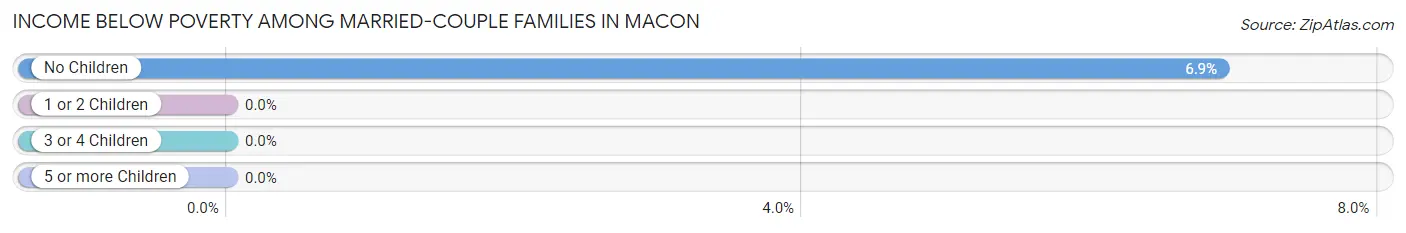
| Children | Above Poverty | Below Poverty |
| No Children | 162 (93.1%) | 12 (6.9%) |
| 1 or 2 Children | 90 (100.0%) | 0 (0.0%) |
| 3 or 4 Children | 9 (100.0%) | 0 (0.0%) |
| 5 or more Children | 0 (0.0%) | 0 (0.0%) |
| Total | 261 (95.6%) | 12 (4.4%) |
Income Below Poverty Among Single-Parent Households in Macon
| Children | Single Father | Single Mother |
| No Children | 0 (0.0%) | 0 (0.0%) |
| 1 or 2 Children | 0 (0.0%) | 0 (0.0%) |
| 3 or 4 Children | 0 (0.0%) | 0 (0.0%) |
| 5 or more Children | 0 (0.0%) | 0 (0.0%) |
| Total | 0 (0.0%) | 0 (0.0%) |
Income Below Poverty Among Married-Couple vs Single-Parent Households in Macon
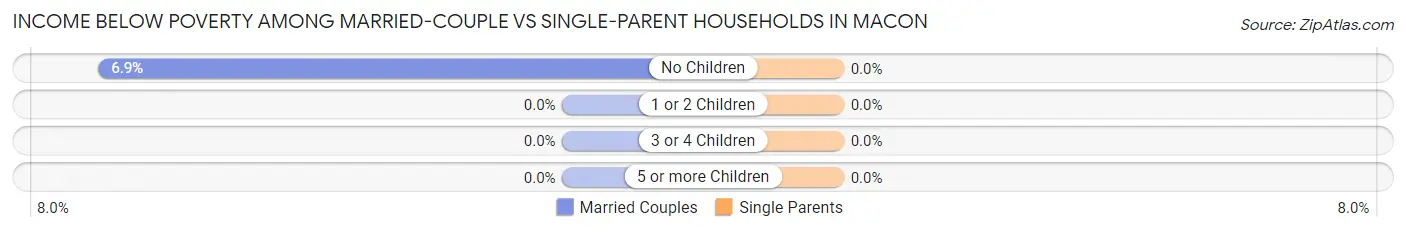
| Children | Married-Couple Families | Single-Parent Households |
| No Children | 12 (6.9%) | 0 (0.0%) |
| 1 or 2 Children | 0 (0.0%) | 0 (0.0%) |
| 3 or 4 Children | 0 (0.0%) | 0 (0.0%) |
| 5 or more Children | 0 (0.0%) | 0 (0.0%) |
| Total | 12 (4.4%) | 0 (0.0%) |
Race in Macon
The most populous races in Macon are White / Caucasian (1,025 | 94.9%), Two or more Races (24 | 2.2%), and Black / African American (17 | 1.6%).
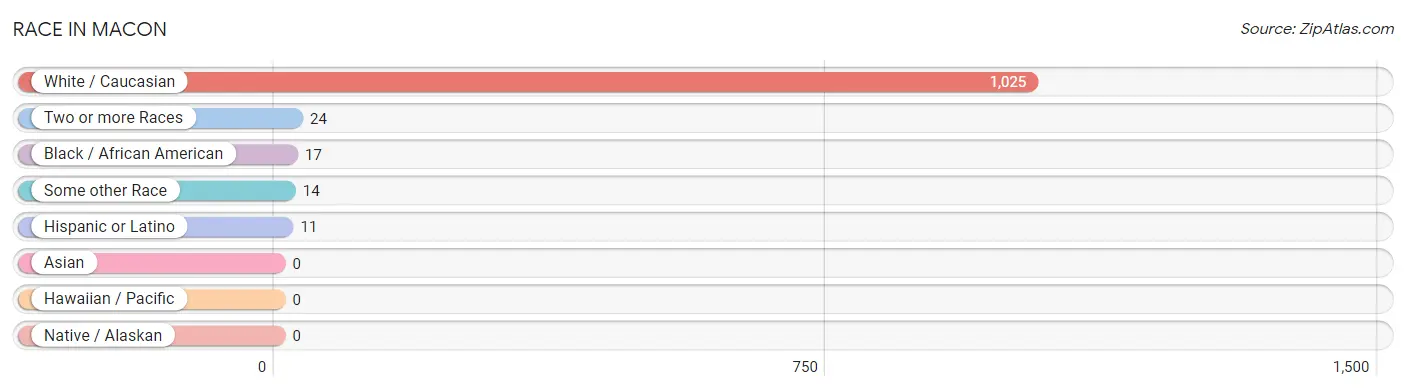
| Race | # Population | % Population |
| Asian | 0 | 0.0% |
| Black / African American | 17 | 1.6% |
| Hawaiian / Pacific | 0 | 0.0% |
| Hispanic or Latino | 11 | 1.0% |
| Native / Alaskan | 0 | 0.0% |
| White / Caucasian | 1,025 | 94.9% |
| Two or more Races | 24 | 2.2% |
| Some other Race | 14 | 1.3% |
| Total | 1,080 | 100.0% |
Ancestry in Macon
The most populous ancestries reported in Macon are German (224 | 20.7%), English (172 | 15.9%), Irish (162 | 15.0%), American (106 | 9.8%), and Italian (29 | 2.7%), together accounting for 64.2% of all Macon residents.
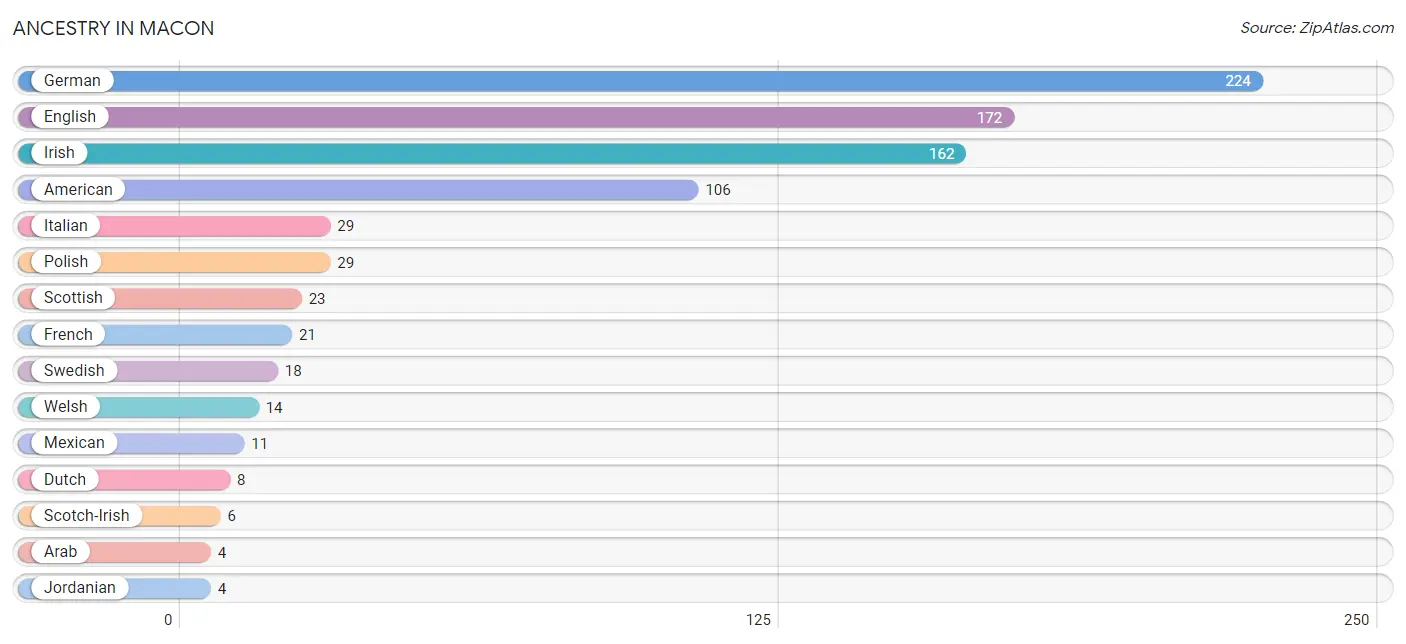
| Ancestry | # Population | % Population |
| American | 106 | 9.8% |
| Arab | 4 | 0.4% |
| Czech | 2 | 0.2% |
| Dutch | 8 | 0.7% |
| English | 172 | 15.9% |
| French | 21 | 1.9% |
| German | 224 | 20.7% |
| Irish | 162 | 15.0% |
| Italian | 29 | 2.7% |
| Jordanian | 4 | 0.4% |
| Lithuanian | 2 | 0.2% |
| Mexican | 11 | 1.0% |
| Polish | 29 | 2.7% |
| Scotch-Irish | 6 | 0.6% |
| Scottish | 23 | 2.1% |
| Swedish | 18 | 1.7% |
| Welsh | 14 | 1.3% | View All 17 Rows |
Immigrants in Macon
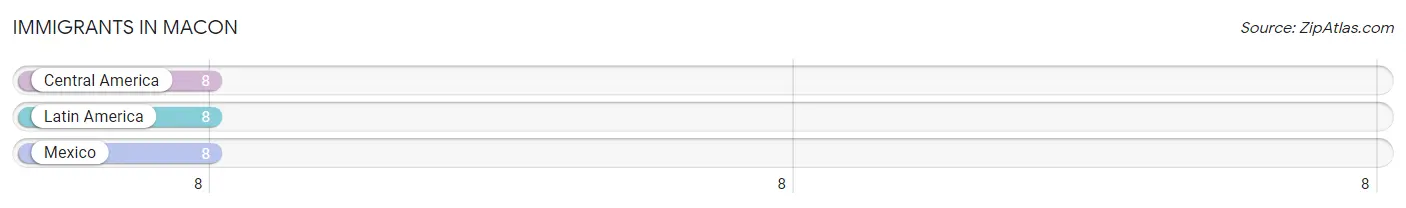
The most numerous immigrant groups reported in Macon came from Central America (8 | 0.7%), Latin America (8 | 0.7%), and Mexico (8 | 0.7%), together accounting for 2.2% of all Macon residents.
| Immigration Origin | # Population | % Population |
| Central America | 8 | 0.7% |
| Latin America | 8 | 0.7% |
| Mexico | 8 | 0.7% | View All 3 Rows |
Sex and Age in Macon
Sex and Age in Macon
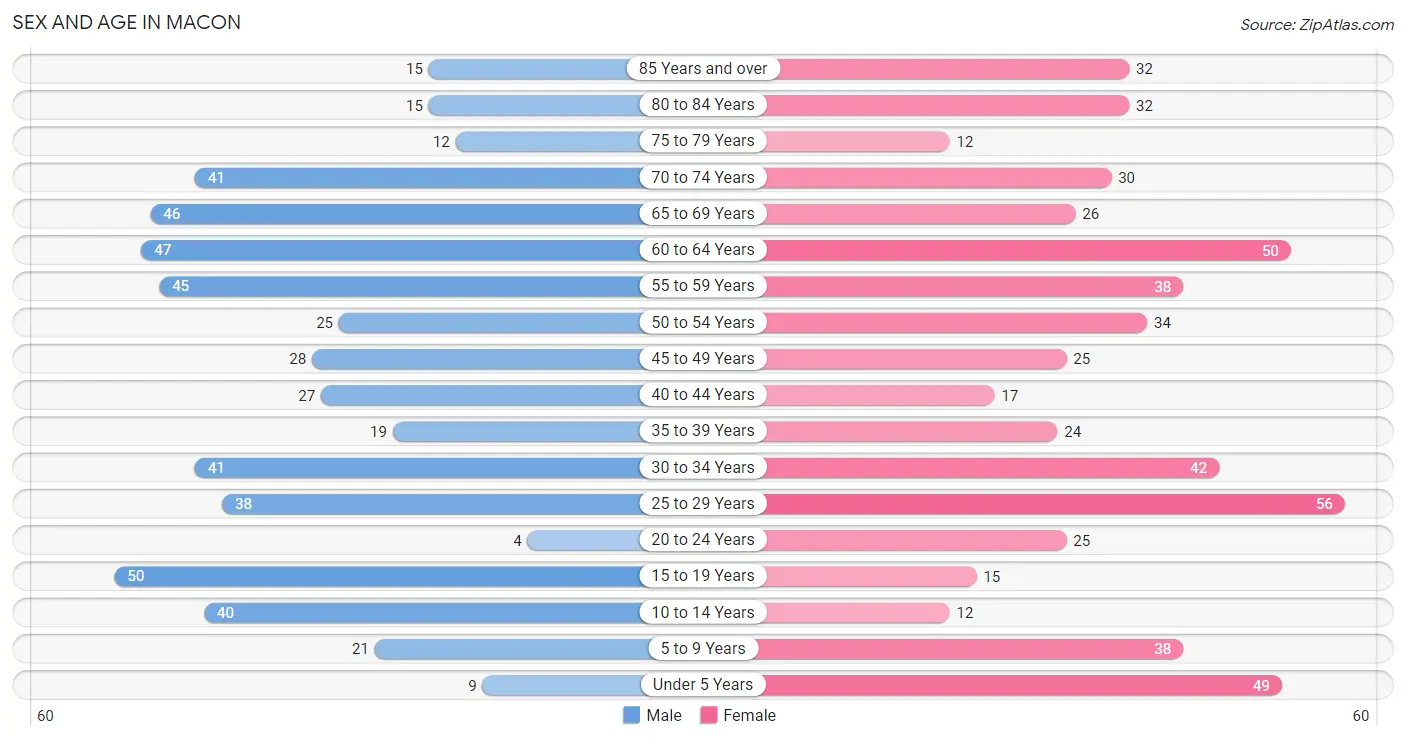
The most populous age groups in Macon are 15 to 19 Years (50 | 9.6%) for men and 25 to 29 Years (56 | 10.1%) for women.
| Age Bracket | Male | Female |
| Under 5 Years | 9 (1.7%) | 49 (8.8%) |
| 5 to 9 Years | 21 (4.0%) | 38 (6.8%) |
| 10 to 14 Years | 40 (7.6%) | 12 (2.1%) |
| 15 to 19 Years | 50 (9.6%) | 15 (2.7%) |
| 20 to 24 Years | 4 (0.8%) | 25 (4.5%) |
| 25 to 29 Years | 38 (7.3%) | 56 (10.1%) |
| 30 to 34 Years | 41 (7.8%) | 42 (7.5%) |
| 35 to 39 Years | 19 (3.6%) | 24 (4.3%) |
| 40 to 44 Years | 27 (5.2%) | 17 (3.0%) |
| 45 to 49 Years | 28 (5.3%) | 25 (4.5%) |
| 50 to 54 Years | 25 (4.8%) | 34 (6.1%) |
| 55 to 59 Years | 45 (8.6%) | 38 (6.8%) |
| 60 to 64 Years | 47 (9.0%) | 50 (9.0%) |
| 65 to 69 Years | 46 (8.8%) | 26 (4.7%) |
| 70 to 74 Years | 41 (7.8%) | 30 (5.4%) |
| 75 to 79 Years | 12 (2.3%) | 12 (2.1%) |
| 80 to 84 Years | 15 (2.9%) | 32 (5.8%) |
| 85 Years and over | 15 (2.9%) | 32 (5.8%) |
| Total | 523 (100.0%) | 557 (100.0%) |
Families and Households in Macon
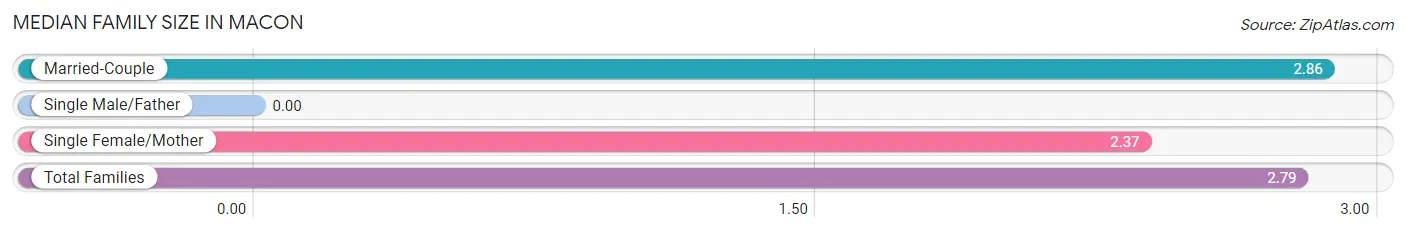
Median Family Size in Macon
| Family Type | # Families | Family Size |
| Married-Couple | 273 (84.3%) | 2.86 |
| Single Male/Father | 0 (0.0%) | - |
| Single Female/Mother | 51 (15.7%) | 2.37 |
| Total Families | 324 (100.0%) | 2.79 |
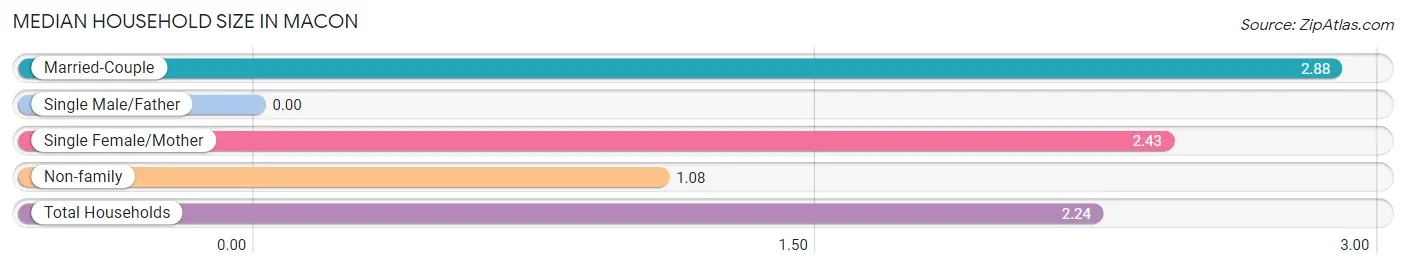
Median Household Size in Macon
| Household Type | # Households | Household Size |
| Married-Couple | 273 (56.6%) | 2.88 |
| Single Male/Father | 0 (0.0%) | - |
| Single Female/Mother | 51 (10.6%) | 2.43 |
| Non-family | 158 (32.8%) | 1.08 |
| Total Households | 482 (100.0%) | 2.24 |
Household Size by Marriage Status in Macon
Out of a total of 482 households in Macon, 324 (67.2%) are family households, while 158 (32.8%) are nonfamily households. The most numerous type of family households are 2-person households, comprising 196, and the most common type of nonfamily households are 1-person households, comprising 150.
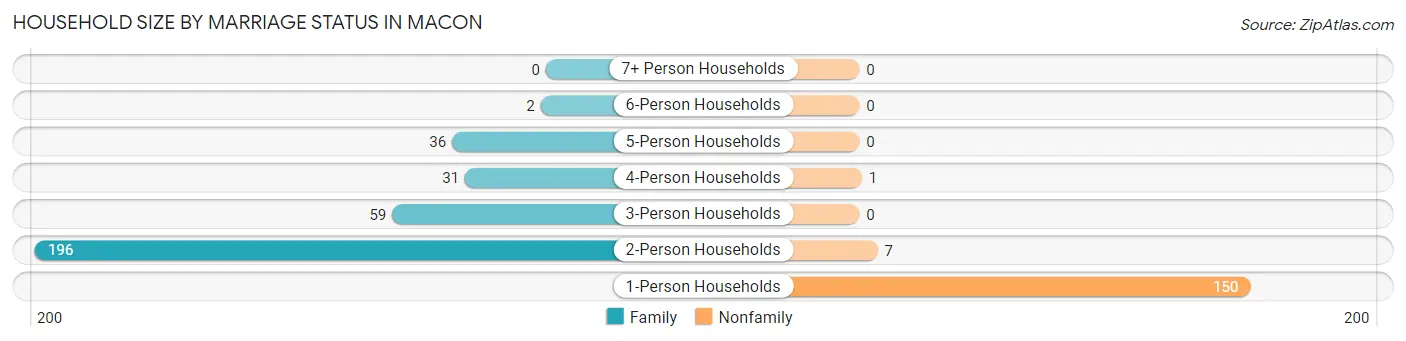
| Household Size | Family Households | Nonfamily Households |
| 1-Person Households | - | 150 (31.1%) |
| 2-Person Households | 196 (40.7%) | 7 (1.5%) |
| 3-Person Households | 59 (12.2%) | 0 (0.0%) |
| 4-Person Households | 31 (6.4%) | 1 (0.2%) |
| 5-Person Households | 36 (7.5%) | 0 (0.0%) |
| 6-Person Households | 2 (0.4%) | 0 (0.0%) |
| 7+ Person Households | 0 (0.0%) | 0 (0.0%) |
| Total | 324 (67.2%) | 158 (32.8%) |
Female Fertility in Macon
Fertility by Age in Macon
Average fertility rate in Macon is 171.0 births per 1,000 women. Women in the age bracket of 35 to 50 years have the highest fertility rate with 328.0 births per 1,000 women. Women in the age bracket of 35 to 50 years acount for 62.9% of all women with births.
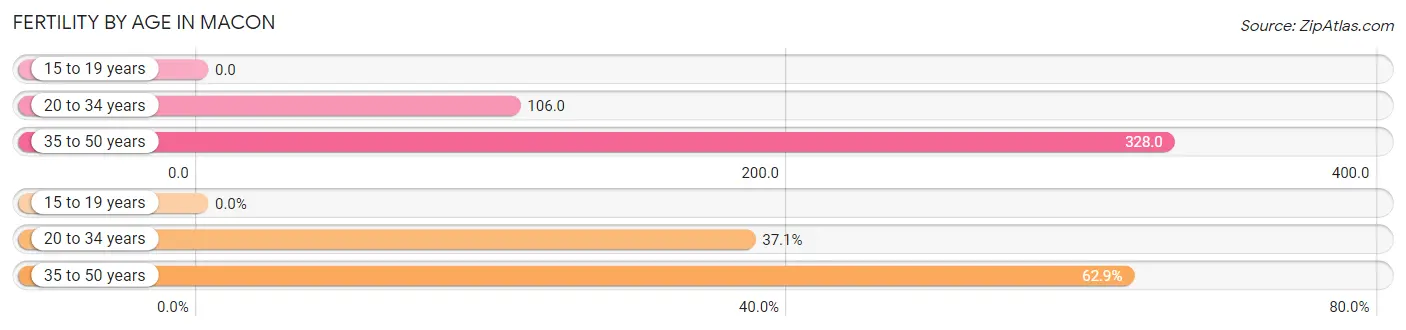
| Age Bracket | Women with Births | Births / 1,000 Women |
| 15 to 19 years | 0 (0.0%) | 0.0 |
| 20 to 34 years | 13 (37.1%) | 106.0 |
| 35 to 50 years | 22 (62.9%) | 328.0 |
| Total | 35 (100.0%) | 171.0 |
Fertility by Age by Marriage Status in Macon
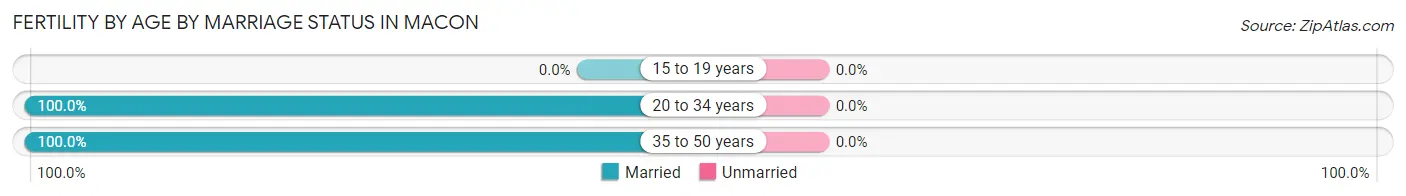
| Age Bracket | Married | Unmarried |
| 15 to 19 years | 0 (0.0%) | 0 (0.0%) |
| 20 to 34 years | 13 (100.0%) | 0 (0.0%) |
| 35 to 50 years | 22 (100.0%) | 0 (0.0%) |
| Total | 35 (100.0%) | 0 (0.0%) |
Fertility by Education in Macon
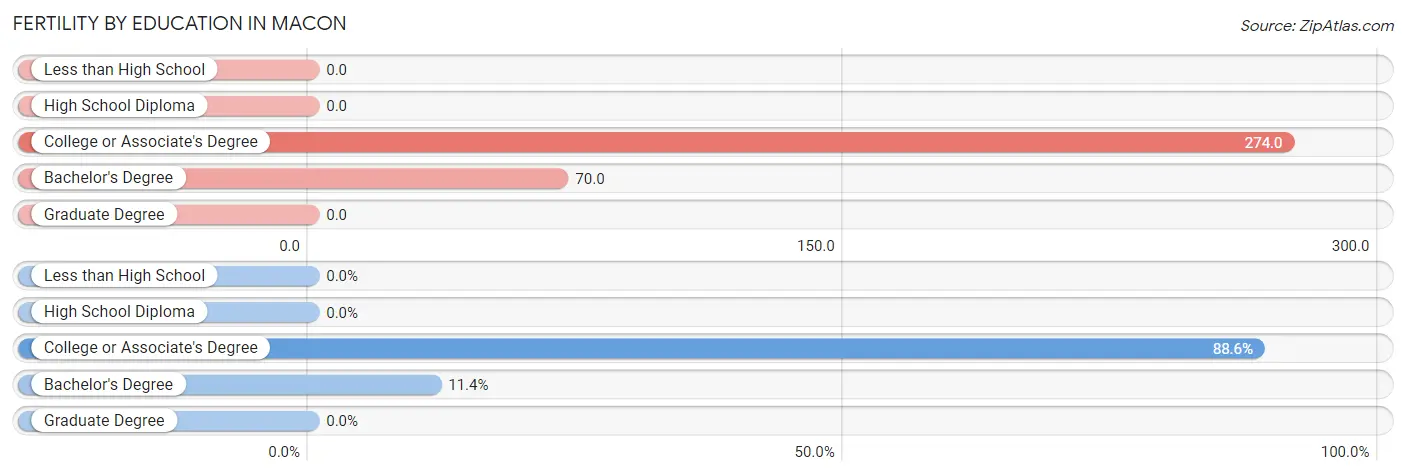
| Educational Attainment | Women with Births | Births / 1,000 Women |
| Less than High School | 0 (0.0%) | 0.0 |
| High School Diploma | 0 (0.0%) | 0.0 |
| College or Associate's Degree | 31 (88.6%) | 274.0 |
| Bachelor's Degree | 4 (11.4%) | 70.0 |
| Graduate Degree | 0 (0.0%) | 0.0 |
| Total | 35 (100.0%) | 171.0 |
Fertility by Education by Marriage Status in Macon
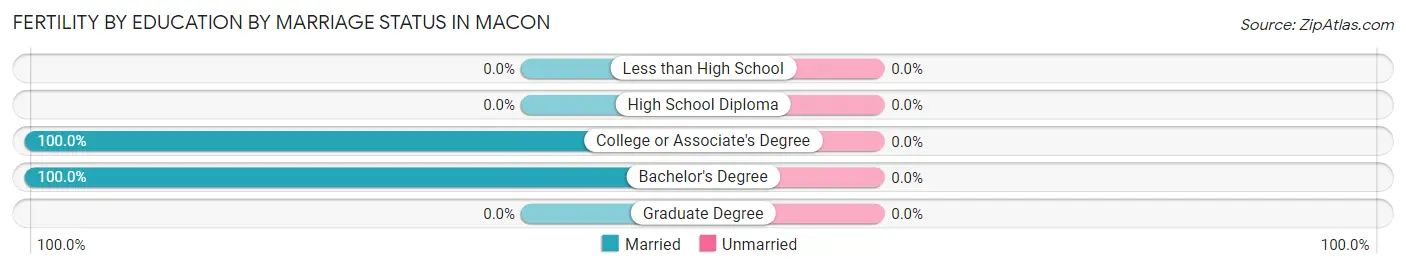
| Educational Attainment | Married | Unmarried |
| Less than High School | 0 (0.0%) | 0 (0.0%) |
| High School Diploma | 0 (0.0%) | 0 (0.0%) |
| College or Associate's Degree | 31 (100.0%) | 0 (0.0%) |
| Bachelor's Degree | 4 (100.0%) | 0 (0.0%) |
| Graduate Degree | 0 (0.0%) | 0 (0.0%) |
| Total | 35 (100.0%) | 0 (0.0%) |
Employment Characteristics in Macon
Employment by Class of Employer in Macon
Among the 516 employed individuals in Macon, private company employees (411 | 79.6%), local government employees (36 | 7.0%), and not-for-profit organizations (31 | 6.0%) make up the most common classes of employment.
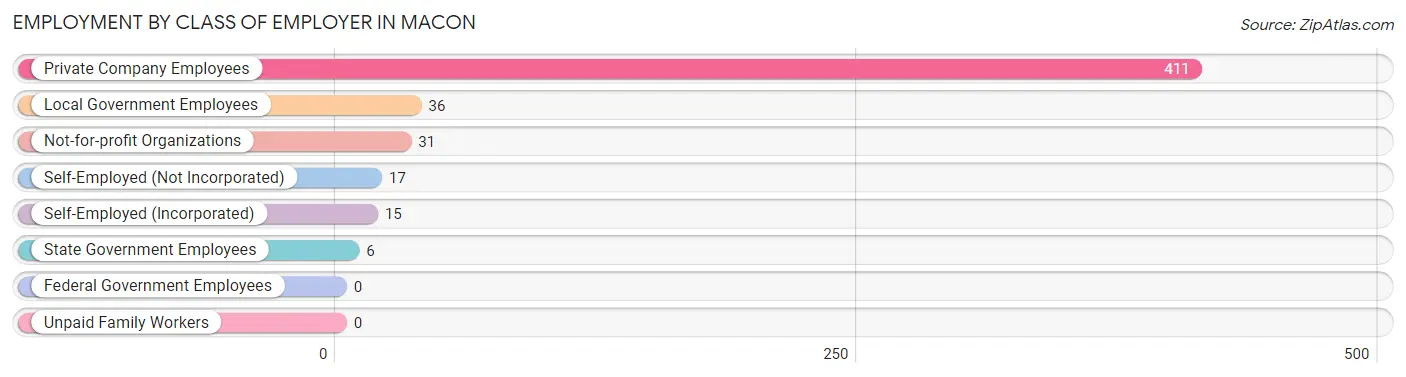
| Employer Class | # Employees | % Employees |
| Private Company Employees | 411 | 79.6% |
| Self-Employed (Incorporated) | 15 | 2.9% |
| Self-Employed (Not Incorporated) | 17 | 3.3% |
| Not-for-profit Organizations | 31 | 6.0% |
| Local Government Employees | 36 | 7.0% |
| State Government Employees | 6 | 1.2% |
| Federal Government Employees | 0 | 0.0% |
| Unpaid Family Workers | 0 | 0.0% |
| Total | 516 | 100.0% |
Employment Status by Age in Macon
According to the labor force statistics for Macon, out of the total population over 16 years of age (889), 60.3% or 536 individuals are in the labor force, with 2.4% or 13 of them unemployed. The age group with the highest labor force participation rate is 25 to 29 years, with 100.0% or 94 individuals in the labor force. Within the labor force, the 75 years and over age range has the highest percentage of unemployed individuals, with 100.0% or 4 of them being unemployed.
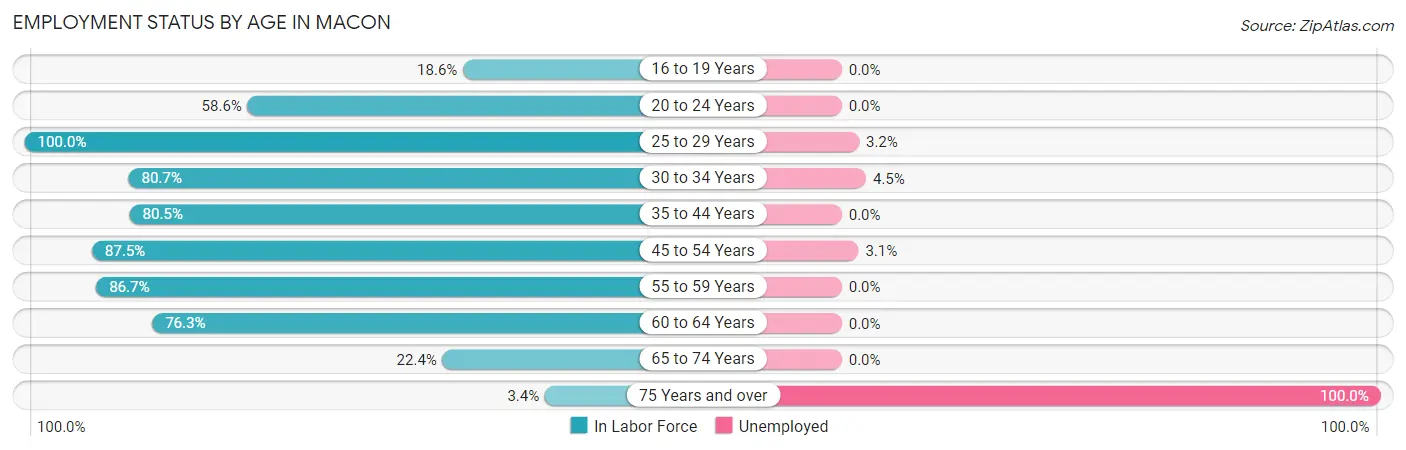
| Age Bracket | In Labor Force | Unemployed |
| 16 to 19 Years | 8 (18.6%) | 0 (0.0%) |
| 20 to 24 Years | 17 (58.6%) | 0 (0.0%) |
| 25 to 29 Years | 94 (100.0%) | 3 (3.2%) |
| 30 to 34 Years | 67 (80.7%) | 3 (4.5%) |
| 35 to 44 Years | 70 (80.5%) | 0 (0.0%) |
| 45 to 54 Years | 98 (87.5%) | 3 (3.1%) |
| 55 to 59 Years | 72 (86.7%) | 0 (0.0%) |
| 60 to 64 Years | 74 (76.3%) | 0 (0.0%) |
| 65 to 74 Years | 32 (22.4%) | 0 (0.0%) |
| 75 Years and over | 4 (3.4%) | 4 (100.0%) |
| Total | 536 (60.3%) | 13 (2.4%) |
Employment Status by Educational Attainment in Macon
According to labor force statistics for Macon, 85.4% of individuals (475) out of the total population between 25 and 64 years of age (556) are in the labor force, with 1.9% or 9 of them being unemployed. The group with the highest labor force participation rate are those with the educational attainment of less than high school, with 100.0% or 12 individuals in the labor force. Within the labor force, individuals with high school diploma education have the highest percentage of unemployment, with 4.8% or 9 of them being unemployed.
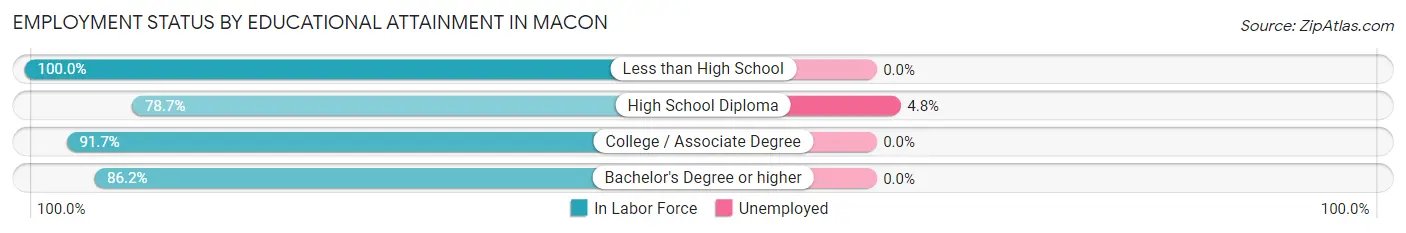
| Educational Attainment | In Labor Force | Unemployed |
| Less than High School | 12 (100.0%) | 0 (0.0%) |
| High School Diploma | 188 (78.7%) | 11 (4.8%) |
| College / Associate Degree | 200 (91.7%) | 0 (0.0%) |
| Bachelor's Degree or higher | 75 (86.2%) | 0 (0.0%) |
| Total | 475 (85.4%) | 11 (1.9%) |
Employment Occupations by Sex in Macon
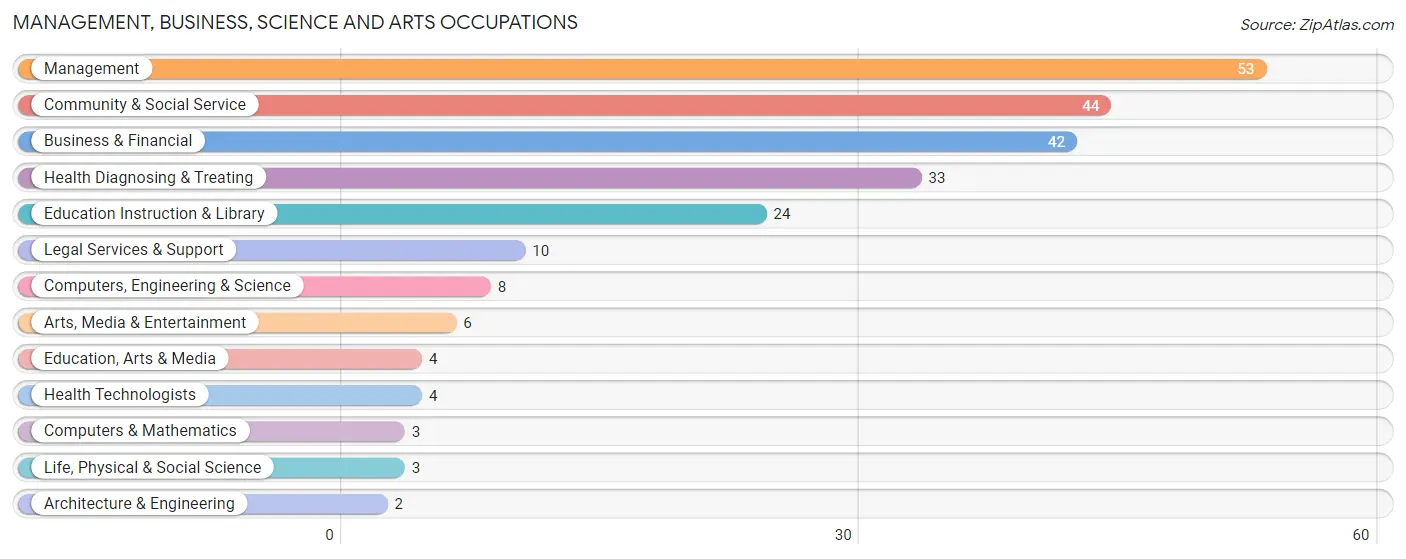
Management, Business, Science and Arts Occupations
The most common Management, Business, Science and Arts occupations in Macon are Management (53 | 10.1%), Community & Social Service (44 | 8.4%), Business & Financial (42 | 8.0%), Health Diagnosing & Treating (33 | 6.3%), and Education Instruction & Library (24 | 4.6%).
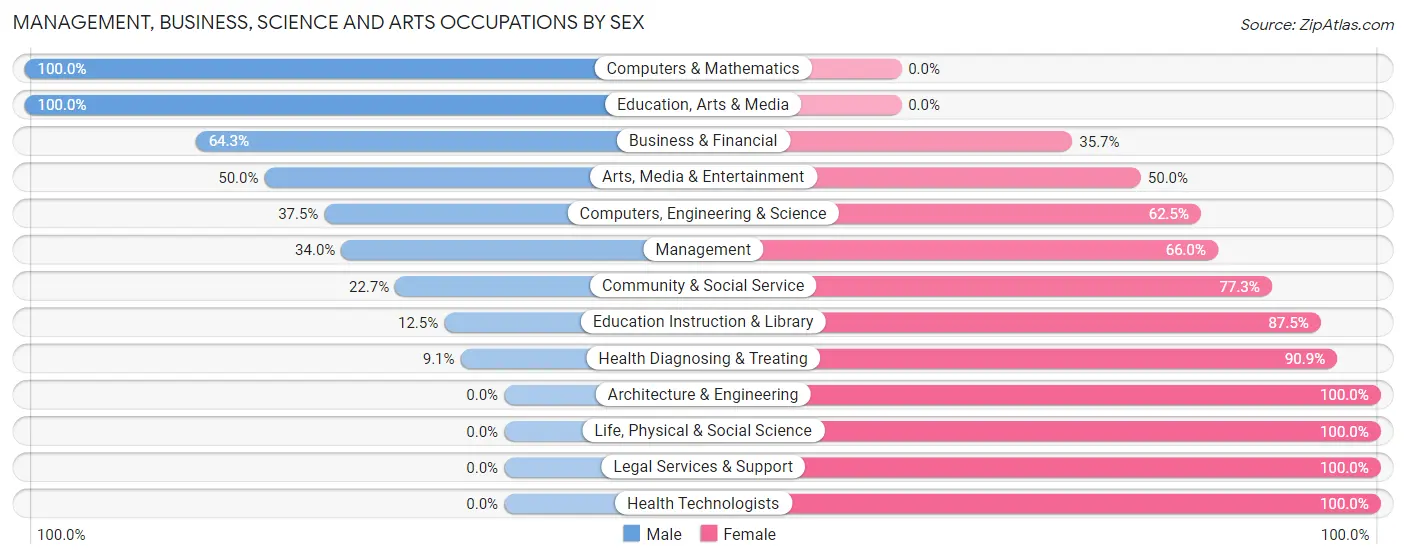
Management, Business, Science and Arts Occupations by Sex
Within the Management, Business, Science and Arts occupations in Macon, the most male-oriented occupations are Computers & Mathematics (100.0%), Education, Arts & Media (100.0%), and Business & Financial (64.3%), while the most female-oriented occupations are Architecture & Engineering (100.0%), Life, Physical & Social Science (100.0%), and Legal Services & Support (100.0%).
| Occupation | Male | Female |
| Management | 18 (34.0%) | 35 (66.0%) |
| Business & Financial | 27 (64.3%) | 15 (35.7%) |
| Computers, Engineering & Science | 3 (37.5%) | 5 (62.5%) |
| Computers & Mathematics | 3 (100.0%) | 0 (0.0%) |
| Architecture & Engineering | 0 (0.0%) | 2 (100.0%) |
| Life, Physical & Social Science | 0 (0.0%) | 3 (100.0%) |
| Community & Social Service | 10 (22.7%) | 34 (77.3%) |
| Education, Arts & Media | 4 (100.0%) | 0 (0.0%) |
| Legal Services & Support | 0 (0.0%) | 10 (100.0%) |
| Education Instruction & Library | 3 (12.5%) | 21 (87.5%) |
| Arts, Media & Entertainment | 3 (50.0%) | 3 (50.0%) |
| Health Diagnosing & Treating | 3 (9.1%) | 30 (90.9%) |
| Health Technologists | 0 (0.0%) | 4 (100.0%) |
| Total (Category) | 61 (33.9%) | 119 (66.1%) |
| Total (Overall) | 251 (48.0%) | 272 (52.0%) |
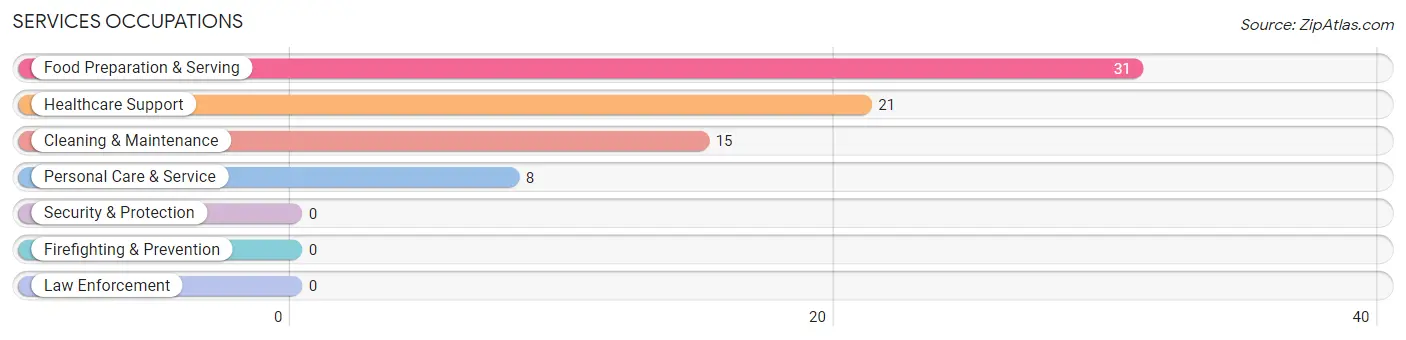
Services Occupations
The most common Services occupations in Macon are Food Preparation & Serving (31 | 5.9%), Healthcare Support (21 | 4.0%), Cleaning & Maintenance (15 | 2.9%), and Personal Care & Service (8 | 1.5%).
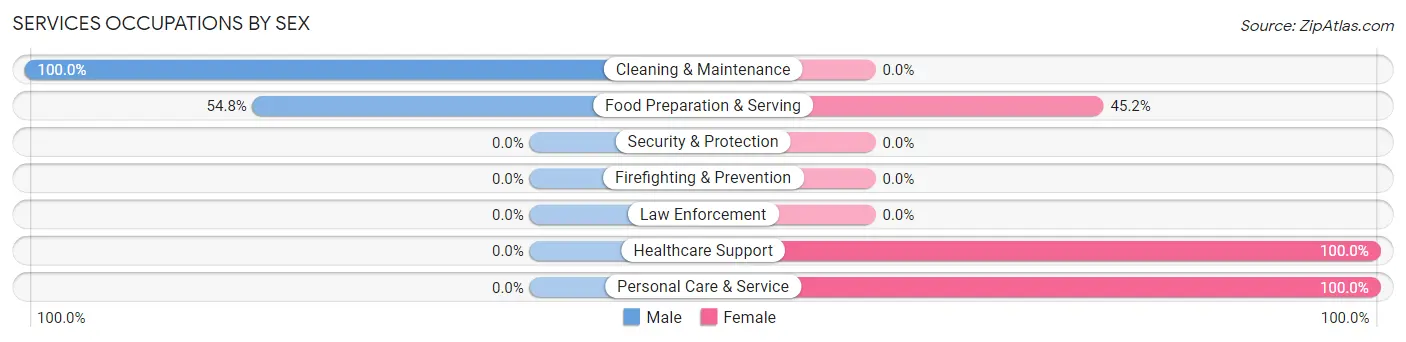
Services Occupations by Sex
Within the Services occupations in Macon, the most male-oriented occupations are Cleaning & Maintenance (100.0%), and Food Preparation & Serving (54.8%), while the most female-oriented occupations are Healthcare Support (100.0%), Personal Care & Service (100.0%), and Food Preparation & Serving (45.2%).
| Occupation | Male | Female |
| Healthcare Support | 0 (0.0%) | 21 (100.0%) |
| Security & Protection | 0 (0.0%) | 0 (0.0%) |
| Firefighting & Prevention | 0 (0.0%) | 0 (0.0%) |
| Law Enforcement | 0 (0.0%) | 0 (0.0%) |
| Food Preparation & Serving | 17 (54.8%) | 14 (45.2%) |
| Cleaning & Maintenance | 15 (100.0%) | 0 (0.0%) |
| Personal Care & Service | 0 (0.0%) | 8 (100.0%) |
| Total (Category) | 32 (42.7%) | 43 (57.3%) |
| Total (Overall) | 251 (48.0%) | 272 (52.0%) |
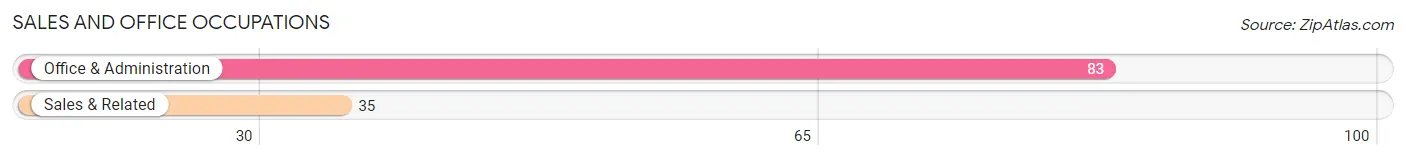
Sales and Office Occupations
The most common Sales and Office occupations in Macon are Office & Administration (83 | 15.9%), and Sales & Related (35 | 6.7%).
Sales and Office Occupations by Sex
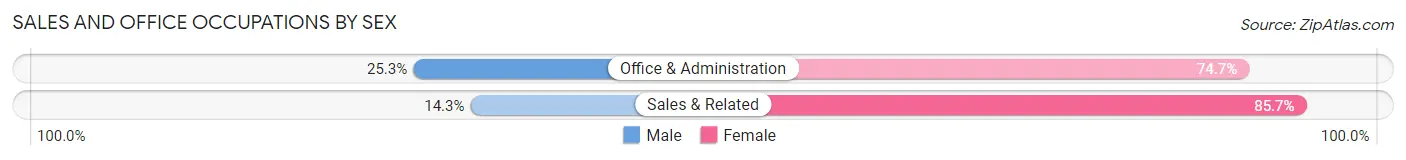
| Occupation | Male | Female |
| Sales & Related | 5 (14.3%) | 30 (85.7%) |
| Office & Administration | 21 (25.3%) | 62 (74.7%) |
| Total (Category) | 26 (22.0%) | 92 (78.0%) |
| Total (Overall) | 251 (48.0%) | 272 (52.0%) |
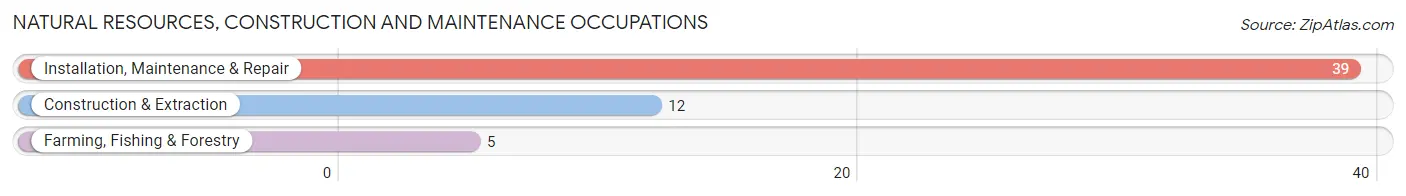
Natural Resources, Construction and Maintenance Occupations
The most common Natural Resources, Construction and Maintenance occupations in Macon are Installation, Maintenance & Repair (39 | 7.5%), Construction & Extraction (12 | 2.3%), and Farming, Fishing & Forestry (5 | 1.0%).
Natural Resources, Construction and Maintenance Occupations by Sex
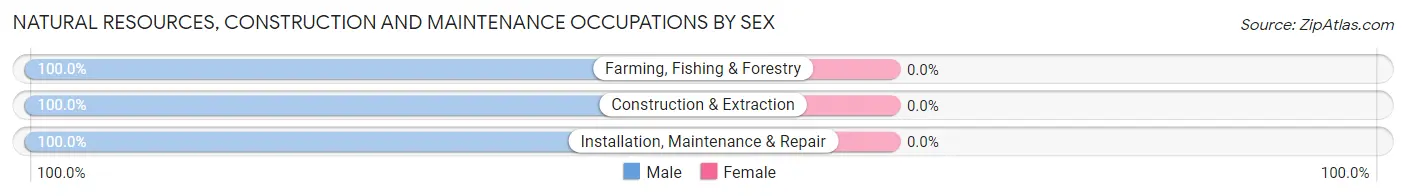
| Occupation | Male | Female |
| Farming, Fishing & Forestry | 5 (100.0%) | 0 (0.0%) |
| Construction & Extraction | 12 (100.0%) | 0 (0.0%) |
| Installation, Maintenance & Repair | 39 (100.0%) | 0 (0.0%) |
| Total (Category) | 56 (100.0%) | 0 (0.0%) |
| Total (Overall) | 251 (48.0%) | 272 (52.0%) |
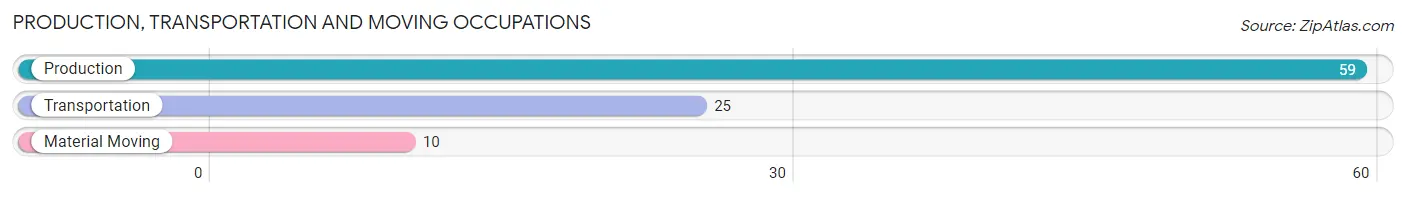
Production, Transportation and Moving Occupations
The most common Production, Transportation and Moving occupations in Macon are Production (59 | 11.3%), Transportation (25 | 4.8%), and Material Moving (10 | 1.9%).
Production, Transportation and Moving Occupations by Sex
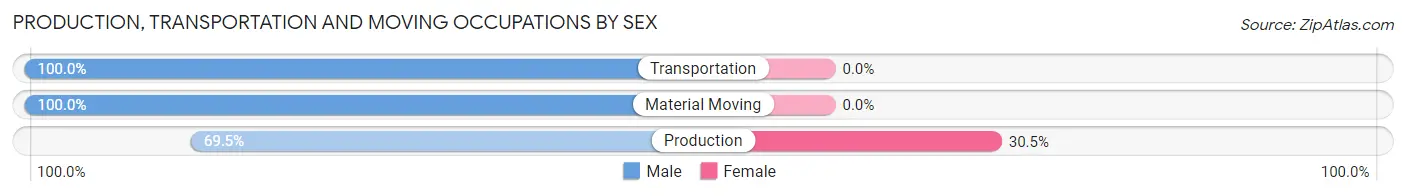
| Occupation | Male | Female |
| Production | 41 (69.5%) | 18 (30.5%) |
| Transportation | 25 (100.0%) | 0 (0.0%) |
| Material Moving | 10 (100.0%) | 0 (0.0%) |
| Total (Category) | 76 (80.8%) | 18 (19.2%) |
| Total (Overall) | 251 (48.0%) | 272 (52.0%) |
Employment Industries by Sex in Macon
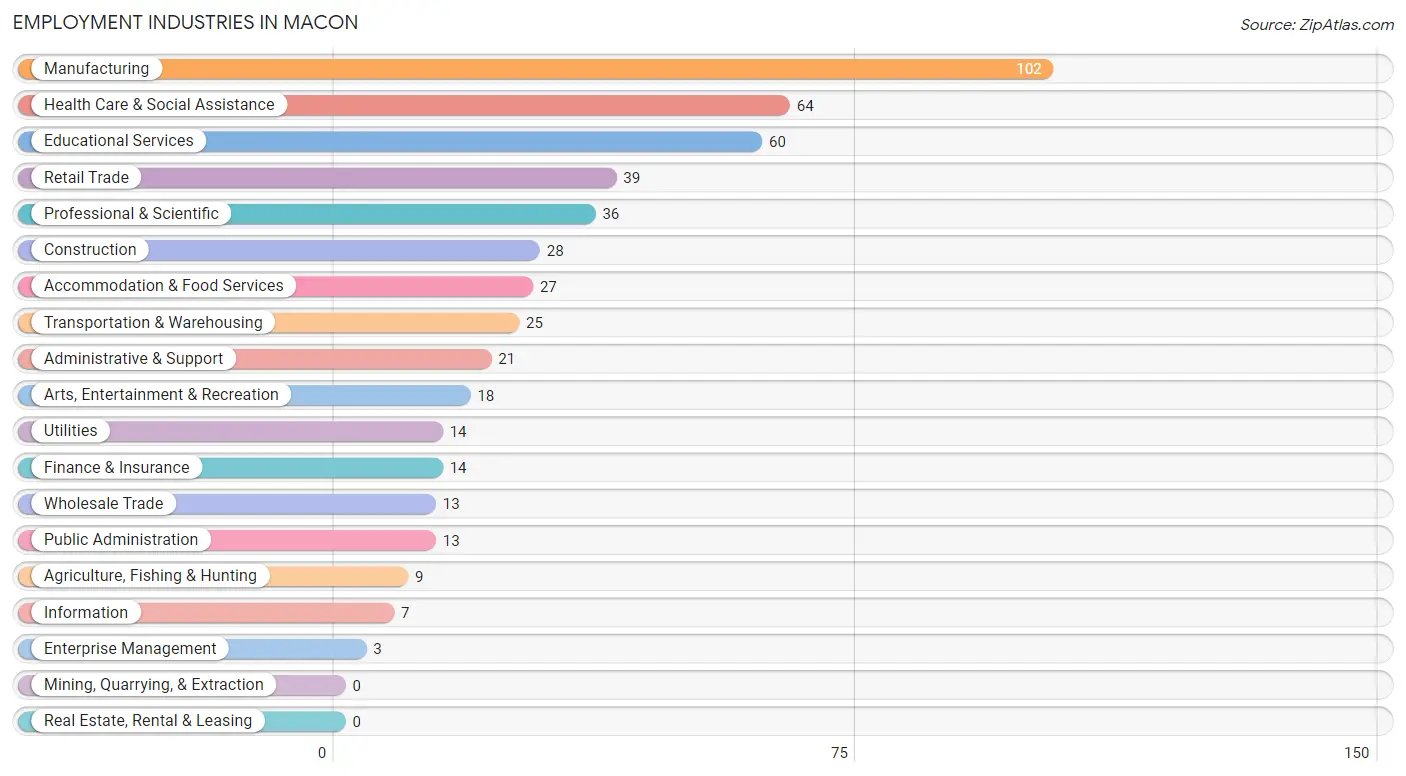
Employment Industries in Macon
The major employment industries in Macon include Manufacturing (102 | 19.5%), Health Care & Social Assistance (64 | 12.2%), Educational Services (60 | 11.5%), Retail Trade (39 | 7.5%), and Professional & Scientific (36 | 6.9%).
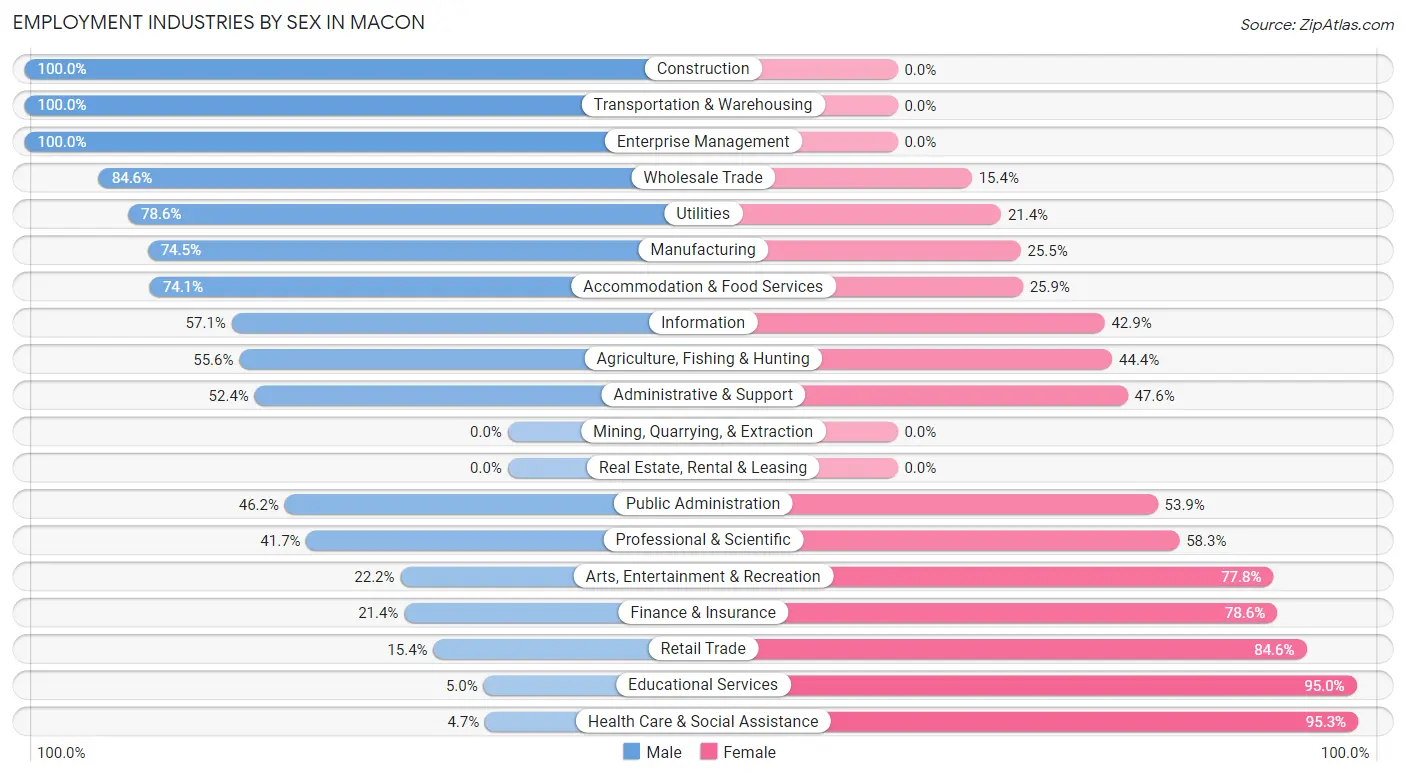
Employment Industries by Sex in Macon
The Macon industries that see more men than women are Construction (100.0%), Transportation & Warehousing (100.0%), and Enterprise Management (100.0%), whereas the industries that tend to have a higher number of women are Health Care & Social Assistance (95.3%), Educational Services (95.0%), and Retail Trade (84.6%).
| Industry | Male | Female |
| Agriculture, Fishing & Hunting | 5 (55.6%) | 4 (44.4%) |
| Mining, Quarrying, & Extraction | 0 (0.0%) | 0 (0.0%) |
| Construction | 28 (100.0%) | 0 (0.0%) |
| Manufacturing | 76 (74.5%) | 26 (25.5%) |
| Wholesale Trade | 11 (84.6%) | 2 (15.4%) |
| Retail Trade | 6 (15.4%) | 33 (84.6%) |
| Transportation & Warehousing | 25 (100.0%) | 0 (0.0%) |
| Utilities | 11 (78.6%) | 3 (21.4%) |
| Information | 4 (57.1%) | 3 (42.9%) |
| Finance & Insurance | 3 (21.4%) | 11 (78.6%) |
| Real Estate, Rental & Leasing | 0 (0.0%) | 0 (0.0%) |
| Professional & Scientific | 15 (41.7%) | 21 (58.3%) |
| Enterprise Management | 3 (100.0%) | 0 (0.0%) |
| Administrative & Support | 11 (52.4%) | 10 (47.6%) |
| Educational Services | 3 (5.0%) | 57 (95.0%) |
| Health Care & Social Assistance | 3 (4.7%) | 61 (95.3%) |
| Arts, Entertainment & Recreation | 4 (22.2%) | 14 (77.8%) |
| Accommodation & Food Services | 20 (74.1%) | 7 (25.9%) |
| Public Administration | 6 (46.2%) | 7 (53.8%) |
| Total | 251 (48.0%) | 272 (52.0%) |
Education in Macon
School Enrollment in Macon
The most common levels of schooling among the 186 students in Macon are high school (43 | 23.1%), elementary school (41 | 22.0%), and middle school (36 | 19.4%).
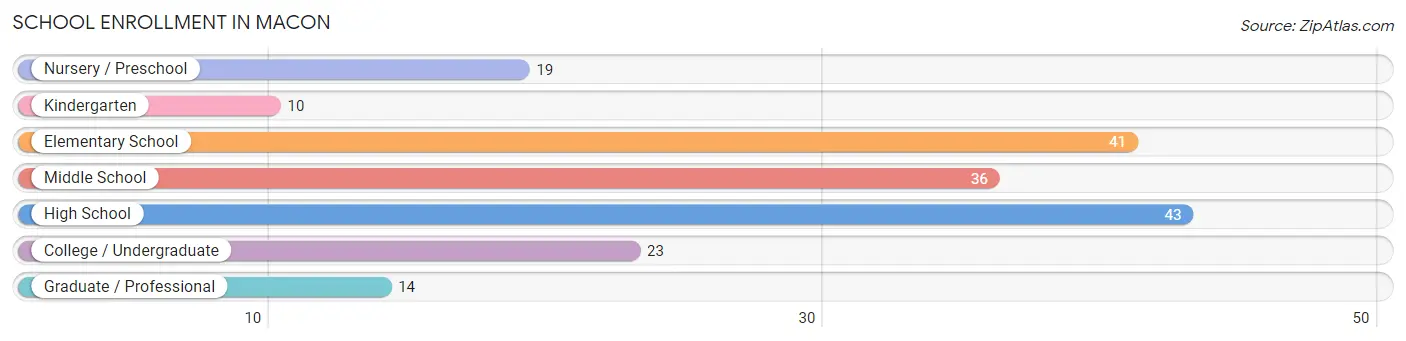
| School Level | # Students | % Students |
| Nursery / Preschool | 19 | 10.2% |
| Kindergarten | 10 | 5.4% |
| Elementary School | 41 | 22.0% |
| Middle School | 36 | 19.4% |
| High School | 43 | 23.1% |
| College / Undergraduate | 23 | 12.4% |
| Graduate / Professional | 14 | 7.5% |
| Total | 186 | 100.0% |
School Enrollment by Age by Funding Source in Macon
Out of a total of 186 students who are enrolled in schools in Macon, 4 (2.2%) attend a private institution, while the remaining 182 (97.8%) are enrolled in public schools. The age group of 15 to 17 year olds has the highest likelihood of being enrolled in private schools, with 4 (12.5% in the age bracket) enrolled. Conversely, the age group of 3 to 4 year olds has the lowest likelihood of being enrolled in a private school, with 13 (100.0% in the age bracket) attending a public institution.
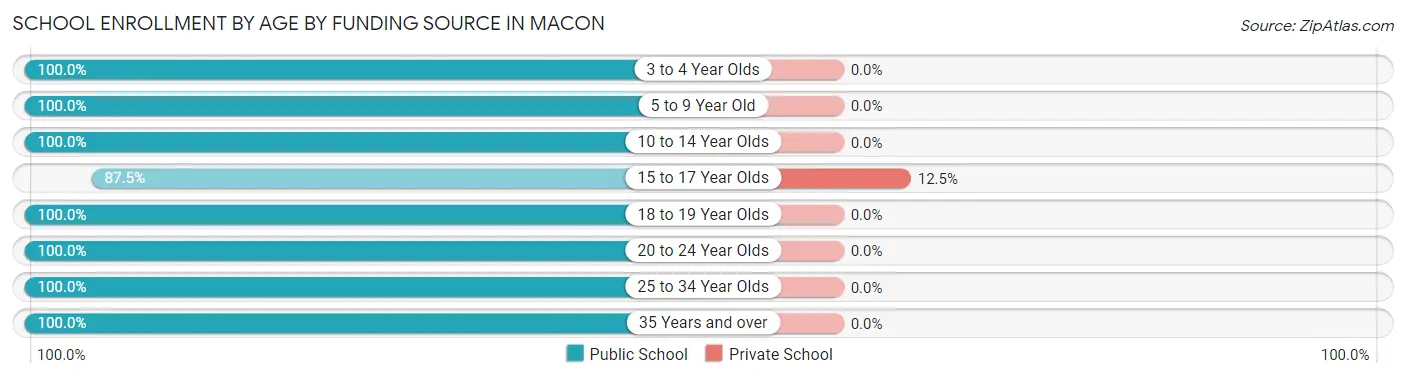
| Age Bracket | Public School | Private School |
| 3 to 4 Year Olds | 13 (100.0%) | 0 (0.0%) |
| 5 to 9 Year Old | 57 (100.0%) | 0 (0.0%) |
| 10 to 14 Year Olds | 36 (100.0%) | 0 (0.0%) |
| 15 to 17 Year Olds | 28 (87.5%) | 4 (12.5%) |
| 18 to 19 Year Olds | 11 (100.0%) | 0 (0.0%) |
| 20 to 24 Year Olds | 15 (100.0%) | 0 (0.0%) |
| 25 to 34 Year Olds | 16 (100.0%) | 0 (0.0%) |
| 35 Years and over | 6 (100.0%) | 0 (0.0%) |
| Total | 182 (97.8%) | 4 (2.2%) |
Educational Attainment by Field of Study in Macon
Business (38 | 34.5%), education (34 | 30.9%), arts & humanities (11 | 10.0%), science & technology (8 | 7.3%), and visual & performing arts (6 | 5.4%) are the most common fields of study among 110 individuals in Macon who have obtained a bachelor's degree or higher.
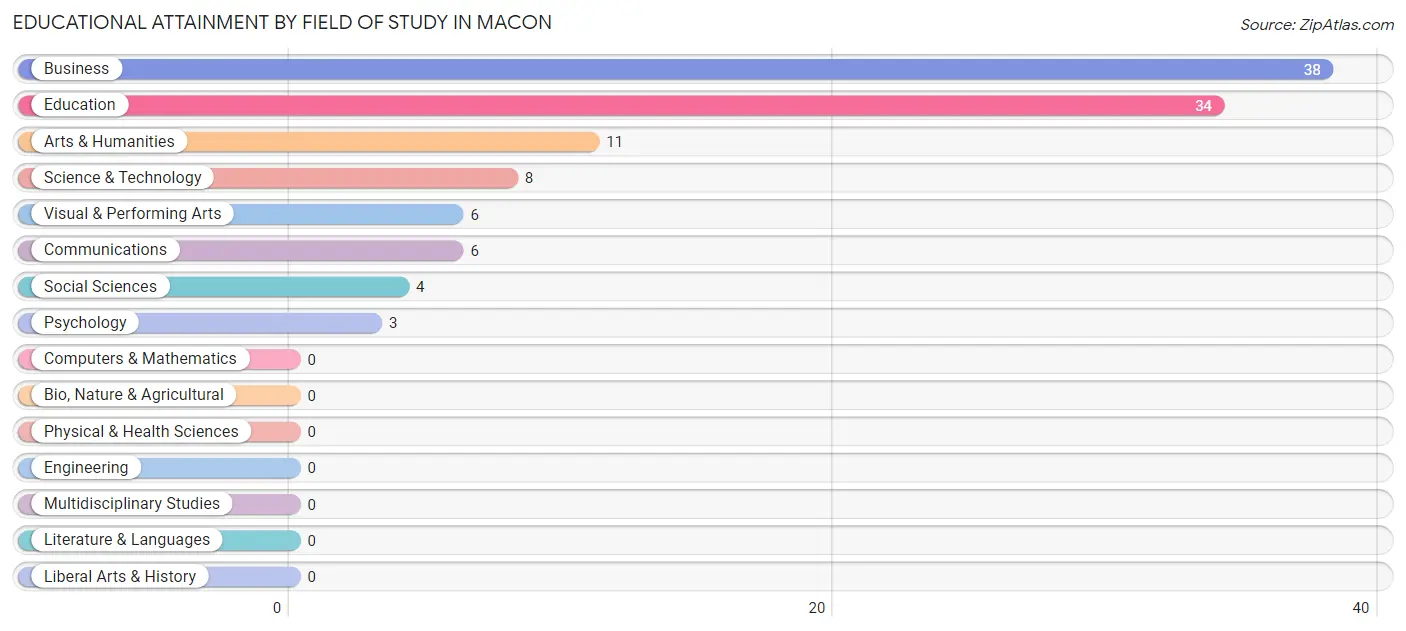
| Field of Study | # Graduates | % Graduates |
| Computers & Mathematics | 0 | 0.0% |
| Bio, Nature & Agricultural | 0 | 0.0% |
| Physical & Health Sciences | 0 | 0.0% |
| Psychology | 3 | 2.7% |
| Social Sciences | 4 | 3.6% |
| Engineering | 0 | 0.0% |
| Multidisciplinary Studies | 0 | 0.0% |
| Science & Technology | 8 | 7.3% |
| Business | 38 | 34.5% |
| Education | 34 | 30.9% |
| Literature & Languages | 0 | 0.0% |
| Liberal Arts & History | 0 | 0.0% |
| Visual & Performing Arts | 6 | 5.4% |
| Communications | 6 | 5.4% |
| Arts & Humanities | 11 | 10.0% |
| Total | 110 | 100.0% |
Transportation & Commute in Macon
Vehicle Availability by Sex in Macon
The most prevalent vehicle ownership categories in Macon are males with 2 vehicles (127, accounting for 52.0%) and females with 2 vehicles (123, making up 46.7%).
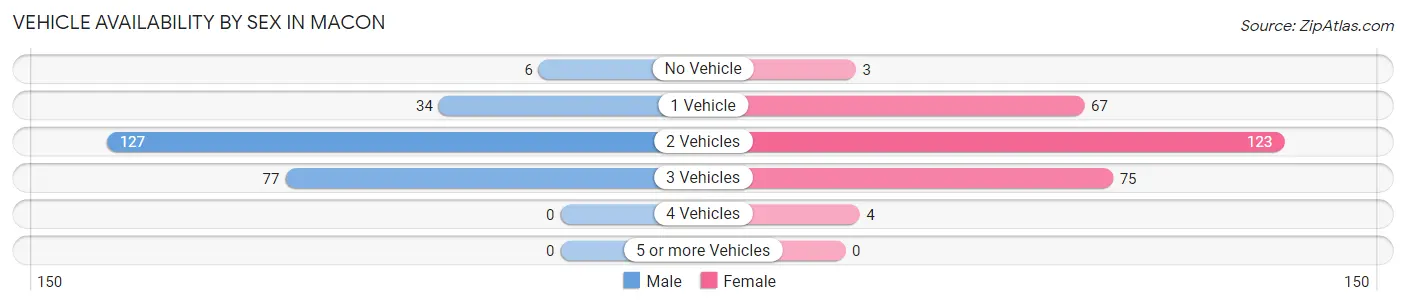
| Vehicles Available | Male | Female |
| No Vehicle | 6 (2.5%) | 3 (1.1%) |
| 1 Vehicle | 34 (13.9%) | 67 (24.6%) |
| 2 Vehicles | 127 (52.0%) | 123 (45.2%) |
| 3 Vehicles | 77 (31.6%) | 75 (27.6%) |
| 4 Vehicles | 0 (0.0%) | 4 (1.5%) |
| 5 or more Vehicles | 0 (0.0%) | 0 (0.0%) |
| Total | 244 (100.0%) | 272 (100.0%) |
Commute Time in Macon
The most frequently occuring commute durations in Macon are 20 to 24 minutes (98 commuters, 20.0%), 15 to 19 minutes (83 commuters, 16.9%), and 30 to 34 minutes (80 commuters, 16.3%).
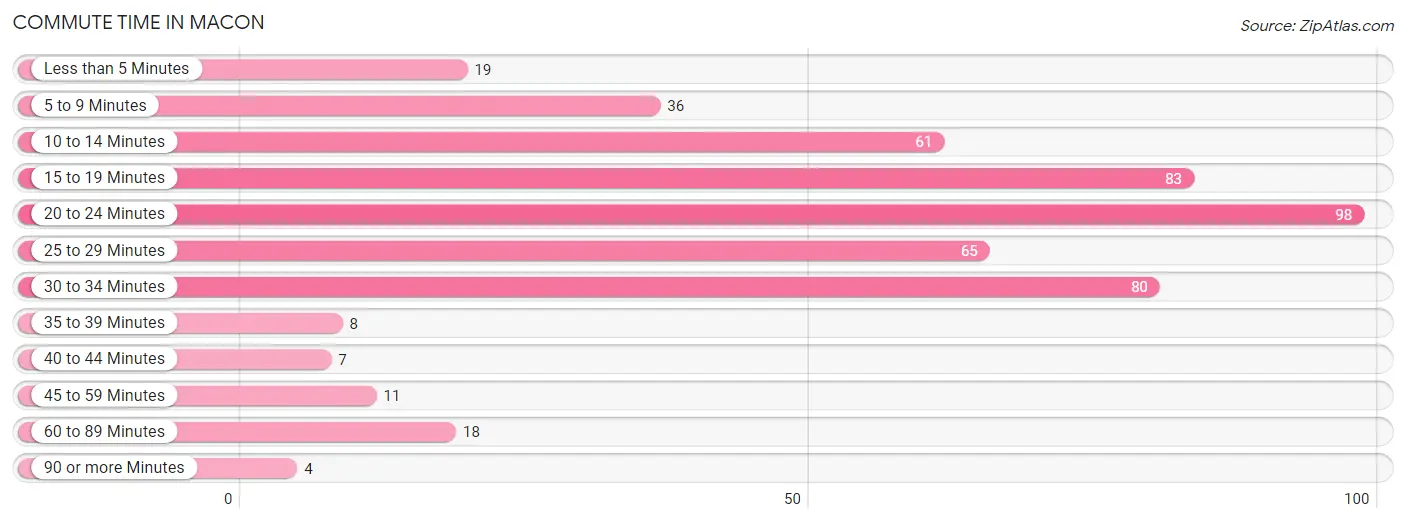
| Commute Time | # Commuters | % Commuters |
| Less than 5 Minutes | 19 | 3.9% |
| 5 to 9 Minutes | 36 | 7.3% |
| 10 to 14 Minutes | 61 | 12.4% |
| 15 to 19 Minutes | 83 | 16.9% |
| 20 to 24 Minutes | 98 | 20.0% |
| 25 to 29 Minutes | 65 | 13.3% |
| 30 to 34 Minutes | 80 | 16.3% |
| 35 to 39 Minutes | 8 | 1.6% |
| 40 to 44 Minutes | 7 | 1.4% |
| 45 to 59 Minutes | 11 | 2.2% |
| 60 to 89 Minutes | 18 | 3.7% |
| 90 or more Minutes | 4 | 0.8% |
Commute Time by Sex in Macon
The most common commute times in Macon are 20 to 24 minutes (54 commuters, 23.6%) for males and 15 to 19 minutes (49 commuters, 18.8%) for females.
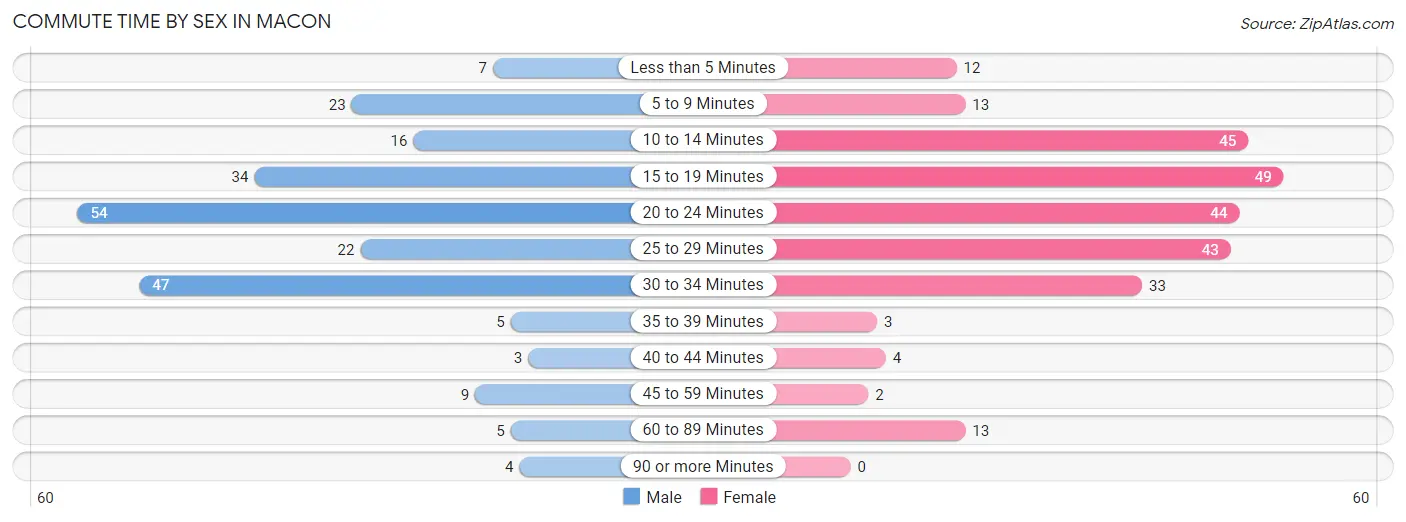
| Commute Time | Male | Female |
| Less than 5 Minutes | 7 (3.1%) | 12 (4.6%) |
| 5 to 9 Minutes | 23 (10.0%) | 13 (5.0%) |
| 10 to 14 Minutes | 16 (7.0%) | 45 (17.2%) |
| 15 to 19 Minutes | 34 (14.8%) | 49 (18.8%) |
| 20 to 24 Minutes | 54 (23.6%) | 44 (16.9%) |
| 25 to 29 Minutes | 22 (9.6%) | 43 (16.5%) |
| 30 to 34 Minutes | 47 (20.5%) | 33 (12.6%) |
| 35 to 39 Minutes | 5 (2.2%) | 3 (1.1%) |
| 40 to 44 Minutes | 3 (1.3%) | 4 (1.5%) |
| 45 to 59 Minutes | 9 (3.9%) | 2 (0.8%) |
| 60 to 89 Minutes | 5 (2.2%) | 13 (5.0%) |
| 90 or more Minutes | 4 (1.8%) | 0 (0.0%) |
Time of Departure to Work by Sex in Macon
The most frequent times of departure to work in Macon are 6:00 AM to 6:29 AM (54, 23.6%) for males and 6:30 AM to 6:59 AM (54, 20.7%) for females.
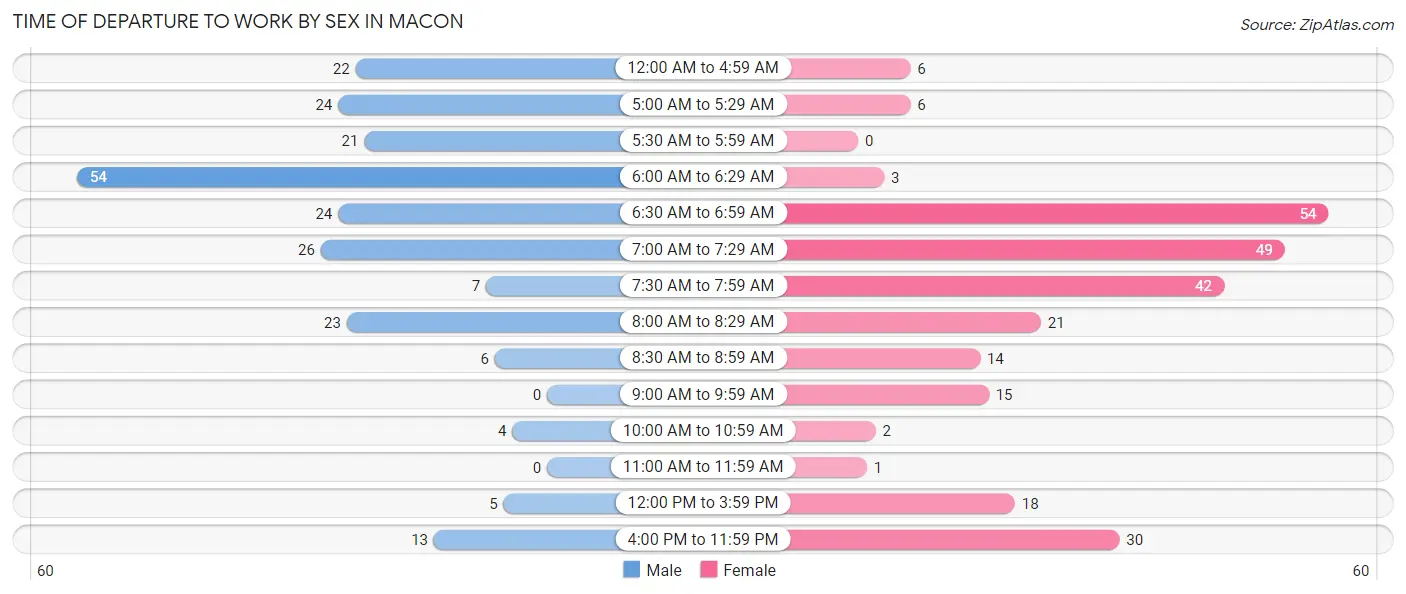
| Time of Departure | Male | Female |
| 12:00 AM to 4:59 AM | 22 (9.6%) | 6 (2.3%) |
| 5:00 AM to 5:29 AM | 24 (10.5%) | 6 (2.3%) |
| 5:30 AM to 5:59 AM | 21 (9.2%) | 0 (0.0%) |
| 6:00 AM to 6:29 AM | 54 (23.6%) | 3 (1.1%) |
| 6:30 AM to 6:59 AM | 24 (10.5%) | 54 (20.7%) |
| 7:00 AM to 7:29 AM | 26 (11.4%) | 49 (18.8%) |
| 7:30 AM to 7:59 AM | 7 (3.1%) | 42 (16.1%) |
| 8:00 AM to 8:29 AM | 23 (10.0%) | 21 (8.1%) |
| 8:30 AM to 8:59 AM | 6 (2.6%) | 14 (5.4%) |
| 9:00 AM to 9:59 AM | 0 (0.0%) | 15 (5.8%) |
| 10:00 AM to 10:59 AM | 4 (1.8%) | 2 (0.8%) |
| 11:00 AM to 11:59 AM | 0 (0.0%) | 1 (0.4%) |
| 12:00 PM to 3:59 PM | 5 (2.2%) | 18 (6.9%) |
| 4:00 PM to 11:59 PM | 13 (5.7%) | 30 (11.5%) |
| Total | 229 (100.0%) | 261 (100.0%) |
Housing Occupancy in Macon
Occupancy by Ownership in Macon
Of the total 482 dwellings in Macon, owner-occupied units account for 381 (79.0%), while renter-occupied units make up 101 (20.9%).
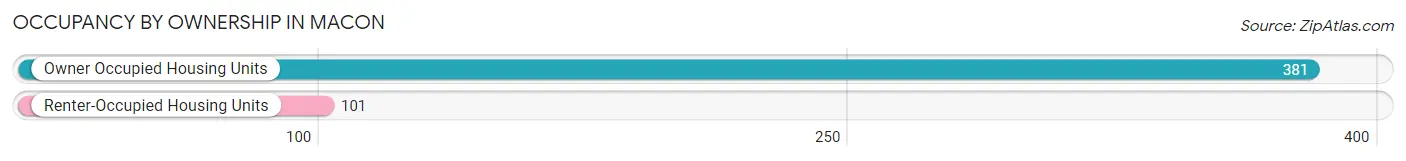
| Occupancy | # Housing Units | % Housing Units |
| Owner Occupied Housing Units | 381 | 79.0% |
| Renter-Occupied Housing Units | 101 | 20.9% |
| Total Occupied Housing Units | 482 | 100.0% |
Occupancy by Household Size in Macon
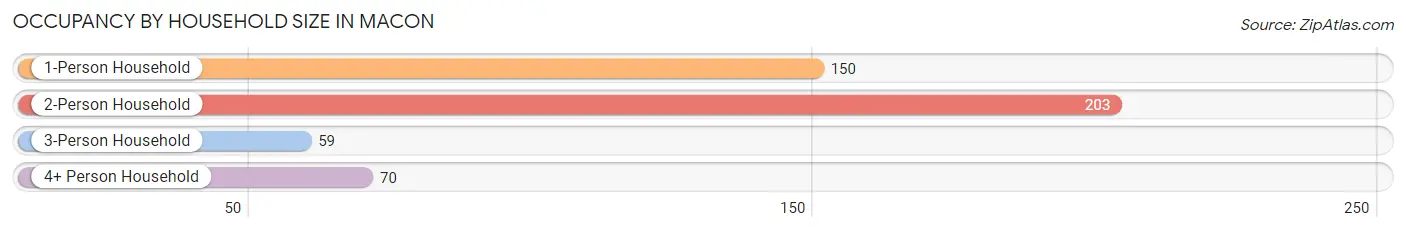
| Household Size | # Housing Units | % Housing Units |
| 1-Person Household | 150 | 31.1% |
| 2-Person Household | 203 | 42.1% |
| 3-Person Household | 59 | 12.2% |
| 4+ Person Household | 70 | 14.5% |
| Total Housing Units | 482 | 100.0% |
Occupancy by Ownership by Household Size in Macon
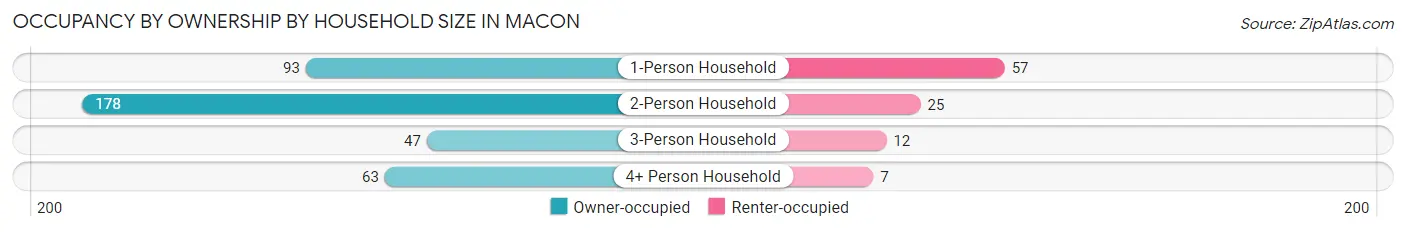
| Household Size | Owner-occupied | Renter-occupied |
| 1-Person Household | 93 (62.0%) | 57 (38.0%) |
| 2-Person Household | 178 (87.7%) | 25 (12.3%) |
| 3-Person Household | 47 (79.7%) | 12 (20.3%) |
| 4+ Person Household | 63 (90.0%) | 7 (10.0%) |
| Total Housing Units | 381 (79.0%) | 101 (20.9%) |
Occupancy by Educational Attainment in Macon
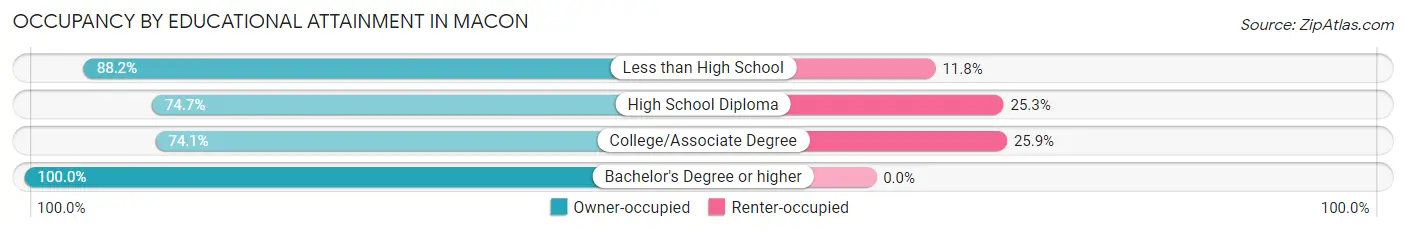
| Household Size | Owner-occupied | Renter-occupied |
| Less than High School | 30 (88.2%) | 4 (11.8%) |
| High School Diploma | 142 (74.7%) | 48 (25.3%) |
| College/Associate Degree | 140 (74.1%) | 49 (25.9%) |
| Bachelor's Degree or higher | 69 (100.0%) | 0 (0.0%) |
Occupancy by Age of Householder in Macon
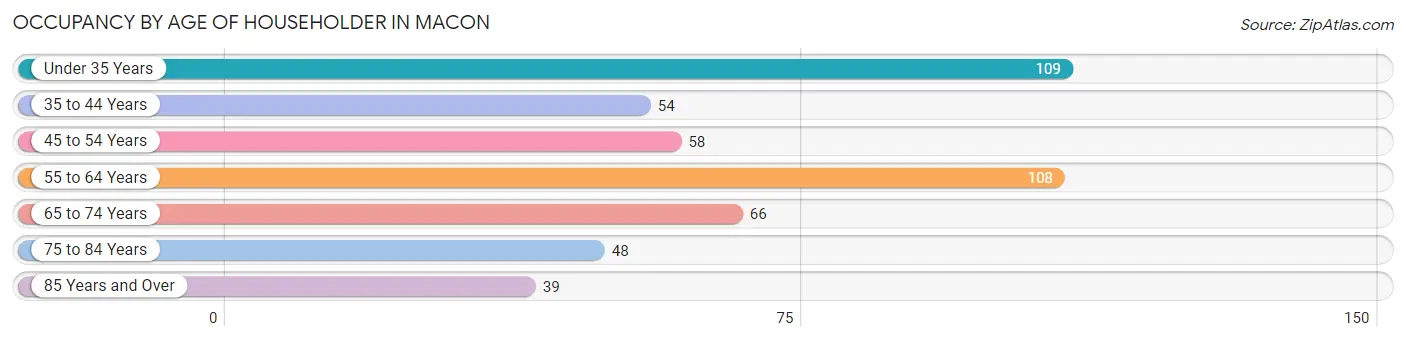
| Age Bracket | # Households | % Households |
| Under 35 Years | 109 | 22.6% |
| 35 to 44 Years | 54 | 11.2% |
| 45 to 54 Years | 58 | 12.0% |
| 55 to 64 Years | 108 | 22.4% |
| 65 to 74 Years | 66 | 13.7% |
| 75 to 84 Years | 48 | 10.0% |
| 85 Years and Over | 39 | 8.1% |
| Total | 482 | 100.0% |
Housing Finances in Macon
Median Income by Occupancy in Macon
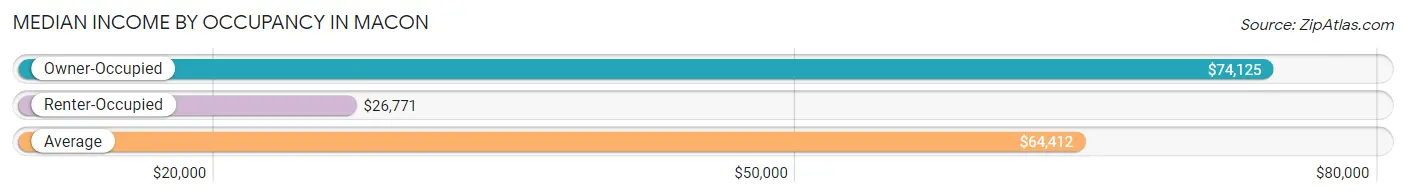
| Occupancy Type | # Households | Median Income |
| Owner-Occupied | 381 (79.0%) | $74,125 |
| Renter-Occupied | 101 (20.9%) | $26,771 |
| Average | 482 (100.0%) | $64,412 |
Occupancy by Householder Income Bracket in Macon
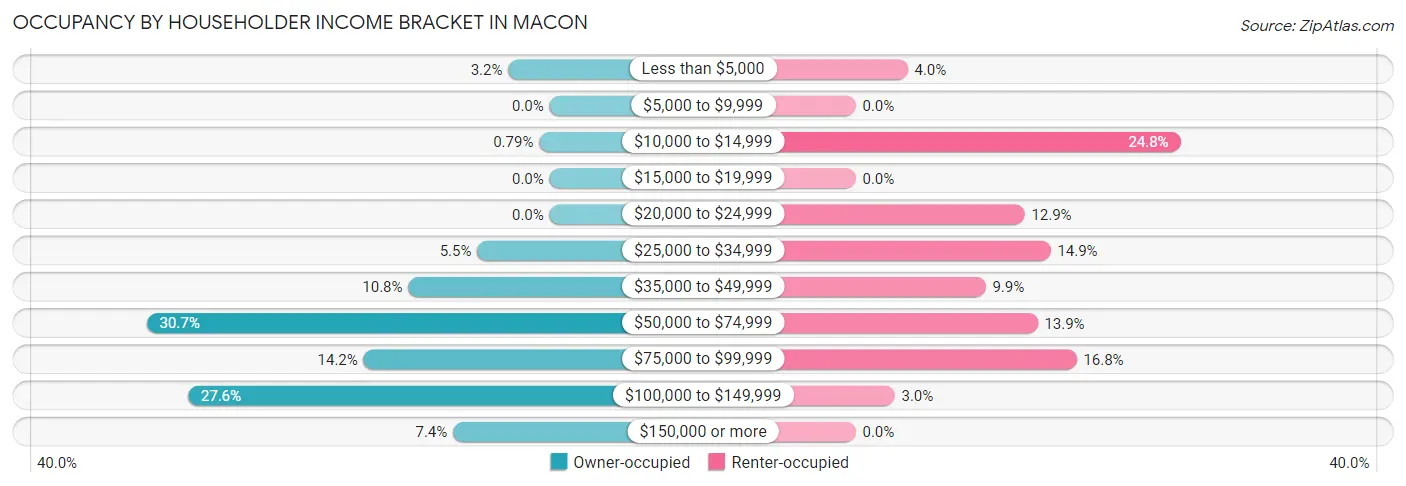
| Income Bracket | Owner-occupied | Renter-occupied |
| Less than $5,000 | 12 (3.2%) | 4 (4.0%) |
| $5,000 to $9,999 | 0 (0.0%) | 0 (0.0%) |
| $10,000 to $14,999 | 3 (0.8%) | 25 (24.7%) |
| $15,000 to $19,999 | 0 (0.0%) | 0 (0.0%) |
| $20,000 to $24,999 | 0 (0.0%) | 13 (12.9%) |
| $25,000 to $34,999 | 21 (5.5%) | 15 (14.8%) |
| $35,000 to $49,999 | 41 (10.8%) | 10 (9.9%) |
| $50,000 to $74,999 | 117 (30.7%) | 14 (13.9%) |
| $75,000 to $99,999 | 54 (14.2%) | 17 (16.8%) |
| $100,000 to $149,999 | 105 (27.6%) | 3 (3.0%) |
| $150,000 or more | 28 (7.3%) | 0 (0.0%) |
| Total | 381 (100.0%) | 101 (100.0%) |
Monthly Housing Cost Tiers in Macon
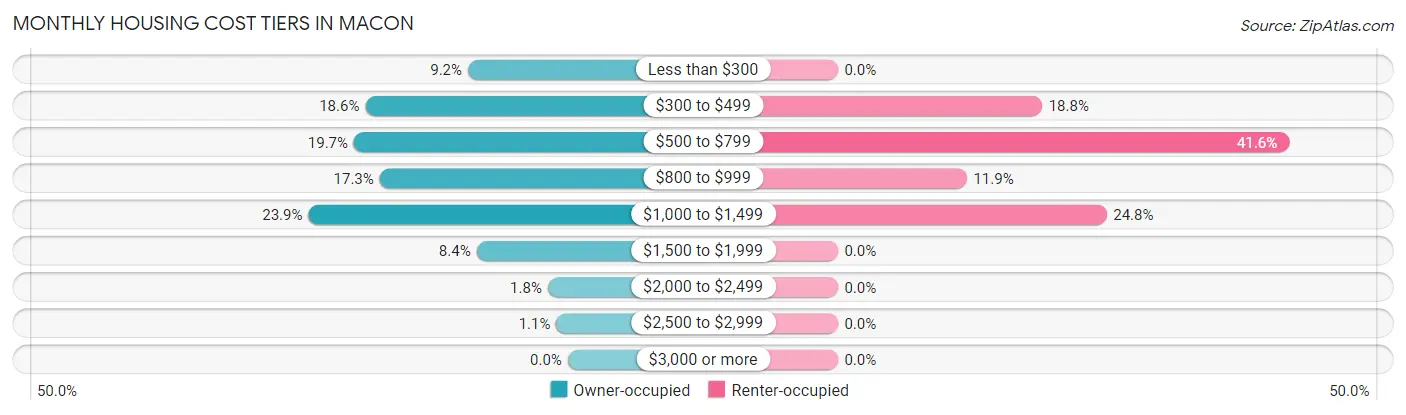
| Monthly Cost | Owner-occupied | Renter-occupied |
| Less than $300 | 35 (9.2%) | 0 (0.0%) |
| $300 to $499 | 71 (18.6%) | 19 (18.8%) |
| $500 to $799 | 75 (19.7%) | 42 (41.6%) |
| $800 to $999 | 66 (17.3%) | 12 (11.9%) |
| $1,000 to $1,499 | 91 (23.9%) | 25 (24.7%) |
| $1,500 to $1,999 | 32 (8.4%) | 0 (0.0%) |
| $2,000 to $2,499 | 7 (1.8%) | 0 (0.0%) |
| $2,500 to $2,999 | 4 (1.1%) | 0 (0.0%) |
| $3,000 or more | 0 (0.0%) | 0 (0.0%) |
| Total | 381 (100.0%) | 101 (100.0%) |
Physical Housing Characteristics in Macon
Housing Structures in Macon
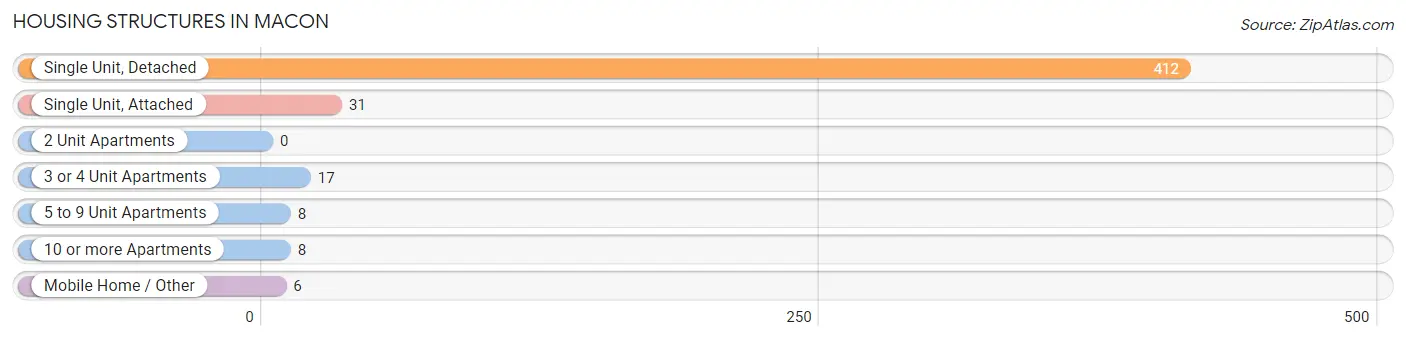
| Structure Type | # Housing Units | % Housing Units |
| Single Unit, Detached | 412 | 85.5% |
| Single Unit, Attached | 31 | 6.4% |
| 2 Unit Apartments | 0 | 0.0% |
| 3 or 4 Unit Apartments | 17 | 3.5% |
| 5 to 9 Unit Apartments | 8 | 1.7% |
| 10 or more Apartments | 8 | 1.7% |
| Mobile Home / Other | 6 | 1.2% |
| Total | 482 | 100.0% |
Housing Structures by Occupancy in Macon
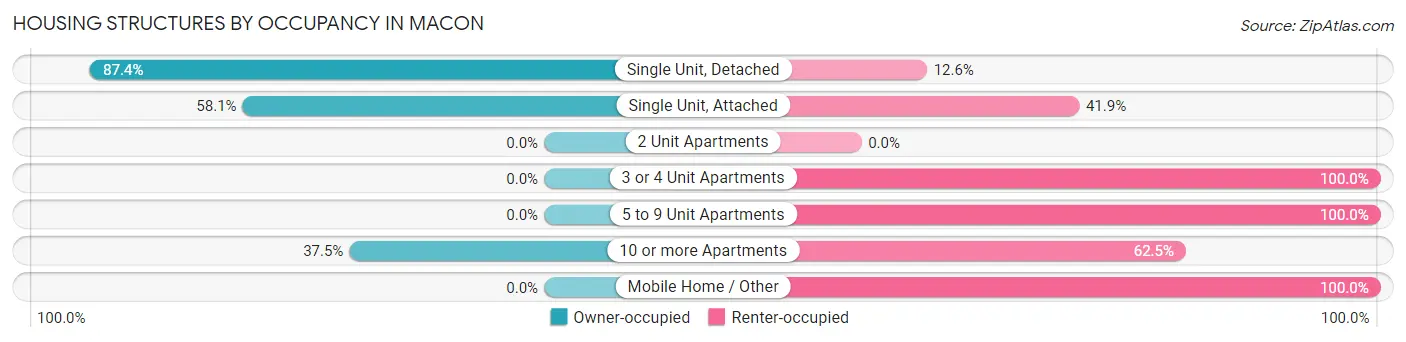
| Structure Type | Owner-occupied | Renter-occupied |
| Single Unit, Detached | 360 (87.4%) | 52 (12.6%) |
| Single Unit, Attached | 18 (58.1%) | 13 (41.9%) |
| 2 Unit Apartments | 0 (0.0%) | 0 (0.0%) |
| 3 or 4 Unit Apartments | 0 (0.0%) | 17 (100.0%) |
| 5 to 9 Unit Apartments | 0 (0.0%) | 8 (100.0%) |
| 10 or more Apartments | 3 (37.5%) | 5 (62.5%) |
| Mobile Home / Other | 0 (0.0%) | 6 (100.0%) |
| Total | 381 (79.0%) | 101 (20.9%) |
Housing Structures by Number of Rooms in Macon
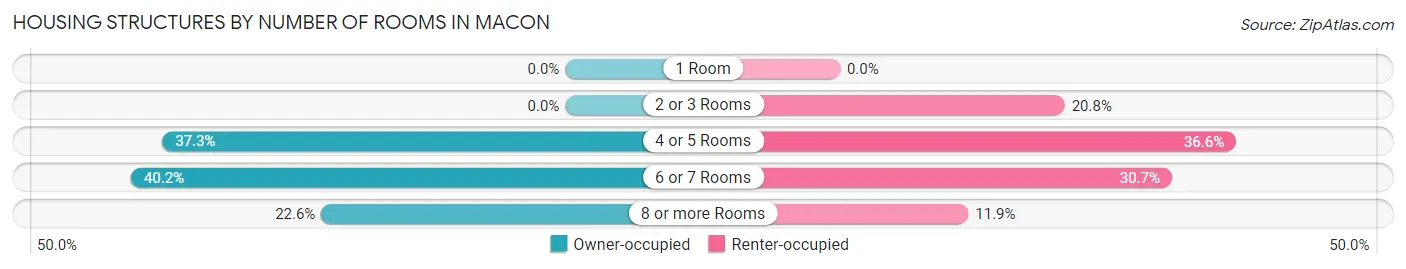
| Number of Rooms | Owner-occupied | Renter-occupied |
| 1 Room | 0 (0.0%) | 0 (0.0%) |
| 2 or 3 Rooms | 0 (0.0%) | 21 (20.8%) |
| 4 or 5 Rooms | 142 (37.3%) | 37 (36.6%) |
| 6 or 7 Rooms | 153 (40.2%) | 31 (30.7%) |
| 8 or more Rooms | 86 (22.6%) | 12 (11.9%) |
| Total | 381 (100.0%) | 101 (100.0%) |
Housing Structure by Heating Type in Macon
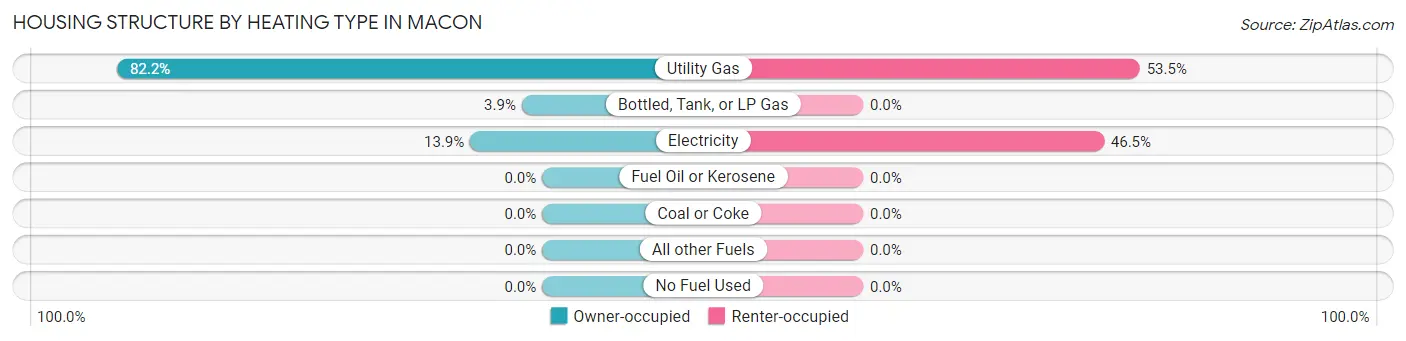
| Heating Type | Owner-occupied | Renter-occupied |
| Utility Gas | 313 (82.2%) | 54 (53.5%) |
| Bottled, Tank, or LP Gas | 15 (3.9%) | 0 (0.0%) |
| Electricity | 53 (13.9%) | 47 (46.5%) |
| Fuel Oil or Kerosene | 0 (0.0%) | 0 (0.0%) |
| Coal or Coke | 0 (0.0%) | 0 (0.0%) |
| All other Fuels | 0 (0.0%) | 0 (0.0%) |
| No Fuel Used | 0 (0.0%) | 0 (0.0%) |
| Total | 381 (100.0%) | 101 (100.0%) |
Household Vehicle Usage in Macon
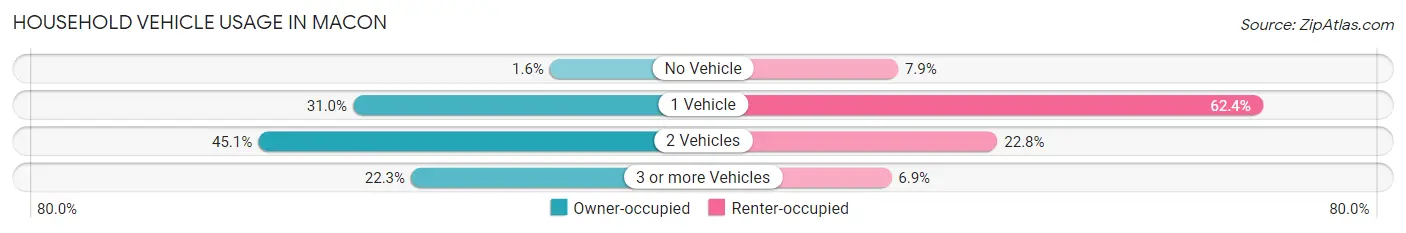
| Vehicles per Household | Owner-occupied | Renter-occupied |
| No Vehicle | 6 (1.6%) | 8 (7.9%) |
| 1 Vehicle | 118 (31.0%) | 63 (62.4%) |
| 2 Vehicles | 172 (45.1%) | 23 (22.8%) |
| 3 or more Vehicles | 85 (22.3%) | 7 (6.9%) |
| Total | 381 (100.0%) | 101 (100.0%) |
Real Estate & Mortgages in Macon
Real Estate and Mortgage Overview in Macon
| Characteristic | Without Mortgage | With Mortgage |
| Housing Units | 153 | 228 |
| Median Property Value | $109,100 | $110,300 |
| Median Household Income | $60,188 | $25 |
| Monthly Housing Costs | $391 | $0 |
| Real Estate Taxes | $1,780 | $5 |
Property Value by Mortgage Status in Macon
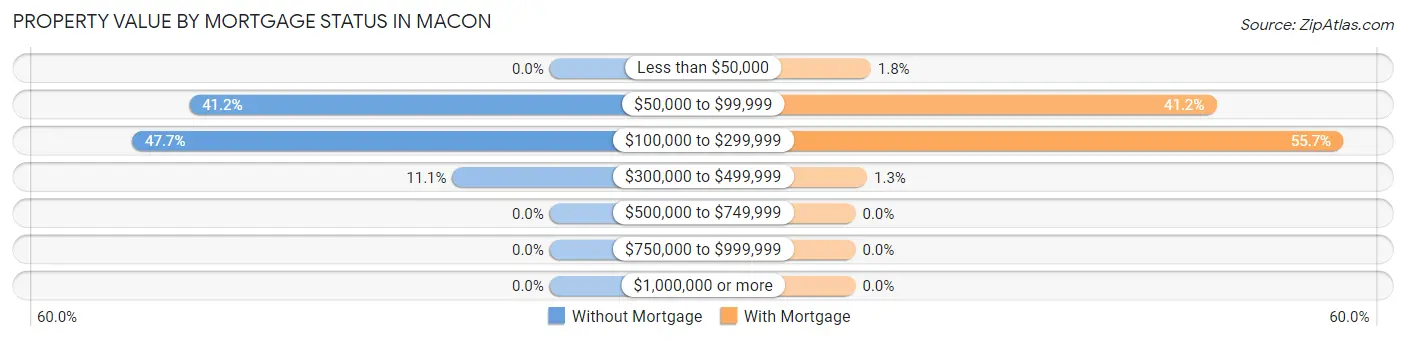
| Property Value | Without Mortgage | With Mortgage |
| Less than $50,000 | 0 (0.0%) | 4 (1.8%) |
| $50,000 to $99,999 | 63 (41.2%) | 94 (41.2%) |
| $100,000 to $299,999 | 73 (47.7%) | 127 (55.7%) |
| $300,000 to $499,999 | 17 (11.1%) | 3 (1.3%) |
| $500,000 to $749,999 | 0 (0.0%) | 0 (0.0%) |
| $750,000 to $999,999 | 0 (0.0%) | 0 (0.0%) |
| $1,000,000 or more | 0 (0.0%) | 0 (0.0%) |
| Total | 153 (100.0%) | 228 (100.0%) |
Household Income by Mortgage Status in Macon
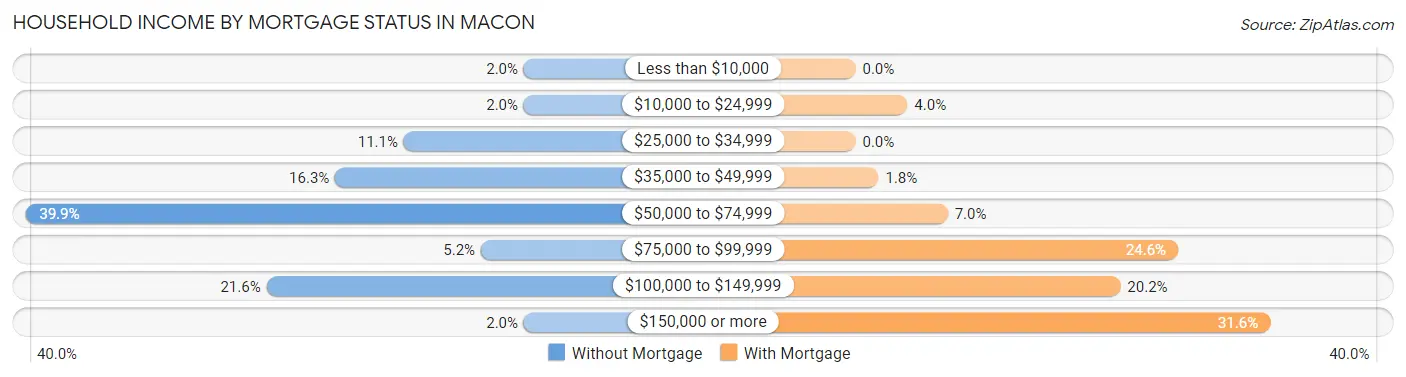
| Household Income | Without Mortgage | With Mortgage |
| Less than $10,000 | 3 (2.0%) | 0 (0.0%) |
| $10,000 to $24,999 | 3 (2.0%) | 9 (4.0%) |
| $25,000 to $34,999 | 17 (11.1%) | 0 (0.0%) |
| $35,000 to $49,999 | 25 (16.3%) | 4 (1.8%) |
| $50,000 to $74,999 | 61 (39.9%) | 16 (7.0%) |
| $75,000 to $99,999 | 8 (5.2%) | 56 (24.6%) |
| $100,000 to $149,999 | 33 (21.6%) | 46 (20.2%) |
| $150,000 or more | 3 (2.0%) | 72 (31.6%) |
| Total | 153 (100.0%) | 228 (100.0%) |
Property Value to Household Income Ratio in Macon
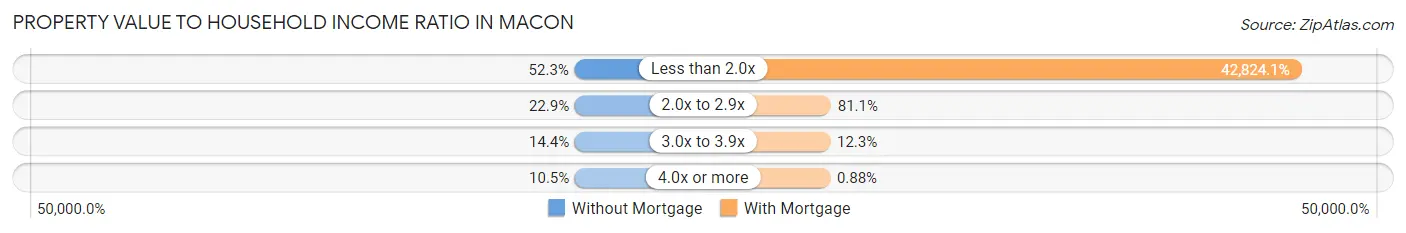
| Value-to-Income Ratio | Without Mortgage | With Mortgage |
| Less than 2.0x | 80 (52.3%) | 97,639 (42,824.1%) |
| 2.0x to 2.9x | 35 (22.9%) | 185 (81.1%) |
| 3.0x to 3.9x | 22 (14.4%) | 28 (12.3%) |
| 4.0x or more | 16 (10.5%) | 2 (0.9%) |
| Total | 153 (100.0%) | 228 (100.0%) |
Real Estate Taxes by Mortgage Status in Macon
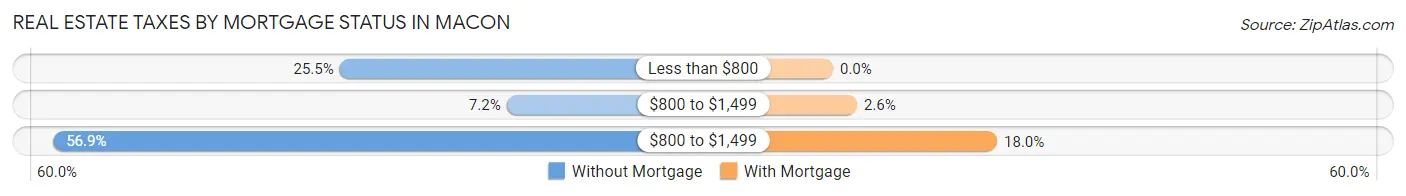
| Property Taxes | Without Mortgage | With Mortgage |
| Less than $800 | 39 (25.5%) | 0 (0.0%) |
| $800 to $1,499 | 11 (7.2%) | 6 (2.6%) |
| $800 to $1,499 | 87 (56.9%) | 41 (18.0%) |
| Total | 153 (100.0%) | 228 (100.0%) |
Health & Disability in Macon
Health Insurance Coverage by Age in Macon
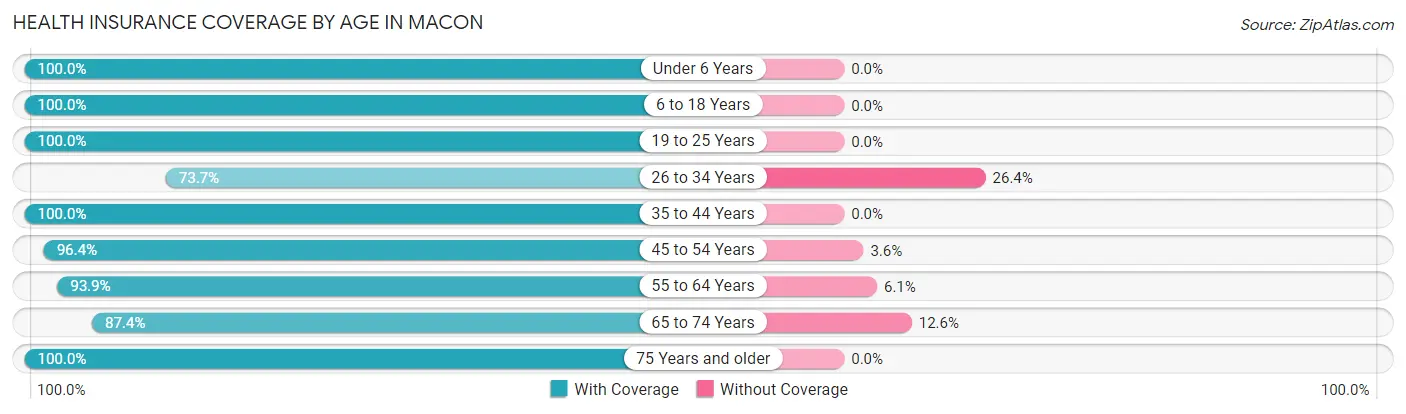
| Age Bracket | With Coverage | Without Coverage |
| Under 6 Years | 64 (100.0%) | 0 (0.0%) |
| 6 to 18 Years | 170 (100.0%) | 0 (0.0%) |
| 19 to 25 Years | 39 (100.0%) | 0 (0.0%) |
| 26 to 34 Years | 123 (73.7%) | 44 (26.4%) |
| 35 to 44 Years | 87 (100.0%) | 0 (0.0%) |
| 45 to 54 Years | 108 (96.4%) | 4 (3.6%) |
| 55 to 64 Years | 169 (93.9%) | 11 (6.1%) |
| 65 to 74 Years | 125 (87.4%) | 18 (12.6%) |
| 75 Years and older | 118 (100.0%) | 0 (0.0%) |
| Total | 1,003 (92.9%) | 77 (7.1%) |
Health Insurance Coverage by Citizenship Status in Macon
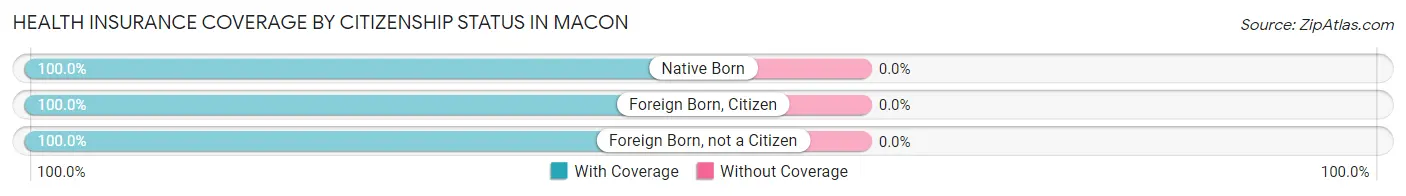
| Citizenship Status | With Coverage | Without Coverage |
| Native Born | 64 (100.0%) | 0 (0.0%) |
| Foreign Born, Citizen | 170 (100.0%) | 0 (0.0%) |
| Foreign Born, not a Citizen | 39 (100.0%) | 0 (0.0%) |
Health Insurance Coverage by Household Income in Macon
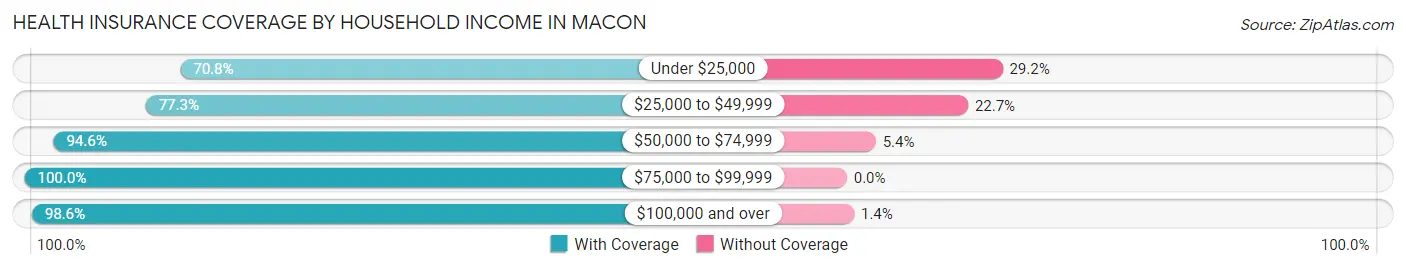
| Household Income | With Coverage | Without Coverage |
| Under $25,000 | 51 (70.8%) | 21 (29.2%) |
| $25,000 to $49,999 | 126 (77.3%) | 37 (22.7%) |
| $50,000 to $74,999 | 227 (94.6%) | 13 (5.4%) |
| $75,000 to $99,999 | 164 (100.0%) | 0 (0.0%) |
| $100,000 and over | 435 (98.6%) | 6 (1.4%) |
Public vs Private Health Insurance Coverage by Age in Macon
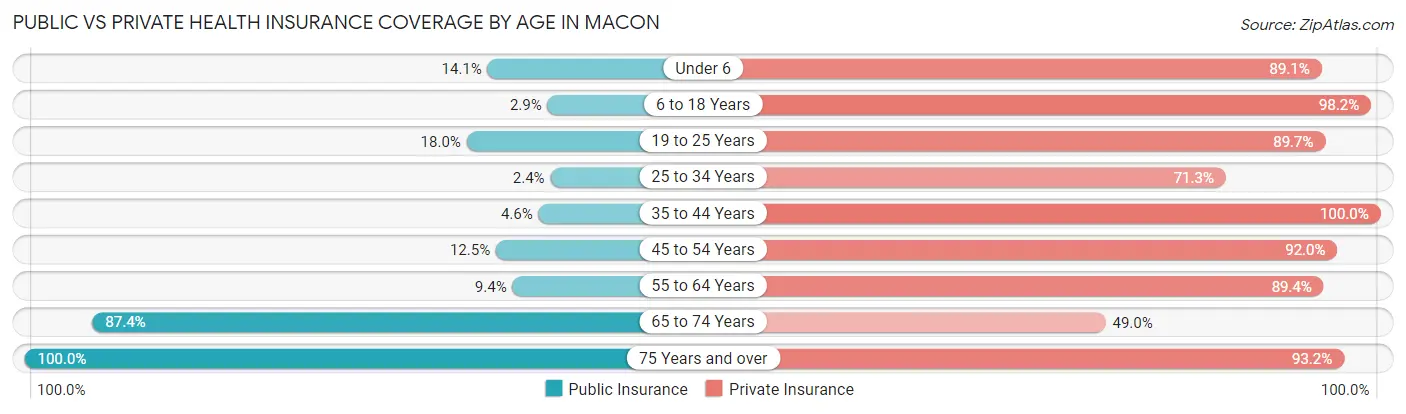
| Age Bracket | Public Insurance | Private Insurance |
| Under 6 | 9 (14.1%) | 57 (89.1%) |
| 6 to 18 Years | 5 (2.9%) | 167 (98.2%) |
| 19 to 25 Years | 7 (17.9%) | 35 (89.7%) |
| 25 to 34 Years | 4 (2.4%) | 119 (71.3%) |
| 35 to 44 Years | 4 (4.6%) | 87 (100.0%) |
| 45 to 54 Years | 14 (12.5%) | 103 (92.0%) |
| 55 to 64 Years | 17 (9.4%) | 161 (89.4%) |
| 65 to 74 Years | 125 (87.4%) | 70 (48.9%) |
| 75 Years and over | 118 (100.0%) | 110 (93.2%) |
| Total | 303 (28.1%) | 909 (84.2%) |
Disability Status by Sex by Age in Macon
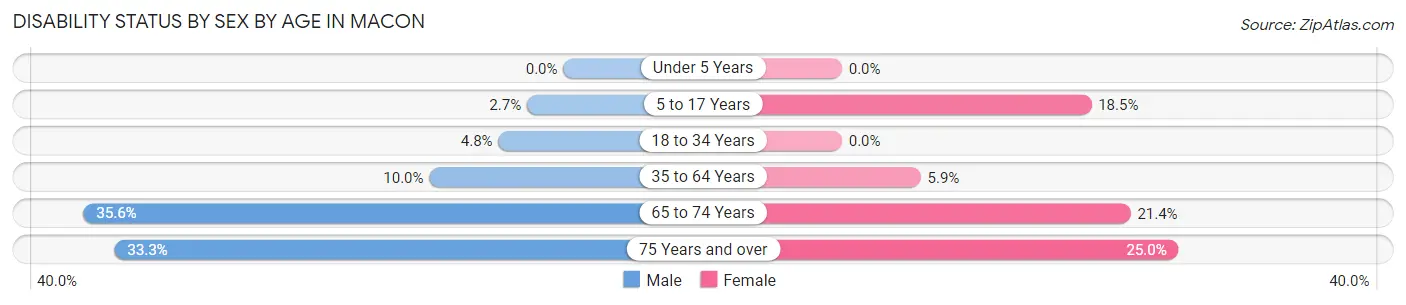
| Age Bracket | Male | Female |
| Under 5 Years | 0 (0.0%) | 0 (0.0%) |
| 5 to 17 Years | 3 (2.7%) | 10 (18.5%) |
| 18 to 34 Years | 4 (4.8%) | 0 (0.0%) |
| 35 to 64 Years | 19 (10.0%) | 11 (5.9%) |
| 65 to 74 Years | 31 (35.6%) | 12 (21.4%) |
| 75 Years and over | 14 (33.3%) | 19 (25.0%) |
Disability Class by Sex by Age in Macon
Disability Class: Hearing Difficulty
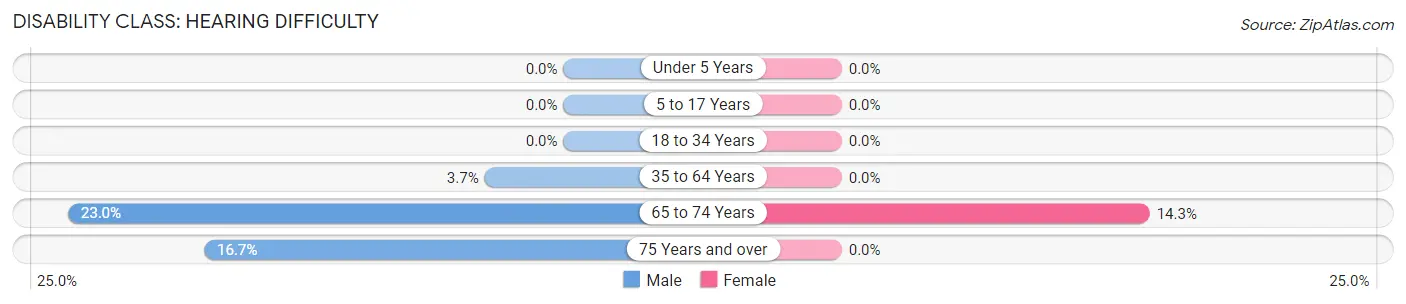
| Age Bracket | Male | Female |
| Under 5 Years | 0 (0.0%) | 0 (0.0%) |
| 5 to 17 Years | 0 (0.0%) | 0 (0.0%) |
| 18 to 34 Years | 0 (0.0%) | 0 (0.0%) |
| 35 to 64 Years | 7 (3.7%) | 0 (0.0%) |
| 65 to 74 Years | 20 (23.0%) | 8 (14.3%) |
| 75 Years and over | 7 (16.7%) | 0 (0.0%) |
Disability Class: Vision Difficulty
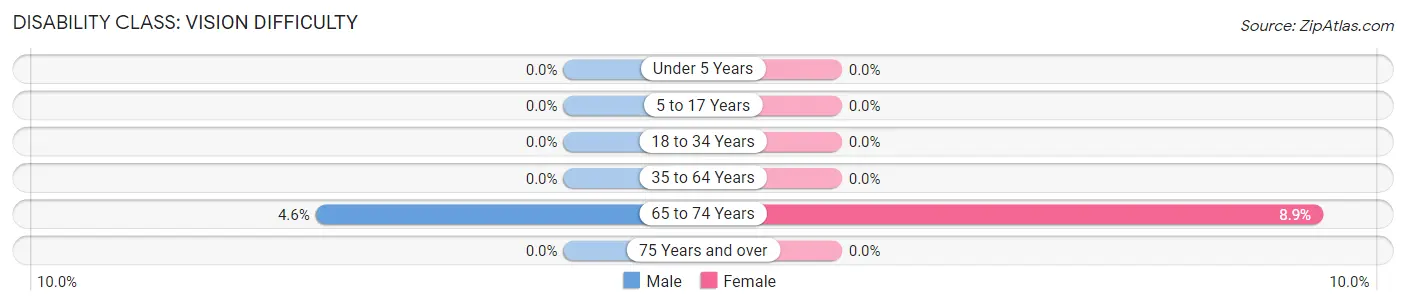
| Age Bracket | Male | Female |
| Under 5 Years | 0 (0.0%) | 0 (0.0%) |
| 5 to 17 Years | 0 (0.0%) | 0 (0.0%) |
| 18 to 34 Years | 0 (0.0%) | 0 (0.0%) |
| 35 to 64 Years | 0 (0.0%) | 0 (0.0%) |
| 65 to 74 Years | 4 (4.6%) | 5 (8.9%) |
| 75 Years and over | 0 (0.0%) | 0 (0.0%) |
Disability Class: Cognitive Difficulty
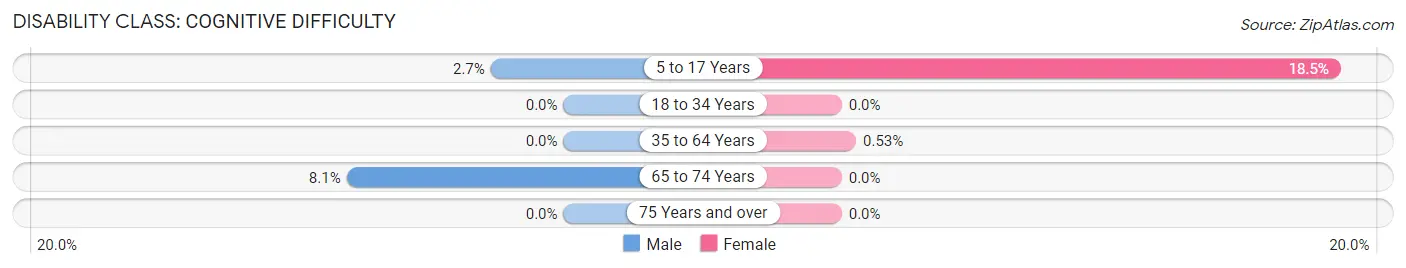
| Age Bracket | Male | Female |
| 5 to 17 Years | 3 (2.7%) | 10 (18.5%) |
| 18 to 34 Years | 0 (0.0%) | 0 (0.0%) |
| 35 to 64 Years | 0 (0.0%) | 1 (0.5%) |
| 65 to 74 Years | 7 (8.1%) | 0 (0.0%) |
| 75 Years and over | 0 (0.0%) | 0 (0.0%) |
Disability Class: Ambulatory Difficulty
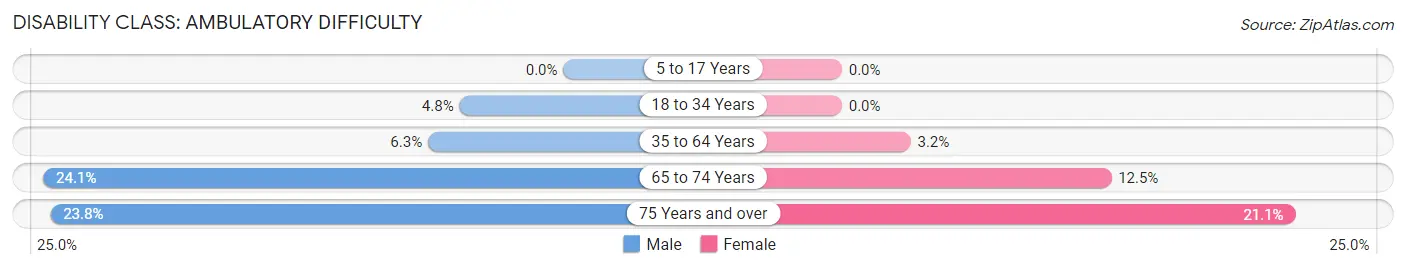
| Age Bracket | Male | Female |
| 5 to 17 Years | 0 (0.0%) | 0 (0.0%) |
| 18 to 34 Years | 4 (4.8%) | 0 (0.0%) |
| 35 to 64 Years | 12 (6.3%) | 6 (3.2%) |
| 65 to 74 Years | 21 (24.1%) | 7 (12.5%) |
| 75 Years and over | 10 (23.8%) | 16 (21.0%) |
Disability Class: Self-Care Difficulty
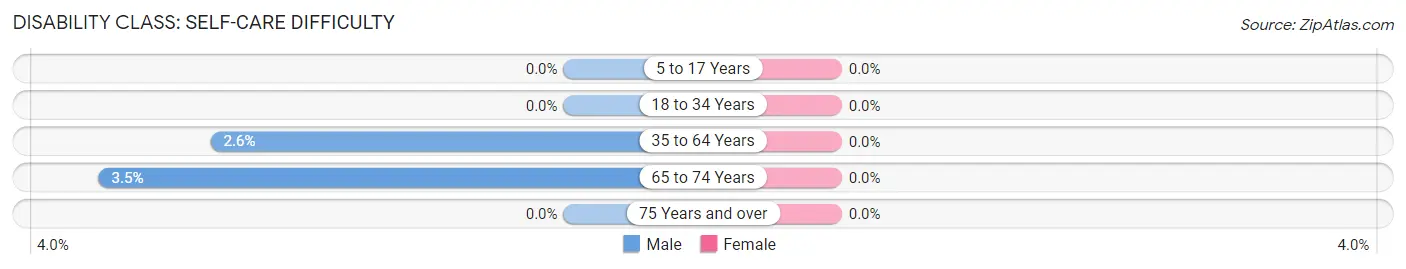
| Age Bracket | Male | Female |
| 5 to 17 Years | 0 (0.0%) | 0 (0.0%) |
| 18 to 34 Years | 0 (0.0%) | 0 (0.0%) |
| 35 to 64 Years | 5 (2.6%) | 0 (0.0%) |
| 65 to 74 Years | 3 (3.5%) | 0 (0.0%) |
| 75 Years and over | 0 (0.0%) | 0 (0.0%) |
Technology Access in Macon
Computing Device Access in Macon
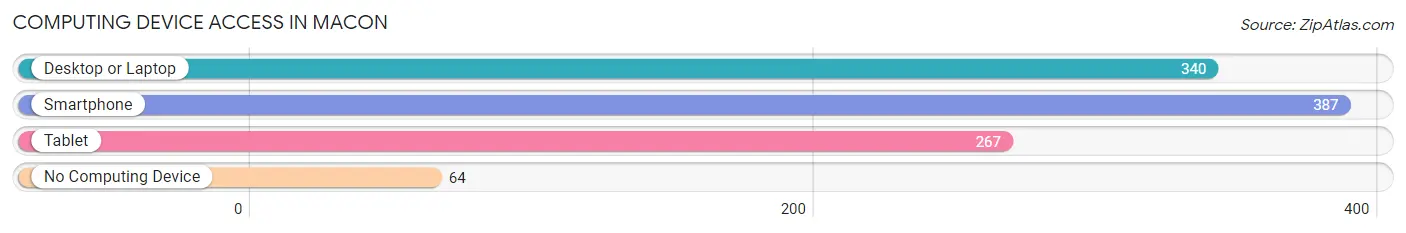
| Device Type | # Households | % Households |
| Desktop or Laptop | 340 | 70.5% |
| Smartphone | 387 | 80.3% |
| Tablet | 267 | 55.4% |
| No Computing Device | 64 | 13.3% |
| Total | 482 | 100.0% |
Internet Access in Macon
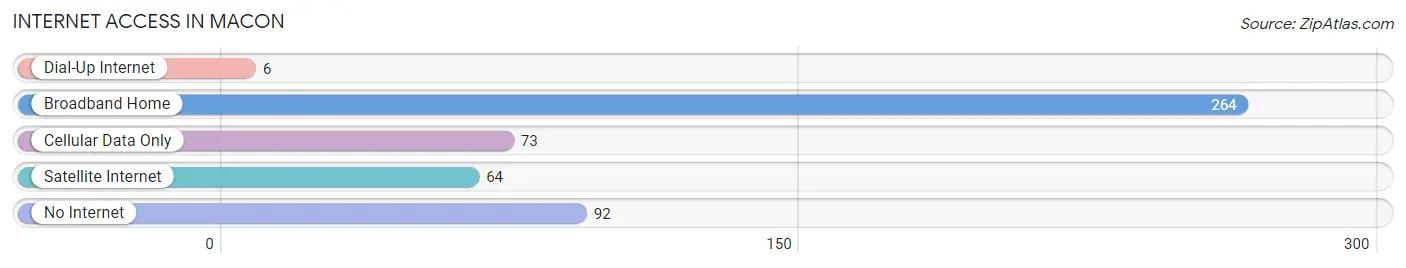
| Internet Type | # Households | % Households |
| Dial-Up Internet | 6 | 1.2% |
| Broadband Home | 264 | 54.8% |
| Cellular Data Only | 73 | 15.1% |
| Satellite Internet | 64 | 13.3% |
| No Internet | 92 | 19.1% |
| Total | 482 | 100.0% |
Macon Summary
Macon, Illinois is a city located in Macon County, in the central part of the state. It is the county seat and the largest city in the county. The city is located along the Sangamon River, and is part of the Decatur Metropolitan Statistical Area. As of the 2010 census, the city had a population of 47,471.
History
Macon was founded in 1829 by William S. Hamilton, a lawyer from Kentucky. He named the city after his hometown of Macon, Georgia. The city was incorporated in 1835, and the first mayor was elected in 1837.
In the early years, Macon was a small agricultural community, with a few small businesses. The city grew slowly until the arrival of the railroad in 1854. This brought new industry and jobs to the area, and the population began to grow rapidly.
By the late 19th century, Macon had become an important industrial center, with several factories producing a variety of products, including furniture, clothing, and agricultural equipment. The city also became a major transportation hub, with several railroads running through it.
In the early 20th century, Macon continued to grow and prosper. The city was home to several large companies, including the International Harvester Company, which had a large factory in the city. The city also had a thriving downtown area, with several department stores, theaters, and other businesses.
Geography
Macon is located in central Illinois, in Macon County. The city is situated along the Sangamon River, and is part of the Decatur Metropolitan Statistical Area. The city has a total area of 16.2 square miles, of which 16.1 square miles is land and 0.1 square miles is water.
The city is located in the Central Till Plains region of Illinois, and is characterized by flat terrain and fertile soil. The climate is humid continental, with hot, humid summers and cold, snowy winters.
Economy
Macon’s economy is largely based on manufacturing and agriculture. The city is home to several large companies, including the International Harvester Company, which has a large factory in the city. Other major employers include the Decatur Memorial Hospital, the Macon County School District, and the Macon County Sheriff’s Office.
The city also has a thriving retail sector, with several department stores, restaurants, and other businesses located in the downtown area. The city is also home to several colleges and universities, including Millikin University and Richland Community College.
Demographics
As of the 2010 census, the city had a population of 47,471. The racial makeup of the city was 79.2% White, 15.3% African American, 0.5% Native American, 1.2% Asian, 0.1% Pacific Islander, 1.7% from other races, and 2.1% from two or more races. Hispanic or Latino of any race were 4.2% of the population.
The median household income in the city was $41,945, and the median family income was $50,945. The per capita income in the city was $21,845. About 13.2% of the population was below the poverty line.
Common Questions
What is Per Capita Income in Macon?
Per Capita income in Macon is $34,272.
What is the Median Family Income in Macon?
Median Family Income in Macon is $76,579.
What is the Median Household income in Macon?
Median Household Income in Macon is $64,412.
What is Income or Wage Gap in Macon?
Income or Wage Gap in Macon is 41.1%.
Women in Macon earn 58.9 cents for every dollar earned by a man.
What is Inequality or Gini Index in Macon?
Inequality or Gini Index in Macon is 0.35.
What is the Total Population of Macon?
Total Population of Macon is 1,080.
What is the Total Male Population of Macon?
Total Male Population of Macon is 523.
What is the Total Female Population of Macon?
Total Female Population of Macon is 557.
What is the Ratio of Males per 100 Females in Macon?
There are 93.90 Males per 100 Females in Macon.
What is the Ratio of Females per 100 Males in Macon?
There are 106.50 Females per 100 Males in Macon.
What is the Median Population Age in Macon?
Median Population Age in Macon is 46.4 Years.
What is the Average Family Size in Macon
Average Family Size in Macon is 2.8 People.
What is the Average Household Size in Macon
Average Household Size in Macon is 2.2 People.
How Large is the Labor Force in Macon?
There are 536 People in the Labor Forcein in Macon.
What is the Percentage of People in the Labor Force in Macon?
60.3% of People are in the Labor Force in Macon.
What is the Unemployment Rate in Macon?
Unemployment Rate in Macon is 2.4%.