Kirkland, IL Map & Demographics
Kirkland Map
Kirkland Overview
$34,159
PER CAPITA INCOME
$85,658
AVG FAMILY INCOME
$86,950
AVG HOUSEHOLD INCOME
47.9%
WAGE / INCOME GAP [ % ]
52.1¢/ $1
WAGE / INCOME GAP [ $ ]
0.29
INEQUALITY / GINI INDEX
1,493
TOTAL POPULATION
776
MALE POPULATION
717
FEMALE POPULATION
108.23
MALES / 100 FEMALES
92.40
FEMALES / 100 MALES
34.8
MEDIAN AGE
3.1
AVG FAMILY SIZE
2.7
AVG HOUSEHOLD SIZE
825
LABOR FORCE [ PEOPLE ]
70.3%
PERCENT IN LABOR FORCE
4.4%
UNEMPLOYMENT RATE
Kirkland Zip Codes
Kirkland Area Codes
Income in Kirkland
Income Overview in Kirkland
Per Capita Income in Kirkland is $34,159, while median incomes of families and households are $85,658 and $86,950 respectively.
| Characteristic | Number | Measure |
| Per Capita Income | 1,493 | $34,159 |
| Median Family Income | 380 | $85,658 |
| Mean Family Income | 380 | $95,494 |
| Median Household Income | 555 | $86,950 |
| Mean Household Income | 555 | $92,674 |
| Income Deficit | 380 | $0 |
| Wage / Income Gap (%) | 1,493 | 47.89% |
| Wage / Income Gap ($) | 1,493 | 52.11¢ per $1 |
| Gini / Inequality Index | 1,493 | 0.29 |
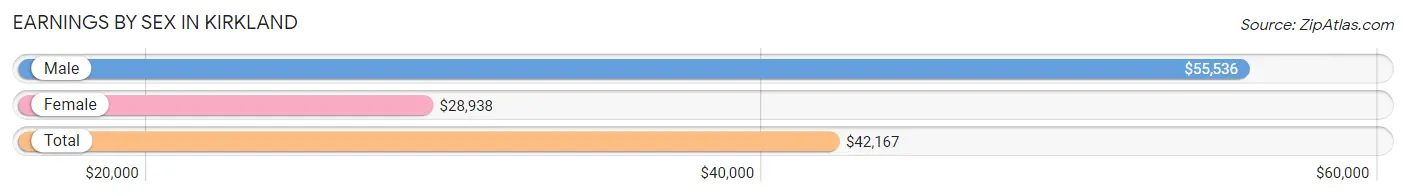
Earnings by Sex in Kirkland
Average Earnings in Kirkland are $42,167, $55,536 for men and $28,938 for women, a difference of 47.9%.
| Sex | Number | Average Earnings |
| Male | 503 (57.0%) | $55,536 |
| Female | 379 (43.0%) | $28,938 |
| Total | 882 (100.0%) | $42,167 |
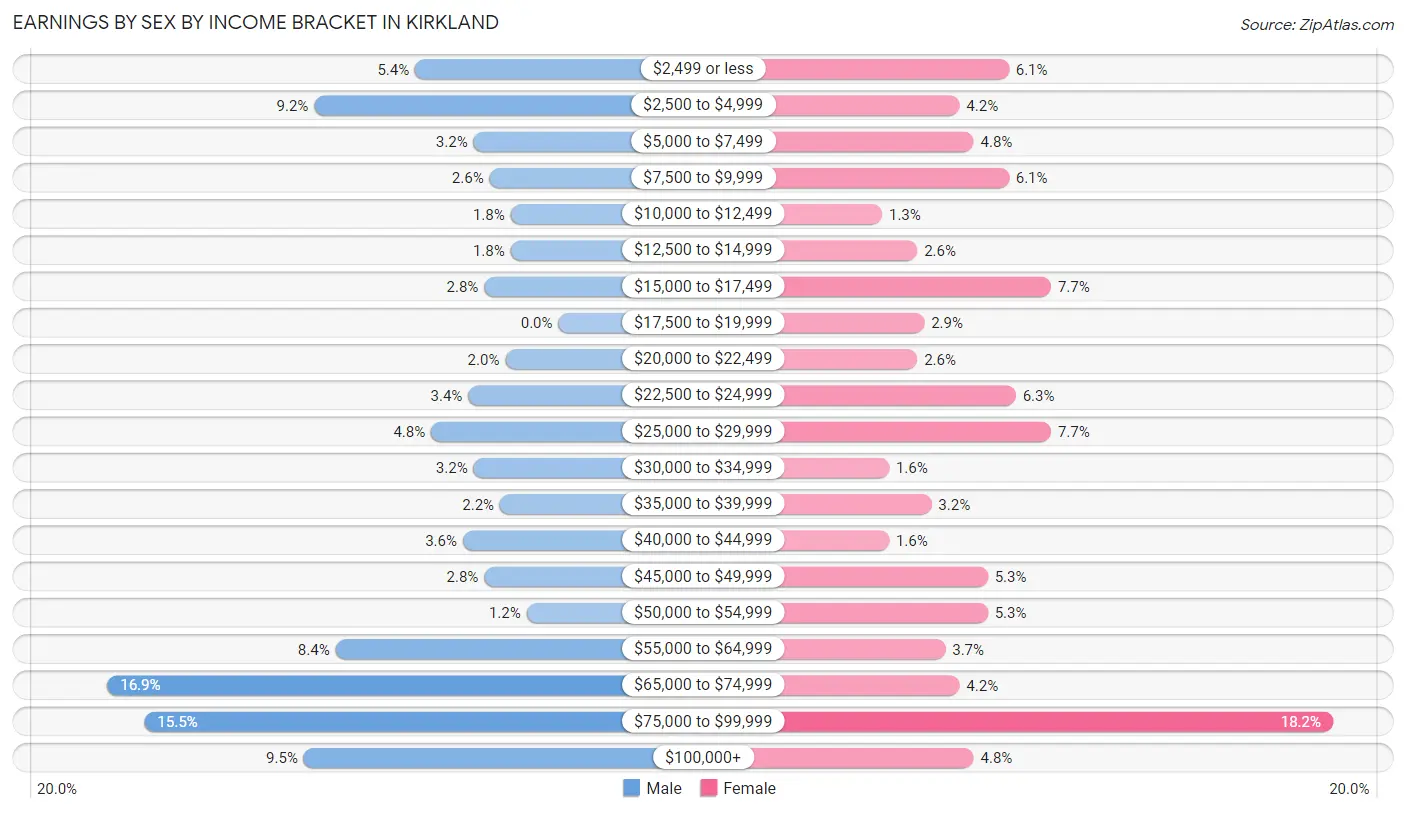
Earnings by Sex by Income Bracket in Kirkland
The most common earnings brackets in Kirkland are $65,000 to $74,999 for men (85 | 16.9%) and $75,000 to $99,999 for women (69 | 18.2%).
| Income | Male | Female |
| $2,499 or less | 27 (5.4%) | 23 (6.1%) |
| $2,500 to $4,999 | 46 (9.1%) | 16 (4.2%) |
| $5,000 to $7,499 | 16 (3.2%) | 18 (4.8%) |
| $7,500 to $9,999 | 13 (2.6%) | 23 (6.1%) |
| $10,000 to $12,499 | 9 (1.8%) | 5 (1.3%) |
| $12,500 to $14,999 | 9 (1.8%) | 10 (2.6%) |
| $15,000 to $17,499 | 14 (2.8%) | 29 (7.6%) |
| $17,500 to $19,999 | 0 (0.0%) | 11 (2.9%) |
| $20,000 to $22,499 | 10 (2.0%) | 10 (2.6%) |
| $22,500 to $24,999 | 17 (3.4%) | 24 (6.3%) |
| $25,000 to $29,999 | 24 (4.8%) | 29 (7.6%) |
| $30,000 to $34,999 | 16 (3.2%) | 6 (1.6%) |
| $35,000 to $39,999 | 11 (2.2%) | 12 (3.2%) |
| $40,000 to $44,999 | 18 (3.6%) | 6 (1.6%) |
| $45,000 to $49,999 | 14 (2.8%) | 20 (5.3%) |
| $50,000 to $54,999 | 6 (1.2%) | 20 (5.3%) |
| $55,000 to $64,999 | 42 (8.4%) | 14 (3.7%) |
| $65,000 to $74,999 | 85 (16.9%) | 16 (4.2%) |
| $75,000 to $99,999 | 78 (15.5%) | 69 (18.2%) |
| $100,000+ | 48 (9.5%) | 18 (4.8%) |
| Total | 503 (100.0%) | 379 (100.0%) |
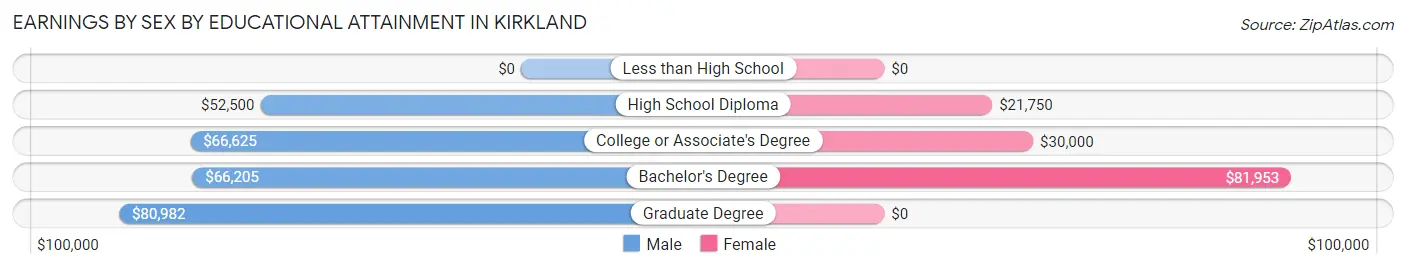
Earnings by Sex by Educational Attainment in Kirkland
Average earnings in Kirkland are $65,208 for men and $40,208 for women, a difference of 38.3%. Men with an educational attainment of graduate degree enjoy the highest average annual earnings of $80,982, while those with high school diploma education earn the least with $52,500. Women with an educational attainment of bachelor's degree earn the most with the average annual earnings of $81,953, while those with high school diploma education have the smallest earnings of $21,750.
| Educational Attainment | Male Income | Female Income |
| Less than High School | - | - |
| High School Diploma | $52,500 | $21,750 |
| College or Associate's Degree | $66,625 | $30,000 |
| Bachelor's Degree | $66,205 | $81,953 |
| Graduate Degree | $80,982 | $0 |
| Total | $65,208 | $40,208 |
Family Income in Kirkland
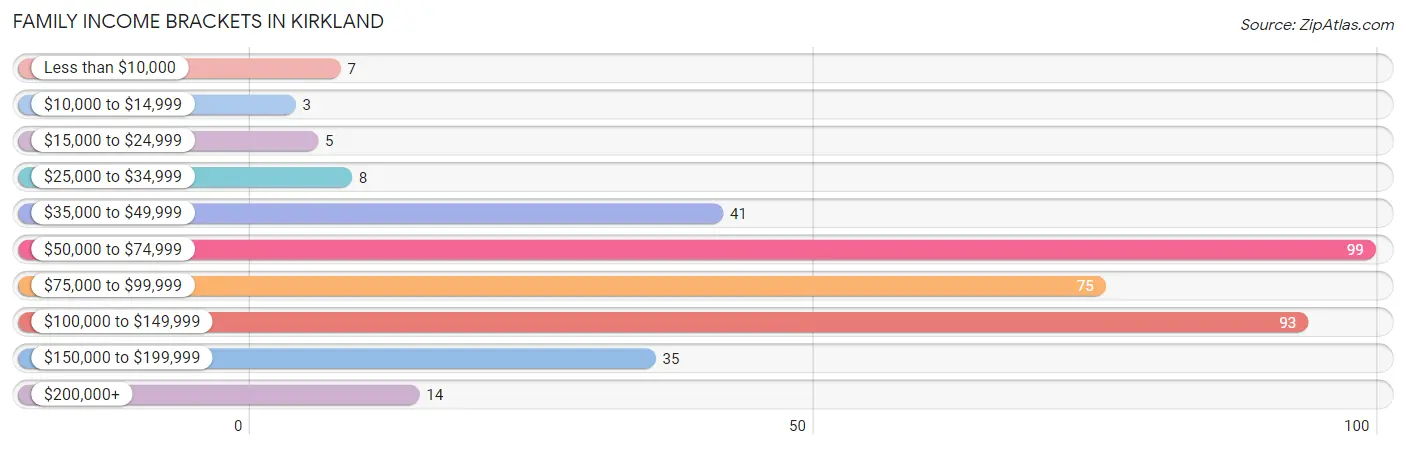
Family Income Brackets in Kirkland
According to the Kirkland family income data, there are 99 families falling into the $50,000 to $74,999 income range, which is the most common income bracket and makes up 26.1% of all families. Conversely, the $10,000 to $14,999 income bracket is the least frequent group with only 3 families (0.8%) belonging to this category.
| Income Bracket | # Families | % Families |
| Less than $10,000 | 7 | 1.8% |
| $10,000 to $14,999 | 3 | 0.8% |
| $15,000 to $24,999 | 5 | 1.3% |
| $25,000 to $34,999 | 8 | 2.1% |
| $35,000 to $49,999 | 41 | 10.8% |
| $50,000 to $74,999 | 99 | 26.1% |
| $75,000 to $99,999 | 75 | 19.7% |
| $100,000 to $149,999 | 93 | 24.5% |
| $150,000 to $199,999 | 35 | 9.2% |
| $200,000+ | 14 | 3.7% |
Family Income by Famaliy Size in Kirkland
6-person families (18 | 4.7%) account for the highest median family income in Kirkland with $140,625 per family, while 2-person families (180 | 47.4%) have the highest median income of $36,125 per family member.

| Income Bracket | # Families | Median Income |
| 2-Person Families | 180 (47.4%) | $72,250 |
| 3-Person Families | 76 (20.0%) | $89,722 |
| 4-Person Families | 84 (22.1%) | $81,429 |
| 5-Person Families | 22 (5.8%) | $78,750 |
| 6-Person Families | 18 (4.7%) | $140,625 |
| 7+ Person Families | 0 (0.0%) | $0 |
| Total | 380 (100.0%) | $85,658 |
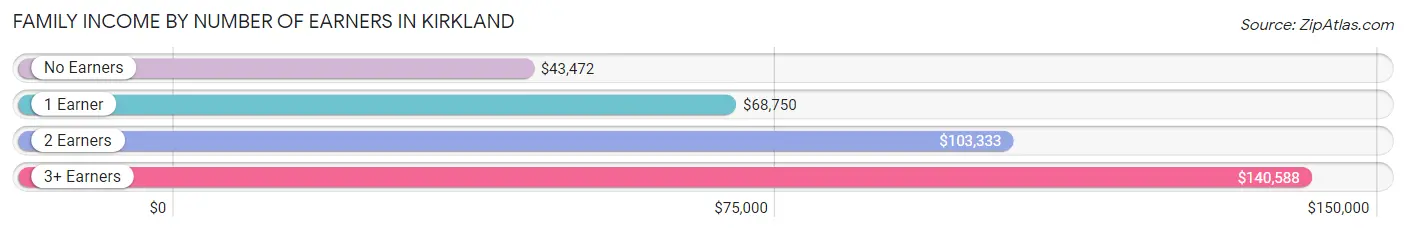
Family Income by Number of Earners in Kirkland
The median family income in Kirkland is $85,658, with families comprising 3+ earners (58) having the highest median family income of $140,588, while families with no earners (61) have the lowest median family income of $43,472, accounting for 15.3% and 16.1% of families, respectively.
| Number of Earners | # Families | Median Income |
| No Earners | 61 (16.1%) | $43,472 |
| 1 Earner | 105 (27.6%) | $68,750 |
| 2 Earners | 156 (41.0%) | $103,333 |
| 3+ Earners | 58 (15.3%) | $140,588 |
| Total | 380 (100.0%) | $85,658 |
Household Income in Kirkland
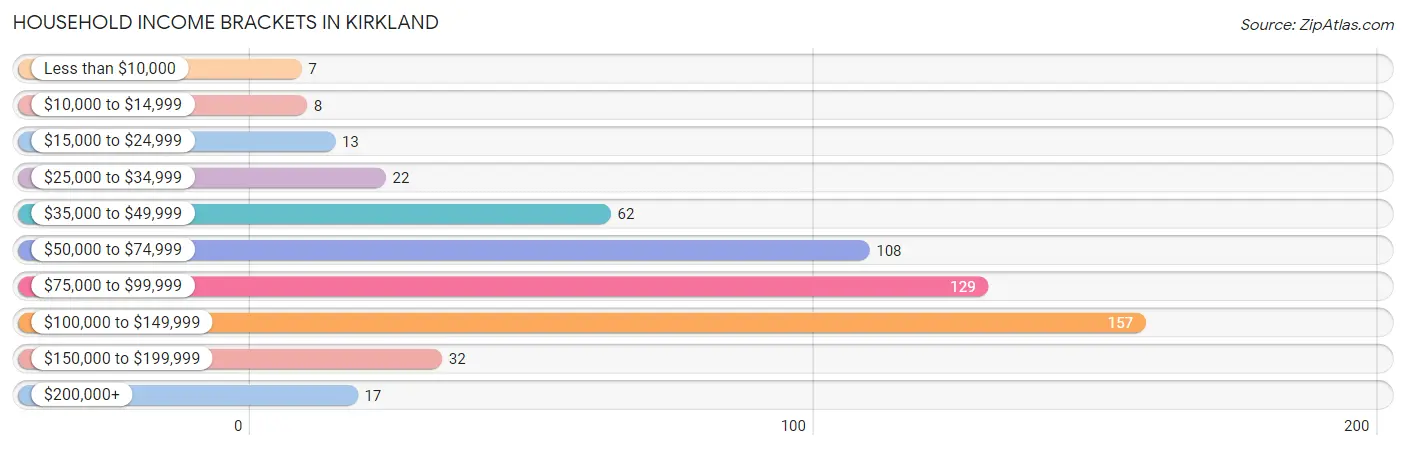
Household Income Brackets in Kirkland
With 157 households falling in the category, the $100,000 to $149,999 income range is the most frequent in Kirkland, accounting for 28.3% of all households. In contrast, only 7 households (1.3%) fall into the less than $10,000 income bracket, making it the least populous group.
| Income Bracket | # Households | % Households |
| Less than $10,000 | 7 | 1.3% |
| $10,000 to $14,999 | 8 | 1.4% |
| $15,000 to $24,999 | 13 | 2.3% |
| $25,000 to $34,999 | 22 | 4.0% |
| $35,000 to $49,999 | 62 | 11.2% |
| $50,000 to $74,999 | 108 | 19.5% |
| $75,000 to $99,999 | 129 | 23.2% |
| $100,000 to $149,999 | 157 | 28.3% |
| $150,000 to $199,999 | 32 | 5.8% |
| $200,000+ | 17 | 3.1% |
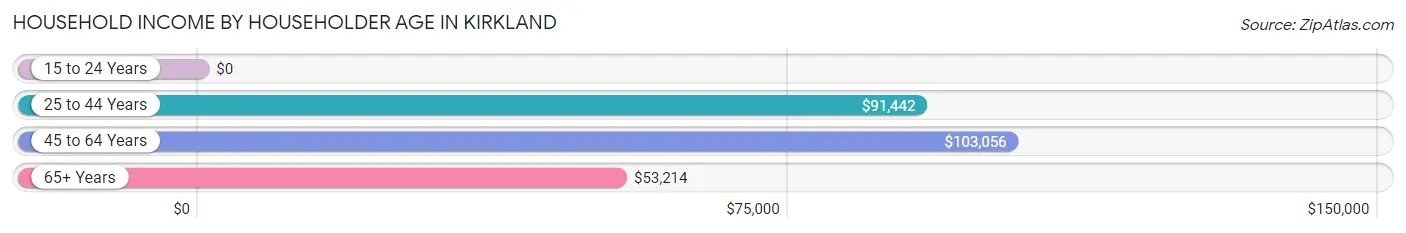
Household Income by Householder Age in Kirkland
The median household income in Kirkland is $86,950, with the highest median household income of $103,056 found in the 45 to 64 years age bracket for the primary householder. A total of 200 households (36.0%) fall into this category. Meanwhile, the 15 to 24 years age bracket for the primary householder has the lowest median household income of $0, with 5 households (0.9%) in this group.
| Income Bracket | # Households | Median Income |
| 15 to 24 Years | 5 (0.9%) | $0 |
| 25 to 44 Years | 200 (36.0%) | $91,442 |
| 45 to 64 Years | 200 (36.0%) | $103,056 |
| 65+ Years | 150 (27.0%) | $53,214 |
| Total | 555 (100.0%) | $86,950 |
Poverty in Kirkland
Income Below Poverty by Sex and Age in Kirkland
With 9.3% poverty level for males and 4.5% for females among the residents of Kirkland, 15 year old males and 25 to 34 year old females are the most vulnerable to poverty, with 7 males (63.6%) and 13 females (11.9%) in their respective age groups living below the poverty level.
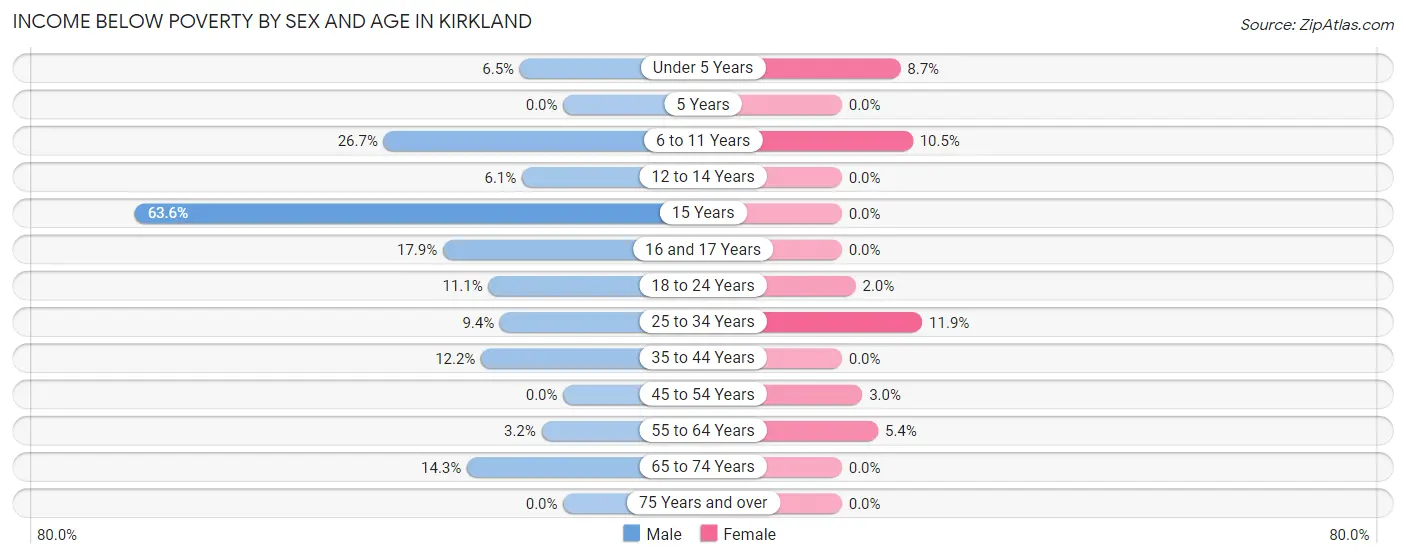
| Age Bracket | Male | Female |
| Under 5 Years | 2 (6.5%) | 4 (8.7%) |
| 5 Years | 0 (0.0%) | 0 (0.0%) |
| 6 to 11 Years | 8 (26.7%) | 6 (10.5%) |
| 12 to 14 Years | 3 (6.1%) | 0 (0.0%) |
| 15 Years | 7 (63.6%) | 0 (0.0%) |
| 16 and 17 Years | 5 (17.9%) | 0 (0.0%) |
| 18 to 24 Years | 10 (11.1%) | 1 (2.0%) |
| 25 to 34 Years | 14 (9.4%) | 13 (11.9%) |
| 35 to 44 Years | 10 (12.2%) | 0 (0.0%) |
| 45 to 54 Years | 0 (0.0%) | 3 (3.0%) |
| 55 to 64 Years | 2 (3.2%) | 5 (5.4%) |
| 65 to 74 Years | 11 (14.3%) | 0 (0.0%) |
| 75 Years and over | 0 (0.0%) | 0 (0.0%) |
| Total | 72 (9.3%) | 32 (4.5%) |
Income Above Poverty by Sex and Age in Kirkland
According to the poverty statistics in Kirkland, males aged 5 years and females aged 5 years are the age groups that are most secure financially, with 100.0% of males and 100.0% of females in these age groups living above the poverty line.
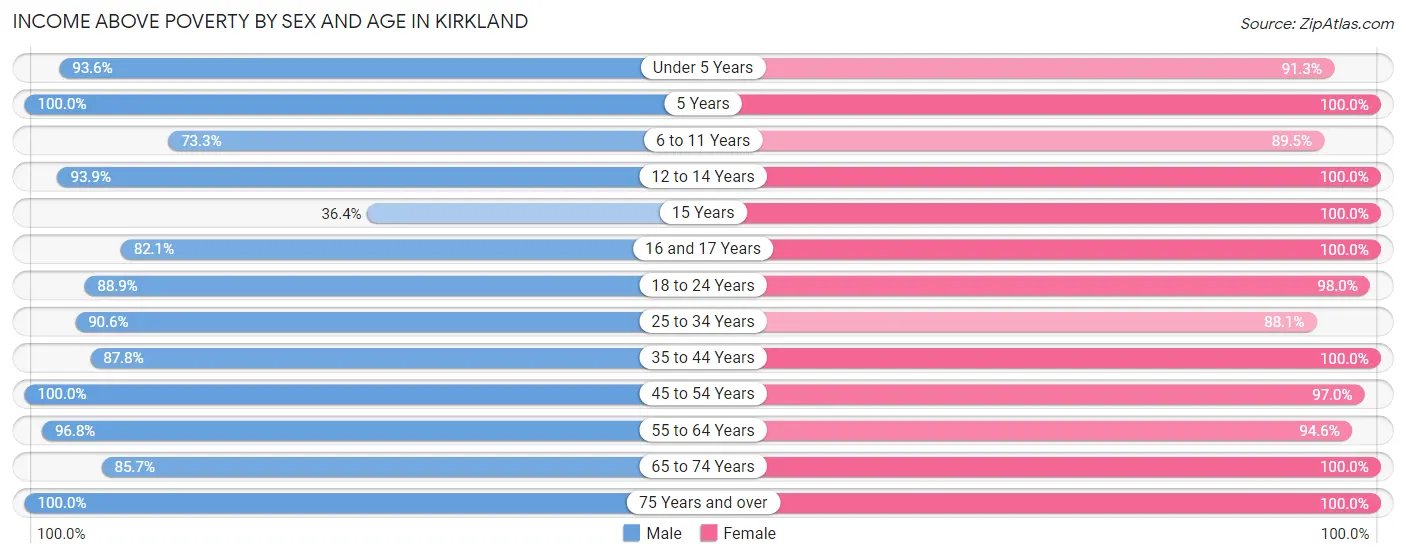
| Age Bracket | Male | Female |
| Under 5 Years | 29 (93.5%) | 42 (91.3%) |
| 5 Years | 2 (100.0%) | 17 (100.0%) |
| 6 to 11 Years | 22 (73.3%) | 51 (89.5%) |
| 12 to 14 Years | 46 (93.9%) | 53 (100.0%) |
| 15 Years | 4 (36.4%) | 13 (100.0%) |
| 16 and 17 Years | 23 (82.1%) | 13 (100.0%) |
| 18 to 24 Years | 80 (88.9%) | 48 (98.0%) |
| 25 to 34 Years | 135 (90.6%) | 96 (88.1%) |
| 35 to 44 Years | 72 (87.8%) | 62 (100.0%) |
| 45 to 54 Years | 109 (100.0%) | 96 (97.0%) |
| 55 to 64 Years | 60 (96.8%) | 88 (94.6%) |
| 65 to 74 Years | 66 (85.7%) | 81 (100.0%) |
| 75 Years and over | 51 (100.0%) | 20 (100.0%) |
| Total | 699 (90.7%) | 680 (95.5%) |
Income Below Poverty Among Married-Couple Families in Kirkland
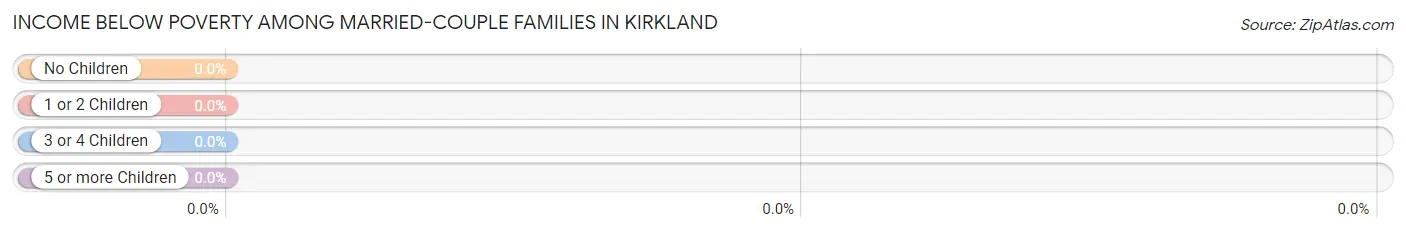
| Children | Above Poverty | Below Poverty |
| No Children | 170 (100.0%) | 0 (0.0%) |
| 1 or 2 Children | 99 (100.0%) | 0 (0.0%) |
| 3 or 4 Children | 7 (100.0%) | 0 (0.0%) |
| 5 or more Children | 0 (0.0%) | 0 (0.0%) |
| Total | 276 (100.0%) | 0 (0.0%) |
Income Below Poverty Among Single-Parent Households in Kirkland
According to the poverty data in Kirkland, 21.3% or 10 single-father households and 8.8% or 5 single-mother households are living below the poverty line. Among single-father households, those with 3 or 4 children have the highest poverty rate, with 7 households (100.0%) experiencing poverty. Likewise, among single-mother households, those with 5 or more children have the highest poverty rate, with 2 households (100.0%) falling below the poverty line.
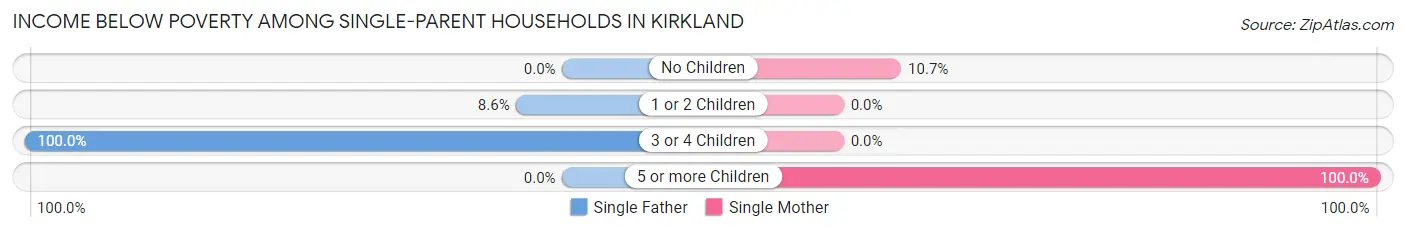
| Children | Single Father | Single Mother |
| No Children | 0 (0.0%) | 3 (10.7%) |
| 1 or 2 Children | 3 (8.6%) | 0 (0.0%) |
| 3 or 4 Children | 7 (100.0%) | 0 (0.0%) |
| 5 or more Children | 0 (0.0%) | 2 (100.0%) |
| Total | 10 (21.3%) | 5 (8.8%) |
Income Below Poverty Among Married-Couple vs Single-Parent Households in Kirkland
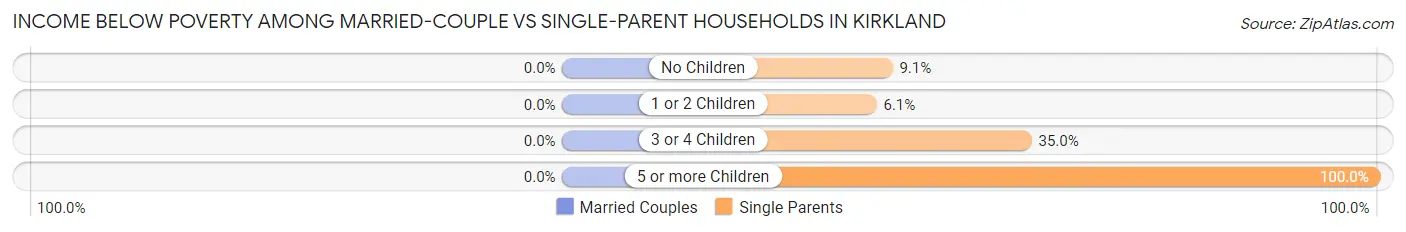
| Children | Married-Couple Families | Single-Parent Households |
| No Children | 0 (0.0%) | 3 (9.1%) |
| 1 or 2 Children | 0 (0.0%) | 3 (6.1%) |
| 3 or 4 Children | 0 (0.0%) | 7 (35.0%) |
| 5 or more Children | 0 (0.0%) | 2 (100.0%) |
| Total | 0 (0.0%) | 15 (14.4%) |
Race in Kirkland
The most populous races in Kirkland are White / Caucasian (1,379 | 92.4%), Hispanic or Latino (93 | 6.2%), and Two or more Races (78 | 5.2%).
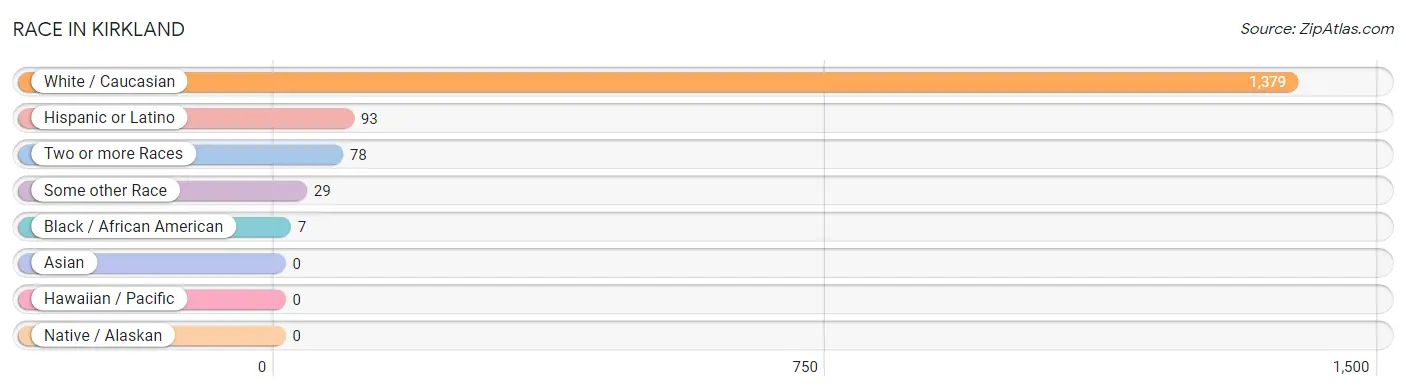
| Race | # Population | % Population |
| Asian | 0 | 0.0% |
| Black / African American | 7 | 0.5% |
| Hawaiian / Pacific | 0 | 0.0% |
| Hispanic or Latino | 93 | 6.2% |
| Native / Alaskan | 0 | 0.0% |
| White / Caucasian | 1,379 | 92.4% |
| Two or more Races | 78 | 5.2% |
| Some other Race | 29 | 1.9% |
| Total | 1,493 | 100.0% |
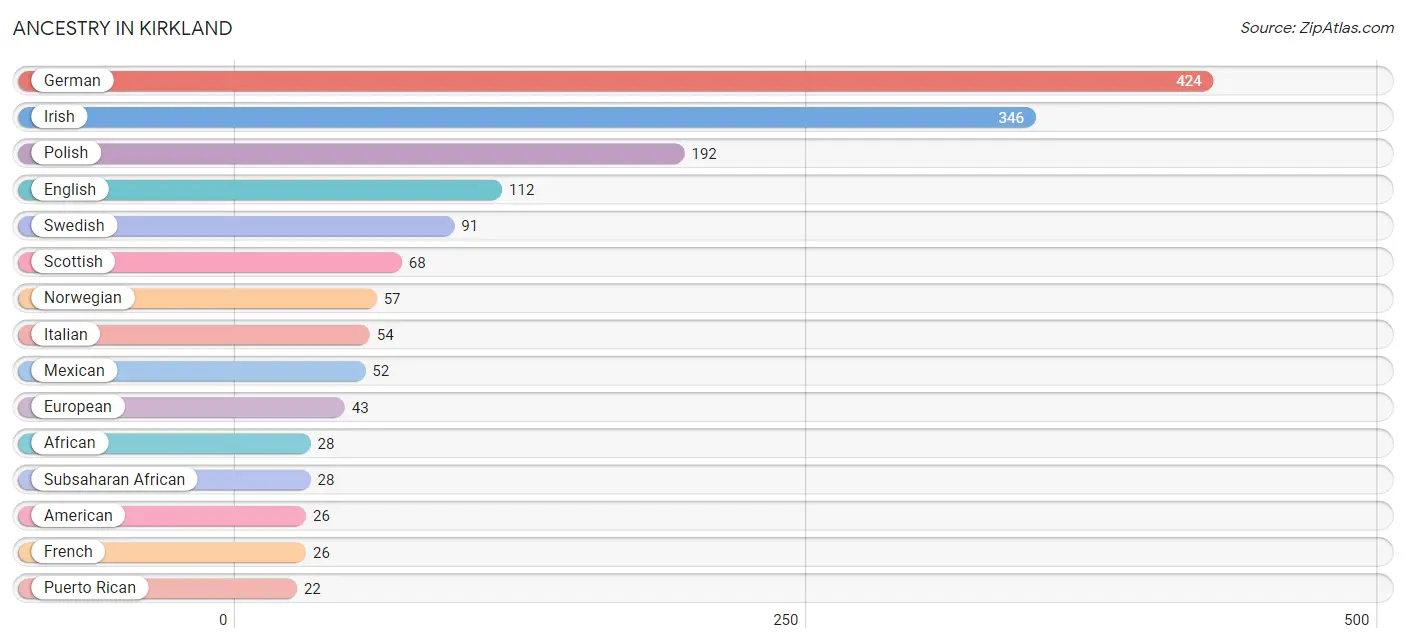
Ancestry in Kirkland
The most populous ancestries reported in Kirkland are German (424 | 28.4%), Irish (346 | 23.2%), Polish (192 | 12.9%), English (112 | 7.5%), and Swedish (91 | 6.1%), together accounting for 78.0% of all Kirkland residents.
| Ancestry | # Population | % Population |
| African | 28 | 1.9% |
| American | 26 | 1.7% |
| Belgian | 4 | 0.3% |
| Brazilian | 5 | 0.3% |
| British | 4 | 0.3% |
| Canadian | 2 | 0.1% |
| Central American | 19 | 1.3% |
| Czech | 5 | 0.3% |
| Czechoslovakian | 7 | 0.5% |
| Dutch | 1 | 0.1% |
| English | 112 | 7.5% |
| European | 43 | 2.9% |
| French | 26 | 1.7% |
| French Canadian | 2 | 0.1% |
| German | 424 | 28.4% |
| Greek | 7 | 0.5% |
| Guatemalan | 4 | 0.3% |
| Irish | 346 | 23.2% |
| Italian | 54 | 3.6% |
| Lithuanian | 17 | 1.1% |
| Mexican | 52 | 3.5% |
| Navajo | 1 | 0.1% |
| Norwegian | 57 | 3.8% |
| Pennsylvania German | 2 | 0.1% |
| Polish | 192 | 12.9% |
| Puerto Rican | 22 | 1.5% |
| Russian | 4 | 0.3% |
| Salvadoran | 15 | 1.0% |
| Scandinavian | 17 | 1.1% |
| Scottish | 68 | 4.5% |
| Subsaharan African | 28 | 1.9% |
| Swedish | 91 | 6.1% |
| Ukrainian | 15 | 1.0% |
| Yugoslavian | 6 | 0.4% | View All 34 Rows |
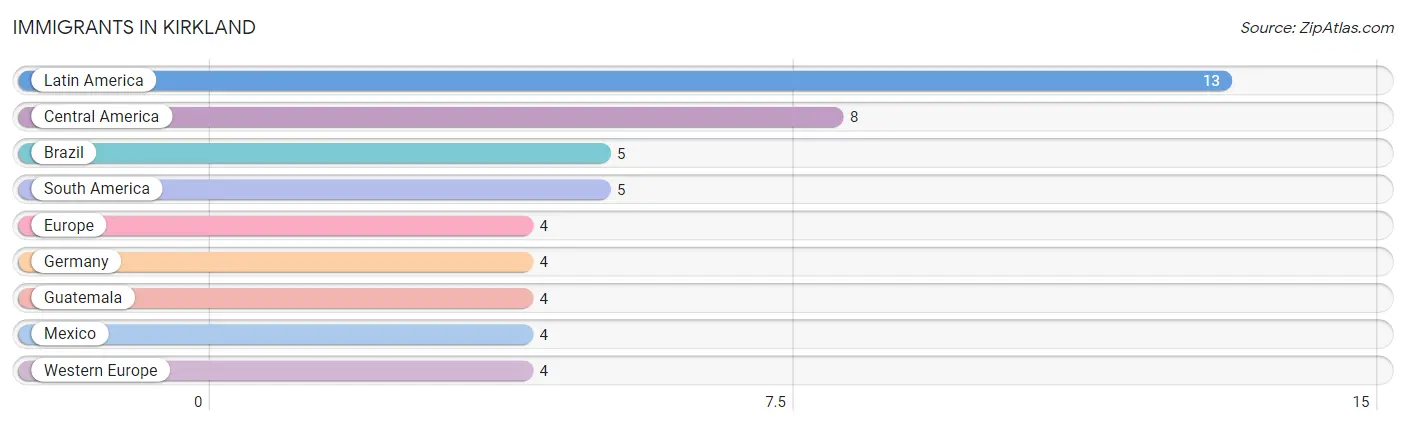
Immigrants in Kirkland
The most numerous immigrant groups reported in Kirkland came from Latin America (13 | 0.9%), Central America (8 | 0.5%), Brazil (5 | 0.3%), South America (5 | 0.3%), and Europe (4 | 0.3%), together accounting for 2.3% of all Kirkland residents.
| Immigration Origin | # Population | % Population |
| Brazil | 5 | 0.3% |
| Central America | 8 | 0.5% |
| Europe | 4 | 0.3% |
| Germany | 4 | 0.3% |
| Guatemala | 4 | 0.3% |
| Latin America | 13 | 0.9% |
| Mexico | 4 | 0.3% |
| South America | 5 | 0.3% |
| Western Europe | 4 | 0.3% | View All 9 Rows |
Sex and Age in Kirkland
Sex and Age in Kirkland
The most populous age groups in Kirkland are 15 to 19 Years (87 | 11.2%) for men and 10 to 14 Years (77 | 10.7%) for women.
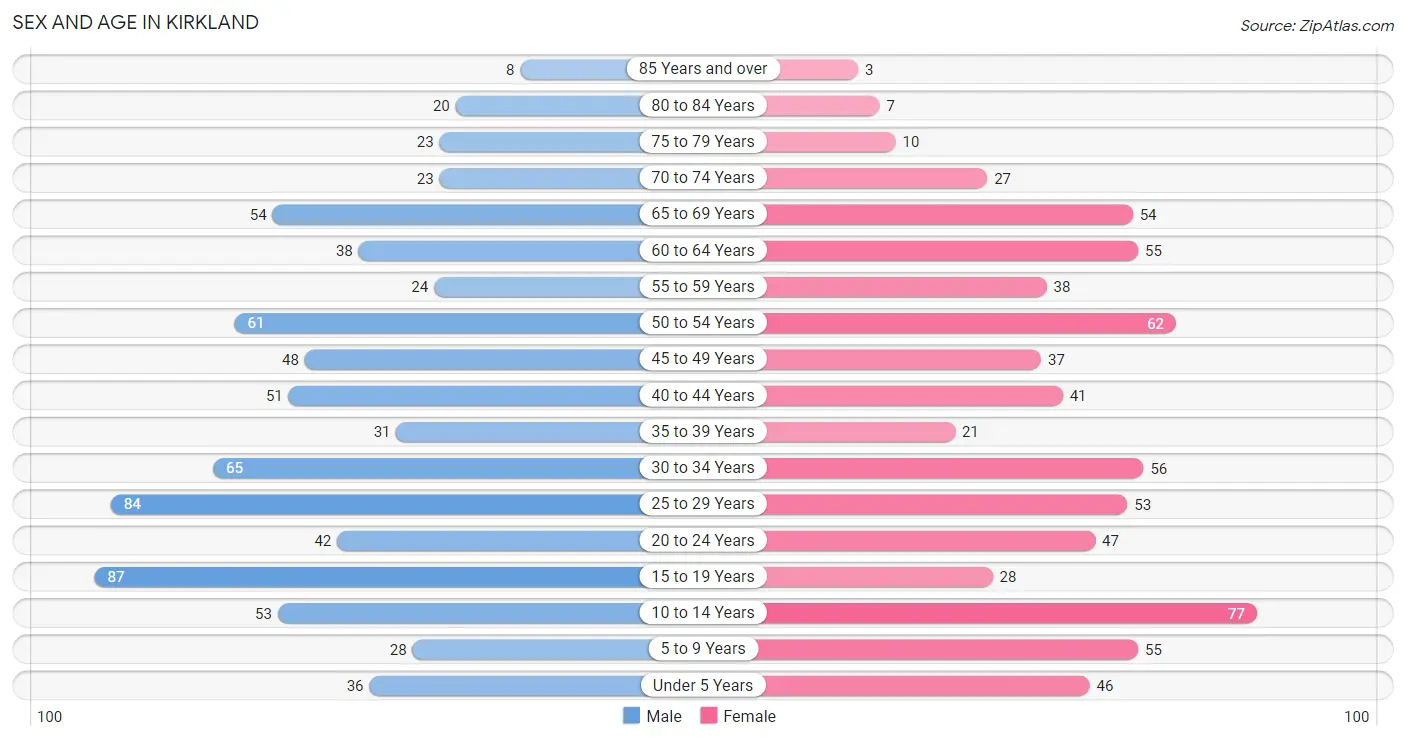
| Age Bracket | Male | Female |
| Under 5 Years | 36 (4.6%) | 46 (6.4%) |
| 5 to 9 Years | 28 (3.6%) | 55 (7.7%) |
| 10 to 14 Years | 53 (6.8%) | 77 (10.7%) |
| 15 to 19 Years | 87 (11.2%) | 28 (3.9%) |
| 20 to 24 Years | 42 (5.4%) | 47 (6.6%) |
| 25 to 29 Years | 84 (10.8%) | 53 (7.4%) |
| 30 to 34 Years | 65 (8.4%) | 56 (7.8%) |
| 35 to 39 Years | 31 (4.0%) | 21 (2.9%) |
| 40 to 44 Years | 51 (6.6%) | 41 (5.7%) |
| 45 to 49 Years | 48 (6.2%) | 37 (5.2%) |
| 50 to 54 Years | 61 (7.9%) | 62 (8.6%) |
| 55 to 59 Years | 24 (3.1%) | 38 (5.3%) |
| 60 to 64 Years | 38 (4.9%) | 55 (7.7%) |
| 65 to 69 Years | 54 (7.0%) | 54 (7.5%) |
| 70 to 74 Years | 23 (3.0%) | 27 (3.8%) |
| 75 to 79 Years | 23 (3.0%) | 10 (1.4%) |
| 80 to 84 Years | 20 (2.6%) | 7 (1.0%) |
| 85 Years and over | 8 (1.0%) | 3 (0.4%) |
| Total | 776 (100.0%) | 717 (100.0%) |
Families and Households in Kirkland
Median Family Size in Kirkland
The median family size in Kirkland is 3.14 persons per family, with single female/mother families (57 | 15.0%) accounting for the largest median family size of 3.63 persons per family. On the other hand, married-couple families (276 | 72.6%) represent the smallest median family size with 3.04 persons per family.
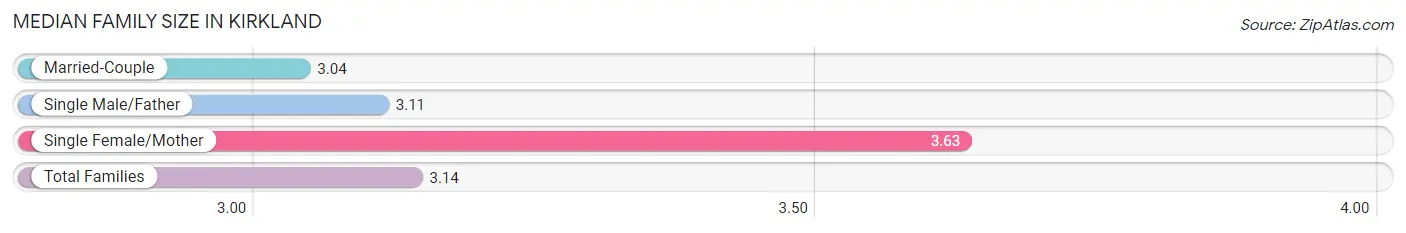
| Family Type | # Families | Family Size |
| Married-Couple | 276 (72.6%) | 3.04 |
| Single Male/Father | 47 (12.4%) | 3.11 |
| Single Female/Mother | 57 (15.0%) | 3.63 |
| Total Families | 380 (100.0%) | 3.14 |
Median Household Size in Kirkland
The median household size in Kirkland is 2.69 persons per household, with single female/mother households (57 | 10.3%) accounting for the largest median household size of 4.23 persons per household. non-family households (175 | 31.5%) represent the smallest median household size with 1.25 persons per household.
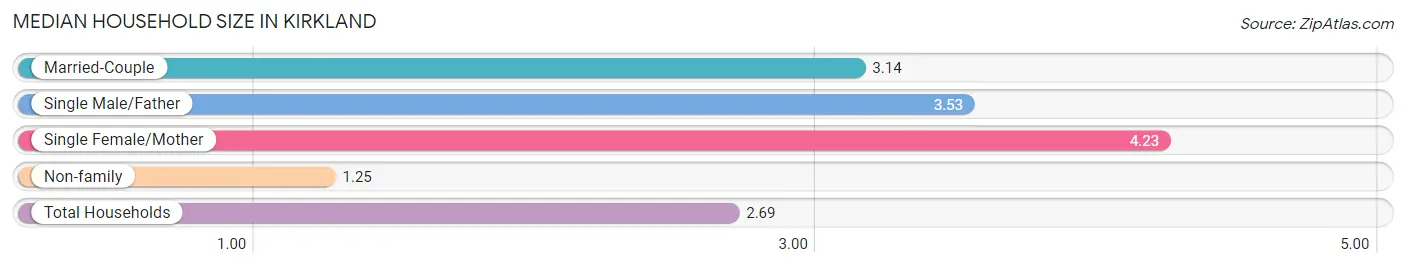
| Household Type | # Households | Household Size |
| Married-Couple | 276 (49.7%) | 3.14 |
| Single Male/Father | 47 (8.5%) | 3.53 |
| Single Female/Mother | 57 (10.3%) | 4.23 |
| Non-family | 175 (31.5%) | 1.25 |
| Total Households | 555 (100.0%) | 2.69 |
Household Size by Marriage Status in Kirkland
Out of a total of 555 households in Kirkland, 380 (68.5%) are family households, while 175 (31.5%) are nonfamily households. The most numerous type of family households are 2-person households, comprising 175, and the most common type of nonfamily households are 1-person households, comprising 127.
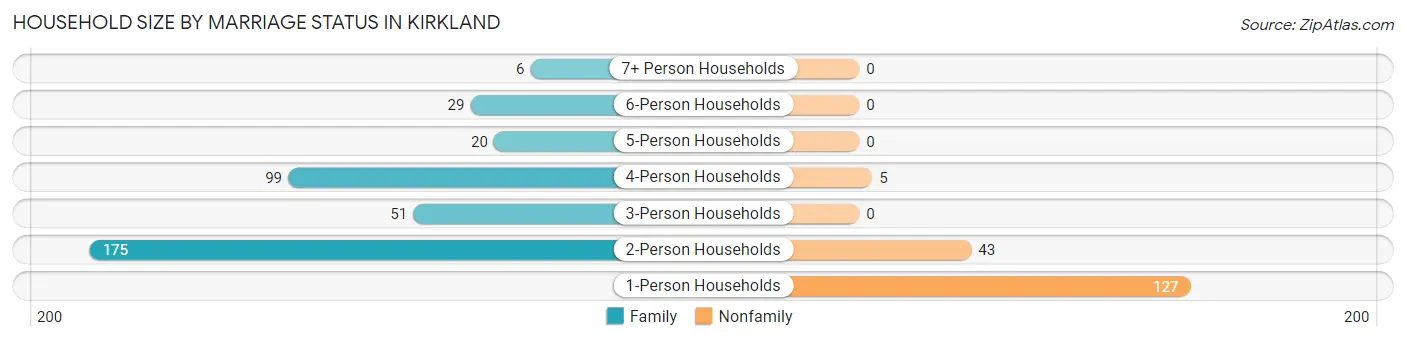
| Household Size | Family Households | Nonfamily Households |
| 1-Person Households | - | 127 (22.9%) |
| 2-Person Households | 175 (31.5%) | 43 (7.7%) |
| 3-Person Households | 51 (9.2%) | 0 (0.0%) |
| 4-Person Households | 99 (17.8%) | 5 (0.9%) |
| 5-Person Households | 20 (3.6%) | 0 (0.0%) |
| 6-Person Households | 29 (5.2%) | 0 (0.0%) |
| 7+ Person Households | 6 (1.1%) | 0 (0.0%) |
| Total | 380 (68.5%) | 175 (31.5%) |
Female Fertility in Kirkland
Fertility by Age in Kirkland
Average fertility rate in Kirkland is 87.0 births per 1,000 women. Women in the age bracket of 20 to 34 years have the highest fertility rate with 160.0 births per 1,000 women. Women in the age bracket of 20 to 34 years acount for 100.0% of all women with births.
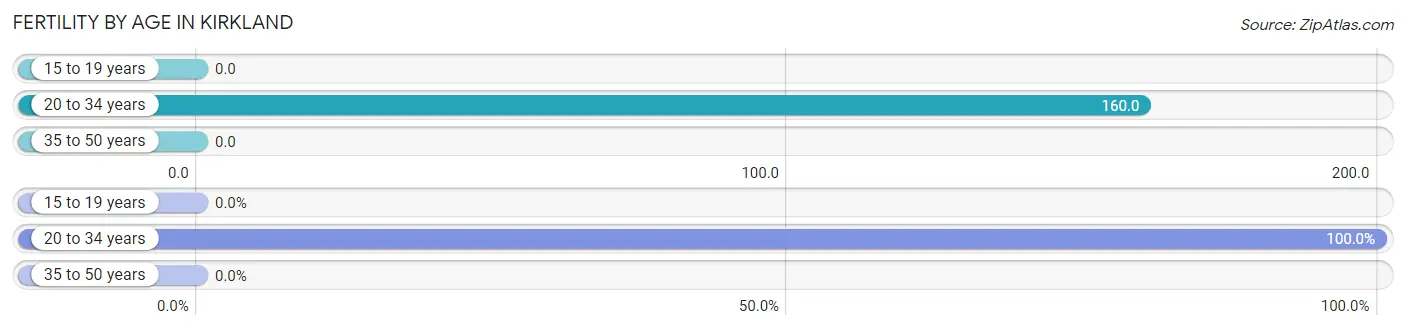
| Age Bracket | Women with Births | Births / 1,000 Women |
| 15 to 19 years | 0 (0.0%) | 0.0 |
| 20 to 34 years | 25 (100.0%) | 160.0 |
| 35 to 50 years | 0 (0.0%) | 0.0 |
| Total | 25 (100.0%) | 87.0 |
Fertility by Age by Marriage Status in Kirkland
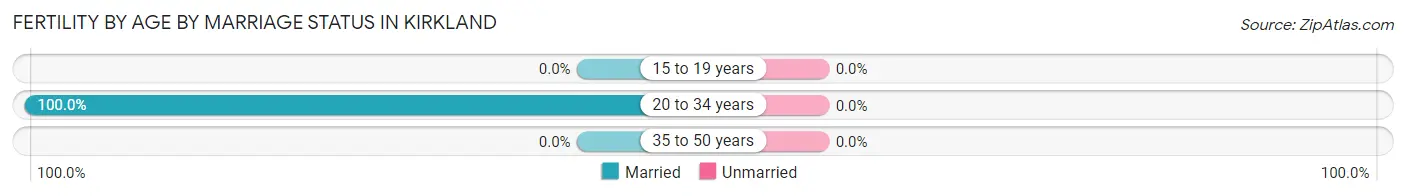
| Age Bracket | Married | Unmarried |
| 15 to 19 years | 0 (0.0%) | 0 (0.0%) |
| 20 to 34 years | 25 (100.0%) | 0 (0.0%) |
| 35 to 50 years | 0 (0.0%) | 0 (0.0%) |
| Total | 25 (100.0%) | 0 (0.0%) |
Fertility by Education in Kirkland
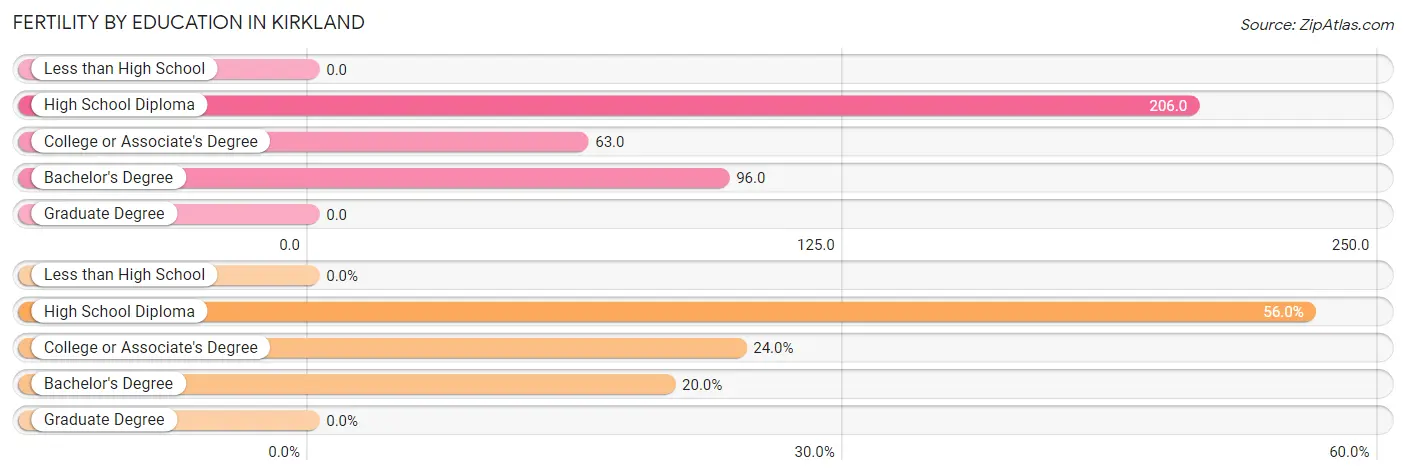
| Educational Attainment | Women with Births | Births / 1,000 Women |
| Less than High School | 0 (0.0%) | 0.0 |
| High School Diploma | 14 (56.0%) | 206.0 |
| College or Associate's Degree | 6 (24.0%) | 63.0 |
| Bachelor's Degree | 5 (20.0%) | 96.0 |
| Graduate Degree | 0 (0.0%) | 0.0 |
| Total | 25 (100.0%) | 87.0 |
Fertility by Education by Marriage Status in Kirkland
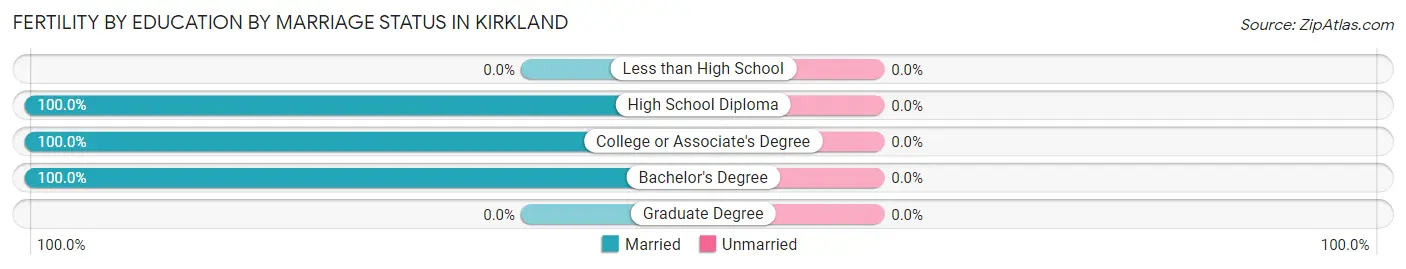
| Educational Attainment | Married | Unmarried |
| Less than High School | 0 (0.0%) | 0 (0.0%) |
| High School Diploma | 14 (100.0%) | 0 (0.0%) |
| College or Associate's Degree | 6 (100.0%) | 0 (0.0%) |
| Bachelor's Degree | 5 (100.0%) | 0 (0.0%) |
| Graduate Degree | 0 (0.0%) | 0 (0.0%) |
| Total | 25 (100.0%) | 0 (0.0%) |
Employment Characteristics in Kirkland
Employment by Class of Employer in Kirkland
Among the 759 employed individuals in Kirkland, private company employees (546 | 71.9%), local government employees (54 | 7.1%), and not-for-profit organizations (46 | 6.1%) make up the most common classes of employment.
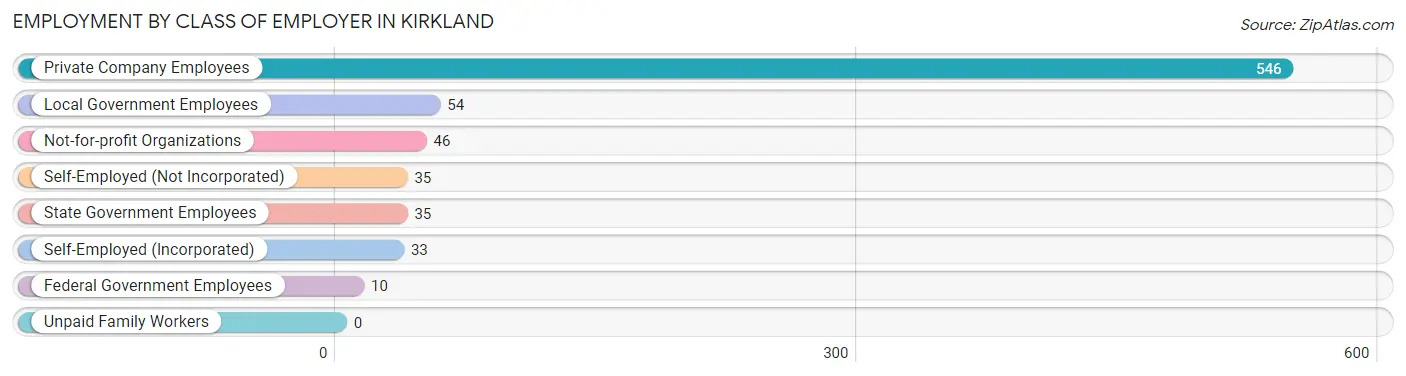
| Employer Class | # Employees | % Employees |
| Private Company Employees | 546 | 71.9% |
| Self-Employed (Incorporated) | 33 | 4.3% |
| Self-Employed (Not Incorporated) | 35 | 4.6% |
| Not-for-profit Organizations | 46 | 6.1% |
| Local Government Employees | 54 | 7.1% |
| State Government Employees | 35 | 4.6% |
| Federal Government Employees | 10 | 1.3% |
| Unpaid Family Workers | 0 | 0.0% |
| Total | 759 | 100.0% |
Employment Status by Age in Kirkland
According to the labor force statistics for Kirkland, out of the total population over 16 years of age (1,174), 70.3% or 825 individuals are in the labor force, with 4.4% or 36 of them unemployed. The age group with the highest labor force participation rate is 20 to 24 years, with 98.9% or 88 individuals in the labor force. Within the labor force, the 16 to 19 years age range has the highest percentage of unemployed individuals, with 24.0% or 12 of them being unemployed.
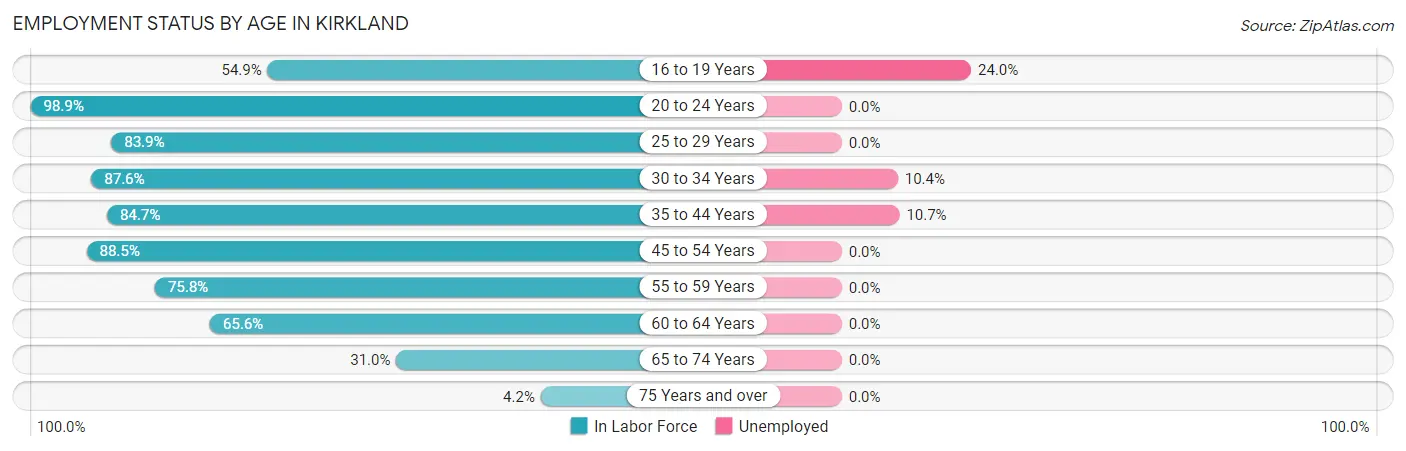
| Age Bracket | In Labor Force | Unemployed |
| 16 to 19 Years | 50 (54.9%) | 12 (24.0%) |
| 20 to 24 Years | 88 (98.9%) | 0 (0.0%) |
| 25 to 29 Years | 115 (83.9%) | 0 (0.0%) |
| 30 to 34 Years | 106 (87.6%) | 11 (10.4%) |
| 35 to 44 Years | 122 (84.7%) | 13 (10.7%) |
| 45 to 54 Years | 184 (88.5%) | 0 (0.0%) |
| 55 to 59 Years | 47 (75.8%) | 0 (0.0%) |
| 60 to 64 Years | 61 (65.6%) | 0 (0.0%) |
| 65 to 74 Years | 49 (31.0%) | 0 (0.0%) |
| 75 Years and over | 3 (4.2%) | 0 (0.0%) |
| Total | 825 (70.3%) | 36 (4.4%) |
Employment Status by Educational Attainment in Kirkland
According to labor force statistics for Kirkland, 83.0% of individuals (635) out of the total population between 25 and 64 years of age (765) are in the labor force, with 3.8% or 24 of them being unemployed. The group with the highest labor force participation rate are those with the educational attainment of bachelor's degree or higher, with 95.5% or 170 individuals in the labor force. Within the labor force, individuals with less than high school education have the highest percentage of unemployment, with 28.9% or 11 of them being unemployed.
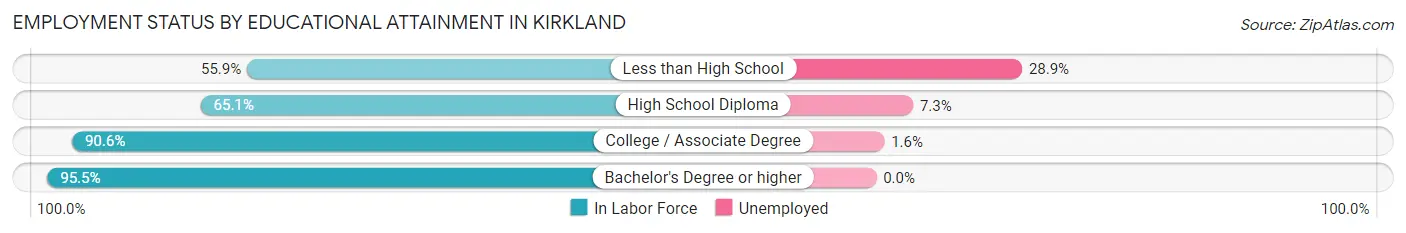
| Educational Attainment | In Labor Force | Unemployed |
| Less than High School | 38 (55.9%) | 20 (28.9%) |
| High School Diploma | 110 (65.1%) | 12 (7.3%) |
| College / Associate Degree | 317 (90.6%) | 6 (1.6%) |
| Bachelor's Degree or higher | 170 (95.5%) | 0 (0.0%) |
| Total | 635 (83.0%) | 29 (3.8%) |
Employment Occupations by Sex in Kirkland
Management, Business, Science and Arts Occupations
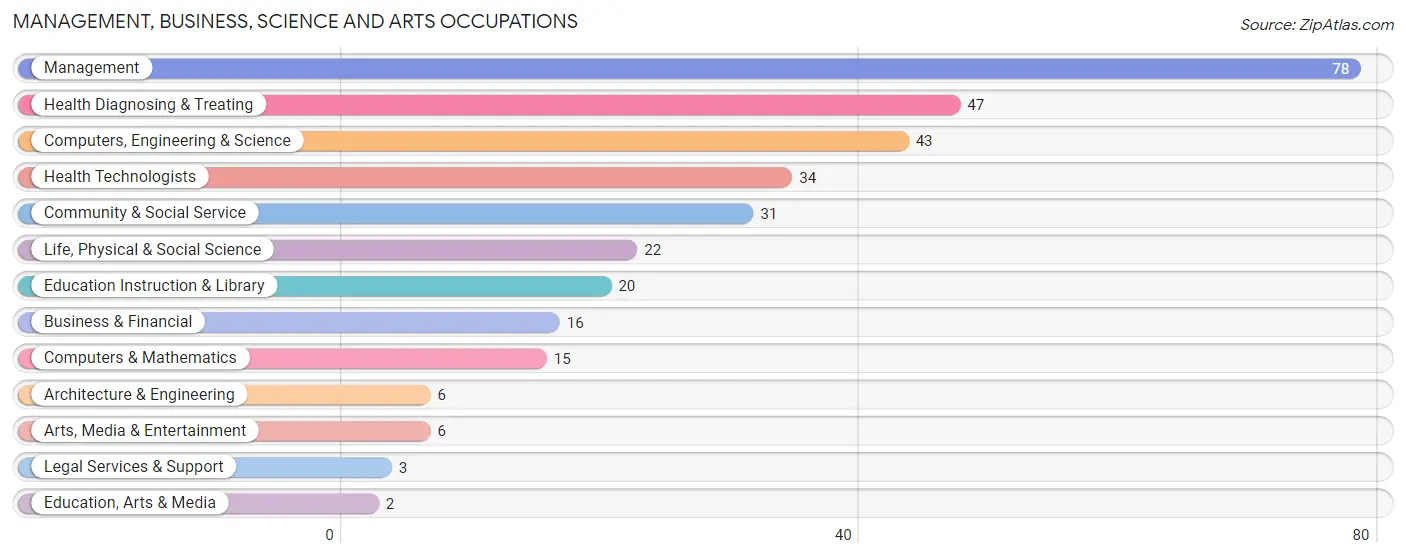
The most common Management, Business, Science and Arts occupations in Kirkland are Management (78 | 9.9%), Health Diagnosing & Treating (47 | 6.0%), Computers, Engineering & Science (43 | 5.4%), Health Technologists (34 | 4.3%), and Community & Social Service (31 | 3.9%).
Management, Business, Science and Arts Occupations by Sex
Within the Management, Business, Science and Arts occupations in Kirkland, the most male-oriented occupations are Computers & Mathematics (100.0%), Architecture & Engineering (100.0%), and Computers, Engineering & Science (81.4%), while the most female-oriented occupations are Education, Arts & Media (100.0%), Legal Services & Support (100.0%), and Health Diagnosing & Treating (100.0%).
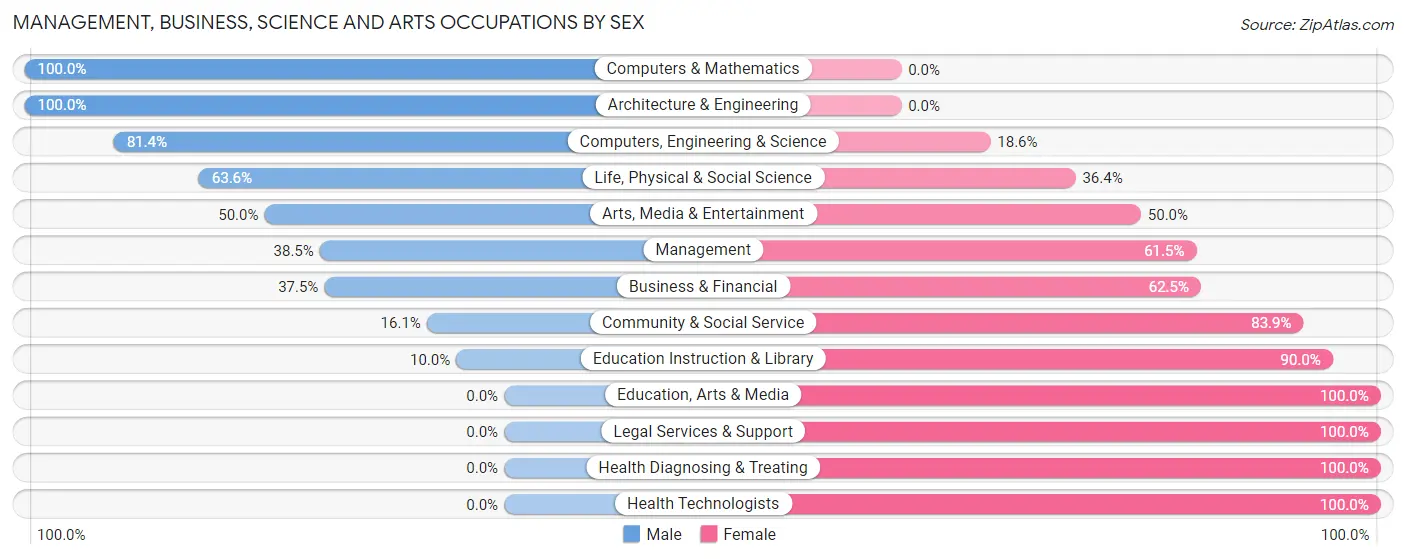
| Occupation | Male | Female |
| Management | 30 (38.5%) | 48 (61.5%) |
| Business & Financial | 6 (37.5%) | 10 (62.5%) |
| Computers, Engineering & Science | 35 (81.4%) | 8 (18.6%) |
| Computers & Mathematics | 15 (100.0%) | 0 (0.0%) |
| Architecture & Engineering | 6 (100.0%) | 0 (0.0%) |
| Life, Physical & Social Science | 14 (63.6%) | 8 (36.4%) |
| Community & Social Service | 5 (16.1%) | 26 (83.9%) |
| Education, Arts & Media | 0 (0.0%) | 2 (100.0%) |
| Legal Services & Support | 0 (0.0%) | 3 (100.0%) |
| Education Instruction & Library | 2 (10.0%) | 18 (90.0%) |
| Arts, Media & Entertainment | 3 (50.0%) | 3 (50.0%) |
| Health Diagnosing & Treating | 0 (0.0%) | 47 (100.0%) |
| Health Technologists | 0 (0.0%) | 34 (100.0%) |
| Total (Category) | 76 (35.3%) | 139 (64.6%) |
| Total (Overall) | 454 (57.5%) | 335 (42.5%) |
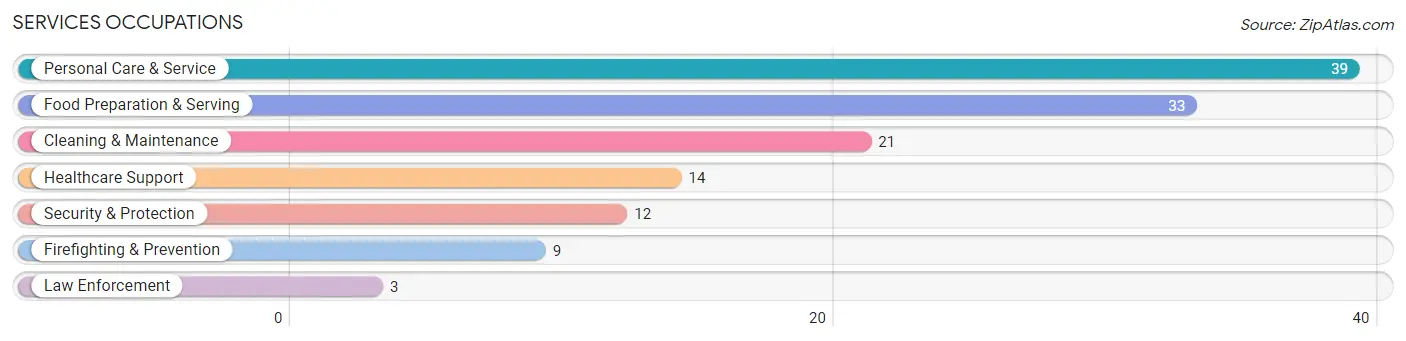
Services Occupations
The most common Services occupations in Kirkland are Personal Care & Service (39 | 4.9%), Food Preparation & Serving (33 | 4.2%), Cleaning & Maintenance (21 | 2.7%), Healthcare Support (14 | 1.8%), and Security & Protection (12 | 1.5%).
Services Occupations by Sex
Within the Services occupations in Kirkland, the most male-oriented occupations are Cleaning & Maintenance (80.9%), Food Preparation & Serving (66.7%), and Firefighting & Prevention (55.6%), while the most female-oriented occupations are Healthcare Support (100.0%), Law Enforcement (100.0%), and Personal Care & Service (76.9%).
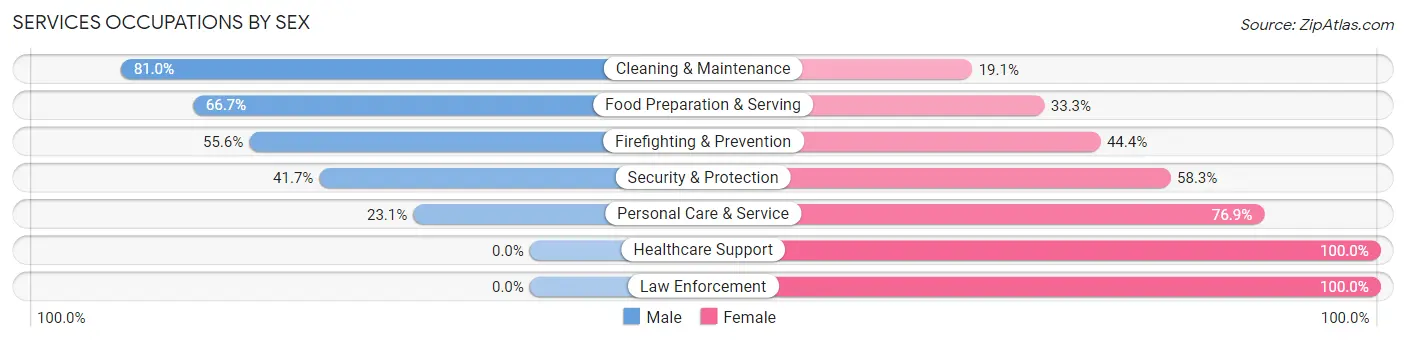
| Occupation | Male | Female |
| Healthcare Support | 0 (0.0%) | 14 (100.0%) |
| Security & Protection | 5 (41.7%) | 7 (58.3%) |
| Firefighting & Prevention | 5 (55.6%) | 4 (44.4%) |
| Law Enforcement | 0 (0.0%) | 3 (100.0%) |
| Food Preparation & Serving | 22 (66.7%) | 11 (33.3%) |
| Cleaning & Maintenance | 17 (80.9%) | 4 (19.1%) |
| Personal Care & Service | 9 (23.1%) | 30 (76.9%) |
| Total (Category) | 53 (44.5%) | 66 (55.5%) |
| Total (Overall) | 454 (57.5%) | 335 (42.5%) |
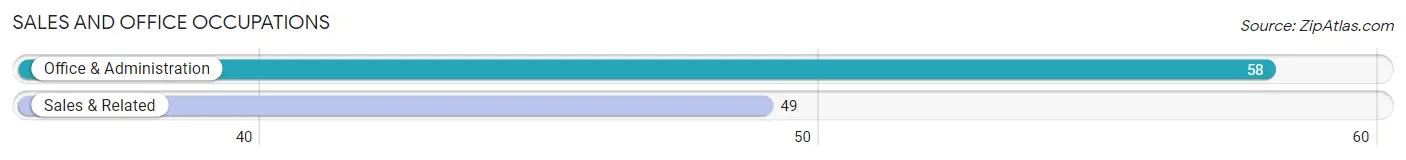
Sales and Office Occupations
The most common Sales and Office occupations in Kirkland are Office & Administration (58 | 7.3%), and Sales & Related (49 | 6.2%).
Sales and Office Occupations by Sex
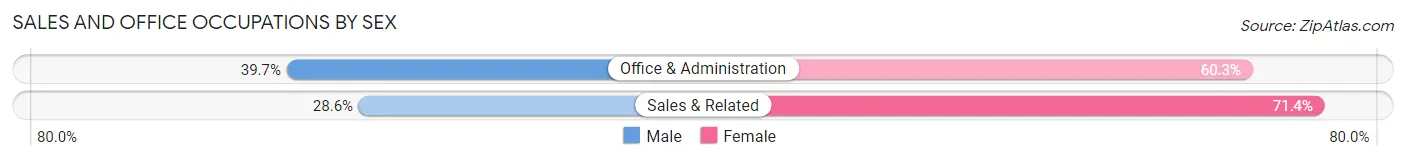
| Occupation | Male | Female |
| Sales & Related | 14 (28.6%) | 35 (71.4%) |
| Office & Administration | 23 (39.7%) | 35 (60.3%) |
| Total (Category) | 37 (34.6%) | 70 (65.4%) |
| Total (Overall) | 454 (57.5%) | 335 (42.5%) |
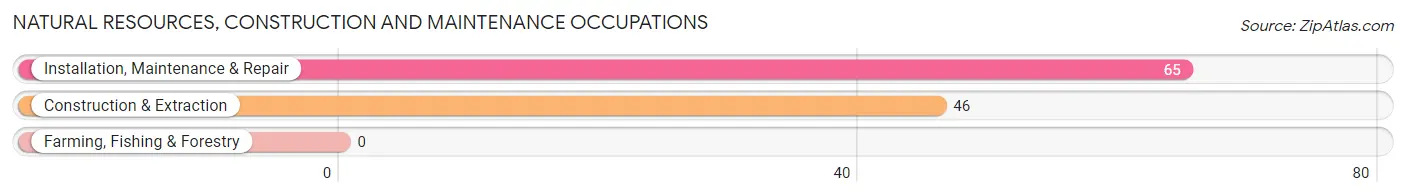
Natural Resources, Construction and Maintenance Occupations
The most common Natural Resources, Construction and Maintenance occupations in Kirkland are Installation, Maintenance & Repair (65 | 8.2%), and Construction & Extraction (46 | 5.8%).
Natural Resources, Construction and Maintenance Occupations by Sex
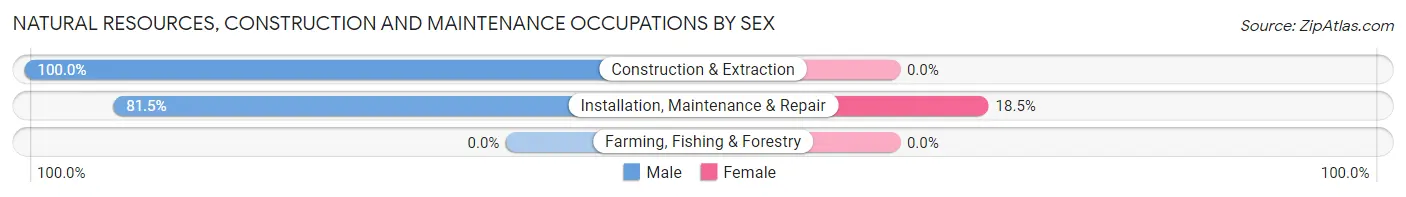
| Occupation | Male | Female |
| Farming, Fishing & Forestry | 0 (0.0%) | 0 (0.0%) |
| Construction & Extraction | 46 (100.0%) | 0 (0.0%) |
| Installation, Maintenance & Repair | 53 (81.5%) | 12 (18.5%) |
| Total (Category) | 99 (89.2%) | 12 (10.8%) |
| Total (Overall) | 454 (57.5%) | 335 (42.5%) |
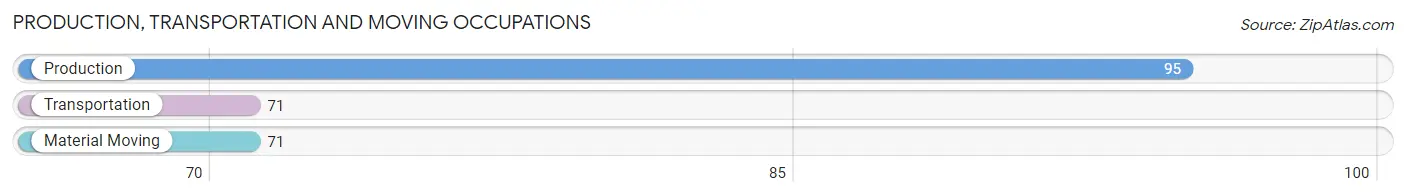
Production, Transportation and Moving Occupations
The most common Production, Transportation and Moving occupations in Kirkland are Production (95 | 12.0%), Transportation (71 | 9.0%), and Material Moving (71 | 9.0%).
Production, Transportation and Moving Occupations by Sex
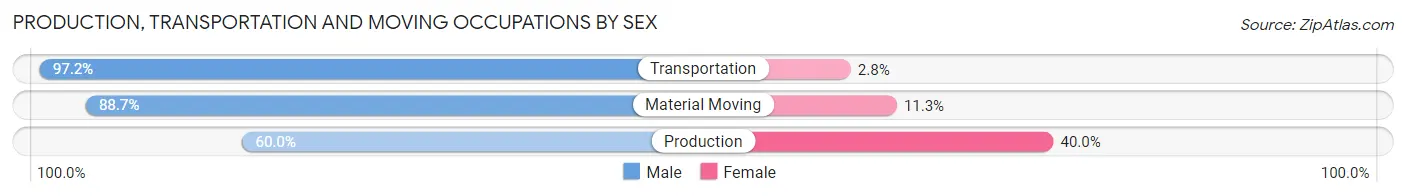
| Occupation | Male | Female |
| Production | 57 (60.0%) | 38 (40.0%) |
| Transportation | 69 (97.2%) | 2 (2.8%) |
| Material Moving | 63 (88.7%) | 8 (11.3%) |
| Total (Category) | 189 (79.7%) | 48 (20.3%) |
| Total (Overall) | 454 (57.5%) | 335 (42.5%) |
Employment Industries by Sex in Kirkland
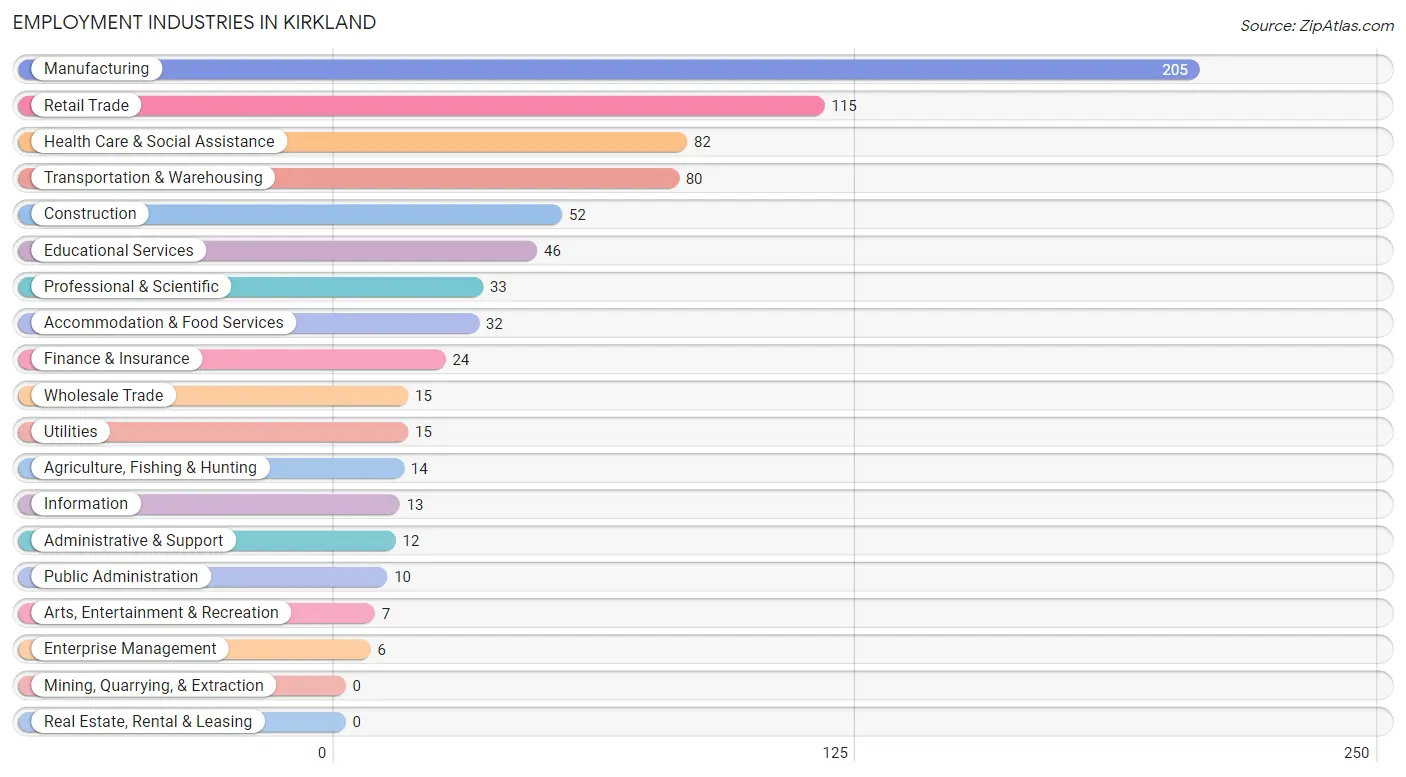
Employment Industries in Kirkland
The major employment industries in Kirkland include Manufacturing (205 | 26.0%), Retail Trade (115 | 14.6%), Health Care & Social Assistance (82 | 10.4%), Transportation & Warehousing (80 | 10.1%), and Construction (52 | 6.6%).
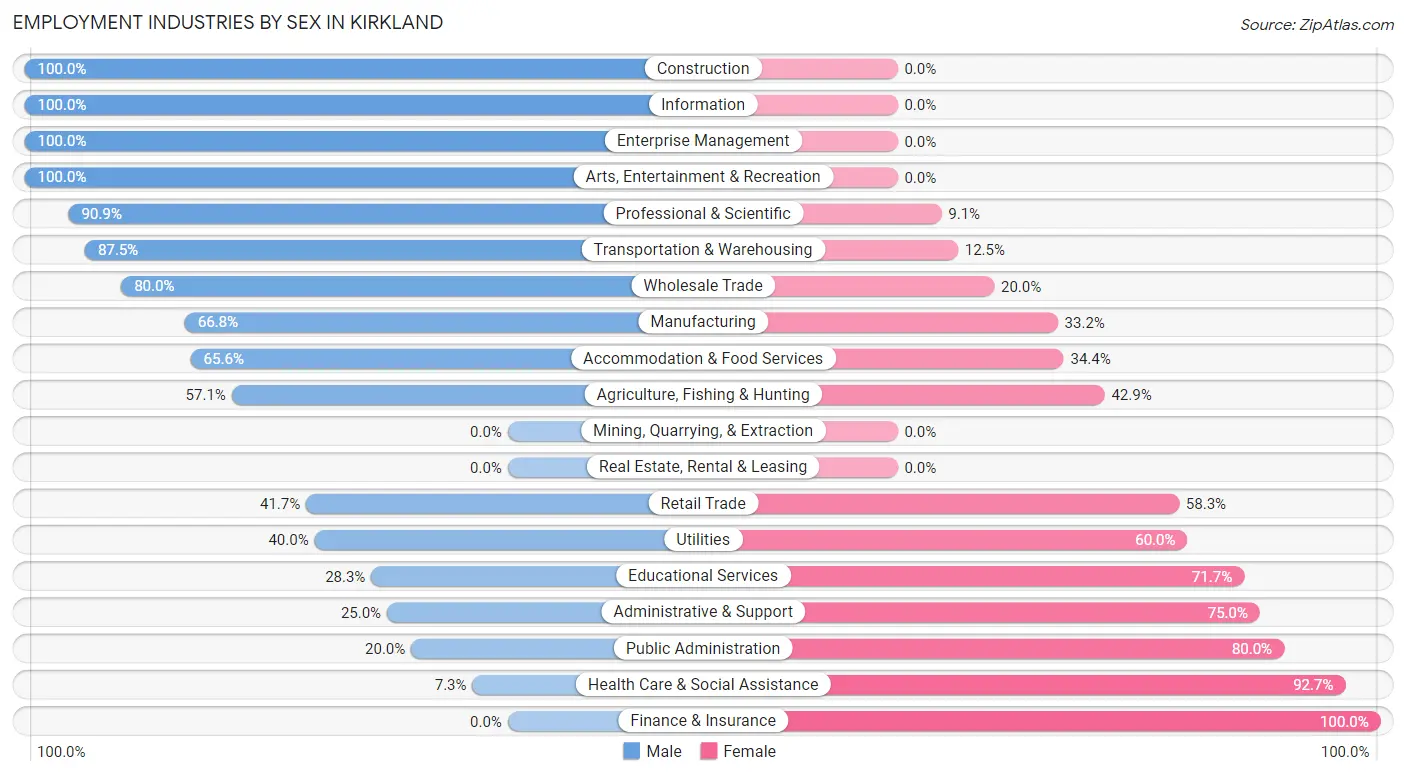
Employment Industries by Sex in Kirkland
The Kirkland industries that see more men than women are Construction (100.0%), Information (100.0%), and Enterprise Management (100.0%), whereas the industries that tend to have a higher number of women are Finance & Insurance (100.0%), Health Care & Social Assistance (92.7%), and Public Administration (80.0%).
| Industry | Male | Female |
| Agriculture, Fishing & Hunting | 8 (57.1%) | 6 (42.9%) |
| Mining, Quarrying, & Extraction | 0 (0.0%) | 0 (0.0%) |
| Construction | 52 (100.0%) | 0 (0.0%) |
| Manufacturing | 137 (66.8%) | 68 (33.2%) |
| Wholesale Trade | 12 (80.0%) | 3 (20.0%) |
| Retail Trade | 48 (41.7%) | 67 (58.3%) |
| Transportation & Warehousing | 70 (87.5%) | 10 (12.5%) |
| Utilities | 6 (40.0%) | 9 (60.0%) |
| Information | 13 (100.0%) | 0 (0.0%) |
| Finance & Insurance | 0 (0.0%) | 24 (100.0%) |
| Real Estate, Rental & Leasing | 0 (0.0%) | 0 (0.0%) |
| Professional & Scientific | 30 (90.9%) | 3 (9.1%) |
| Enterprise Management | 6 (100.0%) | 0 (0.0%) |
| Administrative & Support | 3 (25.0%) | 9 (75.0%) |
| Educational Services | 13 (28.3%) | 33 (71.7%) |
| Health Care & Social Assistance | 6 (7.3%) | 76 (92.7%) |
| Arts, Entertainment & Recreation | 7 (100.0%) | 0 (0.0%) |
| Accommodation & Food Services | 21 (65.6%) | 11 (34.4%) |
| Public Administration | 2 (20.0%) | 8 (80.0%) |
| Total | 454 (57.5%) | 335 (42.5%) |
Education in Kirkland
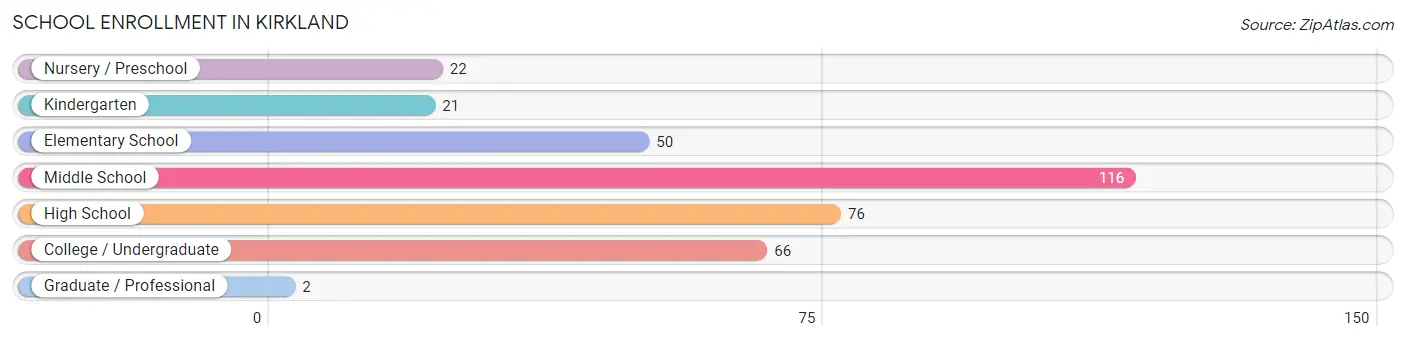
School Enrollment in Kirkland
The most common levels of schooling among the 353 students in Kirkland are middle school (116 | 32.9%), high school (76 | 21.5%), and college / undergraduate (66 | 18.7%).
| School Level | # Students | % Students |
| Nursery / Preschool | 22 | 6.2% |
| Kindergarten | 21 | 5.9% |
| Elementary School | 50 | 14.2% |
| Middle School | 116 | 32.9% |
| High School | 76 | 21.5% |
| College / Undergraduate | 66 | 18.7% |
| Graduate / Professional | 2 | 0.6% |
| Total | 353 | 100.0% |
School Enrollment by Age by Funding Source in Kirkland
Out of a total of 353 students who are enrolled in schools in Kirkland, 34 (9.6%) attend a private institution, while the remaining 319 (90.4%) are enrolled in public schools. The age group of 20 to 24 year olds has the highest likelihood of being enrolled in private schools, with 15 (62.5% in the age bracket) enrolled. Conversely, the age group of 3 to 4 year olds has the lowest likelihood of being enrolled in a private school, with 5 (100.0% in the age bracket) attending a public institution.
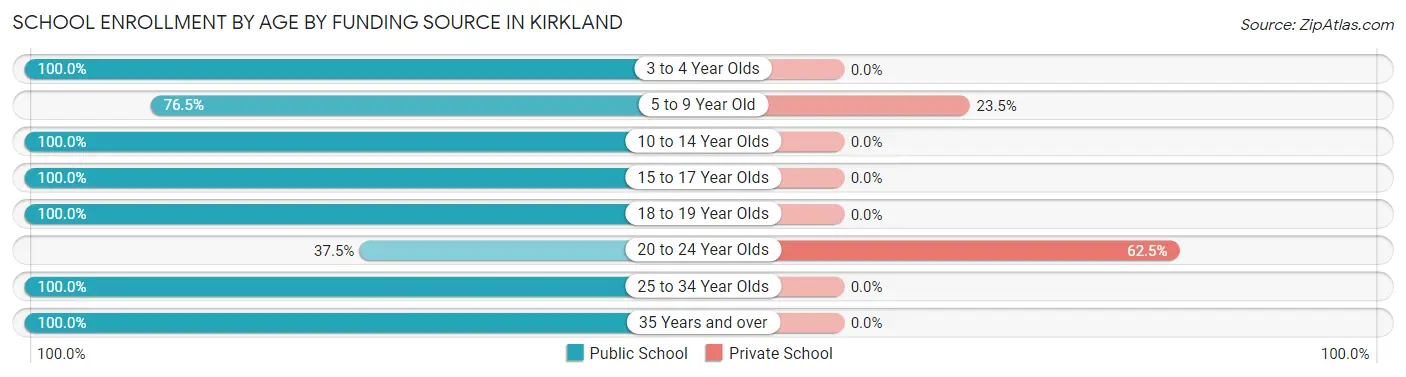
| Age Bracket | Public School | Private School |
| 3 to 4 Year Olds | 5 (100.0%) | 0 (0.0%) |
| 5 to 9 Year Old | 62 (76.5%) | 19 (23.5%) |
| 10 to 14 Year Olds | 128 (100.0%) | 0 (0.0%) |
| 15 to 17 Year Olds | 65 (100.0%) | 0 (0.0%) |
| 18 to 19 Year Olds | 34 (100.0%) | 0 (0.0%) |
| 20 to 24 Year Olds | 9 (37.5%) | 15 (62.5%) |
| 25 to 34 Year Olds | 14 (100.0%) | 0 (0.0%) |
| 35 Years and over | 2 (100.0%) | 0 (0.0%) |
| Total | 319 (90.4%) | 34 (9.6%) |
Educational Attainment by Field of Study in Kirkland
Business (44 | 21.7%), arts & humanities (36 | 17.7%), bio, nature & agricultural (30 | 14.8%), education (27 | 13.3%), and physical & health sciences (19 | 9.4%) are the most common fields of study among 203 individuals in Kirkland who have obtained a bachelor's degree or higher.
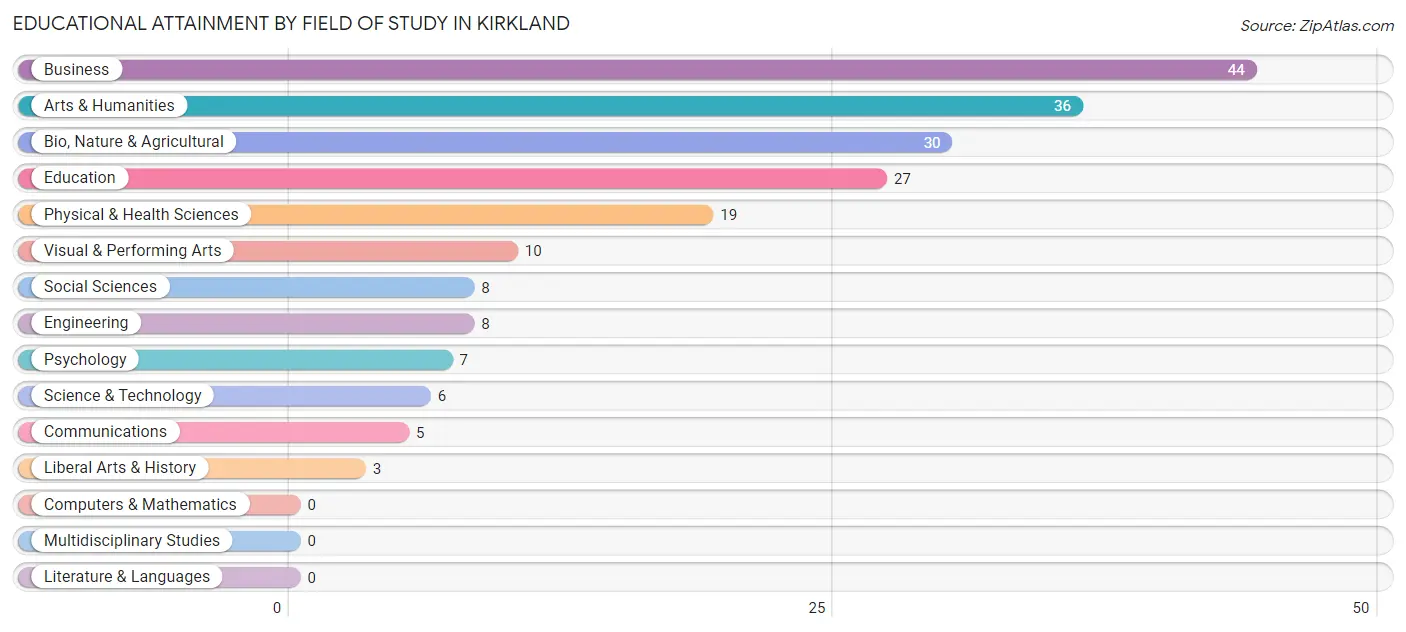
| Field of Study | # Graduates | % Graduates |
| Computers & Mathematics | 0 | 0.0% |
| Bio, Nature & Agricultural | 30 | 14.8% |
| Physical & Health Sciences | 19 | 9.4% |
| Psychology | 7 | 3.5% |
| Social Sciences | 8 | 3.9% |
| Engineering | 8 | 3.9% |
| Multidisciplinary Studies | 0 | 0.0% |
| Science & Technology | 6 | 3.0% |
| Business | 44 | 21.7% |
| Education | 27 | 13.3% |
| Literature & Languages | 0 | 0.0% |
| Liberal Arts & History | 3 | 1.5% |
| Visual & Performing Arts | 10 | 4.9% |
| Communications | 5 | 2.5% |
| Arts & Humanities | 36 | 17.7% |
| Total | 203 | 100.0% |
Transportation & Commute in Kirkland
Vehicle Availability by Sex in Kirkland
The most prevalent vehicle ownership categories in Kirkland are males with 2 vehicles (195, accounting for 44.0%) and females with 2 vehicles (115, making up 61.7%).
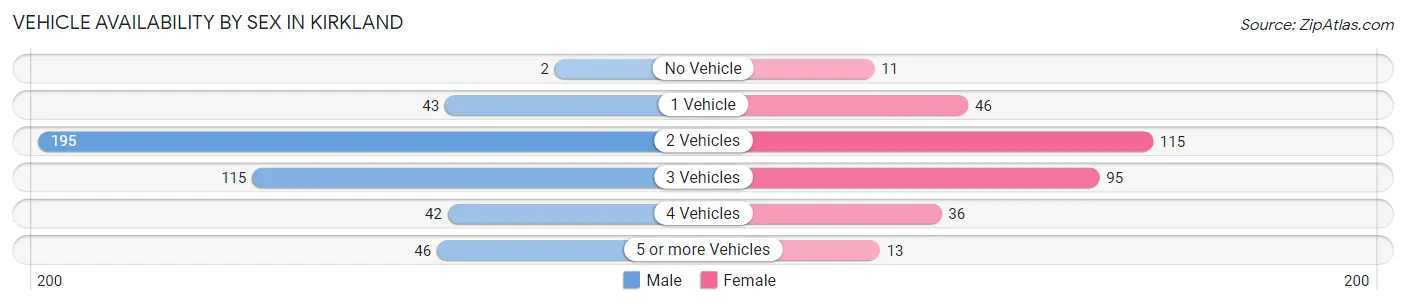
| Vehicles Available | Male | Female |
| No Vehicle | 2 (0.4%) | 11 (3.5%) |
| 1 Vehicle | 43 (9.7%) | 46 (14.6%) |
| 2 Vehicles | 195 (44.0%) | 115 (36.4%) |
| 3 Vehicles | 115 (26.0%) | 95 (30.1%) |
| 4 Vehicles | 42 (9.5%) | 36 (11.4%) |
| 5 or more Vehicles | 46 (10.4%) | 13 (4.1%) |
| Total | 443 (100.0%) | 316 (100.0%) |
Commute Time in Kirkland
The most frequently occuring commute durations in Kirkland are 20 to 24 minutes (136 commuters, 19.1%), 30 to 34 minutes (120 commuters, 16.8%), and 25 to 29 minutes (113 commuters, 15.8%).
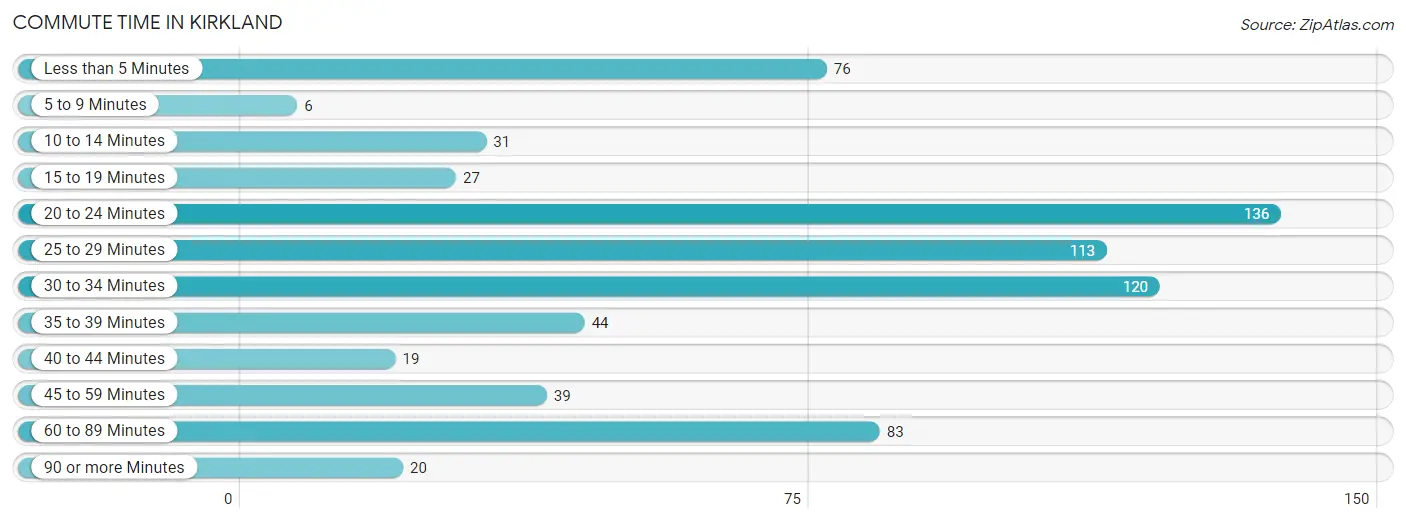
| Commute Time | # Commuters | % Commuters |
| Less than 5 Minutes | 76 | 10.6% |
| 5 to 9 Minutes | 6 | 0.8% |
| 10 to 14 Minutes | 31 | 4.3% |
| 15 to 19 Minutes | 27 | 3.8% |
| 20 to 24 Minutes | 136 | 19.1% |
| 25 to 29 Minutes | 113 | 15.8% |
| 30 to 34 Minutes | 120 | 16.8% |
| 35 to 39 Minutes | 44 | 6.2% |
| 40 to 44 Minutes | 19 | 2.7% |
| 45 to 59 Minutes | 39 | 5.5% |
| 60 to 89 Minutes | 83 | 11.6% |
| 90 or more Minutes | 20 | 2.8% |
Commute Time by Sex in Kirkland
The most common commute times in Kirkland are 30 to 34 minutes (77 commuters, 17.9%) for males and 25 to 29 minutes (80 commuters, 28.3%) for females.
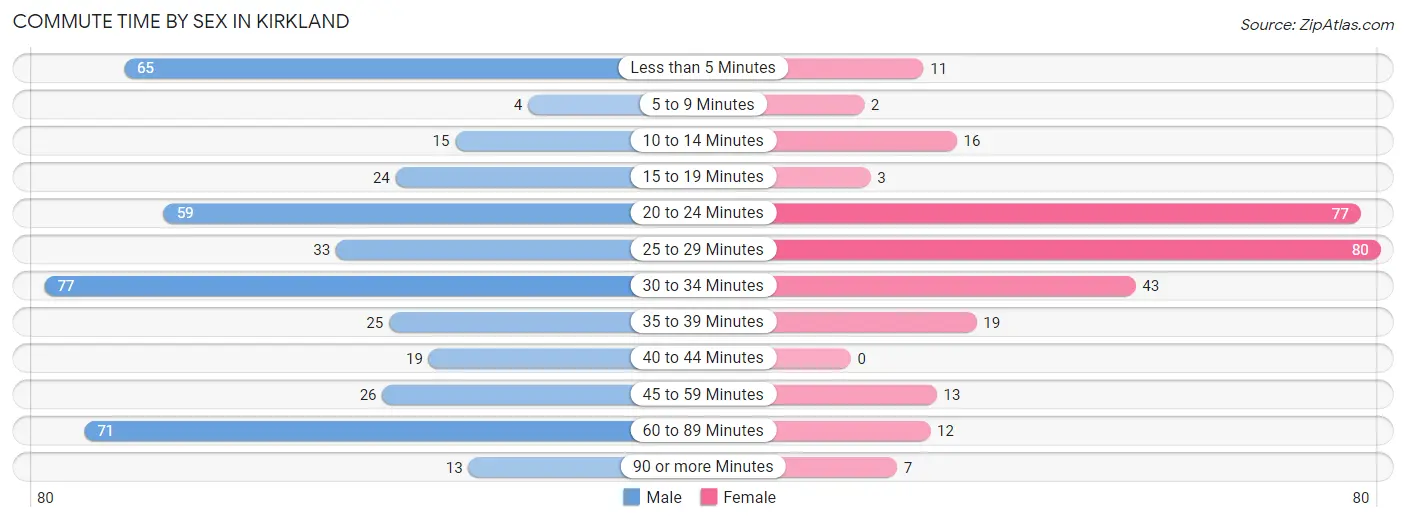
| Commute Time | Male | Female |
| Less than 5 Minutes | 65 (15.1%) | 11 (3.9%) |
| 5 to 9 Minutes | 4 (0.9%) | 2 (0.7%) |
| 10 to 14 Minutes | 15 (3.5%) | 16 (5.7%) |
| 15 to 19 Minutes | 24 (5.6%) | 3 (1.1%) |
| 20 to 24 Minutes | 59 (13.7%) | 77 (27.2%) |
| 25 to 29 Minutes | 33 (7.7%) | 80 (28.3%) |
| 30 to 34 Minutes | 77 (17.9%) | 43 (15.2%) |
| 35 to 39 Minutes | 25 (5.8%) | 19 (6.7%) |
| 40 to 44 Minutes | 19 (4.4%) | 0 (0.0%) |
| 45 to 59 Minutes | 26 (6.0%) | 13 (4.6%) |
| 60 to 89 Minutes | 71 (16.5%) | 12 (4.2%) |
| 90 or more Minutes | 13 (3.0%) | 7 (2.5%) |
Time of Departure to Work by Sex in Kirkland
The most frequent times of departure to work in Kirkland are 12:00 AM to 4:59 AM (89, 20.6%) for males and 7:30 AM to 7:59 AM (58, 20.5%) for females.
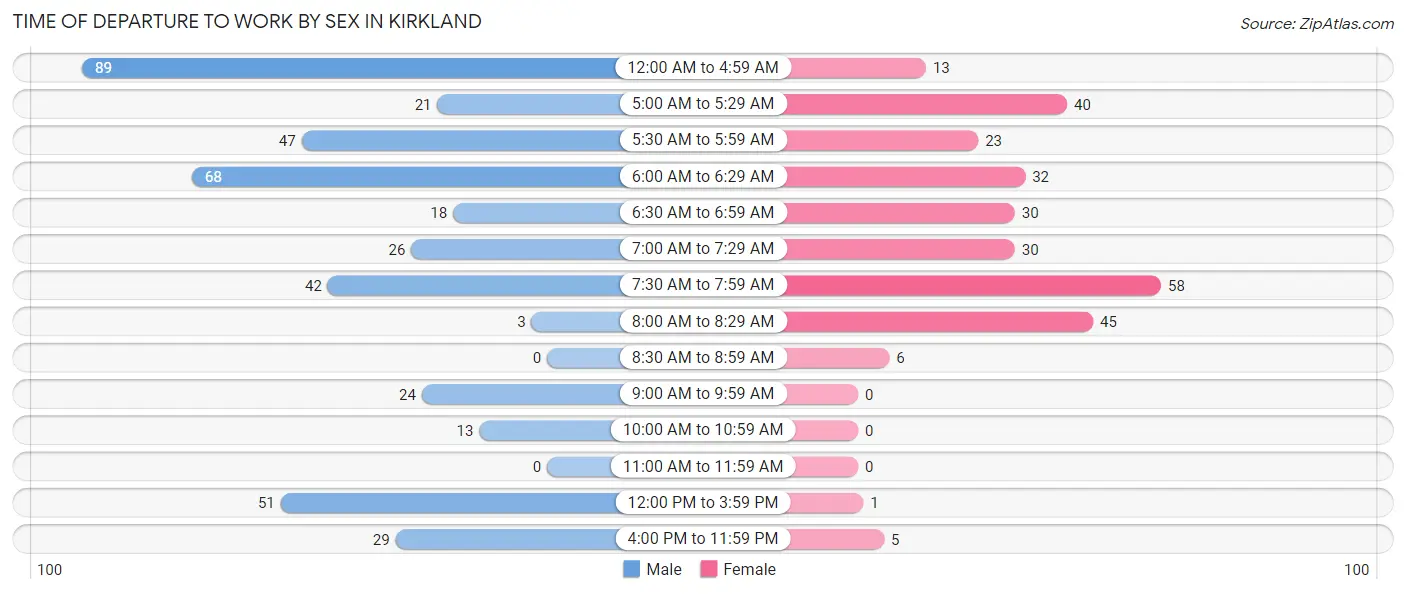
| Time of Departure | Male | Female |
| 12:00 AM to 4:59 AM | 89 (20.6%) | 13 (4.6%) |
| 5:00 AM to 5:29 AM | 21 (4.9%) | 40 (14.1%) |
| 5:30 AM to 5:59 AM | 47 (10.9%) | 23 (8.1%) |
| 6:00 AM to 6:29 AM | 68 (15.8%) | 32 (11.3%) |
| 6:30 AM to 6:59 AM | 18 (4.2%) | 30 (10.6%) |
| 7:00 AM to 7:29 AM | 26 (6.0%) | 30 (10.6%) |
| 7:30 AM to 7:59 AM | 42 (9.7%) | 58 (20.5%) |
| 8:00 AM to 8:29 AM | 3 (0.7%) | 45 (15.9%) |
| 8:30 AM to 8:59 AM | 0 (0.0%) | 6 (2.1%) |
| 9:00 AM to 9:59 AM | 24 (5.6%) | 0 (0.0%) |
| 10:00 AM to 10:59 AM | 13 (3.0%) | 0 (0.0%) |
| 11:00 AM to 11:59 AM | 0 (0.0%) | 0 (0.0%) |
| 12:00 PM to 3:59 PM | 51 (11.8%) | 1 (0.4%) |
| 4:00 PM to 11:59 PM | 29 (6.7%) | 5 (1.8%) |
| Total | 431 (100.0%) | 283 (100.0%) |
Housing Occupancy in Kirkland
Occupancy by Ownership in Kirkland
Of the total 555 dwellings in Kirkland, owner-occupied units account for 435 (78.4%), while renter-occupied units make up 120 (21.6%).
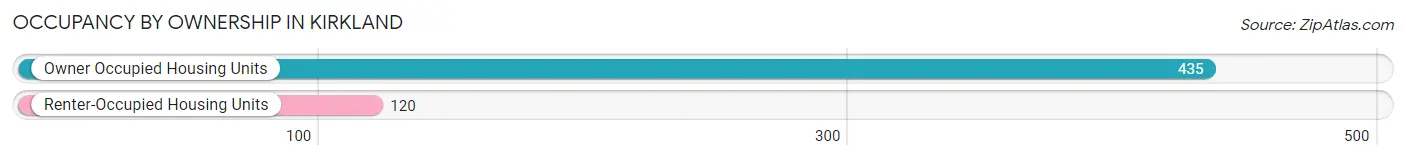
| Occupancy | # Housing Units | % Housing Units |
| Owner Occupied Housing Units | 435 | 78.4% |
| Renter-Occupied Housing Units | 120 | 21.6% |
| Total Occupied Housing Units | 555 | 100.0% |
Occupancy by Household Size in Kirkland
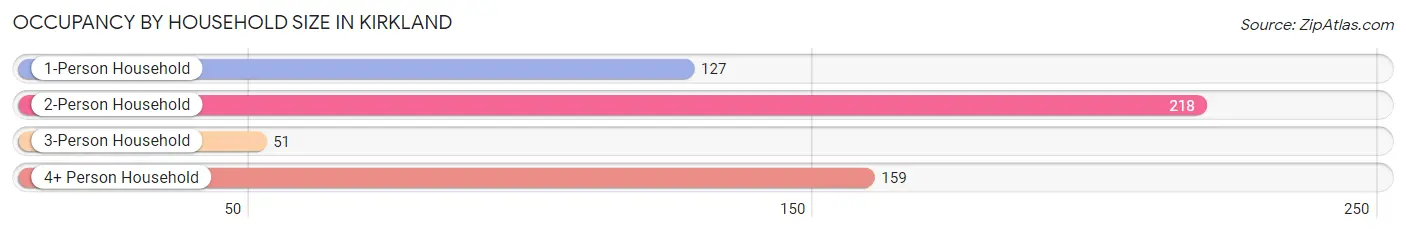
| Household Size | # Housing Units | % Housing Units |
| 1-Person Household | 127 | 22.9% |
| 2-Person Household | 218 | 39.3% |
| 3-Person Household | 51 | 9.2% |
| 4+ Person Household | 159 | 28.6% |
| Total Housing Units | 555 | 100.0% |
Occupancy by Ownership by Household Size in Kirkland
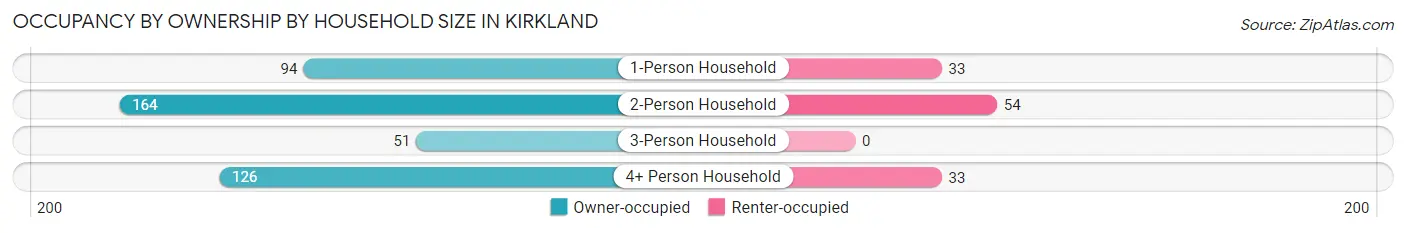
| Household Size | Owner-occupied | Renter-occupied |
| 1-Person Household | 94 (74.0%) | 33 (26.0%) |
| 2-Person Household | 164 (75.2%) | 54 (24.8%) |
| 3-Person Household | 51 (100.0%) | 0 (0.0%) |
| 4+ Person Household | 126 (79.2%) | 33 (20.7%) |
| Total Housing Units | 435 (78.4%) | 120 (21.6%) |
Occupancy by Educational Attainment in Kirkland
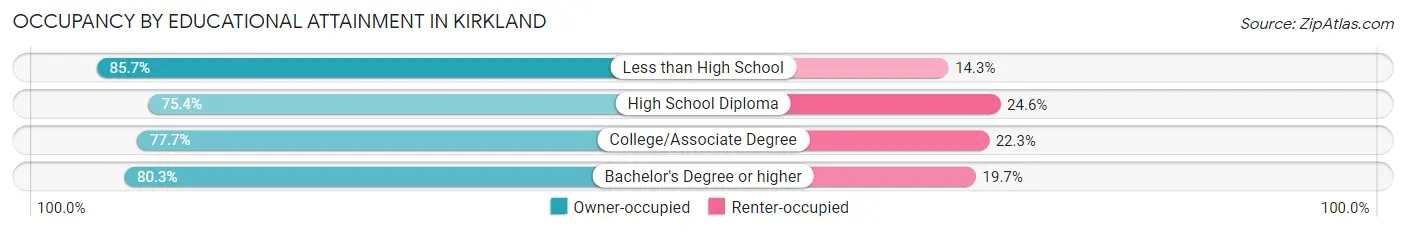
| Household Size | Owner-occupied | Renter-occupied |
| Less than High School | 30 (85.7%) | 5 (14.3%) |
| High School Diploma | 89 (75.4%) | 29 (24.6%) |
| College/Associate Degree | 202 (77.7%) | 58 (22.3%) |
| Bachelor's Degree or higher | 114 (80.3%) | 28 (19.7%) |
Occupancy by Age of Householder in Kirkland
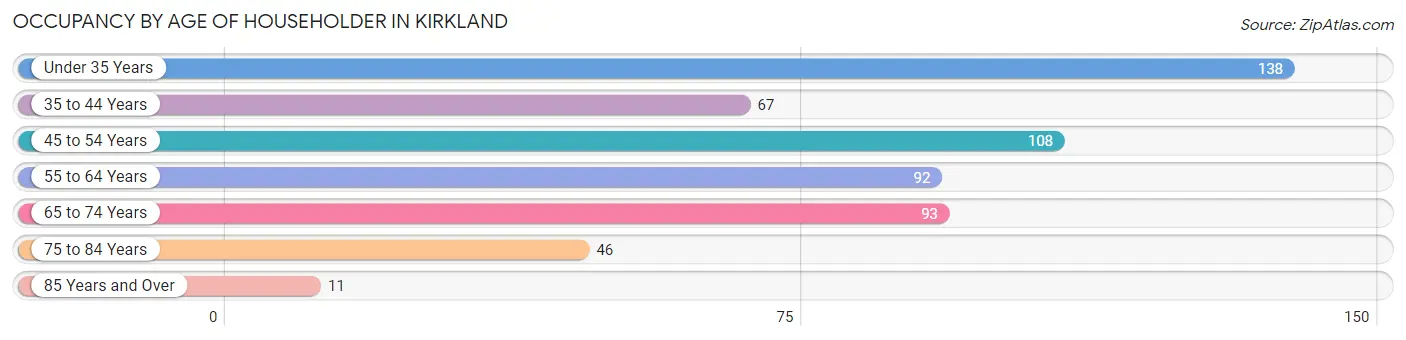
| Age Bracket | # Households | % Households |
| Under 35 Years | 138 | 24.9% |
| 35 to 44 Years | 67 | 12.1% |
| 45 to 54 Years | 108 | 19.5% |
| 55 to 64 Years | 92 | 16.6% |
| 65 to 74 Years | 93 | 16.8% |
| 75 to 84 Years | 46 | 8.3% |
| 85 Years and Over | 11 | 2.0% |
| Total | 555 | 100.0% |
Housing Finances in Kirkland
Median Income by Occupancy in Kirkland
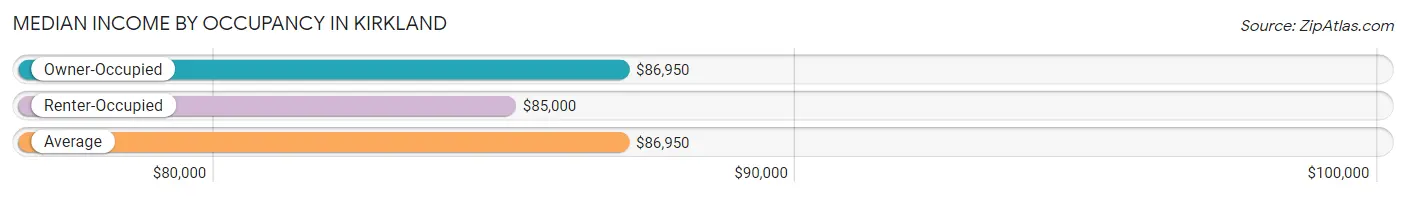
| Occupancy Type | # Households | Median Income |
| Owner-Occupied | 435 (78.4%) | $86,950 |
| Renter-Occupied | 120 (21.6%) | $85,000 |
| Average | 555 (100.0%) | $86,950 |
Occupancy by Householder Income Bracket in Kirkland
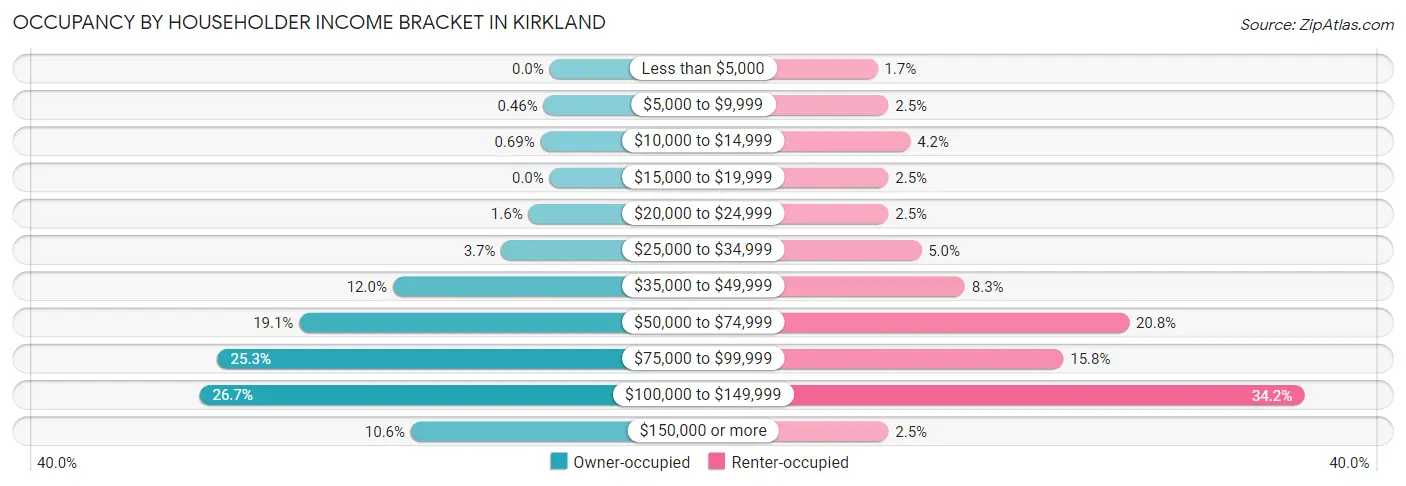
| Income Bracket | Owner-occupied | Renter-occupied |
| Less than $5,000 | 0 (0.0%) | 2 (1.7%) |
| $5,000 to $9,999 | 2 (0.5%) | 3 (2.5%) |
| $10,000 to $14,999 | 3 (0.7%) | 5 (4.2%) |
| $15,000 to $19,999 | 0 (0.0%) | 3 (2.5%) |
| $20,000 to $24,999 | 7 (1.6%) | 3 (2.5%) |
| $25,000 to $34,999 | 16 (3.7%) | 6 (5.0%) |
| $35,000 to $49,999 | 52 (11.9%) | 10 (8.3%) |
| $50,000 to $74,999 | 83 (19.1%) | 25 (20.8%) |
| $75,000 to $99,999 | 110 (25.3%) | 19 (15.8%) |
| $100,000 to $149,999 | 116 (26.7%) | 41 (34.2%) |
| $150,000 or more | 46 (10.6%) | 3 (2.5%) |
| Total | 435 (100.0%) | 120 (100.0%) |
Monthly Housing Cost Tiers in Kirkland
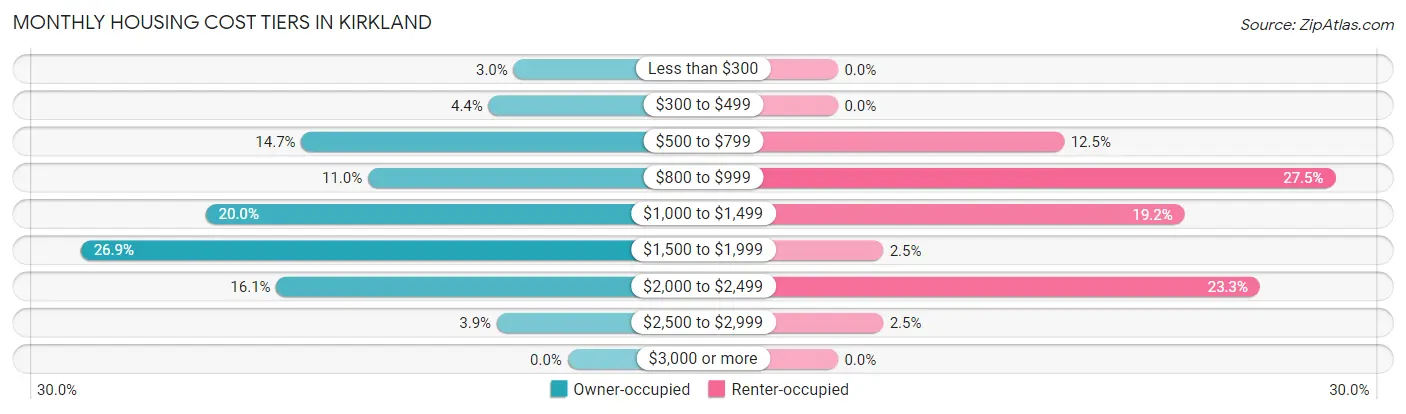
| Monthly Cost | Owner-occupied | Renter-occupied |
| Less than $300 | 13 (3.0%) | 0 (0.0%) |
| $300 to $499 | 19 (4.4%) | 0 (0.0%) |
| $500 to $799 | 64 (14.7%) | 15 (12.5%) |
| $800 to $999 | 48 (11.0%) | 33 (27.5%) |
| $1,000 to $1,499 | 87 (20.0%) | 23 (19.2%) |
| $1,500 to $1,999 | 117 (26.9%) | 3 (2.5%) |
| $2,000 to $2,499 | 70 (16.1%) | 28 (23.3%) |
| $2,500 to $2,999 | 17 (3.9%) | 3 (2.5%) |
| $3,000 or more | 0 (0.0%) | 0 (0.0%) |
| Total | 435 (100.0%) | 120 (100.0%) |
Physical Housing Characteristics in Kirkland
Housing Structures in Kirkland
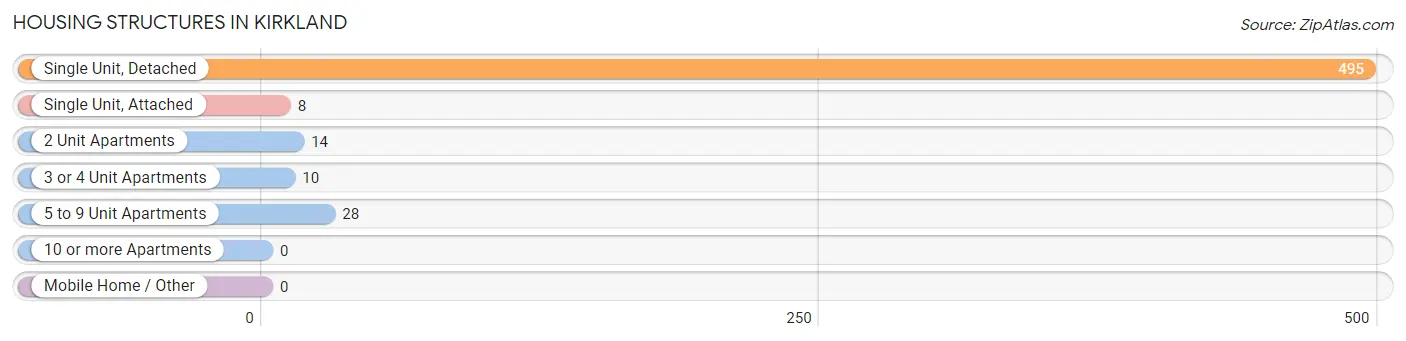
| Structure Type | # Housing Units | % Housing Units |
| Single Unit, Detached | 495 | 89.2% |
| Single Unit, Attached | 8 | 1.4% |
| 2 Unit Apartments | 14 | 2.5% |
| 3 or 4 Unit Apartments | 10 | 1.8% |
| 5 to 9 Unit Apartments | 28 | 5.1% |
| 10 or more Apartments | 0 | 0.0% |
| Mobile Home / Other | 0 | 0.0% |
| Total | 555 | 100.0% |
Housing Structures by Occupancy in Kirkland
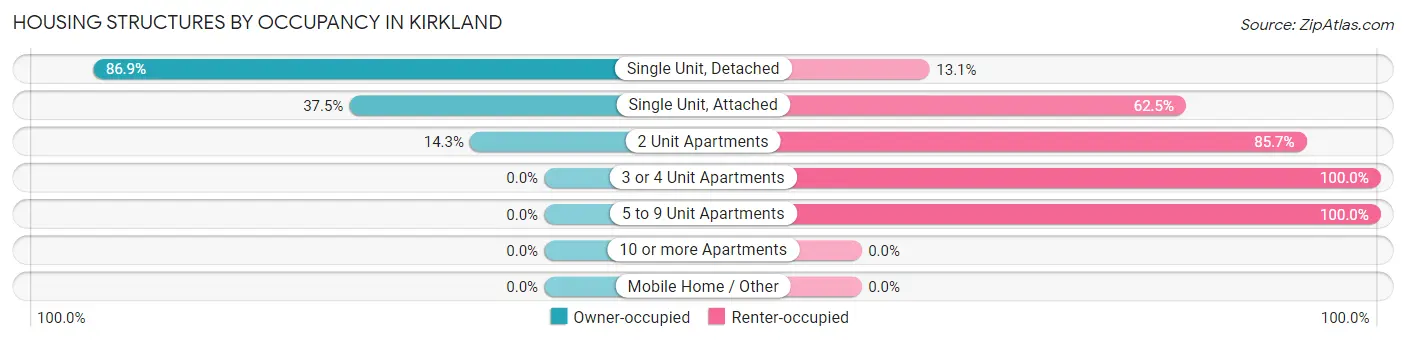
| Structure Type | Owner-occupied | Renter-occupied |
| Single Unit, Detached | 430 (86.9%) | 65 (13.1%) |
| Single Unit, Attached | 3 (37.5%) | 5 (62.5%) |
| 2 Unit Apartments | 2 (14.3%) | 12 (85.7%) |
| 3 or 4 Unit Apartments | 0 (0.0%) | 10 (100.0%) |
| 5 to 9 Unit Apartments | 0 (0.0%) | 28 (100.0%) |
| 10 or more Apartments | 0 (0.0%) | 0 (0.0%) |
| Mobile Home / Other | 0 (0.0%) | 0 (0.0%) |
| Total | 435 (78.4%) | 120 (21.6%) |
Housing Structures by Number of Rooms in Kirkland
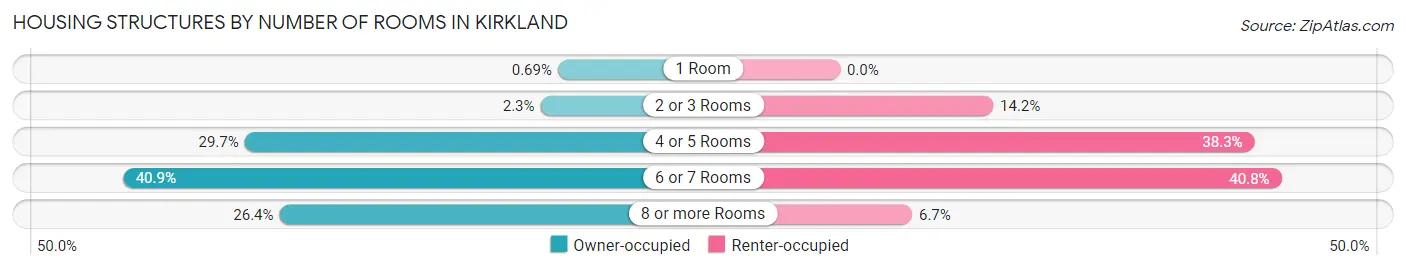
| Number of Rooms | Owner-occupied | Renter-occupied |
| 1 Room | 3 (0.7%) | 0 (0.0%) |
| 2 or 3 Rooms | 10 (2.3%) | 17 (14.2%) |
| 4 or 5 Rooms | 129 (29.7%) | 46 (38.3%) |
| 6 or 7 Rooms | 178 (40.9%) | 49 (40.8%) |
| 8 or more Rooms | 115 (26.4%) | 8 (6.7%) |
| Total | 435 (100.0%) | 120 (100.0%) |
Housing Structure by Heating Type in Kirkland
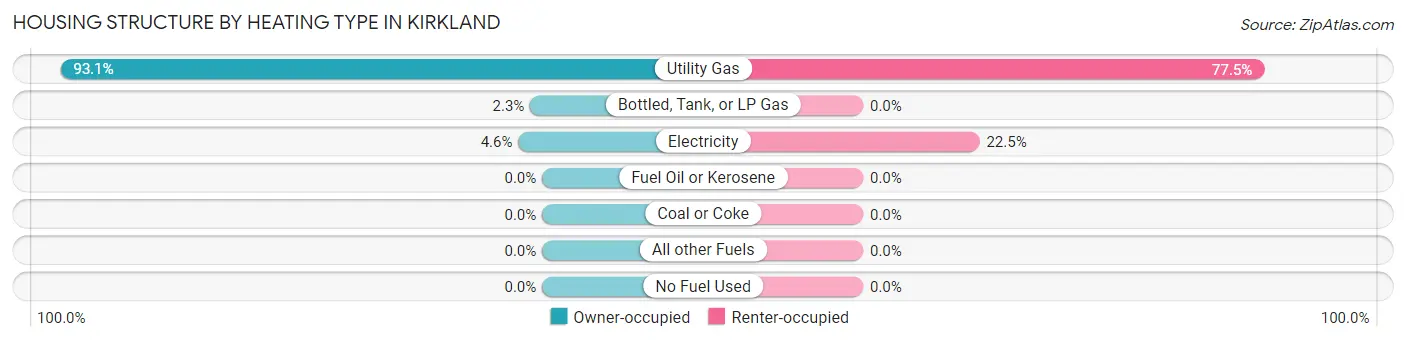
| Heating Type | Owner-occupied | Renter-occupied |
| Utility Gas | 405 (93.1%) | 93 (77.5%) |
| Bottled, Tank, or LP Gas | 10 (2.3%) | 0 (0.0%) |
| Electricity | 20 (4.6%) | 27 (22.5%) |
| Fuel Oil or Kerosene | 0 (0.0%) | 0 (0.0%) |
| Coal or Coke | 0 (0.0%) | 0 (0.0%) |
| All other Fuels | 0 (0.0%) | 0 (0.0%) |
| No Fuel Used | 0 (0.0%) | 0 (0.0%) |
| Total | 435 (100.0%) | 120 (100.0%) |
Household Vehicle Usage in Kirkland
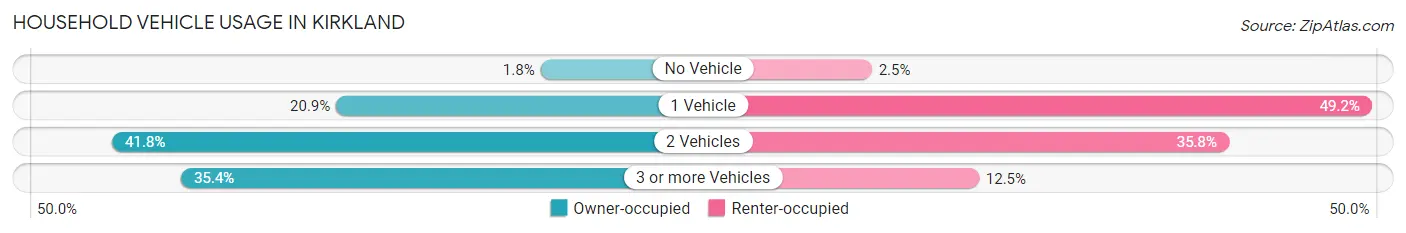
| Vehicles per Household | Owner-occupied | Renter-occupied |
| No Vehicle | 8 (1.8%) | 3 (2.5%) |
| 1 Vehicle | 91 (20.9%) | 59 (49.2%) |
| 2 Vehicles | 182 (41.8%) | 43 (35.8%) |
| 3 or more Vehicles | 154 (35.4%) | 15 (12.5%) |
| Total | 435 (100.0%) | 120 (100.0%) |
Real Estate & Mortgages in Kirkland
Real Estate and Mortgage Overview in Kirkland
| Characteristic | Without Mortgage | With Mortgage |
| Housing Units | 137 | 298 |
| Median Property Value | $169,900 | $181,100 |
| Median Household Income | $63,125 | $39 |
| Monthly Housing Costs | $602 | $0 |
| Real Estate Taxes | $3,883 | $0 |
Property Value by Mortgage Status in Kirkland
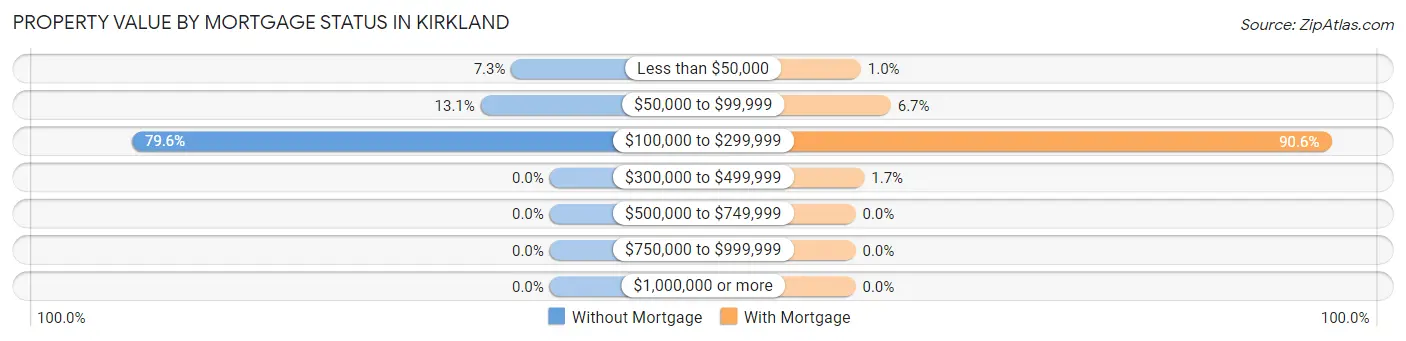
| Property Value | Without Mortgage | With Mortgage |
| Less than $50,000 | 10 (7.3%) | 3 (1.0%) |
| $50,000 to $99,999 | 18 (13.1%) | 20 (6.7%) |
| $100,000 to $299,999 | 109 (79.6%) | 270 (90.6%) |
| $300,000 to $499,999 | 0 (0.0%) | 5 (1.7%) |
| $500,000 to $749,999 | 0 (0.0%) | 0 (0.0%) |
| $750,000 to $999,999 | 0 (0.0%) | 0 (0.0%) |
| $1,000,000 or more | 0 (0.0%) | 0 (0.0%) |
| Total | 137 (100.0%) | 298 (100.0%) |
Household Income by Mortgage Status in Kirkland
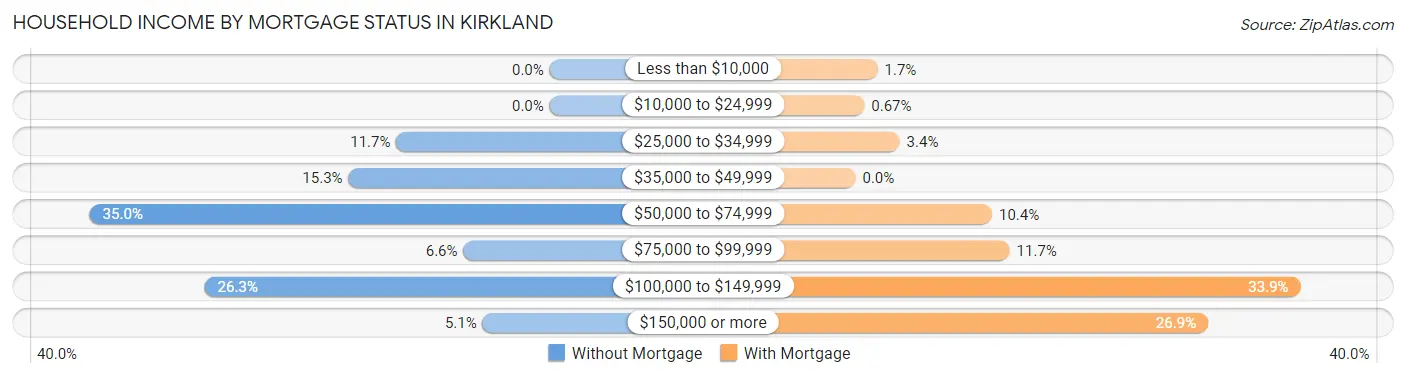
| Household Income | Without Mortgage | With Mortgage |
| Less than $10,000 | 0 (0.0%) | 5 (1.7%) |
| $10,000 to $24,999 | 0 (0.0%) | 2 (0.7%) |
| $25,000 to $34,999 | 16 (11.7%) | 10 (3.4%) |
| $35,000 to $49,999 | 21 (15.3%) | 0 (0.0%) |
| $50,000 to $74,999 | 48 (35.0%) | 31 (10.4%) |
| $75,000 to $99,999 | 9 (6.6%) | 35 (11.7%) |
| $100,000 to $149,999 | 36 (26.3%) | 101 (33.9%) |
| $150,000 or more | 7 (5.1%) | 80 (26.9%) |
| Total | 137 (100.0%) | 298 (100.0%) |
Property Value to Household Income Ratio in Kirkland
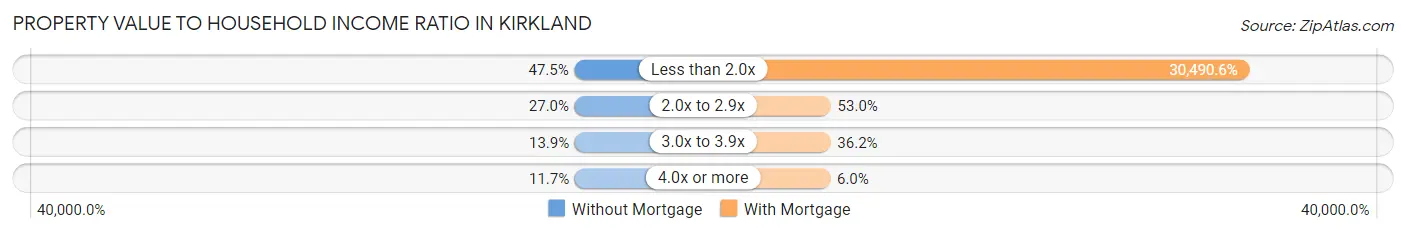
| Value-to-Income Ratio | Without Mortgage | With Mortgage |
| Less than 2.0x | 65 (47.4%) | 90,862 (30,490.6%) |
| 2.0x to 2.9x | 37 (27.0%) | 158 (53.0%) |
| 3.0x to 3.9x | 19 (13.9%) | 108 (36.2%) |
| 4.0x or more | 16 (11.7%) | 18 (6.0%) |
| Total | 137 (100.0%) | 298 (100.0%) |
Real Estate Taxes by Mortgage Status in Kirkland
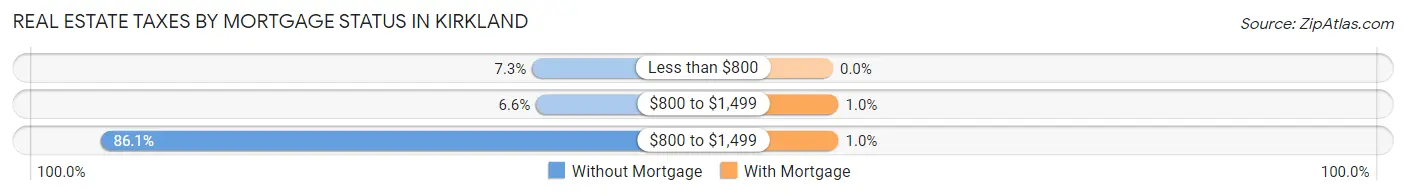
| Property Taxes | Without Mortgage | With Mortgage |
| Less than $800 | 10 (7.3%) | 0 (0.0%) |
| $800 to $1,499 | 9 (6.6%) | 3 (1.0%) |
| $800 to $1,499 | 118 (86.1%) | 3 (1.0%) |
| Total | 137 (100.0%) | 298 (100.0%) |
Health & Disability in Kirkland
Health Insurance Coverage by Age in Kirkland
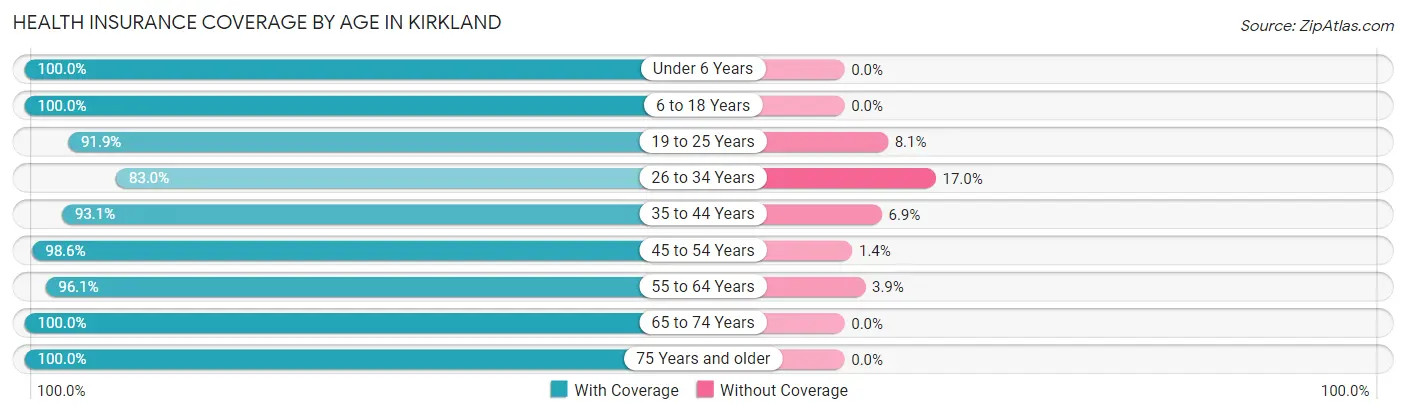
| Age Bracket | With Coverage | Without Coverage |
| Under 6 Years | 106 (100.0%) | 0 (0.0%) |
| 6 to 18 Years | 280 (100.0%) | 0 (0.0%) |
| 19 to 25 Years | 125 (91.9%) | 11 (8.1%) |
| 26 to 34 Years | 195 (83.0%) | 40 (17.0%) |
| 35 to 44 Years | 134 (93.1%) | 10 (6.9%) |
| 45 to 54 Years | 205 (98.6%) | 3 (1.4%) |
| 55 to 64 Years | 149 (96.1%) | 6 (3.9%) |
| 65 to 74 Years | 158 (100.0%) | 0 (0.0%) |
| 75 Years and older | 71 (100.0%) | 0 (0.0%) |
| Total | 1,423 (95.3%) | 70 (4.7%) |
Health Insurance Coverage by Citizenship Status in Kirkland
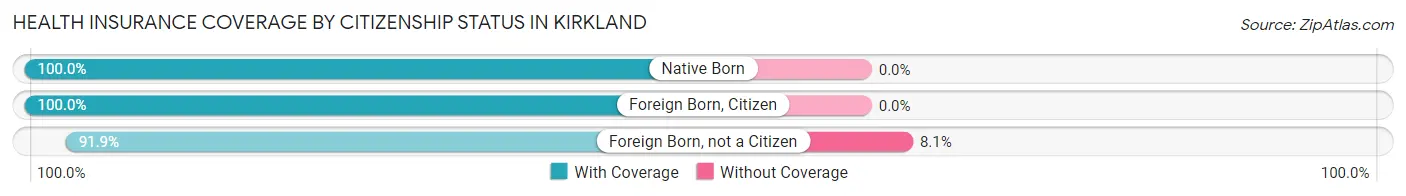
| Citizenship Status | With Coverage | Without Coverage |
| Native Born | 106 (100.0%) | 0 (0.0%) |
| Foreign Born, Citizen | 280 (100.0%) | 0 (0.0%) |
| Foreign Born, not a Citizen | 125 (91.9%) | 11 (8.1%) |
Health Insurance Coverage by Household Income in Kirkland
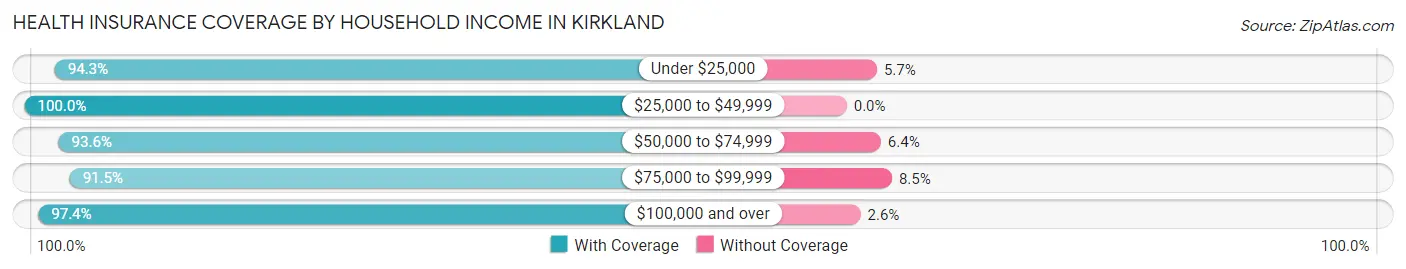
| Household Income | With Coverage | Without Coverage |
| Under $25,000 | 50 (94.3%) | 3 (5.7%) |
| $25,000 to $49,999 | 152 (100.0%) | 0 (0.0%) |
| $50,000 to $74,999 | 249 (93.6%) | 17 (6.4%) |
| $75,000 to $99,999 | 368 (91.5%) | 34 (8.5%) |
| $100,000 and over | 604 (97.4%) | 16 (2.6%) |
Public vs Private Health Insurance Coverage by Age in Kirkland
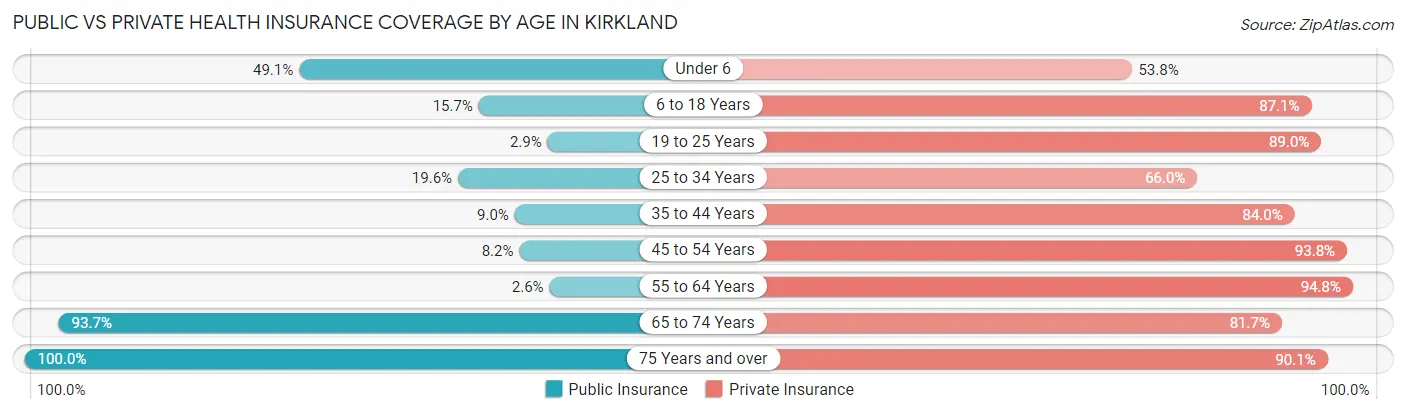
| Age Bracket | Public Insurance | Private Insurance |
| Under 6 | 52 (49.1%) | 57 (53.8%) |
| 6 to 18 Years | 44 (15.7%) | 244 (87.1%) |
| 19 to 25 Years | 4 (2.9%) | 121 (89.0%) |
| 25 to 34 Years | 46 (19.6%) | 155 (66.0%) |
| 35 to 44 Years | 13 (9.0%) | 121 (84.0%) |
| 45 to 54 Years | 17 (8.2%) | 195 (93.8%) |
| 55 to 64 Years | 4 (2.6%) | 147 (94.8%) |
| 65 to 74 Years | 148 (93.7%) | 129 (81.7%) |
| 75 Years and over | 71 (100.0%) | 64 (90.1%) |
| Total | 399 (26.7%) | 1,233 (82.6%) |
Disability Status by Sex by Age in Kirkland
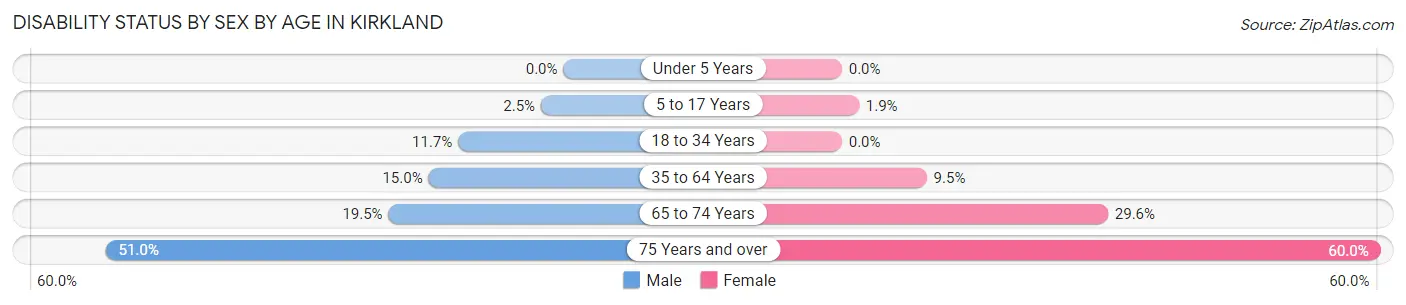
| Age Bracket | Male | Female |
| Under 5 Years | 0 (0.0%) | 0 (0.0%) |
| 5 to 17 Years | 3 (2.5%) | 3 (1.9%) |
| 18 to 34 Years | 28 (11.7%) | 0 (0.0%) |
| 35 to 64 Years | 38 (15.0%) | 24 (9.5%) |
| 65 to 74 Years | 15 (19.5%) | 24 (29.6%) |
| 75 Years and over | 26 (51.0%) | 12 (60.0%) |
Disability Class by Sex by Age in Kirkland
Disability Class: Hearing Difficulty
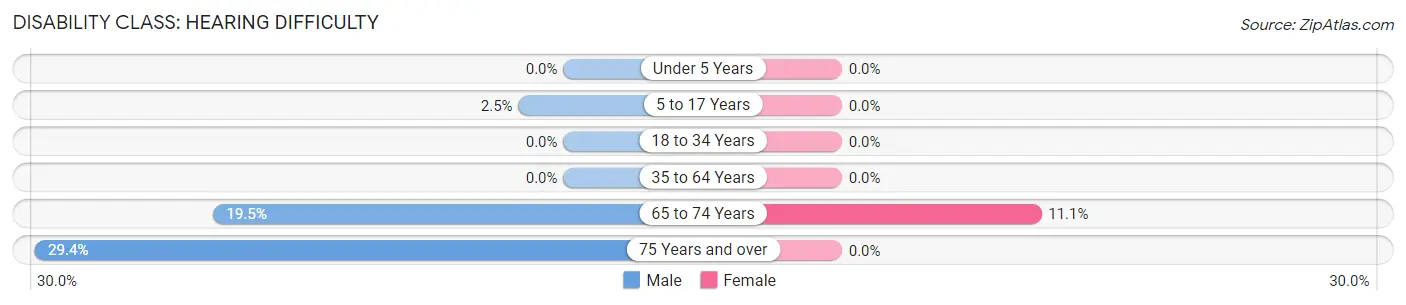
| Age Bracket | Male | Female |
| Under 5 Years | 0 (0.0%) | 0 (0.0%) |
| 5 to 17 Years | 3 (2.5%) | 0 (0.0%) |
| 18 to 34 Years | 0 (0.0%) | 0 (0.0%) |
| 35 to 64 Years | 0 (0.0%) | 0 (0.0%) |
| 65 to 74 Years | 15 (19.5%) | 9 (11.1%) |
| 75 Years and over | 15 (29.4%) | 0 (0.0%) |
Disability Class: Vision Difficulty
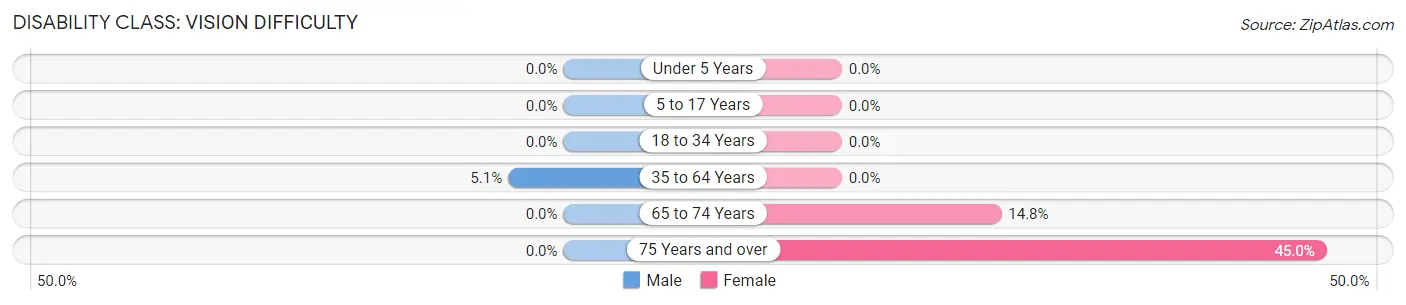
| Age Bracket | Male | Female |
| Under 5 Years | 0 (0.0%) | 0 (0.0%) |
| 5 to 17 Years | 0 (0.0%) | 0 (0.0%) |
| 18 to 34 Years | 0 (0.0%) | 0 (0.0%) |
| 35 to 64 Years | 13 (5.1%) | 0 (0.0%) |
| 65 to 74 Years | 0 (0.0%) | 12 (14.8%) |
| 75 Years and over | 0 (0.0%) | 9 (45.0%) |
Disability Class: Cognitive Difficulty
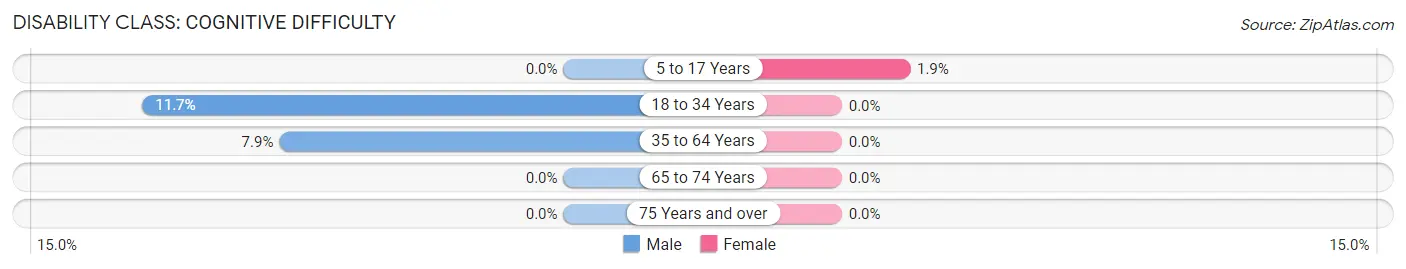
| Age Bracket | Male | Female |
| 5 to 17 Years | 0 (0.0%) | 3 (1.9%) |
| 18 to 34 Years | 28 (11.7%) | 0 (0.0%) |
| 35 to 64 Years | 20 (7.9%) | 0 (0.0%) |
| 65 to 74 Years | 0 (0.0%) | 0 (0.0%) |
| 75 Years and over | 0 (0.0%) | 0 (0.0%) |
Disability Class: Ambulatory Difficulty
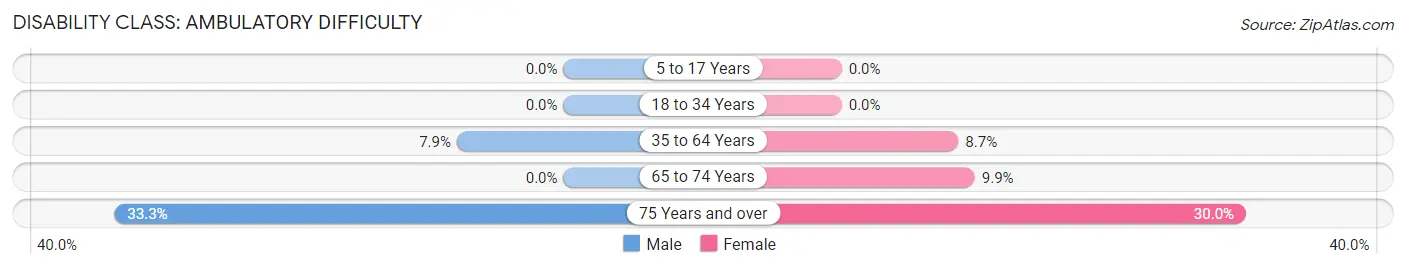
| Age Bracket | Male | Female |
| 5 to 17 Years | 0 (0.0%) | 0 (0.0%) |
| 18 to 34 Years | 0 (0.0%) | 0 (0.0%) |
| 35 to 64 Years | 20 (7.9%) | 22 (8.7%) |
| 65 to 74 Years | 0 (0.0%) | 8 (9.9%) |
| 75 Years and over | 17 (33.3%) | 6 (30.0%) |
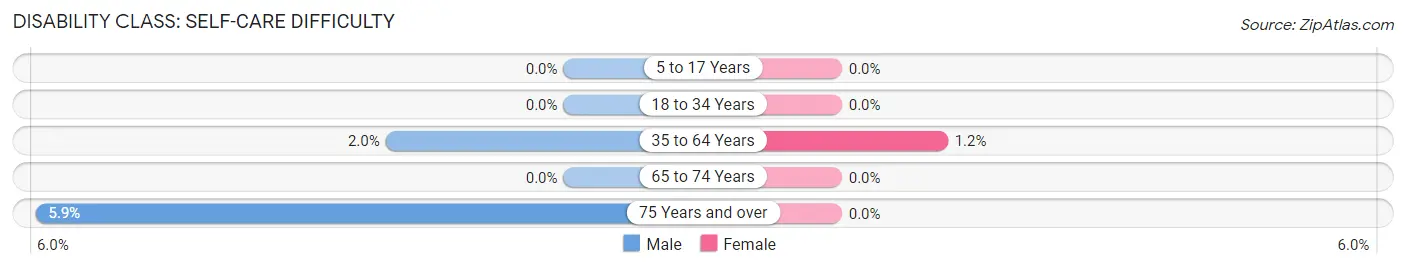
Disability Class: Self-Care Difficulty
| Age Bracket | Male | Female |
| 5 to 17 Years | 0 (0.0%) | 0 (0.0%) |
| 18 to 34 Years | 0 (0.0%) | 0 (0.0%) |
| 35 to 64 Years | 5 (2.0%) | 3 (1.2%) |
| 65 to 74 Years | 0 (0.0%) | 0 (0.0%) |
| 75 Years and over | 3 (5.9%) | 0 (0.0%) |
Technology Access in Kirkland
Computing Device Access in Kirkland
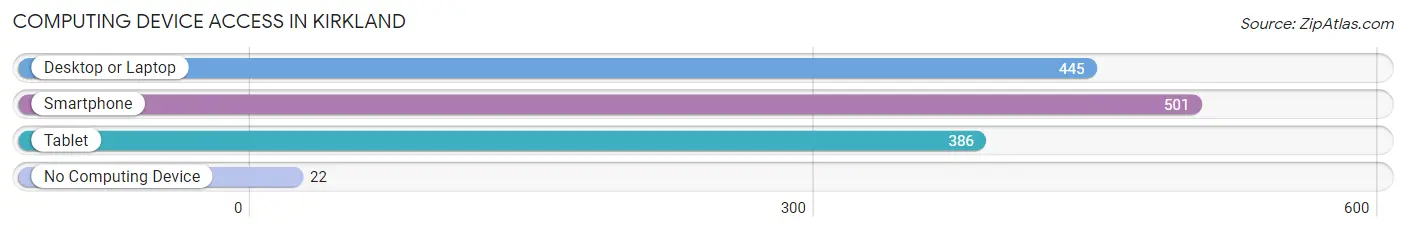
| Device Type | # Households | % Households |
| Desktop or Laptop | 445 | 80.2% |
| Smartphone | 501 | 90.3% |
| Tablet | 386 | 69.6% |
| No Computing Device | 22 | 4.0% |
| Total | 555 | 100.0% |
Internet Access in Kirkland
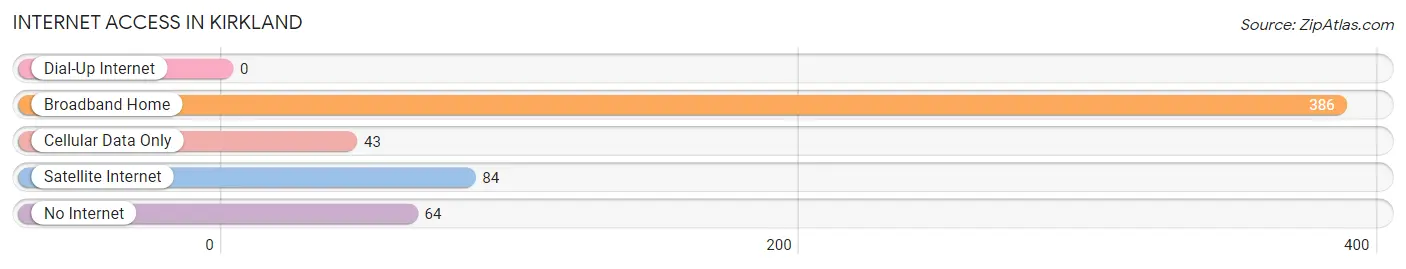
| Internet Type | # Households | % Households |
| Dial-Up Internet | 0 | 0.0% |
| Broadband Home | 386 | 69.6% |
| Cellular Data Only | 43 | 7.7% |
| Satellite Internet | 84 | 15.1% |
| No Internet | 64 | 11.5% |
| Total | 555 | 100.0% |
Kirkland Summary
Kirkland, Illinois is a small village located in DeKalb County, Illinois. It is situated about 40 miles west of Chicago and is part of the DeKalb-Sycamore Metropolitan Statistical Area. The village has a population of 1,845 people, according to the 2010 census.
History
Kirkland was founded in 1856 by a group of settlers from New York. The village was named after the Kirkland family, who were among the first settlers. The village was incorporated in 1867.
In the late 19th century, Kirkland was a thriving agricultural community. The village was home to several grain elevators, a creamery, a cheese factory, and a canning factory. The village also had a railroad station, which connected it to the rest of the country.
In the early 20th century, the village began to decline as the railroad station closed and the agricultural industry shifted away from the area. The village was able to survive, however, due to its proximity to Chicago.
Geography
Kirkland is located in the northern part of DeKalb County, Illinois. It is situated about 40 miles west of Chicago and is part of the DeKalb-Sycamore Metropolitan Statistical Area. The village is located on the banks of the Kishwaukee River.
The village has a total area of 0.9 square miles, all of which is land. The village is located in a flat, open area with few trees.
Economy
Kirkland’s economy is largely based on agriculture. The village is home to several farms, which produce corn, soybeans, and other crops. The village also has a few small businesses, including a grocery store, a hardware store, and a few restaurants.
The village is also home to a few manufacturing companies, including a plastics manufacturer and a metal fabrication company.
Demographics
According to the 2010 census, Kirkland has a population of 1,845 people. The village has a median household income of $50,000 and a median home value of $150,000.
The village is predominantly white, with 92.3% of the population identifying as white. The remaining population is made up of African Americans (3.2%), Hispanics (2.2%), and Asians (1.3%).
Kirkland is a small, rural village with a strong sense of community. The village is home to several churches, a library, and a few parks. The village also has a few annual events, including a Fourth of July parade and a Christmas tree lighting ceremony.
Common Questions
What is Per Capita Income in Kirkland?
Per Capita income in Kirkland is $34,159.
What is the Median Family Income in Kirkland?
Median Family Income in Kirkland is $85,658.
What is the Median Household income in Kirkland?
Median Household Income in Kirkland is $86,950.
What is Income or Wage Gap in Kirkland?
Income or Wage Gap in Kirkland is 47.9%.
Women in Kirkland earn 52.1 cents for every dollar earned by a man.
What is Inequality or Gini Index in Kirkland?
Inequality or Gini Index in Kirkland is 0.29.
What is the Total Population of Kirkland?
Total Population of Kirkland is 1,493.
What is the Total Male Population of Kirkland?
Total Male Population of Kirkland is 776.
What is the Total Female Population of Kirkland?
Total Female Population of Kirkland is 717.
What is the Ratio of Males per 100 Females in Kirkland?
There are 108.23 Males per 100 Females in Kirkland.
What is the Ratio of Females per 100 Males in Kirkland?
There are 92.40 Females per 100 Males in Kirkland.
What is the Median Population Age in Kirkland?
Median Population Age in Kirkland is 34.8 Years.
What is the Average Family Size in Kirkland
Average Family Size in Kirkland is 3.1 People.
What is the Average Household Size in Kirkland
Average Household Size in Kirkland is 2.7 People.
How Large is the Labor Force in Kirkland?
There are 825 People in the Labor Forcein in Kirkland.
What is the Percentage of People in the Labor Force in Kirkland?
70.3% of People are in the Labor Force in Kirkland.
What is the Unemployment Rate in Kirkland?
Unemployment Rate in Kirkland is 4.4%.