Kincaid, IL Map & Demographics
Kincaid Map
Kincaid Overview
$39,565
PER CAPITA INCOME
$95,417
AVG FAMILY INCOME
$63,810
AVG HOUSEHOLD INCOME
46.1%
WAGE / INCOME GAP [ % ]
53.9¢/ $1
WAGE / INCOME GAP [ $ ]
0.46
INEQUALITY / GINI INDEX
1,146
TOTAL POPULATION
579
MALE POPULATION
567
FEMALE POPULATION
102.12
MALES / 100 FEMALES
97.93
FEMALES / 100 MALES
54.1
MEDIAN AGE
2.7
AVG FAMILY SIZE
2.0
AVG HOUSEHOLD SIZE
600
LABOR FORCE [ PEOPLE ]
57.8%
PERCENT IN LABOR FORCE
3.9%
UNEMPLOYMENT RATE
Kincaid Zip Codes
Kincaid Area Codes
Income in Kincaid
Income Overview in Kincaid
Per Capita Income in Kincaid is $39,565, while median incomes of families and households are $95,417 and $63,810 respectively.
| Characteristic | Number | Measure |
| Per Capita Income | 1,146 | $39,565 |
| Median Family Income | 288 | $95,417 |
| Mean Family Income | 288 | $103,785 |
| Median Household Income | 572 | $63,810 |
| Mean Household Income | 572 | $75,862 |
| Income Deficit | 288 | $0 |
| Wage / Income Gap (%) | 1,146 | 46.06% |
| Wage / Income Gap ($) | 1,146 | 53.94¢ per $1 |
| Gini / Inequality Index | 1,146 | 0.46 |
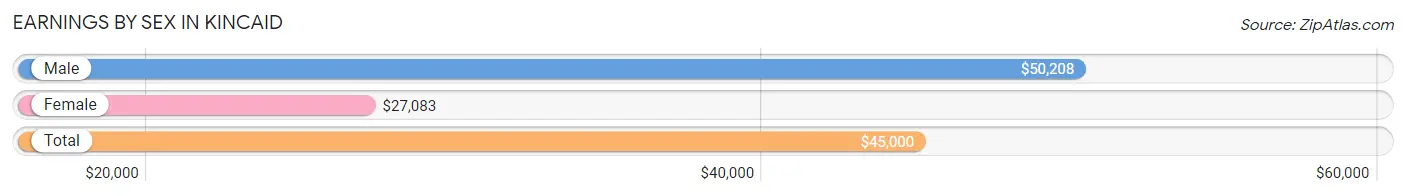
Earnings by Sex in Kincaid
Average Earnings in Kincaid are $45,000, $50,208 for men and $27,083 for women, a difference of 46.1%.
| Sex | Number | Average Earnings |
| Male | 403 (65.0%) | $50,208 |
| Female | 217 (35.0%) | $27,083 |
| Total | 620 (100.0%) | $45,000 |
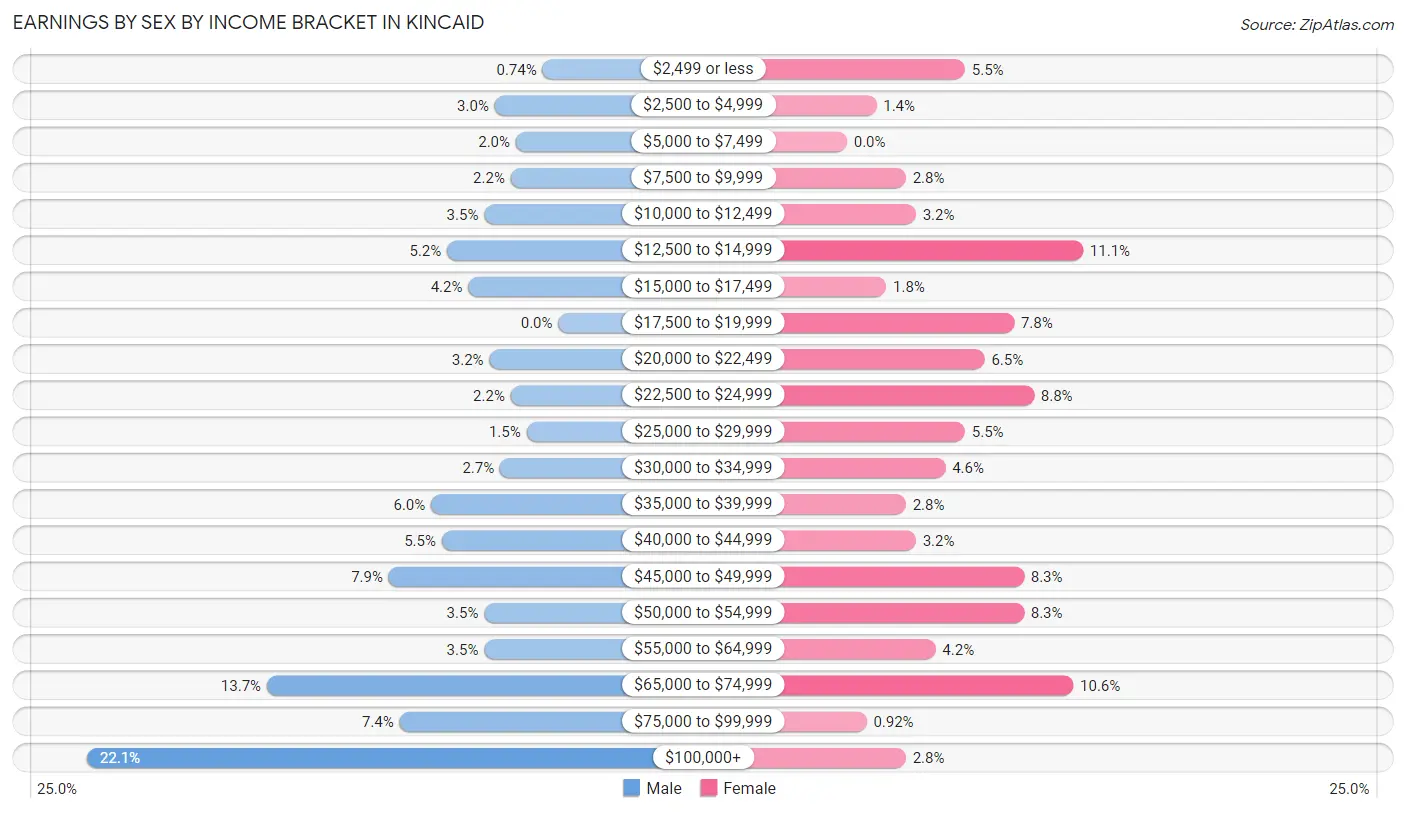
Earnings by Sex by Income Bracket in Kincaid
The most common earnings brackets in Kincaid are $100,000+ for men (89 | 22.1%) and $12,500 to $14,999 for women (24 | 11.1%).
| Income | Male | Female |
| $2,499 or less | 3 (0.7%) | 12 (5.5%) |
| $2,500 to $4,999 | 12 (3.0%) | 3 (1.4%) |
| $5,000 to $7,499 | 8 (2.0%) | 0 (0.0%) |
| $7,500 to $9,999 | 9 (2.2%) | 6 (2.8%) |
| $10,000 to $12,499 | 14 (3.5%) | 7 (3.2%) |
| $12,500 to $14,999 | 21 (5.2%) | 24 (11.1%) |
| $15,000 to $17,499 | 17 (4.2%) | 4 (1.8%) |
| $17,500 to $19,999 | 0 (0.0%) | 17 (7.8%) |
| $20,000 to $22,499 | 13 (3.2%) | 14 (6.5%) |
| $22,500 to $24,999 | 9 (2.2%) | 19 (8.8%) |
| $25,000 to $29,999 | 6 (1.5%) | 12 (5.5%) |
| $30,000 to $34,999 | 11 (2.7%) | 10 (4.6%) |
| $35,000 to $39,999 | 24 (6.0%) | 6 (2.8%) |
| $40,000 to $44,999 | 22 (5.5%) | 7 (3.2%) |
| $45,000 to $49,999 | 32 (7.9%) | 18 (8.3%) |
| $50,000 to $54,999 | 14 (3.5%) | 18 (8.3%) |
| $55,000 to $64,999 | 14 (3.5%) | 9 (4.2%) |
| $65,000 to $74,999 | 55 (13.7%) | 23 (10.6%) |
| $75,000 to $99,999 | 30 (7.4%) | 2 (0.9%) |
| $100,000+ | 89 (22.1%) | 6 (2.8%) |
| Total | 403 (100.0%) | 217 (100.0%) |
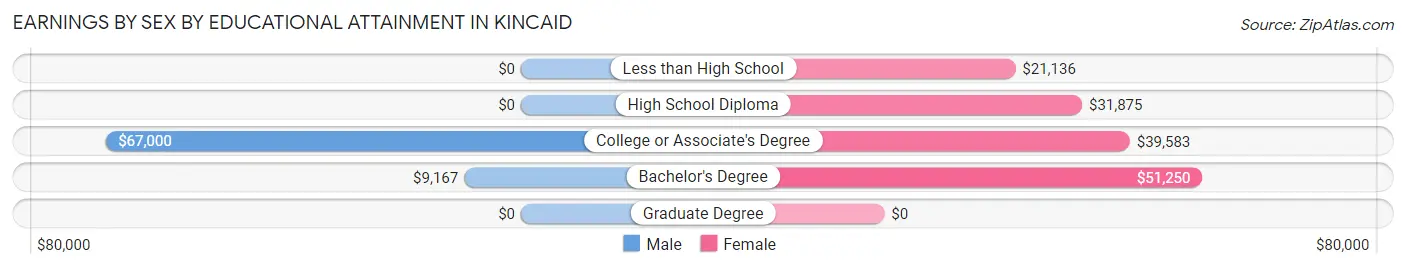
Earnings by Sex by Educational Attainment in Kincaid
Average earnings in Kincaid are $66,750 for men and $38,750 for women, a difference of 41.9%. Men with an educational attainment of college or associate's degree enjoy the highest average annual earnings of $67,000, while those with bachelor's degree education earn the least with $9,167. Women with an educational attainment of bachelor's degree earn the most with the average annual earnings of $51,250, while those with less than high school education have the smallest earnings of $21,136.
| Educational Attainment | Male Income | Female Income |
| Less than High School | - | - |
| High School Diploma | - | - |
| College or Associate's Degree | $67,000 | $39,583 |
| Bachelor's Degree | $9,167 | $51,250 |
| Graduate Degree | - | - |
| Total | $66,750 | $38,750 |
Family Income in Kincaid
Family Income Brackets in Kincaid
According to the Kincaid family income data, there are 65 families falling into the $100,000 to $149,999 income range, which is the most common income bracket and makes up 22.6% of all families.
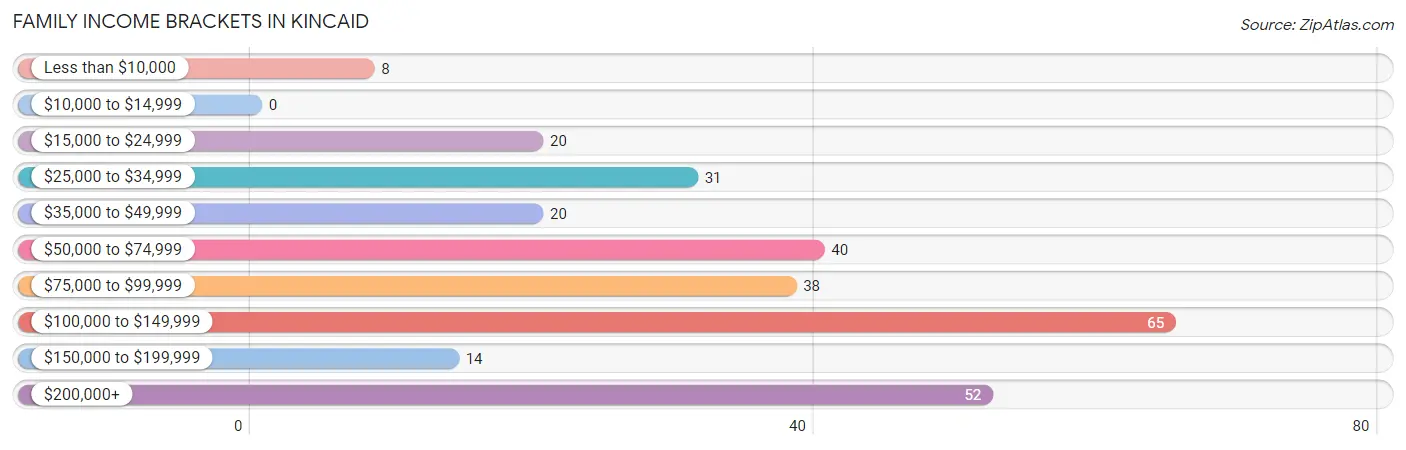
| Income Bracket | # Families | % Families |
| Less than $10,000 | 8 | 2.8% |
| $10,000 to $14,999 | 0 | 0.0% |
| $15,000 to $24,999 | 20 | 6.9% |
| $25,000 to $34,999 | 31 | 10.8% |
| $35,000 to $49,999 | 20 | 6.9% |
| $50,000 to $74,999 | 40 | 13.9% |
| $75,000 to $99,999 | 38 | 13.2% |
| $100,000 to $149,999 | 65 | 22.6% |
| $150,000 to $199,999 | 14 | 4.9% |
| $200,000+ | 52 | 18.1% |
Family Income by Famaliy Size in Kincaid
5-person families (11 | 3.8%) account for the highest median family income in Kincaid with $115,417 per family, while 2-person families (216 | 75.0%) have the highest median income of $48,229 per family member.
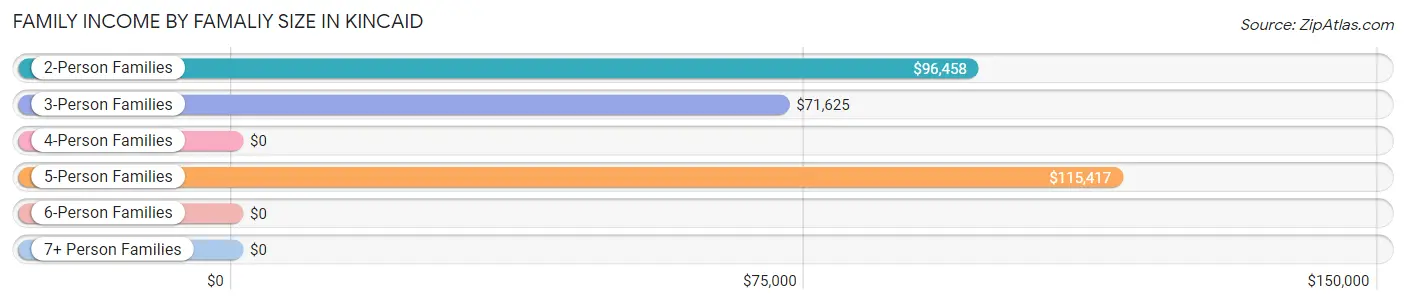
| Income Bracket | # Families | Median Income |
| 2-Person Families | 216 (75.0%) | $96,458 |
| 3-Person Families | 55 (19.1%) | $71,625 |
| 4-Person Families | 6 (2.1%) | $0 |
| 5-Person Families | 11 (3.8%) | $115,417 |
| 6-Person Families | 0 (0.0%) | $0 |
| 7+ Person Families | 0 (0.0%) | $0 |
| Total | 288 (100.0%) | $95,417 |
Family Income by Number of Earners in Kincaid
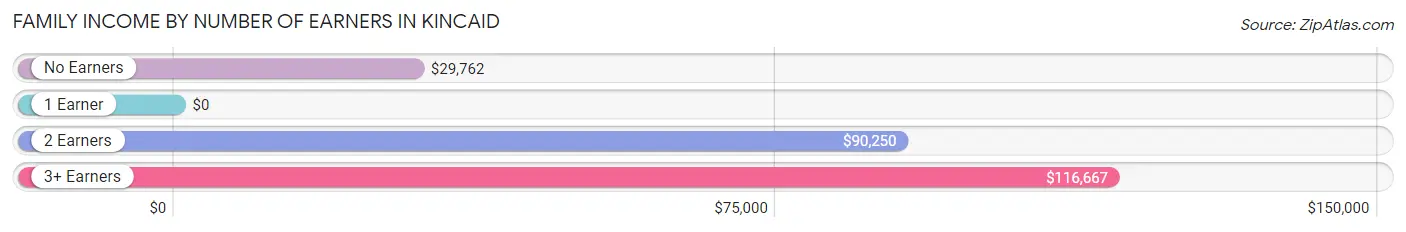
| Number of Earners | # Families | Median Income |
| No Earners | 66 (22.9%) | $29,762 |
| 1 Earner | 119 (41.3%) | $0 |
| 2 Earners | 83 (28.8%) | $90,250 |
| 3+ Earners | 20 (6.9%) | $116,667 |
| Total | 288 (100.0%) | $95,417 |
Household Income in Kincaid
Household Income Brackets in Kincaid
With 102 households falling in the category, the $50,000 to $74,999 income range is the most frequent in Kincaid, accounting for 17.8% of all households. In contrast, only 22 households (3.8%) fall into the $150,000 to $199,999 income bracket, making it the least populous group.
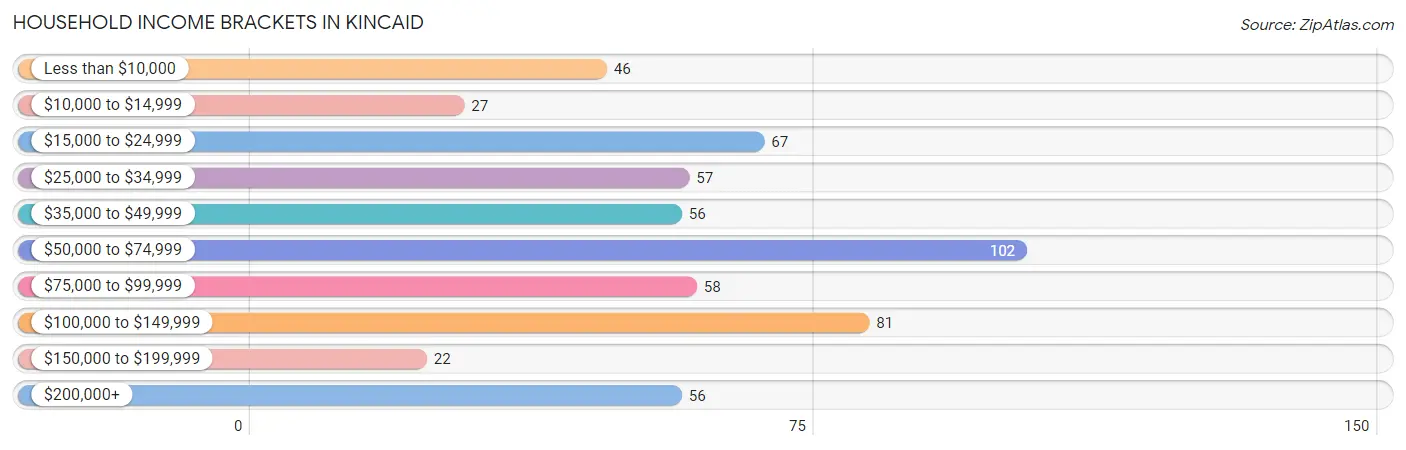
| Income Bracket | # Households | % Households |
| Less than $10,000 | 46 | 8.0% |
| $10,000 to $14,999 | 27 | 4.7% |
| $15,000 to $24,999 | 67 | 11.7% |
| $25,000 to $34,999 | 57 | 10.0% |
| $35,000 to $49,999 | 56 | 9.8% |
| $50,000 to $74,999 | 102 | 17.8% |
| $75,000 to $99,999 | 58 | 10.1% |
| $100,000 to $149,999 | 81 | 14.2% |
| $150,000 to $199,999 | 22 | 3.8% |
| $200,000+ | 56 | 9.8% |
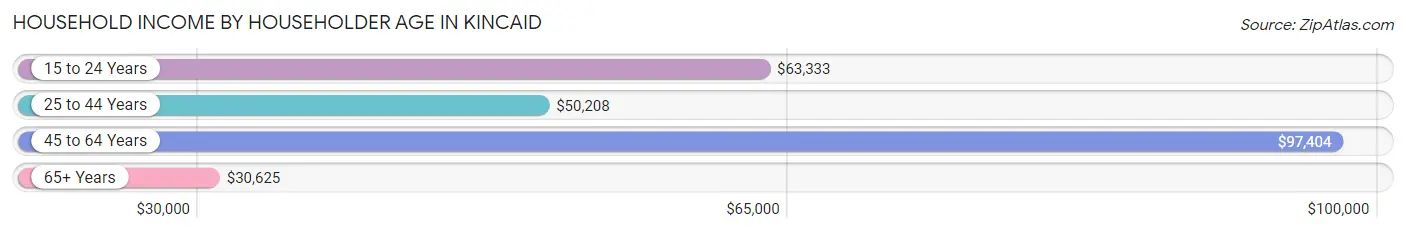
Household Income by Householder Age in Kincaid
The median household income in Kincaid is $63,810, with the highest median household income of $97,404 found in the 45 to 64 years age bracket for the primary householder. A total of 239 households (41.8%) fall into this category. Meanwhile, the 65+ years age bracket for the primary householder has the lowest median household income of $30,625, with 172 households (30.1%) in this group.
| Income Bracket | # Households | Median Income |
| 15 to 24 Years | 40 (7.0%) | $63,333 |
| 25 to 44 Years | 121 (21.1%) | $50,208 |
| 45 to 64 Years | 239 (41.8%) | $97,404 |
| 65+ Years | 172 (30.1%) | $30,625 |
| Total | 572 (100.0%) | $63,810 |
Poverty in Kincaid
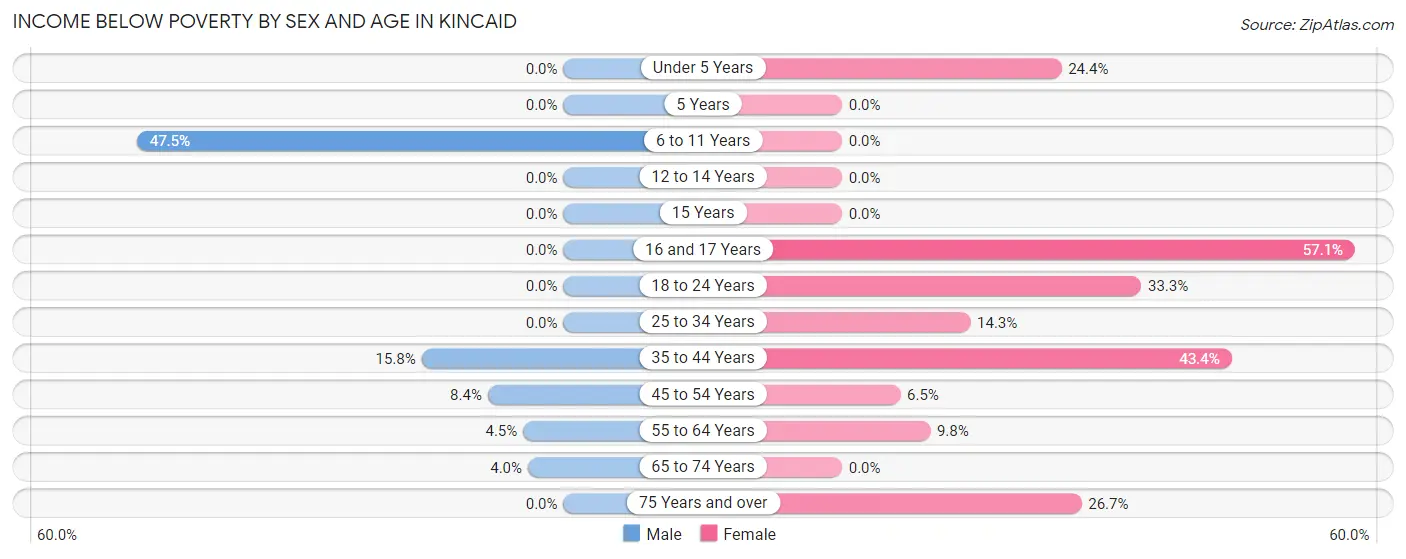
Income Below Poverty by Sex and Age in Kincaid
With 7.8% poverty level for males and 17.3% for females among the residents of Kincaid, 6 to 11 year old males and 16 and 17 year old females are the most vulnerable to poverty, with 19 males (47.5%) and 4 females (57.1%) in their respective age groups living below the poverty level.
| Age Bracket | Male | Female |
| Under 5 Years | 0 (0.0%) | 11 (24.4%) |
| 5 Years | 0 (0.0%) | 0 (0.0%) |
| 6 to 11 Years | 19 (47.5%) | 0 (0.0%) |
| 12 to 14 Years | 0 (0.0%) | 0 (0.0%) |
| 15 Years | 0 (0.0%) | 0 (0.0%) |
| 16 and 17 Years | 0 (0.0%) | 4 (57.1%) |
| 18 to 24 Years | 0 (0.0%) | 16 (33.3%) |
| 25 to 34 Years | 0 (0.0%) | 3 (14.3%) |
| 35 to 44 Years | 9 (15.8%) | 23 (43.4%) |
| 45 to 54 Years | 8 (8.4%) | 5 (6.5%) |
| 55 to 64 Years | 6 (4.5%) | 16 (9.8%) |
| 65 to 74 Years | 3 (4.0%) | 0 (0.0%) |
| 75 Years and over | 0 (0.0%) | 20 (26.7%) |
| Total | 45 (7.8%) | 98 (17.3%) |
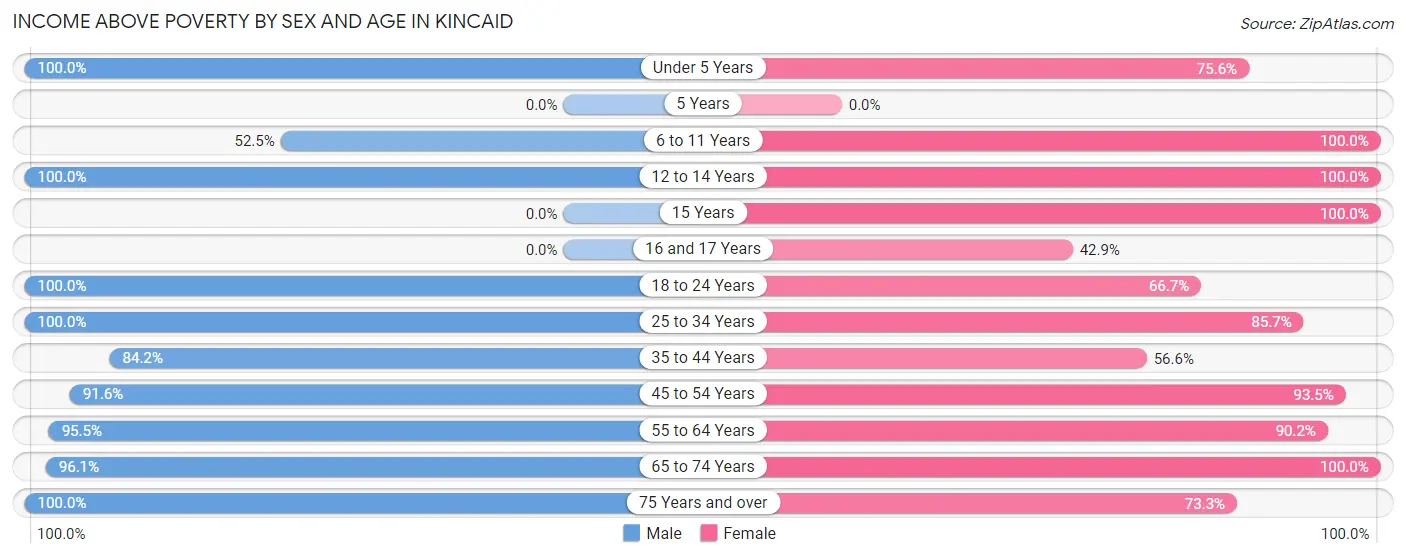
Income Above Poverty by Sex and Age in Kincaid
According to the poverty statistics in Kincaid, males aged under 5 years and females aged 6 to 11 years are the age groups that are most secure financially, with 100.0% of males and 100.0% of females in these age groups living above the poverty line.
| Age Bracket | Male | Female |
| Under 5 Years | 3 (100.0%) | 34 (75.6%) |
| 5 Years | 0 (0.0%) | 0 (0.0%) |
| 6 to 11 Years | 21 (52.5%) | 6 (100.0%) |
| 12 to 14 Years | 3 (100.0%) | 8 (100.0%) |
| 15 Years | 0 (0.0%) | 3 (100.0%) |
| 16 and 17 Years | 0 (0.0%) | 3 (42.9%) |
| 18 to 24 Years | 89 (100.0%) | 32 (66.7%) |
| 25 to 34 Years | 53 (100.0%) | 18 (85.7%) |
| 35 to 44 Years | 48 (84.2%) | 30 (56.6%) |
| 45 to 54 Years | 87 (91.6%) | 72 (93.5%) |
| 55 to 64 Years | 128 (95.5%) | 147 (90.2%) |
| 65 to 74 Years | 73 (96.1%) | 61 (100.0%) |
| 75 Years and over | 29 (100.0%) | 55 (73.3%) |
| Total | 534 (92.2%) | 469 (82.7%) |
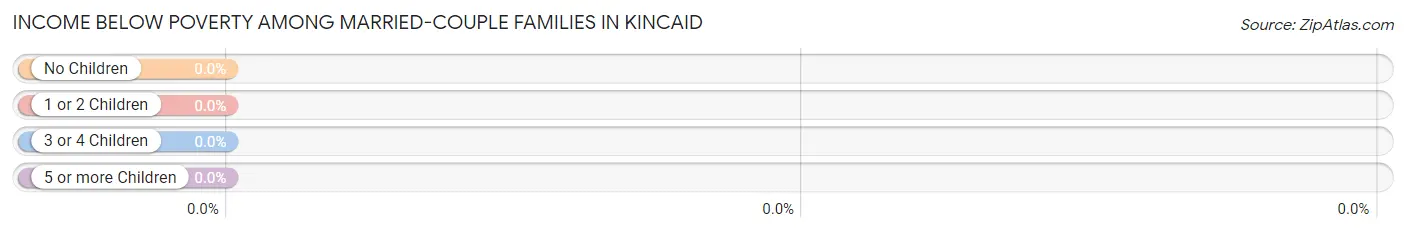
Income Below Poverty Among Married-Couple Families in Kincaid
| Children | Above Poverty | Below Poverty |
| No Children | 197 (100.0%) | 0 (0.0%) |
| 1 or 2 Children | 29 (100.0%) | 0 (0.0%) |
| 3 or 4 Children | 6 (100.0%) | 0 (0.0%) |
| 5 or more Children | 0 (0.0%) | 0 (0.0%) |
| Total | 232 (100.0%) | 0 (0.0%) |
Income Below Poverty Among Single-Parent Households in Kincaid
According to the poverty data in Kincaid, 16.7% or 5 single-father households and 53.8% or 14 single-mother households are living below the poverty line. Among single-father households, those with 1 or 2 children have the highest poverty rate, with 5 households (71.4%) experiencing poverty. Likewise, among single-mother households, those with 1 or 2 children have the highest poverty rate, with 14 households (73.7%) falling below the poverty line.
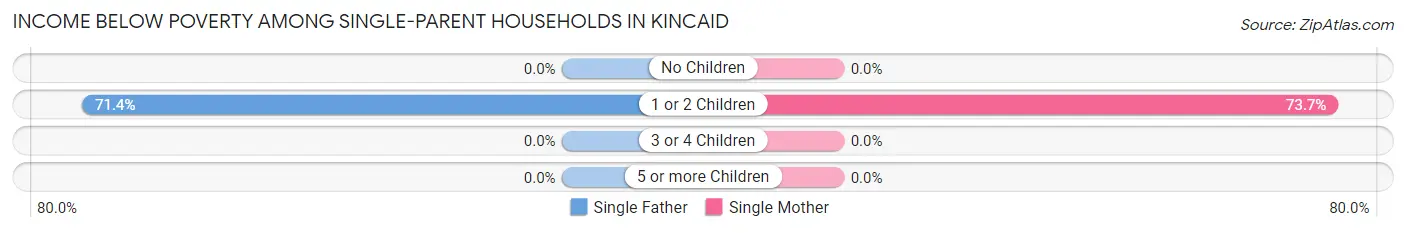
| Children | Single Father | Single Mother |
| No Children | 0 (0.0%) | 0 (0.0%) |
| 1 or 2 Children | 5 (71.4%) | 14 (73.7%) |
| 3 or 4 Children | 0 (0.0%) | 0 (0.0%) |
| 5 or more Children | 0 (0.0%) | 0 (0.0%) |
| Total | 5 (16.7%) | 14 (53.8%) |
Income Below Poverty Among Married-Couple vs Single-Parent Households in Kincaid
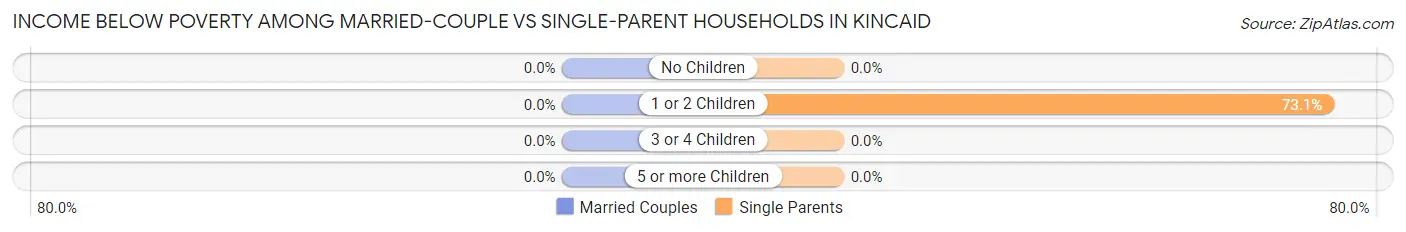
| Children | Married-Couple Families | Single-Parent Households |
| No Children | 0 (0.0%) | 0 (0.0%) |
| 1 or 2 Children | 0 (0.0%) | 19 (73.1%) |
| 3 or 4 Children | 0 (0.0%) | 0 (0.0%) |
| 5 or more Children | 0 (0.0%) | 0 (0.0%) |
| Total | 0 (0.0%) | 19 (33.9%) |
Race in Kincaid
The most populous races in Kincaid are White / Caucasian (1,107 | 96.6%), Hispanic or Latino (36 | 3.1%), and Some other Race (36 | 3.1%).
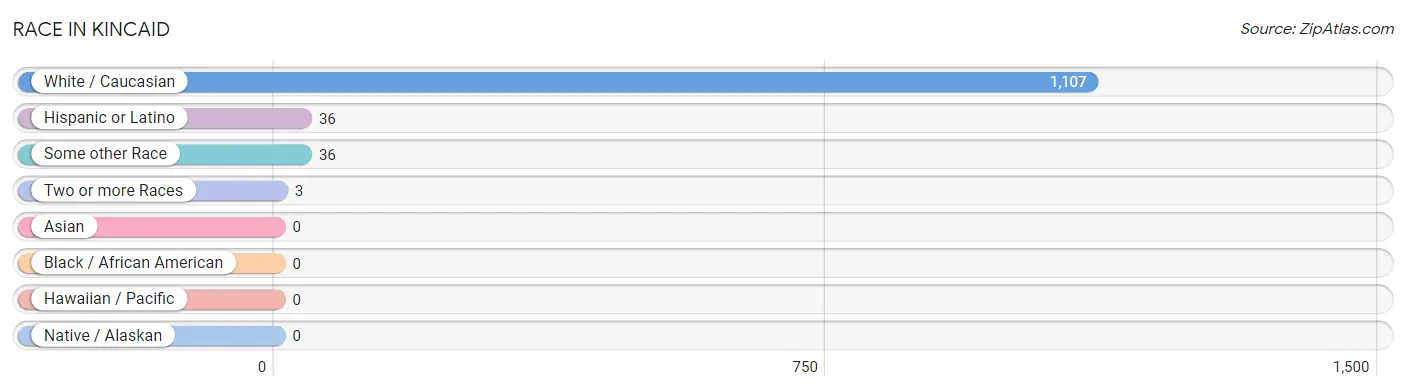
| Race | # Population | % Population |
| Asian | 0 | 0.0% |
| Black / African American | 0 | 0.0% |
| Hawaiian / Pacific | 0 | 0.0% |
| Hispanic or Latino | 36 | 3.1% |
| Native / Alaskan | 0 | 0.0% |
| White / Caucasian | 1,107 | 96.6% |
| Two or more Races | 3 | 0.3% |
| Some other Race | 36 | 3.1% |
| Total | 1,146 | 100.0% |
Ancestry in Kincaid
The most populous ancestries reported in Kincaid are German (202 | 17.6%), Irish (166 | 14.5%), English (119 | 10.4%), Italian (100 | 8.7%), and American (66 | 5.8%), together accounting for 57.0% of all Kincaid residents.
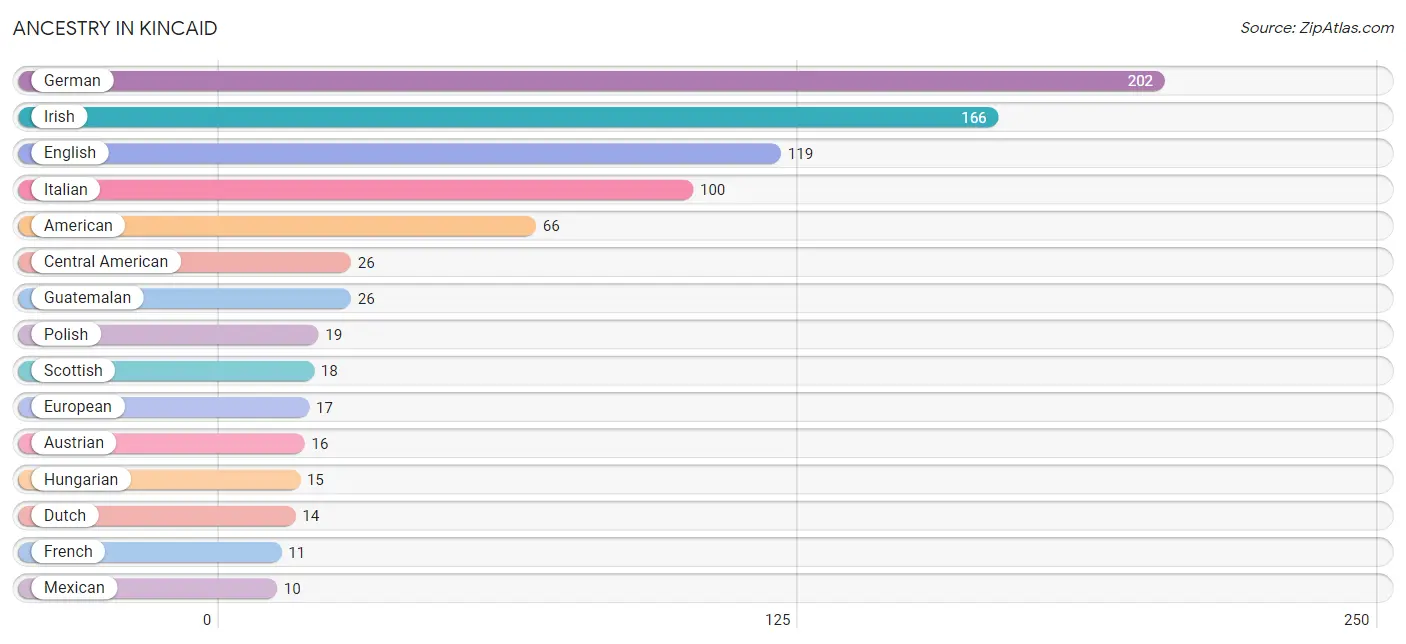
| Ancestry | # Population | % Population |
| American | 66 | 5.8% |
| Austrian | 16 | 1.4% |
| Central American | 26 | 2.3% |
| Cherokee | 3 | 0.3% |
| Croatian | 3 | 0.3% |
| Dutch | 14 | 1.2% |
| English | 119 | 10.4% |
| European | 17 | 1.5% |
| French | 11 | 1.0% |
| German | 202 | 17.6% |
| Guatemalan | 26 | 2.3% |
| Hungarian | 15 | 1.3% |
| Irish | 166 | 14.5% |
| Italian | 100 | 8.7% |
| Mexican | 10 | 0.9% |
| Polish | 19 | 1.7% |
| Romanian | 5 | 0.4% |
| Scotch-Irish | 3 | 0.3% |
| Scottish | 18 | 1.6% |
| Swiss | 8 | 0.7% |
| Welsh | 4 | 0.4% | View All 21 Rows |
Immigrants in Kincaid

| Immigration Origin | # Population | % Population | View All 0 Rows |
Sex and Age in Kincaid
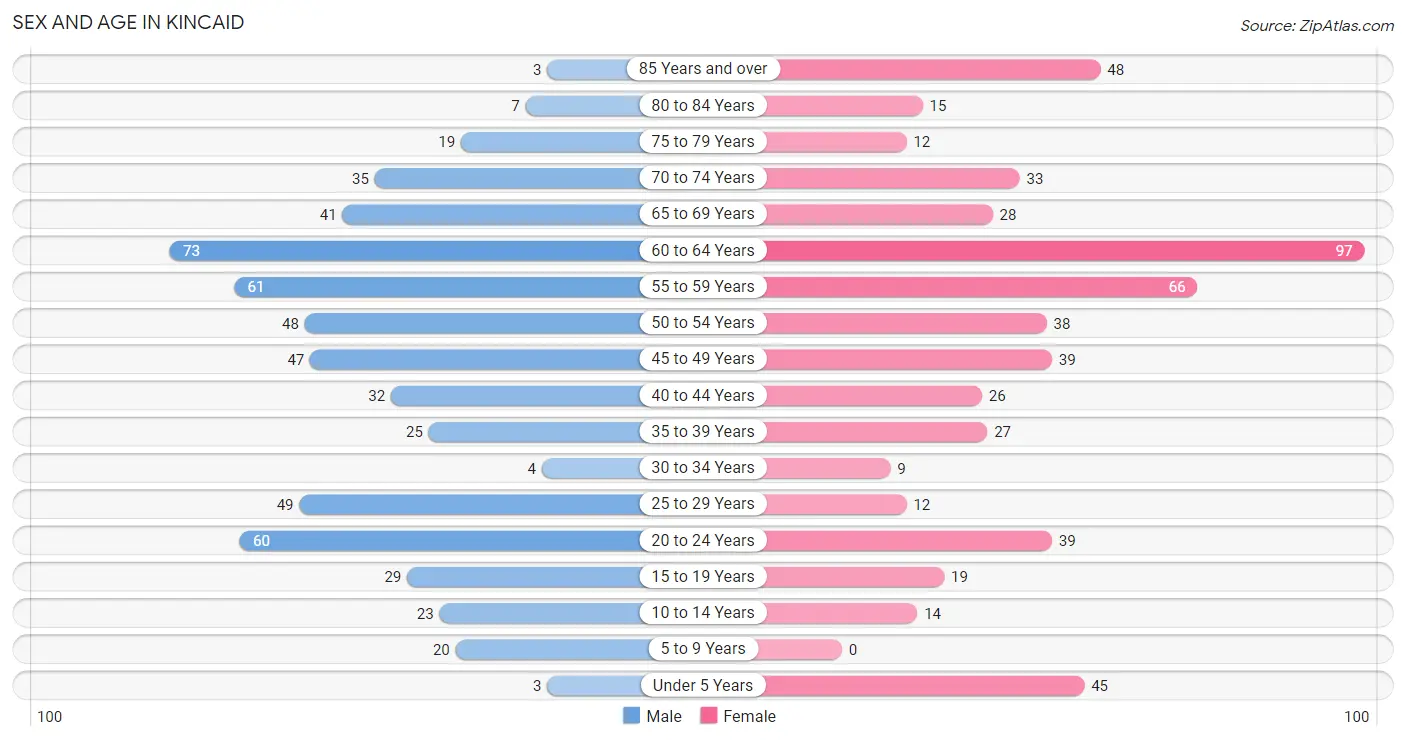
Sex and Age in Kincaid
The most populous age groups in Kincaid are 60 to 64 Years (73 | 12.6%) for men and 60 to 64 Years (97 | 17.1%) for women.
| Age Bracket | Male | Female |
| Under 5 Years | 3 (0.5%) | 45 (7.9%) |
| 5 to 9 Years | 20 (3.5%) | 0 (0.0%) |
| 10 to 14 Years | 23 (4.0%) | 14 (2.5%) |
| 15 to 19 Years | 29 (5.0%) | 19 (3.4%) |
| 20 to 24 Years | 60 (10.4%) | 39 (6.9%) |
| 25 to 29 Years | 49 (8.5%) | 12 (2.1%) |
| 30 to 34 Years | 4 (0.7%) | 9 (1.6%) |
| 35 to 39 Years | 25 (4.3%) | 27 (4.8%) |
| 40 to 44 Years | 32 (5.5%) | 26 (4.6%) |
| 45 to 49 Years | 47 (8.1%) | 39 (6.9%) |
| 50 to 54 Years | 48 (8.3%) | 38 (6.7%) |
| 55 to 59 Years | 61 (10.5%) | 66 (11.6%) |
| 60 to 64 Years | 73 (12.6%) | 97 (17.1%) |
| 65 to 69 Years | 41 (7.1%) | 28 (4.9%) |
| 70 to 74 Years | 35 (6.0%) | 33 (5.8%) |
| 75 to 79 Years | 19 (3.3%) | 12 (2.1%) |
| 80 to 84 Years | 7 (1.2%) | 15 (2.6%) |
| 85 Years and over | 3 (0.5%) | 48 (8.5%) |
| Total | 579 (100.0%) | 567 (100.0%) |
Families and Households in Kincaid
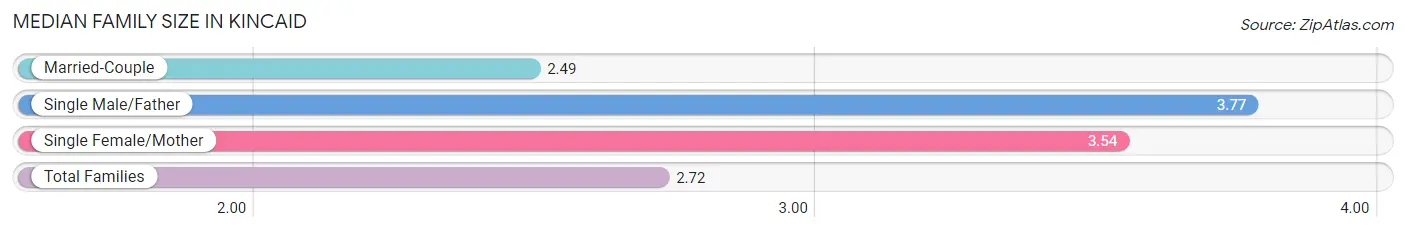
Median Family Size in Kincaid
The median family size in Kincaid is 2.72 persons per family, with single male/father families (30 | 10.4%) accounting for the largest median family size of 3.77 persons per family. On the other hand, married-couple families (232 | 80.6%) represent the smallest median family size with 2.49 persons per family.
| Family Type | # Families | Family Size |
| Married-Couple | 232 (80.6%) | 2.49 |
| Single Male/Father | 30 (10.4%) | 3.77 |
| Single Female/Mother | 26 (9.0%) | 3.54 |
| Total Families | 288 (100.0%) | 2.72 |
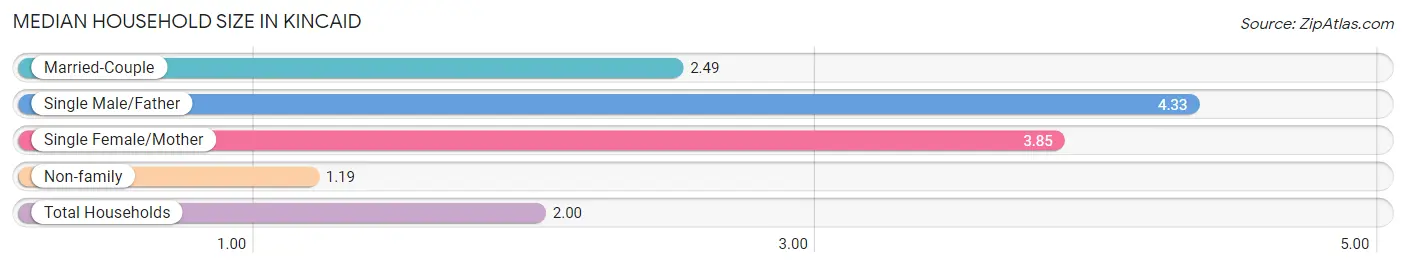
Median Household Size in Kincaid
The median household size in Kincaid is 2.00 persons per household, with single male/father households (30 | 5.2%) accounting for the largest median household size of 4.33 persons per household. non-family households (284 | 49.6%) represent the smallest median household size with 1.19 persons per household.
| Household Type | # Households | Household Size |
| Married-Couple | 232 (40.6%) | 2.49 |
| Single Male/Father | 30 (5.2%) | 4.33 |
| Single Female/Mother | 26 (4.5%) | 3.85 |
| Non-family | 284 (49.6%) | 1.19 |
| Total Households | 572 (100.0%) | 2.00 |
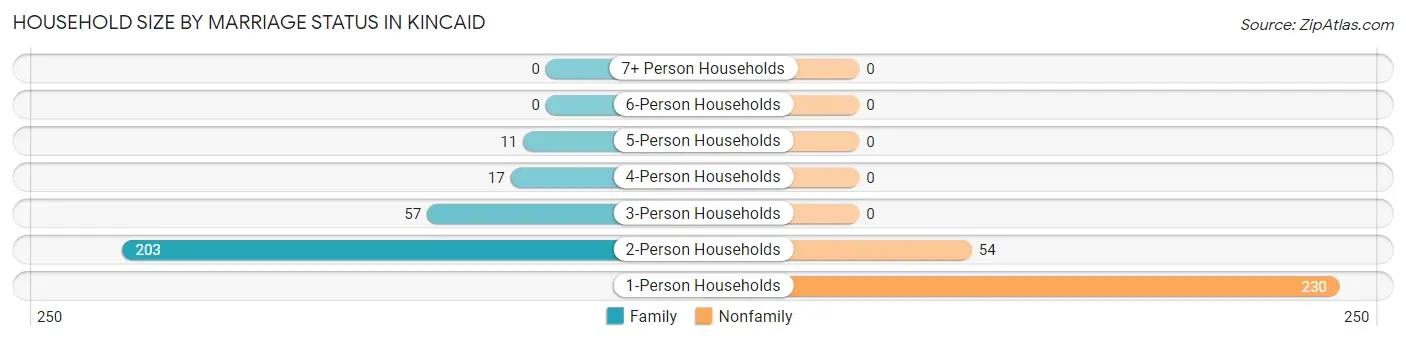
Household Size by Marriage Status in Kincaid
Out of a total of 572 households in Kincaid, 288 (50.3%) are family households, while 284 (49.6%) are nonfamily households. The most numerous type of family households are 2-person households, comprising 203, and the most common type of nonfamily households are 1-person households, comprising 230.
| Household Size | Family Households | Nonfamily Households |
| 1-Person Households | - | 230 (40.2%) |
| 2-Person Households | 203 (35.5%) | 54 (9.4%) |
| 3-Person Households | 57 (10.0%) | 0 (0.0%) |
| 4-Person Households | 17 (3.0%) | 0 (0.0%) |
| 5-Person Households | 11 (1.9%) | 0 (0.0%) |
| 6-Person Households | 0 (0.0%) | 0 (0.0%) |
| 7+ Person Households | 0 (0.0%) | 0 (0.0%) |
| Total | 288 (50.3%) | 284 (49.6%) |
Female Fertility in Kincaid
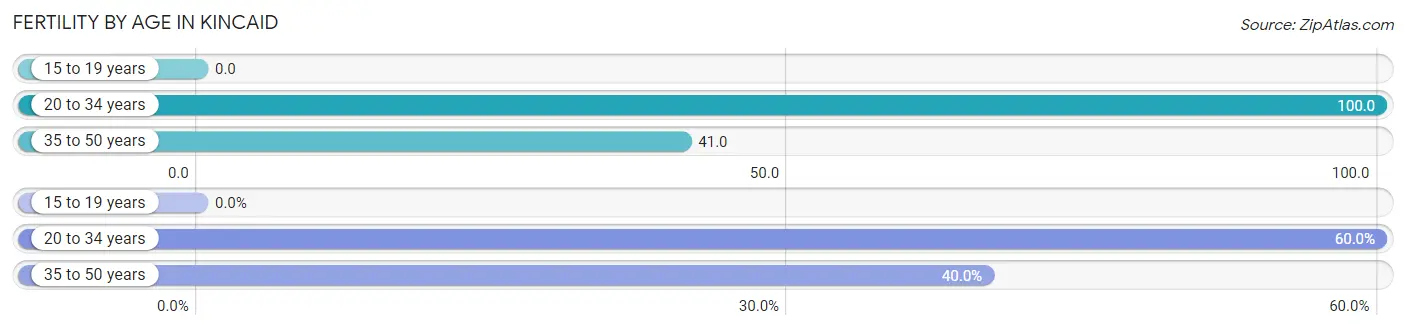
Fertility by Age in Kincaid
Average fertility rate in Kincaid is 57.0 births per 1,000 women. Women in the age bracket of 20 to 34 years have the highest fertility rate with 100.0 births per 1,000 women. Women in the age bracket of 20 to 34 years acount for 60.0% of all women with births.
| Age Bracket | Women with Births | Births / 1,000 Women |
| 15 to 19 years | 0 (0.0%) | 0.0 |
| 20 to 34 years | 6 (60.0%) | 100.0 |
| 35 to 50 years | 4 (40.0%) | 41.0 |
| Total | 10 (100.0%) | 57.0 |
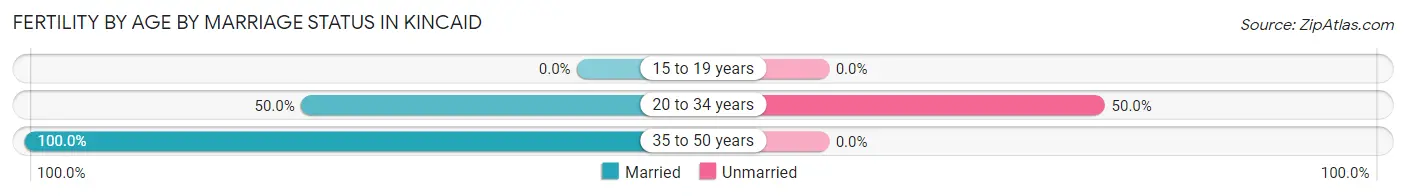
Fertility by Age by Marriage Status in Kincaid
70.0% of women with births (10) in Kincaid are married. The highest percentage of unmarried women with births falls into 20 to 34 years age bracket with 50.0% of them unmarried at the time of birth, while the lowest percentage of unmarried women with births belong to 35 to 50 years age bracket with 0.0% of them unmarried.
| Age Bracket | Married | Unmarried |
| 15 to 19 years | 0 (0.0%) | 0 (0.0%) |
| 20 to 34 years | 3 (50.0%) | 3 (50.0%) |
| 35 to 50 years | 4 (100.0%) | 0 (0.0%) |
| Total | 7 (70.0%) | 3 (30.0%) |
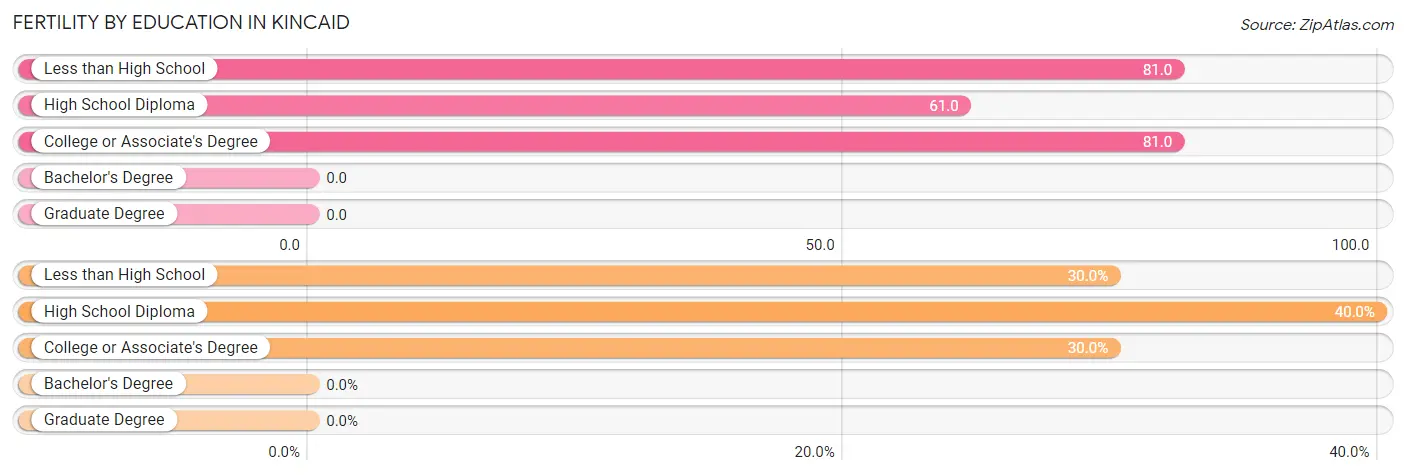
Fertility by Education in Kincaid
| Educational Attainment | Women with Births | Births / 1,000 Women |
| Less than High School | 3 (30.0%) | 81.0 |
| High School Diploma | 4 (40.0%) | 61.0 |
| College or Associate's Degree | 3 (30.0%) | 81.0 |
| Bachelor's Degree | 0 (0.0%) | 0.0 |
| Graduate Degree | 0 (0.0%) | 0.0 |
| Total | 10 (100.0%) | 57.0 |
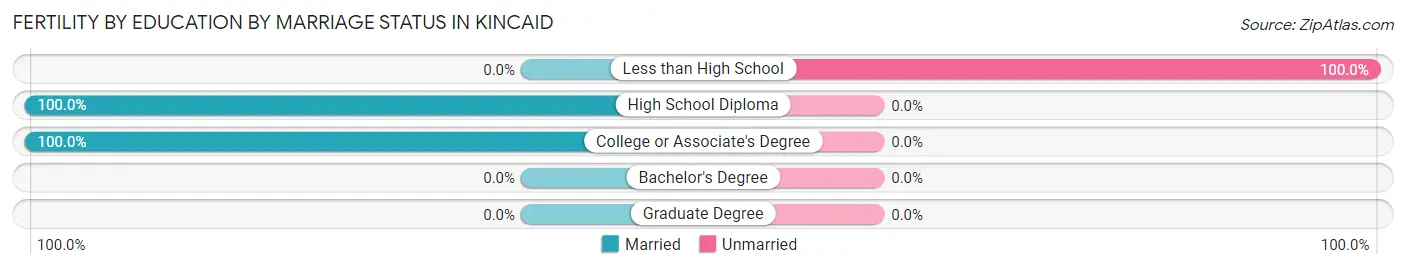
Fertility by Education by Marriage Status in Kincaid
30.0% of women with births in Kincaid are unmarried. Women with the educational attainment of high school diploma are most likely to be married with 100.0% of them married at childbirth, while women with the educational attainment of less than high school are least likely to be married with 100.0% of them unmarried at childbirth.
| Educational Attainment | Married | Unmarried |
| Less than High School | 0 (0.0%) | 3 (100.0%) |
| High School Diploma | 4 (100.0%) | 0 (0.0%) |
| College or Associate's Degree | 3 (100.0%) | 0 (0.0%) |
| Bachelor's Degree | 0 (0.0%) | 0 (0.0%) |
| Graduate Degree | 0 (0.0%) | 0 (0.0%) |
| Total | 7 (70.0%) | 3 (30.0%) |
Employment Characteristics in Kincaid
Employment by Class of Employer in Kincaid
Among the 574 employed individuals in Kincaid, private company employees (441 | 76.8%), local government employees (42 | 7.3%), and state government employees (37 | 6.5%) make up the most common classes of employment.
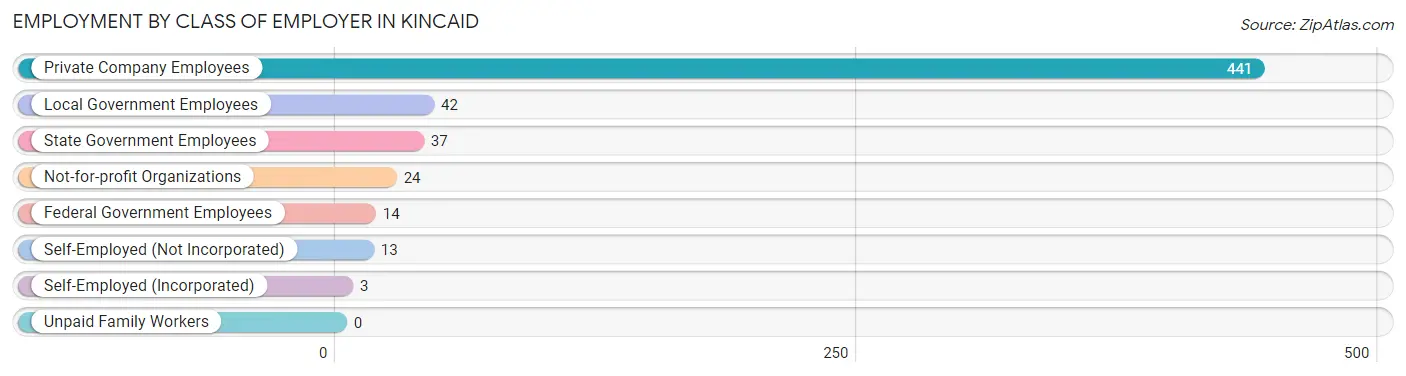
| Employer Class | # Employees | % Employees |
| Private Company Employees | 441 | 76.8% |
| Self-Employed (Incorporated) | 3 | 0.5% |
| Self-Employed (Not Incorporated) | 13 | 2.3% |
| Not-for-profit Organizations | 24 | 4.2% |
| Local Government Employees | 42 | 7.3% |
| State Government Employees | 37 | 6.5% |
| Federal Government Employees | 14 | 2.4% |
| Unpaid Family Workers | 0 | 0.0% |
| Total | 574 | 100.0% |
Employment Status by Age in Kincaid
According to the labor force statistics for Kincaid, out of the total population over 16 years of age (1,038), 57.8% or 600 individuals are in the labor force, with 3.9% or 23 of them unemployed. The age group with the highest labor force participation rate is 25 to 29 years, with 100.0% or 61 individuals in the labor force. Within the labor force, the 25 to 29 years age range has the highest percentage of unemployed individuals, with 27.9% or 17 of them being unemployed.
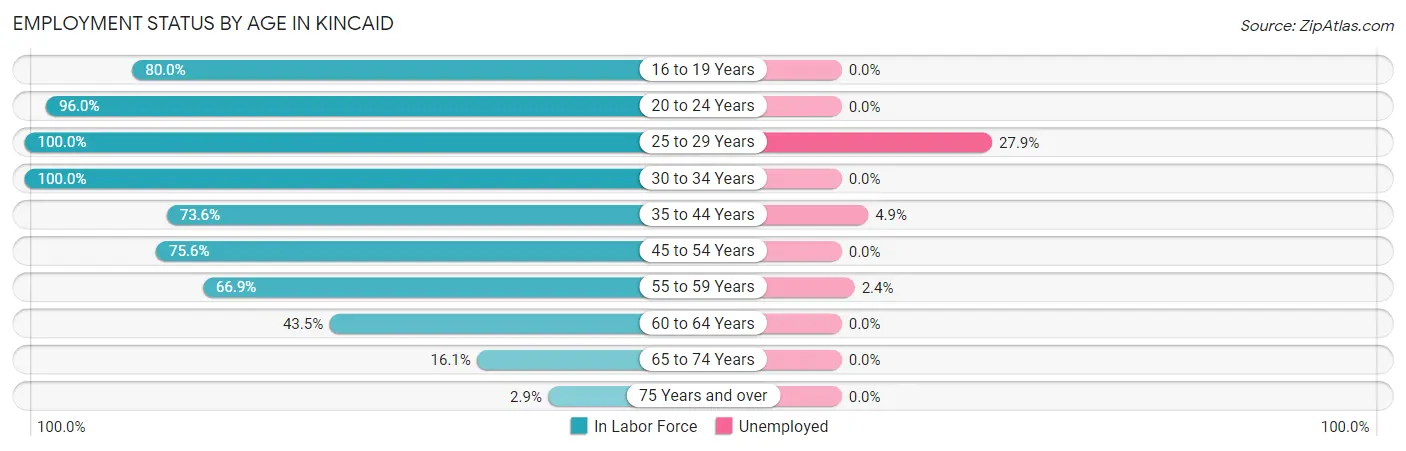
| Age Bracket | In Labor Force | Unemployed |
| 16 to 19 Years | 36 (80.0%) | 0 (0.0%) |
| 20 to 24 Years | 95 (96.0%) | 0 (0.0%) |
| 25 to 29 Years | 61 (100.0%) | 17 (27.9%) |
| 30 to 34 Years | 13 (100.0%) | 0 (0.0%) |
| 35 to 44 Years | 81 (73.6%) | 4 (4.9%) |
| 45 to 54 Years | 130 (75.6%) | 0 (0.0%) |
| 55 to 59 Years | 85 (66.9%) | 2 (2.4%) |
| 60 to 64 Years | 74 (43.5%) | 0 (0.0%) |
| 65 to 74 Years | 22 (16.1%) | 0 (0.0%) |
| 75 Years and over | 3 (2.9%) | 0 (0.0%) |
| Total | 600 (57.8%) | 23 (3.9%) |
Employment Status by Educational Attainment in Kincaid
According to labor force statistics for Kincaid, 68.0% of individuals (444) out of the total population between 25 and 64 years of age (653) are in the labor force, with 5.2% or 23 of them being unemployed. The group with the highest labor force participation rate are those with the educational attainment of bachelor's degree or higher, with 88.1% or 52 individuals in the labor force. Within the labor force, individuals with bachelor's degree or higher education have the highest percentage of unemployment, with 15.4% or 8 of them being unemployed.
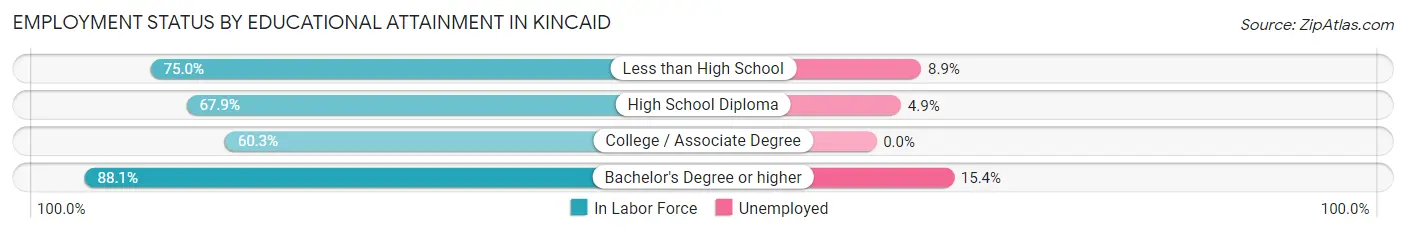
| Educational Attainment | In Labor Force | Unemployed |
| Less than High School | 45 (75.0%) | 5 (8.9%) |
| High School Diploma | 224 (67.9%) | 16 (4.9%) |
| College / Associate Degree | 123 (60.3%) | 0 (0.0%) |
| Bachelor's Degree or higher | 52 (88.1%) | 9 (15.4%) |
| Total | 444 (68.0%) | 34 (5.2%) |
Employment Occupations by Sex in Kincaid
Management, Business, Science and Arts Occupations
The most common Management, Business, Science and Arts occupations in Kincaid are Community & Social Service (38 | 6.7%), Education Instruction & Library (29 | 5.1%), Health Diagnosing & Treating (29 | 5.1%), Management (26 | 4.5%), and Computers, Engineering & Science (21 | 3.7%).
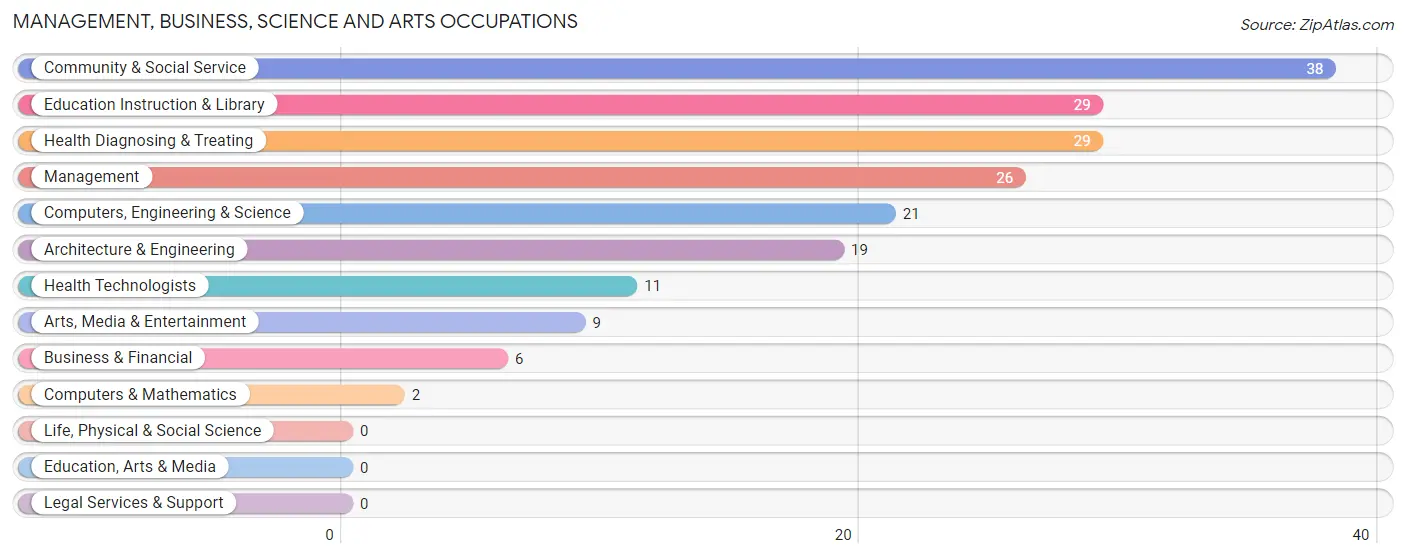
Management, Business, Science and Arts Occupations by Sex
Within the Management, Business, Science and Arts occupations in Kincaid, the most male-oriented occupations are Computers & Mathematics (100.0%), Arts, Media & Entertainment (100.0%), and Computers, Engineering & Science (85.7%), while the most female-oriented occupations are Business & Financial (100.0%), Education Instruction & Library (100.0%), and Health Diagnosing & Treating (100.0%).
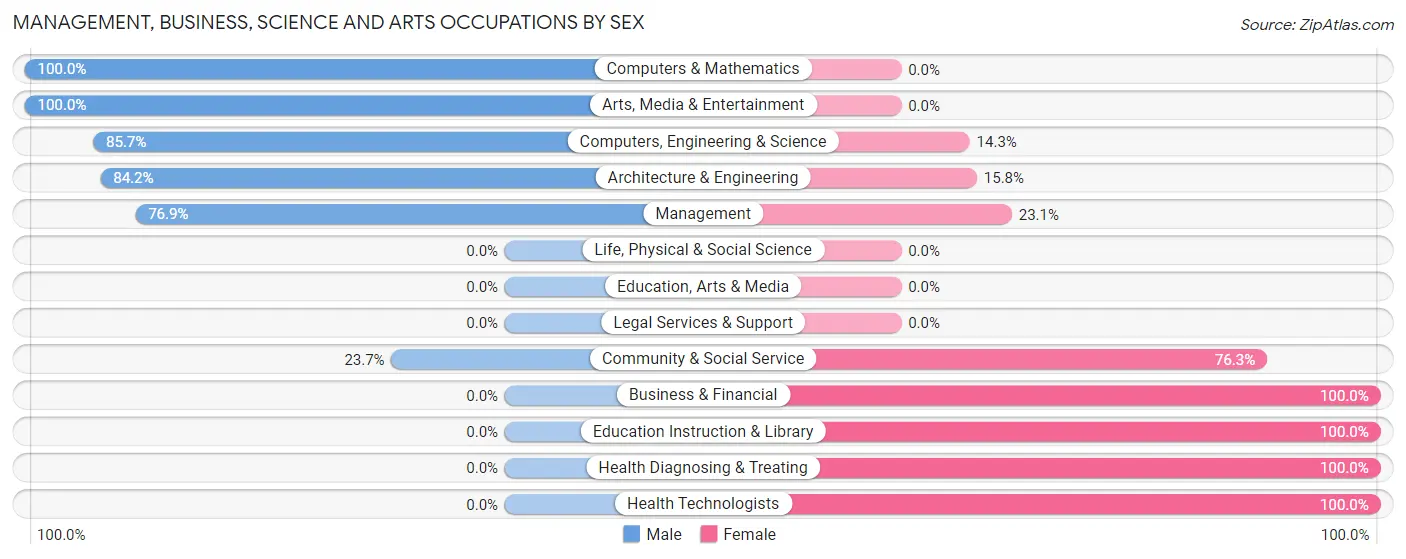
| Occupation | Male | Female |
| Management | 20 (76.9%) | 6 (23.1%) |
| Business & Financial | 0 (0.0%) | 6 (100.0%) |
| Computers, Engineering & Science | 18 (85.7%) | 3 (14.3%) |
| Computers & Mathematics | 2 (100.0%) | 0 (0.0%) |
| Architecture & Engineering | 16 (84.2%) | 3 (15.8%) |
| Life, Physical & Social Science | 0 (0.0%) | 0 (0.0%) |
| Community & Social Service | 9 (23.7%) | 29 (76.3%) |
| Education, Arts & Media | 0 (0.0%) | 0 (0.0%) |
| Legal Services & Support | 0 (0.0%) | 0 (0.0%) |
| Education Instruction & Library | 0 (0.0%) | 29 (100.0%) |
| Arts, Media & Entertainment | 9 (100.0%) | 0 (0.0%) |
| Health Diagnosing & Treating | 0 (0.0%) | 29 (100.0%) |
| Health Technologists | 0 (0.0%) | 11 (100.0%) |
| Total (Category) | 47 (39.2%) | 73 (60.8%) |
| Total (Overall) | 354 (62.0%) | 217 (38.0%) |
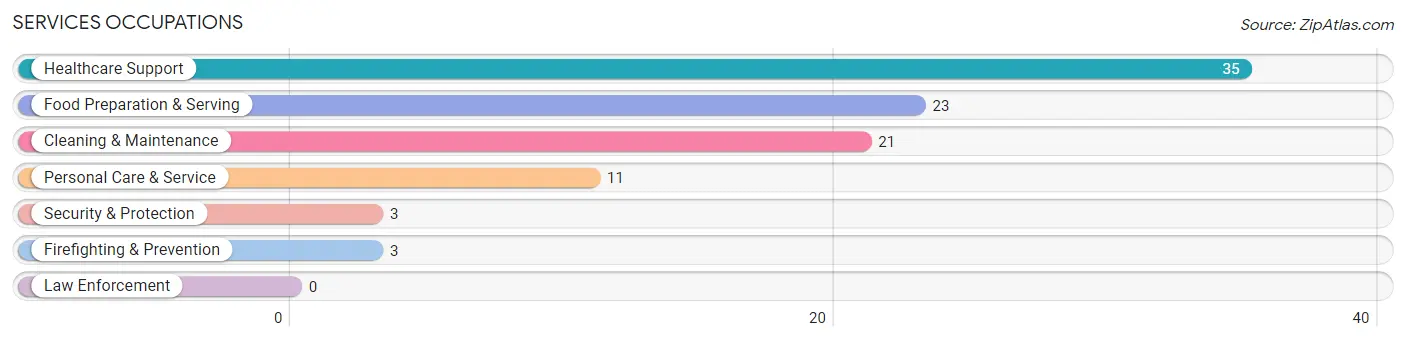
Services Occupations
The most common Services occupations in Kincaid are Healthcare Support (35 | 6.1%), Food Preparation & Serving (23 | 4.0%), Cleaning & Maintenance (21 | 3.7%), Personal Care & Service (11 | 1.9%), and Security & Protection (3 | 0.5%).
Services Occupations by Sex
Within the Services occupations in Kincaid, the most male-oriented occupations are Security & Protection (100.0%), Firefighting & Prevention (100.0%), and Healthcare Support (48.6%), while the most female-oriented occupations are Food Preparation & Serving (100.0%), Personal Care & Service (100.0%), and Cleaning & Maintenance (52.4%).
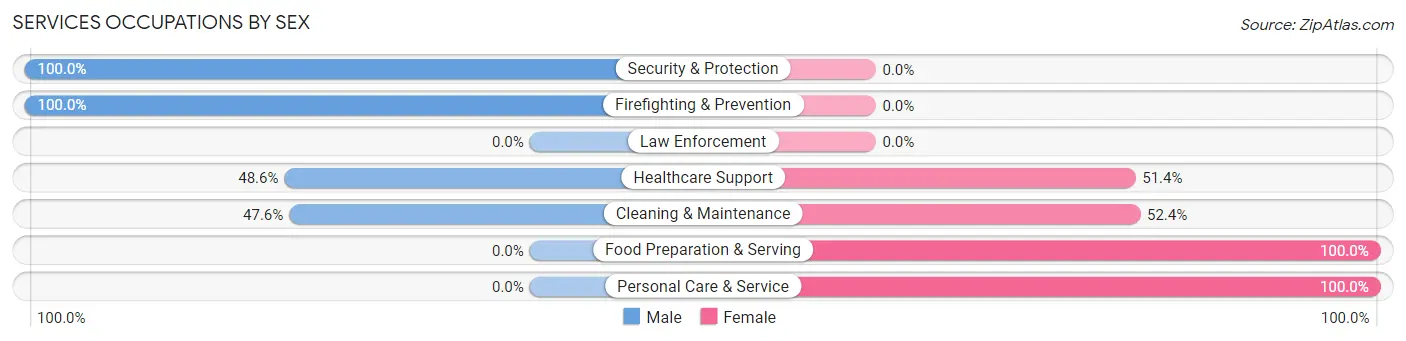
| Occupation | Male | Female |
| Healthcare Support | 17 (48.6%) | 18 (51.4%) |
| Security & Protection | 3 (100.0%) | 0 (0.0%) |
| Firefighting & Prevention | 3 (100.0%) | 0 (0.0%) |
| Law Enforcement | 0 (0.0%) | 0 (0.0%) |
| Food Preparation & Serving | 0 (0.0%) | 23 (100.0%) |
| Cleaning & Maintenance | 10 (47.6%) | 11 (52.4%) |
| Personal Care & Service | 0 (0.0%) | 11 (100.0%) |
| Total (Category) | 30 (32.3%) | 63 (67.7%) |
| Total (Overall) | 354 (62.0%) | 217 (38.0%) |
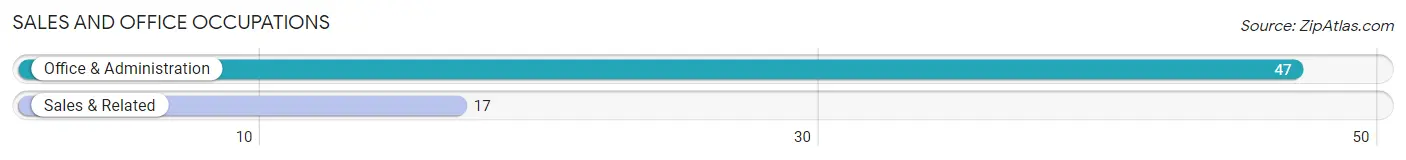
Sales and Office Occupations
The most common Sales and Office occupations in Kincaid are Office & Administration (47 | 8.2%), and Sales & Related (17 | 3.0%).
Sales and Office Occupations by Sex
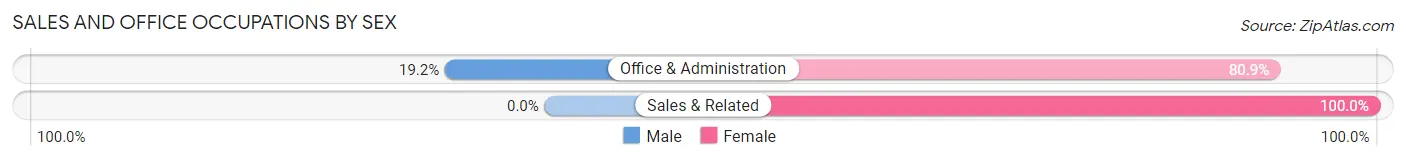
| Occupation | Male | Female |
| Sales & Related | 0 (0.0%) | 17 (100.0%) |
| Office & Administration | 9 (19.2%) | 38 (80.8%) |
| Total (Category) | 9 (14.1%) | 55 (85.9%) |
| Total (Overall) | 354 (62.0%) | 217 (38.0%) |
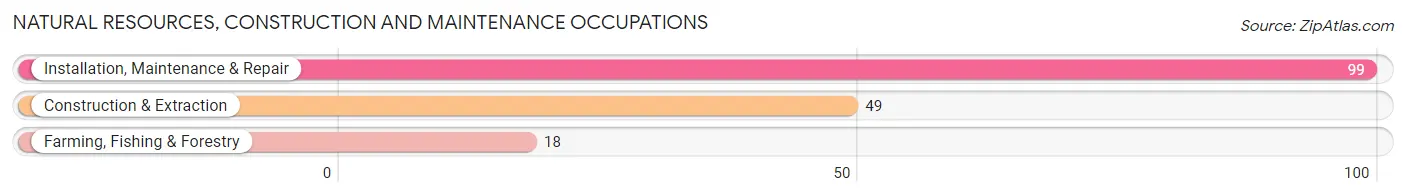
Natural Resources, Construction and Maintenance Occupations
The most common Natural Resources, Construction and Maintenance occupations in Kincaid are Installation, Maintenance & Repair (99 | 17.3%), Construction & Extraction (49 | 8.6%), and Farming, Fishing & Forestry (18 | 3.2%).
Natural Resources, Construction and Maintenance Occupations by Sex
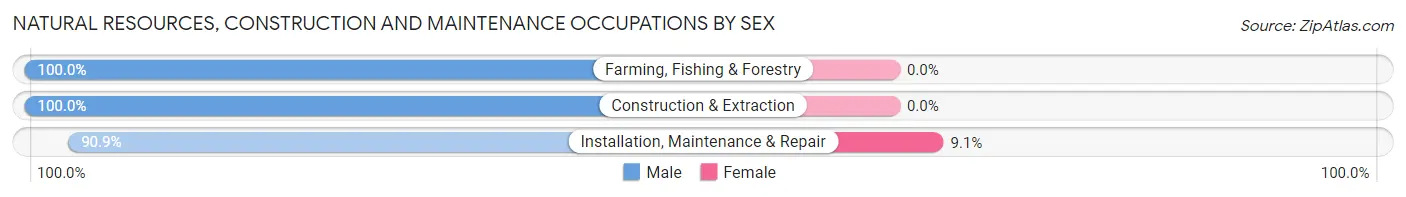
| Occupation | Male | Female |
| Farming, Fishing & Forestry | 18 (100.0%) | 0 (0.0%) |
| Construction & Extraction | 49 (100.0%) | 0 (0.0%) |
| Installation, Maintenance & Repair | 90 (90.9%) | 9 (9.1%) |
| Total (Category) | 157 (94.6%) | 9 (5.4%) |
| Total (Overall) | 354 (62.0%) | 217 (38.0%) |
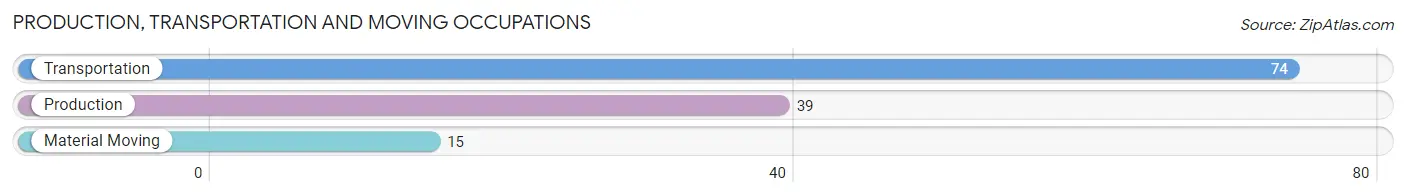
Production, Transportation and Moving Occupations
The most common Production, Transportation and Moving occupations in Kincaid are Transportation (74 | 13.0%), Production (39 | 6.8%), and Material Moving (15 | 2.6%).
Production, Transportation and Moving Occupations by Sex
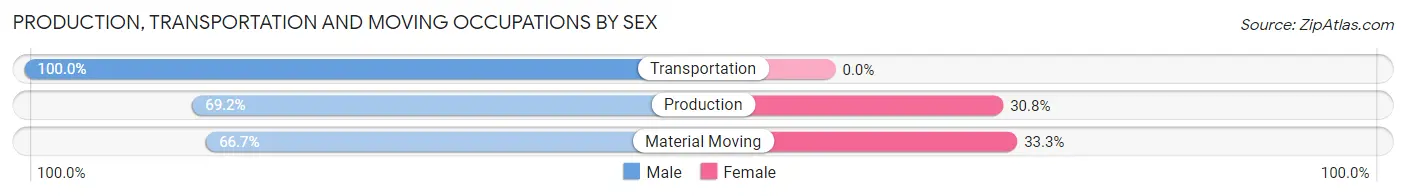
| Occupation | Male | Female |
| Production | 27 (69.2%) | 12 (30.8%) |
| Transportation | 74 (100.0%) | 0 (0.0%) |
| Material Moving | 10 (66.7%) | 5 (33.3%) |
| Total (Category) | 111 (86.7%) | 17 (13.3%) |
| Total (Overall) | 354 (62.0%) | 217 (38.0%) |
Employment Industries by Sex in Kincaid
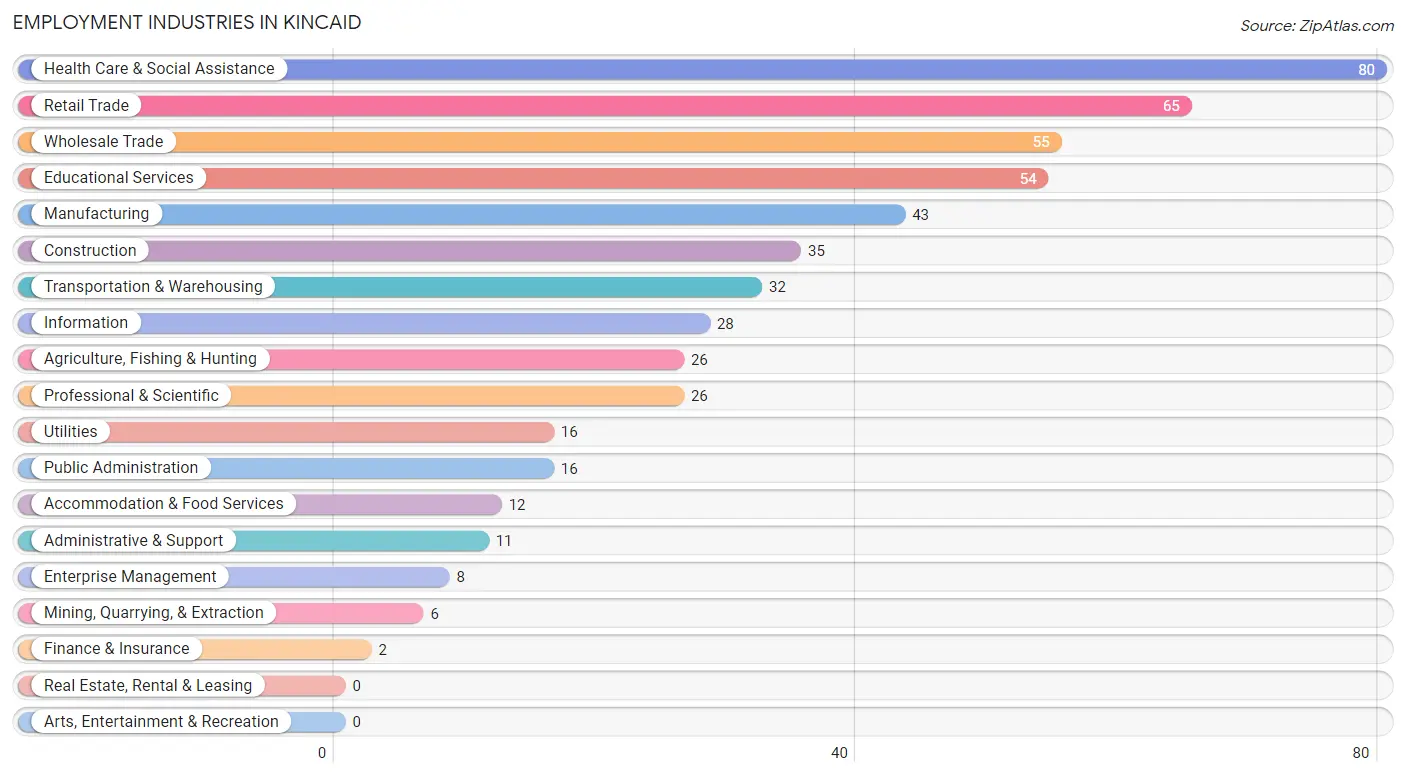
Employment Industries in Kincaid
The major employment industries in Kincaid include Health Care & Social Assistance (80 | 14.0%), Retail Trade (65 | 11.4%), Wholesale Trade (55 | 9.6%), Educational Services (54 | 9.5%), and Manufacturing (43 | 7.5%).
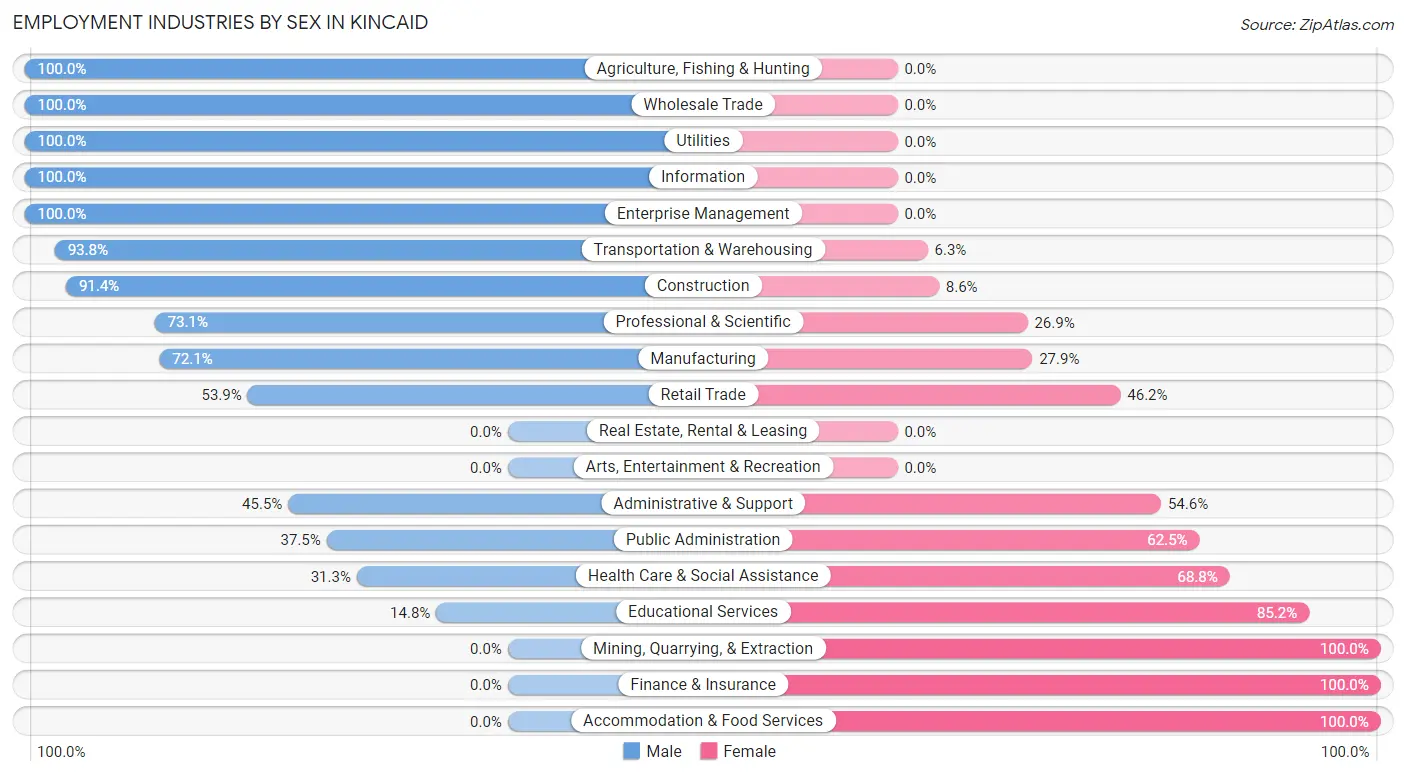
Employment Industries by Sex in Kincaid
The Kincaid industries that see more men than women are Agriculture, Fishing & Hunting (100.0%), Wholesale Trade (100.0%), and Utilities (100.0%), whereas the industries that tend to have a higher number of women are Mining, Quarrying, & Extraction (100.0%), Finance & Insurance (100.0%), and Accommodation & Food Services (100.0%).
| Industry | Male | Female |
| Agriculture, Fishing & Hunting | 26 (100.0%) | 0 (0.0%) |
| Mining, Quarrying, & Extraction | 0 (0.0%) | 6 (100.0%) |
| Construction | 32 (91.4%) | 3 (8.6%) |
| Manufacturing | 31 (72.1%) | 12 (27.9%) |
| Wholesale Trade | 55 (100.0%) | 0 (0.0%) |
| Retail Trade | 35 (53.8%) | 30 (46.2%) |
| Transportation & Warehousing | 30 (93.8%) | 2 (6.2%) |
| Utilities | 16 (100.0%) | 0 (0.0%) |
| Information | 28 (100.0%) | 0 (0.0%) |
| Finance & Insurance | 0 (0.0%) | 2 (100.0%) |
| Real Estate, Rental & Leasing | 0 (0.0%) | 0 (0.0%) |
| Professional & Scientific | 19 (73.1%) | 7 (26.9%) |
| Enterprise Management | 8 (100.0%) | 0 (0.0%) |
| Administrative & Support | 5 (45.5%) | 6 (54.5%) |
| Educational Services | 8 (14.8%) | 46 (85.2%) |
| Health Care & Social Assistance | 25 (31.2%) | 55 (68.8%) |
| Arts, Entertainment & Recreation | 0 (0.0%) | 0 (0.0%) |
| Accommodation & Food Services | 0 (0.0%) | 12 (100.0%) |
| Public Administration | 6 (37.5%) | 10 (62.5%) |
| Total | 354 (62.0%) | 217 (38.0%) |
Education in Kincaid
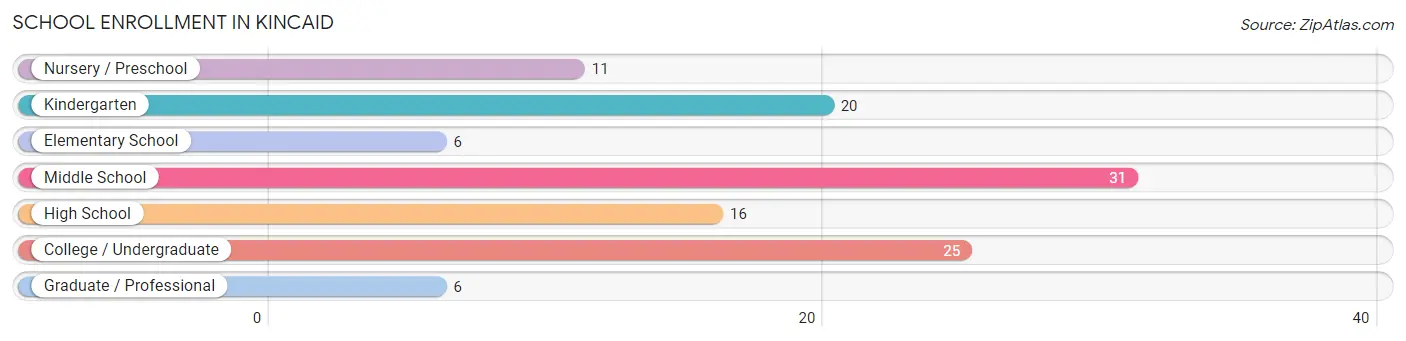
School Enrollment in Kincaid
The most common levels of schooling among the 115 students in Kincaid are middle school (31 | 27.0%), college / undergraduate (25 | 21.7%), and kindergarten (20 | 17.4%).
| School Level | # Students | % Students |
| Nursery / Preschool | 11 | 9.6% |
| Kindergarten | 20 | 17.4% |
| Elementary School | 6 | 5.2% |
| Middle School | 31 | 27.0% |
| High School | 16 | 13.9% |
| College / Undergraduate | 25 | 21.7% |
| Graduate / Professional | 6 | 5.2% |
| Total | 115 | 100.0% |
School Enrollment by Age by Funding Source in Kincaid
Out of a total of 115 students who are enrolled in schools in Kincaid, 17 (14.8%) attend a private institution, while the remaining 98 (85.2%) are enrolled in public schools. The age group of 5 to 9 year old has the highest likelihood of being enrolled in private schools, with 10 (50.0% in the age bracket) enrolled. Conversely, the age group of 3 to 4 year olds has the lowest likelihood of being enrolled in a private school, with 11 (100.0% in the age bracket) attending a public institution.
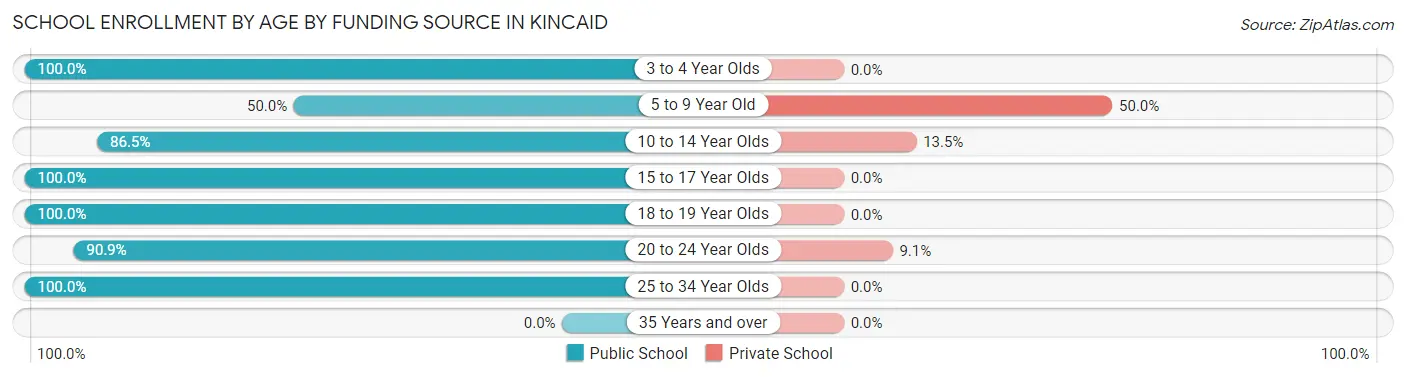
| Age Bracket | Public School | Private School |
| 3 to 4 Year Olds | 11 (100.0%) | 0 (0.0%) |
| 5 to 9 Year Old | 10 (50.0%) | 10 (50.0%) |
| 10 to 14 Year Olds | 32 (86.5%) | 5 (13.5%) |
| 15 to 17 Year Olds | 10 (100.0%) | 0 (0.0%) |
| 18 to 19 Year Olds | 6 (100.0%) | 0 (0.0%) |
| 20 to 24 Year Olds | 20 (90.9%) | 2 (9.1%) |
| 25 to 34 Year Olds | 9 (100.0%) | 0 (0.0%) |
| 35 Years and over | 0 (0.0%) | 0 (0.0%) |
| Total | 98 (85.2%) | 17 (14.8%) |
Educational Attainment by Field of Study in Kincaid
Engineering (12 | 16.0%), multidisciplinary studies (10 | 13.3%), psychology (9 | 12.0%), business (9 | 12.0%), and computers & mathematics (8 | 10.7%) are the most common fields of study among 75 individuals in Kincaid who have obtained a bachelor's degree or higher.
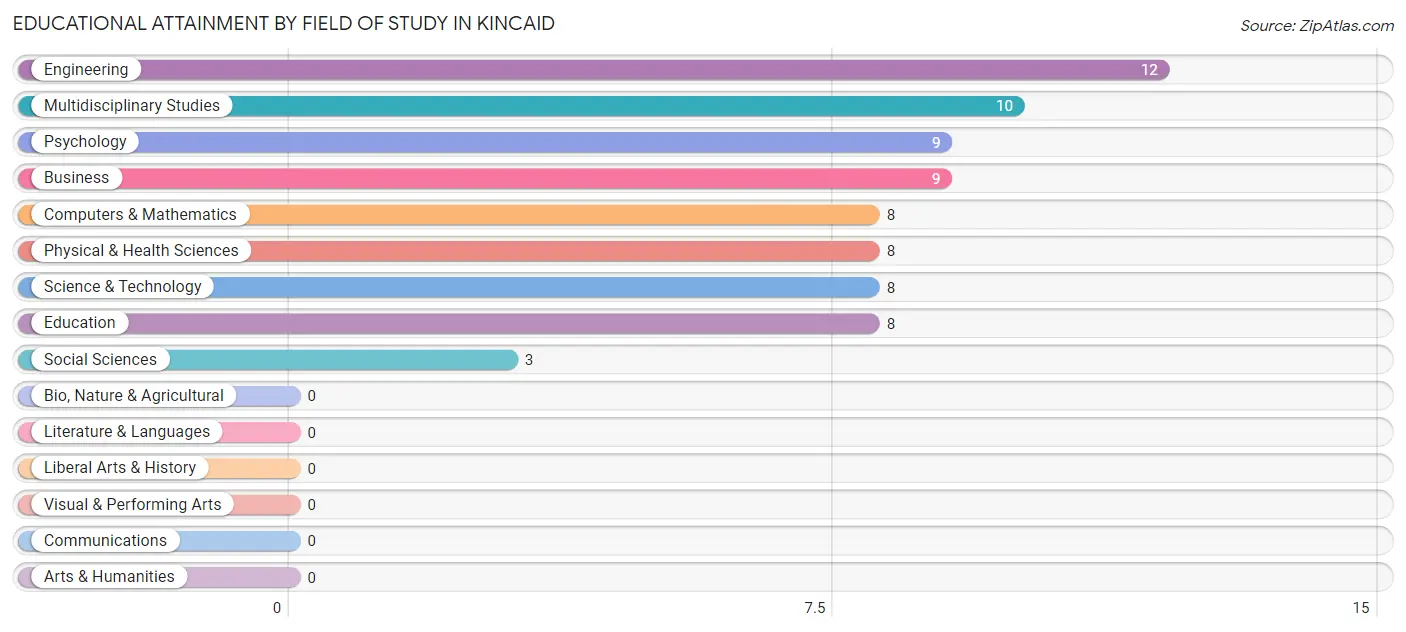
| Field of Study | # Graduates | % Graduates |
| Computers & Mathematics | 8 | 10.7% |
| Bio, Nature & Agricultural | 0 | 0.0% |
| Physical & Health Sciences | 8 | 10.7% |
| Psychology | 9 | 12.0% |
| Social Sciences | 3 | 4.0% |
| Engineering | 12 | 16.0% |
| Multidisciplinary Studies | 10 | 13.3% |
| Science & Technology | 8 | 10.7% |
| Business | 9 | 12.0% |
| Education | 8 | 10.7% |
| Literature & Languages | 0 | 0.0% |
| Liberal Arts & History | 0 | 0.0% |
| Visual & Performing Arts | 0 | 0.0% |
| Communications | 0 | 0.0% |
| Arts & Humanities | 0 | 0.0% |
| Total | 75 | 100.0% |
Transportation & Commute in Kincaid
Vehicle Availability by Sex in Kincaid
The most prevalent vehicle ownership categories in Kincaid are males with 2 vehicles (185, accounting for 51.4%) and females with 2 vehicles (120, making up 86.5%).
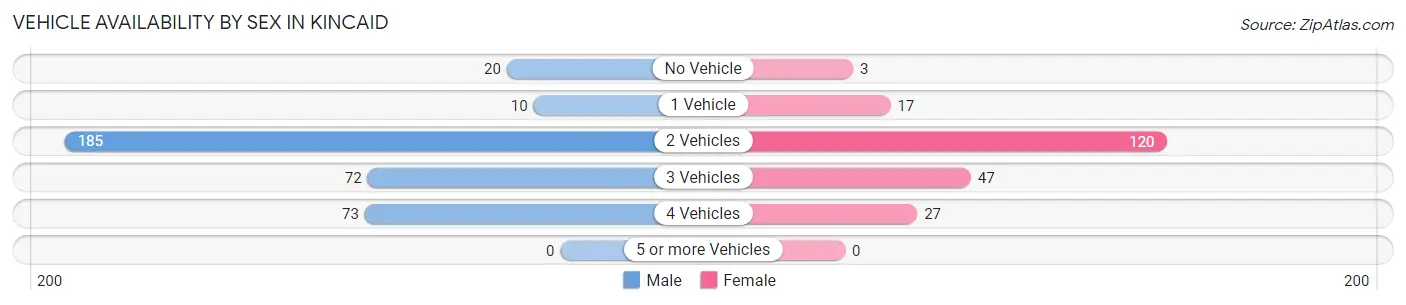
| Vehicles Available | Male | Female |
| No Vehicle | 20 (5.6%) | 3 (1.4%) |
| 1 Vehicle | 10 (2.8%) | 17 (7.9%) |
| 2 Vehicles | 185 (51.4%) | 120 (56.1%) |
| 3 Vehicles | 72 (20.0%) | 47 (22.0%) |
| 4 Vehicles | 73 (20.3%) | 27 (12.6%) |
| 5 or more Vehicles | 0 (0.0%) | 0 (0.0%) |
| Total | 360 (100.0%) | 214 (100.0%) |
Commute Time in Kincaid
The most frequently occuring commute durations in Kincaid are 20 to 24 minutes (143 commuters, 25.0%), 30 to 34 minutes (105 commuters, 18.4%), and 15 to 19 minutes (88 commuters, 15.4%).
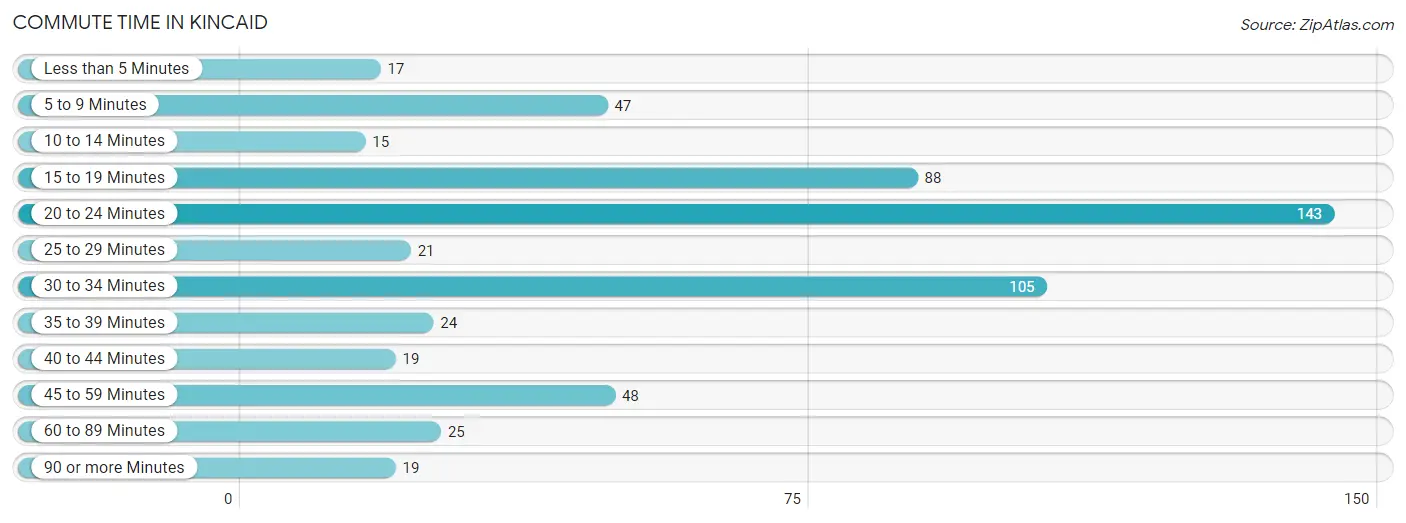
| Commute Time | # Commuters | % Commuters |
| Less than 5 Minutes | 17 | 3.0% |
| 5 to 9 Minutes | 47 | 8.2% |
| 10 to 14 Minutes | 15 | 2.6% |
| 15 to 19 Minutes | 88 | 15.4% |
| 20 to 24 Minutes | 143 | 25.0% |
| 25 to 29 Minutes | 21 | 3.7% |
| 30 to 34 Minutes | 105 | 18.4% |
| 35 to 39 Minutes | 24 | 4.2% |
| 40 to 44 Minutes | 19 | 3.3% |
| 45 to 59 Minutes | 48 | 8.4% |
| 60 to 89 Minutes | 25 | 4.4% |
| 90 or more Minutes | 19 | 3.3% |
Commute Time by Sex in Kincaid
The most common commute times in Kincaid are 20 to 24 minutes (115 commuters, 32.2%) for males and 15 to 19 minutes (58 commuters, 27.1%) for females.
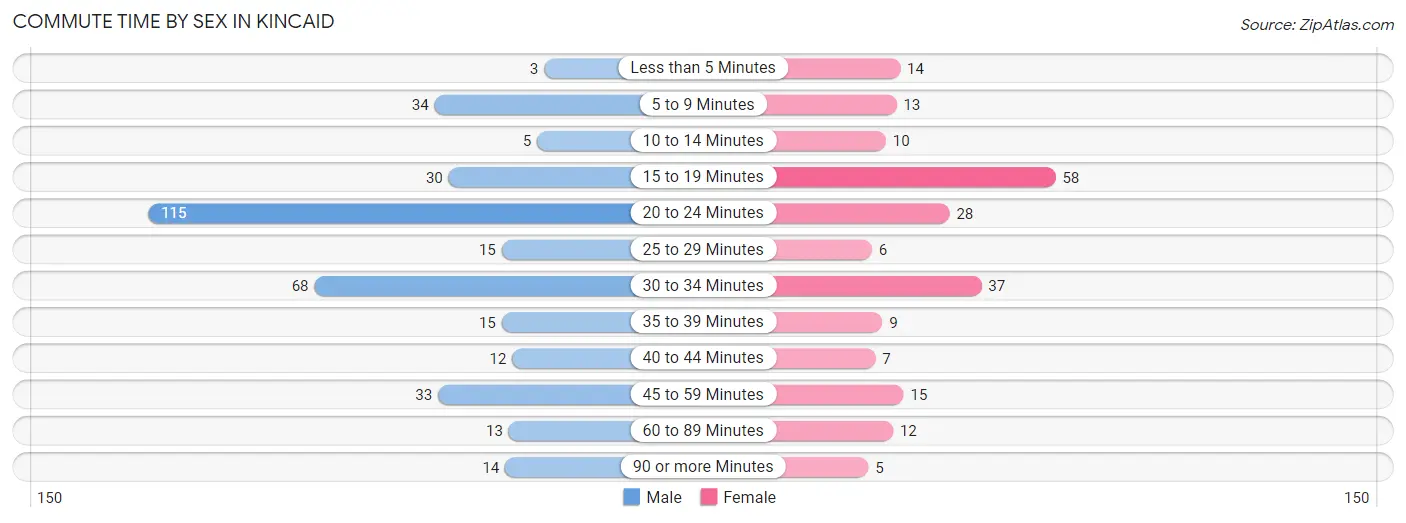
| Commute Time | Male | Female |
| Less than 5 Minutes | 3 (0.8%) | 14 (6.5%) |
| 5 to 9 Minutes | 34 (9.5%) | 13 (6.1%) |
| 10 to 14 Minutes | 5 (1.4%) | 10 (4.7%) |
| 15 to 19 Minutes | 30 (8.4%) | 58 (27.1%) |
| 20 to 24 Minutes | 115 (32.2%) | 28 (13.1%) |
| 25 to 29 Minutes | 15 (4.2%) | 6 (2.8%) |
| 30 to 34 Minutes | 68 (19.1%) | 37 (17.3%) |
| 35 to 39 Minutes | 15 (4.2%) | 9 (4.2%) |
| 40 to 44 Minutes | 12 (3.4%) | 7 (3.3%) |
| 45 to 59 Minutes | 33 (9.2%) | 15 (7.0%) |
| 60 to 89 Minutes | 13 (3.6%) | 12 (5.6%) |
| 90 or more Minutes | 14 (3.9%) | 5 (2.3%) |
Time of Departure to Work by Sex in Kincaid
The most frequent times of departure to work in Kincaid are 6:30 AM to 6:59 AM (92, 25.8%) for males and 7:00 AM to 7:29 AM (35, 16.4%) for females.
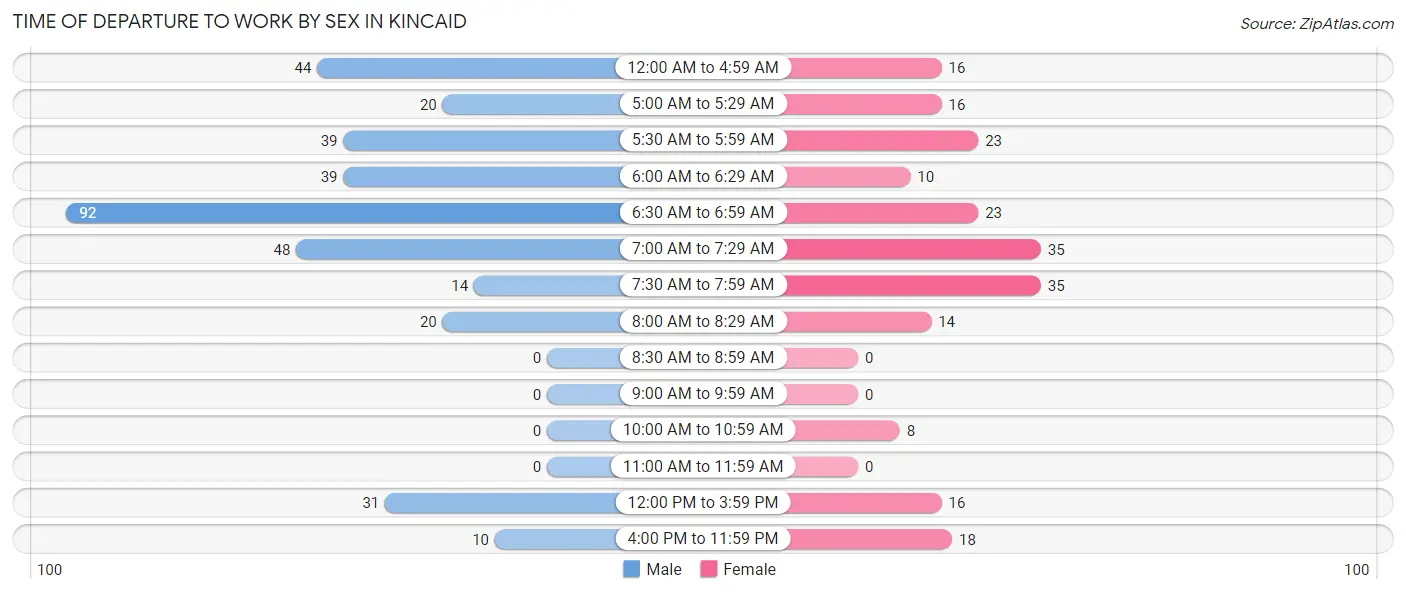
| Time of Departure | Male | Female |
| 12:00 AM to 4:59 AM | 44 (12.3%) | 16 (7.5%) |
| 5:00 AM to 5:29 AM | 20 (5.6%) | 16 (7.5%) |
| 5:30 AM to 5:59 AM | 39 (10.9%) | 23 (10.7%) |
| 6:00 AM to 6:29 AM | 39 (10.9%) | 10 (4.7%) |
| 6:30 AM to 6:59 AM | 92 (25.8%) | 23 (10.7%) |
| 7:00 AM to 7:29 AM | 48 (13.5%) | 35 (16.4%) |
| 7:30 AM to 7:59 AM | 14 (3.9%) | 35 (16.4%) |
| 8:00 AM to 8:29 AM | 20 (5.6%) | 14 (6.5%) |
| 8:30 AM to 8:59 AM | 0 (0.0%) | 0 (0.0%) |
| 9:00 AM to 9:59 AM | 0 (0.0%) | 0 (0.0%) |
| 10:00 AM to 10:59 AM | 0 (0.0%) | 8 (3.7%) |
| 11:00 AM to 11:59 AM | 0 (0.0%) | 0 (0.0%) |
| 12:00 PM to 3:59 PM | 31 (8.7%) | 16 (7.5%) |
| 4:00 PM to 11:59 PM | 10 (2.8%) | 18 (8.4%) |
| Total | 357 (100.0%) | 214 (100.0%) |
Housing Occupancy in Kincaid
Occupancy by Ownership in Kincaid
Of the total 572 dwellings in Kincaid, owner-occupied units account for 425 (74.3%), while renter-occupied units make up 147 (25.7%).
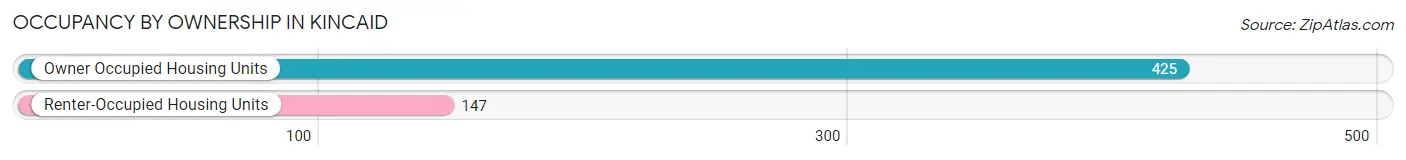
| Occupancy | # Housing Units | % Housing Units |
| Owner Occupied Housing Units | 425 | 74.3% |
| Renter-Occupied Housing Units | 147 | 25.7% |
| Total Occupied Housing Units | 572 | 100.0% |
Occupancy by Household Size in Kincaid
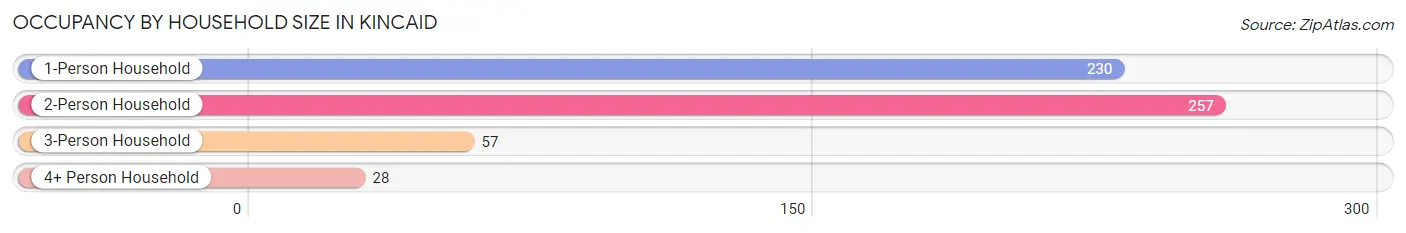
| Household Size | # Housing Units | % Housing Units |
| 1-Person Household | 230 | 40.2% |
| 2-Person Household | 257 | 44.9% |
| 3-Person Household | 57 | 10.0% |
| 4+ Person Household | 28 | 4.9% |
| Total Housing Units | 572 | 100.0% |
Occupancy by Ownership by Household Size in Kincaid
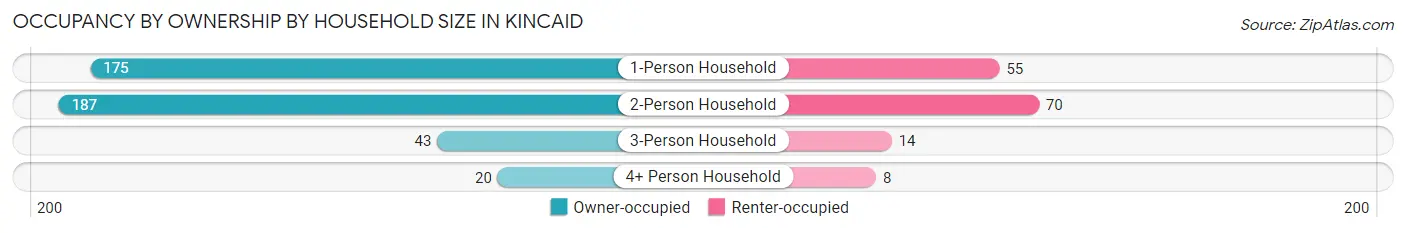
| Household Size | Owner-occupied | Renter-occupied |
| 1-Person Household | 175 (76.1%) | 55 (23.9%) |
| 2-Person Household | 187 (72.8%) | 70 (27.2%) |
| 3-Person Household | 43 (75.4%) | 14 (24.6%) |
| 4+ Person Household | 20 (71.4%) | 8 (28.6%) |
| Total Housing Units | 425 (74.3%) | 147 (25.7%) |
Occupancy by Educational Attainment in Kincaid
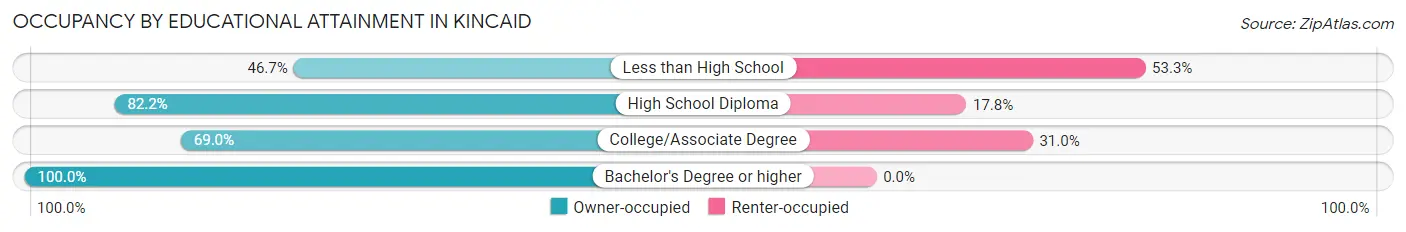
| Household Size | Owner-occupied | Renter-occupied |
| Less than High School | 28 (46.7%) | 32 (53.3%) |
| High School Diploma | 226 (82.2%) | 49 (17.8%) |
| College/Associate Degree | 147 (69.0%) | 66 (31.0%) |
| Bachelor's Degree or higher | 24 (100.0%) | 0 (0.0%) |
Occupancy by Age of Householder in Kincaid
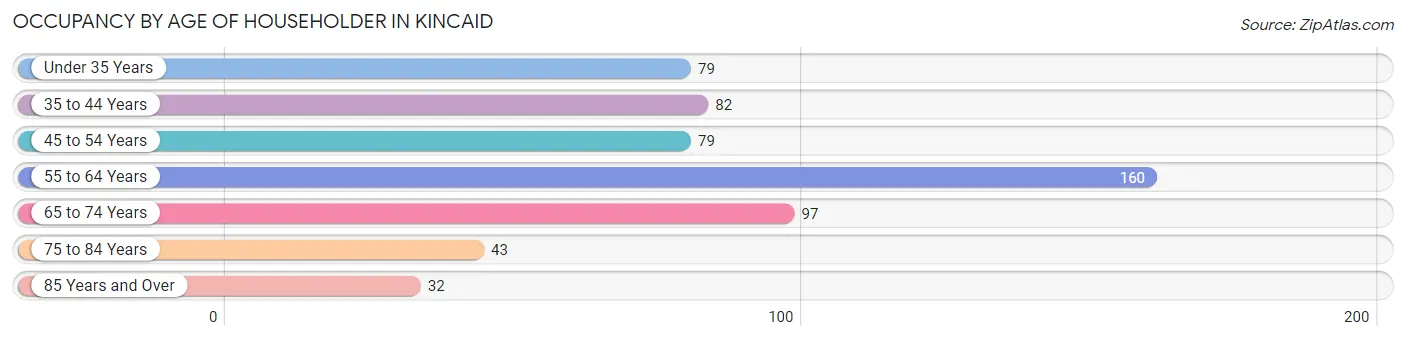
| Age Bracket | # Households | % Households |
| Under 35 Years | 79 | 13.8% |
| 35 to 44 Years | 82 | 14.3% |
| 45 to 54 Years | 79 | 13.8% |
| 55 to 64 Years | 160 | 28.0% |
| 65 to 74 Years | 97 | 17.0% |
| 75 to 84 Years | 43 | 7.5% |
| 85 Years and Over | 32 | 5.6% |
| Total | 572 | 100.0% |
Housing Finances in Kincaid
Median Income by Occupancy in Kincaid
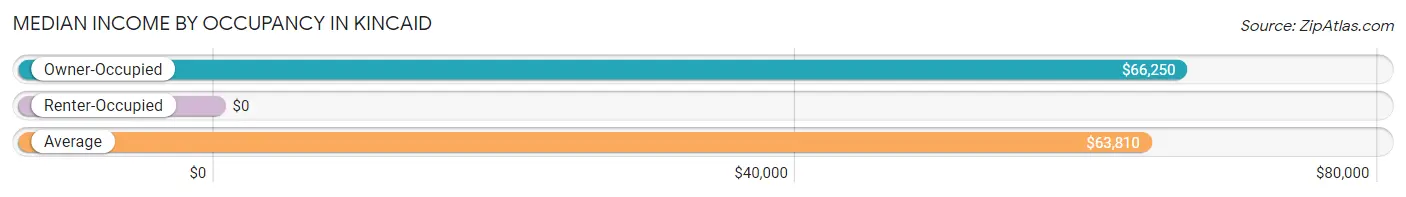
| Occupancy Type | # Households | Median Income |
| Owner-Occupied | 425 (74.3%) | $66,250 |
| Renter-Occupied | 147 (25.7%) | $0 |
| Average | 572 (100.0%) | $63,810 |
Occupancy by Householder Income Bracket in Kincaid
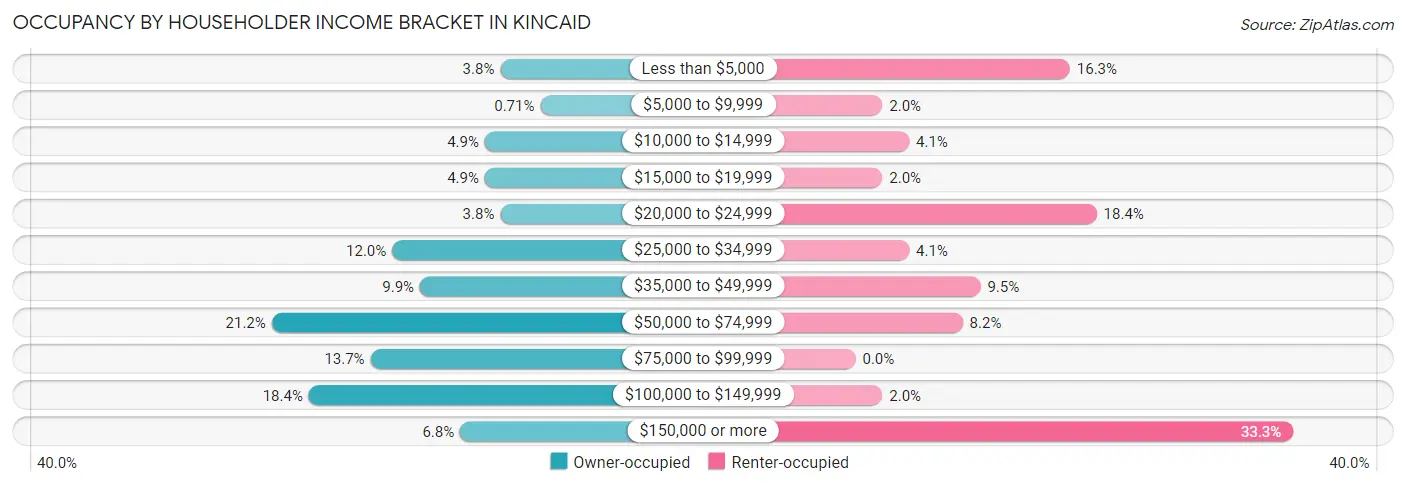
| Income Bracket | Owner-occupied | Renter-occupied |
| Less than $5,000 | 16 (3.8%) | 24 (16.3%) |
| $5,000 to $9,999 | 3 (0.7%) | 3 (2.0%) |
| $10,000 to $14,999 | 21 (4.9%) | 6 (4.1%) |
| $15,000 to $19,999 | 21 (4.9%) | 3 (2.0%) |
| $20,000 to $24,999 | 16 (3.8%) | 27 (18.4%) |
| $25,000 to $34,999 | 51 (12.0%) | 6 (4.1%) |
| $35,000 to $49,999 | 42 (9.9%) | 14 (9.5%) |
| $50,000 to $74,999 | 90 (21.2%) | 12 (8.2%) |
| $75,000 to $99,999 | 58 (13.7%) | 0 (0.0%) |
| $100,000 to $149,999 | 78 (18.3%) | 3 (2.0%) |
| $150,000 or more | 29 (6.8%) | 49 (33.3%) |
| Total | 425 (100.0%) | 147 (100.0%) |
Monthly Housing Cost Tiers in Kincaid
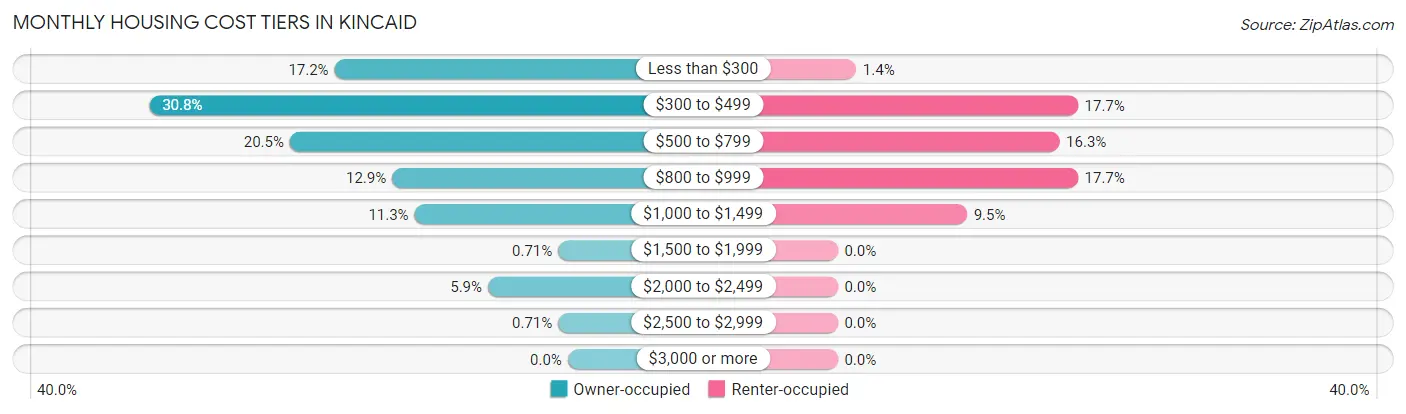
| Monthly Cost | Owner-occupied | Renter-occupied |
| Less than $300 | 73 (17.2%) | 2 (1.4%) |
| $300 to $499 | 131 (30.8%) | 26 (17.7%) |
| $500 to $799 | 87 (20.5%) | 24 (16.3%) |
| $800 to $999 | 55 (12.9%) | 26 (17.7%) |
| $1,000 to $1,499 | 48 (11.3%) | 14 (9.5%) |
| $1,500 to $1,999 | 3 (0.7%) | 0 (0.0%) |
| $2,000 to $2,499 | 25 (5.9%) | 0 (0.0%) |
| $2,500 to $2,999 | 3 (0.7%) | 0 (0.0%) |
| $3,000 or more | 0 (0.0%) | 0 (0.0%) |
| Total | 425 (100.0%) | 147 (100.0%) |
Physical Housing Characteristics in Kincaid
Housing Structures in Kincaid
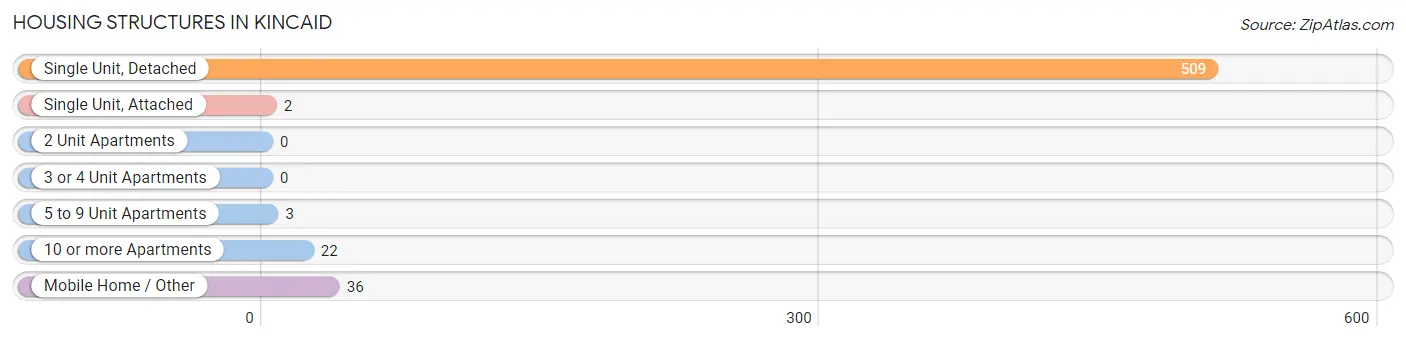
| Structure Type | # Housing Units | % Housing Units |
| Single Unit, Detached | 509 | 89.0% |
| Single Unit, Attached | 2 | 0.4% |
| 2 Unit Apartments | 0 | 0.0% |
| 3 or 4 Unit Apartments | 0 | 0.0% |
| 5 to 9 Unit Apartments | 3 | 0.5% |
| 10 or more Apartments | 22 | 3.8% |
| Mobile Home / Other | 36 | 6.3% |
| Total | 572 | 100.0% |
Housing Structures by Occupancy in Kincaid
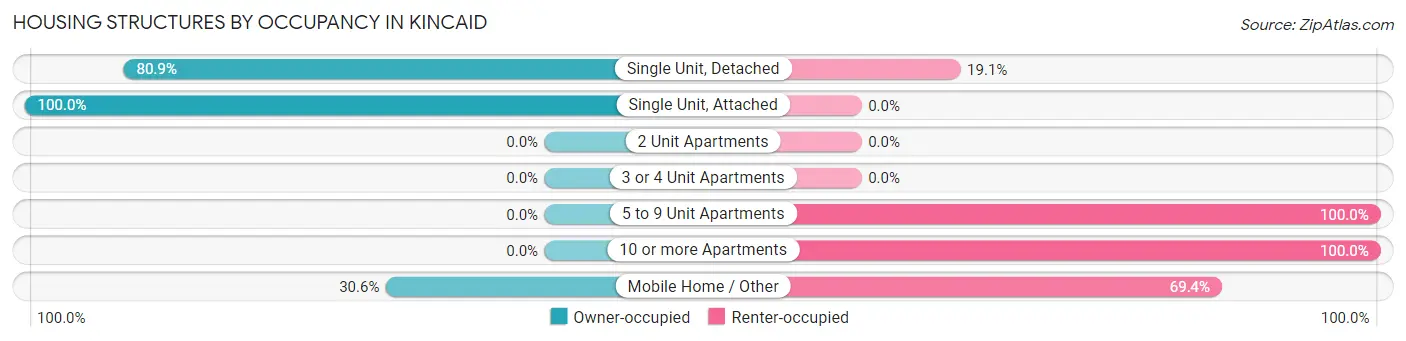
| Structure Type | Owner-occupied | Renter-occupied |
| Single Unit, Detached | 412 (80.9%) | 97 (19.1%) |
| Single Unit, Attached | 2 (100.0%) | 0 (0.0%) |
| 2 Unit Apartments | 0 (0.0%) | 0 (0.0%) |
| 3 or 4 Unit Apartments | 0 (0.0%) | 0 (0.0%) |
| 5 to 9 Unit Apartments | 0 (0.0%) | 3 (100.0%) |
| 10 or more Apartments | 0 (0.0%) | 22 (100.0%) |
| Mobile Home / Other | 11 (30.6%) | 25 (69.4%) |
| Total | 425 (74.3%) | 147 (25.7%) |
Housing Structures by Number of Rooms in Kincaid
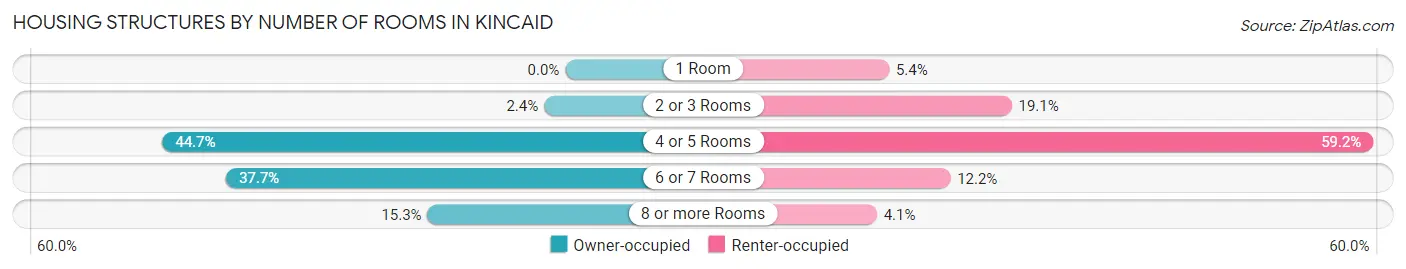
| Number of Rooms | Owner-occupied | Renter-occupied |
| 1 Room | 0 (0.0%) | 8 (5.4%) |
| 2 or 3 Rooms | 10 (2.4%) | 28 (19.1%) |
| 4 or 5 Rooms | 190 (44.7%) | 87 (59.2%) |
| 6 or 7 Rooms | 160 (37.7%) | 18 (12.2%) |
| 8 or more Rooms | 65 (15.3%) | 6 (4.1%) |
| Total | 425 (100.0%) | 147 (100.0%) |
Housing Structure by Heating Type in Kincaid
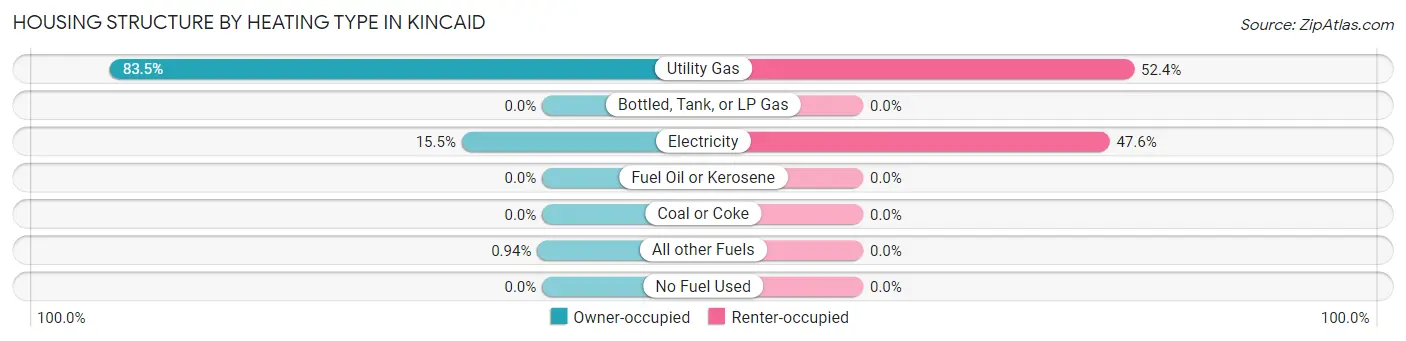
| Heating Type | Owner-occupied | Renter-occupied |
| Utility Gas | 355 (83.5%) | 77 (52.4%) |
| Bottled, Tank, or LP Gas | 0 (0.0%) | 0 (0.0%) |
| Electricity | 66 (15.5%) | 70 (47.6%) |
| Fuel Oil or Kerosene | 0 (0.0%) | 0 (0.0%) |
| Coal or Coke | 0 (0.0%) | 0 (0.0%) |
| All other Fuels | 4 (0.9%) | 0 (0.0%) |
| No Fuel Used | 0 (0.0%) | 0 (0.0%) |
| Total | 425 (100.0%) | 147 (100.0%) |
Household Vehicle Usage in Kincaid
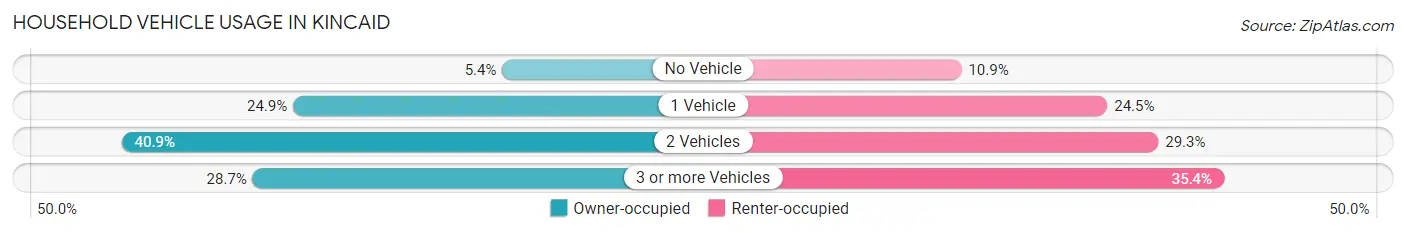
| Vehicles per Household | Owner-occupied | Renter-occupied |
| No Vehicle | 23 (5.4%) | 16 (10.9%) |
| 1 Vehicle | 106 (24.9%) | 36 (24.5%) |
| 2 Vehicles | 174 (40.9%) | 43 (29.2%) |
| 3 or more Vehicles | 122 (28.7%) | 52 (35.4%) |
| Total | 425 (100.0%) | 147 (100.0%) |
Real Estate & Mortgages in Kincaid
Real Estate and Mortgage Overview in Kincaid
| Characteristic | Without Mortgage | With Mortgage |
| Housing Units | 254 | 171 |
| Median Property Value | $66,400 | $96,300 |
| Median Household Income | $40,500 | $14 |
| Monthly Housing Costs | $379 | $0 |
| Real Estate Taxes | $868 | $0 |
Property Value by Mortgage Status in Kincaid
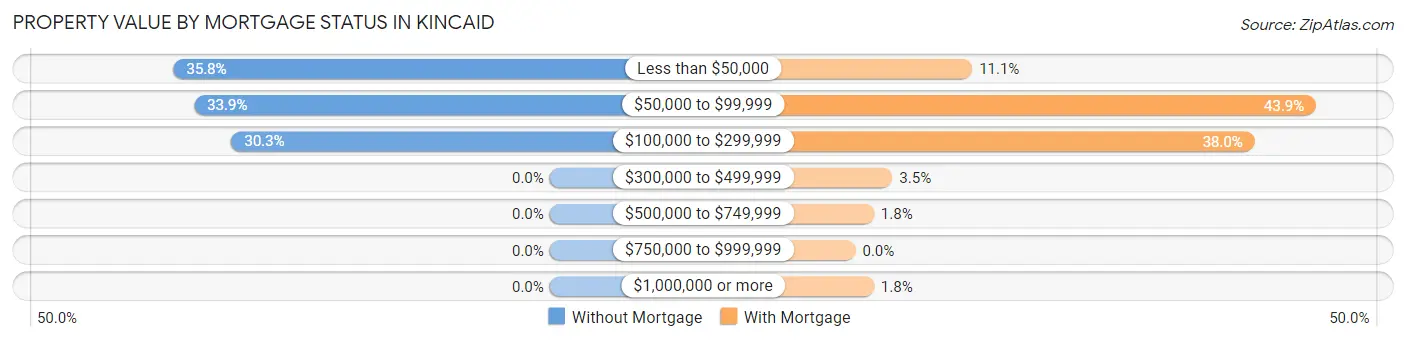
| Property Value | Without Mortgage | With Mortgage |
| Less than $50,000 | 91 (35.8%) | 19 (11.1%) |
| $50,000 to $99,999 | 86 (33.9%) | 75 (43.9%) |
| $100,000 to $299,999 | 77 (30.3%) | 65 (38.0%) |
| $300,000 to $499,999 | 0 (0.0%) | 6 (3.5%) |
| $500,000 to $749,999 | 0 (0.0%) | 3 (1.8%) |
| $750,000 to $999,999 | 0 (0.0%) | 0 (0.0%) |
| $1,000,000 or more | 0 (0.0%) | 3 (1.8%) |
| Total | 254 (100.0%) | 171 (100.0%) |
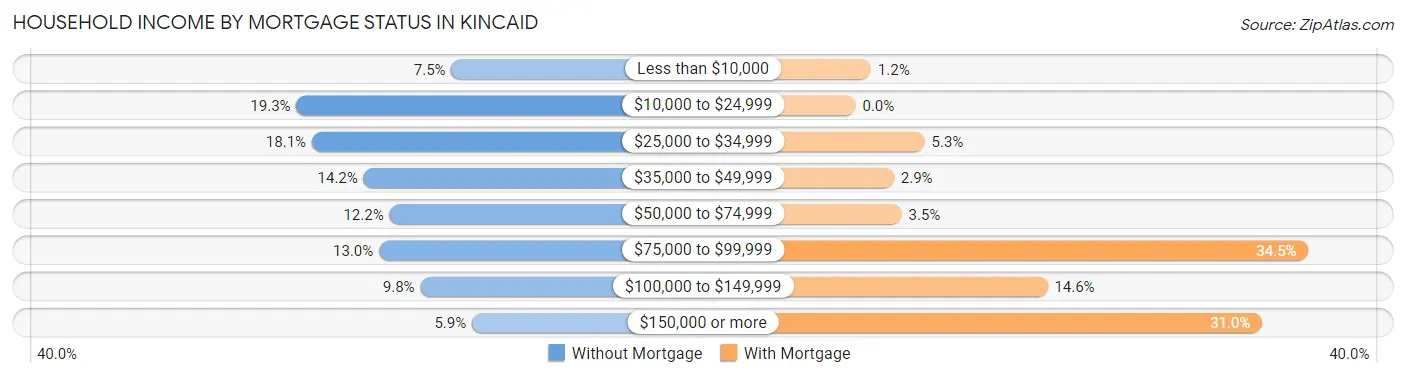
Household Income by Mortgage Status in Kincaid
| Household Income | Without Mortgage | With Mortgage |
| Less than $10,000 | 19 (7.5%) | 2 (1.2%) |
| $10,000 to $24,999 | 49 (19.3%) | 0 (0.0%) |
| $25,000 to $34,999 | 46 (18.1%) | 9 (5.3%) |
| $35,000 to $49,999 | 36 (14.2%) | 5 (2.9%) |
| $50,000 to $74,999 | 31 (12.2%) | 6 (3.5%) |
| $75,000 to $99,999 | 33 (13.0%) | 59 (34.5%) |
| $100,000 to $149,999 | 25 (9.8%) | 25 (14.6%) |
| $150,000 or more | 15 (5.9%) | 53 (31.0%) |
| Total | 254 (100.0%) | 171 (100.0%) |
Property Value to Household Income Ratio in Kincaid
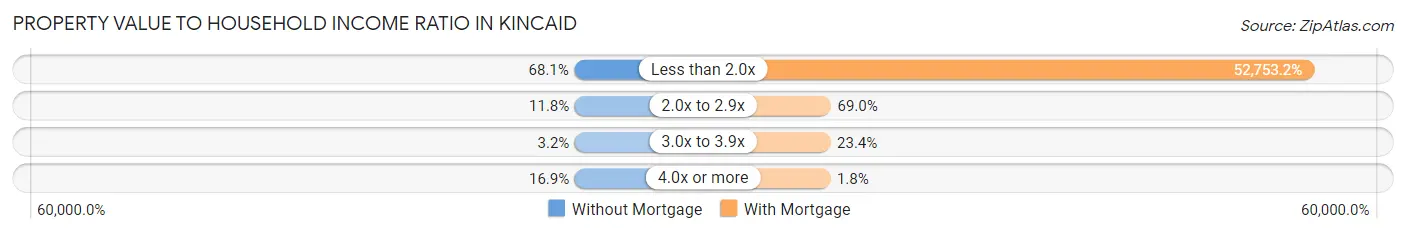
| Value-to-Income Ratio | Without Mortgage | With Mortgage |
| Less than 2.0x | 173 (68.1%) | 90,208 (52,753.2%) |
| 2.0x to 2.9x | 30 (11.8%) | 118 (69.0%) |
| 3.0x to 3.9x | 8 (3.2%) | 40 (23.4%) |
| 4.0x or more | 43 (16.9%) | 3 (1.8%) |
| Total | 254 (100.0%) | 171 (100.0%) |
Real Estate Taxes by Mortgage Status in Kincaid
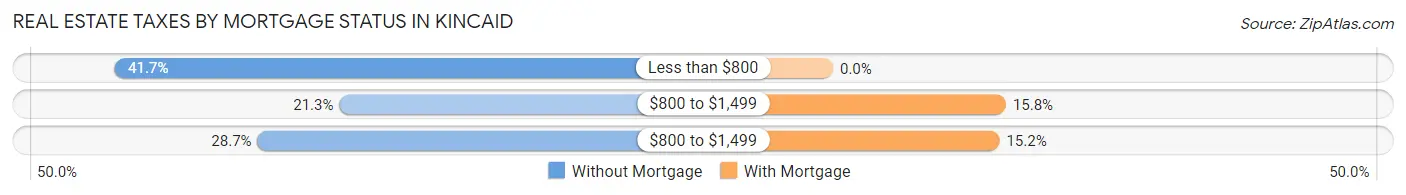
| Property Taxes | Without Mortgage | With Mortgage |
| Less than $800 | 106 (41.7%) | 0 (0.0%) |
| $800 to $1,499 | 54 (21.3%) | 27 (15.8%) |
| $800 to $1,499 | 73 (28.7%) | 26 (15.2%) |
| Total | 254 (100.0%) | 171 (100.0%) |
Health & Disability in Kincaid
Health Insurance Coverage by Age in Kincaid
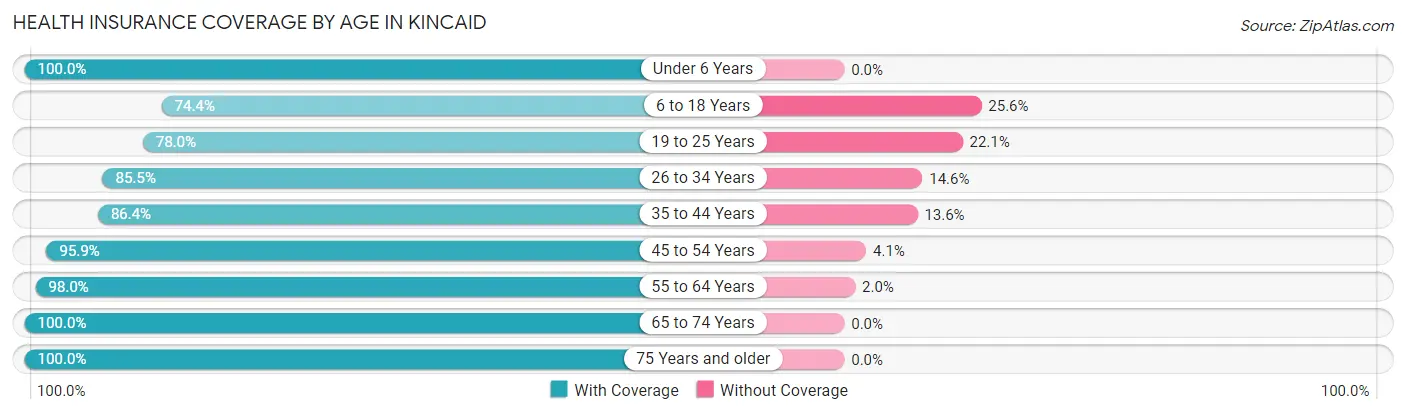
| Age Bracket | With Coverage | Without Coverage |
| Under 6 Years | 48 (100.0%) | 0 (0.0%) |
| 6 to 18 Years | 67 (74.4%) | 23 (25.6%) |
| 19 to 25 Years | 99 (77.9%) | 28 (22.1%) |
| 26 to 34 Years | 47 (85.5%) | 8 (14.5%) |
| 35 to 44 Years | 95 (86.4%) | 15 (13.6%) |
| 45 to 54 Years | 165 (95.9%) | 7 (4.1%) |
| 55 to 64 Years | 291 (98.0%) | 6 (2.0%) |
| 65 to 74 Years | 137 (100.0%) | 0 (0.0%) |
| 75 Years and older | 104 (100.0%) | 0 (0.0%) |
| Total | 1,053 (92.4%) | 87 (7.6%) |
Health Insurance Coverage by Citizenship Status in Kincaid
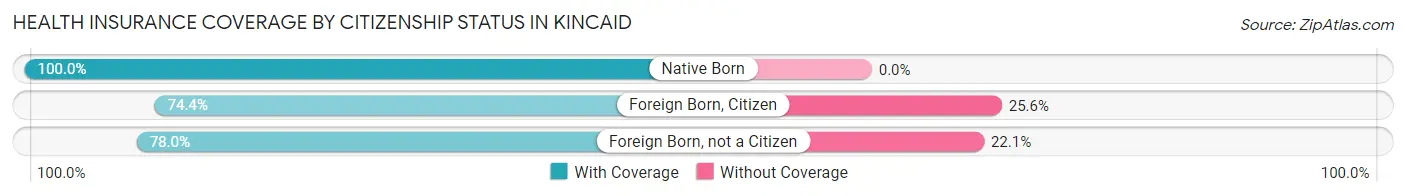
| Citizenship Status | With Coverage | Without Coverage |
| Native Born | 48 (100.0%) | 0 (0.0%) |
| Foreign Born, Citizen | 67 (74.4%) | 23 (25.6%) |
| Foreign Born, not a Citizen | 99 (77.9%) | 28 (22.1%) |
Health Insurance Coverage by Household Income in Kincaid
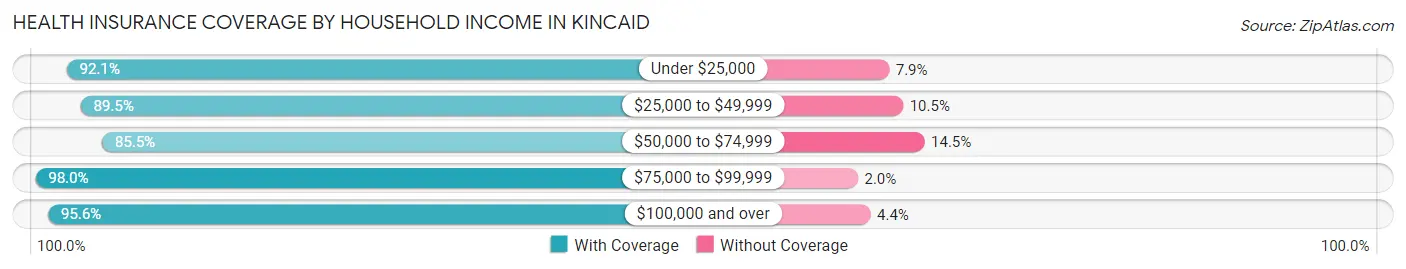
| Household Income | With Coverage | Without Coverage |
| Under $25,000 | 164 (92.1%) | 14 (7.9%) |
| $25,000 to $49,999 | 188 (89.5%) | 22 (10.5%) |
| $50,000 to $74,999 | 183 (85.5%) | 31 (14.5%) |
| $75,000 to $99,999 | 146 (98.0%) | 3 (2.0%) |
| $100,000 and over | 372 (95.6%) | 17 (4.4%) |
Public vs Private Health Insurance Coverage by Age in Kincaid
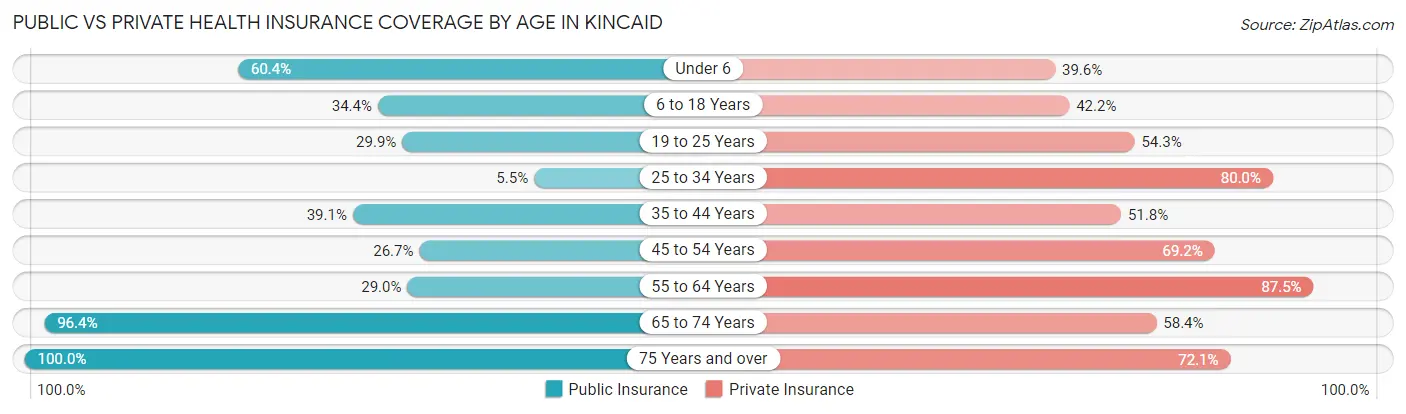
| Age Bracket | Public Insurance | Private Insurance |
| Under 6 | 29 (60.4%) | 19 (39.6%) |
| 6 to 18 Years | 31 (34.4%) | 38 (42.2%) |
| 19 to 25 Years | 38 (29.9%) | 69 (54.3%) |
| 25 to 34 Years | 3 (5.4%) | 44 (80.0%) |
| 35 to 44 Years | 43 (39.1%) | 57 (51.8%) |
| 45 to 54 Years | 46 (26.7%) | 119 (69.2%) |
| 55 to 64 Years | 86 (29.0%) | 260 (87.5%) |
| 65 to 74 Years | 132 (96.4%) | 80 (58.4%) |
| 75 Years and over | 104 (100.0%) | 75 (72.1%) |
| Total | 512 (44.9%) | 761 (66.7%) |
Disability Status by Sex by Age in Kincaid
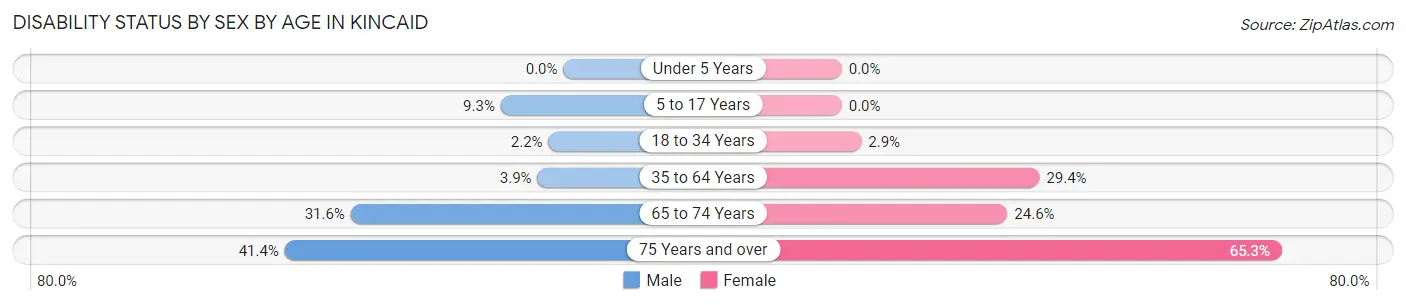
| Age Bracket | Male | Female |
| Under 5 Years | 0 (0.0%) | 0 (0.0%) |
| 5 to 17 Years | 4 (9.3%) | 0 (0.0%) |
| 18 to 34 Years | 3 (2.2%) | 2 (2.9%) |
| 35 to 64 Years | 11 (3.8%) | 86 (29.3%) |
| 65 to 74 Years | 24 (31.6%) | 15 (24.6%) |
| 75 Years and over | 12 (41.4%) | 49 (65.3%) |
Disability Class by Sex by Age in Kincaid
Disability Class: Hearing Difficulty
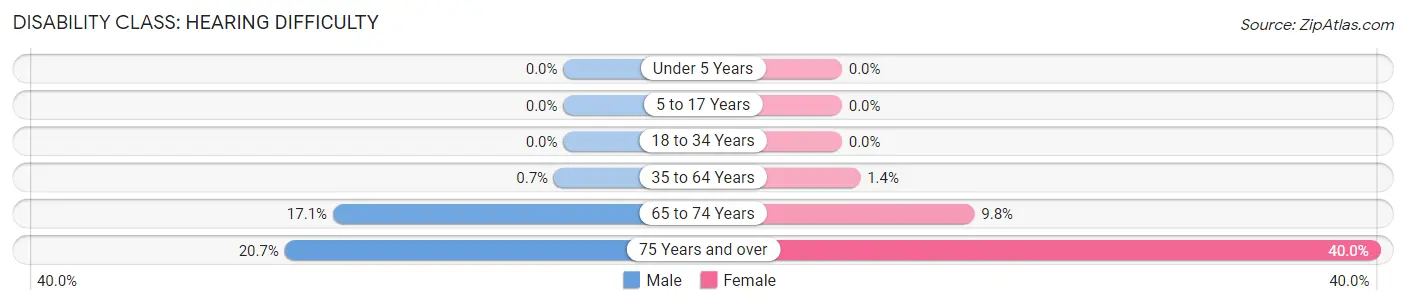
| Age Bracket | Male | Female |
| Under 5 Years | 0 (0.0%) | 0 (0.0%) |
| 5 to 17 Years | 0 (0.0%) | 0 (0.0%) |
| 18 to 34 Years | 0 (0.0%) | 0 (0.0%) |
| 35 to 64 Years | 2 (0.7%) | 4 (1.4%) |
| 65 to 74 Years | 13 (17.1%) | 6 (9.8%) |
| 75 Years and over | 6 (20.7%) | 30 (40.0%) |
Disability Class: Vision Difficulty
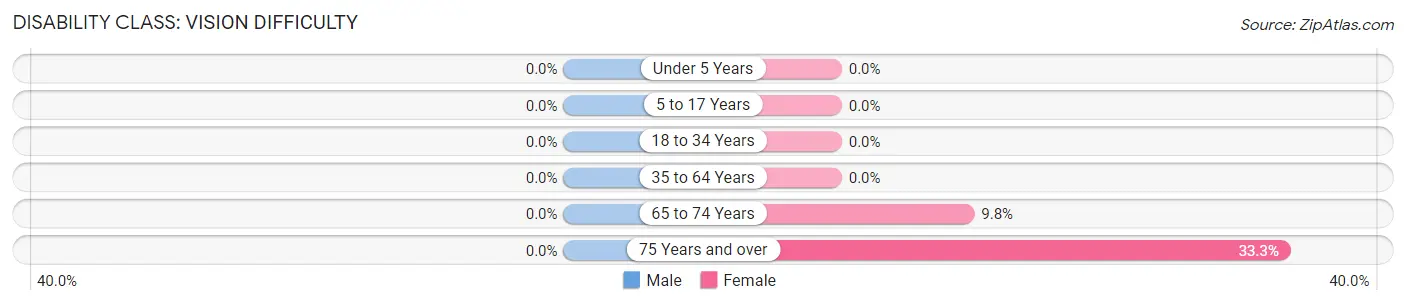
| Age Bracket | Male | Female |
| Under 5 Years | 0 (0.0%) | 0 (0.0%) |
| 5 to 17 Years | 0 (0.0%) | 0 (0.0%) |
| 18 to 34 Years | 0 (0.0%) | 0 (0.0%) |
| 35 to 64 Years | 0 (0.0%) | 0 (0.0%) |
| 65 to 74 Years | 0 (0.0%) | 6 (9.8%) |
| 75 Years and over | 0 (0.0%) | 25 (33.3%) |
Disability Class: Cognitive Difficulty
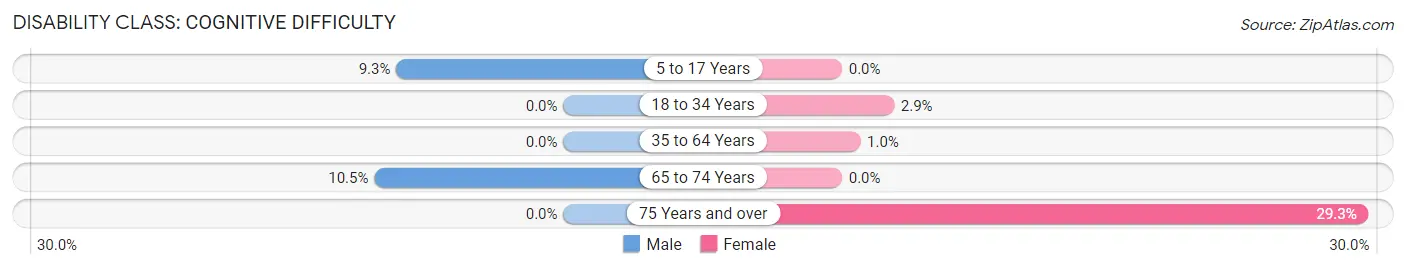
| Age Bracket | Male | Female |
| 5 to 17 Years | 4 (9.3%) | 0 (0.0%) |
| 18 to 34 Years | 0 (0.0%) | 2 (2.9%) |
| 35 to 64 Years | 0 (0.0%) | 3 (1.0%) |
| 65 to 74 Years | 8 (10.5%) | 0 (0.0%) |
| 75 Years and over | 0 (0.0%) | 22 (29.3%) |
Disability Class: Ambulatory Difficulty
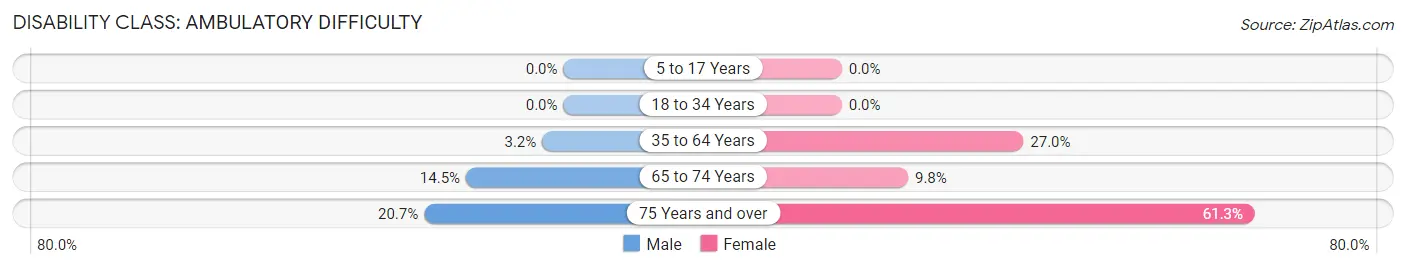
| Age Bracket | Male | Female |
| 5 to 17 Years | 0 (0.0%) | 0 (0.0%) |
| 18 to 34 Years | 0 (0.0%) | 0 (0.0%) |
| 35 to 64 Years | 9 (3.2%) | 79 (27.0%) |
| 65 to 74 Years | 11 (14.5%) | 6 (9.8%) |
| 75 Years and over | 6 (20.7%) | 46 (61.3%) |
Disability Class: Self-Care Difficulty
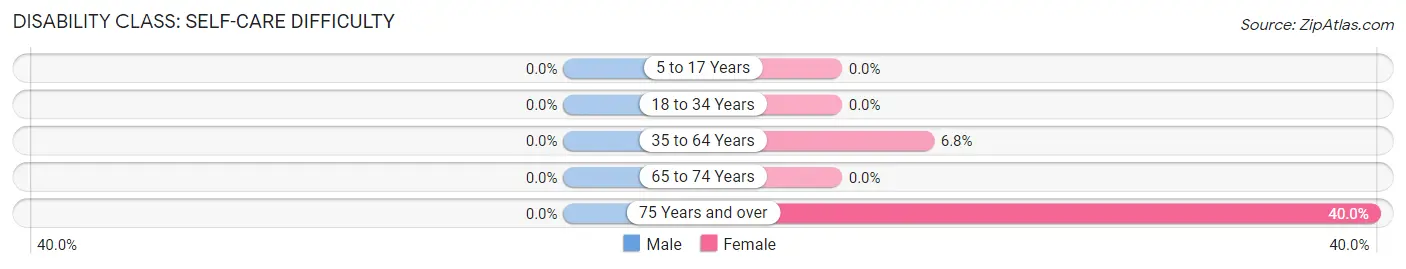
| Age Bracket | Male | Female |
| 5 to 17 Years | 0 (0.0%) | 0 (0.0%) |
| 18 to 34 Years | 0 (0.0%) | 0 (0.0%) |
| 35 to 64 Years | 0 (0.0%) | 20 (6.8%) |
| 65 to 74 Years | 0 (0.0%) | 0 (0.0%) |
| 75 Years and over | 0 (0.0%) | 30 (40.0%) |
Technology Access in Kincaid
Computing Device Access in Kincaid
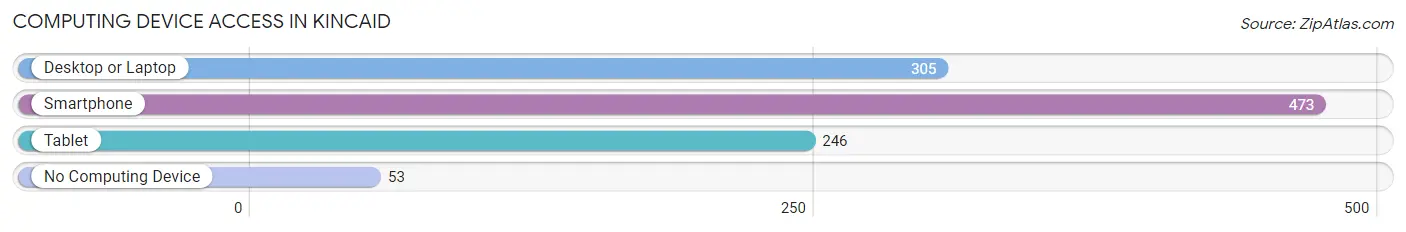
| Device Type | # Households | % Households |
| Desktop or Laptop | 305 | 53.3% |
| Smartphone | 473 | 82.7% |
| Tablet | 246 | 43.0% |
| No Computing Device | 53 | 9.3% |
| Total | 572 | 100.0% |
Internet Access in Kincaid
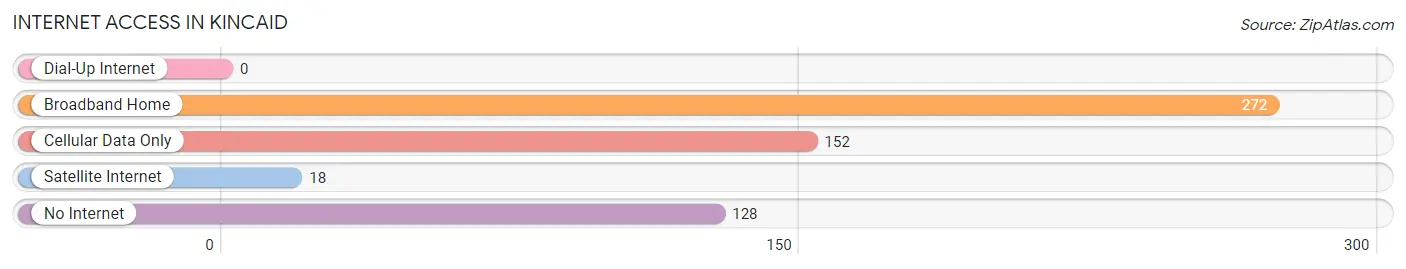
| Internet Type | # Households | % Households |
| Dial-Up Internet | 0 | 0.0% |
| Broadband Home | 272 | 47.5% |
| Cellular Data Only | 152 | 26.6% |
| Satellite Internet | 18 | 3.2% |
| No Internet | 128 | 22.4% |
| Total | 572 | 100.0% |
Kincaid Summary
Kincaid, Illinois is a small village located in Christian County, Illinois. It is situated in the central part of the state, approximately 25 miles south of Springfield. The village has a population of 1,717 people, according to the 2010 census.
History
Kincaid was founded in 1854 by a group of settlers from Kentucky. The village was named after the Kincaid family, who were among the first settlers. The Kincaids were farmers and the village was originally a farming community. The first post office was established in 1855 and the first school was built in 1856.
In the late 19th century, Kincaid began to grow and develop. The village was incorporated in 1887 and the first mayor was elected in 1888. The village was connected to the railroad in 1891, which allowed for the growth of the local economy.
Geography
Kincaid is located in the central part of Illinois, approximately 25 miles south of Springfield. The village is situated in Christian County, which is part of the Springfield Metropolitan Statistical Area. The village is located on the banks of the Sangamon River, which flows through the area.
The village has a total area of 1.2 square miles, all of which is land. The terrain is mostly flat, with some rolling hills in the area. The climate is humid continental, with hot summers and cold winters.
Economy
Kincaid’s economy is largely based on agriculture. The village is home to several farms, which produce a variety of crops, including corn, soybeans, wheat, and hay. The village also has several small businesses, including a grocery store, a hardware store, and a few restaurants.
The village is also home to a few manufacturing companies, including a plastics factory and a metal fabrication plant. The village is also home to a few small technology companies, which provide software and web development services.
Demographics
According to the 2010 census, Kincaid has a population of 1,717 people. The population is predominantly white, with a small minority of African Americans and Hispanics. The median household income is $45,000, and the median age is 38.
Kincaid is a small, rural village with a strong sense of community. The village is home to several churches, a library, and a few parks. The village also has a few small businesses, which provide employment opportunities for the local residents.
Common Questions
What is Per Capita Income in Kincaid?
Per Capita income in Kincaid is $39,565.
What is the Median Family Income in Kincaid?
Median Family Income in Kincaid is $95,417.
What is the Median Household income in Kincaid?
Median Household Income in Kincaid is $63,810.
What is Income or Wage Gap in Kincaid?
Income or Wage Gap in Kincaid is 46.1%.
Women in Kincaid earn 53.9 cents for every dollar earned by a man.
What is Inequality or Gini Index in Kincaid?
Inequality or Gini Index in Kincaid is 0.46.
What is the Total Population of Kincaid?
Total Population of Kincaid is 1,146.
What is the Total Male Population of Kincaid?
Total Male Population of Kincaid is 579.
What is the Total Female Population of Kincaid?
Total Female Population of Kincaid is 567.
What is the Ratio of Males per 100 Females in Kincaid?
There are 102.12 Males per 100 Females in Kincaid.
What is the Ratio of Females per 100 Males in Kincaid?
There are 97.93 Females per 100 Males in Kincaid.
What is the Median Population Age in Kincaid?
Median Population Age in Kincaid is 54.1 Years.
What is the Average Family Size in Kincaid
Average Family Size in Kincaid is 2.7 People.
What is the Average Household Size in Kincaid
Average Household Size in Kincaid is 2.0 People.
How Large is the Labor Force in Kincaid?
There are 600 People in the Labor Forcein in Kincaid.
What is the Percentage of People in the Labor Force in Kincaid?
57.8% of People are in the Labor Force in Kincaid.
What is the Unemployment Rate in Kincaid?
Unemployment Rate in Kincaid is 3.9%.