Hull, IL Map & Demographics
Hull Map
Hull Overview
$28,142
PER CAPITA INCOME
$71,250
AVG FAMILY INCOME
$56,495
AVG HOUSEHOLD INCOME
11.6%
WAGE / INCOME GAP [ % ]
88.4¢/ $1
WAGE / INCOME GAP [ $ ]
0.33
INEQUALITY / GINI INDEX
460
TOTAL POPULATION
211
MALE POPULATION
249
FEMALE POPULATION
84.74
MALES / 100 FEMALES
118.01
FEMALES / 100 MALES
44.0
MEDIAN AGE
3.1
AVG FAMILY SIZE
2.2
AVG HOUSEHOLD SIZE
256
LABOR FORCE [ PEOPLE ]
67.0%
PERCENT IN LABOR FORCE
0.4%
UNEMPLOYMENT RATE
Hull Zip Codes
Hull Area Codes
Income in Hull
Income Overview in Hull
Per Capita Income in Hull is $28,142, while median incomes of families and households are $71,250 and $56,495 respectively.
| Characteristic | Number | Measure |
| Per Capita Income | 460 | $28,142 |
| Median Family Income | 104 | $71,250 |
| Mean Family Income | 104 | $70,538 |
| Median Household Income | 213 | $56,495 |
| Mean Household Income | 213 | $57,437 |
| Income Deficit | 104 | $0 |
| Wage / Income Gap (%) | 460 | 11.56% |
| Wage / Income Gap ($) | 460 | 88.44¢ per $1 |
| Gini / Inequality Index | 460 | 0.33 |
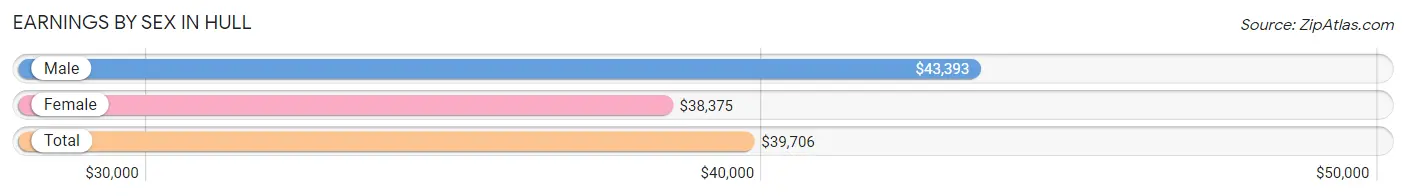
Earnings by Sex in Hull
Average Earnings in Hull are $39,706, $43,393 for men and $38,375 for women, a difference of 11.6%.
| Sex | Number | Average Earnings |
| Male | 103 (38.7%) | $43,393 |
| Female | 163 (61.3%) | $38,375 |
| Total | 266 (100.0%) | $39,706 |
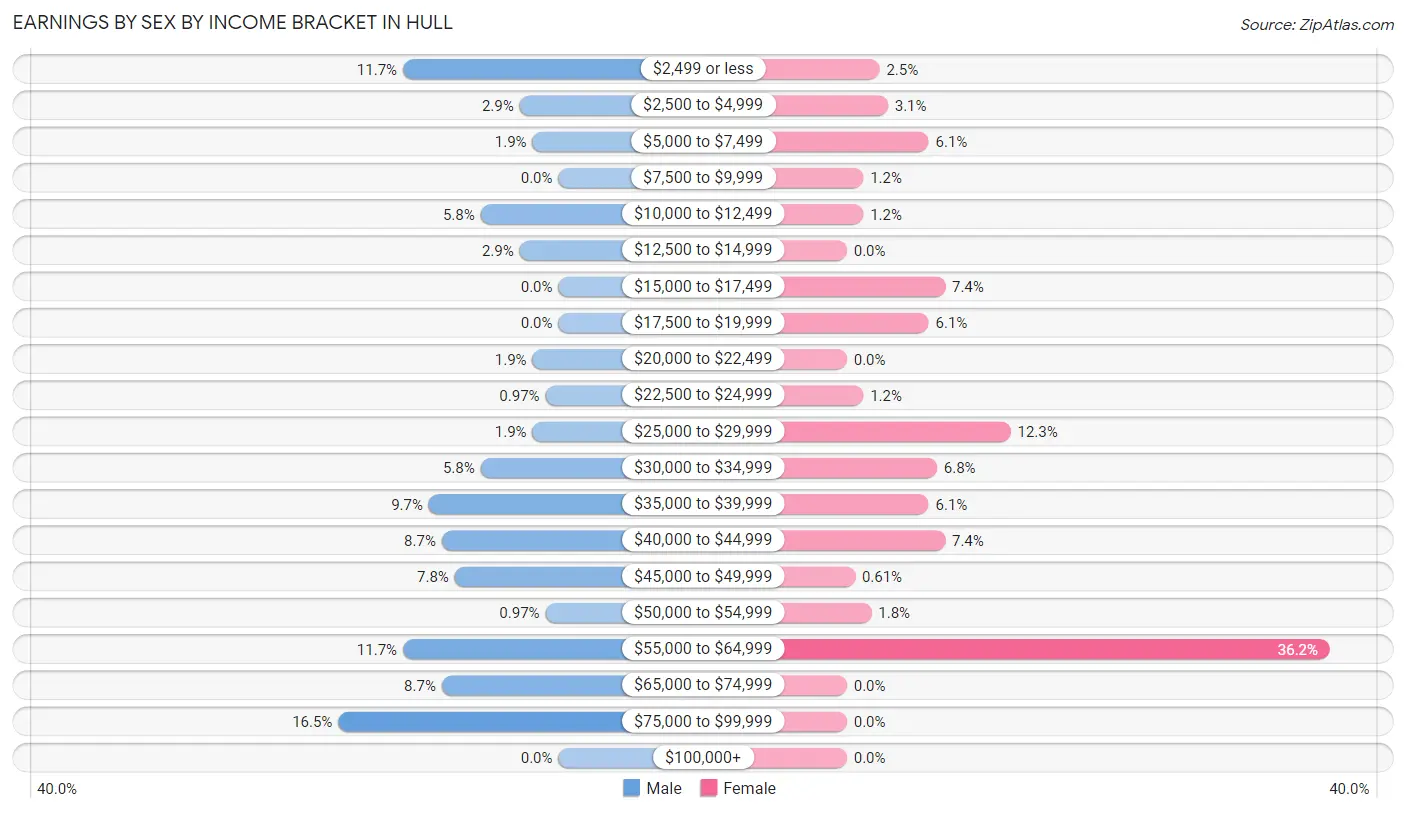
Earnings by Sex by Income Bracket in Hull
The most common earnings brackets in Hull are $75,000 to $99,999 for men (17 | 16.5%) and $55,000 to $64,999 for women (59 | 36.2%).
| Income | Male | Female |
| $2,499 or less | 12 (11.7%) | 4 (2.5%) |
| $2,500 to $4,999 | 3 (2.9%) | 5 (3.1%) |
| $5,000 to $7,499 | 2 (1.9%) | 10 (6.1%) |
| $7,500 to $9,999 | 0 (0.0%) | 2 (1.2%) |
| $10,000 to $12,499 | 6 (5.8%) | 2 (1.2%) |
| $12,500 to $14,999 | 3 (2.9%) | 0 (0.0%) |
| $15,000 to $17,499 | 0 (0.0%) | 12 (7.4%) |
| $17,500 to $19,999 | 0 (0.0%) | 10 (6.1%) |
| $20,000 to $22,499 | 2 (1.9%) | 0 (0.0%) |
| $22,500 to $24,999 | 1 (1.0%) | 2 (1.2%) |
| $25,000 to $29,999 | 2 (1.9%) | 20 (12.3%) |
| $30,000 to $34,999 | 6 (5.8%) | 11 (6.8%) |
| $35,000 to $39,999 | 10 (9.7%) | 10 (6.1%) |
| $40,000 to $44,999 | 9 (8.7%) | 12 (7.4%) |
| $45,000 to $49,999 | 8 (7.8%) | 1 (0.6%) |
| $50,000 to $54,999 | 1 (1.0%) | 3 (1.8%) |
| $55,000 to $64,999 | 12 (11.7%) | 59 (36.2%) |
| $65,000 to $74,999 | 9 (8.7%) | 0 (0.0%) |
| $75,000 to $99,999 | 17 (16.5%) | 0 (0.0%) |
| $100,000+ | 0 (0.0%) | 0 (0.0%) |
| Total | 103 (100.0%) | 163 (100.0%) |
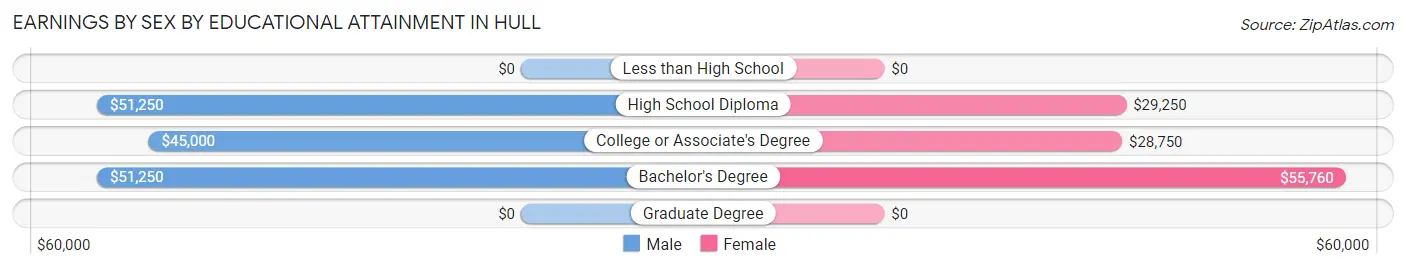
Earnings by Sex by Educational Attainment in Hull
Average earnings in Hull are $44,464 for men and $39,000 for women, a difference of 12.3%. Men with an educational attainment of high school diploma enjoy the highest average annual earnings of $51,250, while those with college or associate's degree education earn the least with $45,000. Women with an educational attainment of bachelor's degree earn the most with the average annual earnings of $55,760, while those with college or associate's degree education have the smallest earnings of $28,750.
| Educational Attainment | Male Income | Female Income |
| Less than High School | - | - |
| High School Diploma | $51,250 | $29,250 |
| College or Associate's Degree | $45,000 | $28,750 |
| Bachelor's Degree | $51,250 | $55,760 |
| Graduate Degree | - | - |
| Total | $44,464 | $39,000 |
Family Income in Hull
Family Income Brackets in Hull
According to the Hull family income data, there are 28 families falling into the $75,000 to $99,999 income range, which is the most common income bracket and makes up 26.9% of all families.
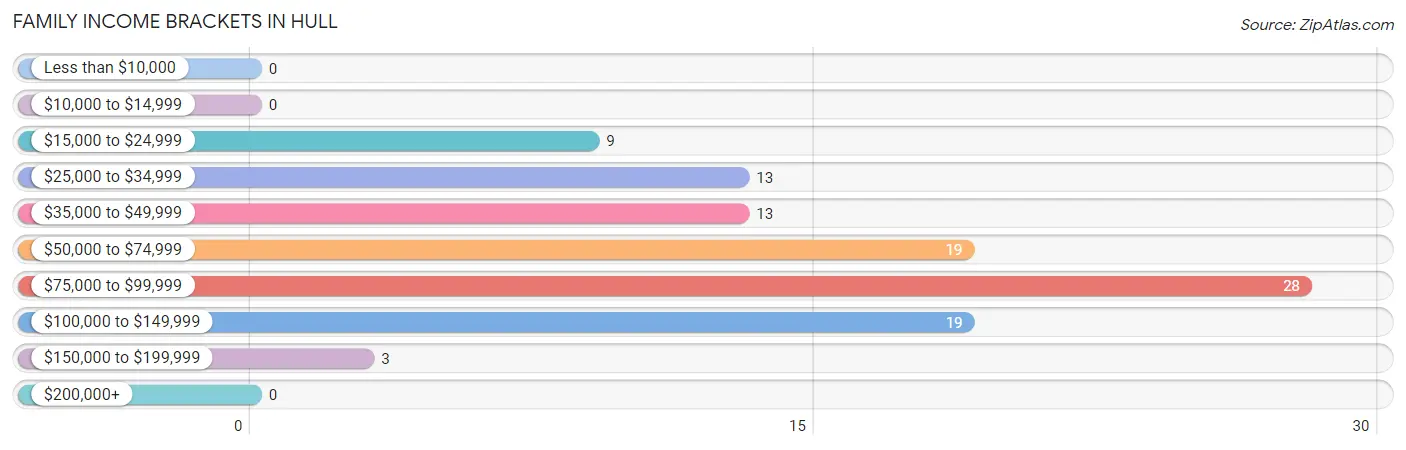
| Income Bracket | # Families | % Families |
| Less than $10,000 | 0 | 0.0% |
| $10,000 to $14,999 | 0 | 0.0% |
| $15,000 to $24,999 | 9 | 8.7% |
| $25,000 to $34,999 | 13 | 12.5% |
| $35,000 to $49,999 | 13 | 12.5% |
| $50,000 to $74,999 | 19 | 18.3% |
| $75,000 to $99,999 | 28 | 26.9% |
| $100,000 to $149,999 | 19 | 18.3% |
| $150,000 to $199,999 | 3 | 2.9% |
| $200,000+ | 0 | 0.0% |
Family Income by Famaliy Size in Hull
5-person families (13 | 12.5%) account for the highest median family income in Hull with $103,542 per family, while 2-person families (52 | 50.0%) have the highest median income of $32,678 per family member.
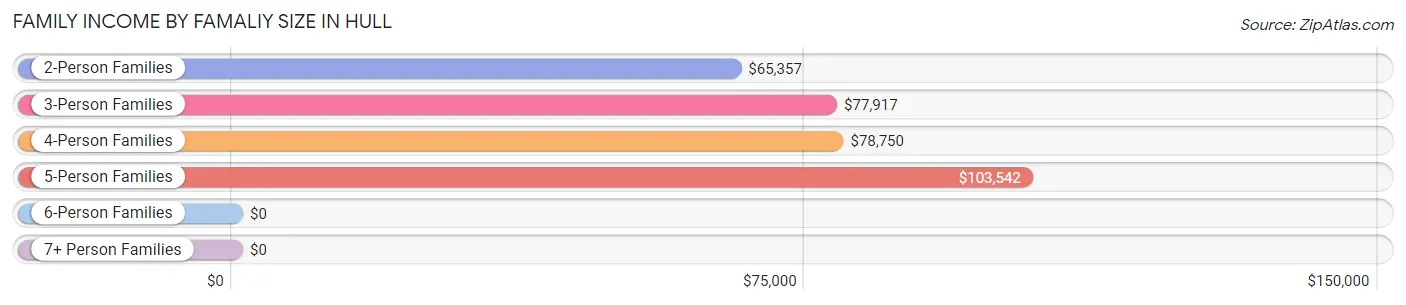
| Income Bracket | # Families | Median Income |
| 2-Person Families | 52 (50.0%) | $65,357 |
| 3-Person Families | 31 (29.8%) | $77,917 |
| 4-Person Families | 8 (7.7%) | $78,750 |
| 5-Person Families | 13 (12.5%) | $103,542 |
| 6-Person Families | 0 (0.0%) | $0 |
| 7+ Person Families | 0 (0.0%) | $0 |
| Total | 104 (100.0%) | $71,250 |
Family Income by Number of Earners in Hull
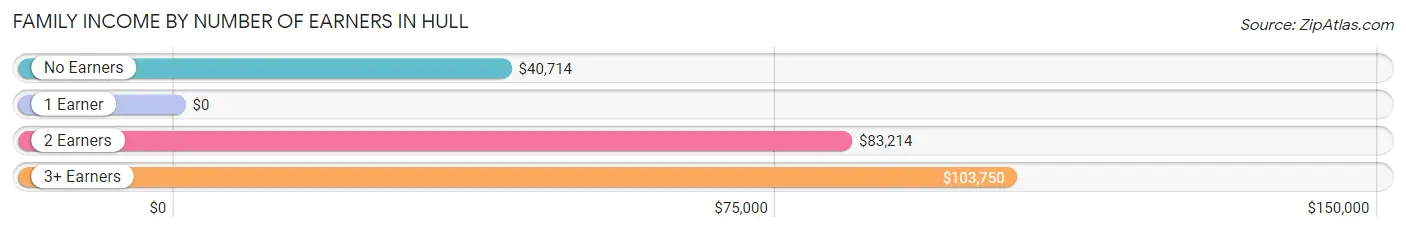
| Number of Earners | # Families | Median Income |
| No Earners | 14 (13.5%) | $40,714 |
| 1 Earner | 34 (32.7%) | $0 |
| 2 Earners | 46 (44.2%) | $83,214 |
| 3+ Earners | 10 (9.6%) | $103,750 |
| Total | 104 (100.0%) | $71,250 |
Household Income in Hull
Household Income Brackets in Hull
With 74 households falling in the category, the $50,000 to $74,999 income range is the most frequent in Hull, accounting for 34.7% of all households.
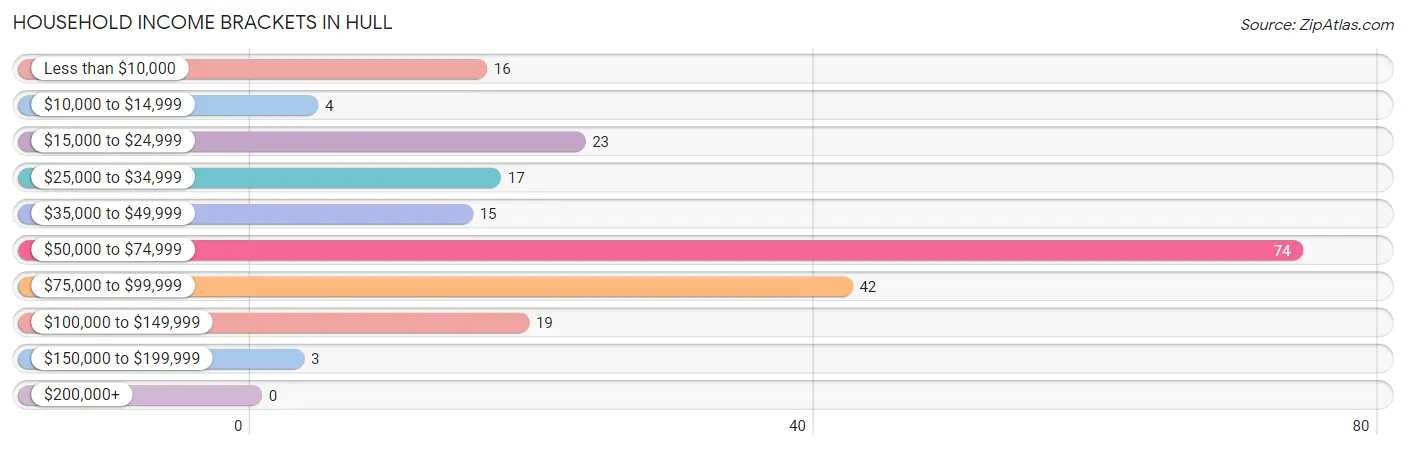
| Income Bracket | # Households | % Households |
| Less than $10,000 | 16 | 7.5% |
| $10,000 to $14,999 | 4 | 1.9% |
| $15,000 to $24,999 | 23 | 10.8% |
| $25,000 to $34,999 | 17 | 8.0% |
| $35,000 to $49,999 | 15 | 7.0% |
| $50,000 to $74,999 | 74 | 34.7% |
| $75,000 to $99,999 | 42 | 19.7% |
| $100,000 to $149,999 | 19 | 8.9% |
| $150,000 to $199,999 | 3 | 1.4% |
| $200,000+ | 0 | 0.0% |
Household Income by Householder Age in Hull
The median household income in Hull is $56,495, with the highest median household income of $80,750 found in the 25 to 44 years age bracket for the primary householder. A total of 53 households (24.9%) fall into this category. Meanwhile, the 15 to 24 years age bracket for the primary householder has the lowest median household income of $0, with 2 households (0.9%) in this group.
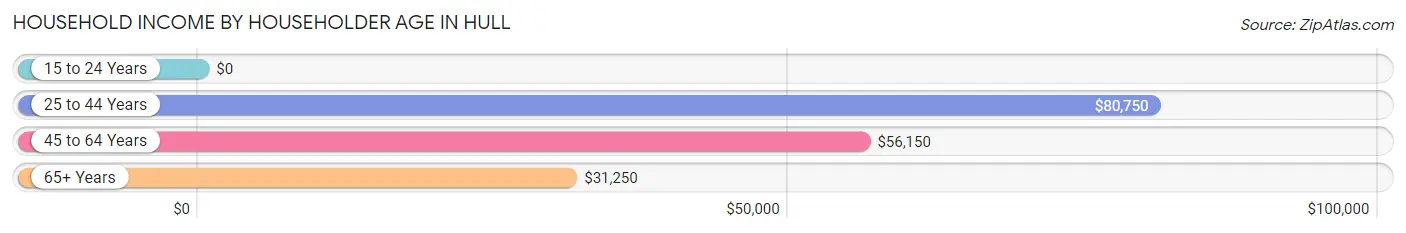
| Income Bracket | # Households | Median Income |
| 15 to 24 Years | 2 (0.9%) | $0 |
| 25 to 44 Years | 53 (24.9%) | $80,750 |
| 45 to 64 Years | 120 (56.3%) | $56,150 |
| 65+ Years | 38 (17.8%) | $31,250 |
| Total | 213 (100.0%) | $56,495 |
Poverty in Hull
Income Below Poverty by Sex and Age in Hull
With 9.5% poverty level for males and 15.7% for females among the residents of Hull, 18 to 24 year old males and 15 year old females are the most vulnerable to poverty, with 3 males (50.0%) and 2 females (100.0%) in their respective age groups living below the poverty level.
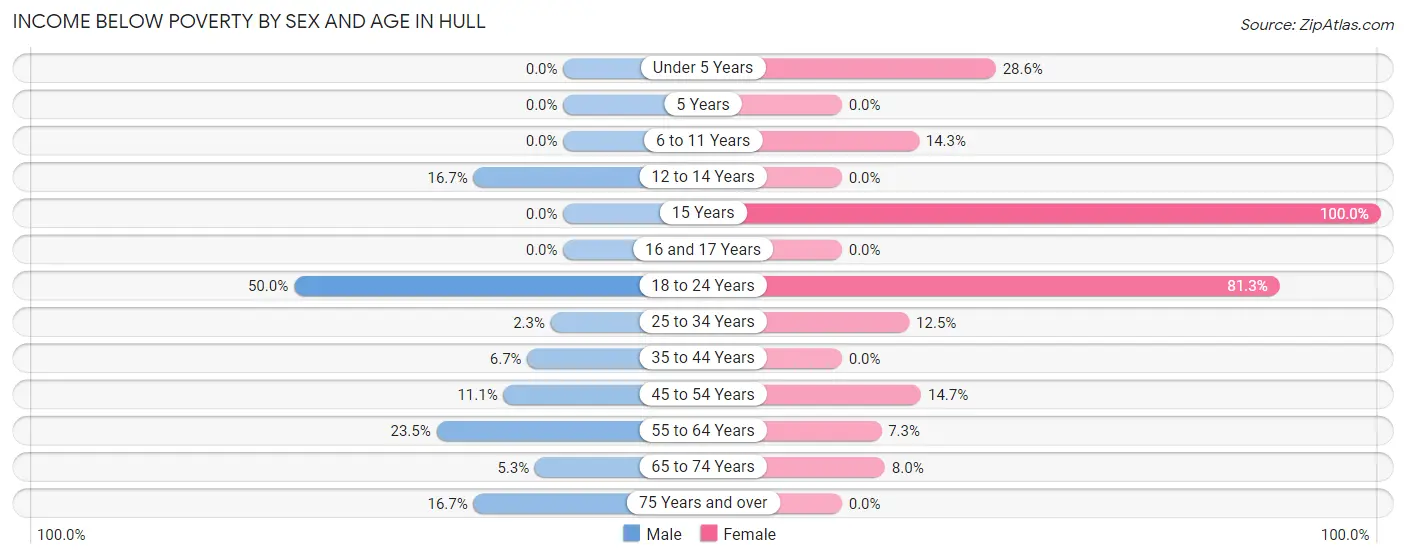
| Age Bracket | Male | Female |
| Under 5 Years | 0 (0.0%) | 4 (28.6%) |
| 5 Years | 0 (0.0%) | 0 (0.0%) |
| 6 to 11 Years | 0 (0.0%) | 1 (14.3%) |
| 12 to 14 Years | 1 (16.7%) | 0 (0.0%) |
| 15 Years | 0 (0.0%) | 2 (100.0%) |
| 16 and 17 Years | 0 (0.0%) | 0 (0.0%) |
| 18 to 24 Years | 3 (50.0%) | 13 (81.2%) |
| 25 to 34 Years | 1 (2.3%) | 4 (12.5%) |
| 35 to 44 Years | 2 (6.7%) | 0 (0.0%) |
| 45 to 54 Years | 2 (11.1%) | 10 (14.7%) |
| 55 to 64 Years | 8 (23.5%) | 3 (7.3%) |
| 65 to 74 Years | 1 (5.3%) | 2 (8.0%) |
| 75 Years and over | 2 (16.7%) | 0 (0.0%) |
| Total | 20 (9.5%) | 39 (15.7%) |
Income Above Poverty by Sex and Age in Hull
According to the poverty statistics in Hull, males aged under 5 years and females aged 5 years are the age groups that are most secure financially, with 100.0% of males and 100.0% of females in these age groups living above the poverty line.
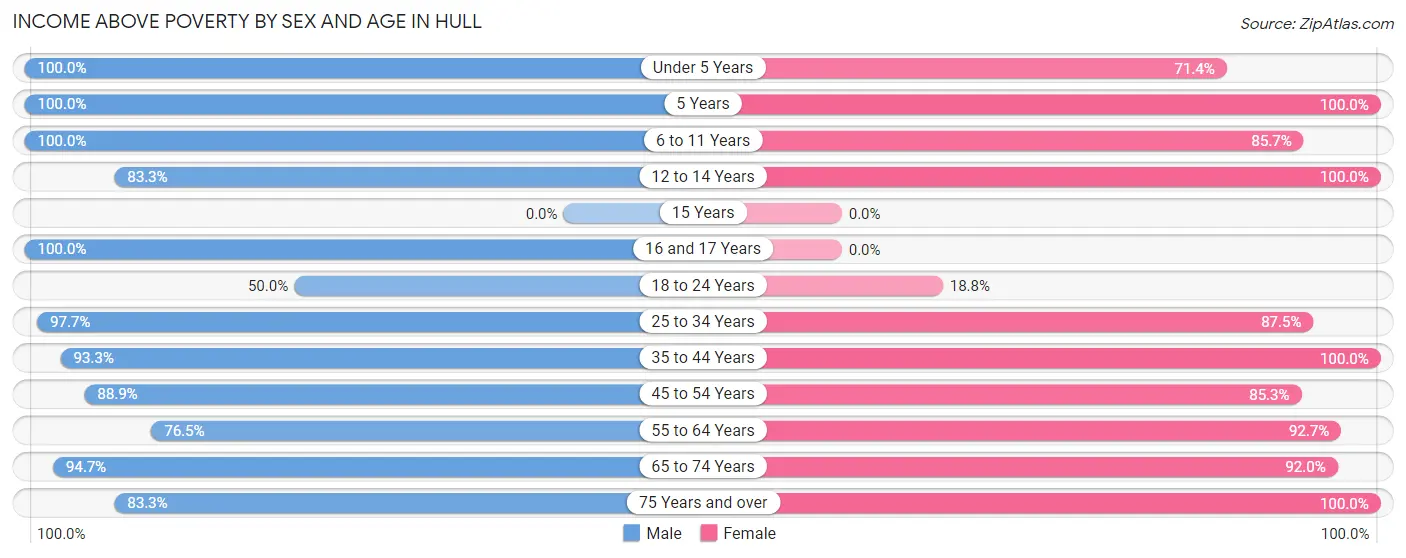
| Age Bracket | Male | Female |
| Under 5 Years | 17 (100.0%) | 10 (71.4%) |
| 5 Years | 5 (100.0%) | 5 (100.0%) |
| 6 to 11 Years | 16 (100.0%) | 6 (85.7%) |
| 12 to 14 Years | 5 (83.3%) | 6 (100.0%) |
| 15 Years | 0 (0.0%) | 0 (0.0%) |
| 16 and 17 Years | 5 (100.0%) | 0 (0.0%) |
| 18 to 24 Years | 3 (50.0%) | 3 (18.8%) |
| 25 to 34 Years | 42 (97.7%) | 28 (87.5%) |
| 35 to 44 Years | 28 (93.3%) | 28 (100.0%) |
| 45 to 54 Years | 16 (88.9%) | 58 (85.3%) |
| 55 to 64 Years | 26 (76.5%) | 38 (92.7%) |
| 65 to 74 Years | 18 (94.7%) | 23 (92.0%) |
| 75 Years and over | 10 (83.3%) | 5 (100.0%) |
| Total | 191 (90.5%) | 210 (84.3%) |
Income Below Poverty Among Married-Couple Families in Hull
The poverty statistics for married-couple families in Hull show that 2.6% or 2 of the total 78 families live below the poverty line. Families with 1 or 2 children have the highest poverty rate of 9.1%, comprising of 2 families. On the other hand, families with no children have the lowest poverty rate of 0.0%, which includes 0 families.
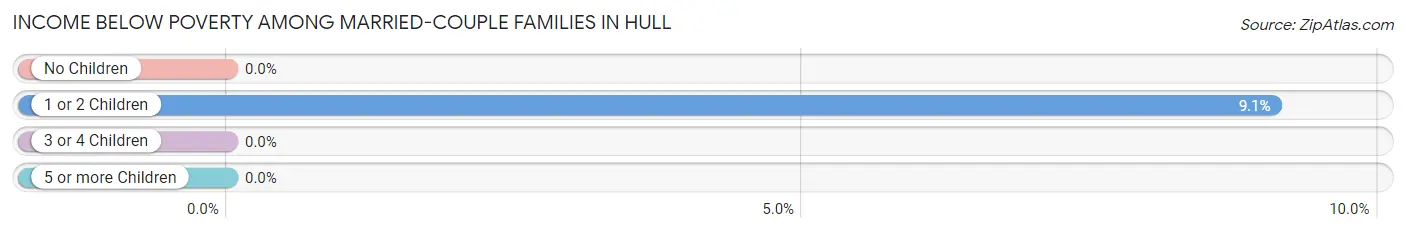
| Children | Above Poverty | Below Poverty |
| No Children | 46 (100.0%) | 0 (0.0%) |
| 1 or 2 Children | 20 (90.9%) | 2 (9.1%) |
| 3 or 4 Children | 10 (100.0%) | 0 (0.0%) |
| 5 or more Children | 0 (0.0%) | 0 (0.0%) |
| Total | 76 (97.4%) | 2 (2.6%) |
Income Below Poverty Among Single-Parent Households in Hull
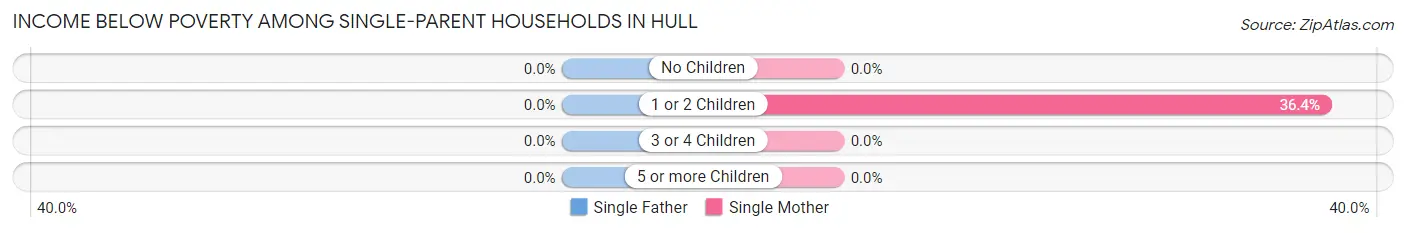
| Children | Single Father | Single Mother |
| No Children | 0 (0.0%) | 0 (0.0%) |
| 1 or 2 Children | 0 (0.0%) | 4 (36.4%) |
| 3 or 4 Children | 0 (0.0%) | 0 (0.0%) |
| 5 or more Children | 0 (0.0%) | 0 (0.0%) |
| Total | 0 (0.0%) | 4 (22.2%) |
Income Below Poverty Among Married-Couple vs Single-Parent Households in Hull
The poverty data for Hull shows that 2 of the married-couple family households (2.6%) and 4 of the single-parent households (15.4%) are living below the poverty level. Within the married-couple family households, those with 1 or 2 children have the highest poverty rate, with 2 households (9.1%) falling below the poverty line. Among the single-parent households, those with 1 or 2 children have the highest poverty rate, with 4 household (23.5%) living below poverty.
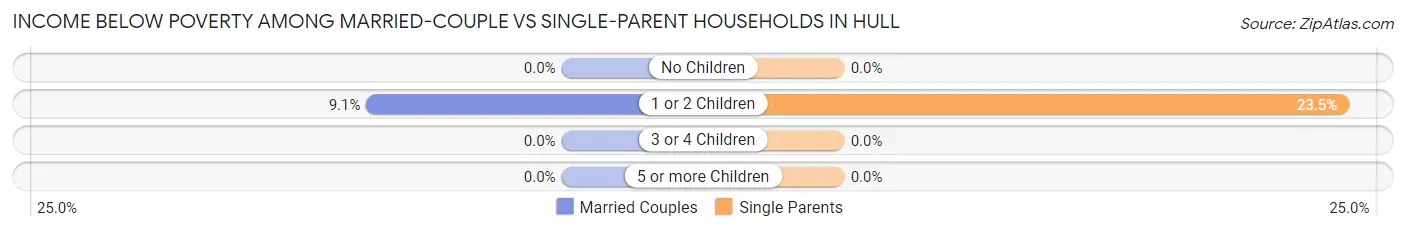
| Children | Married-Couple Families | Single-Parent Households |
| No Children | 0 (0.0%) | 0 (0.0%) |
| 1 or 2 Children | 2 (9.1%) | 4 (23.5%) |
| 3 or 4 Children | 0 (0.0%) | 0 (0.0%) |
| 5 or more Children | 0 (0.0%) | 0 (0.0%) |
| Total | 2 (2.6%) | 4 (15.4%) |
Race in Hull
The most populous races in Hull are White / Caucasian (445 | 96.7%), Two or more Races (14 | 3.0%), and Hispanic or Latino (12 | 2.6%).
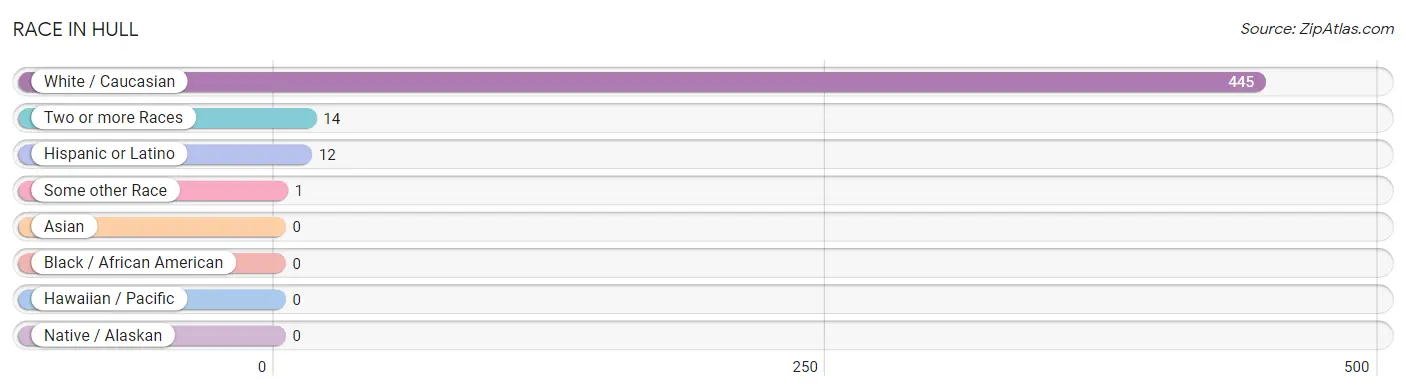
| Race | # Population | % Population |
| Asian | 0 | 0.0% |
| Black / African American | 0 | 0.0% |
| Hawaiian / Pacific | 0 | 0.0% |
| Hispanic or Latino | 12 | 2.6% |
| Native / Alaskan | 0 | 0.0% |
| White / Caucasian | 445 | 96.7% |
| Two or more Races | 14 | 3.0% |
| Some other Race | 1 | 0.2% |
| Total | 460 | 100.0% |
Ancestry in Hull
The most populous ancestries reported in Hull are German (127 | 27.6%), Scottish (54 | 11.7%), American (24 | 5.2%), English (20 | 4.3%), and Irish (16 | 3.5%), together accounting for 52.4% of all Hull residents.
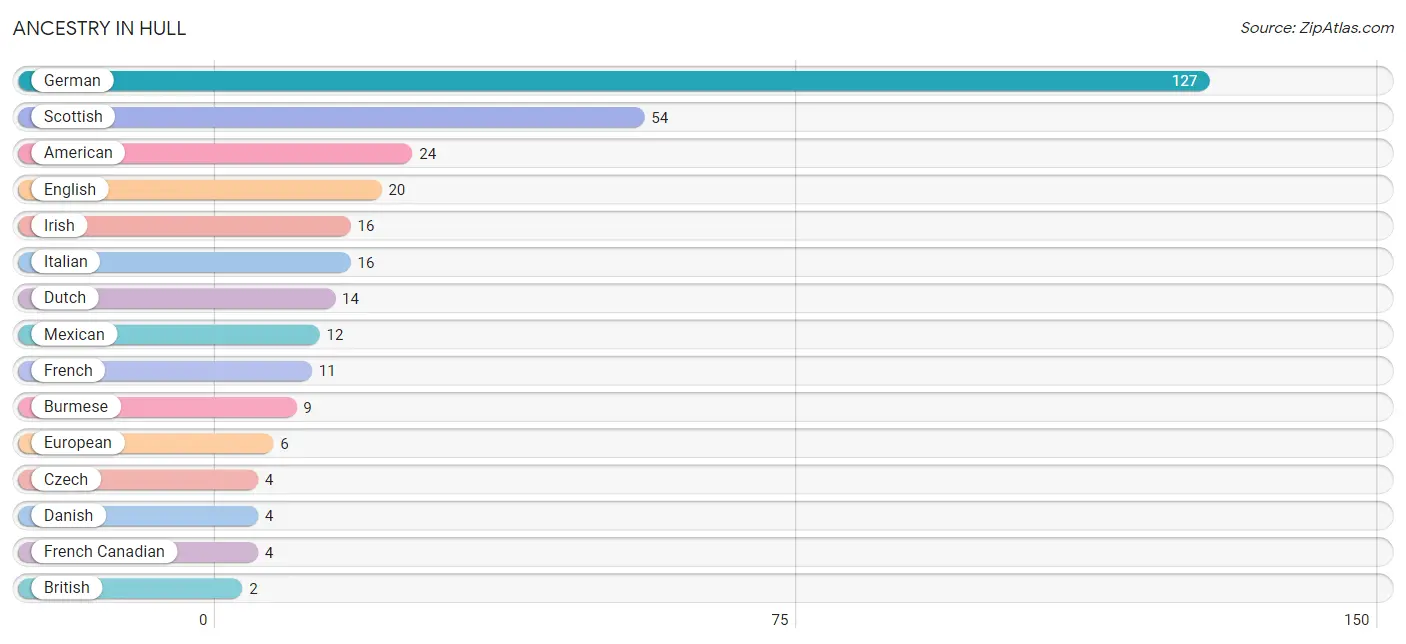
| Ancestry | # Population | % Population |
| American | 24 | 5.2% |
| British | 2 | 0.4% |
| Burmese | 9 | 2.0% |
| Czech | 4 | 0.9% |
| Danish | 4 | 0.9% |
| Dutch | 14 | 3.0% |
| Eastern European | 2 | 0.4% |
| English | 20 | 4.3% |
| European | 6 | 1.3% |
| French | 11 | 2.4% |
| French Canadian | 4 | 0.9% |
| German | 127 | 27.6% |
| Irish | 16 | 3.5% |
| Italian | 16 | 3.5% |
| Mexican | 12 | 2.6% |
| Polish | 1 | 0.2% |
| Portuguese | 1 | 0.2% |
| Scottish | 54 | 11.7% |
| Swedish | 2 | 0.4% | View All 19 Rows |
Immigrants in Hull

| Immigration Origin | # Population | % Population | View All 0 Rows |
Sex and Age in Hull
Sex and Age in Hull
The most populous age groups in Hull are 30 to 34 Years (28 | 13.3%) for men and 50 to 54 Years (58 | 23.3%) for women.
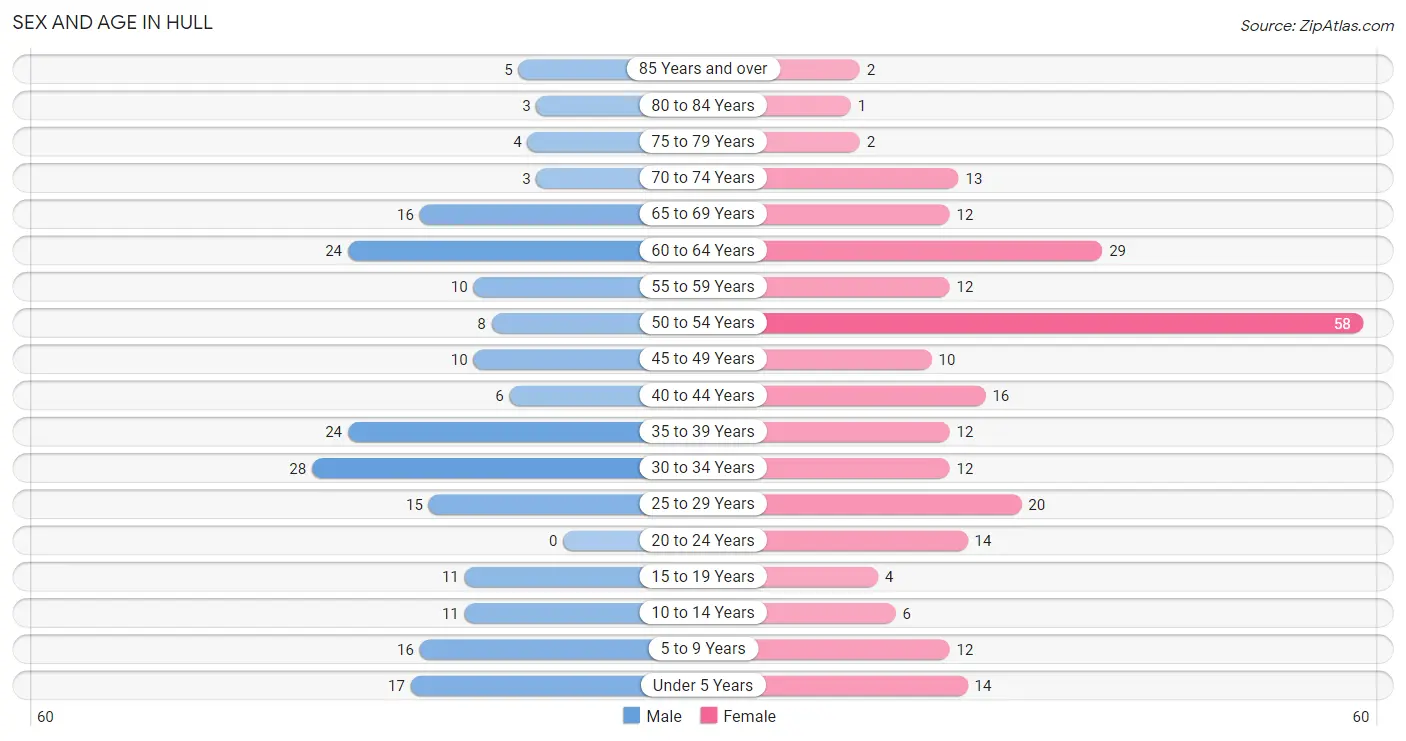
| Age Bracket | Male | Female |
| Under 5 Years | 17 (8.1%) | 14 (5.6%) |
| 5 to 9 Years | 16 (7.6%) | 12 (4.8%) |
| 10 to 14 Years | 11 (5.2%) | 6 (2.4%) |
| 15 to 19 Years | 11 (5.2%) | 4 (1.6%) |
| 20 to 24 Years | 0 (0.0%) | 14 (5.6%) |
| 25 to 29 Years | 15 (7.1%) | 20 (8.0%) |
| 30 to 34 Years | 28 (13.3%) | 12 (4.8%) |
| 35 to 39 Years | 24 (11.4%) | 12 (4.8%) |
| 40 to 44 Years | 6 (2.8%) | 16 (6.4%) |
| 45 to 49 Years | 10 (4.7%) | 10 (4.0%) |
| 50 to 54 Years | 8 (3.8%) | 58 (23.3%) |
| 55 to 59 Years | 10 (4.7%) | 12 (4.8%) |
| 60 to 64 Years | 24 (11.4%) | 29 (11.7%) |
| 65 to 69 Years | 16 (7.6%) | 12 (4.8%) |
| 70 to 74 Years | 3 (1.4%) | 13 (5.2%) |
| 75 to 79 Years | 4 (1.9%) | 2 (0.8%) |
| 80 to 84 Years | 3 (1.4%) | 1 (0.4%) |
| 85 Years and over | 5 (2.4%) | 2 (0.8%) |
| Total | 211 (100.0%) | 249 (100.0%) |
Families and Households in Hull
Median Family Size in Hull
The median family size in Hull is 3.14 persons per family, with single female/mother families (18 | 17.3%) accounting for the largest median family size of 3.44 persons per family. On the other hand, single male/father families (8 | 7.7%) represent the smallest median family size with 1.88 persons per family.
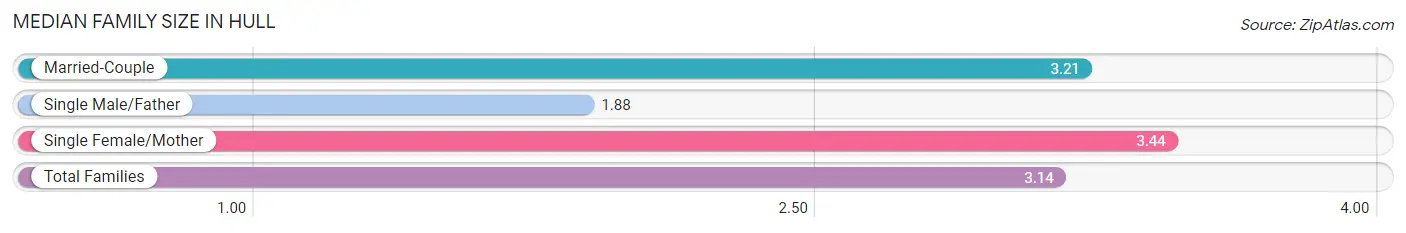
| Family Type | # Families | Family Size |
| Married-Couple | 78 (75.0%) | 3.21 |
| Single Male/Father | 8 (7.7%) | 1.88 |
| Single Female/Mother | 18 (17.3%) | 3.44 |
| Total Families | 104 (100.0%) | 3.14 |
Median Household Size in Hull
The median household size in Hull is 2.16 persons per household, with single female/mother households (18 | 8.5%) accounting for the largest median household size of 3.83 persons per household. non-family households (109 | 51.2%) represent the smallest median household size with 1.06 persons per household.
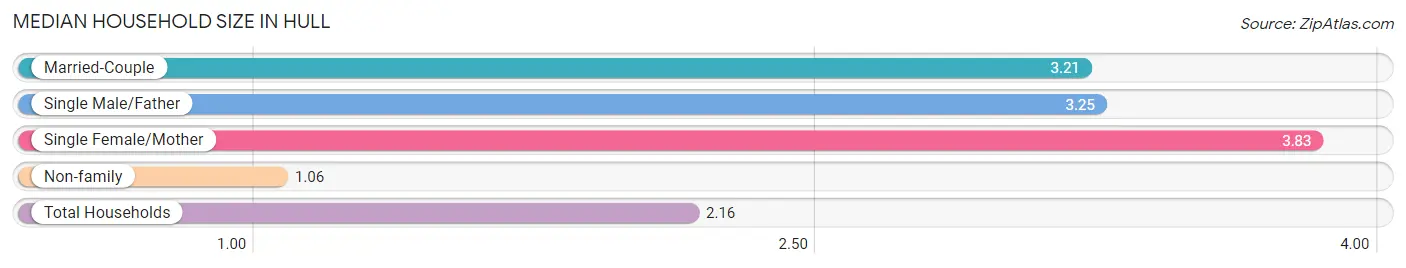
| Household Type | # Households | Household Size |
| Married-Couple | 78 (36.6%) | 3.21 |
| Single Male/Father | 8 (3.8%) | 3.25 |
| Single Female/Mother | 18 (8.5%) | 3.83 |
| Non-family | 109 (51.2%) | 1.06 |
| Total Households | 213 (100.0%) | 2.16 |
Household Size by Marriage Status in Hull
Out of a total of 213 households in Hull, 104 (48.8%) are family households, while 109 (51.2%) are nonfamily households. The most numerous type of family households are 2-person households, comprising 46, and the most common type of nonfamily households are 1-person households, comprising 103.
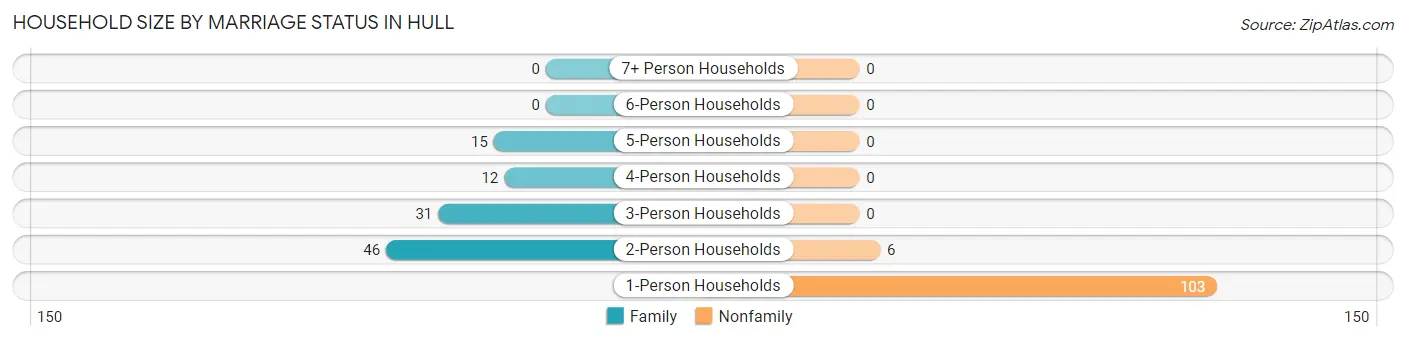
| Household Size | Family Households | Nonfamily Households |
| 1-Person Households | - | 103 (48.4%) |
| 2-Person Households | 46 (21.6%) | 6 (2.8%) |
| 3-Person Households | 31 (14.5%) | 0 (0.0%) |
| 4-Person Households | 12 (5.6%) | 0 (0.0%) |
| 5-Person Households | 15 (7.0%) | 0 (0.0%) |
| 6-Person Households | 0 (0.0%) | 0 (0.0%) |
| 7+ Person Households | 0 (0.0%) | 0 (0.0%) |
| Total | 104 (48.8%) | 109 (51.2%) |
Female Fertility in Hull
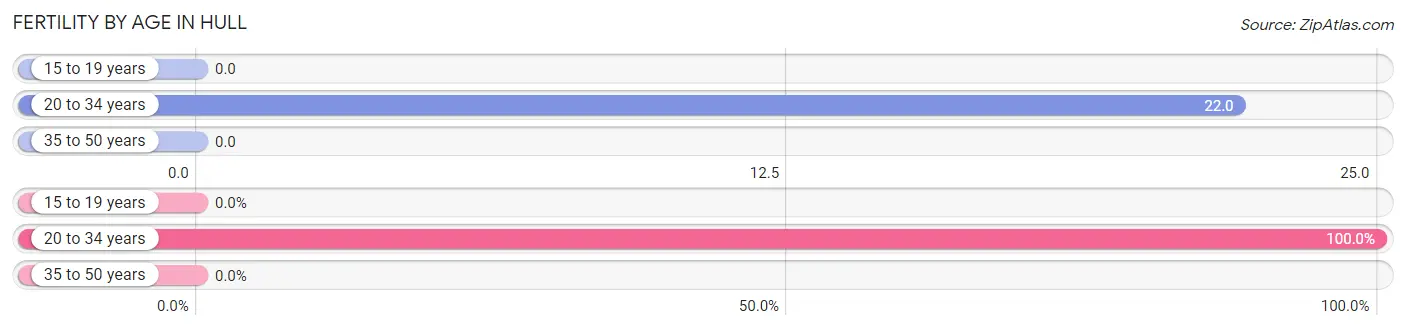
Fertility by Age in Hull
Average fertility rate in Hull is 11.0 births per 1,000 women. Women in the age bracket of 20 to 34 years have the highest fertility rate with 22.0 births per 1,000 women. Women in the age bracket of 20 to 34 years acount for 100.0% of all women with births.
| Age Bracket | Women with Births | Births / 1,000 Women |
| 15 to 19 years | 0 (0.0%) | 0.0 |
| 20 to 34 years | 1 (100.0%) | 22.0 |
| 35 to 50 years | 0 (0.0%) | 0.0 |
| Total | 1 (100.0%) | 11.0 |
Fertility by Age by Marriage Status in Hull
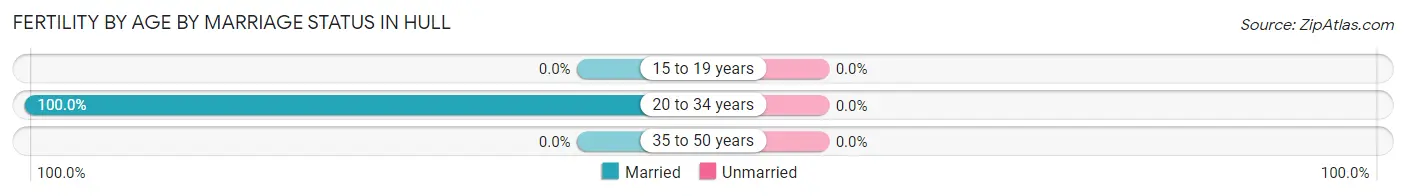
| Age Bracket | Married | Unmarried |
| 15 to 19 years | 0 (0.0%) | 0 (0.0%) |
| 20 to 34 years | 1 (100.0%) | 0 (0.0%) |
| 35 to 50 years | 0 (0.0%) | 0 (0.0%) |
| Total | 1 (100.0%) | 0 (0.0%) |
Fertility by Education in Hull
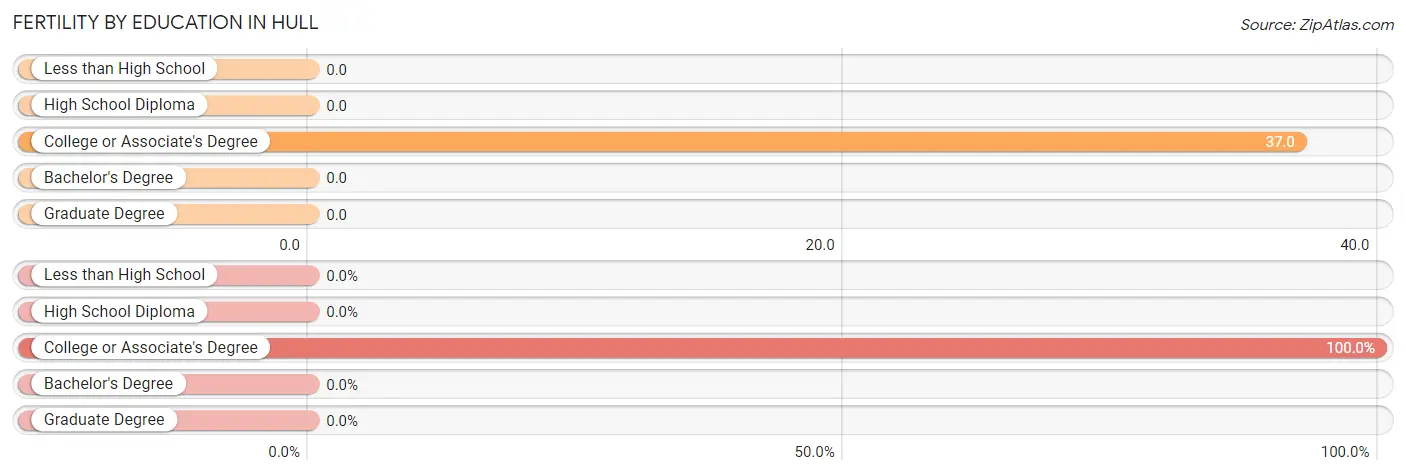
| Educational Attainment | Women with Births | Births / 1,000 Women |
| Less than High School | 0 (0.0%) | 0.0 |
| High School Diploma | 0 (0.0%) | 0.0 |
| College or Associate's Degree | 1 (100.0%) | 37.0 |
| Bachelor's Degree | 0 (0.0%) | 0.0 |
| Graduate Degree | 0 (0.0%) | 0.0 |
| Total | 1 (100.0%) | 11.0 |
Fertility by Education by Marriage Status in Hull
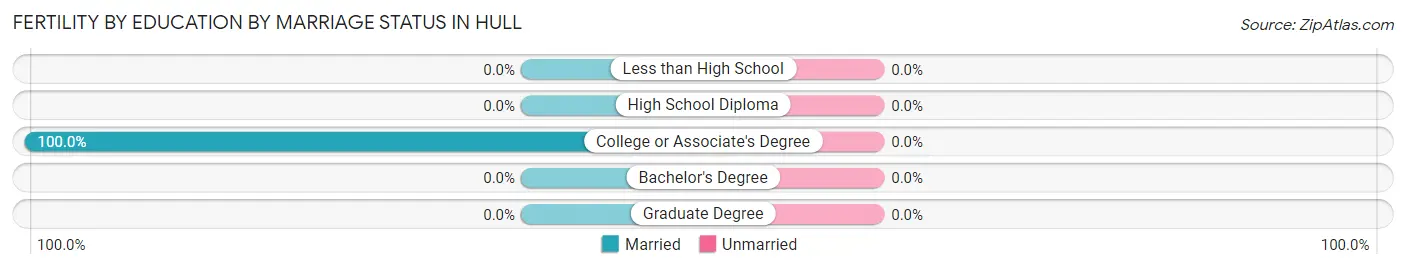
| Educational Attainment | Married | Unmarried |
| Less than High School | 0 (0.0%) | 0 (0.0%) |
| High School Diploma | 0 (0.0%) | 0 (0.0%) |
| College or Associate's Degree | 1 (100.0%) | 0 (0.0%) |
| Bachelor's Degree | 0 (0.0%) | 0 (0.0%) |
| Graduate Degree | 0 (0.0%) | 0 (0.0%) |
| Total | 1 (100.0%) | 0 (0.0%) |
Employment Characteristics in Hull
Employment by Class of Employer in Hull
Among the 249 employed individuals in Hull, private company employees (154 | 61.9%), self-employed (not incorporated) (61 | 24.5%), and not-for-profit organizations (15 | 6.0%) make up the most common classes of employment.
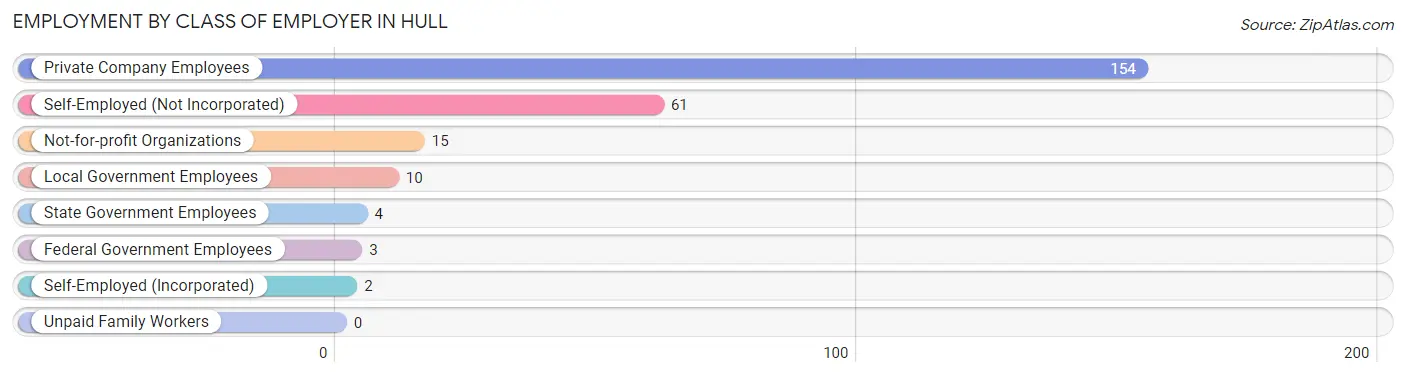
| Employer Class | # Employees | % Employees |
| Private Company Employees | 154 | 61.9% |
| Self-Employed (Incorporated) | 2 | 0.8% |
| Self-Employed (Not Incorporated) | 61 | 24.5% |
| Not-for-profit Organizations | 15 | 6.0% |
| Local Government Employees | 10 | 4.0% |
| State Government Employees | 4 | 1.6% |
| Federal Government Employees | 3 | 1.2% |
| Unpaid Family Workers | 0 | 0.0% |
| Total | 249 | 100.0% |
Employment Status by Age in Hull
According to the labor force statistics for Hull, out of the total population over 16 years of age (382), 67.0% or 256 individuals are in the labor force, with 0.4% or 1 of them unemployed. The age group with the highest labor force participation rate is 45 to 54 years, with 93.0% or 80 individuals in the labor force. Within the labor force, the 25 to 29 years age range has the highest percentage of unemployed individuals, with 3.2% or 1 of them being unemployed.
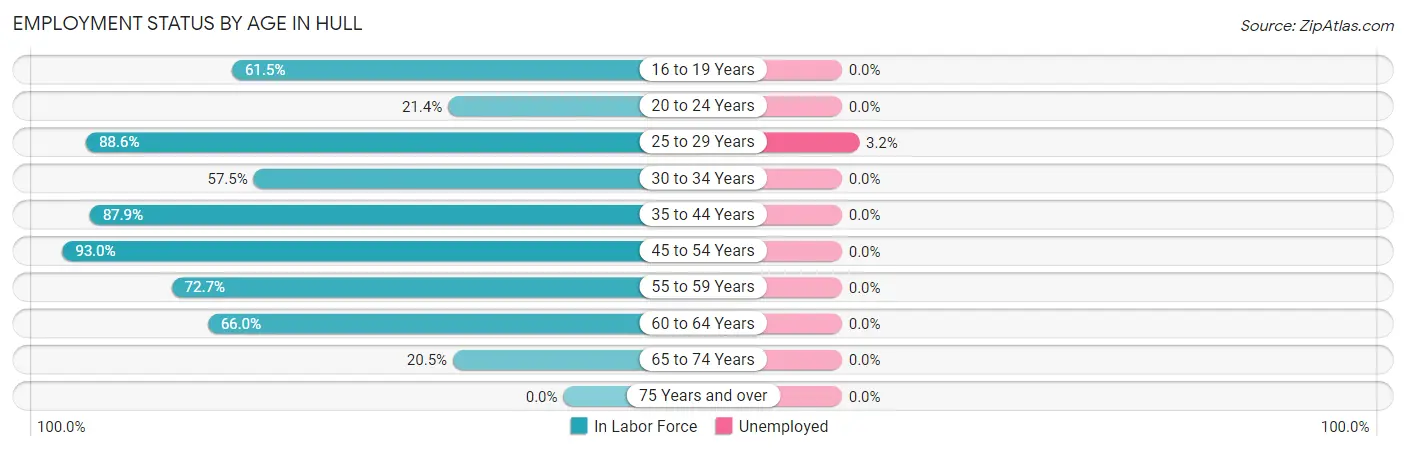
| Age Bracket | In Labor Force | Unemployed |
| 16 to 19 Years | 8 (61.5%) | 0 (0.0%) |
| 20 to 24 Years | 3 (21.4%) | 0 (0.0%) |
| 25 to 29 Years | 31 (88.6%) | 1 (3.2%) |
| 30 to 34 Years | 23 (57.5%) | 0 (0.0%) |
| 35 to 44 Years | 51 (87.9%) | 0 (0.0%) |
| 45 to 54 Years | 80 (93.0%) | 0 (0.0%) |
| 55 to 59 Years | 16 (72.7%) | 0 (0.0%) |
| 60 to 64 Years | 35 (66.0%) | 0 (0.0%) |
| 65 to 74 Years | 9 (20.5%) | 0 (0.0%) |
| 75 Years and over | 0 (0.0%) | 0 (0.0%) |
| Total | 256 (67.0%) | 1 (0.4%) |
Employment Status by Educational Attainment in Hull
According to labor force statistics for Hull, 80.3% of individuals (236) out of the total population between 25 and 64 years of age (294) are in the labor force, with 0.4% or 1 of them being unemployed. The group with the highest labor force participation rate are those with the educational attainment of bachelor's degree or higher, with 99.0% or 98 individuals in the labor force. Within the labor force, individuals with college / associate degree education have the highest percentage of unemployment, with 1.6% or 1 of them being unemployed.
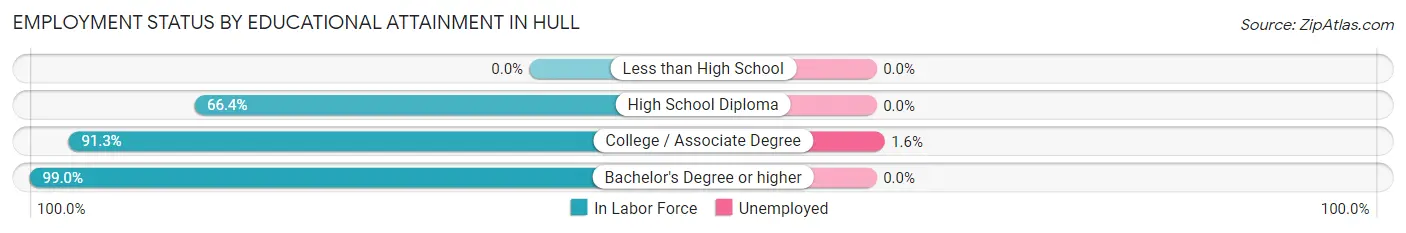
| Educational Attainment | In Labor Force | Unemployed |
| Less than High School | 0 (0.0%) | 0 (0.0%) |
| High School Diploma | 75 (66.4%) | 0 (0.0%) |
| College / Associate Degree | 63 (91.3%) | 1 (1.6%) |
| Bachelor's Degree or higher | 98 (99.0%) | 0 (0.0%) |
| Total | 236 (80.3%) | 1 (0.4%) |
Employment Occupations by Sex in Hull
Management, Business, Science and Arts Occupations
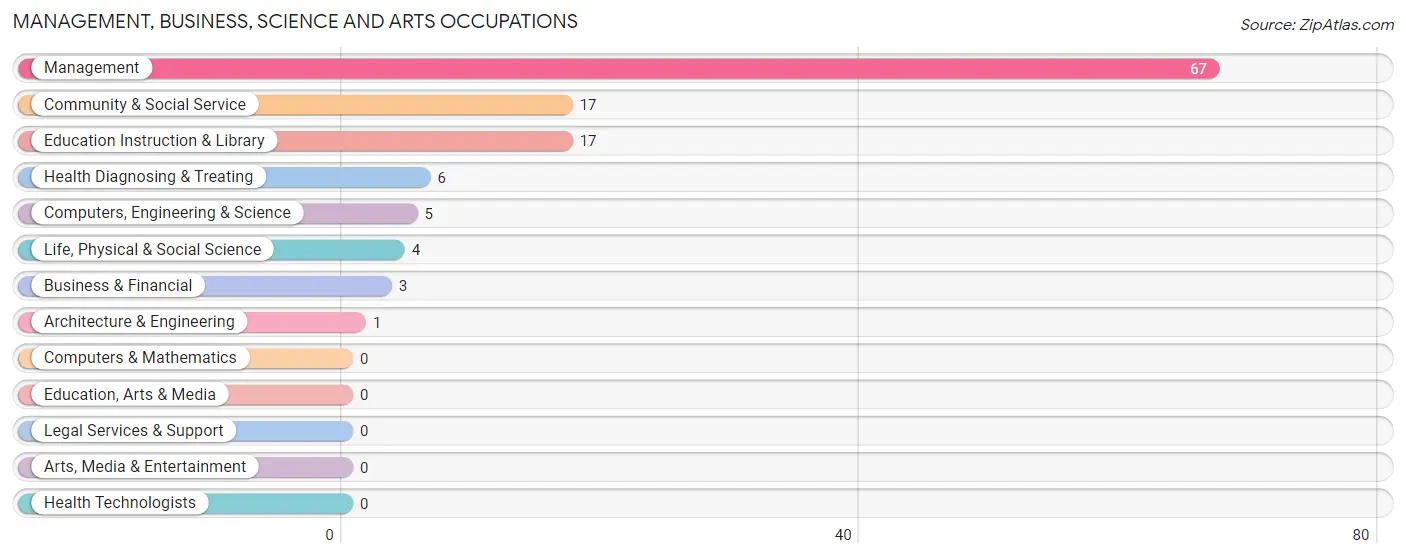
The most common Management, Business, Science and Arts occupations in Hull are Management (67 | 26.3%), Community & Social Service (17 | 6.7%), Education Instruction & Library (17 | 6.7%), Health Diagnosing & Treating (6 | 2.4%), and Computers, Engineering & Science (5 | 2.0%).
Management, Business, Science and Arts Occupations by Sex
Within the Management, Business, Science and Arts occupations in Hull, the most male-oriented occupations are Architecture & Engineering (100.0%), Business & Financial (33.3%), and Computers, Engineering & Science (20.0%), while the most female-oriented occupations are Life, Physical & Social Science (100.0%), Community & Social Service (100.0%), and Education Instruction & Library (100.0%).
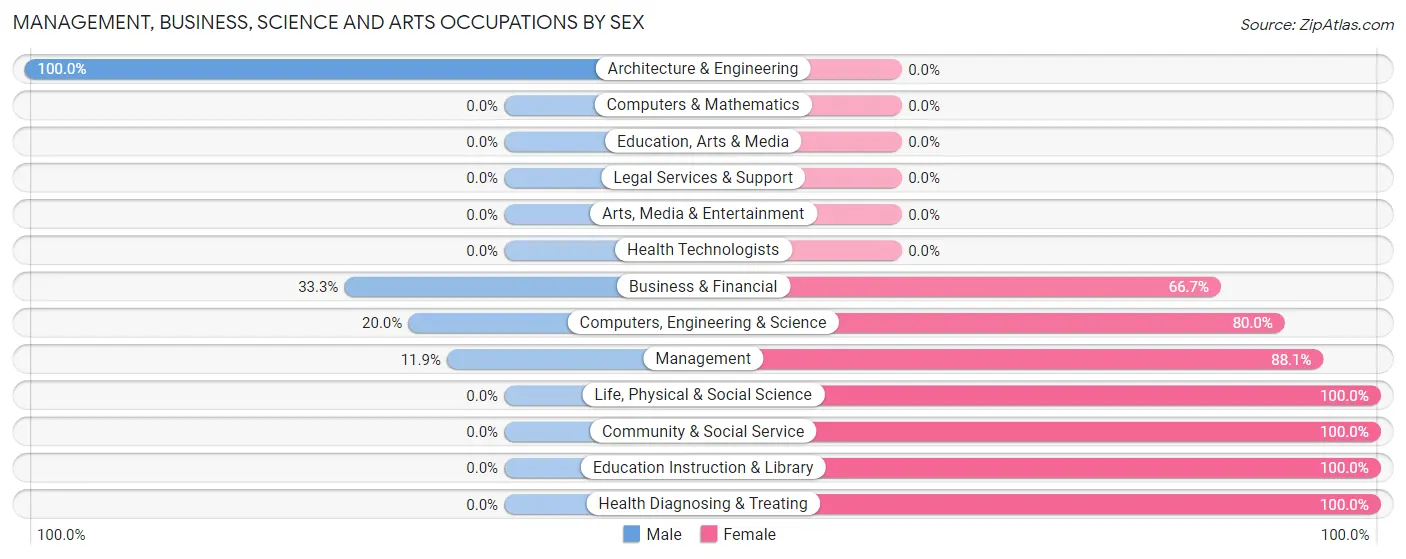
| Occupation | Male | Female |
| Management | 8 (11.9%) | 59 (88.1%) |
| Business & Financial | 1 (33.3%) | 2 (66.7%) |
| Computers, Engineering & Science | 1 (20.0%) | 4 (80.0%) |
| Computers & Mathematics | 0 (0.0%) | 0 (0.0%) |
| Architecture & Engineering | 1 (100.0%) | 0 (0.0%) |
| Life, Physical & Social Science | 0 (0.0%) | 4 (100.0%) |
| Community & Social Service | 0 (0.0%) | 17 (100.0%) |
| Education, Arts & Media | 0 (0.0%) | 0 (0.0%) |
| Legal Services & Support | 0 (0.0%) | 0 (0.0%) |
| Education Instruction & Library | 0 (0.0%) | 17 (100.0%) |
| Arts, Media & Entertainment | 0 (0.0%) | 0 (0.0%) |
| Health Diagnosing & Treating | 0 (0.0%) | 6 (100.0%) |
| Health Technologists | 0 (0.0%) | 0 (0.0%) |
| Total (Category) | 10 (10.2%) | 88 (89.8%) |
| Total (Overall) | 94 (36.9%) | 161 (63.1%) |
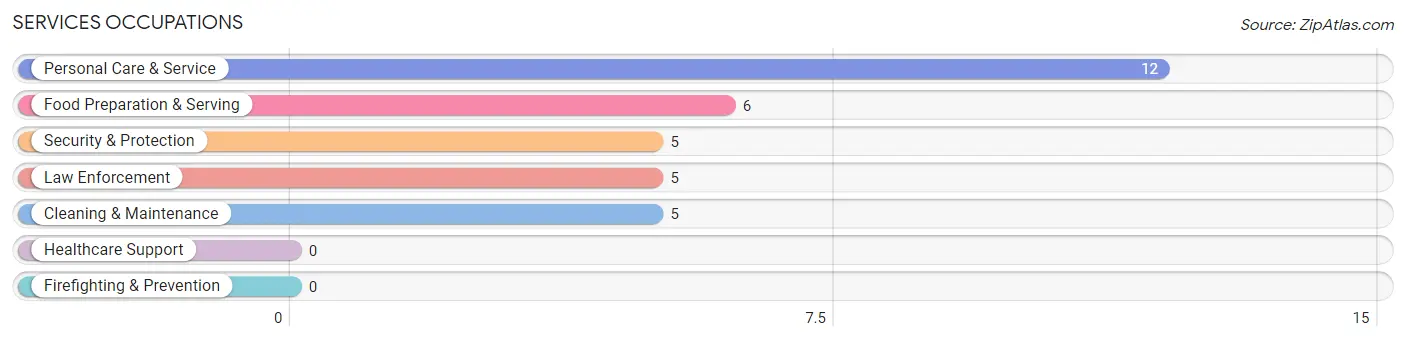
Services Occupations
The most common Services occupations in Hull are Personal Care & Service (12 | 4.7%), Food Preparation & Serving (6 | 2.4%), Security & Protection (5 | 2.0%), Law Enforcement (5 | 2.0%), and Cleaning & Maintenance (5 | 2.0%).
Services Occupations by Sex
Within the Services occupations in Hull, the most male-oriented occupations are Security & Protection (100.0%), Law Enforcement (100.0%), and Cleaning & Maintenance (60.0%), while the most female-oriented occupations are Food Preparation & Serving (50.0%), Personal Care & Service (50.0%), and Cleaning & Maintenance (40.0%).
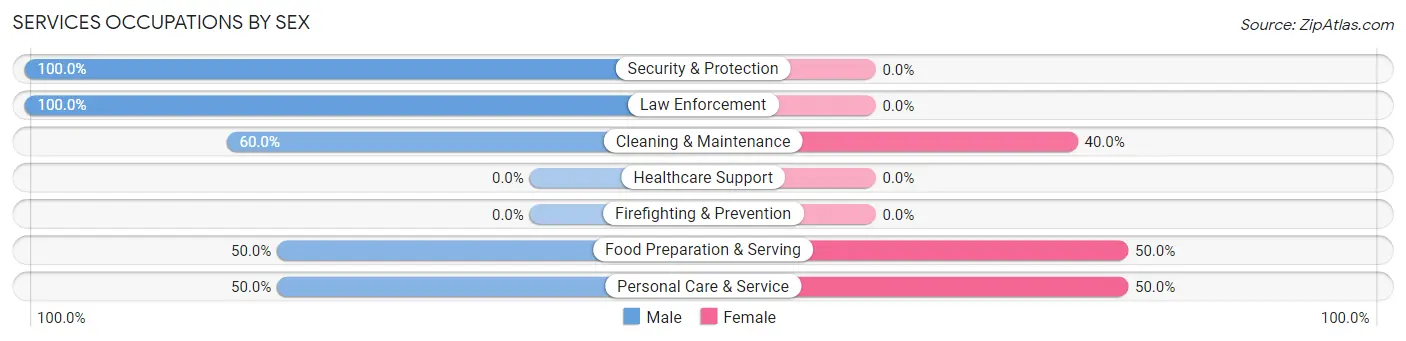
| Occupation | Male | Female |
| Healthcare Support | 0 (0.0%) | 0 (0.0%) |
| Security & Protection | 5 (100.0%) | 0 (0.0%) |
| Firefighting & Prevention | 0 (0.0%) | 0 (0.0%) |
| Law Enforcement | 5 (100.0%) | 0 (0.0%) |
| Food Preparation & Serving | 3 (50.0%) | 3 (50.0%) |
| Cleaning & Maintenance | 3 (60.0%) | 2 (40.0%) |
| Personal Care & Service | 6 (50.0%) | 6 (50.0%) |
| Total (Category) | 17 (60.7%) | 11 (39.3%) |
| Total (Overall) | 94 (36.9%) | 161 (63.1%) |
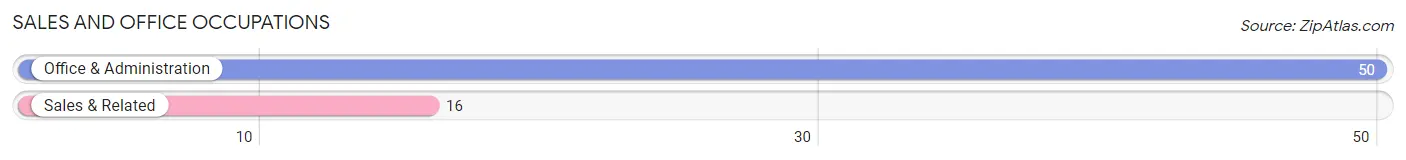
Sales and Office Occupations
The most common Sales and Office occupations in Hull are Office & Administration (50 | 19.6%), and Sales & Related (16 | 6.3%).
Sales and Office Occupations by Sex
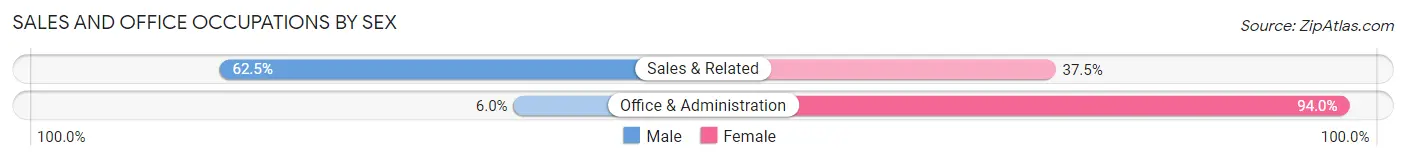
| Occupation | Male | Female |
| Sales & Related | 10 (62.5%) | 6 (37.5%) |
| Office & Administration | 3 (6.0%) | 47 (94.0%) |
| Total (Category) | 13 (19.7%) | 53 (80.3%) |
| Total (Overall) | 94 (36.9%) | 161 (63.1%) |
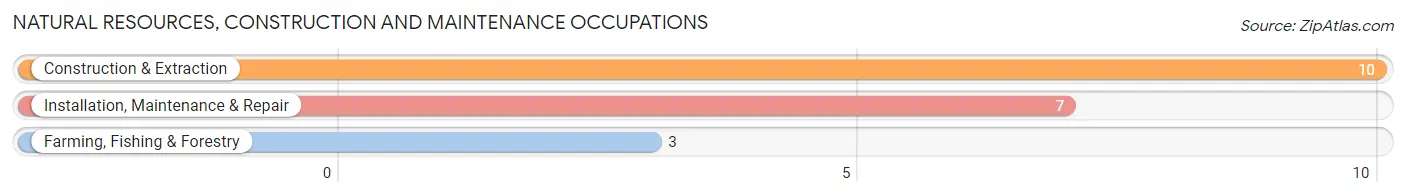
Natural Resources, Construction and Maintenance Occupations
The most common Natural Resources, Construction and Maintenance occupations in Hull are Construction & Extraction (10 | 3.9%), Installation, Maintenance & Repair (7 | 2.8%), and Farming, Fishing & Forestry (3 | 1.2%).
Natural Resources, Construction and Maintenance Occupations by Sex
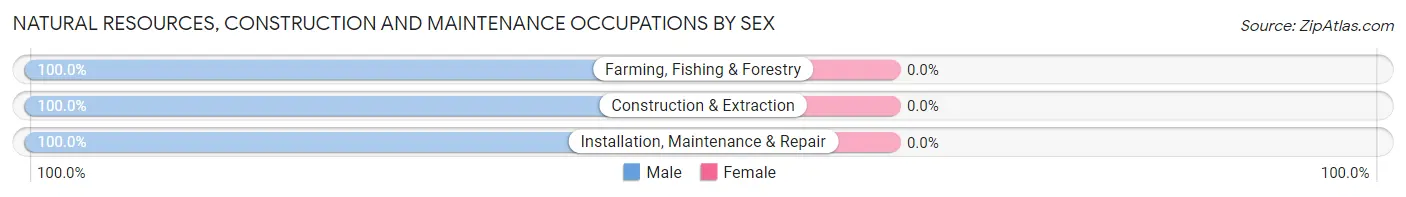
| Occupation | Male | Female |
| Farming, Fishing & Forestry | 3 (100.0%) | 0 (0.0%) |
| Construction & Extraction | 10 (100.0%) | 0 (0.0%) |
| Installation, Maintenance & Repair | 7 (100.0%) | 0 (0.0%) |
| Total (Category) | 20 (100.0%) | 0 (0.0%) |
| Total (Overall) | 94 (36.9%) | 161 (63.1%) |
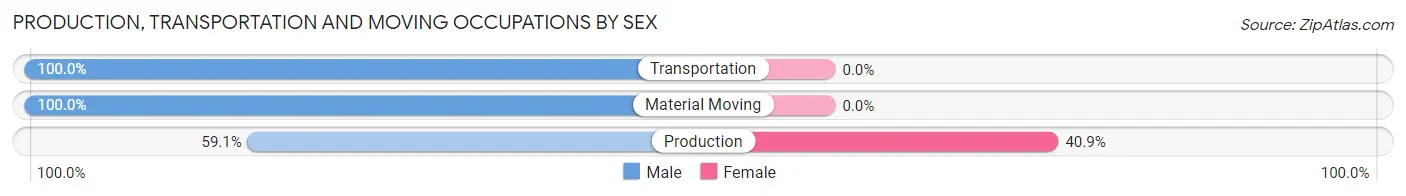
Production, Transportation and Moving Occupations
The most common Production, Transportation and Moving occupations in Hull are Production (22 | 8.6%), Transportation (12 | 4.7%), and Material Moving (9 | 3.5%).
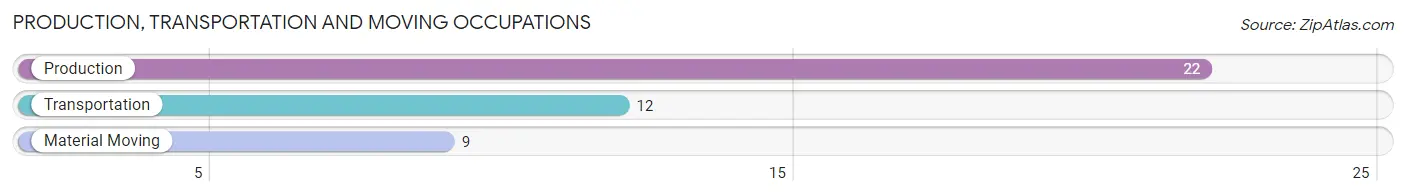
Production, Transportation and Moving Occupations by Sex
| Occupation | Male | Female |
| Production | 13 (59.1%) | 9 (40.9%) |
| Transportation | 12 (100.0%) | 0 (0.0%) |
| Material Moving | 9 (100.0%) | 0 (0.0%) |
| Total (Category) | 34 (79.1%) | 9 (20.9%) |
| Total (Overall) | 94 (36.9%) | 161 (63.1%) |
Employment Industries by Sex in Hull
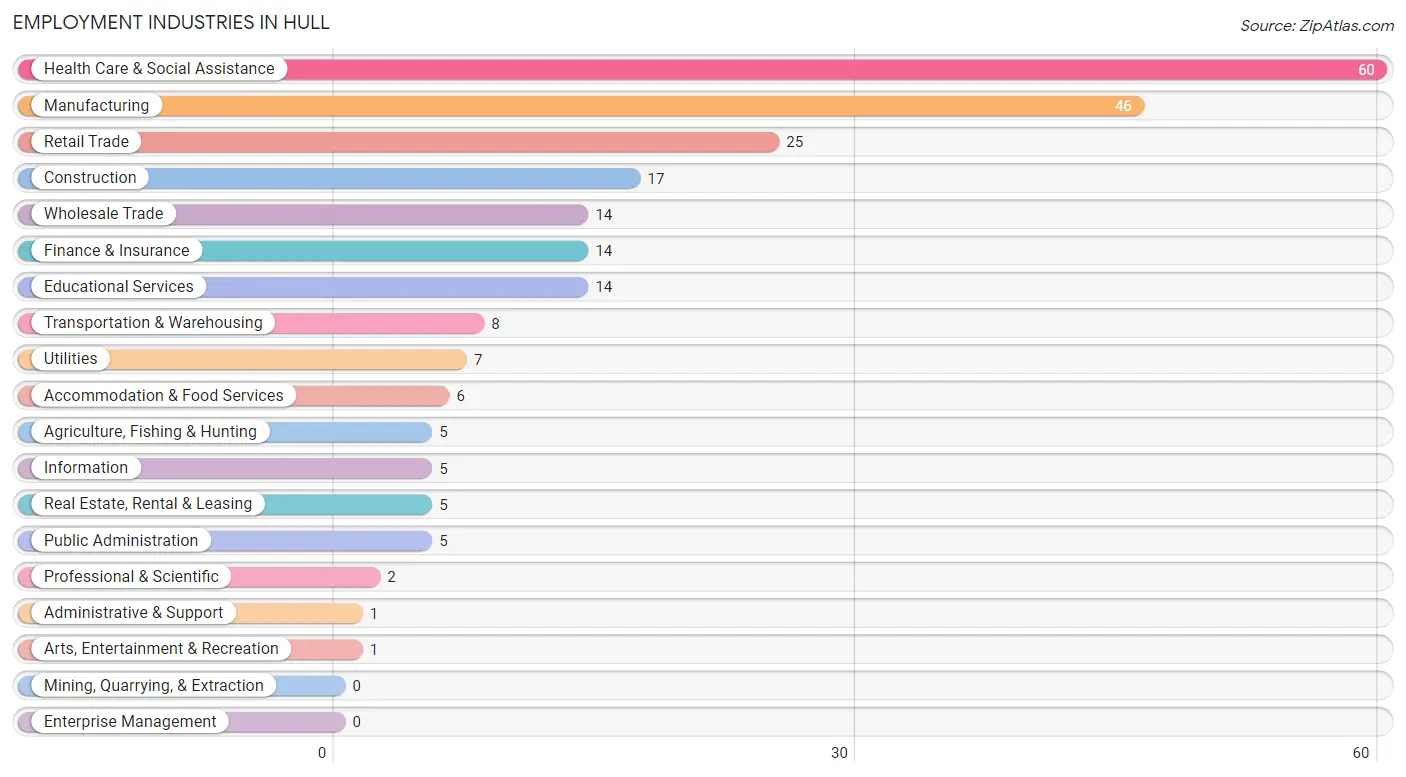
Employment Industries in Hull
The major employment industries in Hull include Health Care & Social Assistance (60 | 23.5%), Manufacturing (46 | 18.0%), Retail Trade (25 | 9.8%), Construction (17 | 6.7%), and Wholesale Trade (14 | 5.5%).
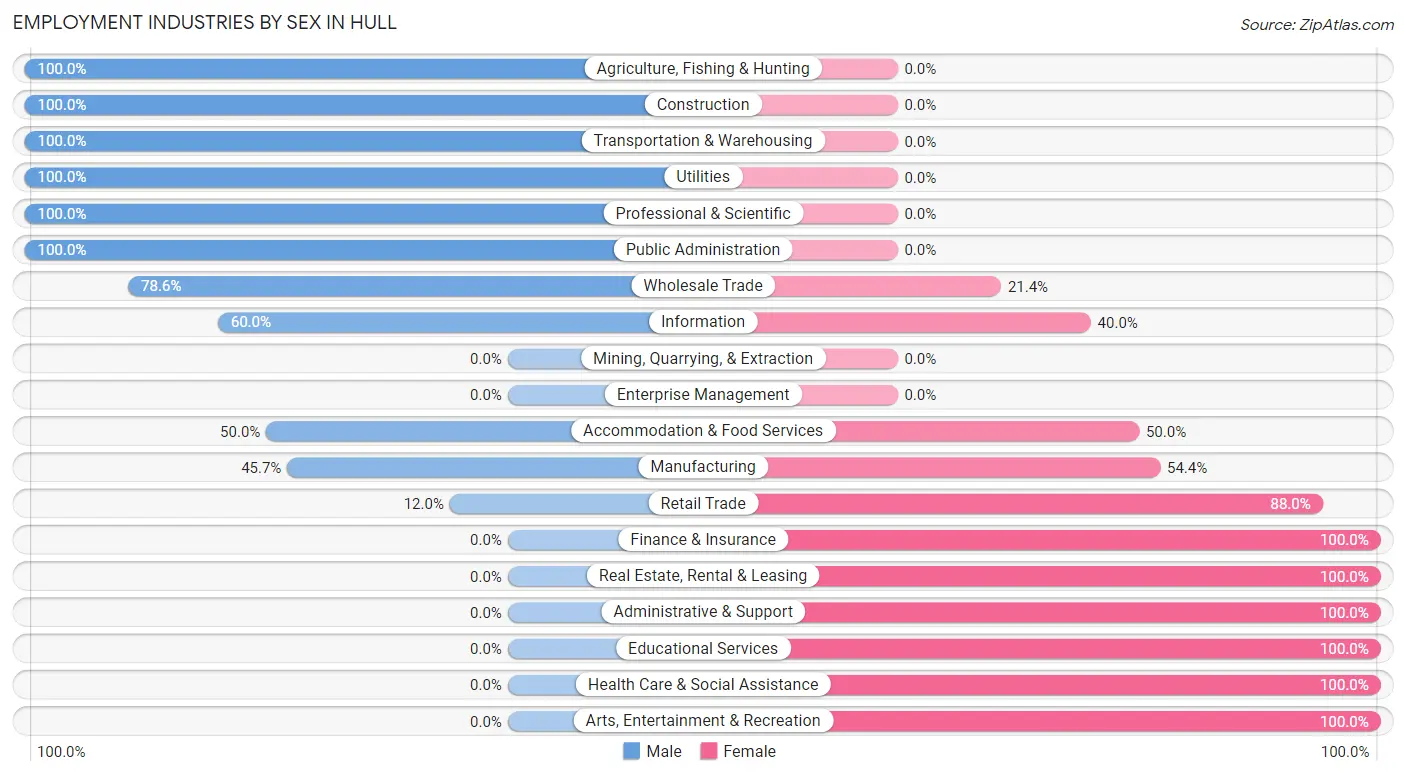
Employment Industries by Sex in Hull
The Hull industries that see more men than women are Agriculture, Fishing & Hunting (100.0%), Construction (100.0%), and Transportation & Warehousing (100.0%), whereas the industries that tend to have a higher number of women are Finance & Insurance (100.0%), Real Estate, Rental & Leasing (100.0%), and Administrative & Support (100.0%).
| Industry | Male | Female |
| Agriculture, Fishing & Hunting | 5 (100.0%) | 0 (0.0%) |
| Mining, Quarrying, & Extraction | 0 (0.0%) | 0 (0.0%) |
| Construction | 17 (100.0%) | 0 (0.0%) |
| Manufacturing | 21 (45.7%) | 25 (54.3%) |
| Wholesale Trade | 11 (78.6%) | 3 (21.4%) |
| Retail Trade | 3 (12.0%) | 22 (88.0%) |
| Transportation & Warehousing | 8 (100.0%) | 0 (0.0%) |
| Utilities | 7 (100.0%) | 0 (0.0%) |
| Information | 3 (60.0%) | 2 (40.0%) |
| Finance & Insurance | 0 (0.0%) | 14 (100.0%) |
| Real Estate, Rental & Leasing | 0 (0.0%) | 5 (100.0%) |
| Professional & Scientific | 2 (100.0%) | 0 (0.0%) |
| Enterprise Management | 0 (0.0%) | 0 (0.0%) |
| Administrative & Support | 0 (0.0%) | 1 (100.0%) |
| Educational Services | 0 (0.0%) | 14 (100.0%) |
| Health Care & Social Assistance | 0 (0.0%) | 60 (100.0%) |
| Arts, Entertainment & Recreation | 0 (0.0%) | 1 (100.0%) |
| Accommodation & Food Services | 3 (50.0%) | 3 (50.0%) |
| Public Administration | 5 (100.0%) | 0 (0.0%) |
| Total | 94 (36.9%) | 161 (63.1%) |
Education in Hull
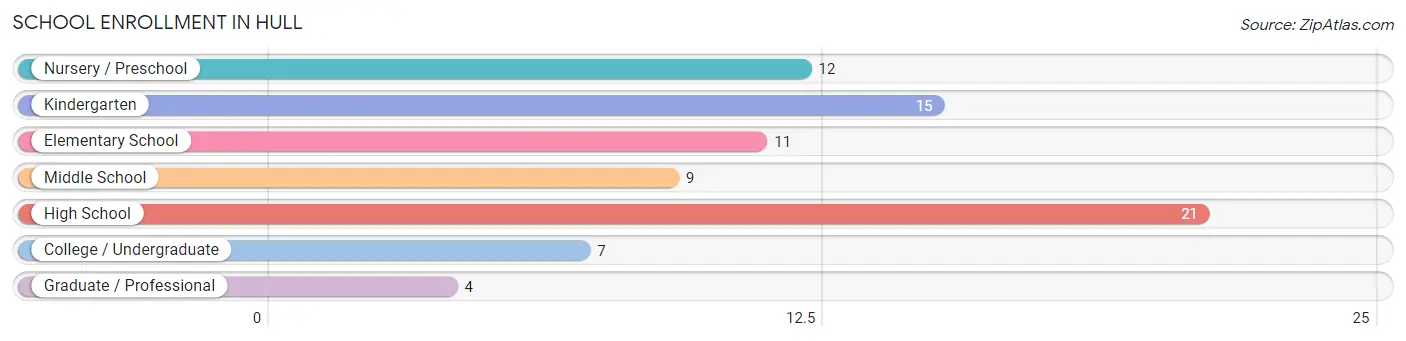
School Enrollment in Hull
The most common levels of schooling among the 79 students in Hull are high school (21 | 26.6%), kindergarten (15 | 19.0%), and nursery / preschool (12 | 15.2%).
| School Level | # Students | % Students |
| Nursery / Preschool | 12 | 15.2% |
| Kindergarten | 15 | 19.0% |
| Elementary School | 11 | 13.9% |
| Middle School | 9 | 11.4% |
| High School | 21 | 26.6% |
| College / Undergraduate | 7 | 8.9% |
| Graduate / Professional | 4 | 5.1% |
| Total | 79 | 100.0% |
School Enrollment by Age by Funding Source in Hull
Out of a total of 79 students who are enrolled in schools in Hull, 3 (3.8%) attend a private institution, while the remaining 76 (96.2%) are enrolled in public schools. The age group of 35 years and over has the highest likelihood of being enrolled in private schools, with 2 (100.0% in the age bracket) enrolled. Conversely, the age group of 5 to 9 year old has the lowest likelihood of being enrolled in a private school, with 28 (100.0% in the age bracket) attending a public institution.
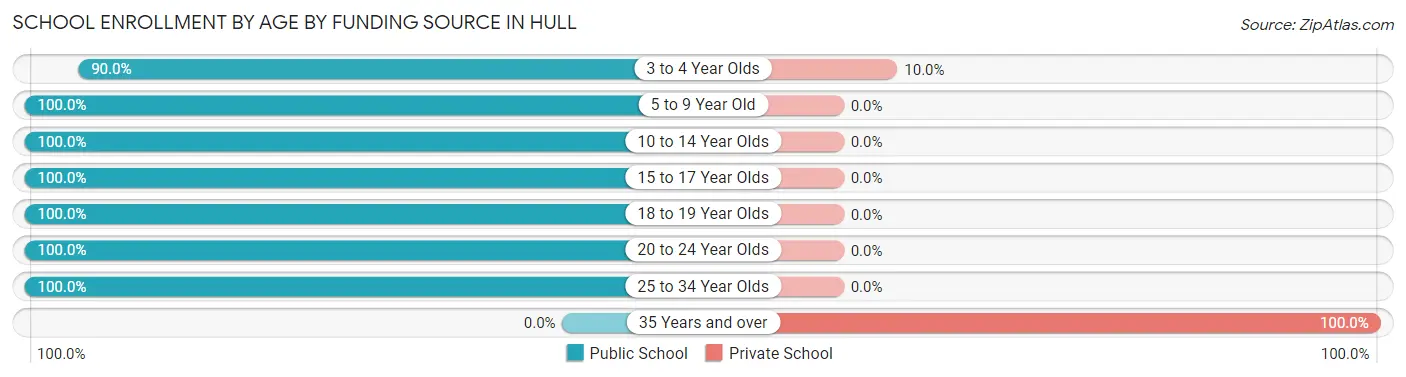
| Age Bracket | Public School | Private School |
| 3 to 4 Year Olds | 9 (90.0%) | 1 (10.0%) |
| 5 to 9 Year Old | 28 (100.0%) | 0 (0.0%) |
| 10 to 14 Year Olds | 17 (100.0%) | 0 (0.0%) |
| 15 to 17 Year Olds | 7 (100.0%) | 0 (0.0%) |
| 18 to 19 Year Olds | 6 (100.0%) | 0 (0.0%) |
| 20 to 24 Year Olds | 2 (100.0%) | 0 (0.0%) |
| 25 to 34 Year Olds | 7 (100.0%) | 0 (0.0%) |
| 35 Years and over | 0 (0.0%) | 2 (100.0%) |
| Total | 76 (96.2%) | 3 (3.8%) |
Educational Attainment by Field of Study in Hull
Visual & performing arts (55 | 52.9%), business (15 | 14.4%), bio, nature & agricultural (8 | 7.7%), engineering (6 | 5.8%), and psychology (5 | 4.8%) are the most common fields of study among 104 individuals in Hull who have obtained a bachelor's degree or higher.
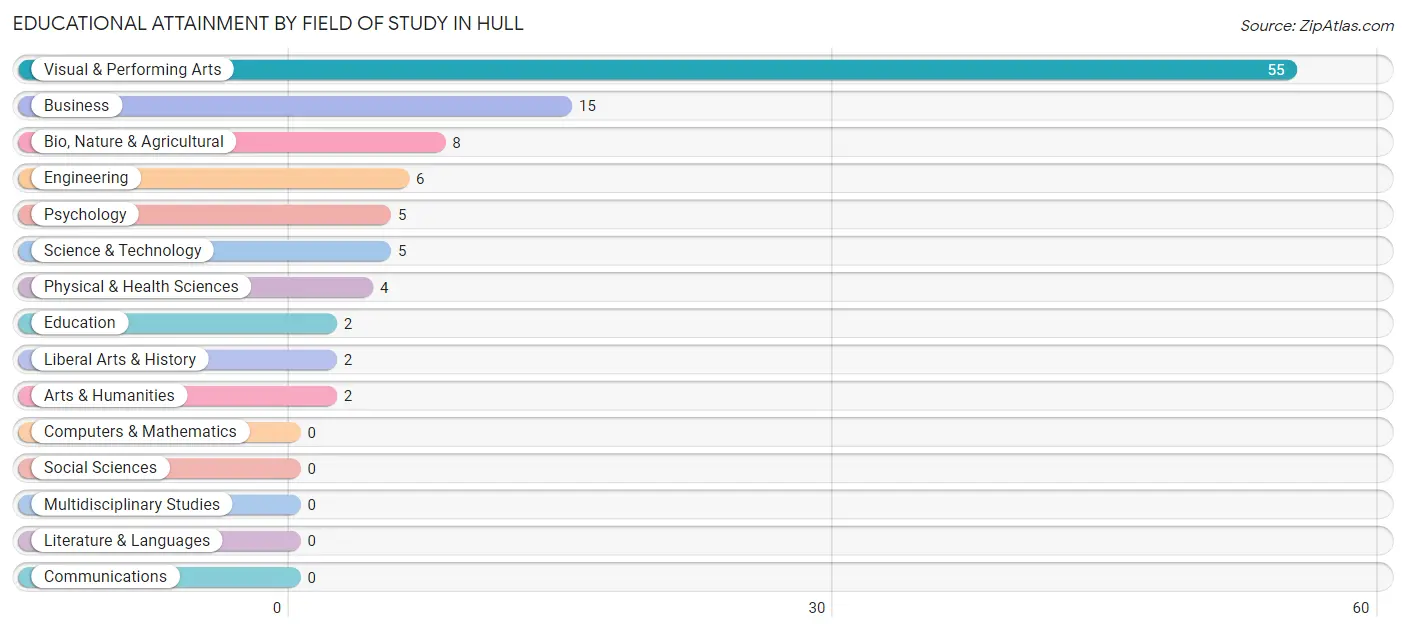
| Field of Study | # Graduates | % Graduates |
| Computers & Mathematics | 0 | 0.0% |
| Bio, Nature & Agricultural | 8 | 7.7% |
| Physical & Health Sciences | 4 | 3.8% |
| Psychology | 5 | 4.8% |
| Social Sciences | 0 | 0.0% |
| Engineering | 6 | 5.8% |
| Multidisciplinary Studies | 0 | 0.0% |
| Science & Technology | 5 | 4.8% |
| Business | 15 | 14.4% |
| Education | 2 | 1.9% |
| Literature & Languages | 0 | 0.0% |
| Liberal Arts & History | 2 | 1.9% |
| Visual & Performing Arts | 55 | 52.9% |
| Communications | 0 | 0.0% |
| Arts & Humanities | 2 | 1.9% |
| Total | 104 | 100.0% |
Transportation & Commute in Hull
Vehicle Availability by Sex in Hull
The most prevalent vehicle ownership categories in Hull are males with 2 vehicles (42, accounting for 45.7%) and females with 2 vehicles (46, making up 26.8%).
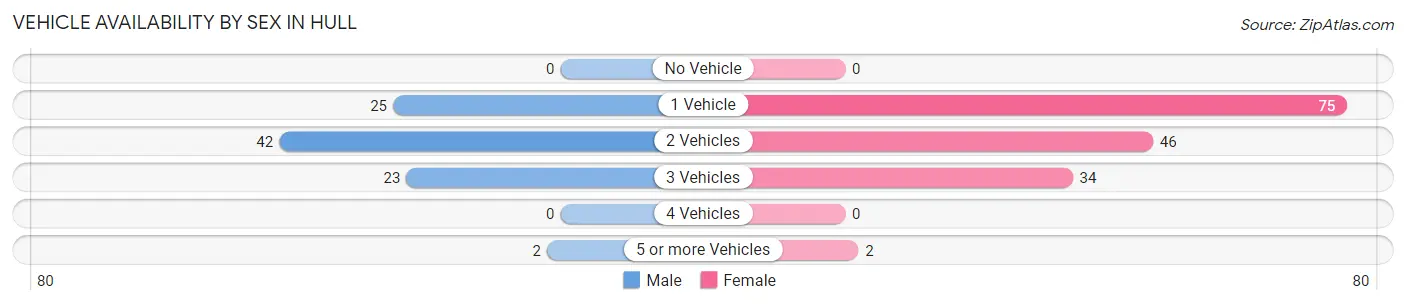
| Vehicles Available | Male | Female |
| No Vehicle | 0 (0.0%) | 0 (0.0%) |
| 1 Vehicle | 25 (27.2%) | 75 (47.8%) |
| 2 Vehicles | 42 (45.7%) | 46 (29.3%) |
| 3 Vehicles | 23 (25.0%) | 34 (21.7%) |
| 4 Vehicles | 0 (0.0%) | 0 (0.0%) |
| 5 or more Vehicles | 2 (2.2%) | 2 (1.3%) |
| Total | 92 (100.0%) | 157 (100.0%) |
Commute Time in Hull
The most frequently occuring commute durations in Hull are 20 to 24 minutes (39 commuters, 21.2%), 30 to 34 minutes (27 commuters, 14.7%), and 25 to 29 minutes (20 commuters, 10.9%).
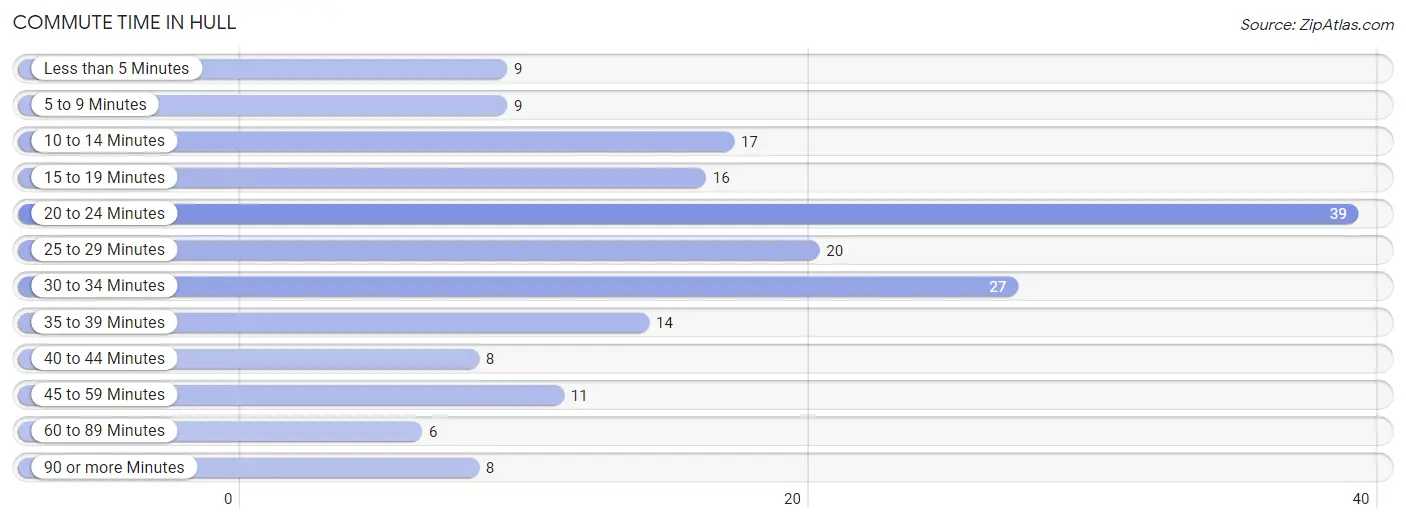
| Commute Time | # Commuters | % Commuters |
| Less than 5 Minutes | 9 | 4.9% |
| 5 to 9 Minutes | 9 | 4.9% |
| 10 to 14 Minutes | 17 | 9.2% |
| 15 to 19 Minutes | 16 | 8.7% |
| 20 to 24 Minutes | 39 | 21.2% |
| 25 to 29 Minutes | 20 | 10.9% |
| 30 to 34 Minutes | 27 | 14.7% |
| 35 to 39 Minutes | 14 | 7.6% |
| 40 to 44 Minutes | 8 | 4.3% |
| 45 to 59 Minutes | 11 | 6.0% |
| 60 to 89 Minutes | 6 | 3.3% |
| 90 or more Minutes | 8 | 4.3% |
Commute Time by Sex in Hull
The most common commute times in Hull are 25 to 29 minutes (19 commuters, 20.9%) for males and 20 to 24 minutes (31 commuters, 33.3%) for females.
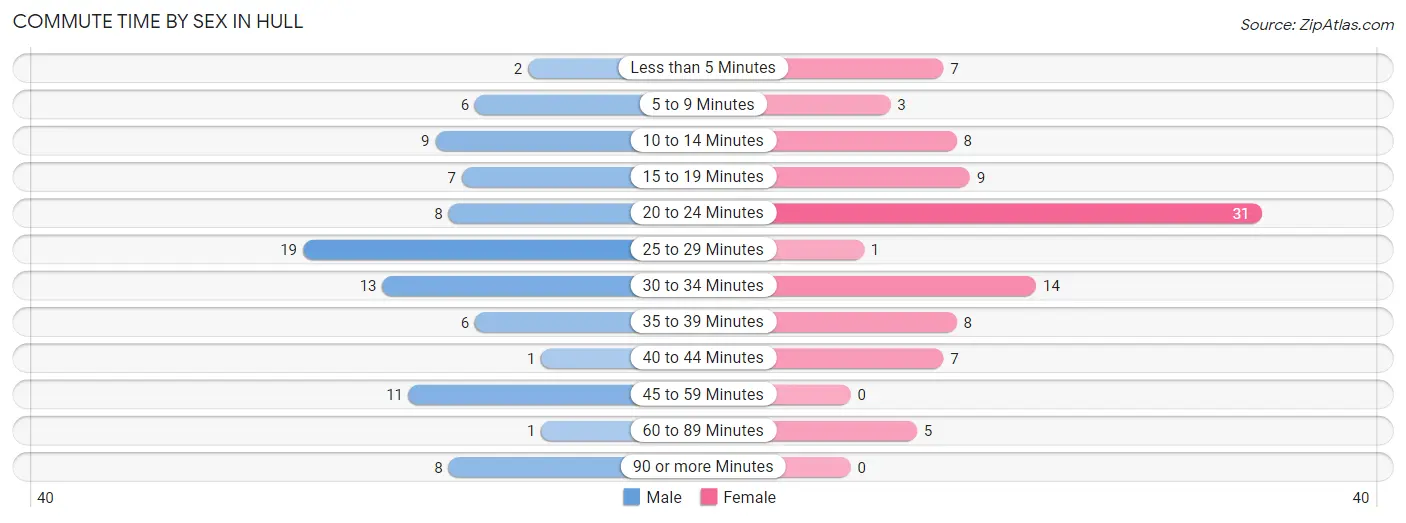
| Commute Time | Male | Female |
| Less than 5 Minutes | 2 (2.2%) | 7 (7.5%) |
| 5 to 9 Minutes | 6 (6.6%) | 3 (3.2%) |
| 10 to 14 Minutes | 9 (9.9%) | 8 (8.6%) |
| 15 to 19 Minutes | 7 (7.7%) | 9 (9.7%) |
| 20 to 24 Minutes | 8 (8.8%) | 31 (33.3%) |
| 25 to 29 Minutes | 19 (20.9%) | 1 (1.1%) |
| 30 to 34 Minutes | 13 (14.3%) | 14 (15.0%) |
| 35 to 39 Minutes | 6 (6.6%) | 8 (8.6%) |
| 40 to 44 Minutes | 1 (1.1%) | 7 (7.5%) |
| 45 to 59 Minutes | 11 (12.1%) | 0 (0.0%) |
| 60 to 89 Minutes | 1 (1.1%) | 5 (5.4%) |
| 90 or more Minutes | 8 (8.8%) | 0 (0.0%) |
Time of Departure to Work by Sex in Hull
The most frequent times of departure to work in Hull are 6:00 AM to 6:29 AM (16, 17.6%) for males and 7:00 AM to 7:29 AM (31, 33.3%) for females.
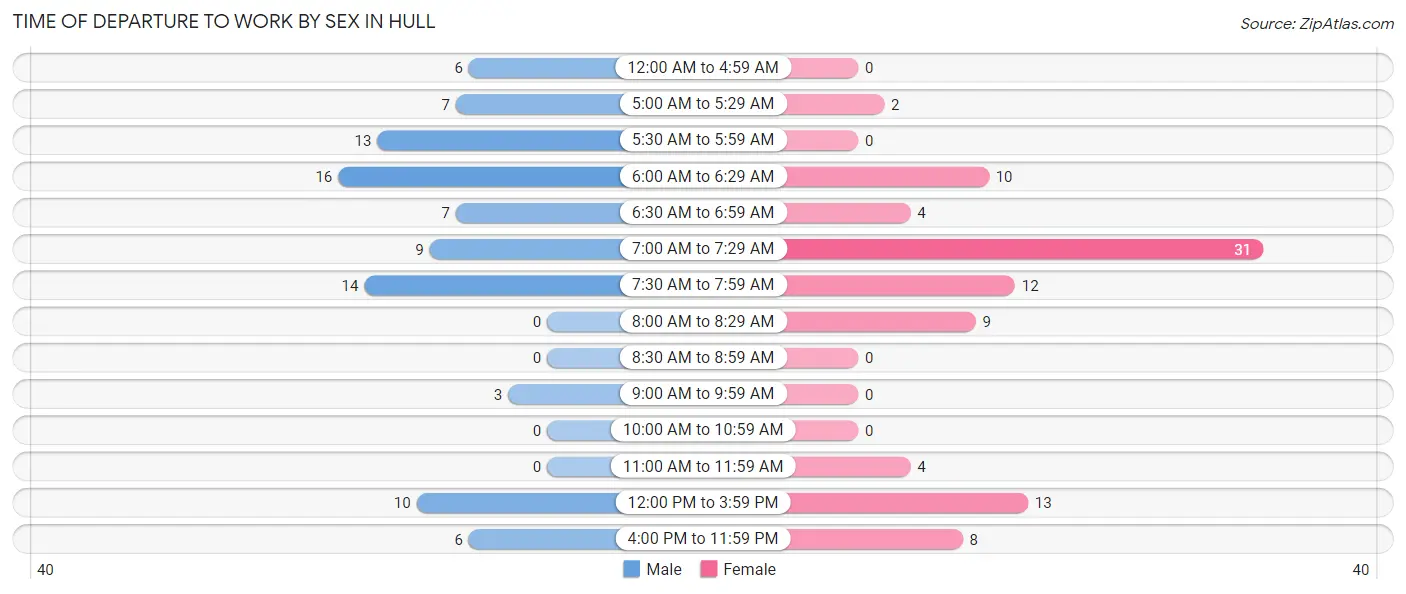
| Time of Departure | Male | Female |
| 12:00 AM to 4:59 AM | 6 (6.6%) | 0 (0.0%) |
| 5:00 AM to 5:29 AM | 7 (7.7%) | 2 (2.1%) |
| 5:30 AM to 5:59 AM | 13 (14.3%) | 0 (0.0%) |
| 6:00 AM to 6:29 AM | 16 (17.6%) | 10 (10.7%) |
| 6:30 AM to 6:59 AM | 7 (7.7%) | 4 (4.3%) |
| 7:00 AM to 7:29 AM | 9 (9.9%) | 31 (33.3%) |
| 7:30 AM to 7:59 AM | 14 (15.4%) | 12 (12.9%) |
| 8:00 AM to 8:29 AM | 0 (0.0%) | 9 (9.7%) |
| 8:30 AM to 8:59 AM | 0 (0.0%) | 0 (0.0%) |
| 9:00 AM to 9:59 AM | 3 (3.3%) | 0 (0.0%) |
| 10:00 AM to 10:59 AM | 0 (0.0%) | 0 (0.0%) |
| 11:00 AM to 11:59 AM | 0 (0.0%) | 4 (4.3%) |
| 12:00 PM to 3:59 PM | 10 (11.0%) | 13 (14.0%) |
| 4:00 PM to 11:59 PM | 6 (6.6%) | 8 (8.6%) |
| Total | 91 (100.0%) | 93 (100.0%) |
Housing Occupancy in Hull
Occupancy by Ownership in Hull
Of the total 213 dwellings in Hull, owner-occupied units account for 198 (93.0%), while renter-occupied units make up 15 (7.0%).
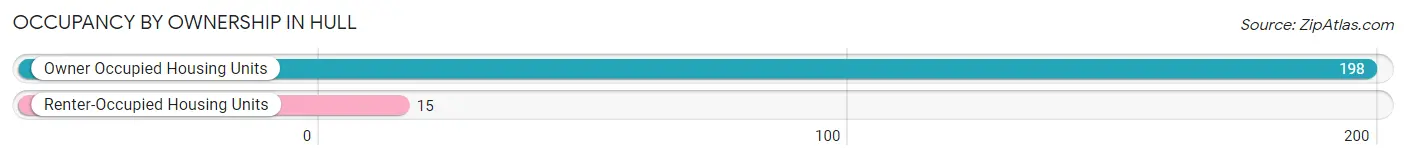
| Occupancy | # Housing Units | % Housing Units |
| Owner Occupied Housing Units | 198 | 93.0% |
| Renter-Occupied Housing Units | 15 | 7.0% |
| Total Occupied Housing Units | 213 | 100.0% |
Occupancy by Household Size in Hull
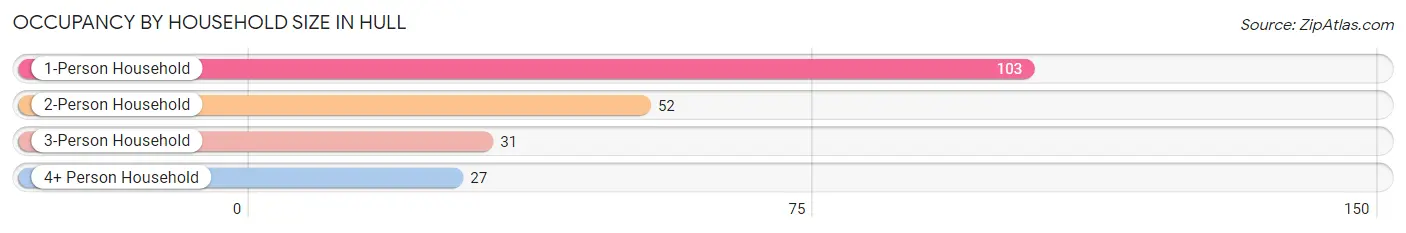
| Household Size | # Housing Units | % Housing Units |
| 1-Person Household | 103 | 48.4% |
| 2-Person Household | 52 | 24.4% |
| 3-Person Household | 31 | 14.5% |
| 4+ Person Household | 27 | 12.7% |
| Total Housing Units | 213 | 100.0% |
Occupancy by Ownership by Household Size in Hull
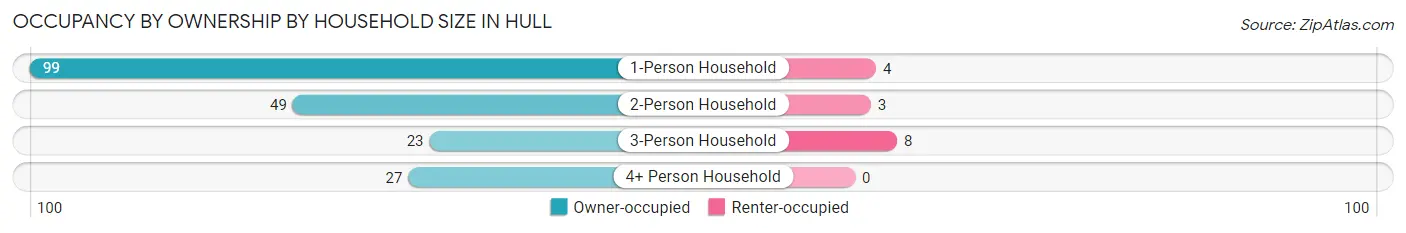
| Household Size | Owner-occupied | Renter-occupied |
| 1-Person Household | 99 (96.1%) | 4 (3.9%) |
| 2-Person Household | 49 (94.2%) | 3 (5.8%) |
| 3-Person Household | 23 (74.2%) | 8 (25.8%) |
| 4+ Person Household | 27 (100.0%) | 0 (0.0%) |
| Total Housing Units | 198 (93.0%) | 15 (7.0%) |
Occupancy by Educational Attainment in Hull
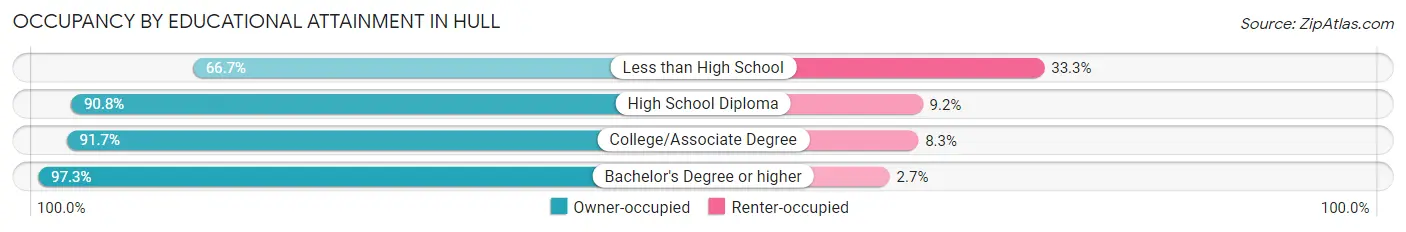
| Household Size | Owner-occupied | Renter-occupied |
| Less than High School | 2 (66.7%) | 1 (33.3%) |
| High School Diploma | 79 (90.8%) | 8 (9.2%) |
| College/Associate Degree | 44 (91.7%) | 4 (8.3%) |
| Bachelor's Degree or higher | 73 (97.3%) | 2 (2.7%) |
Occupancy by Age of Householder in Hull
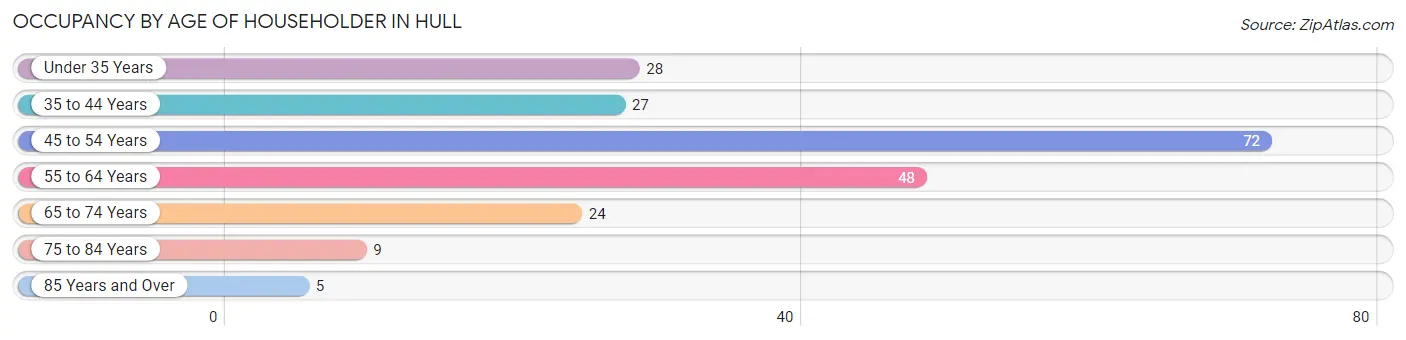
| Age Bracket | # Households | % Households |
| Under 35 Years | 28 | 13.2% |
| 35 to 44 Years | 27 | 12.7% |
| 45 to 54 Years | 72 | 33.8% |
| 55 to 64 Years | 48 | 22.5% |
| 65 to 74 Years | 24 | 11.3% |
| 75 to 84 Years | 9 | 4.2% |
| 85 Years and Over | 5 | 2.4% |
| Total | 213 | 100.0% |
Housing Finances in Hull
Median Income by Occupancy in Hull
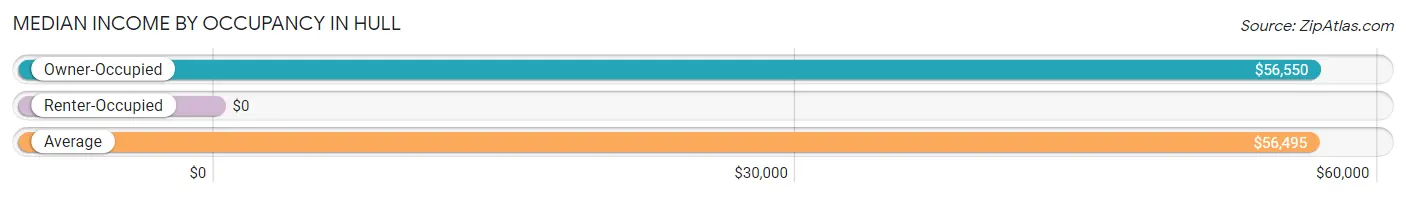
| Occupancy Type | # Households | Median Income |
| Owner-Occupied | 198 (93.0%) | $56,550 |
| Renter-Occupied | 15 (7.0%) | $0 |
| Average | 213 (100.0%) | $56,495 |
Occupancy by Householder Income Bracket in Hull
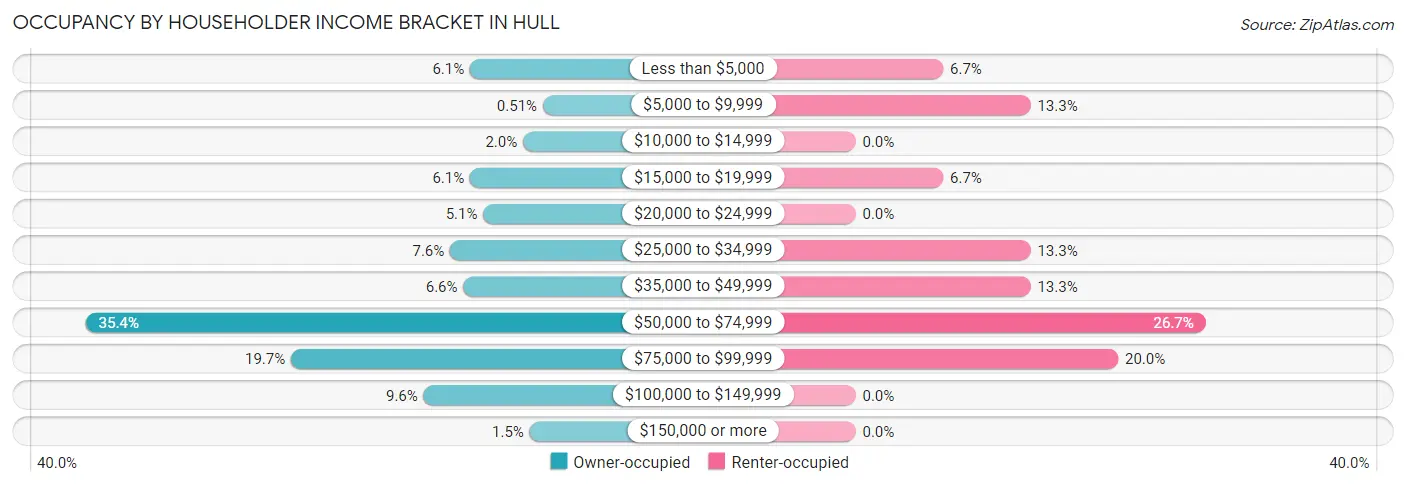
| Income Bracket | Owner-occupied | Renter-occupied |
| Less than $5,000 | 12 (6.1%) | 1 (6.7%) |
| $5,000 to $9,999 | 1 (0.5%) | 2 (13.3%) |
| $10,000 to $14,999 | 4 (2.0%) | 0 (0.0%) |
| $15,000 to $19,999 | 12 (6.1%) | 1 (6.7%) |
| $20,000 to $24,999 | 10 (5.1%) | 0 (0.0%) |
| $25,000 to $34,999 | 15 (7.6%) | 2 (13.3%) |
| $35,000 to $49,999 | 13 (6.6%) | 2 (13.3%) |
| $50,000 to $74,999 | 70 (35.3%) | 4 (26.7%) |
| $75,000 to $99,999 | 39 (19.7%) | 3 (20.0%) |
| $100,000 to $149,999 | 19 (9.6%) | 0 (0.0%) |
| $150,000 or more | 3 (1.5%) | 0 (0.0%) |
| Total | 198 (100.0%) | 15 (100.0%) |
Monthly Housing Cost Tiers in Hull
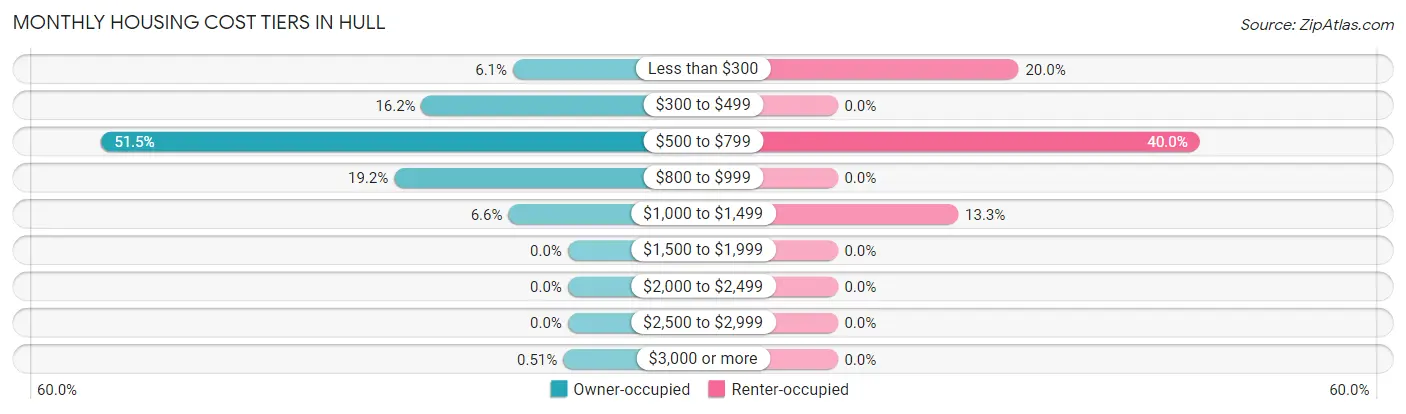
| Monthly Cost | Owner-occupied | Renter-occupied |
| Less than $300 | 12 (6.1%) | 3 (20.0%) |
| $300 to $499 | 32 (16.2%) | 0 (0.0%) |
| $500 to $799 | 102 (51.5%) | 6 (40.0%) |
| $800 to $999 | 38 (19.2%) | 0 (0.0%) |
| $1,000 to $1,499 | 13 (6.6%) | 2 (13.3%) |
| $1,500 to $1,999 | 0 (0.0%) | 0 (0.0%) |
| $2,000 to $2,499 | 0 (0.0%) | 0 (0.0%) |
| $2,500 to $2,999 | 0 (0.0%) | 0 (0.0%) |
| $3,000 or more | 1 (0.5%) | 0 (0.0%) |
| Total | 198 (100.0%) | 15 (100.0%) |
Physical Housing Characteristics in Hull
Housing Structures in Hull
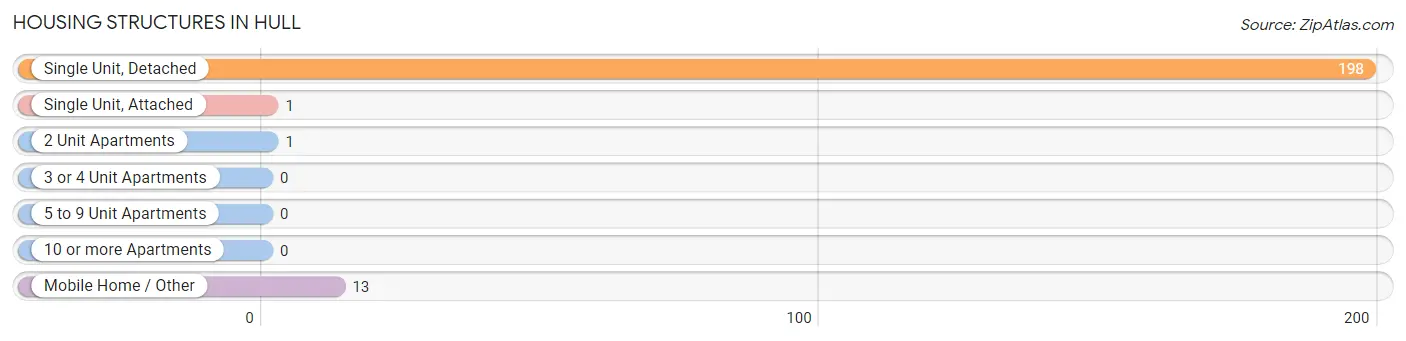
| Structure Type | # Housing Units | % Housing Units |
| Single Unit, Detached | 198 | 93.0% |
| Single Unit, Attached | 1 | 0.5% |
| 2 Unit Apartments | 1 | 0.5% |
| 3 or 4 Unit Apartments | 0 | 0.0% |
| 5 to 9 Unit Apartments | 0 | 0.0% |
| 10 or more Apartments | 0 | 0.0% |
| Mobile Home / Other | 13 | 6.1% |
| Total | 213 | 100.0% |
Housing Structures by Occupancy in Hull
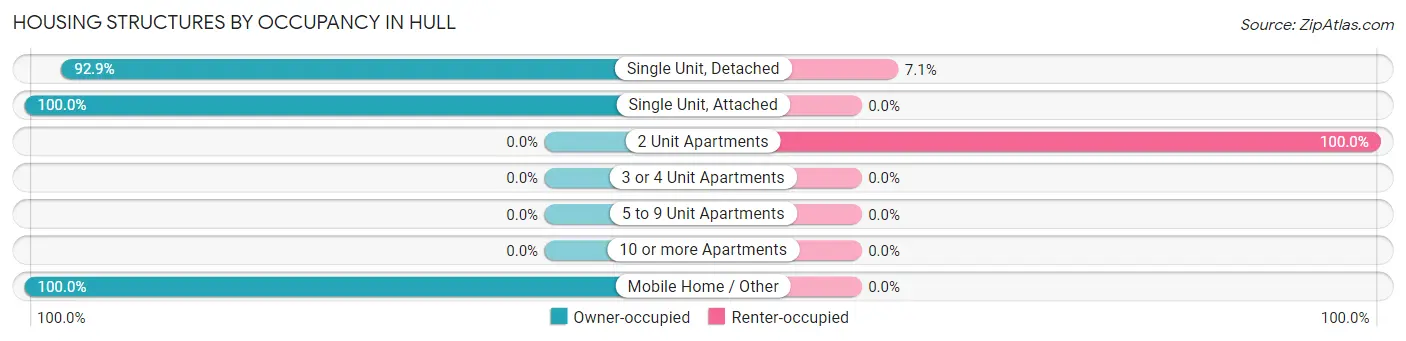
| Structure Type | Owner-occupied | Renter-occupied |
| Single Unit, Detached | 184 (92.9%) | 14 (7.1%) |
| Single Unit, Attached | 1 (100.0%) | 0 (0.0%) |
| 2 Unit Apartments | 0 (0.0%) | 1 (100.0%) |
| 3 or 4 Unit Apartments | 0 (0.0%) | 0 (0.0%) |
| 5 to 9 Unit Apartments | 0 (0.0%) | 0 (0.0%) |
| 10 or more Apartments | 0 (0.0%) | 0 (0.0%) |
| Mobile Home / Other | 13 (100.0%) | 0 (0.0%) |
| Total | 198 (93.0%) | 15 (7.0%) |
Housing Structures by Number of Rooms in Hull
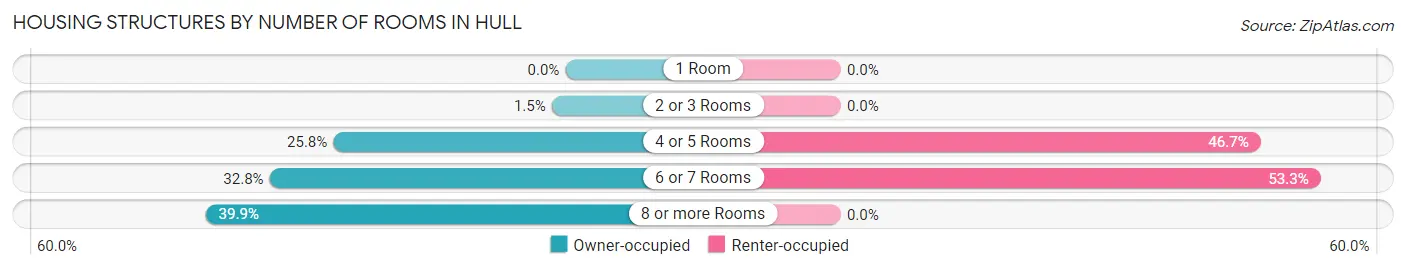
| Number of Rooms | Owner-occupied | Renter-occupied |
| 1 Room | 0 (0.0%) | 0 (0.0%) |
| 2 or 3 Rooms | 3 (1.5%) | 0 (0.0%) |
| 4 or 5 Rooms | 51 (25.8%) | 7 (46.7%) |
| 6 or 7 Rooms | 65 (32.8%) | 8 (53.3%) |
| 8 or more Rooms | 79 (39.9%) | 0 (0.0%) |
| Total | 198 (100.0%) | 15 (100.0%) |
Housing Structure by Heating Type in Hull
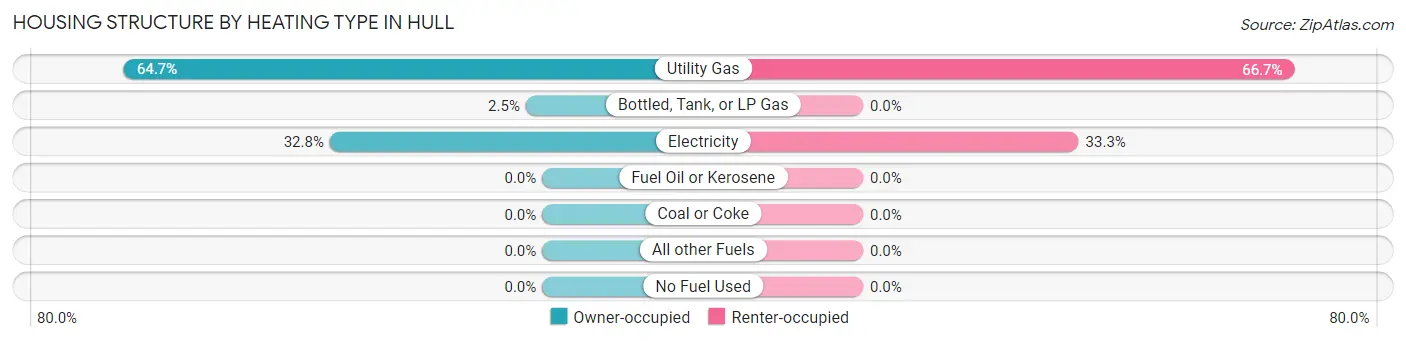
| Heating Type | Owner-occupied | Renter-occupied |
| Utility Gas | 128 (64.6%) | 10 (66.7%) |
| Bottled, Tank, or LP Gas | 5 (2.5%) | 0 (0.0%) |
| Electricity | 65 (32.8%) | 5 (33.3%) |
| Fuel Oil or Kerosene | 0 (0.0%) | 0 (0.0%) |
| Coal or Coke | 0 (0.0%) | 0 (0.0%) |
| All other Fuels | 0 (0.0%) | 0 (0.0%) |
| No Fuel Used | 0 (0.0%) | 0 (0.0%) |
| Total | 198 (100.0%) | 15 (100.0%) |
Household Vehicle Usage in Hull
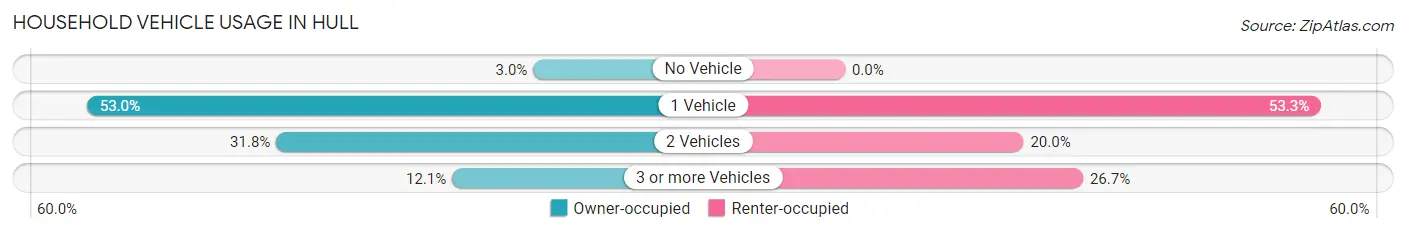
| Vehicles per Household | Owner-occupied | Renter-occupied |
| No Vehicle | 6 (3.0%) | 0 (0.0%) |
| 1 Vehicle | 105 (53.0%) | 8 (53.3%) |
| 2 Vehicles | 63 (31.8%) | 3 (20.0%) |
| 3 or more Vehicles | 24 (12.1%) | 4 (26.7%) |
| Total | 198 (100.0%) | 15 (100.0%) |
Real Estate & Mortgages in Hull
Real Estate and Mortgage Overview in Hull
| Characteristic | Without Mortgage | With Mortgage |
| Housing Units | 117 | 81 |
| Median Property Value | $104,700 | $59,000 |
| Median Household Income | $55,925 | $3 |
| Monthly Housing Costs | $703 | $1 |
| Real Estate Taxes | $2,567 | $0 |
Property Value by Mortgage Status in Hull
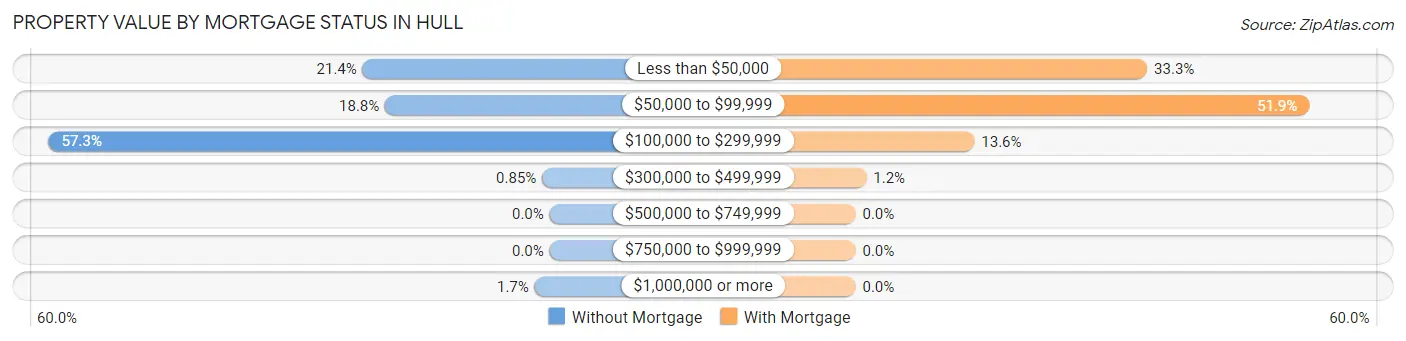
| Property Value | Without Mortgage | With Mortgage |
| Less than $50,000 | 25 (21.4%) | 27 (33.3%) |
| $50,000 to $99,999 | 22 (18.8%) | 42 (51.8%) |
| $100,000 to $299,999 | 67 (57.3%) | 11 (13.6%) |
| $300,000 to $499,999 | 1 (0.9%) | 1 (1.2%) |
| $500,000 to $749,999 | 0 (0.0%) | 0 (0.0%) |
| $750,000 to $999,999 | 0 (0.0%) | 0 (0.0%) |
| $1,000,000 or more | 2 (1.7%) | 0 (0.0%) |
| Total | 117 (100.0%) | 81 (100.0%) |
Household Income by Mortgage Status in Hull
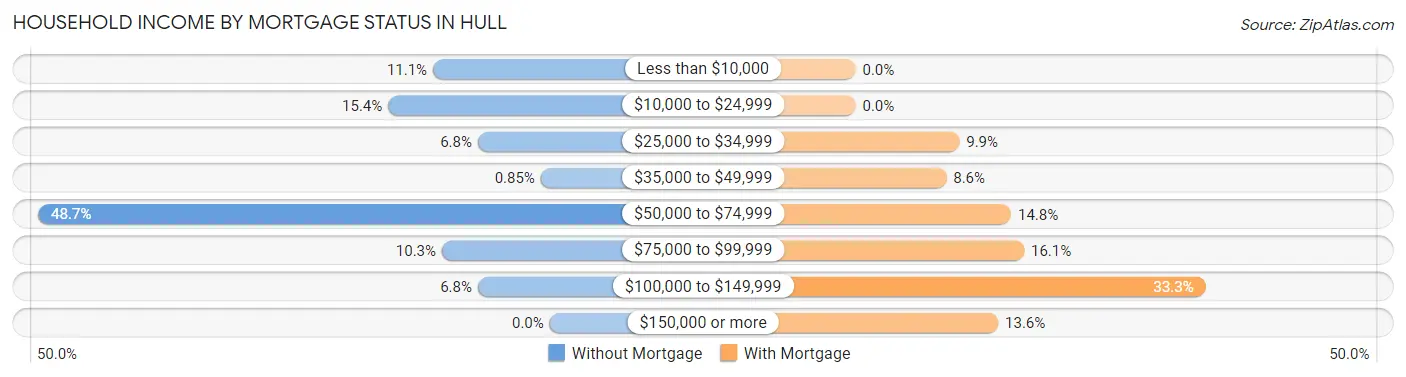
| Household Income | Without Mortgage | With Mortgage |
| Less than $10,000 | 13 (11.1%) | 0 (0.0%) |
| $10,000 to $24,999 | 18 (15.4%) | 0 (0.0%) |
| $25,000 to $34,999 | 8 (6.8%) | 8 (9.9%) |
| $35,000 to $49,999 | 1 (0.9%) | 7 (8.6%) |
| $50,000 to $74,999 | 57 (48.7%) | 12 (14.8%) |
| $75,000 to $99,999 | 12 (10.3%) | 13 (16.1%) |
| $100,000 to $149,999 | 8 (6.8%) | 27 (33.3%) |
| $150,000 or more | 0 (0.0%) | 11 (13.6%) |
| Total | 117 (100.0%) | 81 (100.0%) |
Property Value to Household Income Ratio in Hull
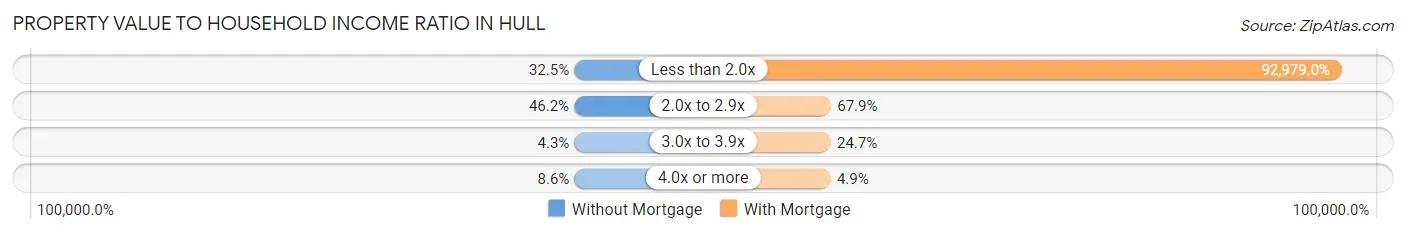
| Value-to-Income Ratio | Without Mortgage | With Mortgage |
| Less than 2.0x | 38 (32.5%) | 75,313 (92,979.0%) |
| 2.0x to 2.9x | 54 (46.2%) | 55 (67.9%) |
| 3.0x to 3.9x | 5 (4.3%) | 20 (24.7%) |
| 4.0x or more | 10 (8.6%) | 4 (4.9%) |
| Total | 117 (100.0%) | 81 (100.0%) |
Real Estate Taxes by Mortgage Status in Hull
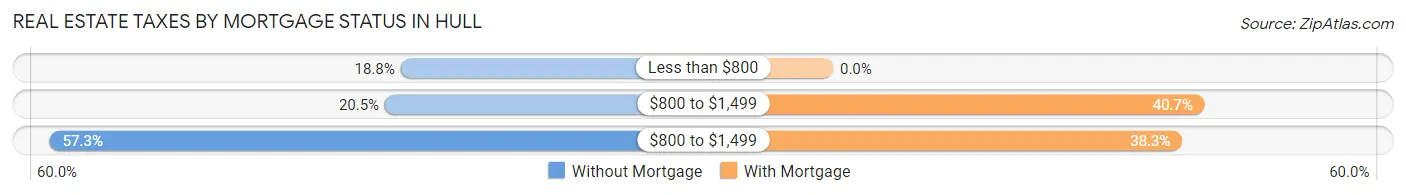
| Property Taxes | Without Mortgage | With Mortgage |
| Less than $800 | 22 (18.8%) | 0 (0.0%) |
| $800 to $1,499 | 24 (20.5%) | 33 (40.7%) |
| $800 to $1,499 | 67 (57.3%) | 31 (38.3%) |
| Total | 117 (100.0%) | 81 (100.0%) |
Health & Disability in Hull
Health Insurance Coverage by Age in Hull
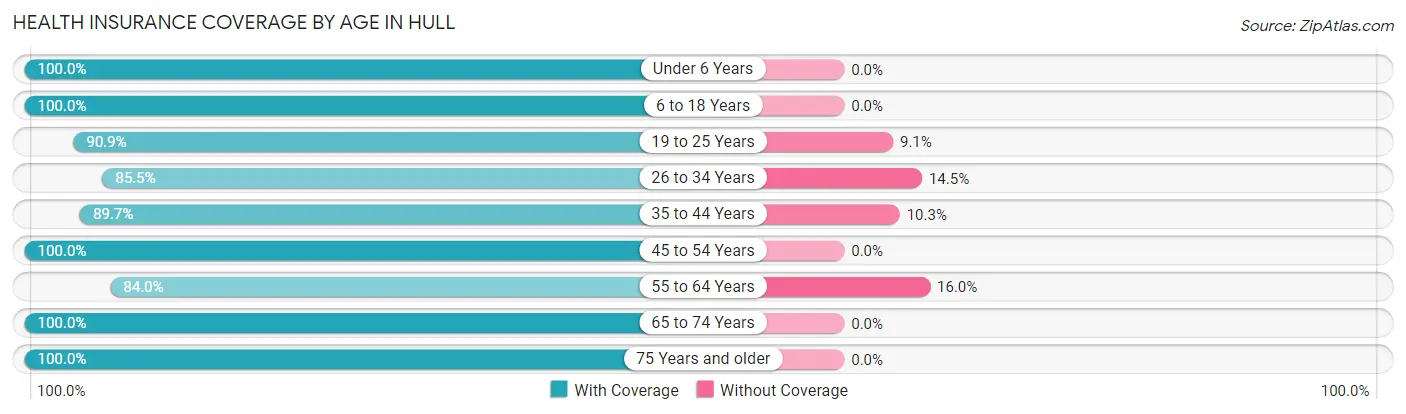
| Age Bracket | With Coverage | Without Coverage |
| Under 6 Years | 41 (100.0%) | 0 (0.0%) |
| 6 to 18 Years | 48 (100.0%) | 0 (0.0%) |
| 19 to 25 Years | 20 (90.9%) | 2 (9.1%) |
| 26 to 34 Years | 59 (85.5%) | 10 (14.5%) |
| 35 to 44 Years | 52 (89.7%) | 6 (10.3%) |
| 45 to 54 Years | 86 (100.0%) | 0 (0.0%) |
| 55 to 64 Years | 63 (84.0%) | 12 (16.0%) |
| 65 to 74 Years | 44 (100.0%) | 0 (0.0%) |
| 75 Years and older | 17 (100.0%) | 0 (0.0%) |
| Total | 430 (93.5%) | 30 (6.5%) |
Health Insurance Coverage by Citizenship Status in Hull
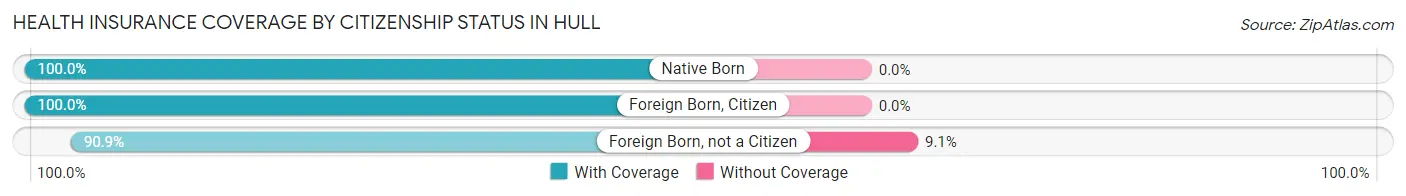
| Citizenship Status | With Coverage | Without Coverage |
| Native Born | 41 (100.0%) | 0 (0.0%) |
| Foreign Born, Citizen | 48 (100.0%) | 0 (0.0%) |
| Foreign Born, not a Citizen | 20 (90.9%) | 2 (9.1%) |
Health Insurance Coverage by Household Income in Hull
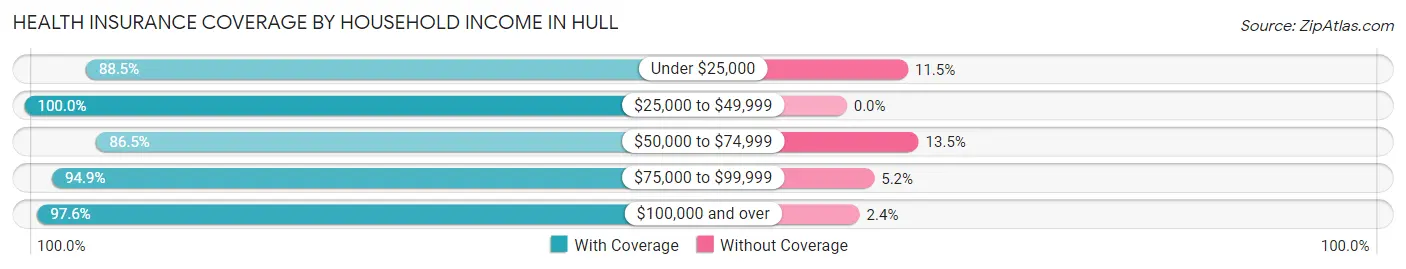
| Household Income | With Coverage | Without Coverage |
| Under $25,000 | 54 (88.5%) | 7 (11.5%) |
| $25,000 to $49,999 | 76 (100.0%) | 0 (0.0%) |
| $50,000 to $74,999 | 90 (86.5%) | 14 (13.5%) |
| $75,000 to $99,999 | 129 (94.9%) | 7 (5.1%) |
| $100,000 and over | 81 (97.6%) | 2 (2.4%) |
Public vs Private Health Insurance Coverage by Age in Hull
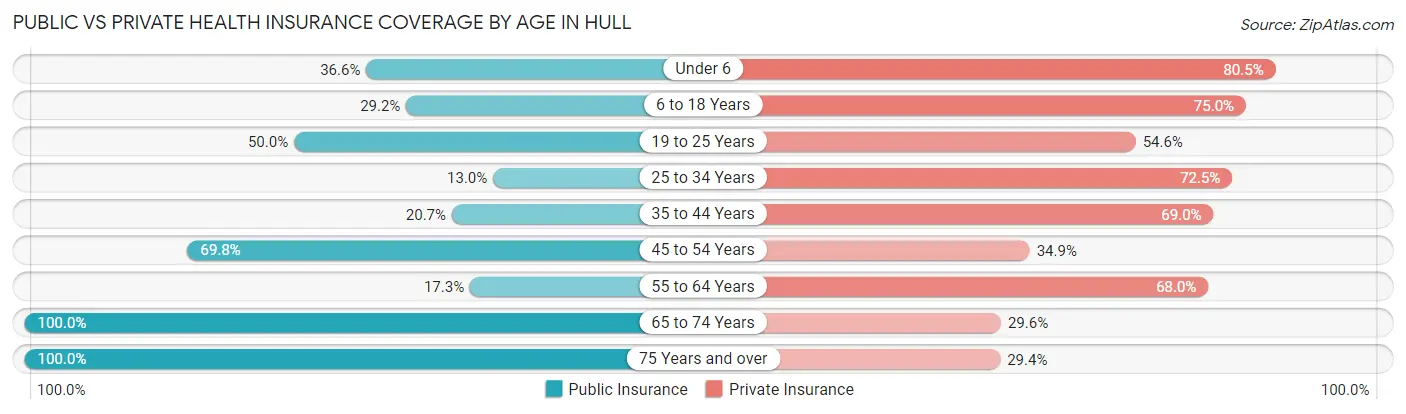
| Age Bracket | Public Insurance | Private Insurance |
| Under 6 | 15 (36.6%) | 33 (80.5%) |
| 6 to 18 Years | 14 (29.2%) | 36 (75.0%) |
| 19 to 25 Years | 11 (50.0%) | 12 (54.5%) |
| 25 to 34 Years | 9 (13.0%) | 50 (72.5%) |
| 35 to 44 Years | 12 (20.7%) | 40 (69.0%) |
| 45 to 54 Years | 60 (69.8%) | 30 (34.9%) |
| 55 to 64 Years | 13 (17.3%) | 51 (68.0%) |
| 65 to 74 Years | 44 (100.0%) | 13 (29.5%) |
| 75 Years and over | 17 (100.0%) | 5 (29.4%) |
| Total | 195 (42.4%) | 270 (58.7%) |
Disability Status by Sex by Age in Hull
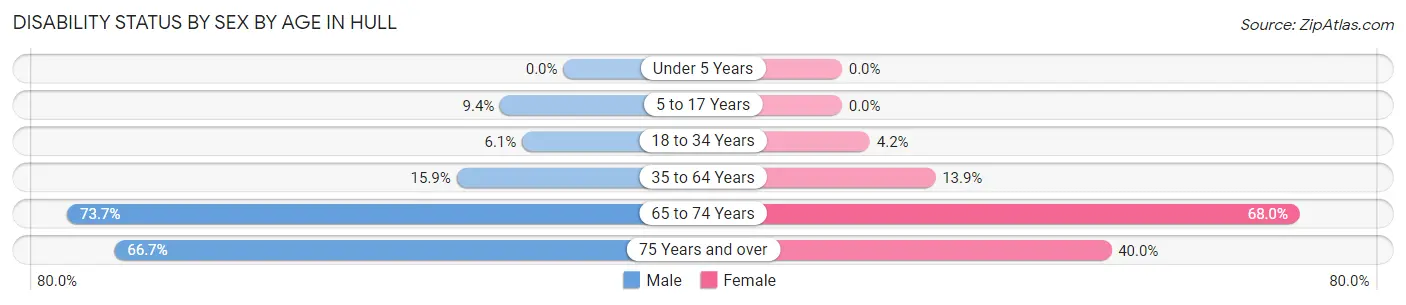
| Age Bracket | Male | Female |
| Under 5 Years | 0 (0.0%) | 0 (0.0%) |
| 5 to 17 Years | 3 (9.4%) | 0 (0.0%) |
| 18 to 34 Years | 3 (6.1%) | 2 (4.2%) |
| 35 to 64 Years | 13 (15.9%) | 19 (13.9%) |
| 65 to 74 Years | 14 (73.7%) | 17 (68.0%) |
| 75 Years and over | 8 (66.7%) | 2 (40.0%) |
Disability Class by Sex by Age in Hull
Disability Class: Hearing Difficulty
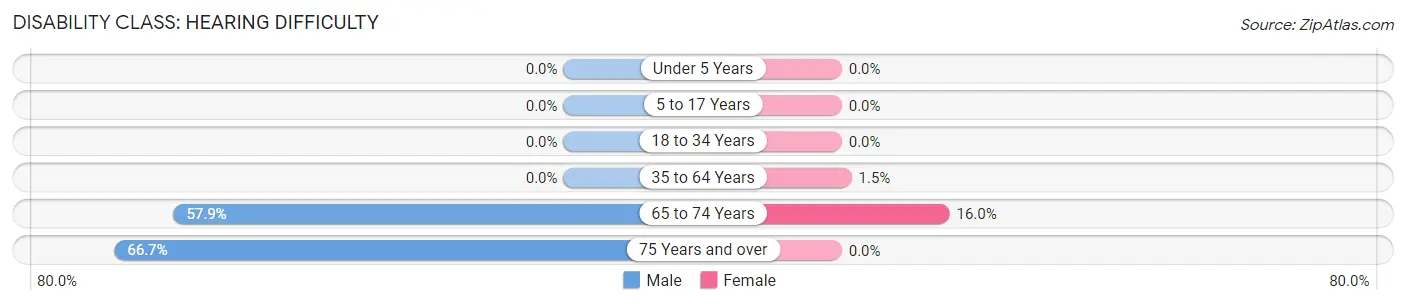
| Age Bracket | Male | Female |
| Under 5 Years | 0 (0.0%) | 0 (0.0%) |
| 5 to 17 Years | 0 (0.0%) | 0 (0.0%) |
| 18 to 34 Years | 0 (0.0%) | 0 (0.0%) |
| 35 to 64 Years | 0 (0.0%) | 2 (1.5%) |
| 65 to 74 Years | 11 (57.9%) | 4 (16.0%) |
| 75 Years and over | 8 (66.7%) | 0 (0.0%) |
Disability Class: Vision Difficulty
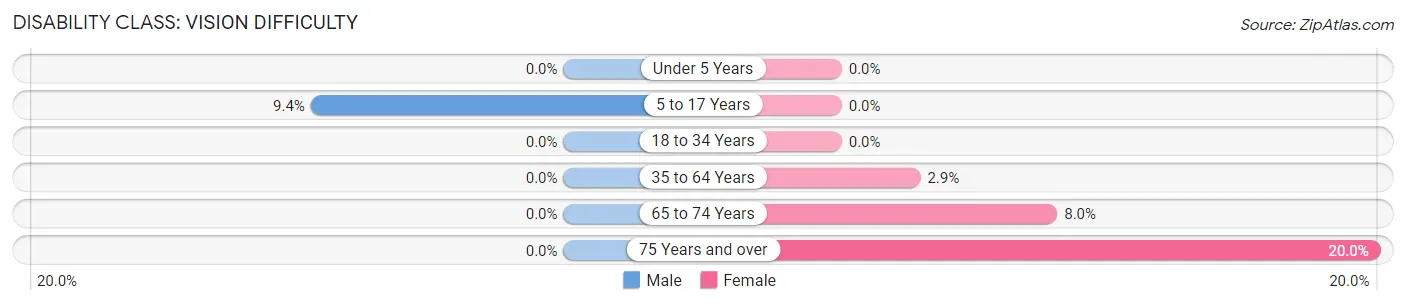
| Age Bracket | Male | Female |
| Under 5 Years | 0 (0.0%) | 0 (0.0%) |
| 5 to 17 Years | 3 (9.4%) | 0 (0.0%) |
| 18 to 34 Years | 0 (0.0%) | 0 (0.0%) |
| 35 to 64 Years | 0 (0.0%) | 4 (2.9%) |
| 65 to 74 Years | 0 (0.0%) | 2 (8.0%) |
| 75 Years and over | 0 (0.0%) | 1 (20.0%) |
Disability Class: Cognitive Difficulty
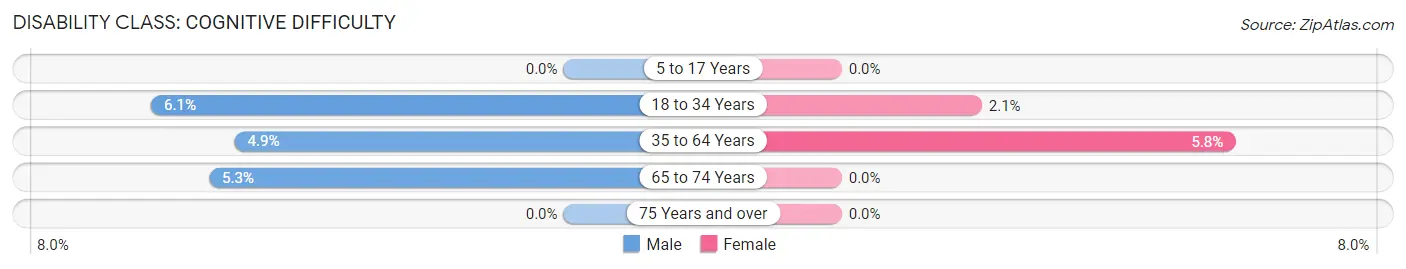
| Age Bracket | Male | Female |
| 5 to 17 Years | 0 (0.0%) | 0 (0.0%) |
| 18 to 34 Years | 3 (6.1%) | 1 (2.1%) |
| 35 to 64 Years | 4 (4.9%) | 8 (5.8%) |
| 65 to 74 Years | 1 (5.3%) | 0 (0.0%) |
| 75 Years and over | 0 (0.0%) | 0 (0.0%) |
Disability Class: Ambulatory Difficulty
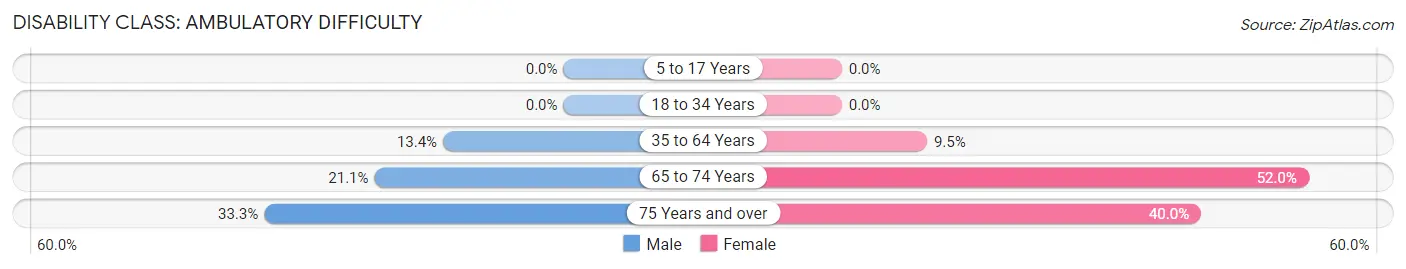
| Age Bracket | Male | Female |
| 5 to 17 Years | 0 (0.0%) | 0 (0.0%) |
| 18 to 34 Years | 0 (0.0%) | 0 (0.0%) |
| 35 to 64 Years | 11 (13.4%) | 13 (9.5%) |
| 65 to 74 Years | 4 (21.0%) | 13 (52.0%) |
| 75 Years and over | 4 (33.3%) | 2 (40.0%) |
Disability Class: Self-Care Difficulty
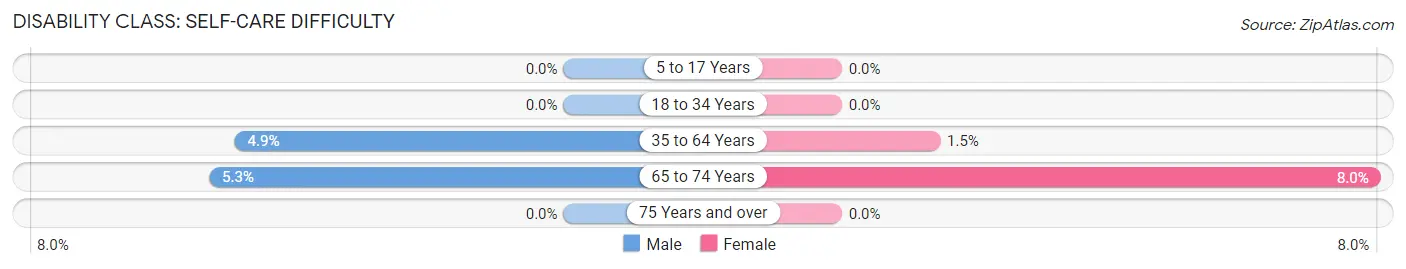
| Age Bracket | Male | Female |
| 5 to 17 Years | 0 (0.0%) | 0 (0.0%) |
| 18 to 34 Years | 0 (0.0%) | 0 (0.0%) |
| 35 to 64 Years | 4 (4.9%) | 2 (1.5%) |
| 65 to 74 Years | 1 (5.3%) | 2 (8.0%) |
| 75 Years and over | 0 (0.0%) | 0 (0.0%) |
Technology Access in Hull
Computing Device Access in Hull
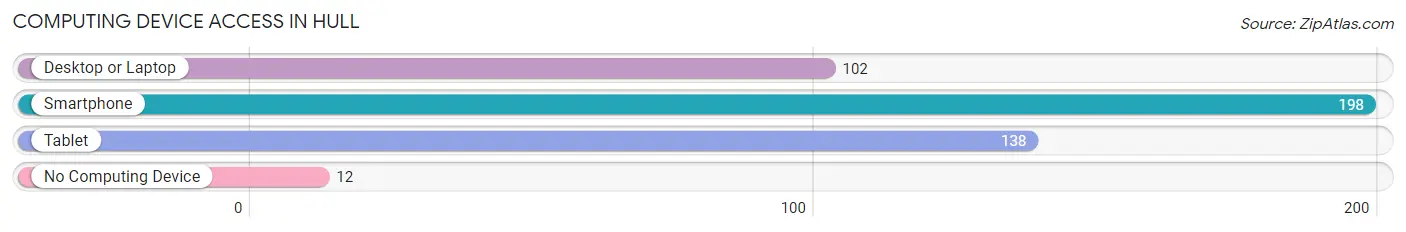
| Device Type | # Households | % Households |
| Desktop or Laptop | 102 | 47.9% |
| Smartphone | 198 | 93.0% |
| Tablet | 138 | 64.8% |
| No Computing Device | 12 | 5.6% |
| Total | 213 | 100.0% |
Internet Access in Hull
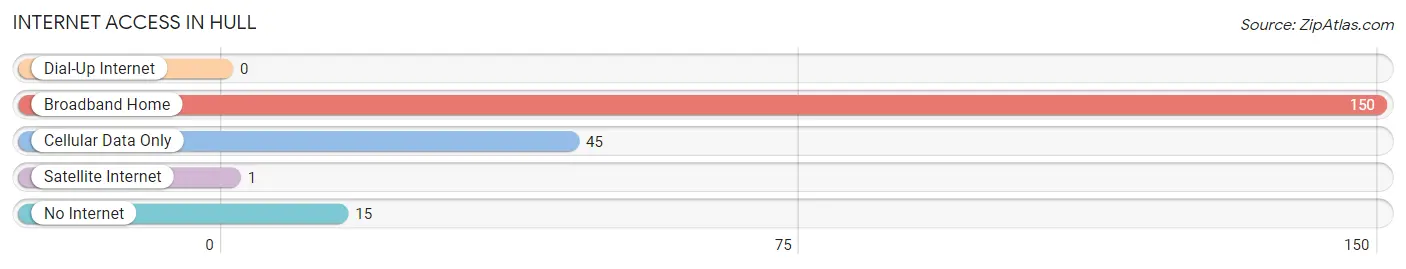
| Internet Type | # Households | % Households |
| Dial-Up Internet | 0 | 0.0% |
| Broadband Home | 150 | 70.4% |
| Cellular Data Only | 45 | 21.1% |
| Satellite Internet | 1 | 0.5% |
| No Internet | 15 | 7.0% |
| Total | 213 | 100.0% |
Hull Summary
Hull is a small village located in the state of Illinois, in the United States. It is situated in the northern part of the state, in the county of Rock Island. The village is located on the banks of the Mississippi River, and is part of the Quad Cities metropolitan area. The population of Hull was 1,845 at the 2010 census.
History
Hull was first settled in 1836 by a group of settlers from New York. The village was originally known as “Hull’s Landing”, and was named after the first settler, William Hull. The village was incorporated in 1854, and the first post office was established in 1855.
In the late 19th century, Hull was a thriving river port, with a large number of steamboats and barges passing through the village. The village was also home to a number of industries, including a flour mill, a sawmill, a brickyard, and a distillery.
In the early 20th century, Hull was a popular tourist destination, with many visitors coming to the village to enjoy the scenery and the river. The village was also home to a number of resorts, including the Hull House, which was a popular destination for vacationers.
Geography
Hull is located at 41°30'25" North, 90°30'45" West (41.506944, -90.5125). The village is situated on the banks of the Mississippi River, and is part of the Quad Cities metropolitan area. The village is located in the northern part of the state, in the county of Rock Island.
The total area of Hull is 1.2 square miles, all of which is land. The village is located in a flat, low-lying area, and is surrounded by agricultural land. The climate in Hull is humid continental, with hot, humid summers and cold, snowy winters.
Economy
The economy of Hull is largely based on agriculture and tourism. The village is home to a number of farms, which produce a variety of crops, including corn, soybeans, and wheat. The village is also home to a number of tourist attractions, including the Hull House, which is a popular destination for vacationers.
The village is also home to a number of small businesses, including restaurants, retail stores, and service providers. The village is served by a number of highways, including Interstate 80, which runs through the village.
Demographics
As of the 2010 census, the population of Hull was 1,845. The racial makeup of the village was 97.2% White, 0.7% African American, 0.2% Native American, 0.2% Asian, 0.1% Pacific Islander, 0.7% from other races, and 0.9% from two or more races. Hispanic or Latino of any race were 2.2% of the population.
The median income for a household in Hull was $45,938, and the median income for a family was $51,250. The per capita income for the village was $20,945. About 6.2% of families and 8.2% of the population were below the poverty line, including 10.2% of those under age 18 and 5.2% of those age 65 or over.
Common Questions
What is Per Capita Income in Hull?
Per Capita income in Hull is $28,142.
What is the Median Family Income in Hull?
Median Family Income in Hull is $71,250.
What is the Median Household income in Hull?
Median Household Income in Hull is $56,495.
What is Income or Wage Gap in Hull?
Income or Wage Gap in Hull is 11.6%.
Women in Hull earn 88.4 cents for every dollar earned by a man.
What is Inequality or Gini Index in Hull?
Inequality or Gini Index in Hull is 0.33.
What is the Total Population of Hull?
Total Population of Hull is 460.
What is the Total Male Population of Hull?
Total Male Population of Hull is 211.
What is the Total Female Population of Hull?
Total Female Population of Hull is 249.
What is the Ratio of Males per 100 Females in Hull?
There are 84.74 Males per 100 Females in Hull.
What is the Ratio of Females per 100 Males in Hull?
There are 118.01 Females per 100 Males in Hull.
What is the Median Population Age in Hull?
Median Population Age in Hull is 44.0 Years.
What is the Average Family Size in Hull
Average Family Size in Hull is 3.1 People.
What is the Average Household Size in Hull
Average Household Size in Hull is 2.2 People.
How Large is the Labor Force in Hull?
There are 256 People in the Labor Forcein in Hull.
What is the Percentage of People in the Labor Force in Hull?
67.0% of People are in the Labor Force in Hull.
What is the Unemployment Rate in Hull?
Unemployment Rate in Hull is 0.4%.