Hampshire, IL Map & Demographics
Hampshire Map
Hampshire Overview
$55,048
PER CAPITA INCOME
$115,650
AVG FAMILY INCOME
$104,746
AVG HOUSEHOLD INCOME
31.7%
WAGE / INCOME GAP [ % ]
68.3¢/ $1
WAGE / INCOME GAP [ $ ]
0.52
INEQUALITY / GINI INDEX
8,113
TOTAL POPULATION
3,816
MALE POPULATION
4,297
FEMALE POPULATION
88.81
MALES / 100 FEMALES
112.60
FEMALES / 100 MALES
39.2
MEDIAN AGE
3.4
AVG FAMILY SIZE
3.1
AVG HOUSEHOLD SIZE
3,884
LABOR FORCE [ PEOPLE ]
61.0%
PERCENT IN LABOR FORCE
2.0%
UNEMPLOYMENT RATE
Hampshire Zip Codes
Income in Hampshire
Income Overview in Hampshire
Per Capita Income in Hampshire is $55,048, while median incomes of families and households are $115,650 and $104,746 respectively.
| Characteristic | Number | Measure |
| Per Capita Income | 8,113 | $55,048 |
| Median Family Income | 2,029 | $115,650 |
| Mean Family Income | 2,029 | $198,619 |
| Median Household Income | 2,631 | $104,746 |
| Mean Household Income | 2,631 | $168,225 |
| Income Deficit | 2,029 | $0 |
| Wage / Income Gap (%) | 8,113 | 31.67% |
| Wage / Income Gap ($) | 8,113 | 68.33¢ per $1 |
| Gini / Inequality Index | 8,113 | 0.52 |
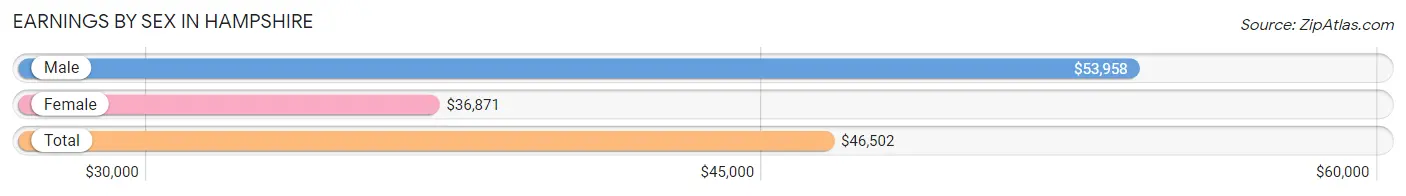
Earnings by Sex in Hampshire
Average Earnings in Hampshire are $46,502, $53,958 for men and $36,871 for women, a difference of 31.7%.
| Sex | Number | Average Earnings |
| Male | 2,358 (52.9%) | $53,958 |
| Female | 2,095 (47.0%) | $36,871 |
| Total | 4,453 (100.0%) | $46,502 |
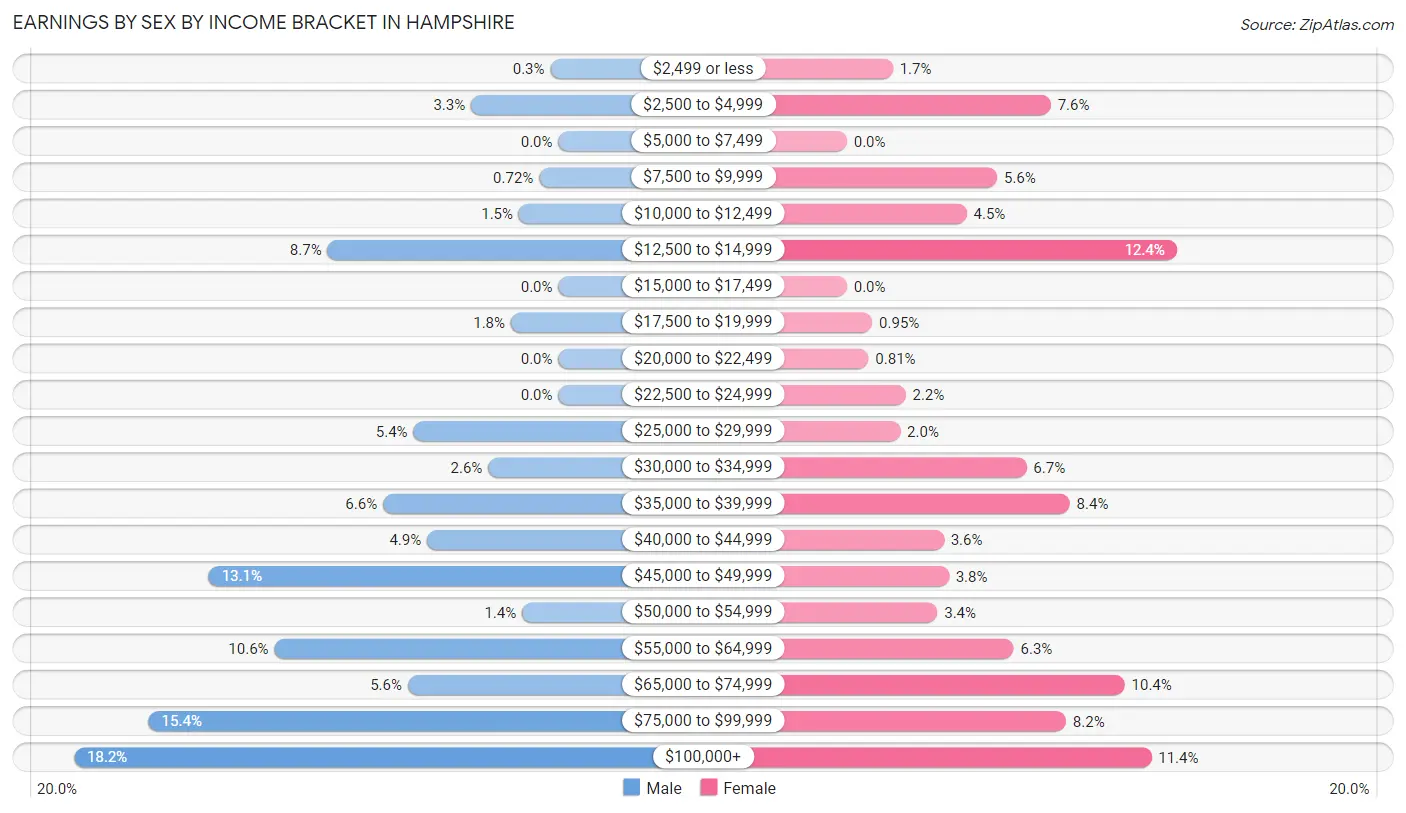
Earnings by Sex by Income Bracket in Hampshire
The most common earnings brackets in Hampshire are $100,000+ for men (428 | 18.1%) and $12,500 to $14,999 for women (259 | 12.4%).
| Income | Male | Female |
| $2,499 or less | 7 (0.3%) | 36 (1.7%) |
| $2,500 to $4,999 | 77 (3.3%) | 160 (7.6%) |
| $5,000 to $7,499 | 0 (0.0%) | 0 (0.0%) |
| $7,500 to $9,999 | 17 (0.7%) | 118 (5.6%) |
| $10,000 to $12,499 | 35 (1.5%) | 94 (4.5%) |
| $12,500 to $14,999 | 204 (8.6%) | 259 (12.4%) |
| $15,000 to $17,499 | 0 (0.0%) | 0 (0.0%) |
| $17,500 to $19,999 | 42 (1.8%) | 20 (0.9%) |
| $20,000 to $22,499 | 0 (0.0%) | 17 (0.8%) |
| $22,500 to $24,999 | 0 (0.0%) | 46 (2.2%) |
| $25,000 to $29,999 | 128 (5.4%) | 42 (2.0%) |
| $30,000 to $34,999 | 62 (2.6%) | 141 (6.7%) |
| $35,000 to $39,999 | 155 (6.6%) | 175 (8.4%) |
| $40,000 to $44,999 | 116 (4.9%) | 76 (3.6%) |
| $45,000 to $49,999 | 309 (13.1%) | 80 (3.8%) |
| $50,000 to $54,999 | 32 (1.4%) | 71 (3.4%) |
| $55,000 to $64,999 | 251 (10.6%) | 131 (6.2%) |
| $65,000 to $74,999 | 133 (5.6%) | 218 (10.4%) |
| $75,000 to $99,999 | 362 (15.3%) | 172 (8.2%) |
| $100,000+ | 428 (18.1%) | 239 (11.4%) |
| Total | 2,358 (100.0%) | 2,095 (100.0%) |
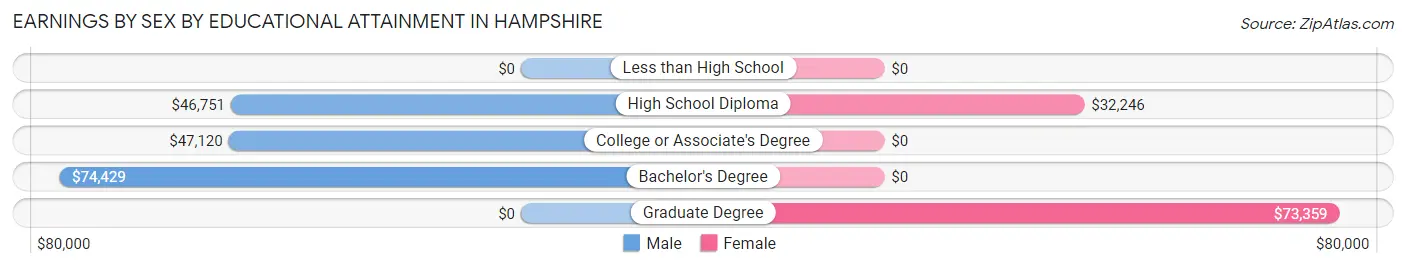
Earnings by Sex by Educational Attainment in Hampshire
Average earnings in Hampshire are $62,606 for men and $40,329 for women, a difference of 35.6%. Men with an educational attainment of bachelor's degree enjoy the highest average annual earnings of $74,429, while those with high school diploma education earn the least with $46,751. Women with an educational attainment of graduate degree earn the most with the average annual earnings of $73,359, while those with high school diploma education have the smallest earnings of $32,246.
| Educational Attainment | Male Income | Female Income |
| Less than High School | - | - |
| High School Diploma | $46,751 | $32,246 |
| College or Associate's Degree | $47,120 | $0 |
| Bachelor's Degree | $74,429 | $0 |
| Graduate Degree | - | - |
| Total | $62,606 | $40,329 |
Family Income in Hampshire
Family Income Brackets in Hampshire
According to the Hampshire family income data, there are 773 families falling into the $100,000 to $149,999 income range, which is the most common income bracket and makes up 38.1% of all families.
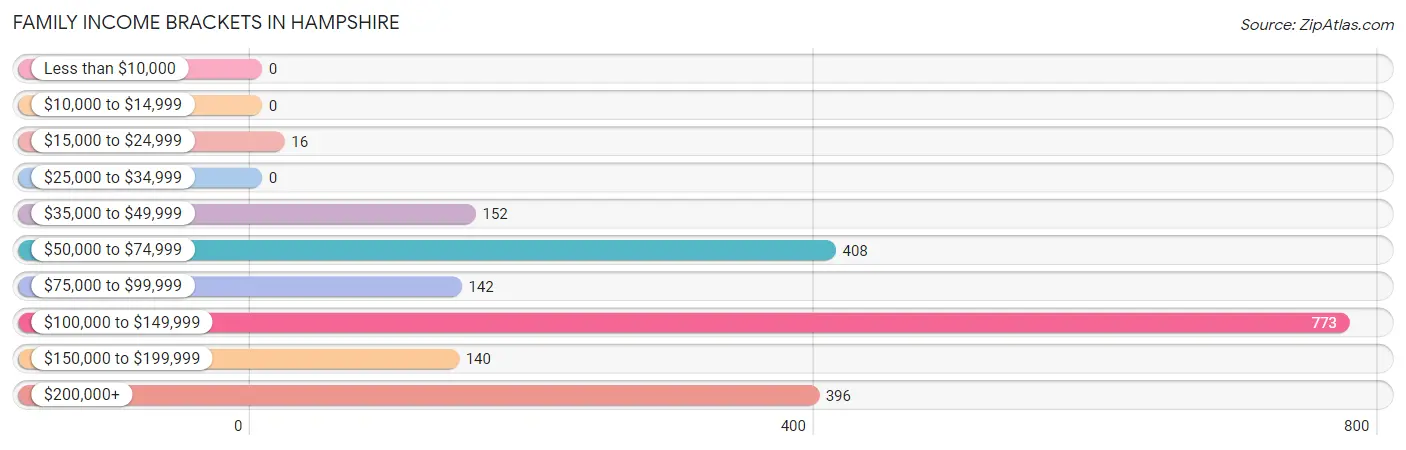
| Income Bracket | # Families | % Families |
| Less than $10,000 | 0 | 0.0% |
| $10,000 to $14,999 | 0 | 0.0% |
| $15,000 to $24,999 | 16 | 0.8% |
| $25,000 to $34,999 | 0 | 0.0% |
| $35,000 to $49,999 | 152 | 7.5% |
| $50,000 to $74,999 | 408 | 20.1% |
| $75,000 to $99,999 | 142 | 7.0% |
| $100,000 to $149,999 | 773 | 38.1% |
| $150,000 to $199,999 | 140 | 6.9% |
| $200,000+ | 396 | 19.5% |
Family Income by Famaliy Size in Hampshire
6-person families (101 | 5.0%) account for the highest median family income in Hampshire with $160,662 per family, while 2-person families (576 | 28.4%) have the highest median income of $57,800 per family member.
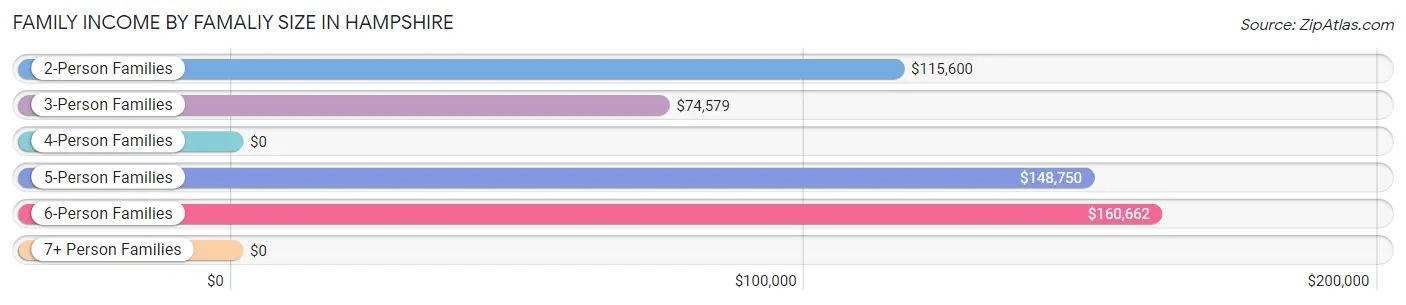
| Income Bracket | # Families | Median Income |
| 2-Person Families | 576 (28.4%) | $115,600 |
| 3-Person Families | 693 (34.2%) | $74,579 |
| 4-Person Families | 467 (23.0%) | $0 |
| 5-Person Families | 192 (9.5%) | $148,750 |
| 6-Person Families | 101 (5.0%) | $160,662 |
| 7+ Person Families | 0 (0.0%) | $0 |
| Total | 2,029 (100.0%) | $115,650 |
Family Income by Number of Earners in Hampshire
The median family income in Hampshire is $115,650, with families comprising 3+ earners (213) having the highest median family income of $161,201, while families with 1 earner (363) have the lowest median family income of $55,991, accounting for 10.5% and 17.9% of families, respectively.
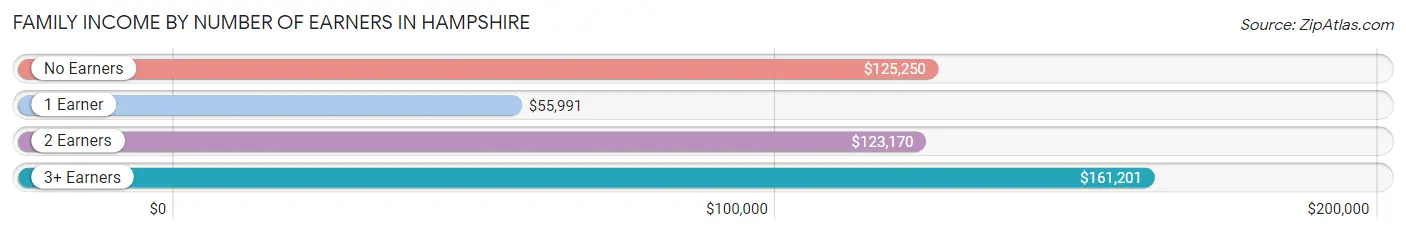
| Number of Earners | # Families | Median Income |
| No Earners | 124 (6.1%) | $125,250 |
| 1 Earner | 363 (17.9%) | $55,991 |
| 2 Earners | 1,329 (65.5%) | $123,170 |
| 3+ Earners | 213 (10.5%) | $161,201 |
| Total | 2,029 (100.0%) | $115,650 |
Household Income in Hampshire
Household Income Brackets in Hampshire
With 871 households falling in the category, the $100,000 to $149,999 income range is the most frequent in Hampshire, accounting for 33.1% of all households.
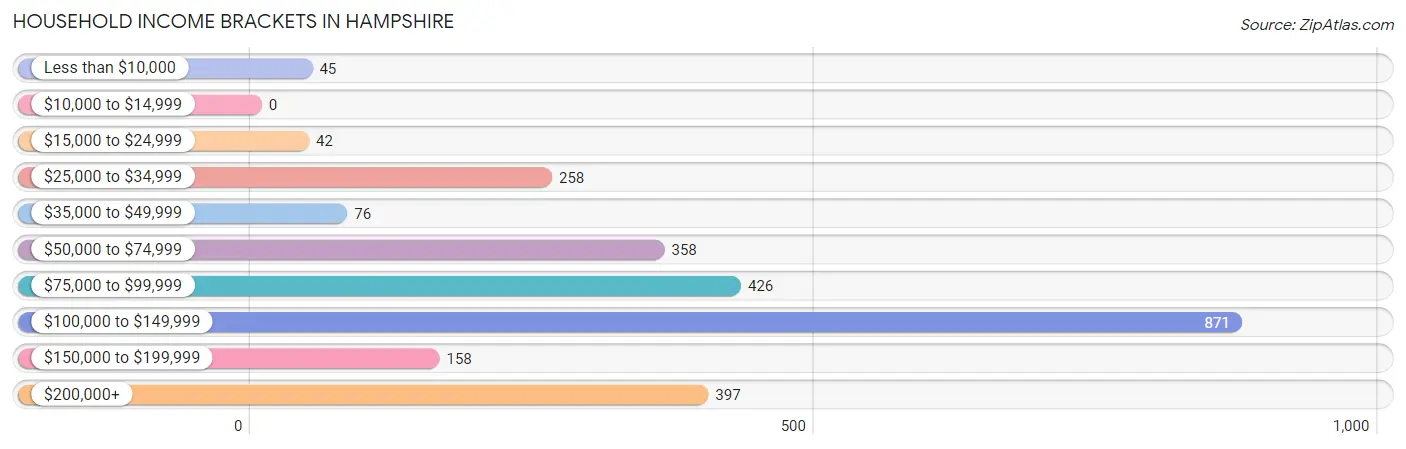
| Income Bracket | # Households | % Households |
| Less than $10,000 | 45 | 1.7% |
| $10,000 to $14,999 | 0 | 0.0% |
| $15,000 to $24,999 | 42 | 1.6% |
| $25,000 to $34,999 | 258 | 9.8% |
| $35,000 to $49,999 | 76 | 2.9% |
| $50,000 to $74,999 | 358 | 13.6% |
| $75,000 to $99,999 | 426 | 16.2% |
| $100,000 to $149,999 | 871 | 33.1% |
| $150,000 to $199,999 | 158 | 6.0% |
| $200,000+ | 397 | 15.1% |
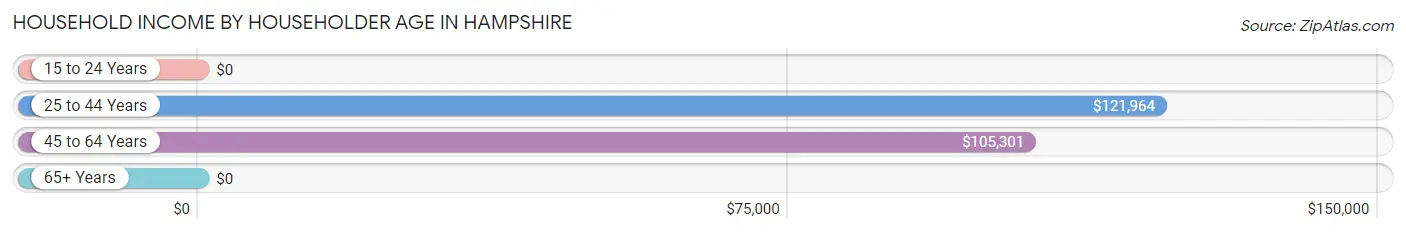
Household Income by Householder Age in Hampshire
The median household income in Hampshire is $104,746, with the highest median household income of $121,964 found in the 25 to 44 years age bracket for the primary householder. A total of 927 households (35.2%) fall into this category.
| Income Bracket | # Households | Median Income |
| 15 to 24 Years | 0 (0.0%) | $0 |
| 25 to 44 Years | 927 (35.2%) | $121,964 |
| 45 to 64 Years | 1,161 (44.1%) | $105,301 |
| 65+ Years | 543 (20.6%) | $0 |
| Total | 2,631 (100.0%) | $104,746 |
Poverty in Hampshire
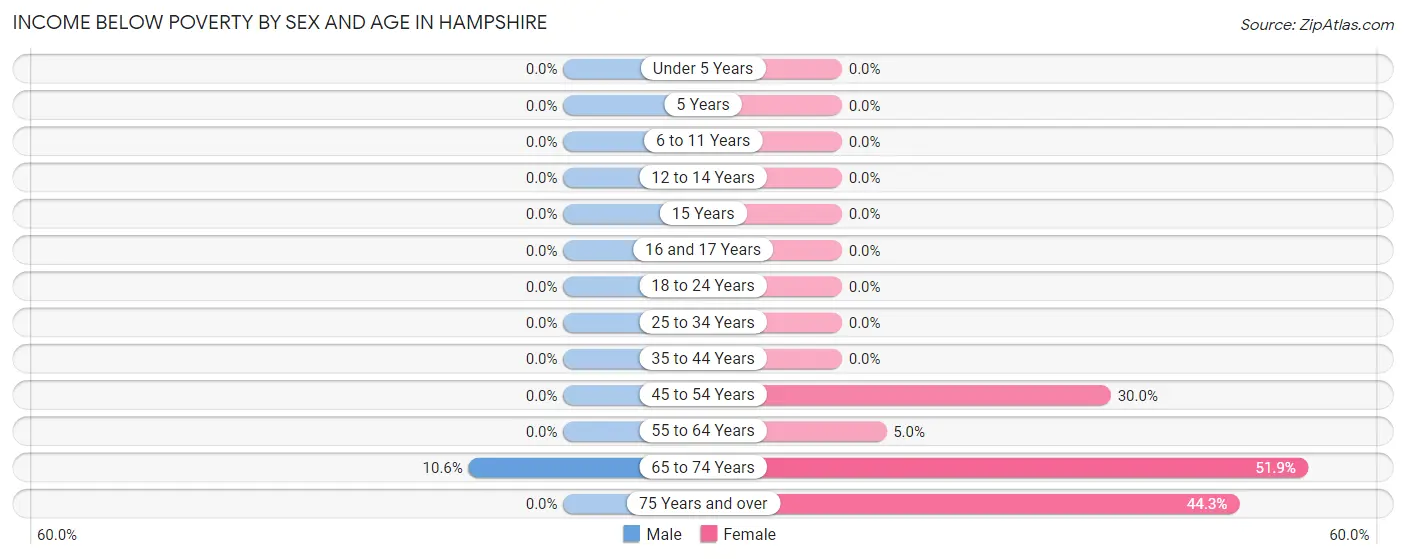
Income Below Poverty by Sex and Age in Hampshire
With 1.1% poverty level for males and 10.9% for females among the residents of Hampshire, 65 to 74 year old males and 65 to 74 year old females are the most vulnerable to poverty, with 44 males (10.5%) and 166 females (51.9%) in their respective age groups living below the poverty level.
| Age Bracket | Male | Female |
| Under 5 Years | 0 (0.0%) | 0 (0.0%) |
| 5 Years | 0 (0.0%) | 0 (0.0%) |
| 6 to 11 Years | 0 (0.0%) | 0 (0.0%) |
| 12 to 14 Years | 0 (0.0%) | 0 (0.0%) |
| 15 Years | 0 (0.0%) | 0 (0.0%) |
| 16 and 17 Years | 0 (0.0%) | 0 (0.0%) |
| 18 to 24 Years | 0 (0.0%) | 0 (0.0%) |
| 25 to 34 Years | 0 (0.0%) | 0 (0.0%) |
| 35 to 44 Years | 0 (0.0%) | 0 (0.0%) |
| 45 to 54 Years | 0 (0.0%) | 239 (29.9%) |
| 55 to 64 Years | 0 (0.0%) | 15 (5.0%) |
| 65 to 74 Years | 44 (10.5%) | 166 (51.9%) |
| 75 Years and over | 0 (0.0%) | 50 (44.3%) |
| Total | 44 (1.1%) | 470 (10.9%) |
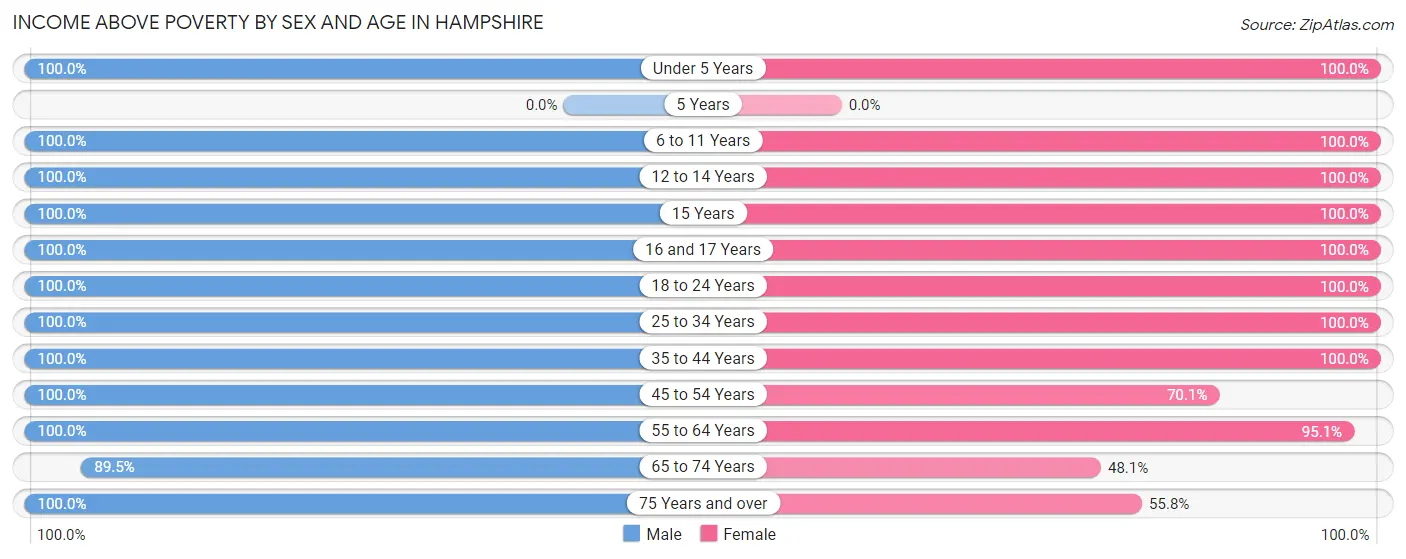
Income Above Poverty by Sex and Age in Hampshire
According to the poverty statistics in Hampshire, males aged under 5 years and females aged under 5 years are the age groups that are most secure financially, with 100.0% of males and 100.0% of females in these age groups living above the poverty line.
| Age Bracket | Male | Female |
| Under 5 Years | 168 (100.0%) | 152 (100.0%) |
| 5 Years | 0 (0.0%) | 0 (0.0%) |
| 6 to 11 Years | 163 (100.0%) | 717 (100.0%) |
| 12 to 14 Years | 182 (100.0%) | 238 (100.0%) |
| 15 Years | 58 (100.0%) | 67 (100.0%) |
| 16 and 17 Years | 20 (100.0%) | 85 (100.0%) |
| 18 to 24 Years | 256 (100.0%) | 459 (100.0%) |
| 25 to 34 Years | 347 (100.0%) | 367 (100.0%) |
| 35 to 44 Years | 736 (100.0%) | 678 (100.0%) |
| 45 to 54 Years | 711 (100.0%) | 559 (70.1%) |
| 55 to 64 Years | 506 (100.0%) | 288 (95.1%) |
| 65 to 74 Years | 373 (89.4%) | 154 (48.1%) |
| 75 Years and over | 252 (100.0%) | 63 (55.7%) |
| Total | 3,772 (98.9%) | 3,827 (89.1%) |
Income Below Poverty Among Married-Couple Families in Hampshire
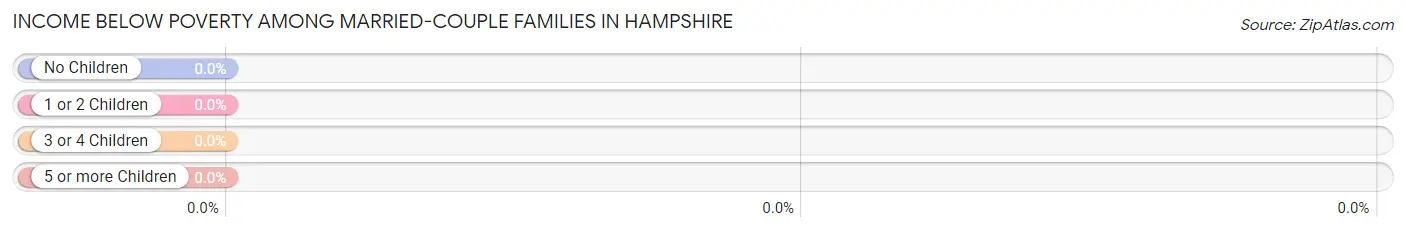
| Children | Above Poverty | Below Poverty |
| No Children | 628 (100.0%) | 0 (0.0%) |
| 1 or 2 Children | 527 (100.0%) | 0 (0.0%) |
| 3 or 4 Children | 240 (100.0%) | 0 (0.0%) |
| 5 or more Children | 0 (0.0%) | 0 (0.0%) |
| Total | 1,395 (100.0%) | 0 (0.0%) |
Income Below Poverty Among Single-Parent Households in Hampshire
| Children | Single Father | Single Mother |
| No Children | 0 (0.0%) | 0 (0.0%) |
| 1 or 2 Children | 0 (0.0%) | 0 (0.0%) |
| 3 or 4 Children | 0 (0.0%) | 0 (0.0%) |
| 5 or more Children | 0 (0.0%) | 0 (0.0%) |
| Total | 0 (0.0%) | 0 (0.0%) |
Income Below Poverty Among Married-Couple vs Single-Parent Households in Hampshire
| Children | Married-Couple Families | Single-Parent Households |
| No Children | 0 (0.0%) | 0 (0.0%) |
| 1 or 2 Children | 0 (0.0%) | 0 (0.0%) |
| 3 or 4 Children | 0 (0.0%) | 0 (0.0%) |
| 5 or more Children | 0 (0.0%) | 0 (0.0%) |
| Total | 0 (0.0%) | 0 (0.0%) |
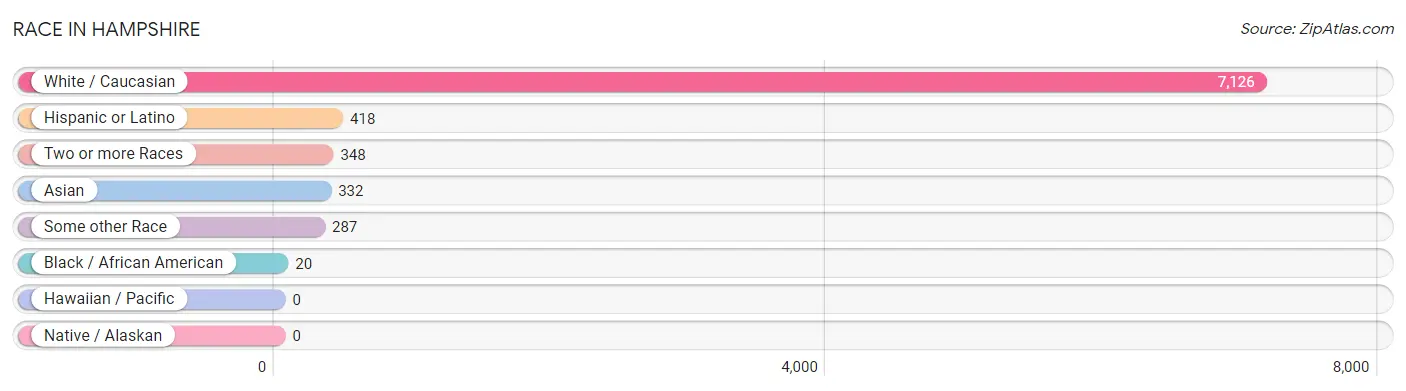
Race in Hampshire
The most populous races in Hampshire are White / Caucasian (7,126 | 87.8%), Hispanic or Latino (418 | 5.1%), and Two or more Races (348 | 4.3%).
| Race | # Population | % Population |
| Asian | 332 | 4.1% |
| Black / African American | 20 | 0.3% |
| Hawaiian / Pacific | 0 | 0.0% |
| Hispanic or Latino | 418 | 5.1% |
| Native / Alaskan | 0 | 0.0% |
| White / Caucasian | 7,126 | 87.8% |
| Two or more Races | 348 | 4.3% |
| Some other Race | 287 | 3.5% |
| Total | 8,113 | 100.0% |
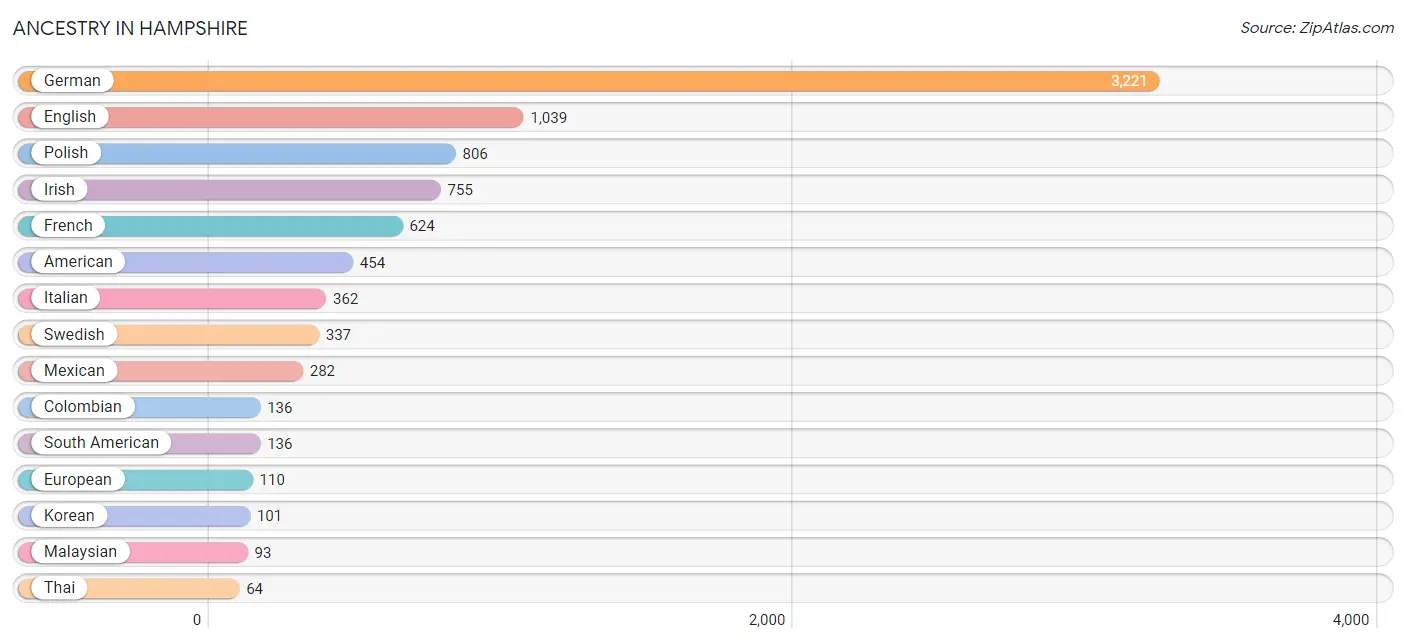
Ancestry in Hampshire
The most populous ancestries reported in Hampshire are German (3,221 | 39.7%), English (1,039 | 12.8%), Polish (806 | 9.9%), Irish (755 | 9.3%), and French (624 | 7.7%), together accounting for 79.4% of all Hampshire residents.
| Ancestry | # Population | % Population |
| American | 454 | 5.6% |
| Belgian | 56 | 0.7% |
| Celtic | 27 | 0.3% |
| Colombian | 136 | 1.7% |
| Czech | 46 | 0.6% |
| Eastern European | 15 | 0.2% |
| English | 1,039 | 12.8% |
| European | 110 | 1.4% |
| Finnish | 35 | 0.4% |
| French | 624 | 7.7% |
| French Canadian | 51 | 0.6% |
| German | 3,221 | 39.7% |
| Indian (Asian) | 57 | 0.7% |
| Irish | 755 | 9.3% |
| Italian | 362 | 4.5% |
| Japanese | 36 | 0.4% |
| Korean | 101 | 1.2% |
| Malaysian | 93 | 1.1% |
| Mexican | 282 | 3.5% |
| Norwegian | 56 | 0.7% |
| Pakistani | 36 | 0.4% |
| Polish | 806 | 9.9% |
| Russian | 63 | 0.8% |
| Scandinavian | 11 | 0.1% |
| Scotch-Irish | 40 | 0.5% |
| Scottish | 27 | 0.3% |
| Serbian | 50 | 0.6% |
| South American | 136 | 1.7% |
| Swedish | 337 | 4.2% |
| Thai | 64 | 0.8% | View All 30 Rows |
Immigrants in Hampshire
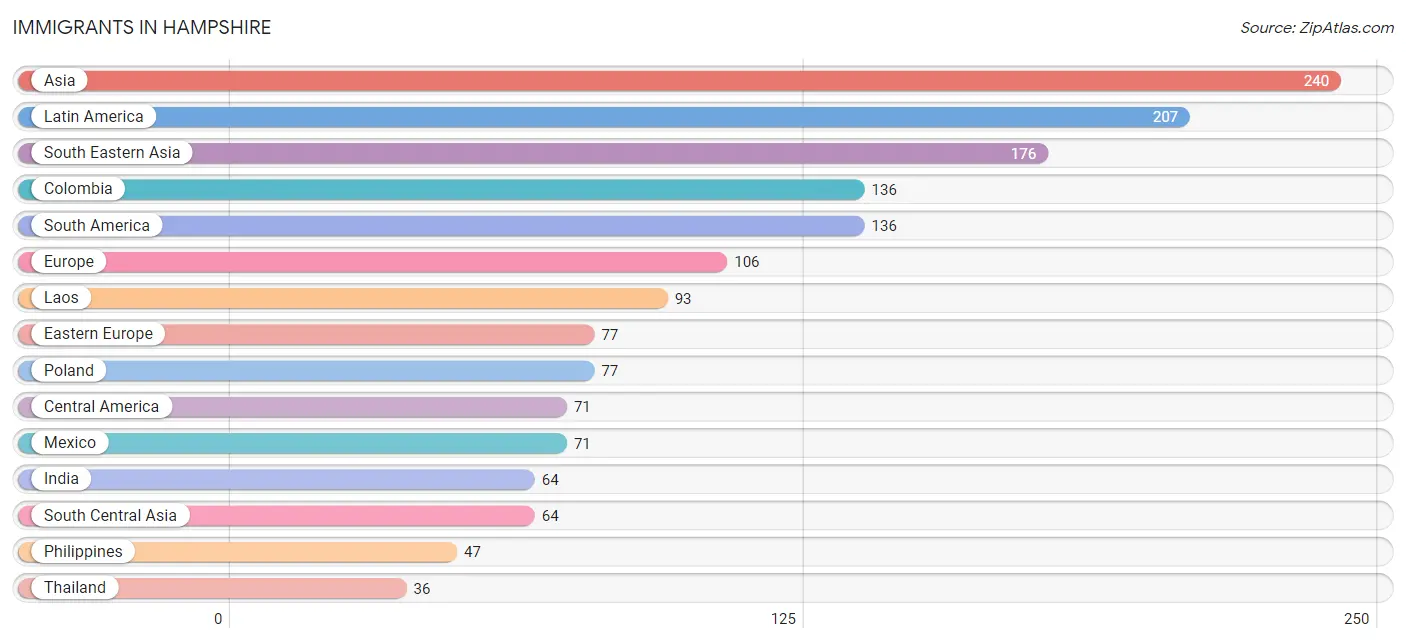
The most numerous immigrant groups reported in Hampshire came from Asia (240 | 3.0%), Latin America (207 | 2.5%), South Eastern Asia (176 | 2.2%), Colombia (136 | 1.7%), and South America (136 | 1.7%), together accounting for 11.0% of all Hampshire residents.
| Immigration Origin | # Population | % Population |
| Asia | 240 | 3.0% |
| Central America | 71 | 0.9% |
| Colombia | 136 | 1.7% |
| Eastern Europe | 77 | 0.9% |
| Europe | 106 | 1.3% |
| India | 64 | 0.8% |
| Italy | 29 | 0.4% |
| Laos | 93 | 1.1% |
| Latin America | 207 | 2.5% |
| Mexico | 71 | 0.9% |
| Philippines | 47 | 0.6% |
| Poland | 77 | 0.9% |
| South America | 136 | 1.7% |
| South Central Asia | 64 | 0.8% |
| South Eastern Asia | 176 | 2.2% |
| Southern Europe | 29 | 0.4% |
| Thailand | 36 | 0.4% | View All 17 Rows |
Sex and Age in Hampshire
Sex and Age in Hampshire
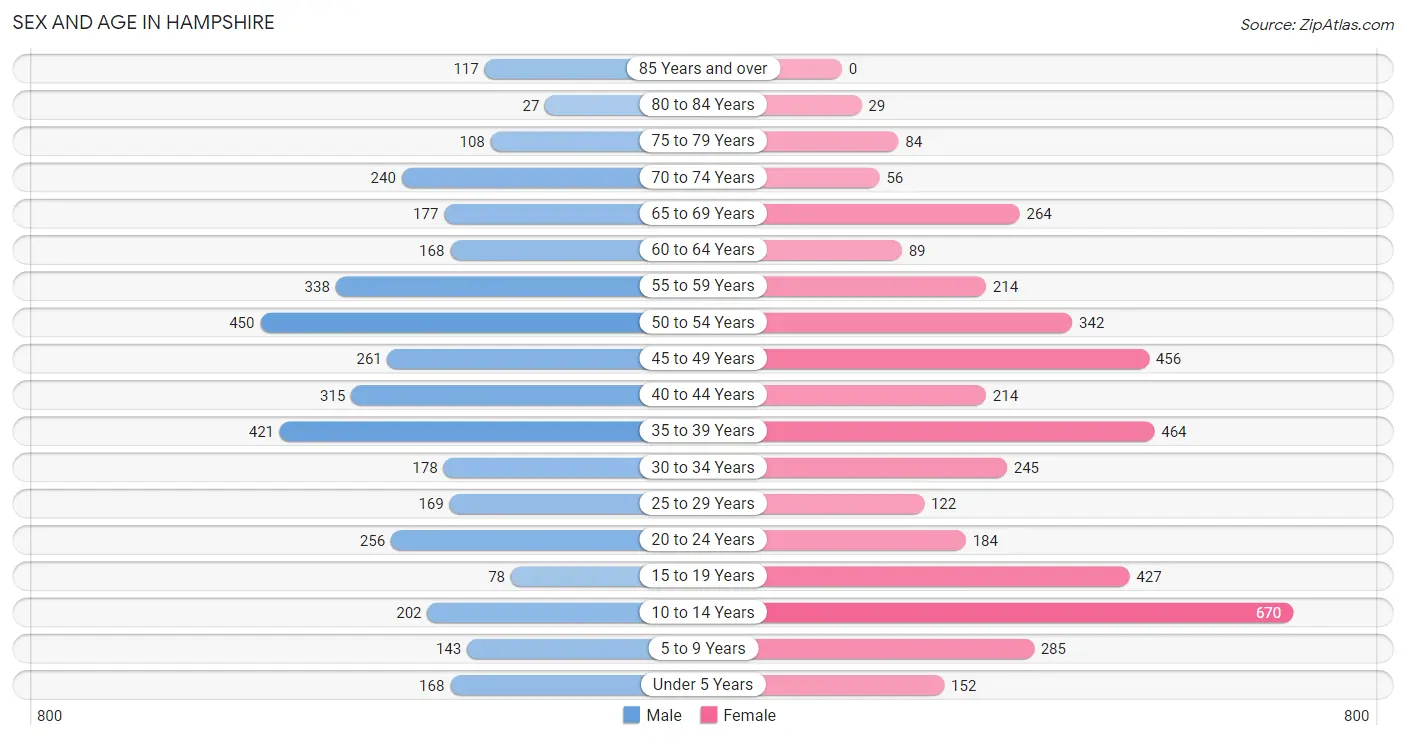
The most populous age groups in Hampshire are 50 to 54 Years (450 | 11.8%) for men and 10 to 14 Years (670 | 15.6%) for women.
| Age Bracket | Male | Female |
| Under 5 Years | 168 (4.4%) | 152 (3.5%) |
| 5 to 9 Years | 143 (3.7%) | 285 (6.6%) |
| 10 to 14 Years | 202 (5.3%) | 670 (15.6%) |
| 15 to 19 Years | 78 (2.0%) | 427 (9.9%) |
| 20 to 24 Years | 256 (6.7%) | 184 (4.3%) |
| 25 to 29 Years | 169 (4.4%) | 122 (2.8%) |
| 30 to 34 Years | 178 (4.7%) | 245 (5.7%) |
| 35 to 39 Years | 421 (11.0%) | 464 (10.8%) |
| 40 to 44 Years | 315 (8.3%) | 214 (5.0%) |
| 45 to 49 Years | 261 (6.8%) | 456 (10.6%) |
| 50 to 54 Years | 450 (11.8%) | 342 (8.0%) |
| 55 to 59 Years | 338 (8.9%) | 214 (5.0%) |
| 60 to 64 Years | 168 (4.4%) | 89 (2.1%) |
| 65 to 69 Years | 177 (4.6%) | 264 (6.1%) |
| 70 to 74 Years | 240 (6.3%) | 56 (1.3%) |
| 75 to 79 Years | 108 (2.8%) | 84 (1.9%) |
| 80 to 84 Years | 27 (0.7%) | 29 (0.7%) |
| 85 Years and over | 117 (3.1%) | 0 (0.0%) |
| Total | 3,816 (100.0%) | 4,297 (100.0%) |
Families and Households in Hampshire
Median Family Size in Hampshire
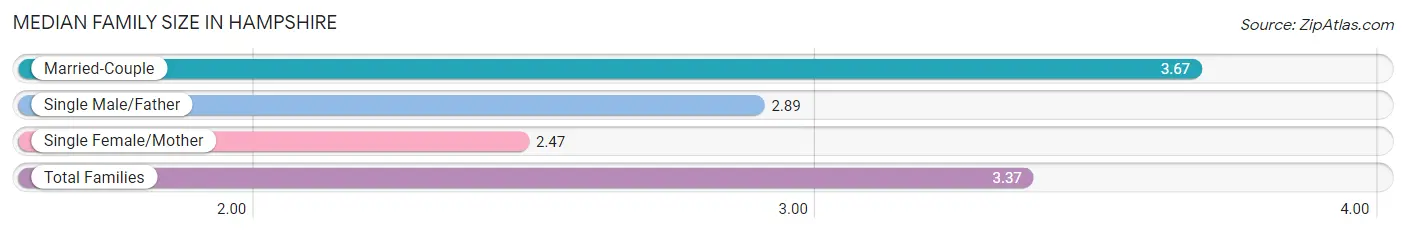
The median family size in Hampshire is 3.37 persons per family, with married-couple families (1,395 | 68.8%) accounting for the largest median family size of 3.67 persons per family. On the other hand, single female/mother families (270 | 13.3%) represent the smallest median family size with 2.47 persons per family.
| Family Type | # Families | Family Size |
| Married-Couple | 1,395 (68.8%) | 3.67 |
| Single Male/Father | 364 (17.9%) | 2.89 |
| Single Female/Mother | 270 (13.3%) | 2.47 |
| Total Families | 2,029 (100.0%) | 3.37 |
Median Household Size in Hampshire
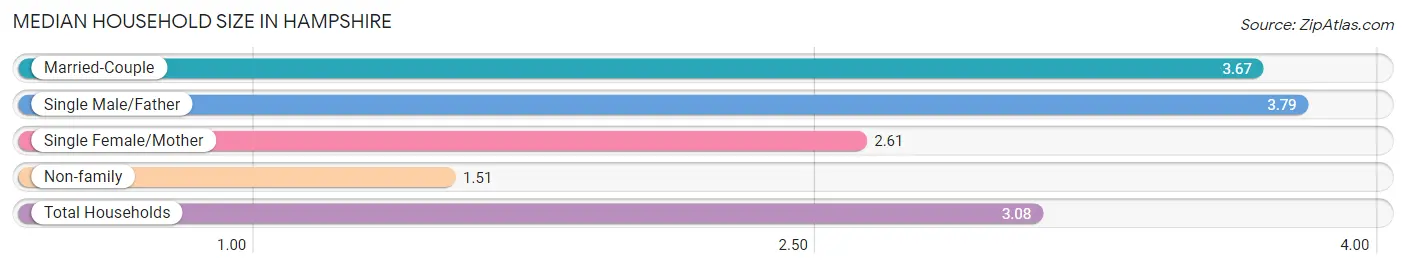
The median household size in Hampshire is 3.08 persons per household, with single male/father households (364 | 13.8%) accounting for the largest median household size of 3.79 persons per household. non-family households (602 | 22.9%) represent the smallest median household size with 1.51 persons per household.
| Household Type | # Households | Household Size |
| Married-Couple | 1,395 (53.0%) | 3.67 |
| Single Male/Father | 364 (13.8%) | 3.79 |
| Single Female/Mother | 270 (10.3%) | 2.61 |
| Non-family | 602 (22.9%) | 1.51 |
| Total Households | 2,631 (100.0%) | 3.08 |
Household Size by Marriage Status in Hampshire
Out of a total of 2,631 households in Hampshire, 2,029 (77.1%) are family households, while 602 (22.9%) are nonfamily households. The most numerous type of family households are 4-person households, comprising 700, and the most common type of nonfamily households are 1-person households, comprising 329.
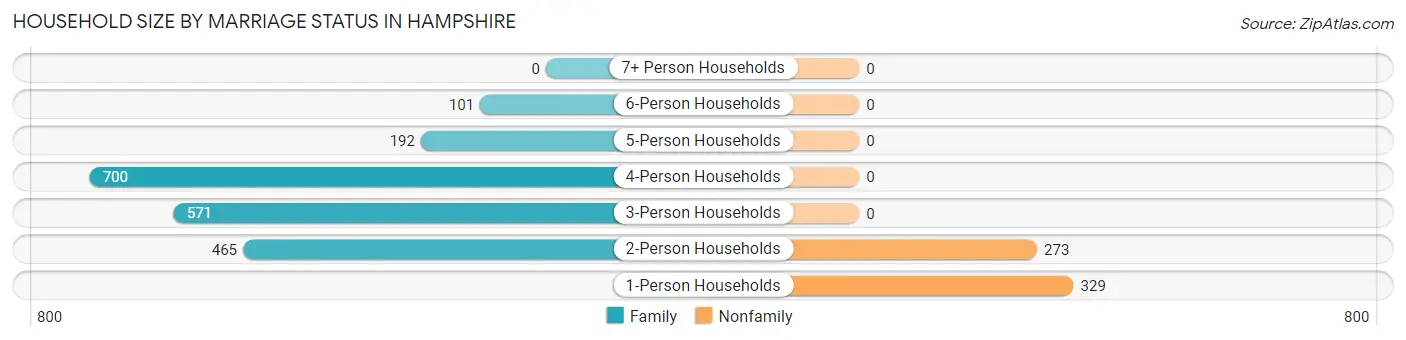
| Household Size | Family Households | Nonfamily Households |
| 1-Person Households | - | 329 (12.5%) |
| 2-Person Households | 465 (17.7%) | 273 (10.4%) |
| 3-Person Households | 571 (21.7%) | 0 (0.0%) |
| 4-Person Households | 700 (26.6%) | 0 (0.0%) |
| 5-Person Households | 192 (7.3%) | 0 (0.0%) |
| 6-Person Households | 101 (3.8%) | 0 (0.0%) |
| 7+ Person Households | 0 (0.0%) | 0 (0.0%) |
| Total | 2,029 (77.1%) | 602 (22.9%) |
Female Fertility in Hampshire
Fertility by Age in Hampshire
Average fertility rate in Hampshire is 18.0 births per 1,000 women. Women in the age bracket of 20 to 34 years have the highest fertility rate with 67.0 births per 1,000 women. Women in the age bracket of 20 to 34 years acount for 100.0% of all women with births.
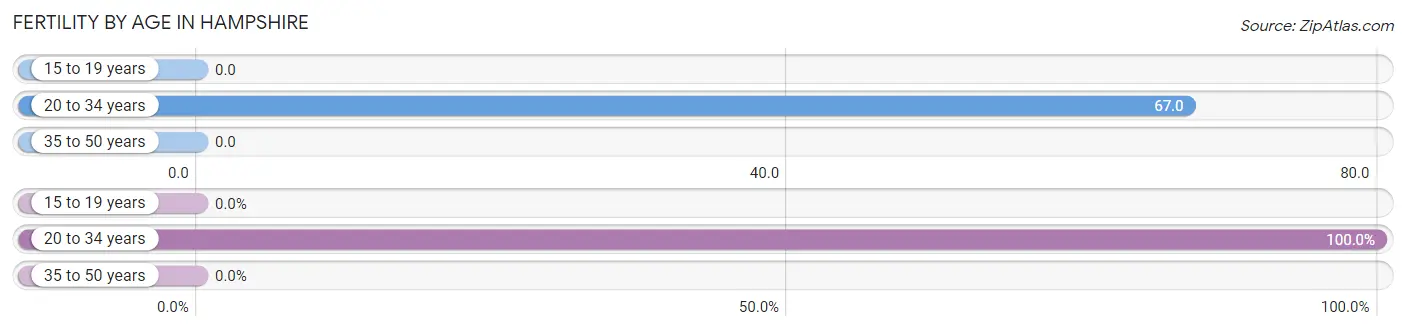
| Age Bracket | Women with Births | Births / 1,000 Women |
| 15 to 19 years | 0 (0.0%) | 0.0 |
| 20 to 34 years | 37 (100.0%) | 67.0 |
| 35 to 50 years | 0 (0.0%) | 0.0 |
| Total | 37 (100.0%) | 18.0 |
Fertility by Age by Marriage Status in Hampshire
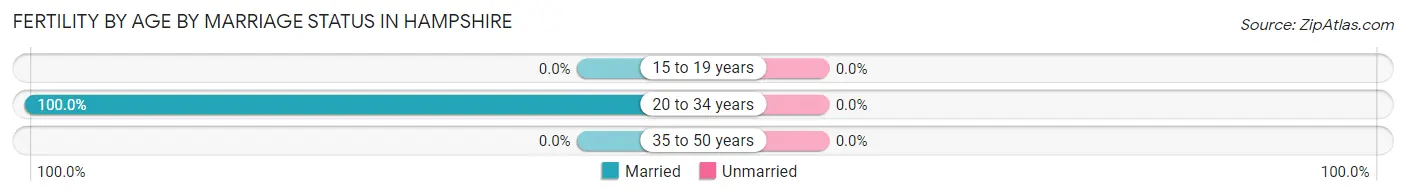
| Age Bracket | Married | Unmarried |
| 15 to 19 years | 0 (0.0%) | 0 (0.0%) |
| 20 to 34 years | 37 (100.0%) | 0 (0.0%) |
| 35 to 50 years | 0 (0.0%) | 0 (0.0%) |
| Total | 37 (100.0%) | 0 (0.0%) |
Fertility by Education in Hampshire
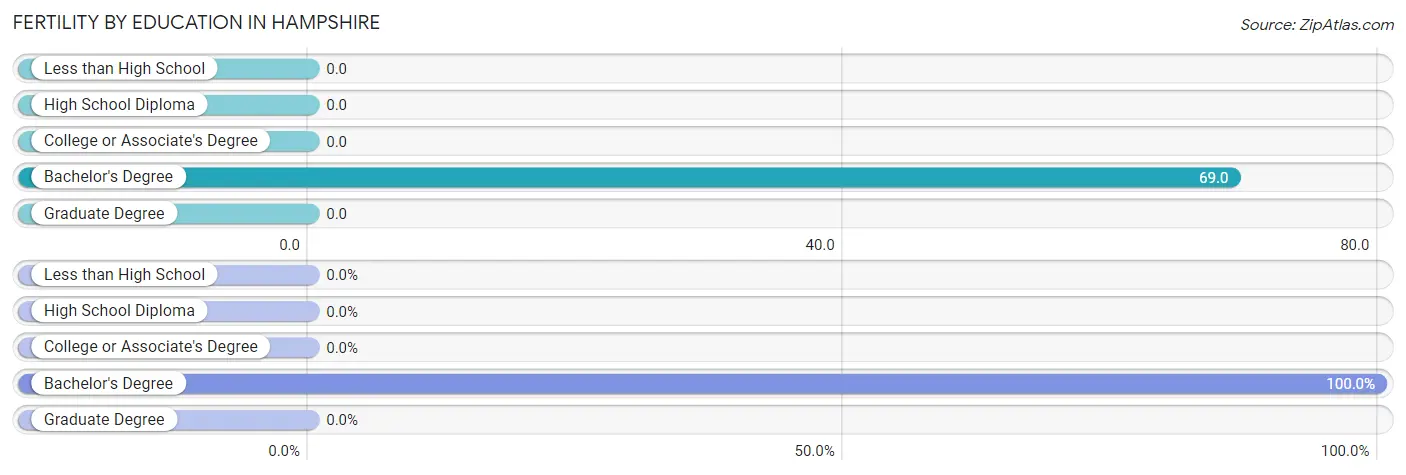
| Educational Attainment | Women with Births | Births / 1,000 Women |
| Less than High School | 0 (0.0%) | 0.0 |
| High School Diploma | 0 (0.0%) | 0.0 |
| College or Associate's Degree | 0 (0.0%) | 0.0 |
| Bachelor's Degree | 37 (100.0%) | 69.0 |
| Graduate Degree | 0 (0.0%) | 0.0 |
| Total | 37 (100.0%) | 18.0 |
Fertility by Education by Marriage Status in Hampshire
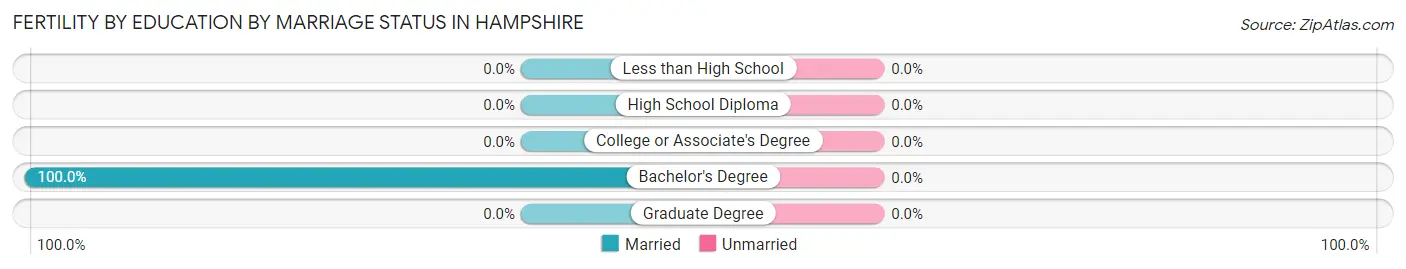
| Educational Attainment | Married | Unmarried |
| Less than High School | 0 (0.0%) | 0 (0.0%) |
| High School Diploma | 0 (0.0%) | 0 (0.0%) |
| College or Associate's Degree | 0 (0.0%) | 0 (0.0%) |
| Bachelor's Degree | 37 (100.0%) | 0 (0.0%) |
| Graduate Degree | 0 (0.0%) | 0 (0.0%) |
| Total | 37 (100.0%) | 0 (0.0%) |
Employment Characteristics in Hampshire
Employment by Class of Employer in Hampshire
Among the 3,696 employed individuals in Hampshire, private company employees (2,703 | 73.1%), local government employees (414 | 11.2%), and self-employed (incorporated) (214 | 5.8%) make up the most common classes of employment.
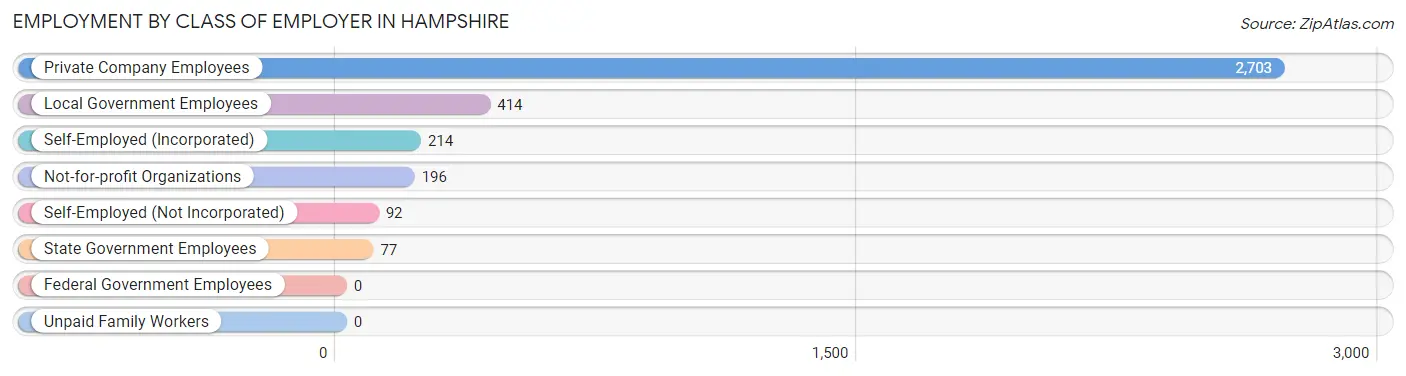
| Employer Class | # Employees | % Employees |
| Private Company Employees | 2,703 | 73.1% |
| Self-Employed (Incorporated) | 214 | 5.8% |
| Self-Employed (Not Incorporated) | 92 | 2.5% |
| Not-for-profit Organizations | 196 | 5.3% |
| Local Government Employees | 414 | 11.2% |
| State Government Employees | 77 | 2.1% |
| Federal Government Employees | 0 | 0.0% |
| Unpaid Family Workers | 0 | 0.0% |
| Total | 3,696 | 100.0% |
Employment Status by Age in Hampshire
According to the labor force statistics for Hampshire, out of the total population over 16 years of age (6,368), 61.0% or 3,884 individuals are in the labor force, with 2.0% or 78 of them unemployed. The age group with the highest labor force participation rate is 30 to 34 years, with 100.0% or 423 individuals in the labor force. Within the labor force, the 65 to 74 years age range has the highest percentage of unemployed individuals, with 25.3% or 20 of them being unemployed.
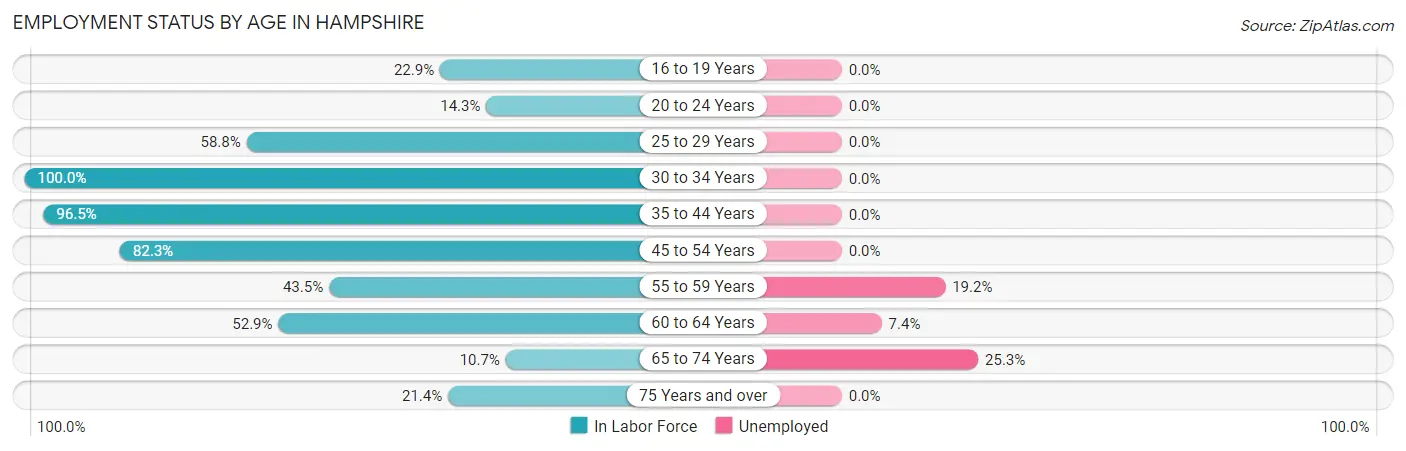
| Age Bracket | In Labor Force | Unemployed |
| 16 to 19 Years | 87 (22.9%) | 0 (0.0%) |
| 20 to 24 Years | 63 (14.3%) | 0 (0.0%) |
| 25 to 29 Years | 171 (58.8%) | 0 (0.0%) |
| 30 to 34 Years | 423 (100.0%) | 0 (0.0%) |
| 35 to 44 Years | 1,365 (96.5%) | 0 (0.0%) |
| 45 to 54 Years | 1,242 (82.3%) | 0 (0.0%) |
| 55 to 59 Years | 240 (43.5%) | 46 (19.2%) |
| 60 to 64 Years | 136 (52.9%) | 10 (7.4%) |
| 65 to 74 Years | 79 (10.7%) | 20 (25.3%) |
| 75 Years and over | 78 (21.4%) | 0 (0.0%) |
| Total | 3,884 (61.0%) | 78 (2.0%) |
Employment Status by Educational Attainment in Hampshire
According to labor force statistics for Hampshire, 80.4% of individuals (3,575) out of the total population between 25 and 64 years of age (4,446) are in the labor force, with 1.6% or 57 of them being unemployed. The group with the highest labor force participation rate are those with the educational attainment of college / associate degree, with 89.4% or 1,052 individuals in the labor force. Within the labor force, individuals with less than high school education have the highest percentage of unemployment, with 45.5% or 46 of them being unemployed.
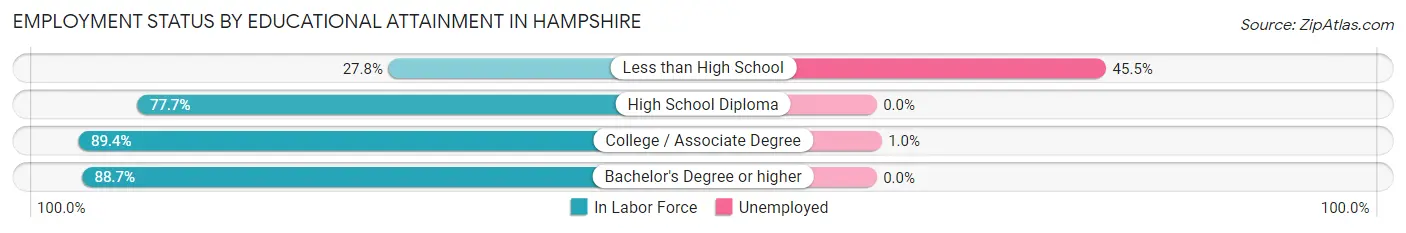
| Educational Attainment | In Labor Force | Unemployed |
| Less than High School | 101 (27.8%) | 165 (45.5%) |
| High School Diploma | 1,092 (77.7%) | 0 (0.0%) |
| College / Associate Degree | 1,052 (89.4%) | 12 (1.0%) |
| Bachelor's Degree or higher | 1,331 (88.7%) | 0 (0.0%) |
| Total | 3,575 (80.4%) | 71 (1.6%) |
Employment Occupations by Sex in Hampshire
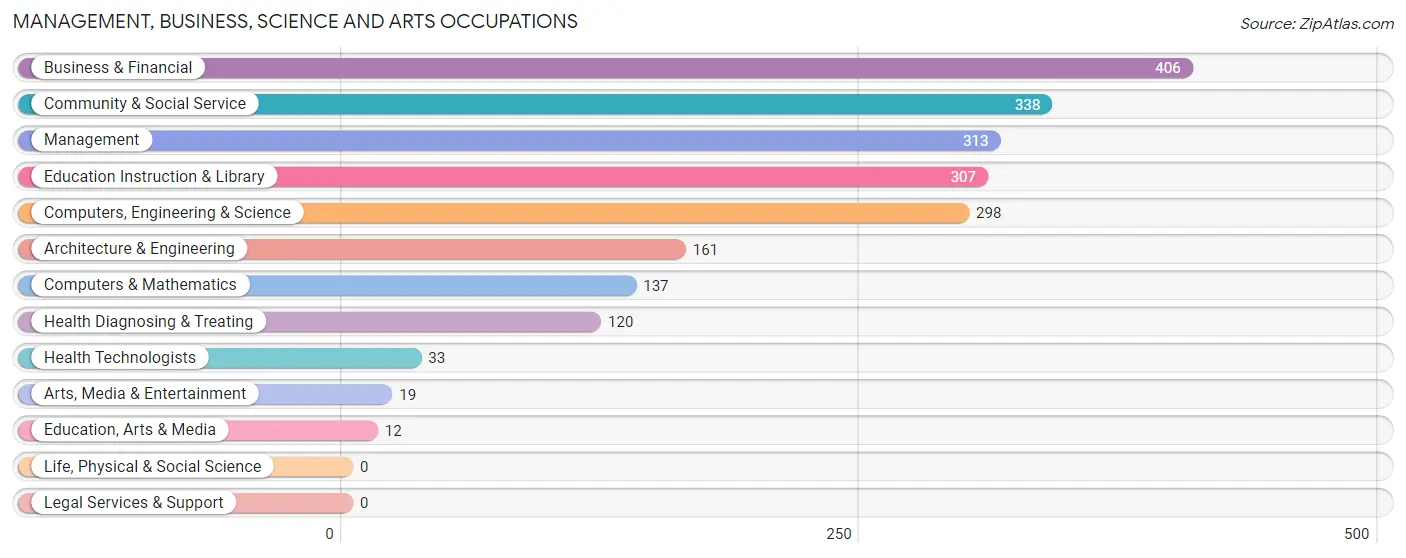
Management, Business, Science and Arts Occupations
The most common Management, Business, Science and Arts occupations in Hampshire are Business & Financial (406 | 10.7%), Community & Social Service (338 | 8.9%), Management (313 | 8.2%), Education Instruction & Library (307 | 8.1%), and Computers, Engineering & Science (298 | 7.8%).
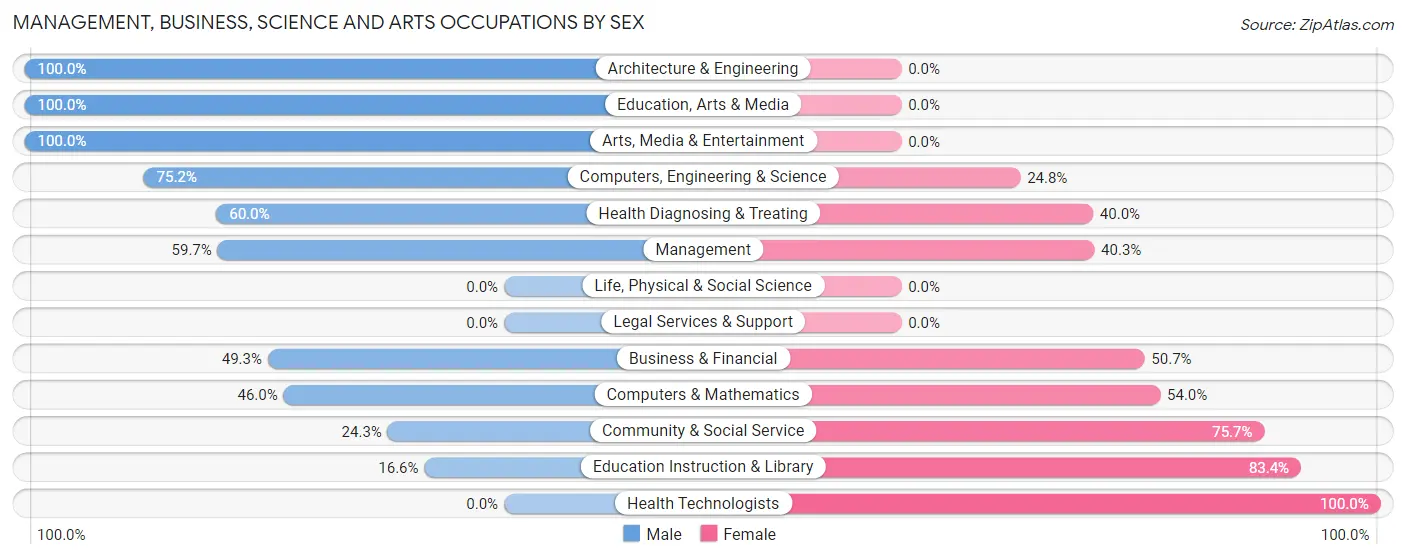
Management, Business, Science and Arts Occupations by Sex
Within the Management, Business, Science and Arts occupations in Hampshire, the most male-oriented occupations are Architecture & Engineering (100.0%), Education, Arts & Media (100.0%), and Arts, Media & Entertainment (100.0%), while the most female-oriented occupations are Health Technologists (100.0%), Education Instruction & Library (83.4%), and Community & Social Service (75.7%).
| Occupation | Male | Female |
| Management | 187 (59.7%) | 126 (40.3%) |
| Business & Financial | 200 (49.3%) | 206 (50.7%) |
| Computers, Engineering & Science | 224 (75.2%) | 74 (24.8%) |
| Computers & Mathematics | 63 (46.0%) | 74 (54.0%) |
| Architecture & Engineering | 161 (100.0%) | 0 (0.0%) |
| Life, Physical & Social Science | 0 (0.0%) | 0 (0.0%) |
| Community & Social Service | 82 (24.3%) | 256 (75.7%) |
| Education, Arts & Media | 12 (100.0%) | 0 (0.0%) |
| Legal Services & Support | 0 (0.0%) | 0 (0.0%) |
| Education Instruction & Library | 51 (16.6%) | 256 (83.4%) |
| Arts, Media & Entertainment | 19 (100.0%) | 0 (0.0%) |
| Health Diagnosing & Treating | 72 (60.0%) | 48 (40.0%) |
| Health Technologists | 0 (0.0%) | 33 (100.0%) |
| Total (Category) | 765 (51.9%) | 710 (48.1%) |
| Total (Overall) | 1,891 (49.7%) | 1,916 (50.3%) |
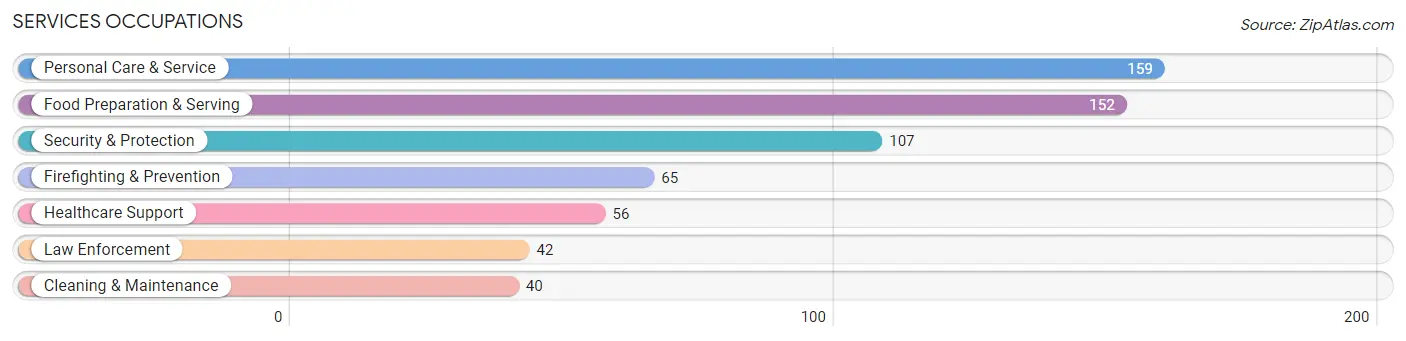
Services Occupations
The most common Services occupations in Hampshire are Personal Care & Service (159 | 4.2%), Food Preparation & Serving (152 | 4.0%), Security & Protection (107 | 2.8%), Firefighting & Prevention (65 | 1.7%), and Healthcare Support (56 | 1.5%).
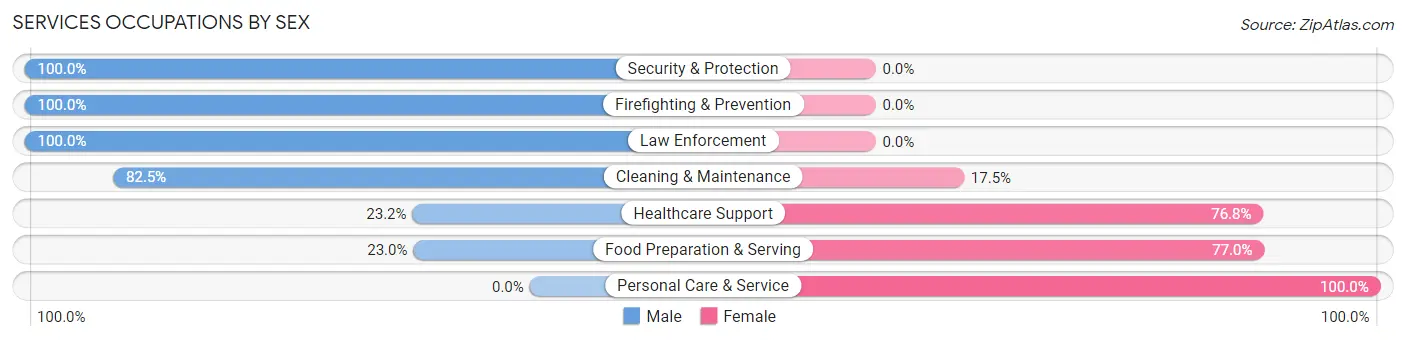
Services Occupations by Sex
Within the Services occupations in Hampshire, the most male-oriented occupations are Security & Protection (100.0%), Firefighting & Prevention (100.0%), and Law Enforcement (100.0%), while the most female-oriented occupations are Personal Care & Service (100.0%), Food Preparation & Serving (77.0%), and Healthcare Support (76.8%).
| Occupation | Male | Female |
| Healthcare Support | 13 (23.2%) | 43 (76.8%) |
| Security & Protection | 107 (100.0%) | 0 (0.0%) |
| Firefighting & Prevention | 65 (100.0%) | 0 (0.0%) |
| Law Enforcement | 42 (100.0%) | 0 (0.0%) |
| Food Preparation & Serving | 35 (23.0%) | 117 (77.0%) |
| Cleaning & Maintenance | 33 (82.5%) | 7 (17.5%) |
| Personal Care & Service | 0 (0.0%) | 159 (100.0%) |
| Total (Category) | 188 (36.6%) | 326 (63.4%) |
| Total (Overall) | 1,891 (49.7%) | 1,916 (50.3%) |
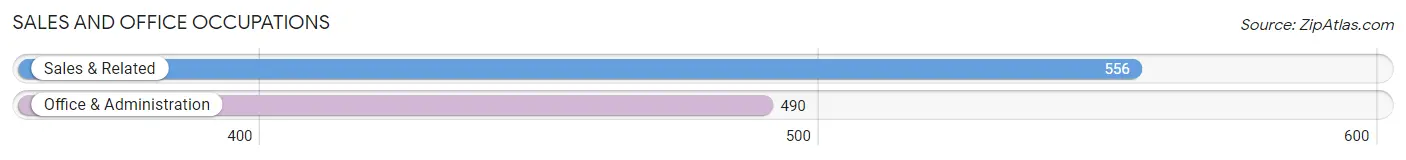
Sales and Office Occupations
The most common Sales and Office occupations in Hampshire are Sales & Related (556 | 14.6%), and Office & Administration (490 | 12.9%).
Sales and Office Occupations by Sex
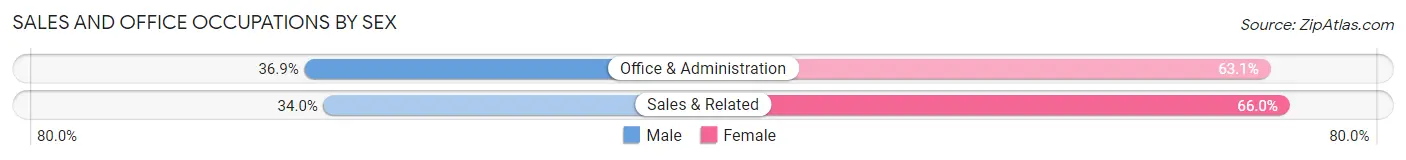
| Occupation | Male | Female |
| Sales & Related | 189 (34.0%) | 367 (66.0%) |
| Office & Administration | 181 (36.9%) | 309 (63.1%) |
| Total (Category) | 370 (35.4%) | 676 (64.6%) |
| Total (Overall) | 1,891 (49.7%) | 1,916 (50.3%) |
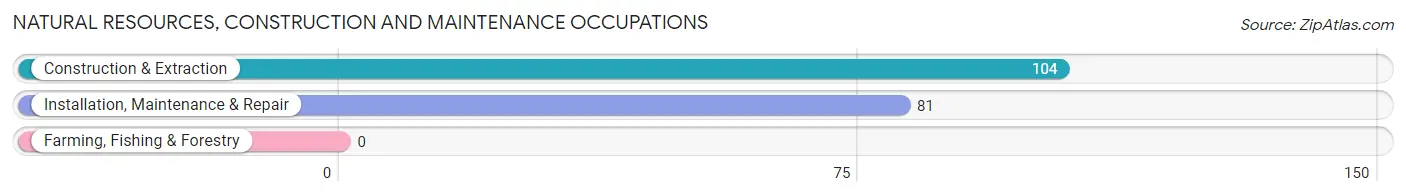
Natural Resources, Construction and Maintenance Occupations
The most common Natural Resources, Construction and Maintenance occupations in Hampshire are Construction & Extraction (104 | 2.7%), and Installation, Maintenance & Repair (81 | 2.1%).
Natural Resources, Construction and Maintenance Occupations by Sex
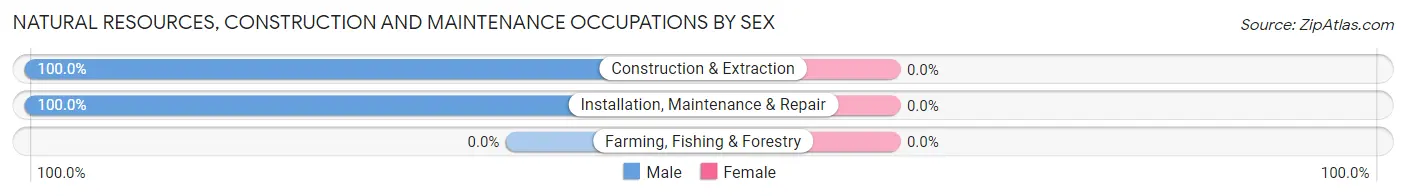
| Occupation | Male | Female |
| Farming, Fishing & Forestry | 0 (0.0%) | 0 (0.0%) |
| Construction & Extraction | 104 (100.0%) | 0 (0.0%) |
| Installation, Maintenance & Repair | 81 (100.0%) | 0 (0.0%) |
| Total (Category) | 185 (100.0%) | 0 (0.0%) |
| Total (Overall) | 1,891 (49.7%) | 1,916 (50.3%) |
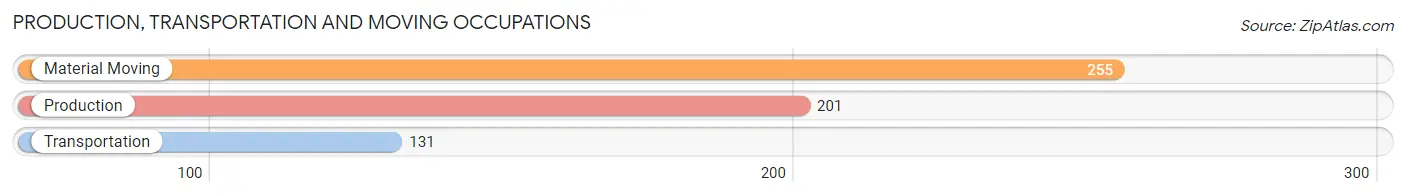
Production, Transportation and Moving Occupations
The most common Production, Transportation and Moving occupations in Hampshire are Material Moving (255 | 6.7%), Production (201 | 5.3%), and Transportation (131 | 3.4%).
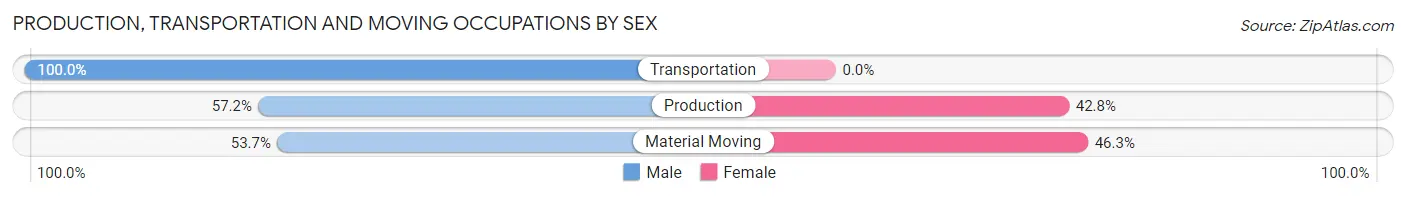
Production, Transportation and Moving Occupations by Sex
| Occupation | Male | Female |
| Production | 115 (57.2%) | 86 (42.8%) |
| Transportation | 131 (100.0%) | 0 (0.0%) |
| Material Moving | 137 (53.7%) | 118 (46.3%) |
| Total (Category) | 383 (65.2%) | 204 (34.7%) |
| Total (Overall) | 1,891 (49.7%) | 1,916 (50.3%) |
Employment Industries by Sex in Hampshire
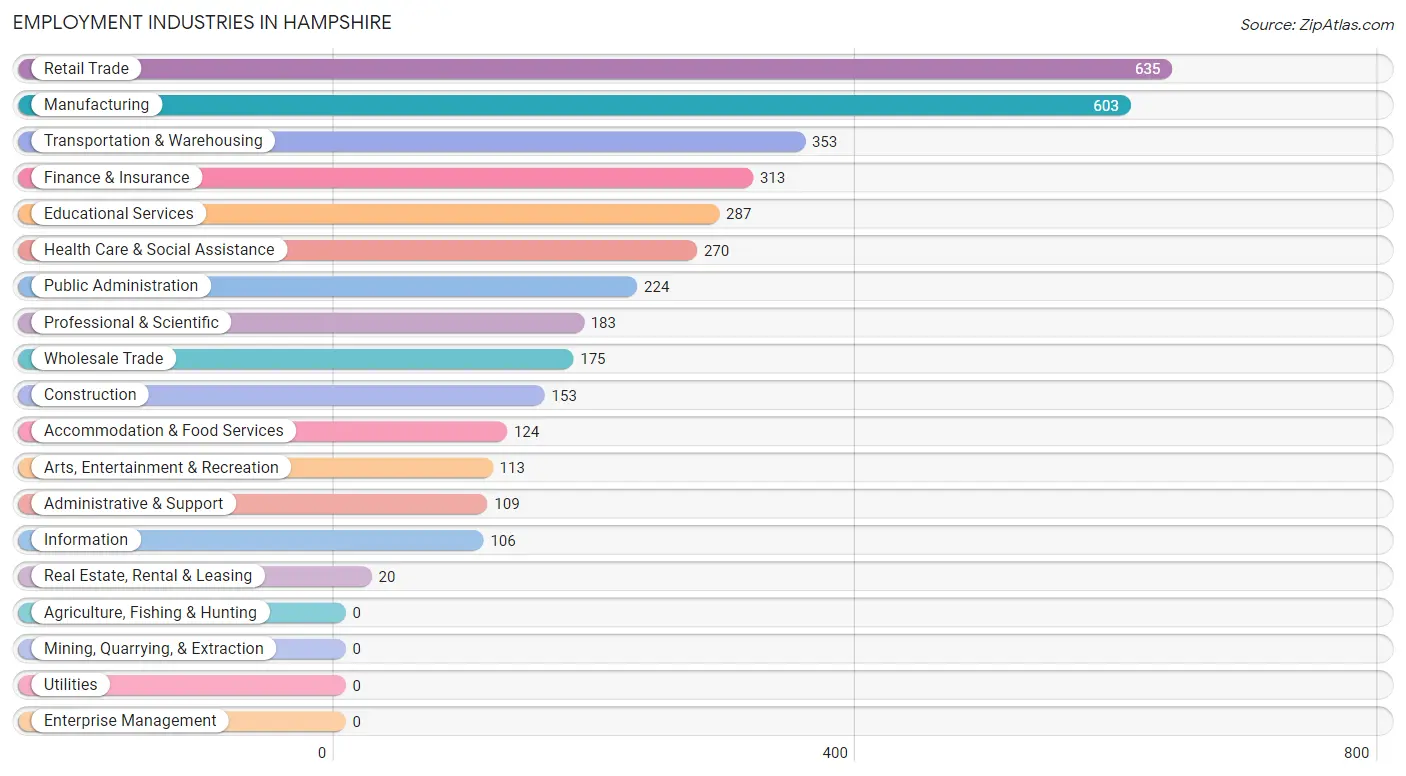
Employment Industries in Hampshire
The major employment industries in Hampshire include Retail Trade (635 | 16.7%), Manufacturing (603 | 15.8%), Transportation & Warehousing (353 | 9.3%), Finance & Insurance (313 | 8.2%), and Educational Services (287 | 7.5%).
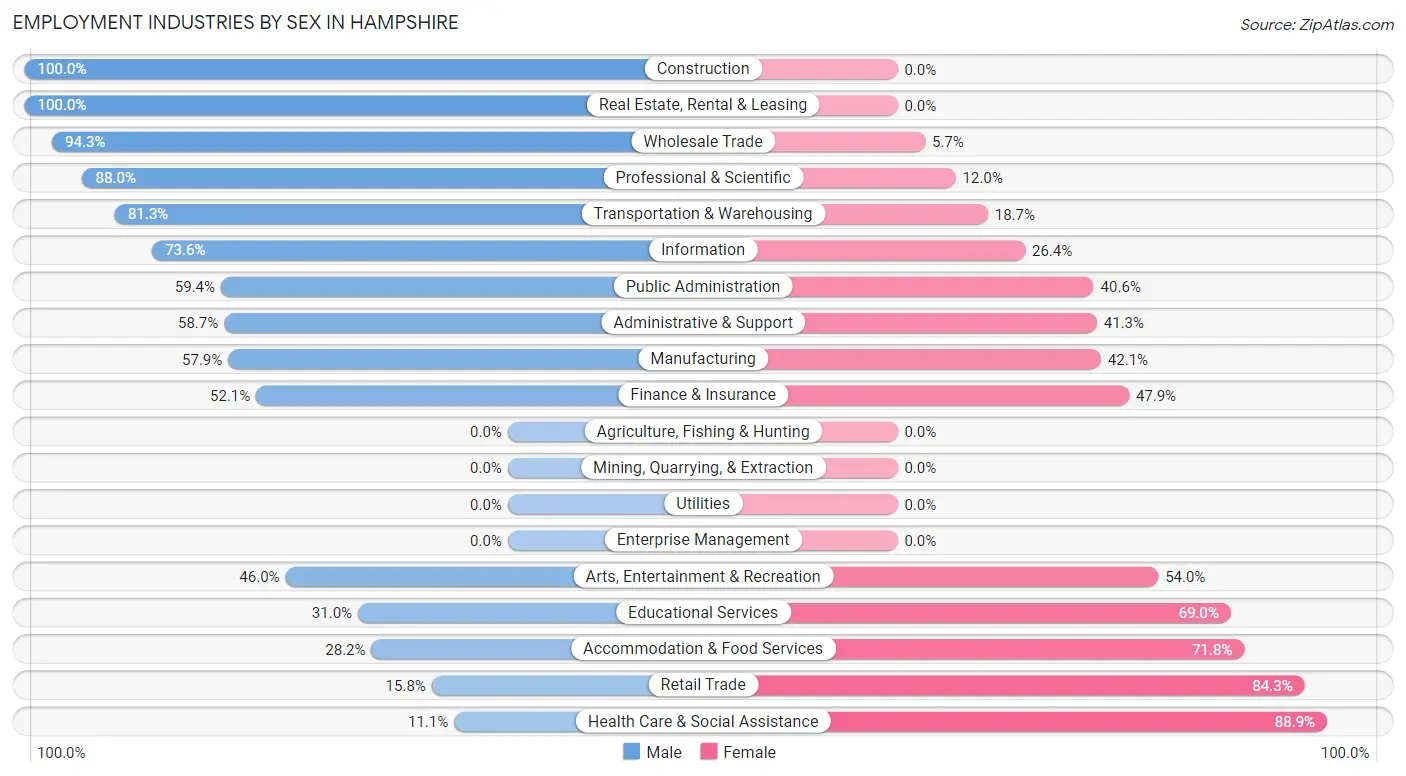
Employment Industries by Sex in Hampshire
The Hampshire industries that see more men than women are Construction (100.0%), Real Estate, Rental & Leasing (100.0%), and Wholesale Trade (94.3%), whereas the industries that tend to have a higher number of women are Health Care & Social Assistance (88.9%), Retail Trade (84.3%), and Accommodation & Food Services (71.8%).
| Industry | Male | Female |
| Agriculture, Fishing & Hunting | 0 (0.0%) | 0 (0.0%) |
| Mining, Quarrying, & Extraction | 0 (0.0%) | 0 (0.0%) |
| Construction | 153 (100.0%) | 0 (0.0%) |
| Manufacturing | 349 (57.9%) | 254 (42.1%) |
| Wholesale Trade | 165 (94.3%) | 10 (5.7%) |
| Retail Trade | 100 (15.8%) | 535 (84.3%) |
| Transportation & Warehousing | 287 (81.3%) | 66 (18.7%) |
| Utilities | 0 (0.0%) | 0 (0.0%) |
| Information | 78 (73.6%) | 28 (26.4%) |
| Finance & Insurance | 163 (52.1%) | 150 (47.9%) |
| Real Estate, Rental & Leasing | 20 (100.0%) | 0 (0.0%) |
| Professional & Scientific | 161 (88.0%) | 22 (12.0%) |
| Enterprise Management | 0 (0.0%) | 0 (0.0%) |
| Administrative & Support | 64 (58.7%) | 45 (41.3%) |
| Educational Services | 89 (31.0%) | 198 (69.0%) |
| Health Care & Social Assistance | 30 (11.1%) | 240 (88.9%) |
| Arts, Entertainment & Recreation | 52 (46.0%) | 61 (54.0%) |
| Accommodation & Food Services | 35 (28.2%) | 89 (71.8%) |
| Public Administration | 133 (59.4%) | 91 (40.6%) |
| Total | 1,891 (49.7%) | 1,916 (50.3%) |
Education in Hampshire
School Enrollment in Hampshire
The most common levels of schooling among the 2,355 students in Hampshire are college / undergraduate (766 | 32.5%), middle school (764 | 32.4%), and elementary school (402 | 17.1%).
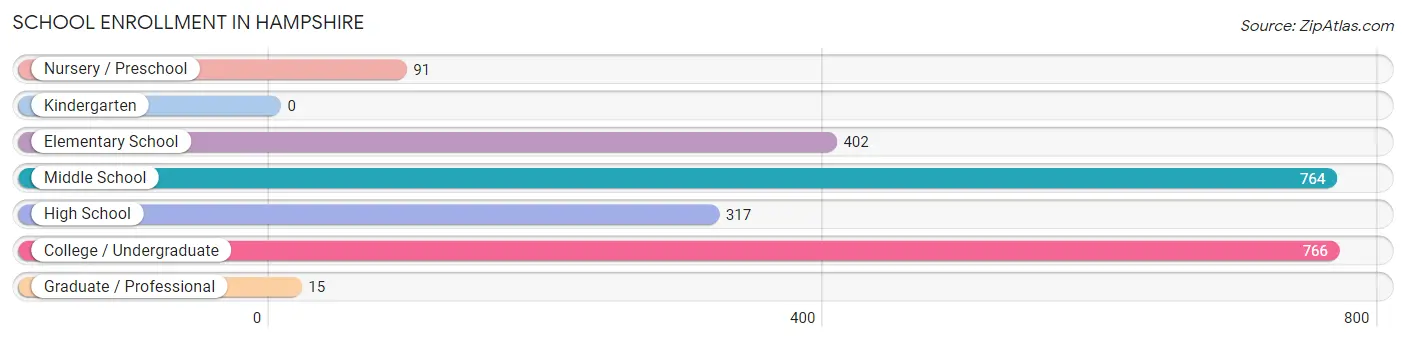
| School Level | # Students | % Students |
| Nursery / Preschool | 91 | 3.9% |
| Kindergarten | 0 | 0.0% |
| Elementary School | 402 | 17.1% |
| Middle School | 764 | 32.4% |
| High School | 317 | 13.5% |
| College / Undergraduate | 766 | 32.5% |
| Graduate / Professional | 15 | 0.6% |
| Total | 2,355 | 100.0% |
School Enrollment by Age by Funding Source in Hampshire
Out of a total of 2,355 students who are enrolled in schools in Hampshire, 179 (7.6%) attend a private institution, while the remaining 2,176 (92.4%) are enrolled in public schools. The age group of 3 to 4 year olds has the highest likelihood of being enrolled in private schools, with 91 (100.0% in the age bracket) enrolled. Conversely, the age group of 10 to 14 year olds has the lowest likelihood of being enrolled in a private school, with 838 (100.0% in the age bracket) attending a public institution.
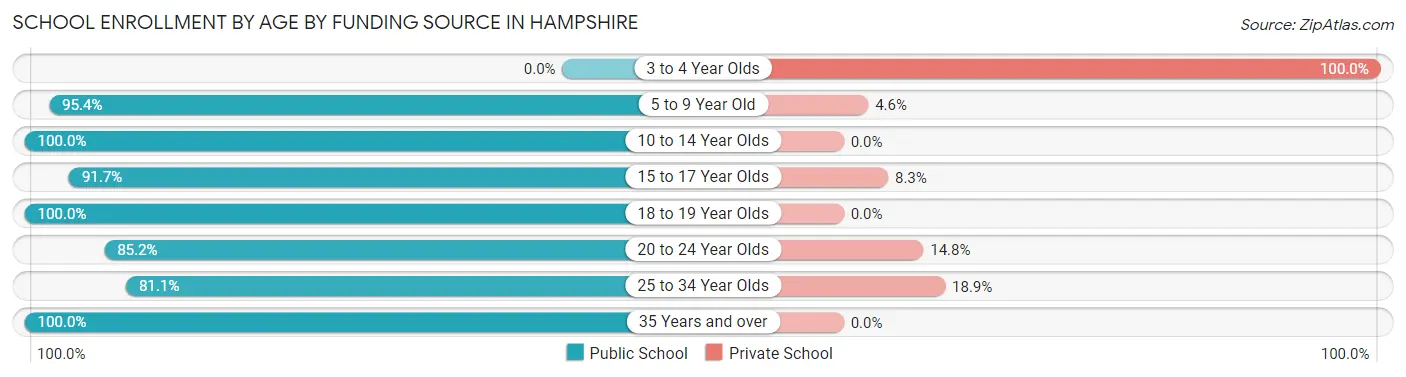
| Age Bracket | Public School | Private School |
| 3 to 4 Year Olds | 0 (0.0%) | 91 (100.0%) |
| 5 to 9 Year Old | 333 (95.4%) | 16 (4.6%) |
| 10 to 14 Year Olds | 838 (100.0%) | 0 (0.0%) |
| 15 to 17 Year Olds | 211 (91.7%) | 19 (8.3%) |
| 18 to 19 Year Olds | 275 (100.0%) | 0 (0.0%) |
| 20 to 24 Year Olds | 201 (85.2%) | 35 (14.8%) |
| 25 to 34 Year Olds | 73 (81.1%) | 17 (18.9%) |
| 35 Years and over | 246 (100.0%) | 0 (0.0%) |
| Total | 2,176 (92.4%) | 179 (7.6%) |
Educational Attainment by Field of Study in Hampshire
Engineering (325 | 20.0%), business (258 | 15.9%), arts & humanities (167 | 10.3%), psychology (154 | 9.5%), and social sciences (148 | 9.1%) are the most common fields of study among 1,626 individuals in Hampshire who have obtained a bachelor's degree or higher.
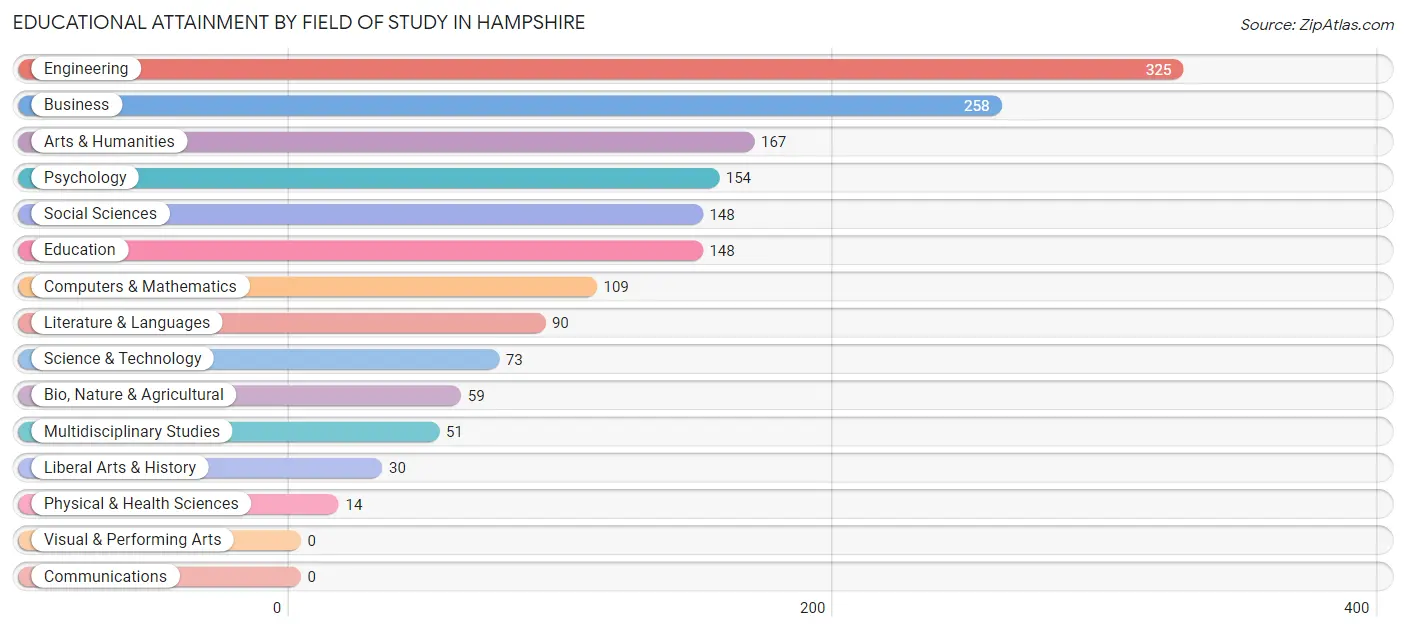
| Field of Study | # Graduates | % Graduates |
| Computers & Mathematics | 109 | 6.7% |
| Bio, Nature & Agricultural | 59 | 3.6% |
| Physical & Health Sciences | 14 | 0.9% |
| Psychology | 154 | 9.5% |
| Social Sciences | 148 | 9.1% |
| Engineering | 325 | 20.0% |
| Multidisciplinary Studies | 51 | 3.1% |
| Science & Technology | 73 | 4.5% |
| Business | 258 | 15.9% |
| Education | 148 | 9.1% |
| Literature & Languages | 90 | 5.5% |
| Liberal Arts & History | 30 | 1.8% |
| Visual & Performing Arts | 0 | 0.0% |
| Communications | 0 | 0.0% |
| Arts & Humanities | 167 | 10.3% |
| Total | 1,626 | 100.0% |
Transportation & Commute in Hampshire
Vehicle Availability by Sex in Hampshire
The most prevalent vehicle ownership categories in Hampshire are males with 2 vehicles (997, accounting for 53.7%) and females with 2 vehicles (848, making up 54.2%).
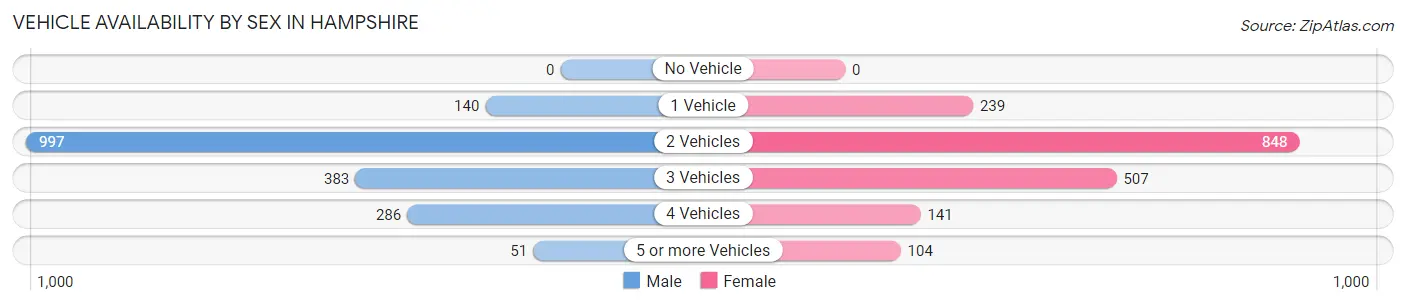
| Vehicles Available | Male | Female |
| No Vehicle | 0 (0.0%) | 0 (0.0%) |
| 1 Vehicle | 140 (7.5%) | 239 (13.0%) |
| 2 Vehicles | 997 (53.7%) | 848 (46.1%) |
| 3 Vehicles | 383 (20.6%) | 507 (27.6%) |
| 4 Vehicles | 286 (15.4%) | 141 (7.7%) |
| 5 or more Vehicles | 51 (2.8%) | 104 (5.7%) |
| Total | 1,857 (100.0%) | 1,839 (100.0%) |
Commute Time in Hampshire
The most frequently occuring commute durations in Hampshire are 20 to 24 minutes (565 commuters, 20.9%), 25 to 29 minutes (391 commuters, 14.4%), and 45 to 59 minutes (362 commuters, 13.4%).
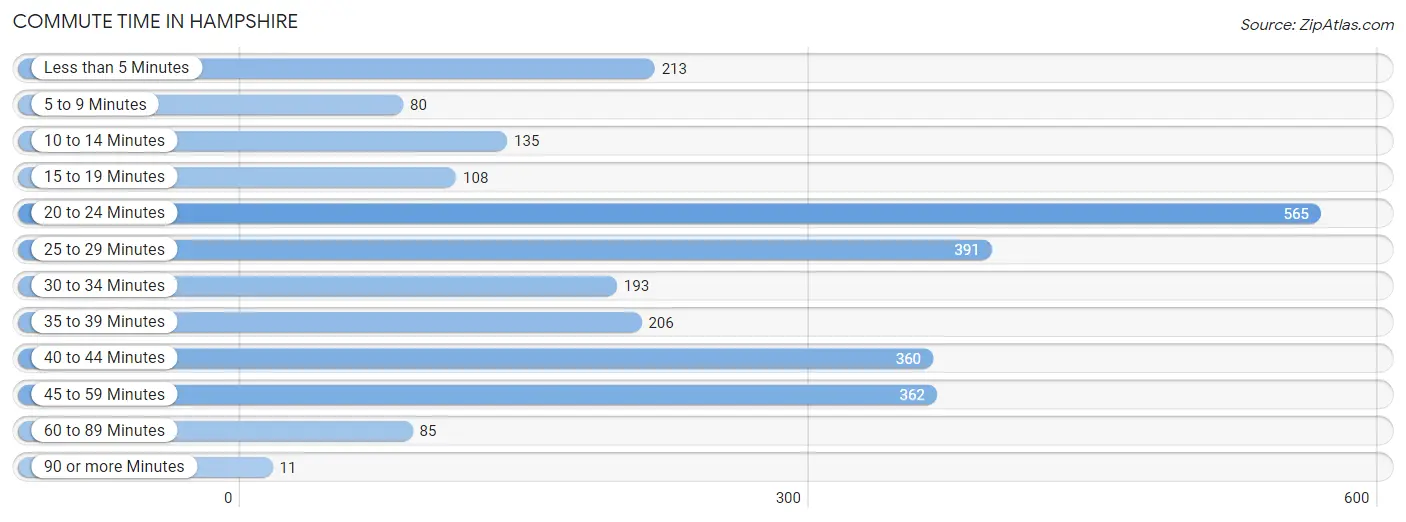
| Commute Time | # Commuters | % Commuters |
| Less than 5 Minutes | 213 | 7.9% |
| 5 to 9 Minutes | 80 | 2.9% |
| 10 to 14 Minutes | 135 | 5.0% |
| 15 to 19 Minutes | 108 | 4.0% |
| 20 to 24 Minutes | 565 | 20.9% |
| 25 to 29 Minutes | 391 | 14.4% |
| 30 to 34 Minutes | 193 | 7.1% |
| 35 to 39 Minutes | 206 | 7.6% |
| 40 to 44 Minutes | 360 | 13.3% |
| 45 to 59 Minutes | 362 | 13.4% |
| 60 to 89 Minutes | 85 | 3.1% |
| 90 or more Minutes | 11 | 0.4% |
Commute Time by Sex in Hampshire
The most common commute times in Hampshire are 45 to 59 minutes (232 commuters, 17.3%) for males and 20 to 24 minutes (387 commuters, 28.2%) for females.
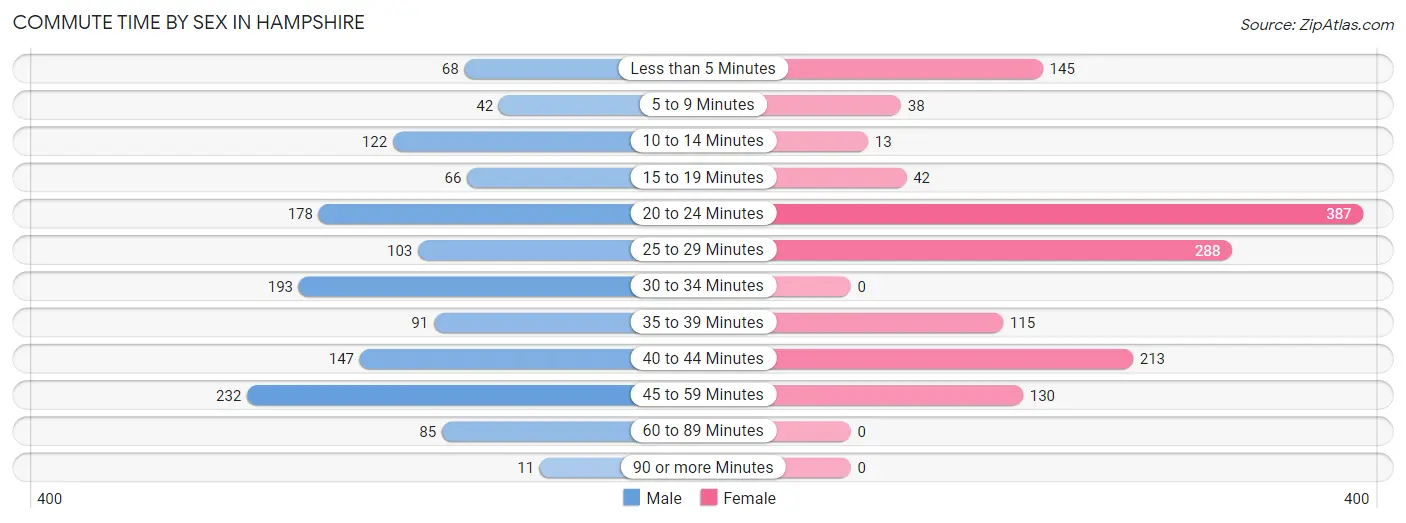
| Commute Time | Male | Female |
| Less than 5 Minutes | 68 (5.1%) | 145 (10.6%) |
| 5 to 9 Minutes | 42 (3.1%) | 38 (2.8%) |
| 10 to 14 Minutes | 122 (9.1%) | 13 (0.9%) |
| 15 to 19 Minutes | 66 (4.9%) | 42 (3.1%) |
| 20 to 24 Minutes | 178 (13.3%) | 387 (28.2%) |
| 25 to 29 Minutes | 103 (7.7%) | 288 (21.0%) |
| 30 to 34 Minutes | 193 (14.4%) | 0 (0.0%) |
| 35 to 39 Minutes | 91 (6.8%) | 115 (8.4%) |
| 40 to 44 Minutes | 147 (11.0%) | 213 (15.5%) |
| 45 to 59 Minutes | 232 (17.3%) | 130 (9.5%) |
| 60 to 89 Minutes | 85 (6.4%) | 0 (0.0%) |
| 90 or more Minutes | 11 (0.8%) | 0 (0.0%) |
Time of Departure to Work by Sex in Hampshire
The most frequent times of departure to work in Hampshire are 4:00 PM to 11:59 PM (224, 16.7%) for males and 7:00 AM to 7:29 AM (399, 29.1%) for females.
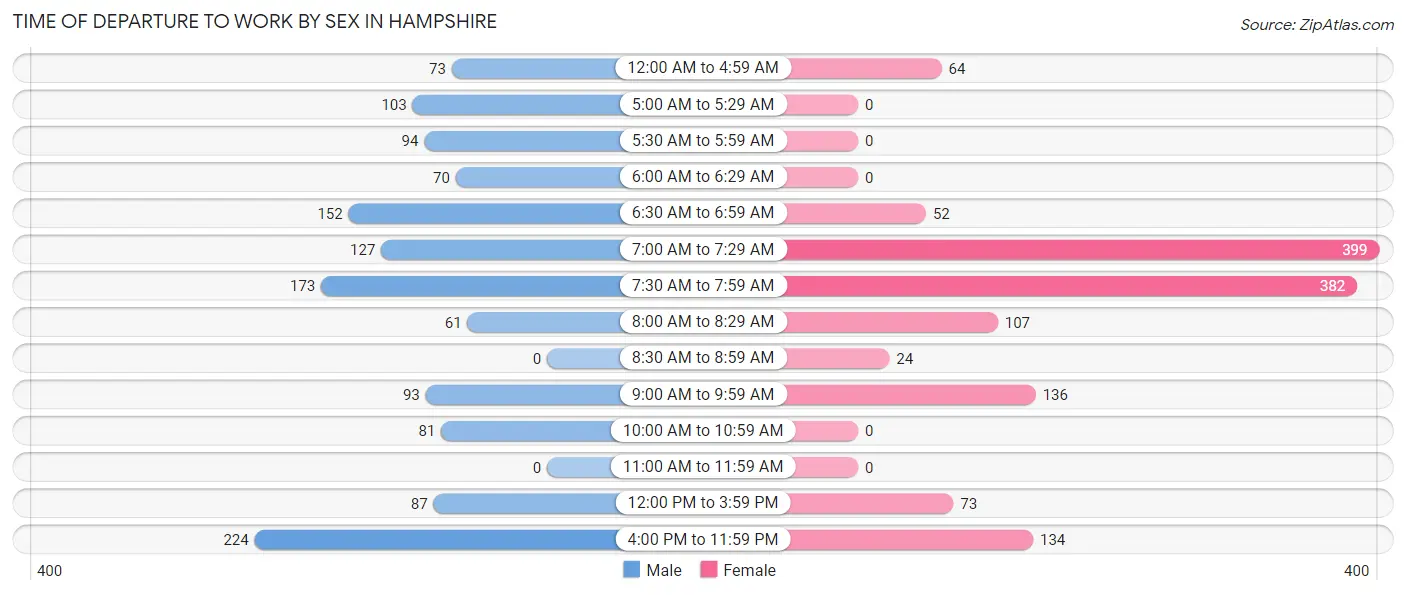
| Time of Departure | Male | Female |
| 12:00 AM to 4:59 AM | 73 (5.5%) | 64 (4.7%) |
| 5:00 AM to 5:29 AM | 103 (7.7%) | 0 (0.0%) |
| 5:30 AM to 5:59 AM | 94 (7.0%) | 0 (0.0%) |
| 6:00 AM to 6:29 AM | 70 (5.2%) | 0 (0.0%) |
| 6:30 AM to 6:59 AM | 152 (11.4%) | 52 (3.8%) |
| 7:00 AM to 7:29 AM | 127 (9.5%) | 399 (29.1%) |
| 7:30 AM to 7:59 AM | 173 (12.9%) | 382 (27.9%) |
| 8:00 AM to 8:29 AM | 61 (4.6%) | 107 (7.8%) |
| 8:30 AM to 8:59 AM | 0 (0.0%) | 24 (1.8%) |
| 9:00 AM to 9:59 AM | 93 (7.0%) | 136 (9.9%) |
| 10:00 AM to 10:59 AM | 81 (6.0%) | 0 (0.0%) |
| 11:00 AM to 11:59 AM | 0 (0.0%) | 0 (0.0%) |
| 12:00 PM to 3:59 PM | 87 (6.5%) | 73 (5.3%) |
| 4:00 PM to 11:59 PM | 224 (16.7%) | 134 (9.8%) |
| Total | 1,338 (100.0%) | 1,371 (100.0%) |
Housing Occupancy in Hampshire
Occupancy by Ownership in Hampshire
Of the total 2,631 dwellings in Hampshire, owner-occupied units account for 1,916 (72.8%), while renter-occupied units make up 715 (27.2%).
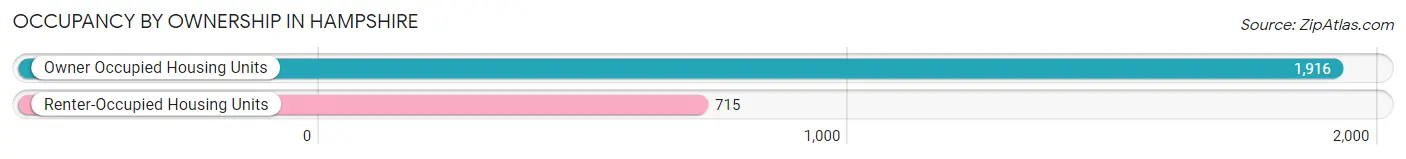
| Occupancy | # Housing Units | % Housing Units |
| Owner Occupied Housing Units | 1,916 | 72.8% |
| Renter-Occupied Housing Units | 715 | 27.2% |
| Total Occupied Housing Units | 2,631 | 100.0% |
Occupancy by Household Size in Hampshire
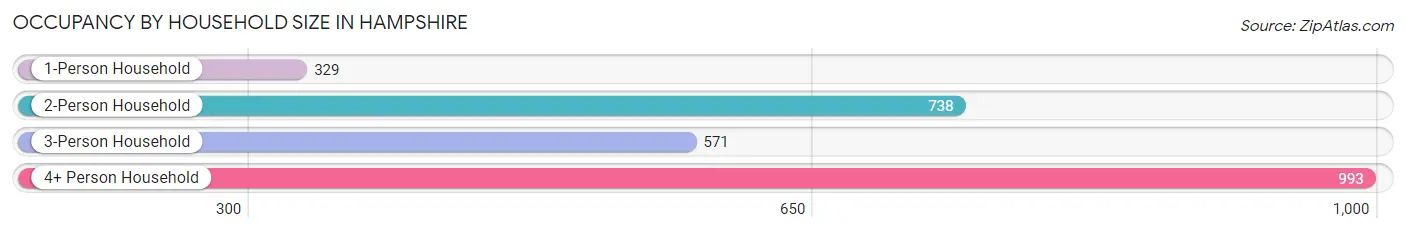
| Household Size | # Housing Units | % Housing Units |
| 1-Person Household | 329 | 12.5% |
| 2-Person Household | 738 | 28.1% |
| 3-Person Household | 571 | 21.7% |
| 4+ Person Household | 993 | 37.7% |
| Total Housing Units | 2,631 | 100.0% |
Occupancy by Ownership by Household Size in Hampshire
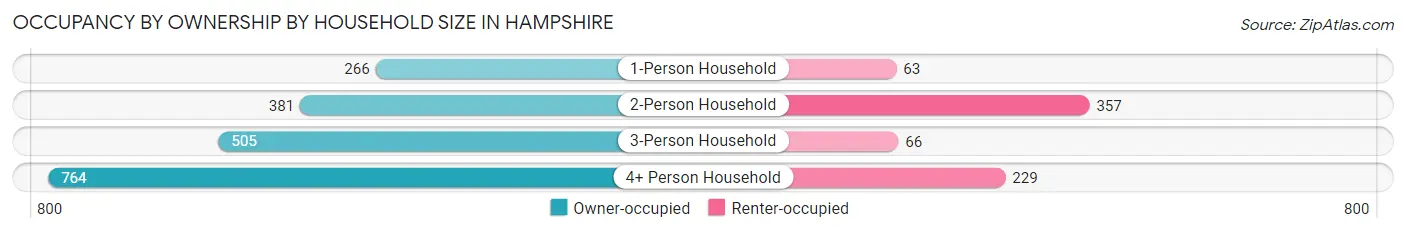
| Household Size | Owner-occupied | Renter-occupied |
| 1-Person Household | 266 (80.8%) | 63 (19.2%) |
| 2-Person Household | 381 (51.6%) | 357 (48.4%) |
| 3-Person Household | 505 (88.4%) | 66 (11.6%) |
| 4+ Person Household | 764 (76.9%) | 229 (23.1%) |
| Total Housing Units | 1,916 (72.8%) | 715 (27.2%) |
Occupancy by Educational Attainment in Hampshire
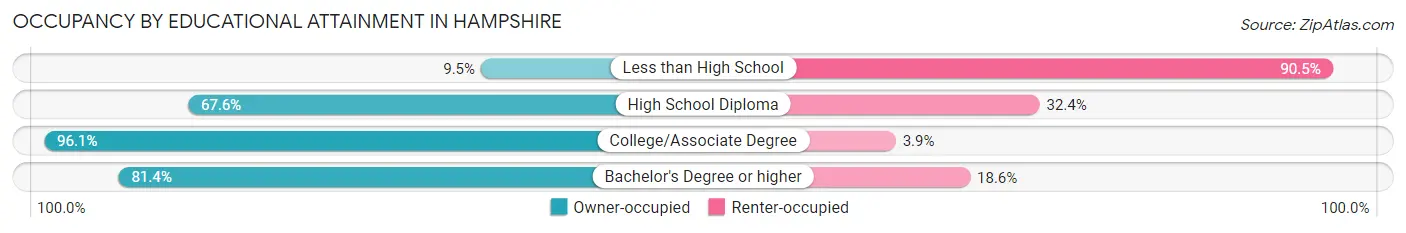
| Household Size | Owner-occupied | Renter-occupied |
| Less than High School | 29 (9.5%) | 275 (90.5%) |
| High School Diploma | 576 (67.6%) | 276 (32.4%) |
| College/Associate Degree | 721 (96.1%) | 29 (3.9%) |
| Bachelor's Degree or higher | 590 (81.4%) | 135 (18.6%) |
Occupancy by Age of Householder in Hampshire
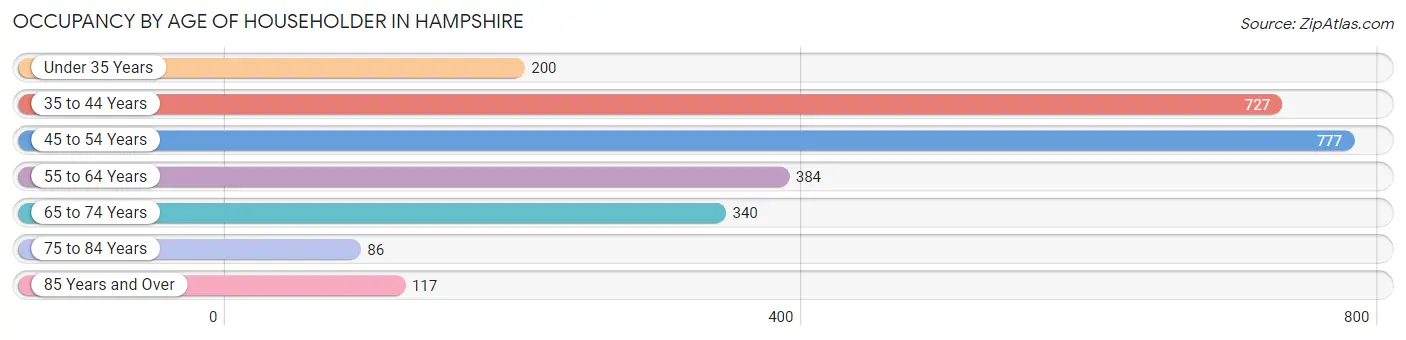
| Age Bracket | # Households | % Households |
| Under 35 Years | 200 | 7.6% |
| 35 to 44 Years | 727 | 27.6% |
| 45 to 54 Years | 777 | 29.5% |
| 55 to 64 Years | 384 | 14.6% |
| 65 to 74 Years | 340 | 12.9% |
| 75 to 84 Years | 86 | 3.3% |
| 85 Years and Over | 117 | 4.4% |
| Total | 2,631 | 100.0% |
Housing Finances in Hampshire
Median Income by Occupancy in Hampshire
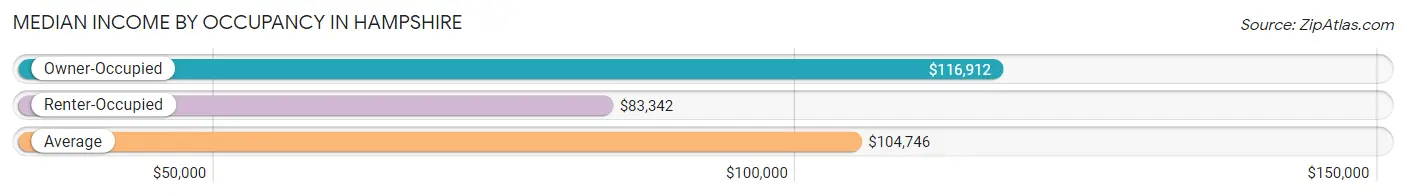
| Occupancy Type | # Households | Median Income |
| Owner-Occupied | 1,916 (72.8%) | $116,912 |
| Renter-Occupied | 715 (27.2%) | $83,342 |
| Average | 2,631 (100.0%) | $104,746 |
Occupancy by Householder Income Bracket in Hampshire
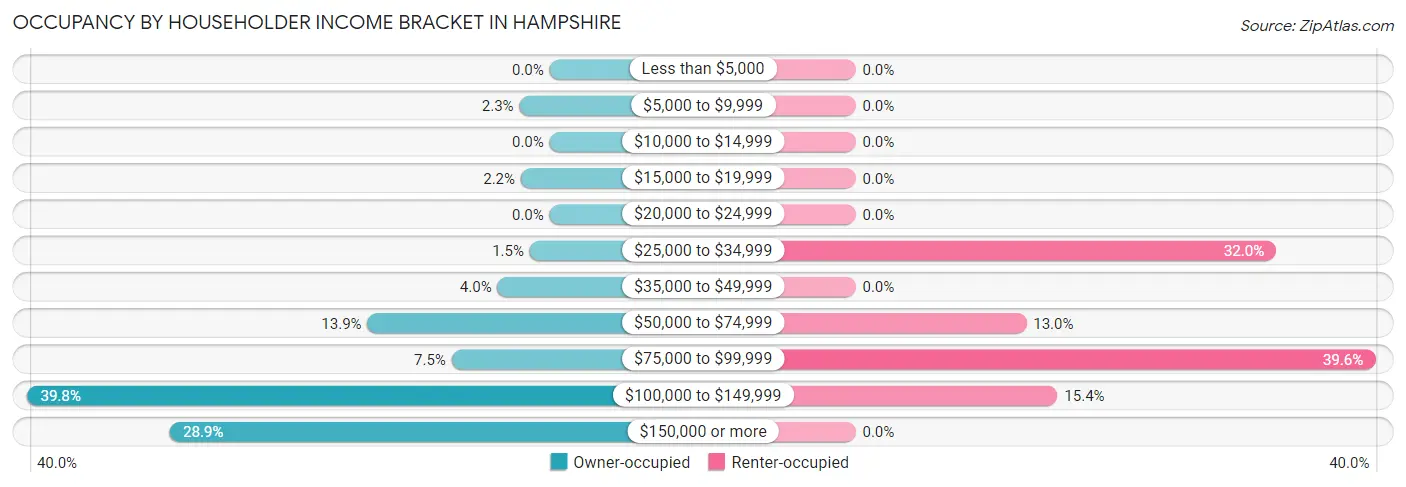
| Income Bracket | Owner-occupied | Renter-occupied |
| Less than $5,000 | 0 (0.0%) | 0 (0.0%) |
| $5,000 to $9,999 | 44 (2.3%) | 0 (0.0%) |
| $10,000 to $14,999 | 0 (0.0%) | 0 (0.0%) |
| $15,000 to $19,999 | 42 (2.2%) | 0 (0.0%) |
| $20,000 to $24,999 | 0 (0.0%) | 0 (0.0%) |
| $25,000 to $34,999 | 29 (1.5%) | 229 (32.0%) |
| $35,000 to $49,999 | 76 (4.0%) | 0 (0.0%) |
| $50,000 to $74,999 | 266 (13.9%) | 93 (13.0%) |
| $75,000 to $99,999 | 143 (7.5%) | 283 (39.6%) |
| $100,000 to $149,999 | 762 (39.8%) | 110 (15.4%) |
| $150,000 or more | 554 (28.9%) | 0 (0.0%) |
| Total | 1,916 (100.0%) | 715 (100.0%) |
Monthly Housing Cost Tiers in Hampshire
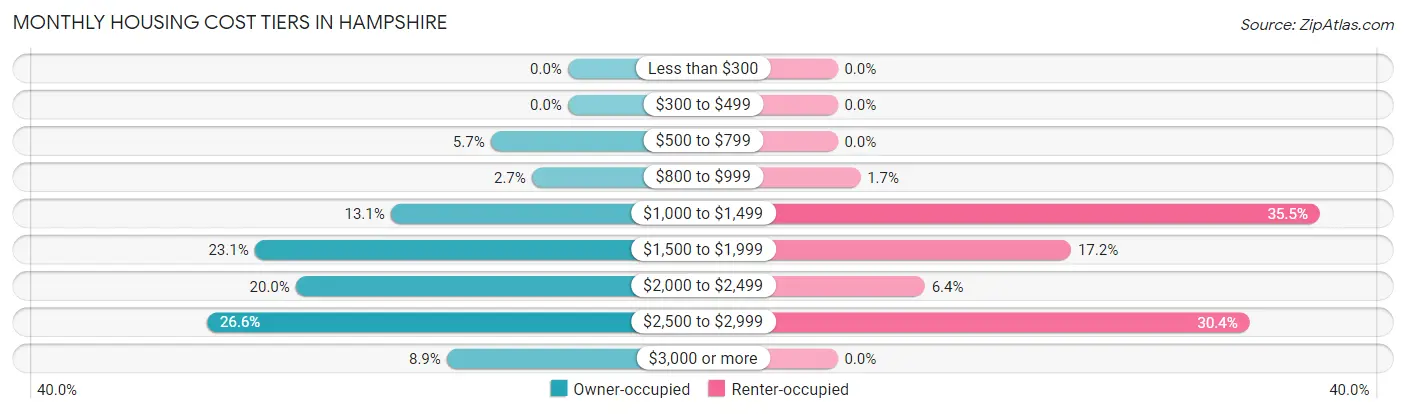
| Monthly Cost | Owner-occupied | Renter-occupied |
| Less than $300 | 0 (0.0%) | 0 (0.0%) |
| $300 to $499 | 0 (0.0%) | 0 (0.0%) |
| $500 to $799 | 109 (5.7%) | 0 (0.0%) |
| $800 to $999 | 51 (2.7%) | 12 (1.7%) |
| $1,000 to $1,499 | 250 (13.1%) | 254 (35.5%) |
| $1,500 to $1,999 | 442 (23.1%) | 123 (17.2%) |
| $2,000 to $2,499 | 384 (20.0%) | 46 (6.4%) |
| $2,500 to $2,999 | 509 (26.6%) | 217 (30.3%) |
| $3,000 or more | 171 (8.9%) | 0 (0.0%) |
| Total | 1,916 (100.0%) | 715 (100.0%) |
Physical Housing Characteristics in Hampshire
Housing Structures in Hampshire
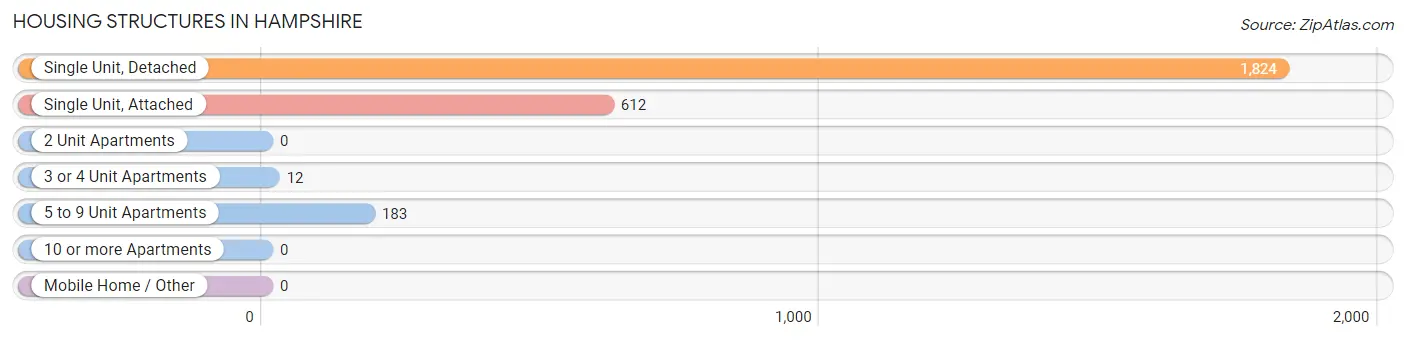
| Structure Type | # Housing Units | % Housing Units |
| Single Unit, Detached | 1,824 | 69.3% |
| Single Unit, Attached | 612 | 23.3% |
| 2 Unit Apartments | 0 | 0.0% |
| 3 or 4 Unit Apartments | 12 | 0.5% |
| 5 to 9 Unit Apartments | 183 | 7.0% |
| 10 or more Apartments | 0 | 0.0% |
| Mobile Home / Other | 0 | 0.0% |
| Total | 2,631 | 100.0% |
Housing Structures by Occupancy in Hampshire
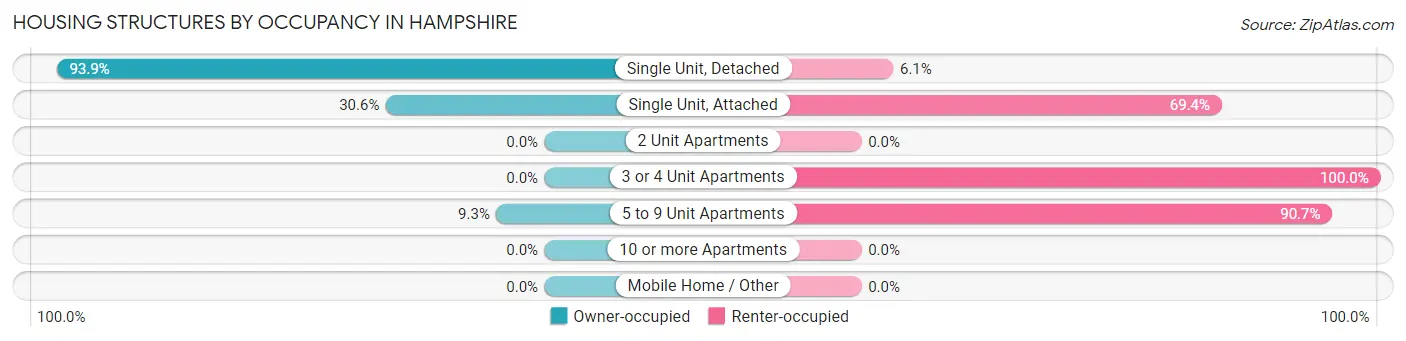
| Structure Type | Owner-occupied | Renter-occupied |
| Single Unit, Detached | 1,712 (93.9%) | 112 (6.1%) |
| Single Unit, Attached | 187 (30.6%) | 425 (69.4%) |
| 2 Unit Apartments | 0 (0.0%) | 0 (0.0%) |
| 3 or 4 Unit Apartments | 0 (0.0%) | 12 (100.0%) |
| 5 to 9 Unit Apartments | 17 (9.3%) | 166 (90.7%) |
| 10 or more Apartments | 0 (0.0%) | 0 (0.0%) |
| Mobile Home / Other | 0 (0.0%) | 0 (0.0%) |
| Total | 1,916 (72.8%) | 715 (27.2%) |
Housing Structures by Number of Rooms in Hampshire
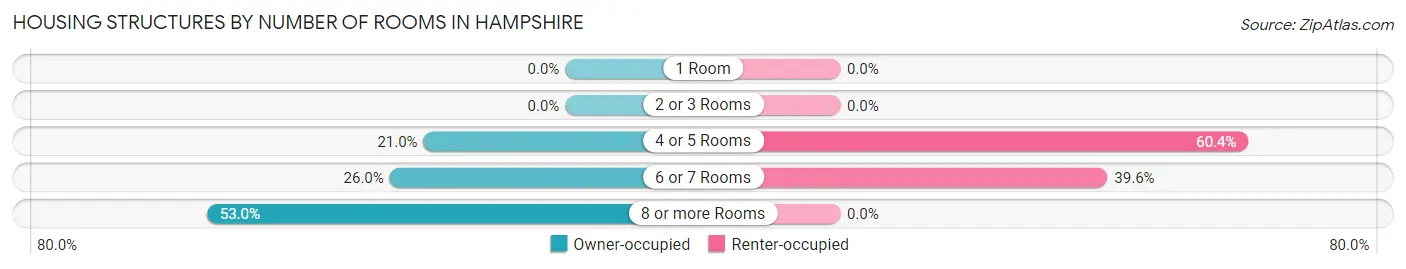
| Number of Rooms | Owner-occupied | Renter-occupied |
| 1 Room | 0 (0.0%) | 0 (0.0%) |
| 2 or 3 Rooms | 0 (0.0%) | 0 (0.0%) |
| 4 or 5 Rooms | 402 (21.0%) | 432 (60.4%) |
| 6 or 7 Rooms | 498 (26.0%) | 283 (39.6%) |
| 8 or more Rooms | 1,016 (53.0%) | 0 (0.0%) |
| Total | 1,916 (100.0%) | 715 (100.0%) |
Housing Structure by Heating Type in Hampshire
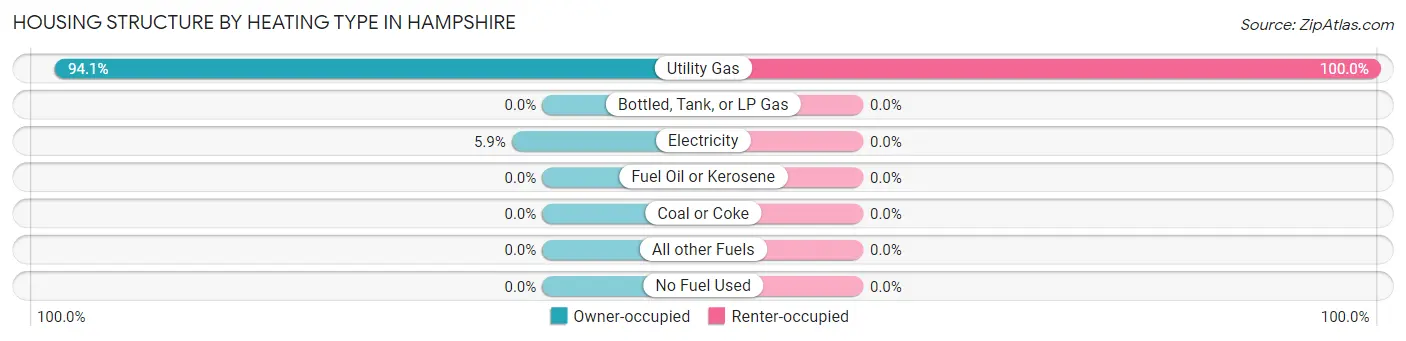
| Heating Type | Owner-occupied | Renter-occupied |
| Utility Gas | 1,803 (94.1%) | 715 (100.0%) |
| Bottled, Tank, or LP Gas | 0 (0.0%) | 0 (0.0%) |
| Electricity | 113 (5.9%) | 0 (0.0%) |
| Fuel Oil or Kerosene | 0 (0.0%) | 0 (0.0%) |
| Coal or Coke | 0 (0.0%) | 0 (0.0%) |
| All other Fuels | 0 (0.0%) | 0 (0.0%) |
| No Fuel Used | 0 (0.0%) | 0 (0.0%) |
| Total | 1,916 (100.0%) | 715 (100.0%) |
Household Vehicle Usage in Hampshire
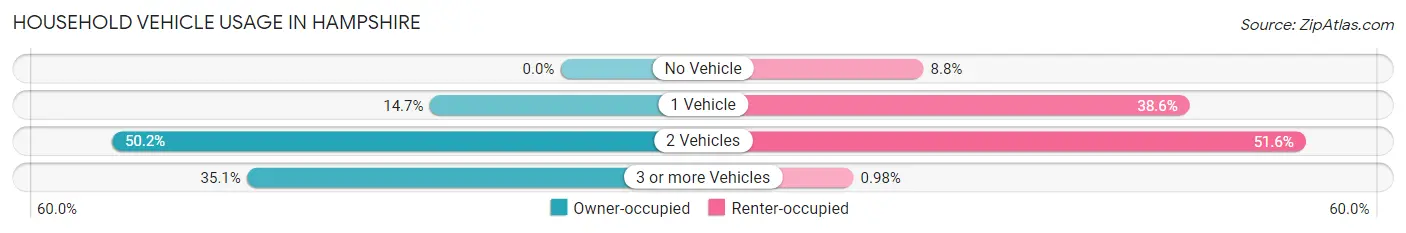
| Vehicles per Household | Owner-occupied | Renter-occupied |
| No Vehicle | 0 (0.0%) | 63 (8.8%) |
| 1 Vehicle | 281 (14.7%) | 276 (38.6%) |
| 2 Vehicles | 962 (50.2%) | 369 (51.6%) |
| 3 or more Vehicles | 673 (35.1%) | 7 (1.0%) |
| Total | 1,916 (100.0%) | 715 (100.0%) |
Real Estate & Mortgages in Hampshire
Real Estate and Mortgage Overview in Hampshire
| Characteristic | Without Mortgage | With Mortgage |
| Housing Units | 285 | 1,631 |
| Median Property Value | $304,900 | $305,800 |
| Median Household Income | $83,983 | $554 |
| Monthly Housing Costs | $917 | $171 |
| Real Estate Taxes | $7,595 | $36 |
Property Value by Mortgage Status in Hampshire
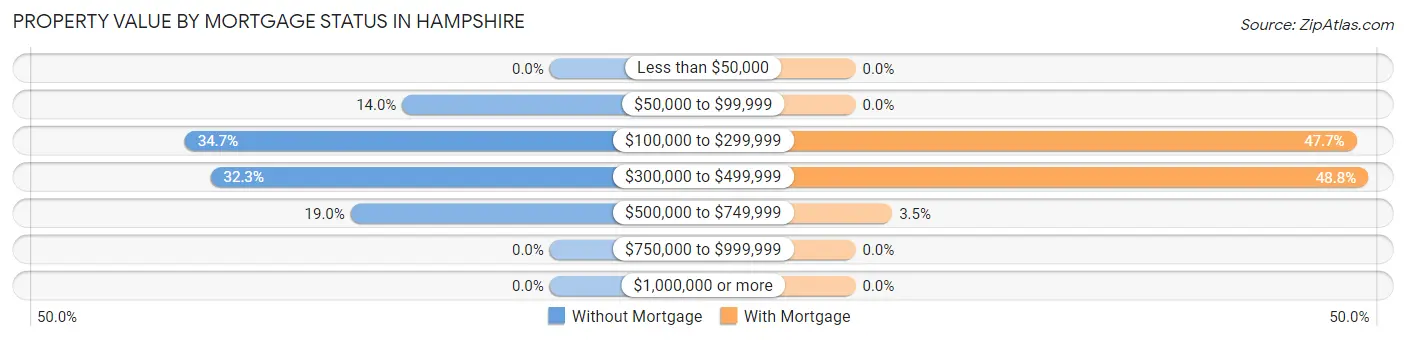
| Property Value | Without Mortgage | With Mortgage |
| Less than $50,000 | 0 (0.0%) | 0 (0.0%) |
| $50,000 to $99,999 | 40 (14.0%) | 0 (0.0%) |
| $100,000 to $299,999 | 99 (34.7%) | 778 (47.7%) |
| $300,000 to $499,999 | 92 (32.3%) | 796 (48.8%) |
| $500,000 to $749,999 | 54 (19.0%) | 57 (3.5%) |
| $750,000 to $999,999 | 0 (0.0%) | 0 (0.0%) |
| $1,000,000 or more | 0 (0.0%) | 0 (0.0%) |
| Total | 285 (100.0%) | 1,631 (100.0%) |
Household Income by Mortgage Status in Hampshire
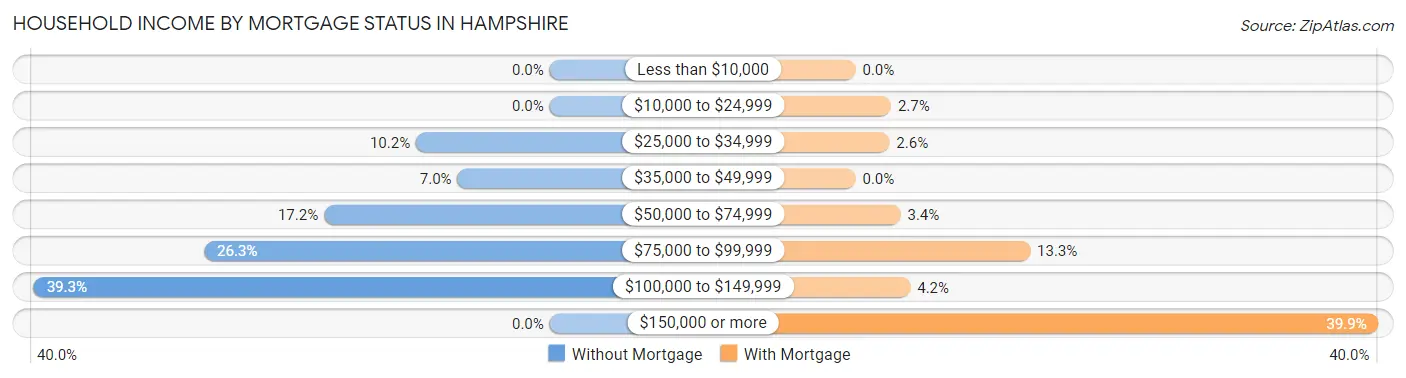
| Household Income | Without Mortgage | With Mortgage |
| Less than $10,000 | 0 (0.0%) | 0 (0.0%) |
| $10,000 to $24,999 | 0 (0.0%) | 44 (2.7%) |
| $25,000 to $34,999 | 29 (10.2%) | 42 (2.6%) |
| $35,000 to $49,999 | 20 (7.0%) | 0 (0.0%) |
| $50,000 to $74,999 | 49 (17.2%) | 56 (3.4%) |
| $75,000 to $99,999 | 75 (26.3%) | 217 (13.3%) |
| $100,000 to $149,999 | 112 (39.3%) | 68 (4.2%) |
| $150,000 or more | 0 (0.0%) | 650 (39.9%) |
| Total | 285 (100.0%) | 1,631 (100.0%) |
Property Value to Household Income Ratio in Hampshire
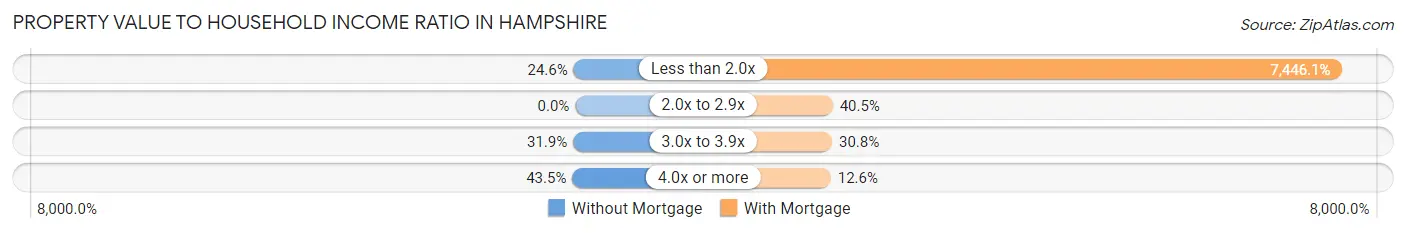
| Value-to-Income Ratio | Without Mortgage | With Mortgage |
| Less than 2.0x | 70 (24.6%) | 121,445 (7,446.0%) |
| 2.0x to 2.9x | 0 (0.0%) | 660 (40.5%) |
| 3.0x to 3.9x | 91 (31.9%) | 502 (30.8%) |
| 4.0x or more | 124 (43.5%) | 205 (12.6%) |
| Total | 285 (100.0%) | 1,631 (100.0%) |
Real Estate Taxes by Mortgage Status in Hampshire
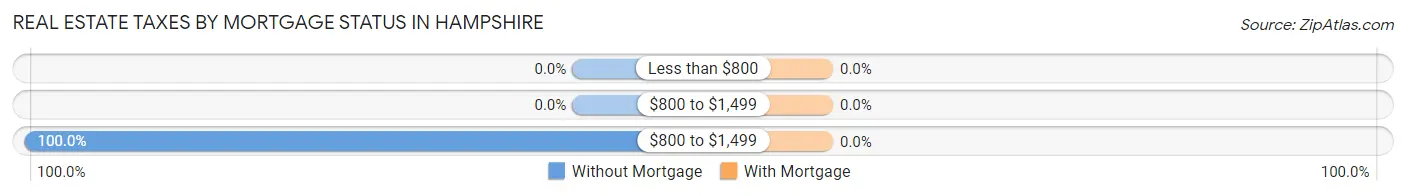
| Property Taxes | Without Mortgage | With Mortgage |
| Less than $800 | 0 (0.0%) | 0 (0.0%) |
| $800 to $1,499 | 0 (0.0%) | 0 (0.0%) |
| $800 to $1,499 | 285 (100.0%) | 0 (0.0%) |
| Total | 285 (100.0%) | 1,631 (100.0%) |
Health & Disability in Hampshire
Health Insurance Coverage by Age in Hampshire
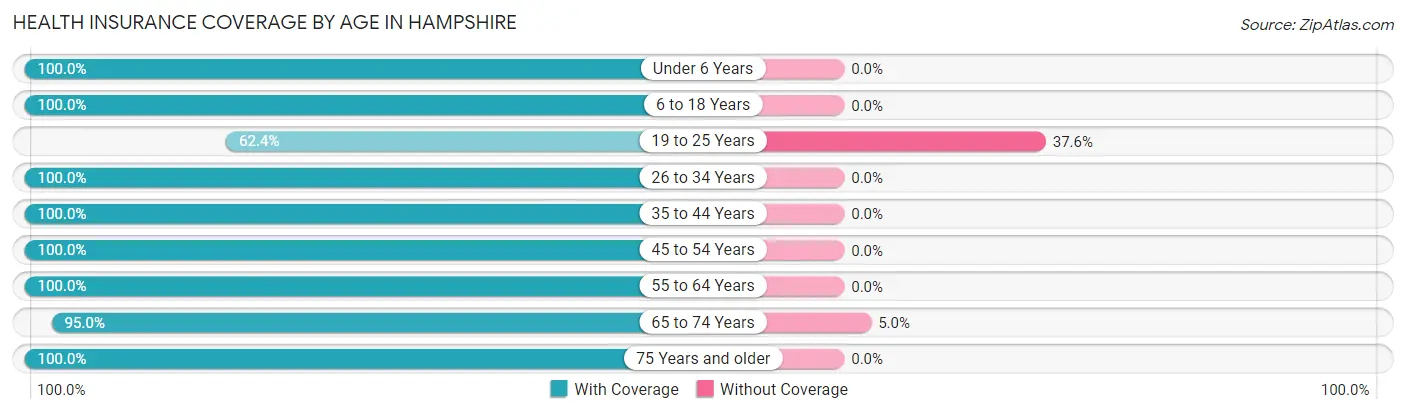
| Age Bracket | With Coverage | Without Coverage |
| Under 6 Years | 320 (100.0%) | 0 (0.0%) |
| 6 to 18 Years | 1,784 (100.0%) | 0 (0.0%) |
| 19 to 25 Years | 339 (62.4%) | 204 (37.6%) |
| 26 to 34 Years | 632 (100.0%) | 0 (0.0%) |
| 35 to 44 Years | 1,414 (100.0%) | 0 (0.0%) |
| 45 to 54 Years | 1,509 (100.0%) | 0 (0.0%) |
| 55 to 64 Years | 809 (100.0%) | 0 (0.0%) |
| 65 to 74 Years | 700 (95.0%) | 37 (5.0%) |
| 75 Years and older | 365 (100.0%) | 0 (0.0%) |
| Total | 7,872 (97.0%) | 241 (3.0%) |
Health Insurance Coverage by Citizenship Status in Hampshire
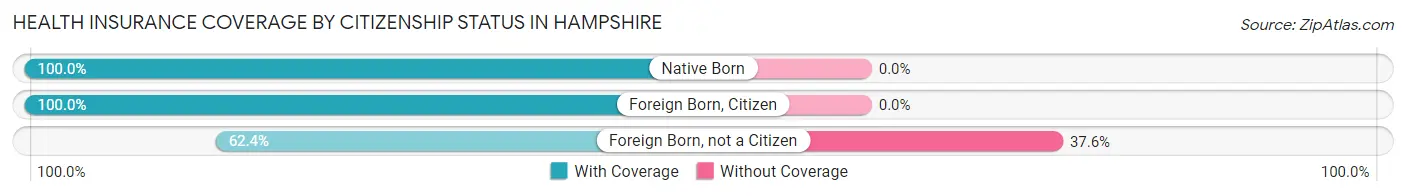
| Citizenship Status | With Coverage | Without Coverage |
| Native Born | 320 (100.0%) | 0 (0.0%) |
| Foreign Born, Citizen | 1,784 (100.0%) | 0 (0.0%) |
| Foreign Born, not a Citizen | 339 (62.4%) | 204 (37.6%) |
Health Insurance Coverage by Household Income in Hampshire
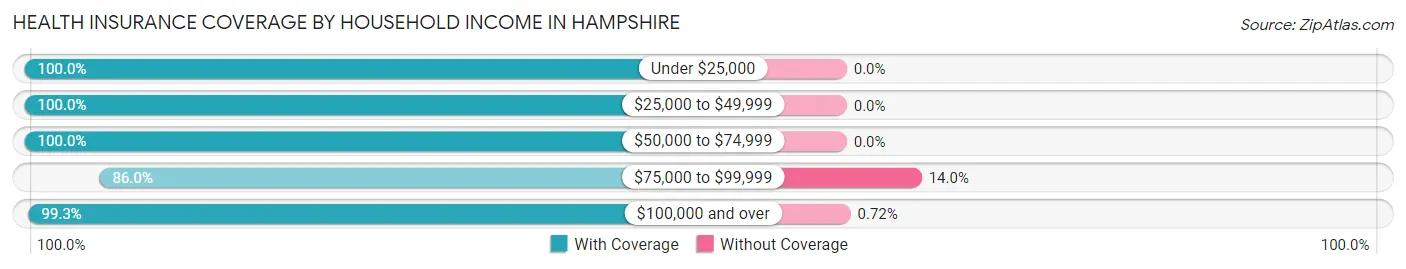
| Household Income | With Coverage | Without Coverage |
| Under $25,000 | 136 (100.0%) | 0 (0.0%) |
| $25,000 to $49,999 | 685 (100.0%) | 0 (0.0%) |
| $50,000 to $74,999 | 707 (100.0%) | 0 (0.0%) |
| $75,000 to $99,999 | 1,249 (86.0%) | 204 (14.0%) |
| $100,000 and over | 5,095 (99.3%) | 37 (0.7%) |
Public vs Private Health Insurance Coverage by Age in Hampshire
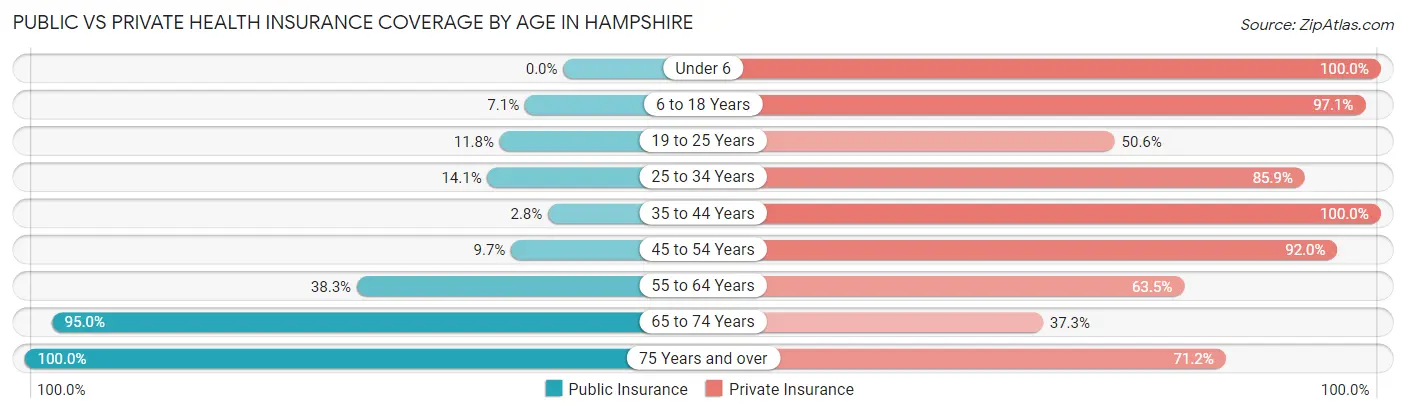
| Age Bracket | Public Insurance | Private Insurance |
| Under 6 | 0 (0.0%) | 320 (100.0%) |
| 6 to 18 Years | 127 (7.1%) | 1,733 (97.1%) |
| 19 to 25 Years | 64 (11.8%) | 275 (50.6%) |
| 25 to 34 Years | 89 (14.1%) | 543 (85.9%) |
| 35 to 44 Years | 40 (2.8%) | 1,414 (100.0%) |
| 45 to 54 Years | 146 (9.7%) | 1,388 (92.0%) |
| 55 to 64 Years | 310 (38.3%) | 514 (63.5%) |
| 65 to 74 Years | 700 (95.0%) | 275 (37.3%) |
| 75 Years and over | 365 (100.0%) | 260 (71.2%) |
| Total | 1,841 (22.7%) | 6,722 (82.9%) |
Disability Status by Sex by Age in Hampshire
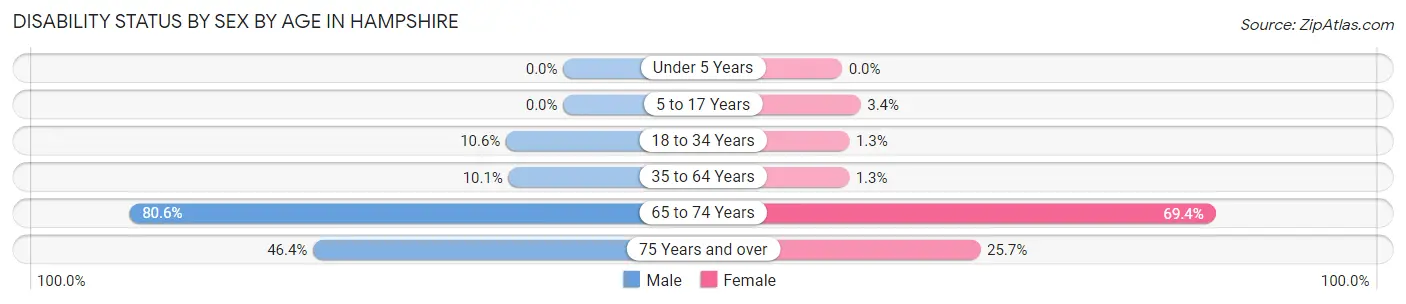
| Age Bracket | Male | Female |
| Under 5 Years | 0 (0.0%) | 0 (0.0%) |
| 5 to 17 Years | 0 (0.0%) | 38 (3.4%) |
| 18 to 34 Years | 64 (10.6%) | 11 (1.3%) |
| 35 to 64 Years | 198 (10.1%) | 23 (1.3%) |
| 65 to 74 Years | 336 (80.6%) | 222 (69.4%) |
| 75 Years and over | 117 (46.4%) | 29 (25.7%) |
Disability Class by Sex by Age in Hampshire
Disability Class: Hearing Difficulty
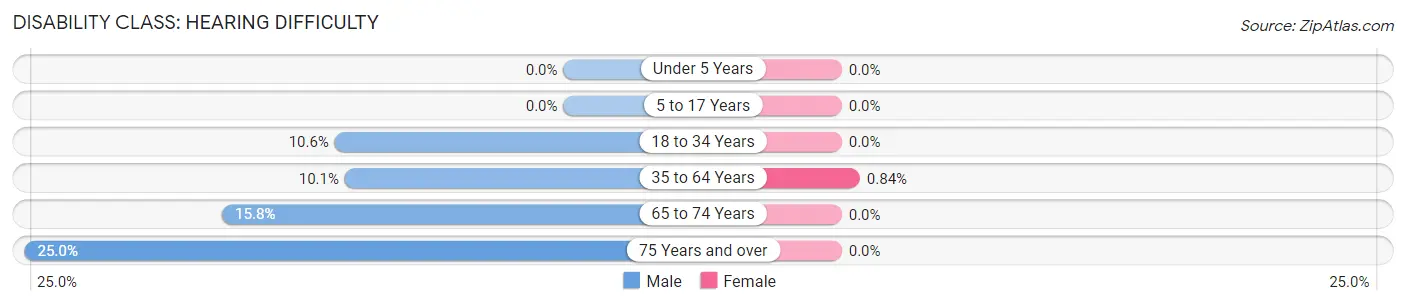
| Age Bracket | Male | Female |
| Under 5 Years | 0 (0.0%) | 0 (0.0%) |
| 5 to 17 Years | 0 (0.0%) | 0 (0.0%) |
| 18 to 34 Years | 64 (10.6%) | 0 (0.0%) |
| 35 to 64 Years | 198 (10.1%) | 15 (0.8%) |
| 65 to 74 Years | 66 (15.8%) | 0 (0.0%) |
| 75 Years and over | 63 (25.0%) | 0 (0.0%) |
Disability Class: Vision Difficulty
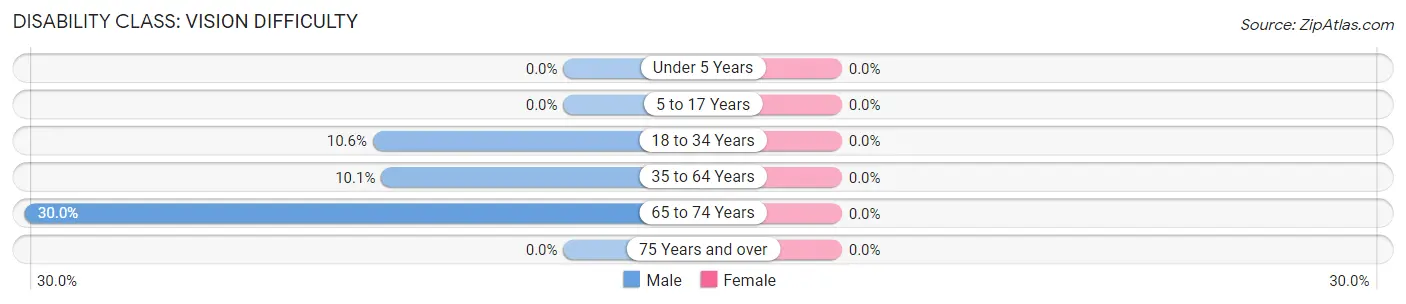
| Age Bracket | Male | Female |
| Under 5 Years | 0 (0.0%) | 0 (0.0%) |
| 5 to 17 Years | 0 (0.0%) | 0 (0.0%) |
| 18 to 34 Years | 64 (10.6%) | 0 (0.0%) |
| 35 to 64 Years | 198 (10.1%) | 0 (0.0%) |
| 65 to 74 Years | 125 (30.0%) | 0 (0.0%) |
| 75 Years and over | 0 (0.0%) | 0 (0.0%) |
Disability Class: Cognitive Difficulty
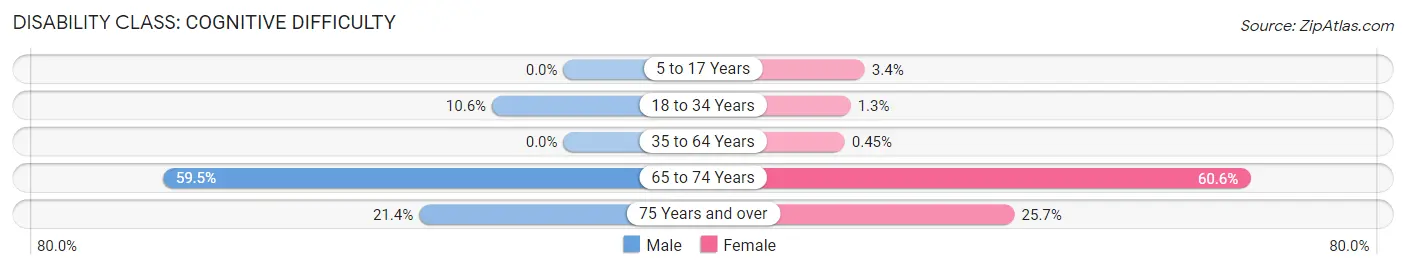
| Age Bracket | Male | Female |
| 5 to 17 Years | 0 (0.0%) | 38 (3.4%) |
| 18 to 34 Years | 64 (10.6%) | 11 (1.3%) |
| 35 to 64 Years | 0 (0.0%) | 8 (0.4%) |
| 65 to 74 Years | 248 (59.5%) | 194 (60.6%) |
| 75 Years and over | 54 (21.4%) | 29 (25.7%) |
Disability Class: Ambulatory Difficulty
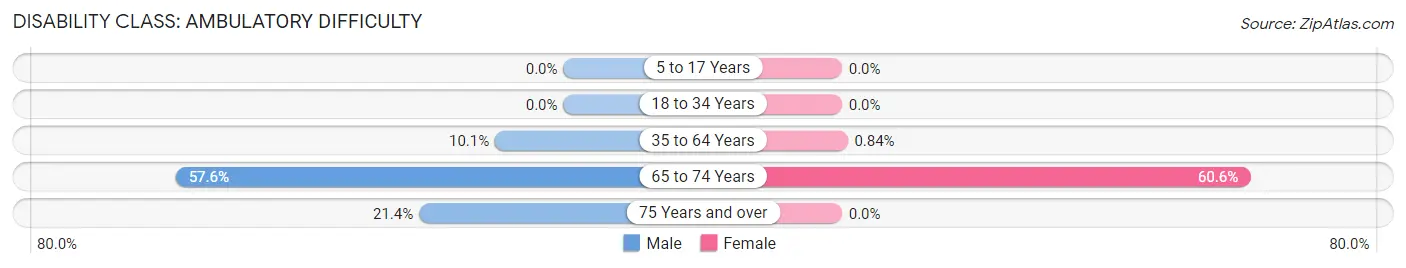
| Age Bracket | Male | Female |
| 5 to 17 Years | 0 (0.0%) | 0 (0.0%) |
| 18 to 34 Years | 0 (0.0%) | 0 (0.0%) |
| 35 to 64 Years | 198 (10.1%) | 15 (0.8%) |
| 65 to 74 Years | 240 (57.6%) | 194 (60.6%) |
| 75 Years and over | 54 (21.4%) | 0 (0.0%) |
Disability Class: Self-Care Difficulty
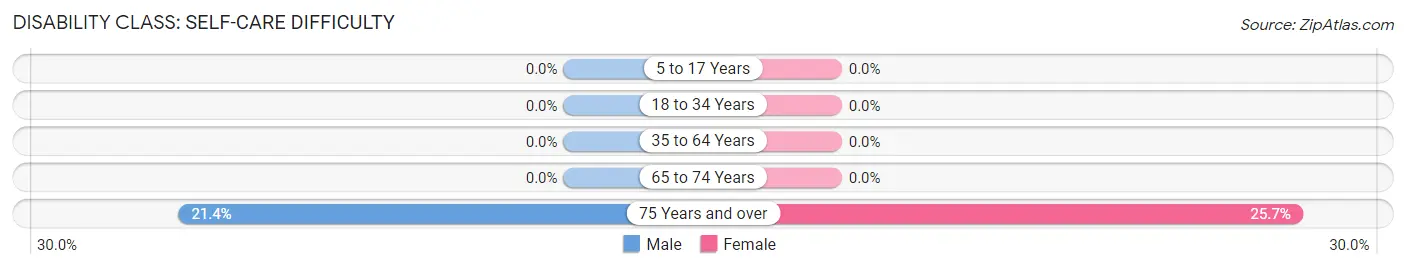
| Age Bracket | Male | Female |
| 5 to 17 Years | 0 (0.0%) | 0 (0.0%) |
| 18 to 34 Years | 0 (0.0%) | 0 (0.0%) |
| 35 to 64 Years | 0 (0.0%) | 0 (0.0%) |
| 65 to 74 Years | 0 (0.0%) | 0 (0.0%) |
| 75 Years and over | 54 (21.4%) | 29 (25.7%) |
Technology Access in Hampshire
Computing Device Access in Hampshire
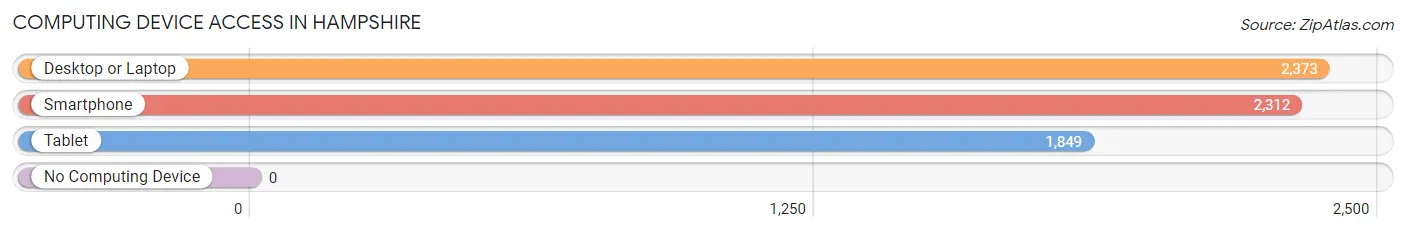
| Device Type | # Households | % Households |
| Desktop or Laptop | 2,373 | 90.2% |
| Smartphone | 2,312 | 87.9% |
| Tablet | 1,849 | 70.3% |
| No Computing Device | 0 | 0.0% |
| Total | 2,631 | 100.0% |
Internet Access in Hampshire
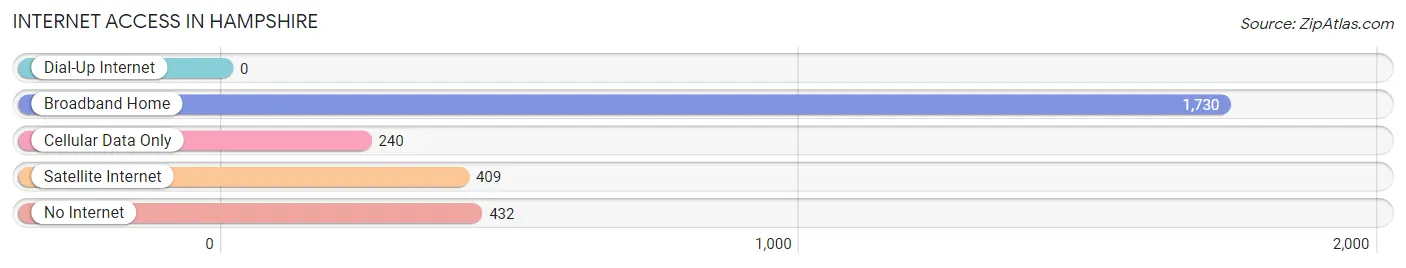
| Internet Type | # Households | % Households |
| Dial-Up Internet | 0 | 0.0% |
| Broadband Home | 1,730 | 65.7% |
| Cellular Data Only | 240 | 9.1% |
| Satellite Internet | 409 | 15.5% |
| No Internet | 432 | 16.4% |
| Total | 2,631 | 100.0% |
Hampshire Summary
Hampshire, Illinois is a small village located in Kane County, Illinois, United States. The village is located approximately 40 miles northwest of Chicago and is part of the Chicago metropolitan area. As of the 2010 census, the village had a population of 4,485.
History
Hampshire was first settled in 1836 by a group of settlers from New Hampshire. The village was originally known as New Hampshire, but the name was changed to Hampshire in 1856. The village was officially incorporated in 1867.
In the late 19th century, Hampshire was a thriving agricultural community. The village was home to several grain elevators, a creamery, a cheese factory, and a canning factory. The village also had a railroad station, which connected it to the rest of the Chicago metropolitan area.
Geography
Hampshire is located in Kane County, Illinois, approximately 40 miles northwest of Chicago. The village is situated on the Fox River, which flows through the village. The village is bordered by the villages of Pingree Grove to the north, Gilberts to the east, and Huntley to the south.
The village has a total area of 4.2 square miles, all of which is land. The village is located in the Fox River Valley, which is characterized by rolling hills and fertile farmland.
Economy
Hampshire is a primarily agricultural community. The village is home to several farms, which produce a variety of crops, including corn, soybeans, and wheat. The village is also home to several businesses, including a grocery store, a hardware store, and a restaurant.
Demographics
As of the 2010 census, the village had a population of 4,485. The racial makeup of the village was 94.3% White, 0.7% African American, 0.2% Native American, 0.7% Asian, 2.2% from other races, and 1.9% from two or more races. Hispanic or Latino of any race were 5.2% of the population.
The median household income in the village was $63,917, and the median family income was $71,917. The per capita income for the village was $25,917. About 4.2% of families and 5.2% of the population were below the poverty line, including 6.2% of those under age 18 and 4.2% of those age 65 or over.
Hampshire is served by the Hampshire Community Unit School District 300, which includes two elementary schools, one middle school, and one high school. The village is also home to several churches, including the First Congregational Church, the First Presbyterian Church, and the St. Mary's Catholic Church.
Common Questions
What is Per Capita Income in Hampshire?
Per Capita income in Hampshire is $55,048.
What is the Median Family Income in Hampshire?
Median Family Income in Hampshire is $115,650.
What is the Median Household income in Hampshire?
Median Household Income in Hampshire is $104,746.
What is Income or Wage Gap in Hampshire?
Income or Wage Gap in Hampshire is 31.7%.
Women in Hampshire earn 68.3 cents for every dollar earned by a man.
What is Inequality or Gini Index in Hampshire?
Inequality or Gini Index in Hampshire is 0.52.
What is the Total Population of Hampshire?
Total Population of Hampshire is 8,113.
What is the Total Male Population of Hampshire?
Total Male Population of Hampshire is 3,816.
What is the Total Female Population of Hampshire?
Total Female Population of Hampshire is 4,297.
What is the Ratio of Males per 100 Females in Hampshire?
There are 88.81 Males per 100 Females in Hampshire.
What is the Ratio of Females per 100 Males in Hampshire?
There are 112.60 Females per 100 Males in Hampshire.
What is the Median Population Age in Hampshire?
Median Population Age in Hampshire is 39.2 Years.
What is the Average Family Size in Hampshire
Average Family Size in Hampshire is 3.4 People.
What is the Average Household Size in Hampshire
Average Household Size in Hampshire is 3.1 People.
How Large is the Labor Force in Hampshire?
There are 3,884 People in the Labor Forcein in Hampshire.
What is the Percentage of People in the Labor Force in Hampshire?
61.0% of People are in the Labor Force in Hampshire.
What is the Unemployment Rate in Hampshire?
Unemployment Rate in Hampshire is 2.0%.