Hammond, IL Map & Demographics
Hammond Map
Hammond Overview
$30,093
PER CAPITA INCOME
$78,571
AVG FAMILY INCOME
$72,292
AVG HOUSEHOLD INCOME
5.9%
WAGE / INCOME GAP [ % ]
94.1¢/ $1
WAGE / INCOME GAP [ $ ]
0.31
INEQUALITY / GINI INDEX
546
TOTAL POPULATION
292
MALE POPULATION
254
FEMALE POPULATION
114.96
MALES / 100 FEMALES
86.99
FEMALES / 100 MALES
37.5
MEDIAN AGE
2.7
AVG FAMILY SIZE
2.3
AVG HOUSEHOLD SIZE
235
LABOR FORCE [ PEOPLE ]
55.7%
PERCENT IN LABOR FORCE
18.3%
UNEMPLOYMENT RATE
Hammond Zip Codes
Hammond Area Codes
Income in Hammond
Income Overview in Hammond
Per Capita Income in Hammond is $30,093, while median incomes of families and households are $78,571 and $72,292 respectively.
| Characteristic | Number | Measure |
| Per Capita Income | 546 | $30,093 |
| Median Family Income | 156 | $78,571 |
| Mean Family Income | 156 | $79,633 |
| Median Household Income | 239 | $72,292 |
| Mean Household Income | 239 | $72,100 |
| Income Deficit | 156 | $0 |
| Wage / Income Gap (%) | 546 | 5.90% |
| Wage / Income Gap ($) | 546 | 94.10¢ per $1 |
| Gini / Inequality Index | 546 | 0.31 |
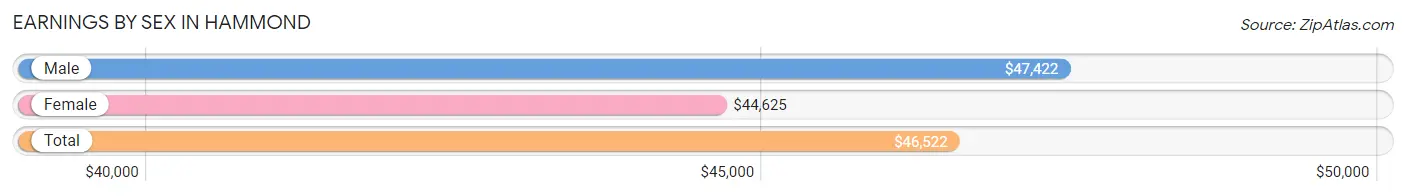
Earnings by Sex in Hammond
Average Earnings in Hammond are $46,522, $47,422 for men and $44,625 for women, a difference of 5.9%.
| Sex | Number | Average Earnings |
| Male | 143 (58.6%) | $47,422 |
| Female | 101 (41.4%) | $44,625 |
| Total | 244 (100.0%) | $46,522 |
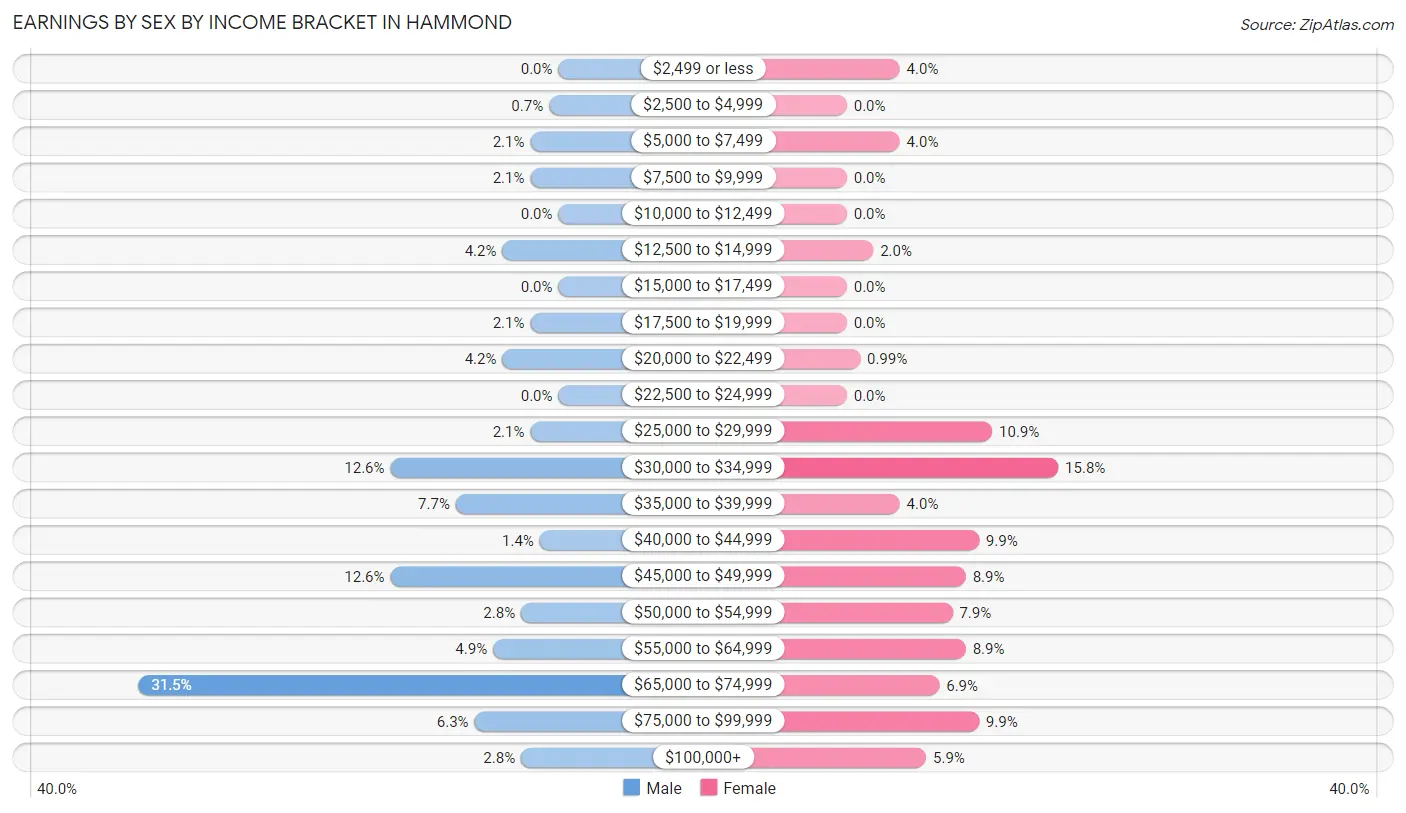
Earnings by Sex by Income Bracket in Hammond
The most common earnings brackets in Hammond are $65,000 to $74,999 for men (45 | 31.5%) and $30,000 to $34,999 for women (16 | 15.8%).
| Income | Male | Female |
| $2,499 or less | 0 (0.0%) | 4 (4.0%) |
| $2,500 to $4,999 | 1 (0.7%) | 0 (0.0%) |
| $5,000 to $7,499 | 3 (2.1%) | 4 (4.0%) |
| $7,500 to $9,999 | 3 (2.1%) | 0 (0.0%) |
| $10,000 to $12,499 | 0 (0.0%) | 0 (0.0%) |
| $12,500 to $14,999 | 6 (4.2%) | 2 (2.0%) |
| $15,000 to $17,499 | 0 (0.0%) | 0 (0.0%) |
| $17,500 to $19,999 | 3 (2.1%) | 0 (0.0%) |
| $20,000 to $22,499 | 6 (4.2%) | 1 (1.0%) |
| $22,500 to $24,999 | 0 (0.0%) | 0 (0.0%) |
| $25,000 to $29,999 | 3 (2.1%) | 11 (10.9%) |
| $30,000 to $34,999 | 18 (12.6%) | 16 (15.8%) |
| $35,000 to $39,999 | 11 (7.7%) | 4 (4.0%) |
| $40,000 to $44,999 | 2 (1.4%) | 10 (9.9%) |
| $45,000 to $49,999 | 18 (12.6%) | 9 (8.9%) |
| $50,000 to $54,999 | 4 (2.8%) | 8 (7.9%) |
| $55,000 to $64,999 | 7 (4.9%) | 9 (8.9%) |
| $65,000 to $74,999 | 45 (31.5%) | 7 (6.9%) |
| $75,000 to $99,999 | 9 (6.3%) | 10 (9.9%) |
| $100,000+ | 4 (2.8%) | 6 (5.9%) |
| Total | 143 (100.0%) | 101 (100.0%) |
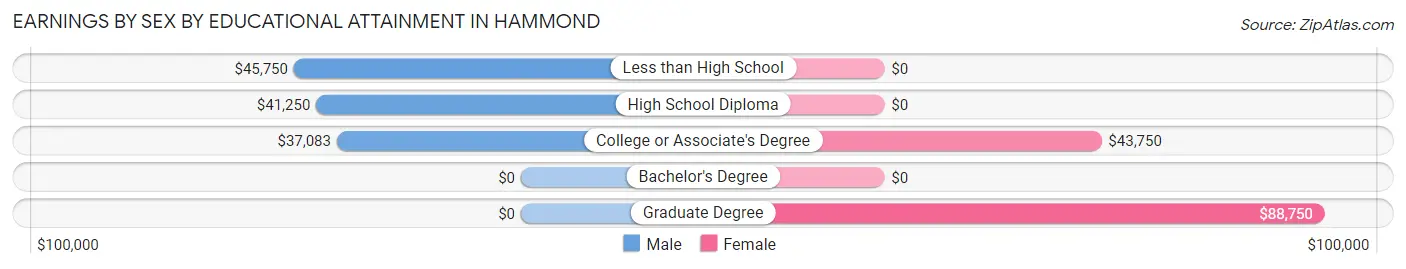
Earnings by Sex by Educational Attainment in Hammond
Average earnings in Hammond are $51,875 for men and $45,179 for women, a difference of 12.9%. Men with an educational attainment of less than high school enjoy the highest average annual earnings of $45,750, while those with college or associate's degree education earn the least with $37,083. Women with an educational attainment of graduate degree earn the most with the average annual earnings of $88,750, while those with college or associate's degree education have the smallest earnings of $43,750.
| Educational Attainment | Male Income | Female Income |
| Less than High School | $45,750 | $0 |
| High School Diploma | $41,250 | $0 |
| College or Associate's Degree | $37,083 | $43,750 |
| Bachelor's Degree | - | - |
| Graduate Degree | - | - |
| Total | $51,875 | $45,179 |
Family Income in Hammond
Family Income Brackets in Hammond
According to the Hammond family income data, there are 50 families falling into the $100,000 to $149,999 income range, which is the most common income bracket and makes up 32.1% of all families. Conversely, the less than $10,000 income bracket is the least frequent group with only 1 families (0.6%) belonging to this category.
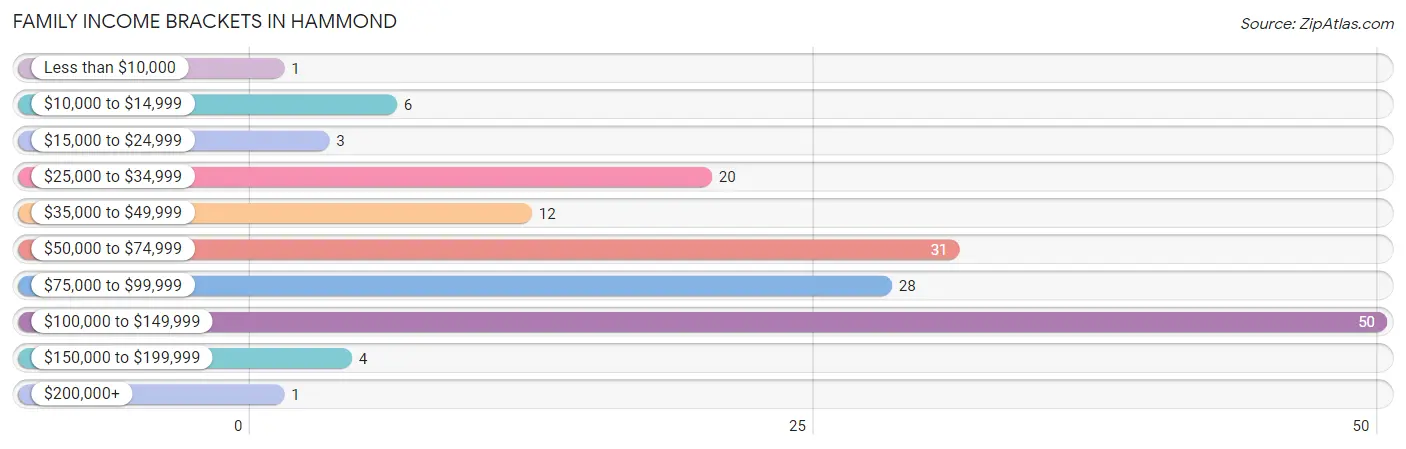
| Income Bracket | # Families | % Families |
| Less than $10,000 | 1 | 0.6% |
| $10,000 to $14,999 | 6 | 3.8% |
| $15,000 to $24,999 | 3 | 1.9% |
| $25,000 to $34,999 | 20 | 12.8% |
| $35,000 to $49,999 | 12 | 7.7% |
| $50,000 to $74,999 | 31 | 19.9% |
| $75,000 to $99,999 | 28 | 17.9% |
| $100,000 to $149,999 | 50 | 32.1% |
| $150,000 to $199,999 | 4 | 2.6% |
| $200,000+ | 1 | 0.6% |
Family Income by Famaliy Size in Hammond
2-person families (95 | 60.9%) account for the highest median family income in Hammond with $79,821 per family, while 2-person families (95 | 60.9%) have the highest median income of $39,910 per family member.
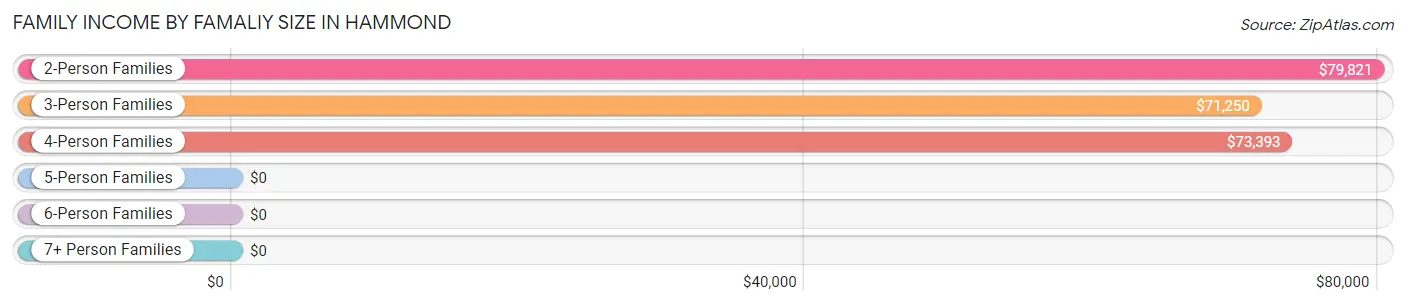
| Income Bracket | # Families | Median Income |
| 2-Person Families | 95 (60.9%) | $79,821 |
| 3-Person Families | 29 (18.6%) | $71,250 |
| 4-Person Families | 27 (17.3%) | $73,393 |
| 5-Person Families | 3 (1.9%) | $0 |
| 6-Person Families | 2 (1.3%) | $0 |
| 7+ Person Families | 0 (0.0%) | $0 |
| Total | 156 (100.0%) | $78,571 |
Family Income by Number of Earners in Hammond
The median family income in Hammond is $78,571, with families comprising 3+ earners (9) having the highest median family income of $146,250, while families with no earners (27) have the lowest median family income of $45,250, accounting for 5.8% and 17.3% of families, respectively.
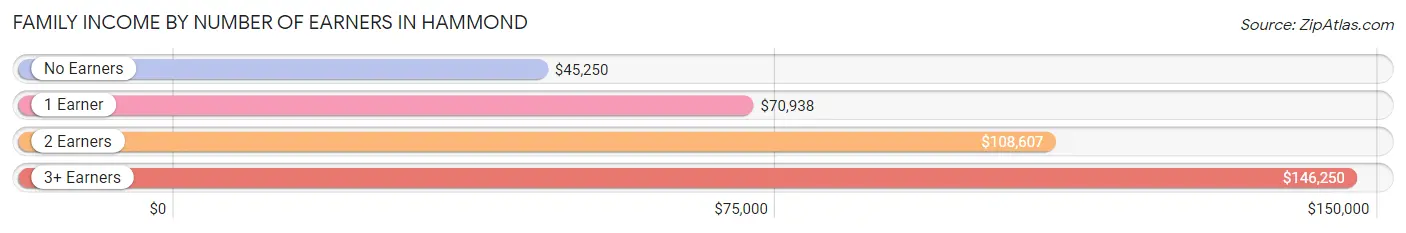
| Number of Earners | # Families | Median Income |
| No Earners | 27 (17.3%) | $45,250 |
| 1 Earner | 63 (40.4%) | $70,938 |
| 2 Earners | 57 (36.5%) | $108,607 |
| 3+ Earners | 9 (5.8%) | $146,250 |
| Total | 156 (100.0%) | $78,571 |
Household Income in Hammond
Household Income Brackets in Hammond
With 64 households falling in the category, the $100,000 to $149,999 income range is the most frequent in Hammond, accounting for 26.8% of all households. In contrast, only 1 households (0.4%) fall into the $200,000+ income bracket, making it the least populous group.
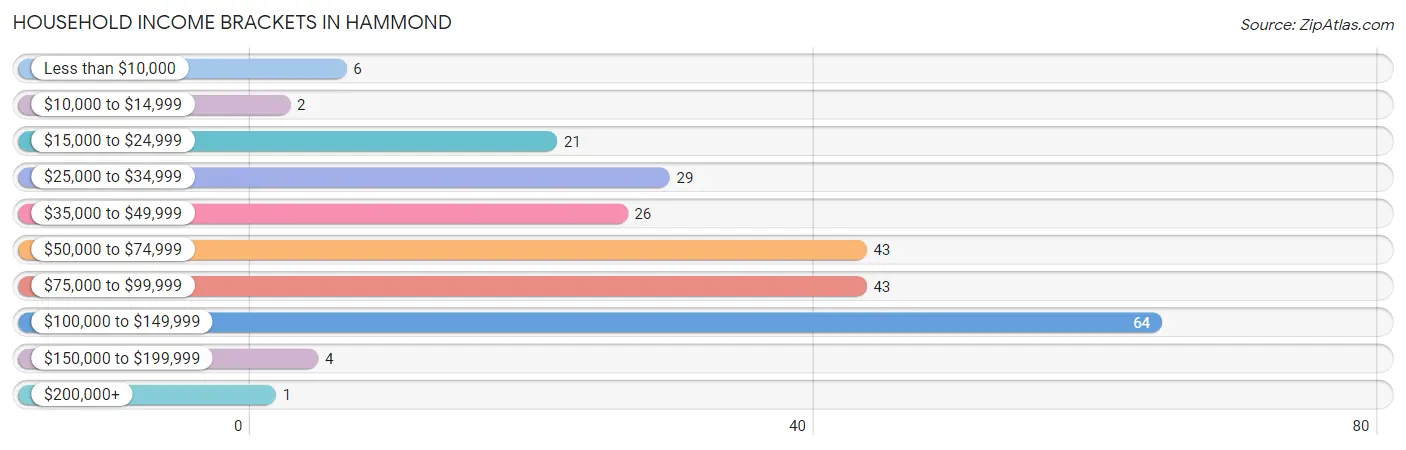
| Income Bracket | # Households | % Households |
| Less than $10,000 | 6 | 2.5% |
| $10,000 to $14,999 | 2 | 0.8% |
| $15,000 to $24,999 | 21 | 8.8% |
| $25,000 to $34,999 | 29 | 12.1% |
| $35,000 to $49,999 | 26 | 10.9% |
| $50,000 to $74,999 | 43 | 18.0% |
| $75,000 to $99,999 | 43 | 18.0% |
| $100,000 to $149,999 | 64 | 26.8% |
| $150,000 to $199,999 | 4 | 1.7% |
| $200,000+ | 1 | 0.4% |
Household Income by Householder Age in Hammond
The median household income in Hammond is $72,292, with the highest median household income of $105,625 found in the 25 to 44 years age bracket for the primary householder. A total of 87 households (36.4%) fall into this category. Meanwhile, the 15 to 24 years age bracket for the primary householder has the lowest median household income of $0, with 5 households (2.1%) in this group.
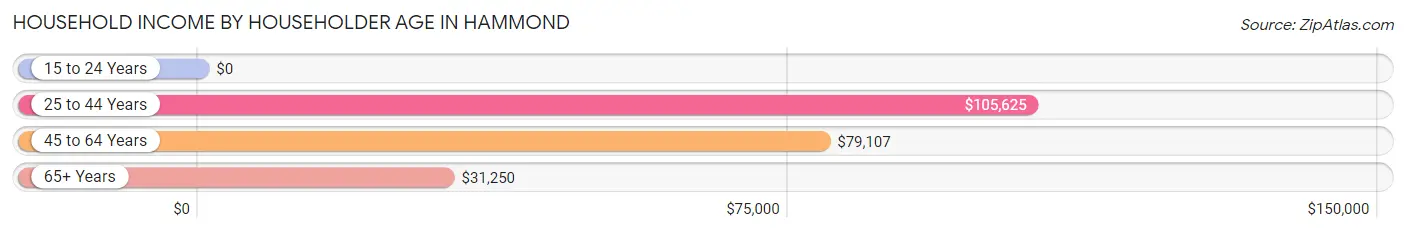
| Income Bracket | # Households | Median Income |
| 15 to 24 Years | 5 (2.1%) | $0 |
| 25 to 44 Years | 87 (36.4%) | $105,625 |
| 45 to 64 Years | 77 (32.2%) | $79,107 |
| 65+ Years | 70 (29.3%) | $31,250 |
| Total | 239 (100.0%) | $72,292 |
Poverty in Hammond
Income Below Poverty by Sex and Age in Hammond
With 5.2% poverty level for males and 10.0% for females among the residents of Hammond, under 5 year old males and 6 to 11 year old females are the most vulnerable to poverty, with 5 males (31.2%) and 9 females (34.6%) in their respective age groups living below the poverty level.
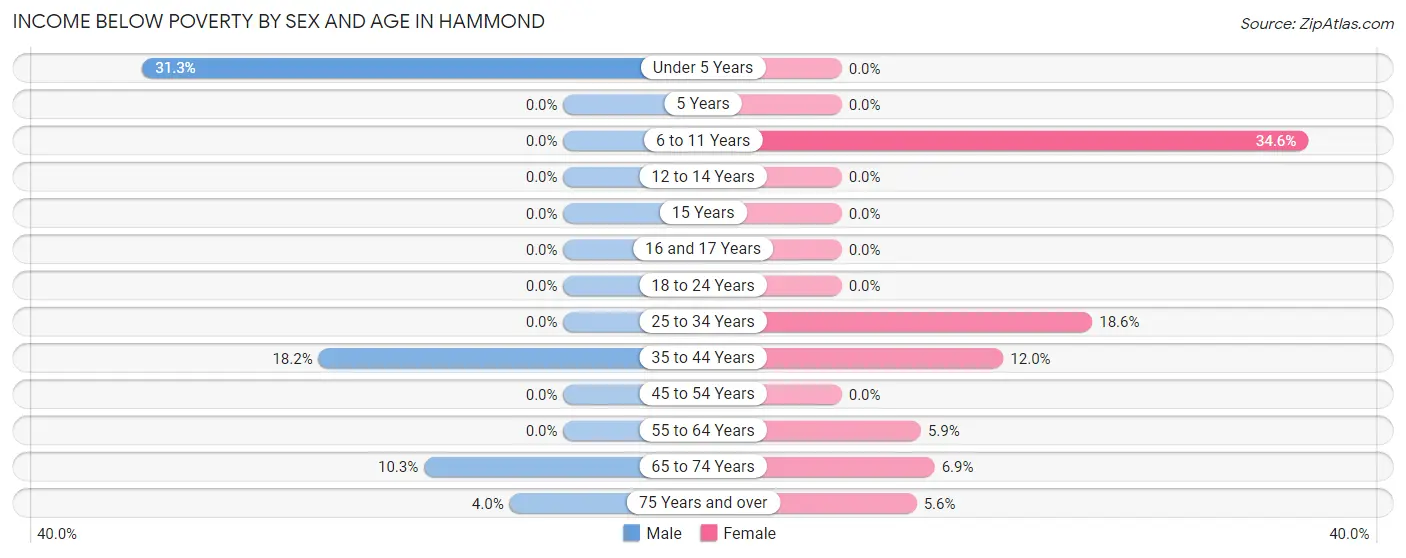
| Age Bracket | Male | Female |
| Under 5 Years | 5 (31.2%) | 0 (0.0%) |
| 5 Years | 0 (0.0%) | 0 (0.0%) |
| 6 to 11 Years | 0 (0.0%) | 9 (34.6%) |
| 12 to 14 Years | 0 (0.0%) | 0 (0.0%) |
| 15 Years | 0 (0.0%) | 0 (0.0%) |
| 16 and 17 Years | 0 (0.0%) | 0 (0.0%) |
| 18 to 24 Years | 0 (0.0%) | 0 (0.0%) |
| 25 to 34 Years | 0 (0.0%) | 8 (18.6%) |
| 35 to 44 Years | 6 (18.2%) | 3 (12.0%) |
| 45 to 54 Years | 0 (0.0%) | 0 (0.0%) |
| 55 to 64 Years | 0 (0.0%) | 2 (5.9%) |
| 65 to 74 Years | 3 (10.3%) | 2 (6.9%) |
| 75 Years and over | 1 (4.0%) | 1 (5.6%) |
| Total | 15 (5.2%) | 25 (10.0%) |
Income Above Poverty by Sex and Age in Hammond
According to the poverty statistics in Hammond, males aged 6 to 11 years and females aged under 5 years are the age groups that are most secure financially, with 100.0% of males and 100.0% of females in these age groups living above the poverty line.
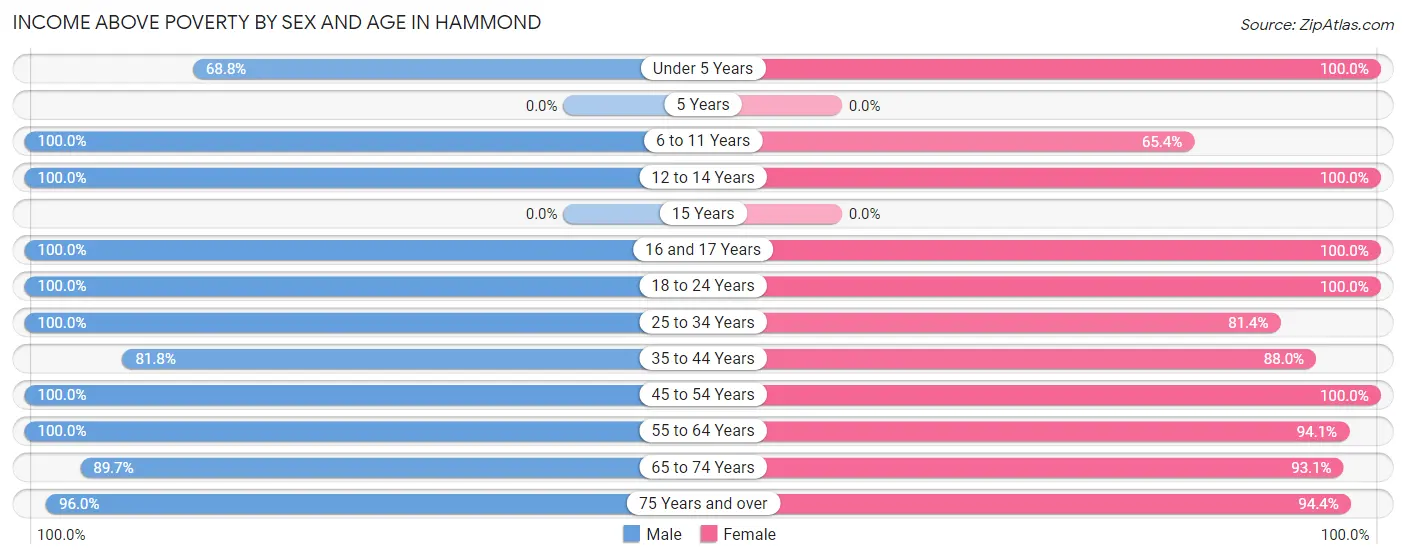
| Age Bracket | Male | Female |
| Under 5 Years | 11 (68.8%) | 10 (100.0%) |
| 5 Years | 0 (0.0%) | 0 (0.0%) |
| 6 to 11 Years | 30 (100.0%) | 17 (65.4%) |
| 12 to 14 Years | 14 (100.0%) | 18 (100.0%) |
| 15 Years | 0 (0.0%) | 0 (0.0%) |
| 16 and 17 Years | 7 (100.0%) | 15 (100.0%) |
| 18 to 24 Years | 12 (100.0%) | 6 (100.0%) |
| 25 to 34 Years | 59 (100.0%) | 35 (81.4%) |
| 35 to 44 Years | 27 (81.8%) | 22 (88.0%) |
| 45 to 54 Years | 35 (100.0%) | 26 (100.0%) |
| 55 to 64 Years | 26 (100.0%) | 32 (94.1%) |
| 65 to 74 Years | 26 (89.7%) | 27 (93.1%) |
| 75 Years and over | 24 (96.0%) | 17 (94.4%) |
| Total | 271 (94.8%) | 225 (90.0%) |
Income Below Poverty Among Married-Couple Families in Hammond
The poverty statistics for married-couple families in Hammond show that 0.8% or 1 of the total 125 families live below the poverty line. Families with no children have the highest poverty rate of 1.1%, comprising of 1 families. On the other hand, families with 1 or 2 children have the lowest poverty rate of 0.0%, which includes 0 families.
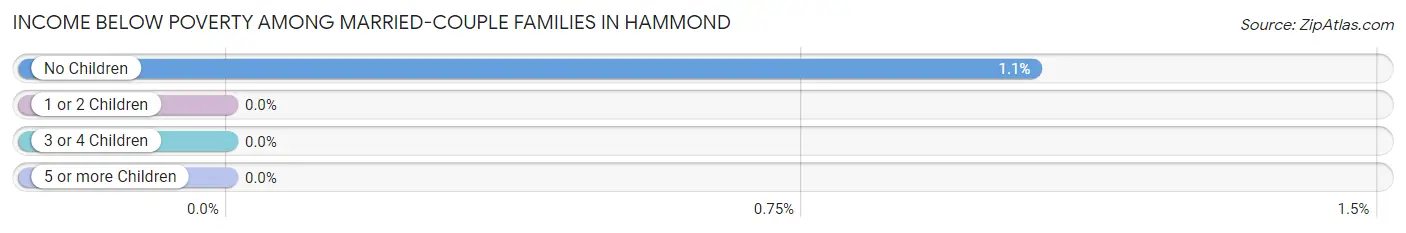
| Children | Above Poverty | Below Poverty |
| No Children | 94 (99.0%) | 1 (1.1%) |
| 1 or 2 Children | 27 (100.0%) | 0 (0.0%) |
| 3 or 4 Children | 3 (100.0%) | 0 (0.0%) |
| 5 or more Children | 0 (0.0%) | 0 (0.0%) |
| Total | 124 (99.2%) | 1 (0.8%) |
Income Below Poverty Among Single-Parent Households in Hammond
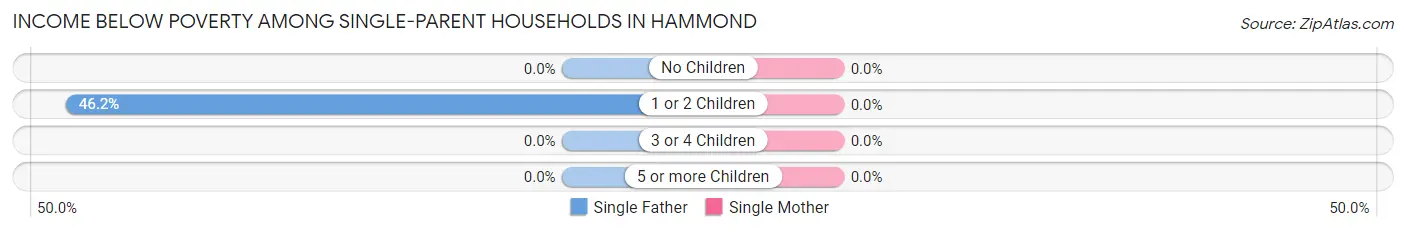
| Children | Single Father | Single Mother |
| No Children | 0 (0.0%) | 0 (0.0%) |
| 1 or 2 Children | 6 (46.2%) | 0 (0.0%) |
| 3 or 4 Children | 0 (0.0%) | 0 (0.0%) |
| 5 or more Children | 0 (0.0%) | 0 (0.0%) |
| Total | 6 (40.0%) | 0 (0.0%) |
Income Below Poverty Among Married-Couple vs Single-Parent Households in Hammond
The poverty data for Hammond shows that 1 of the married-couple family households (0.8%) and 6 of the single-parent households (19.4%) are living below the poverty level. Within the married-couple family households, those with no children have the highest poverty rate, with 1 households (1.1%) falling below the poverty line. Among the single-parent households, those with 1 or 2 children have the highest poverty rate, with 6 household (31.6%) living below poverty.
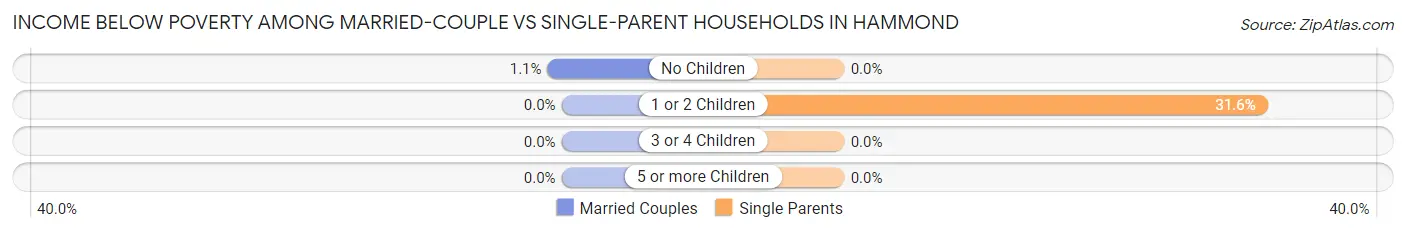
| Children | Married-Couple Families | Single-Parent Households |
| No Children | 1 (1.1%) | 0 (0.0%) |
| 1 or 2 Children | 0 (0.0%) | 6 (31.6%) |
| 3 or 4 Children | 0 (0.0%) | 0 (0.0%) |
| 5 or more Children | 0 (0.0%) | 0 (0.0%) |
| Total | 1 (0.8%) | 6 (19.4%) |
Race in Hammond
The most populous races in Hammond are White / Caucasian (536 | 98.2%), Asian (6 | 1.1%), and Two or more Races (4 | 0.7%).
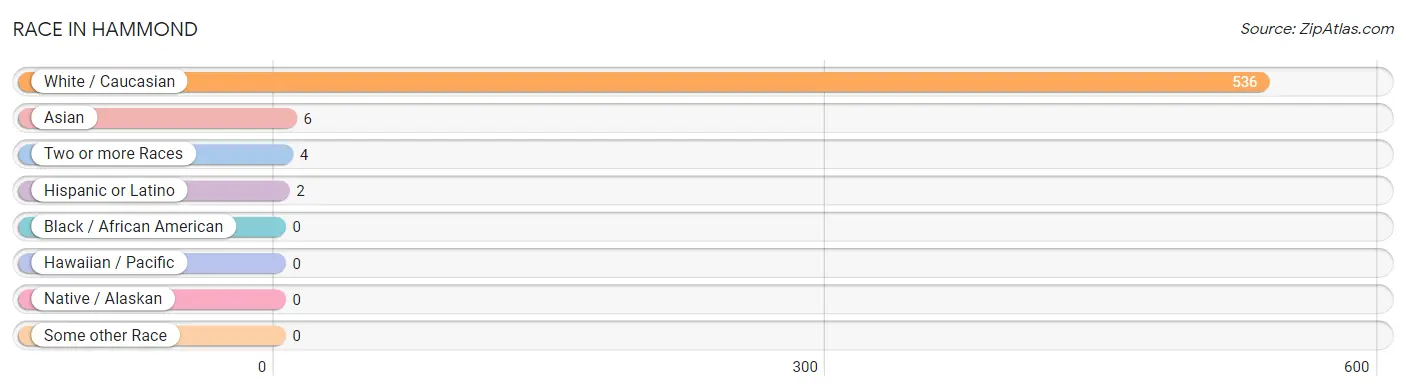
| Race | # Population | % Population |
| Asian | 6 | 1.1% |
| Black / African American | 0 | 0.0% |
| Hawaiian / Pacific | 0 | 0.0% |
| Hispanic or Latino | 2 | 0.4% |
| Native / Alaskan | 0 | 0.0% |
| White / Caucasian | 536 | 98.2% |
| Two or more Races | 4 | 0.7% |
| Some other Race | 0 | 0.0% |
| Total | 546 | 100.0% |
Ancestry in Hammond
The most populous ancestries reported in Hammond are German (113 | 20.7%), Irish (59 | 10.8%), English (57 | 10.4%), Italian (55 | 10.1%), and Polish (38 | 7.0%), together accounting for 59.0% of all Hammond residents.
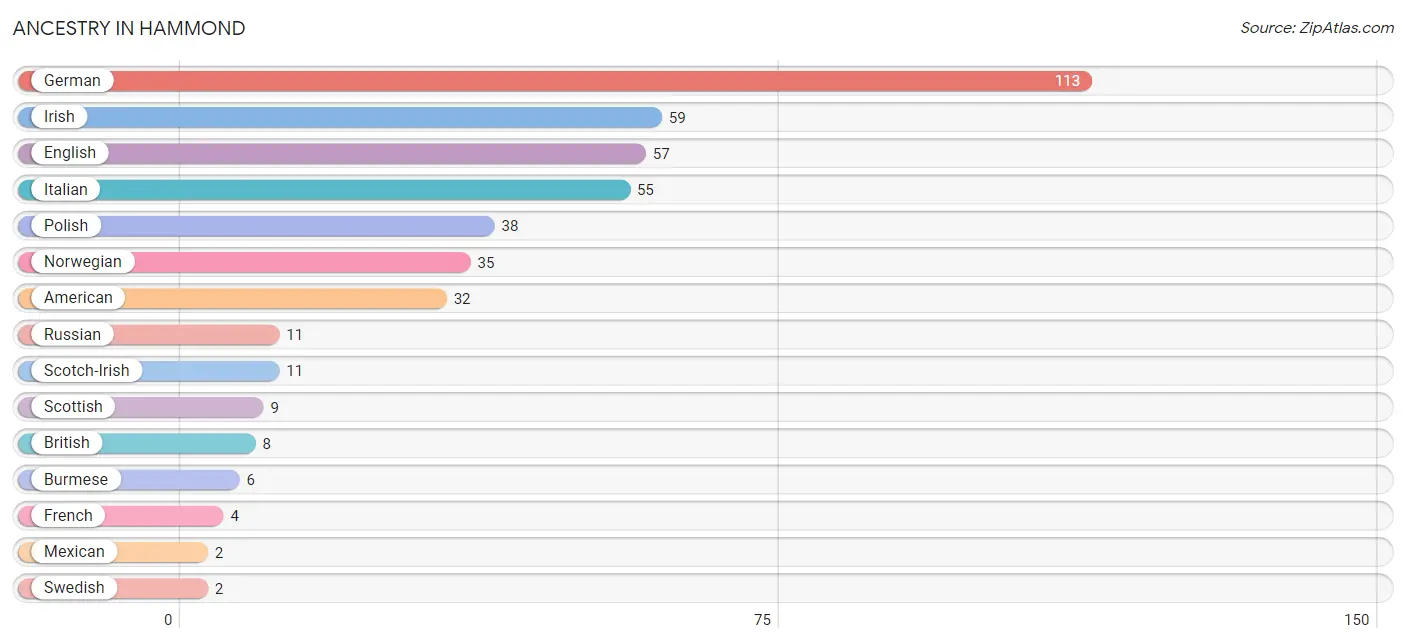
| Ancestry | # Population | % Population |
| American | 32 | 5.9% |
| British | 8 | 1.5% |
| Burmese | 6 | 1.1% |
| Cherokee | 1 | 0.2% |
| English | 57 | 10.4% |
| French | 4 | 0.7% |
| German | 113 | 20.7% |
| Irish | 59 | 10.8% |
| Italian | 55 | 10.1% |
| Mexican | 2 | 0.4% |
| Norwegian | 35 | 6.4% |
| Polish | 38 | 7.0% |
| Russian | 11 | 2.0% |
| Scotch-Irish | 11 | 2.0% |
| Scottish | 9 | 1.7% |
| Sioux | 1 | 0.2% |
| Swedish | 2 | 0.4% |
| Welsh | 2 | 0.4% | View All 18 Rows |
Immigrants in Hammond
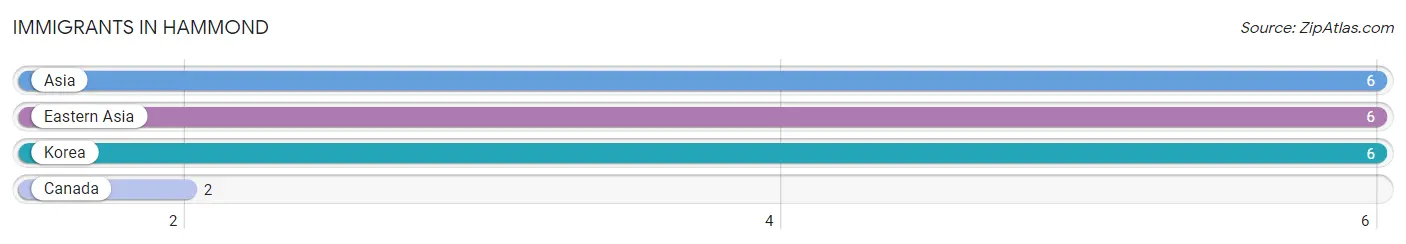
The most numerous immigrant groups reported in Hammond came from Asia (6 | 1.1%), Eastern Asia (6 | 1.1%), Korea (6 | 1.1%), and Canada (2 | 0.4%), together accounting for 3.7% of all Hammond residents.
| Immigration Origin | # Population | % Population |
| Asia | 6 | 1.1% |
| Canada | 2 | 0.4% |
| Eastern Asia | 6 | 1.1% |
| Korea | 6 | 1.1% | View All 4 Rows |
Sex and Age in Hammond
Sex and Age in Hammond
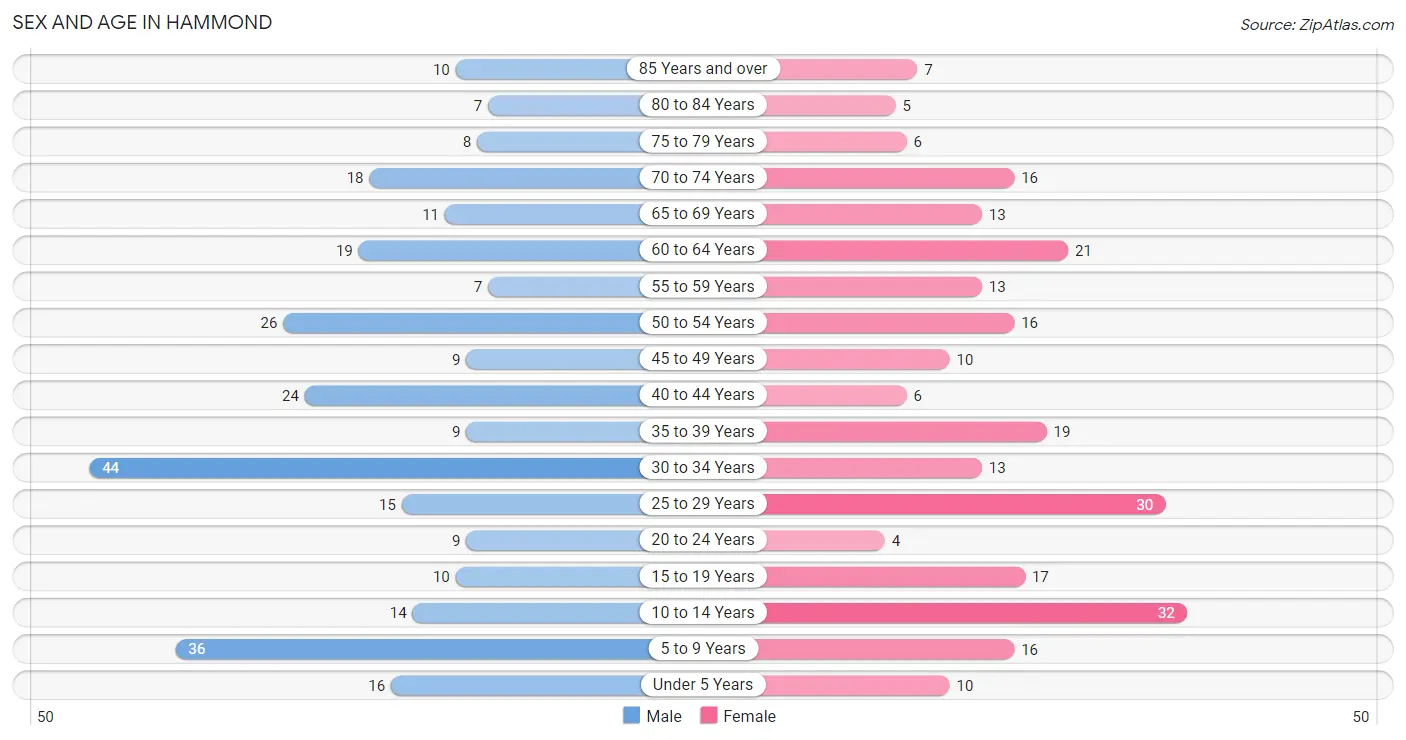
The most populous age groups in Hammond are 30 to 34 Years (44 | 15.1%) for men and 10 to 14 Years (32 | 12.6%) for women.
| Age Bracket | Male | Female |
| Under 5 Years | 16 (5.5%) | 10 (3.9%) |
| 5 to 9 Years | 36 (12.3%) | 16 (6.3%) |
| 10 to 14 Years | 14 (4.8%) | 32 (12.6%) |
| 15 to 19 Years | 10 (3.4%) | 17 (6.7%) |
| 20 to 24 Years | 9 (3.1%) | 4 (1.6%) |
| 25 to 29 Years | 15 (5.1%) | 30 (11.8%) |
| 30 to 34 Years | 44 (15.1%) | 13 (5.1%) |
| 35 to 39 Years | 9 (3.1%) | 19 (7.5%) |
| 40 to 44 Years | 24 (8.2%) | 6 (2.4%) |
| 45 to 49 Years | 9 (3.1%) | 10 (3.9%) |
| 50 to 54 Years | 26 (8.9%) | 16 (6.3%) |
| 55 to 59 Years | 7 (2.4%) | 13 (5.1%) |
| 60 to 64 Years | 19 (6.5%) | 21 (8.3%) |
| 65 to 69 Years | 11 (3.8%) | 13 (5.1%) |
| 70 to 74 Years | 18 (6.2%) | 16 (6.3%) |
| 75 to 79 Years | 8 (2.7%) | 6 (2.4%) |
| 80 to 84 Years | 7 (2.4%) | 5 (2.0%) |
| 85 Years and over | 10 (3.4%) | 7 (2.8%) |
| Total | 292 (100.0%) | 254 (100.0%) |
Families and Households in Hammond
Median Family Size in Hammond
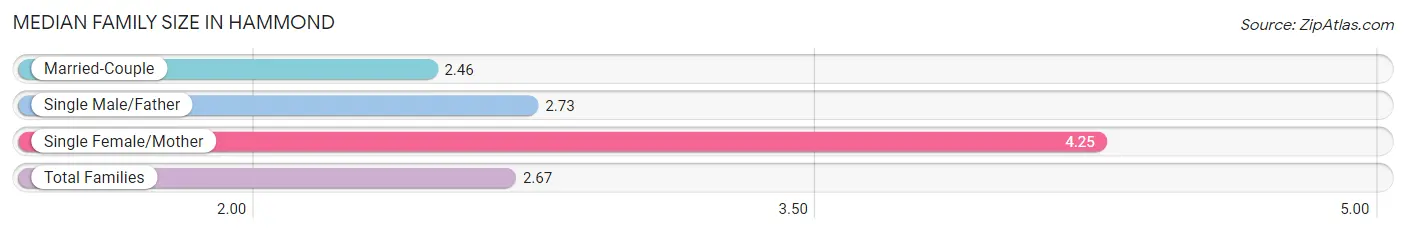
The median family size in Hammond is 2.67 persons per family, with single female/mother families (16 | 10.3%) accounting for the largest median family size of 4.25 persons per family. On the other hand, married-couple families (125 | 80.1%) represent the smallest median family size with 2.46 persons per family.
| Family Type | # Families | Family Size |
| Married-Couple | 125 (80.1%) | 2.46 |
| Single Male/Father | 15 (9.6%) | 2.73 |
| Single Female/Mother | 16 (10.3%) | 4.25 |
| Total Families | 156 (100.0%) | 2.67 |
Median Household Size in Hammond
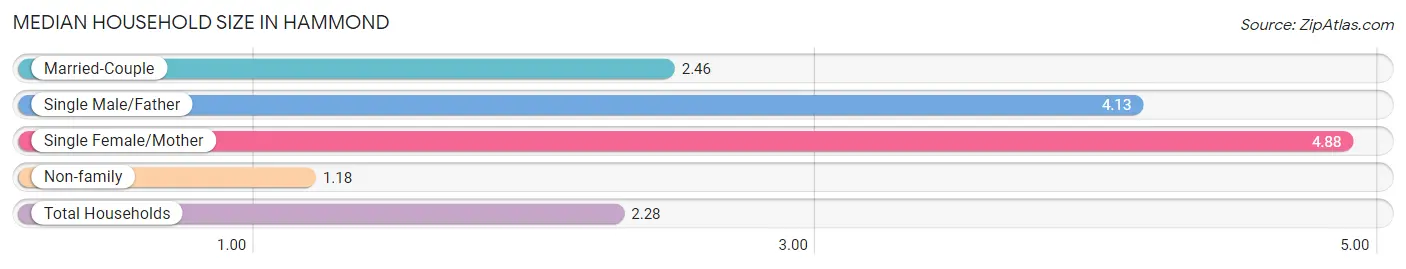
The median household size in Hammond is 2.28 persons per household, with single female/mother households (16 | 6.7%) accounting for the largest median household size of 4.88 persons per household. non-family households (83 | 34.7%) represent the smallest median household size with 1.18 persons per household.
| Household Type | # Households | Household Size |
| Married-Couple | 125 (52.3%) | 2.46 |
| Single Male/Father | 15 (6.3%) | 4.13 |
| Single Female/Mother | 16 (6.7%) | 4.88 |
| Non-family | 83 (34.7%) | 1.18 |
| Total Households | 239 (100.0%) | 2.28 |
Household Size by Marriage Status in Hammond
Out of a total of 239 households in Hammond, 156 (65.3%) are family households, while 83 (34.7%) are nonfamily households. The most numerous type of family households are 2-person households, comprising 87, and the most common type of nonfamily households are 1-person households, comprising 73.
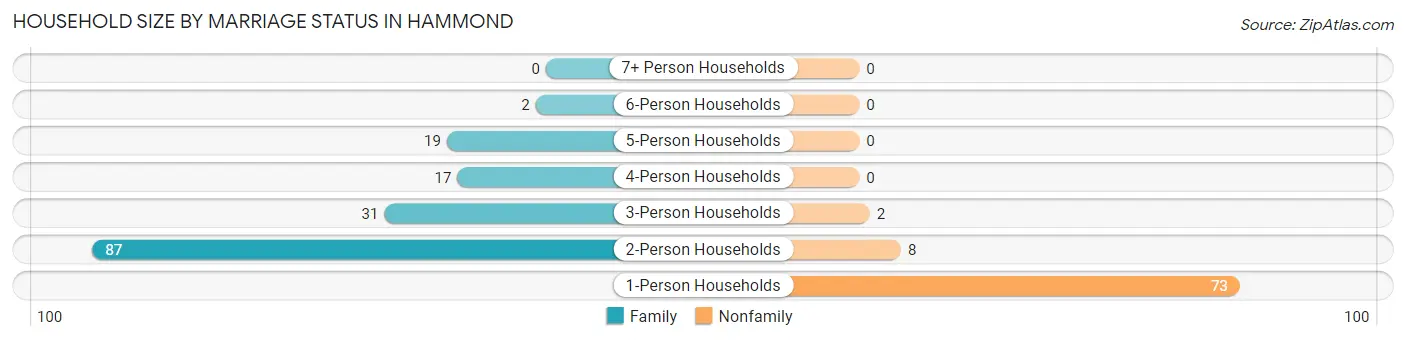
| Household Size | Family Households | Nonfamily Households |
| 1-Person Households | - | 73 (30.5%) |
| 2-Person Households | 87 (36.4%) | 8 (3.4%) |
| 3-Person Households | 31 (13.0%) | 2 (0.8%) |
| 4-Person Households | 17 (7.1%) | 0 (0.0%) |
| 5-Person Households | 19 (8.0%) | 0 (0.0%) |
| 6-Person Households | 2 (0.8%) | 0 (0.0%) |
| 7+ Person Households | 0 (0.0%) | 0 (0.0%) |
| Total | 156 (65.3%) | 83 (34.7%) |
Female Fertility in Hammond
Fertility by Age in Hammond
Average fertility rate in Hammond is 212.0 births per 1,000 women. Women in the age bracket of 20 to 34 years have the highest fertility rate with 298.0 births per 1,000 women. Women in the age bracket of 20 to 34 years acount for 66.7% of all women with births.
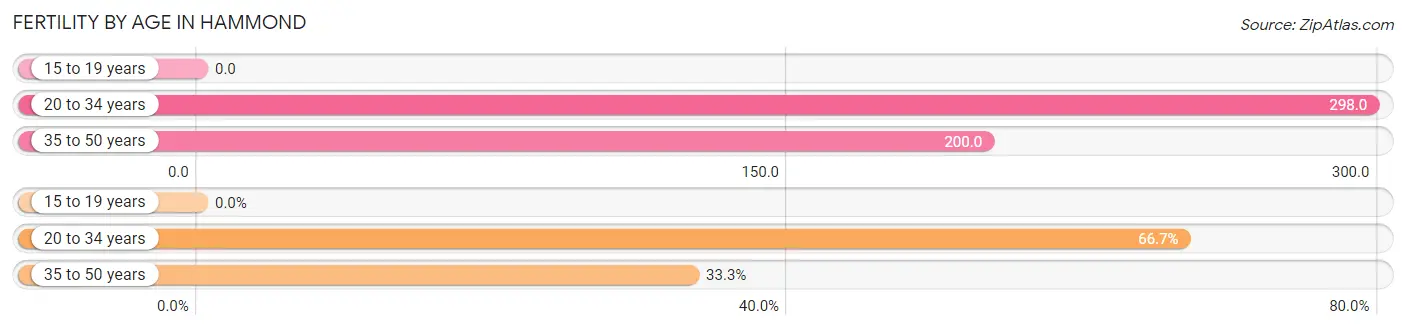
| Age Bracket | Women with Births | Births / 1,000 Women |
| 15 to 19 years | 0 (0.0%) | 0.0 |
| 20 to 34 years | 14 (66.7%) | 298.0 |
| 35 to 50 years | 7 (33.3%) | 200.0 |
| Total | 21 (100.0%) | 212.0 |
Fertility by Age by Marriage Status in Hammond
19.0% of women with births (21) in Hammond are married. The highest percentage of unmarried women with births falls into 35 to 50 years age bracket with 100.0% of them unmarried at the time of birth, while the lowest percentage of unmarried women with births belong to 20 to 34 years age bracket with 71.4% of them unmarried.
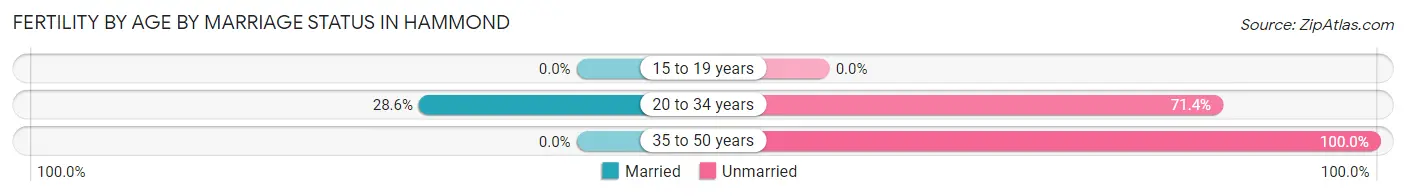
| Age Bracket | Married | Unmarried |
| 15 to 19 years | 0 (0.0%) | 0 (0.0%) |
| 20 to 34 years | 4 (28.6%) | 10 (71.4%) |
| 35 to 50 years | 0 (0.0%) | 7 (100.0%) |
| Total | 4 (19.1%) | 17 (80.9%) |
Fertility by Education in Hammond
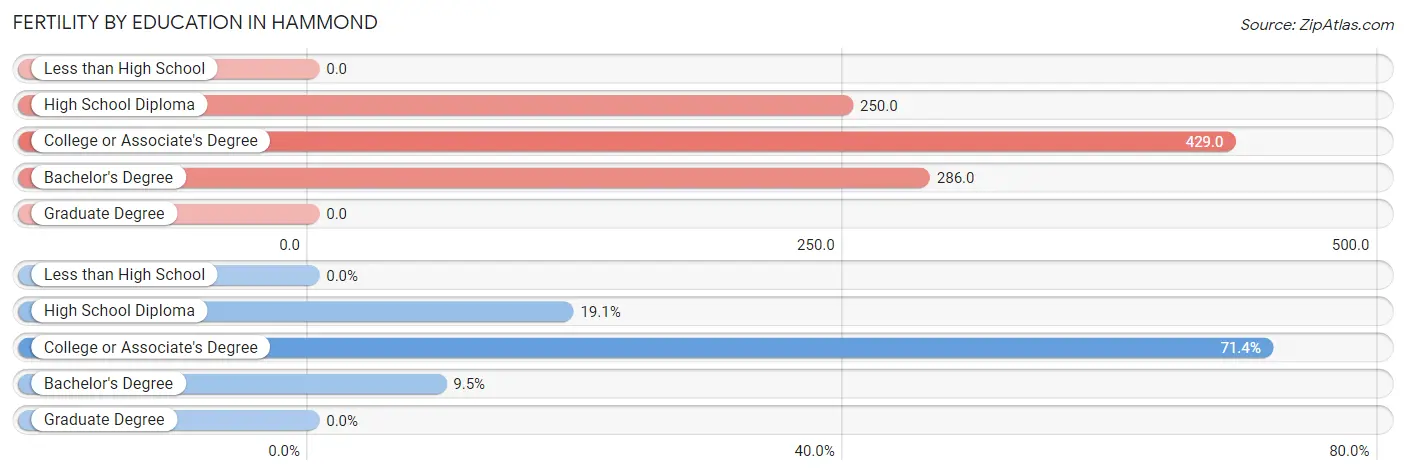
| Educational Attainment | Women with Births | Births / 1,000 Women |
| Less than High School | 0 (0.0%) | 0.0 |
| High School Diploma | 4 (19.1%) | 250.0 |
| College or Associate's Degree | 15 (71.4%) | 429.0 |
| Bachelor's Degree | 2 (9.5%) | 286.0 |
| Graduate Degree | 0 (0.0%) | 0.0 |
| Total | 21 (100.0%) | 212.0 |
Fertility by Education by Marriage Status in Hammond
80.9% of women with births in Hammond are unmarried. Women with the educational attainment of high school diploma are most likely to be married with 100.0% of them married at childbirth, while women with the educational attainment of college or associate's degree are least likely to be married with 100.0% of them unmarried at childbirth.
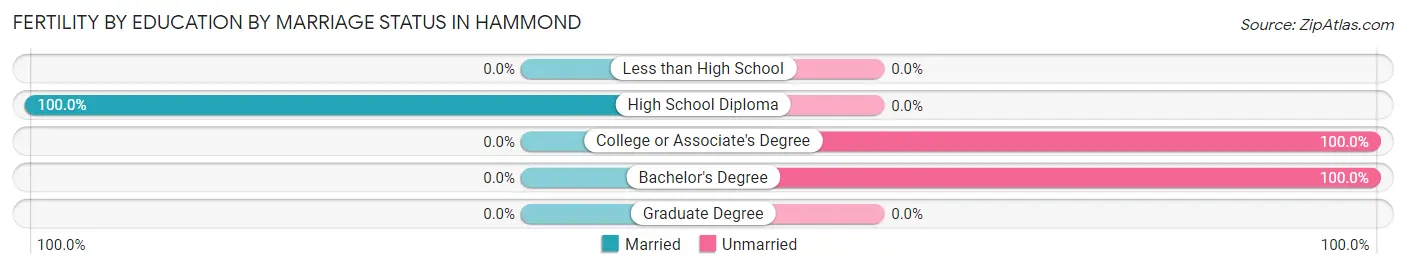
| Educational Attainment | Married | Unmarried |
| Less than High School | 0 (0.0%) | 0 (0.0%) |
| High School Diploma | 4 (100.0%) | 0 (0.0%) |
| College or Associate's Degree | 0 (0.0%) | 15 (100.0%) |
| Bachelor's Degree | 0 (0.0%) | 2 (100.0%) |
| Graduate Degree | 0 (0.0%) | 0 (0.0%) |
| Total | 4 (19.1%) | 17 (80.9%) |
Employment Characteristics in Hammond
Employment by Class of Employer in Hammond
Among the 192 employed individuals in Hammond, private company employees (145 | 75.5%), local government employees (14 | 7.3%), and self-employed (not incorporated) (10 | 5.2%) make up the most common classes of employment.
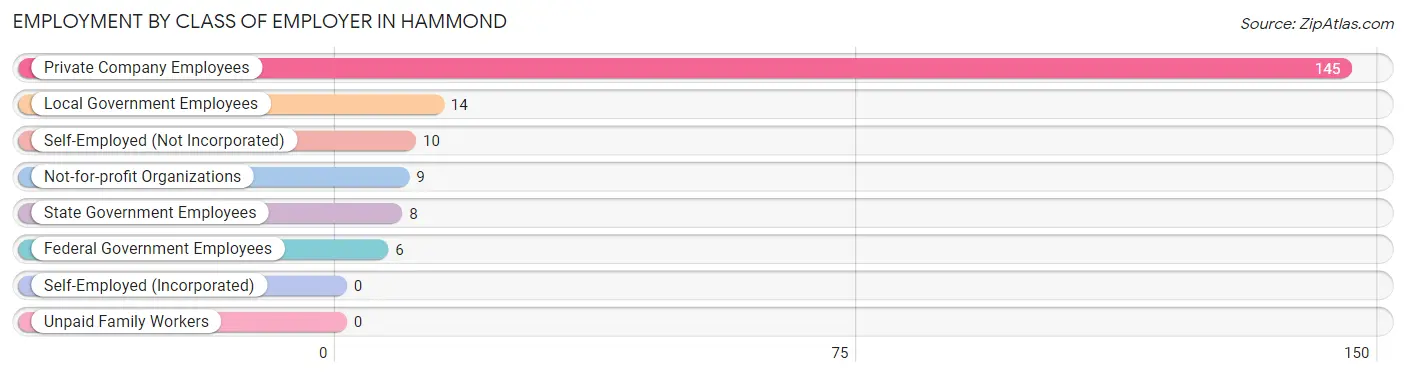
| Employer Class | # Employees | % Employees |
| Private Company Employees | 145 | 75.5% |
| Self-Employed (Incorporated) | 0 | 0.0% |
| Self-Employed (Not Incorporated) | 10 | 5.2% |
| Not-for-profit Organizations | 9 | 4.7% |
| Local Government Employees | 14 | 7.3% |
| State Government Employees | 8 | 4.2% |
| Federal Government Employees | 6 | 3.1% |
| Unpaid Family Workers | 0 | 0.0% |
| Total | 192 | 100.0% |
Employment Status by Age in Hammond
According to the labor force statistics for Hammond, out of the total population over 16 years of age (422), 55.7% or 235 individuals are in the labor force, with 18.3% or 43 of them unemployed. The age group with the highest labor force participation rate is 20 to 24 years, with 100.0% or 13 individuals in the labor force. Within the labor force, the 30 to 34 years age range has the highest percentage of unemployed individuals, with 66.0% or 35 of them being unemployed.
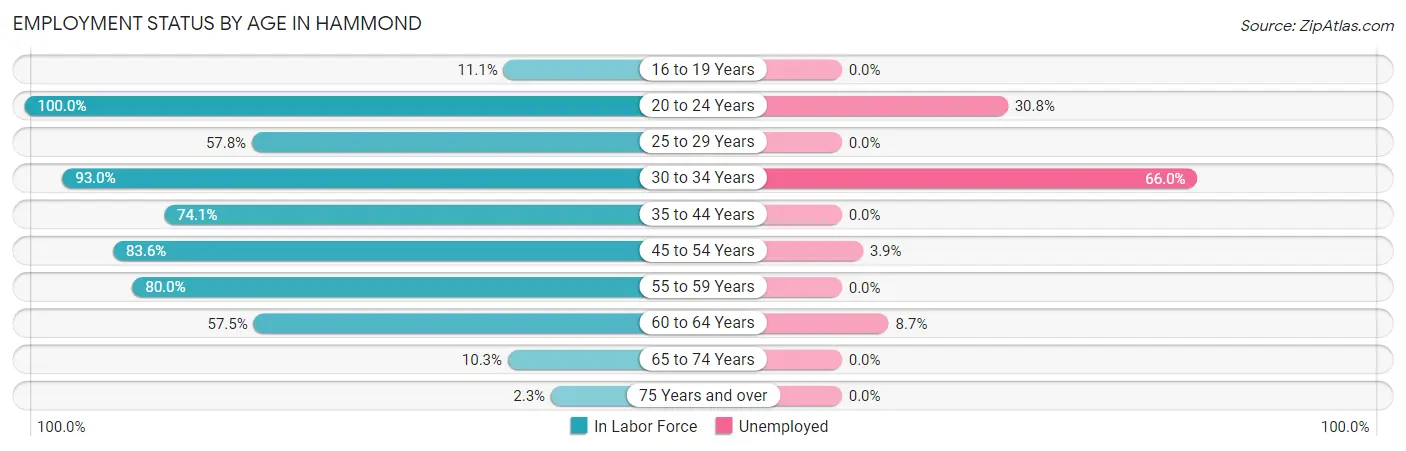
| Age Bracket | In Labor Force | Unemployed |
| 16 to 19 Years | 3 (11.1%) | 0 (0.0%) |
| 20 to 24 Years | 13 (100.0%) | 4 (30.8%) |
| 25 to 29 Years | 26 (57.8%) | 0 (0.0%) |
| 30 to 34 Years | 53 (93.0%) | 35 (66.0%) |
| 35 to 44 Years | 43 (74.1%) | 0 (0.0%) |
| 45 to 54 Years | 51 (83.6%) | 2 (3.9%) |
| 55 to 59 Years | 16 (80.0%) | 0 (0.0%) |
| 60 to 64 Years | 23 (57.5%) | 2 (8.7%) |
| 65 to 74 Years | 6 (10.3%) | 0 (0.0%) |
| 75 Years and over | 1 (2.3%) | 0 (0.0%) |
| Total | 235 (55.7%) | 43 (18.3%) |
Employment Status by Educational Attainment in Hammond
According to labor force statistics for Hammond, 75.4% of individuals (212) out of the total population between 25 and 64 years of age (281) are in the labor force, with 18.4% or 39 of them being unemployed. The group with the highest labor force participation rate are those with the educational attainment of bachelor's degree or higher, with 95.9% or 70 individuals in the labor force. Within the labor force, individuals with bachelor's degree or higher education have the highest percentage of unemployment, with 55.7% or 39 of them being unemployed.
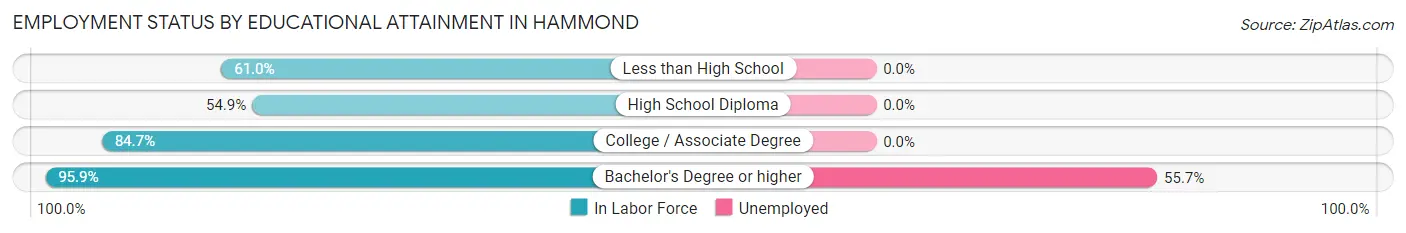
| Educational Attainment | In Labor Force | Unemployed |
| Less than High School | 25 (61.0%) | 0 (0.0%) |
| High School Diploma | 45 (54.9%) | 0 (0.0%) |
| College / Associate Degree | 72 (84.7%) | 0 (0.0%) |
| Bachelor's Degree or higher | 70 (95.9%) | 41 (55.7%) |
| Total | 212 (75.4%) | 52 (18.4%) |
Employment Occupations by Sex in Hammond
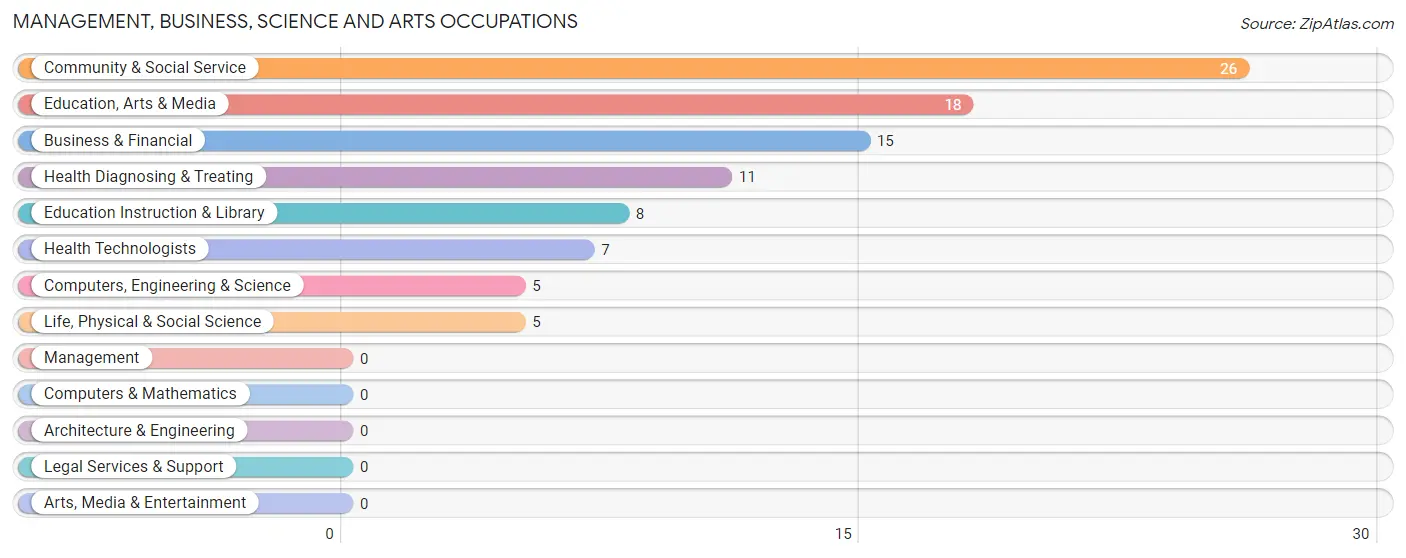
Management, Business, Science and Arts Occupations
The most common Management, Business, Science and Arts occupations in Hammond are Community & Social Service (26 | 13.5%), Education, Arts & Media (18 | 9.4%), Business & Financial (15 | 7.8%), Health Diagnosing & Treating (11 | 5.7%), and Education Instruction & Library (8 | 4.2%).
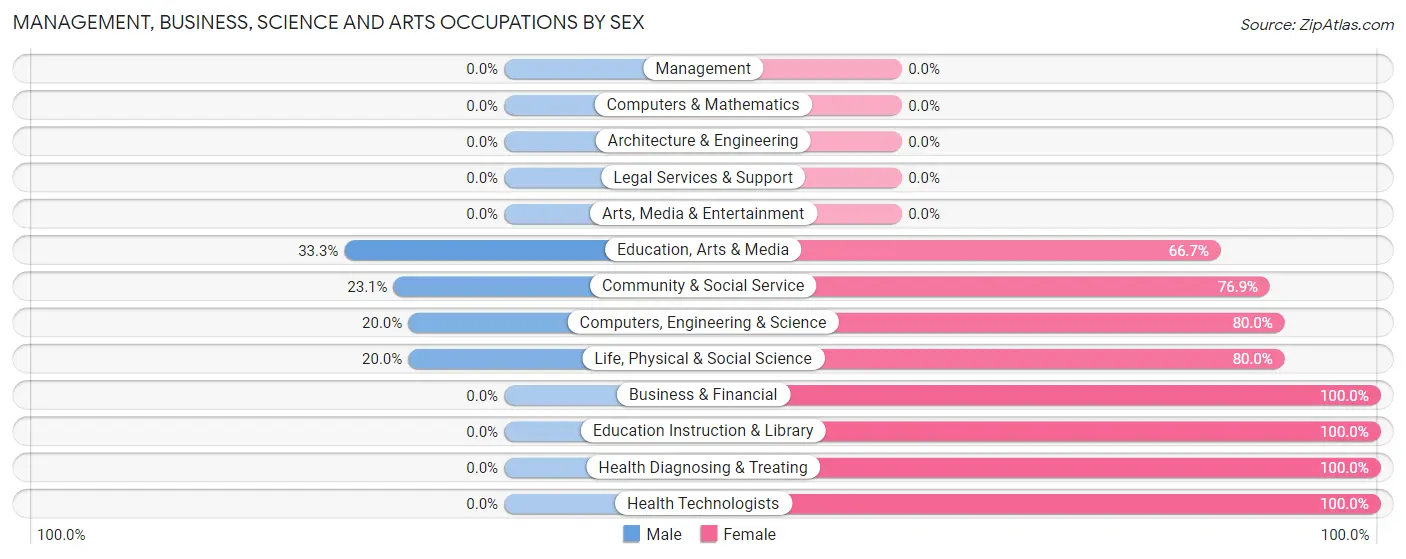
Management, Business, Science and Arts Occupations by Sex
Within the Management, Business, Science and Arts occupations in Hammond, the most male-oriented occupations are Education, Arts & Media (33.3%), Community & Social Service (23.1%), and Computers, Engineering & Science (20.0%), while the most female-oriented occupations are Business & Financial (100.0%), Education Instruction & Library (100.0%), and Health Diagnosing & Treating (100.0%).
| Occupation | Male | Female |
| Management | 0 (0.0%) | 0 (0.0%) |
| Business & Financial | 0 (0.0%) | 15 (100.0%) |
| Computers, Engineering & Science | 1 (20.0%) | 4 (80.0%) |
| Computers & Mathematics | 0 (0.0%) | 0 (0.0%) |
| Architecture & Engineering | 0 (0.0%) | 0 (0.0%) |
| Life, Physical & Social Science | 1 (20.0%) | 4 (80.0%) |
| Community & Social Service | 6 (23.1%) | 20 (76.9%) |
| Education, Arts & Media | 6 (33.3%) | 12 (66.7%) |
| Legal Services & Support | 0 (0.0%) | 0 (0.0%) |
| Education Instruction & Library | 0 (0.0%) | 8 (100.0%) |
| Arts, Media & Entertainment | 0 (0.0%) | 0 (0.0%) |
| Health Diagnosing & Treating | 0 (0.0%) | 11 (100.0%) |
| Health Technologists | 0 (0.0%) | 7 (100.0%) |
| Total (Category) | 7 (12.3%) | 50 (87.7%) |
| Total (Overall) | 101 (52.6%) | 91 (47.4%) |
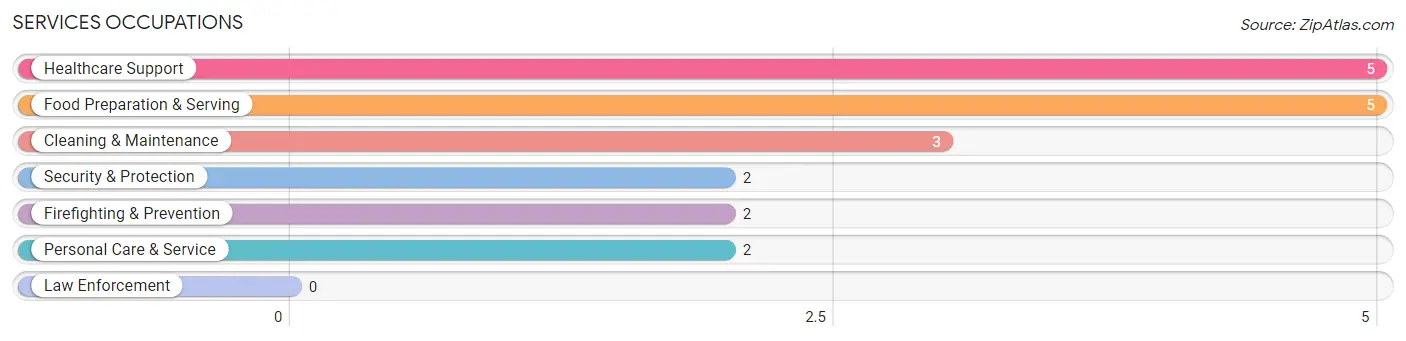
Services Occupations
The most common Services occupations in Hammond are Healthcare Support (5 | 2.6%), Food Preparation & Serving (5 | 2.6%), Cleaning & Maintenance (3 | 1.6%), Security & Protection (2 | 1.0%), and Firefighting & Prevention (2 | 1.0%).
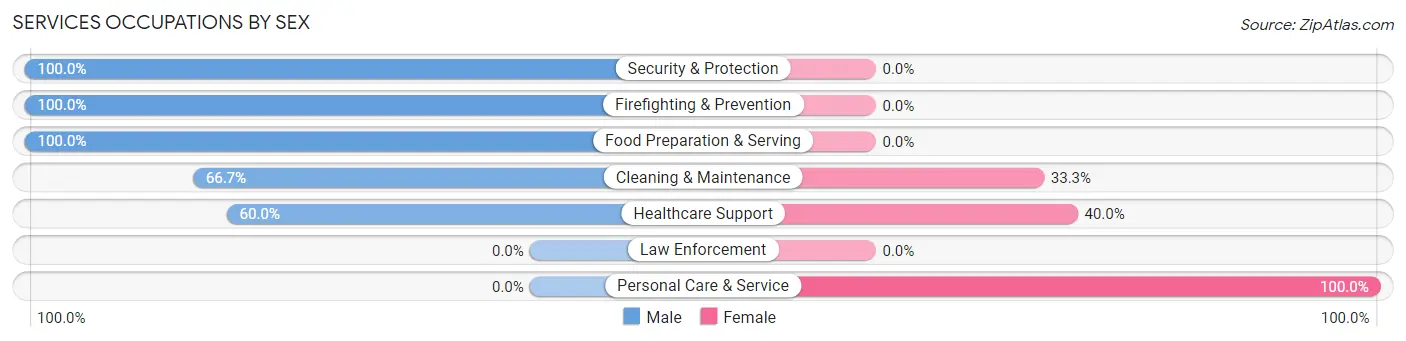
Services Occupations by Sex
Within the Services occupations in Hammond, the most male-oriented occupations are Security & Protection (100.0%), Firefighting & Prevention (100.0%), and Food Preparation & Serving (100.0%), while the most female-oriented occupations are Personal Care & Service (100.0%), Healthcare Support (40.0%), and Cleaning & Maintenance (33.3%).
| Occupation | Male | Female |
| Healthcare Support | 3 (60.0%) | 2 (40.0%) |
| Security & Protection | 2 (100.0%) | 0 (0.0%) |
| Firefighting & Prevention | 2 (100.0%) | 0 (0.0%) |
| Law Enforcement | 0 (0.0%) | 0 (0.0%) |
| Food Preparation & Serving | 5 (100.0%) | 0 (0.0%) |
| Cleaning & Maintenance | 2 (66.7%) | 1 (33.3%) |
| Personal Care & Service | 0 (0.0%) | 2 (100.0%) |
| Total (Category) | 12 (70.6%) | 5 (29.4%) |
| Total (Overall) | 101 (52.6%) | 91 (47.4%) |
Sales and Office Occupations
The most common Sales and Office occupations in Hammond are Office & Administration (18 | 9.4%), and Sales & Related (14 | 7.3%).
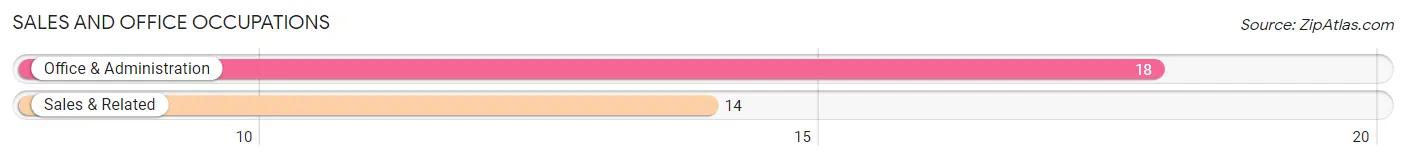
Sales and Office Occupations by Sex
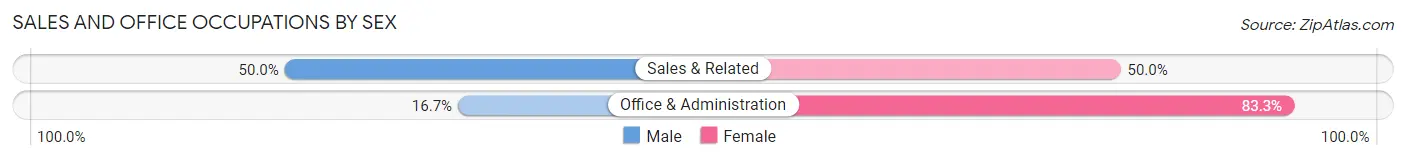
| Occupation | Male | Female |
| Sales & Related | 7 (50.0%) | 7 (50.0%) |
| Office & Administration | 3 (16.7%) | 15 (83.3%) |
| Total (Category) | 10 (31.2%) | 22 (68.8%) |
| Total (Overall) | 101 (52.6%) | 91 (47.4%) |
Natural Resources, Construction and Maintenance Occupations
The most common Natural Resources, Construction and Maintenance occupations in Hammond are Installation, Maintenance & Repair (22 | 11.5%), Construction & Extraction (18 | 9.4%), and Farming, Fishing & Forestry (2 | 1.0%).
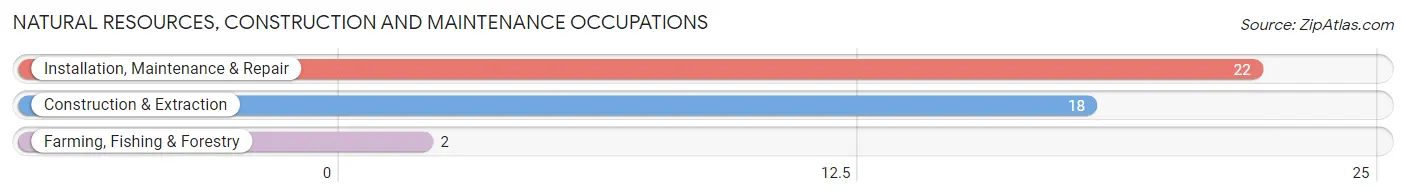
Natural Resources, Construction and Maintenance Occupations by Sex
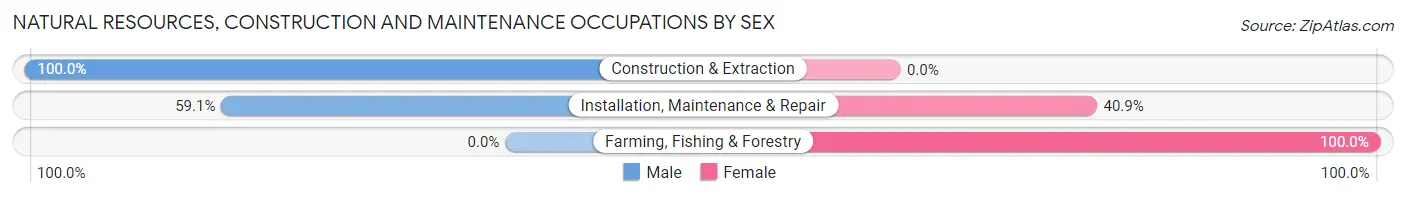
| Occupation | Male | Female |
| Farming, Fishing & Forestry | 0 (0.0%) | 2 (100.0%) |
| Construction & Extraction | 18 (100.0%) | 0 (0.0%) |
| Installation, Maintenance & Repair | 13 (59.1%) | 9 (40.9%) |
| Total (Category) | 31 (73.8%) | 11 (26.2%) |
| Total (Overall) | 101 (52.6%) | 91 (47.4%) |
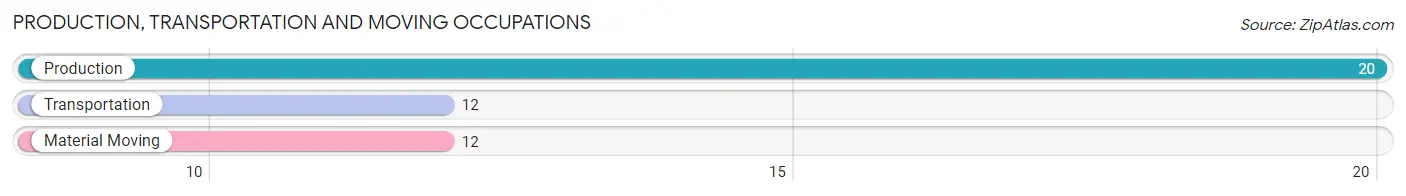
Production, Transportation and Moving Occupations
The most common Production, Transportation and Moving occupations in Hammond are Production (20 | 10.4%), Transportation (12 | 6.2%), and Material Moving (12 | 6.2%).
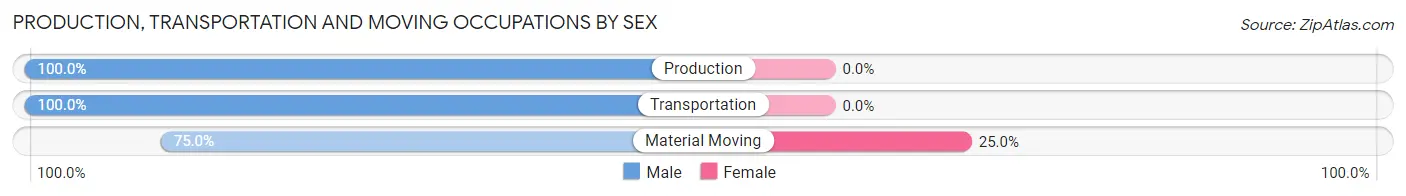
Production, Transportation and Moving Occupations by Sex
| Occupation | Male | Female |
| Production | 20 (100.0%) | 0 (0.0%) |
| Transportation | 12 (100.0%) | 0 (0.0%) |
| Material Moving | 9 (75.0%) | 3 (25.0%) |
| Total (Category) | 41 (93.2%) | 3 (6.8%) |
| Total (Overall) | 101 (52.6%) | 91 (47.4%) |
Employment Industries by Sex in Hammond
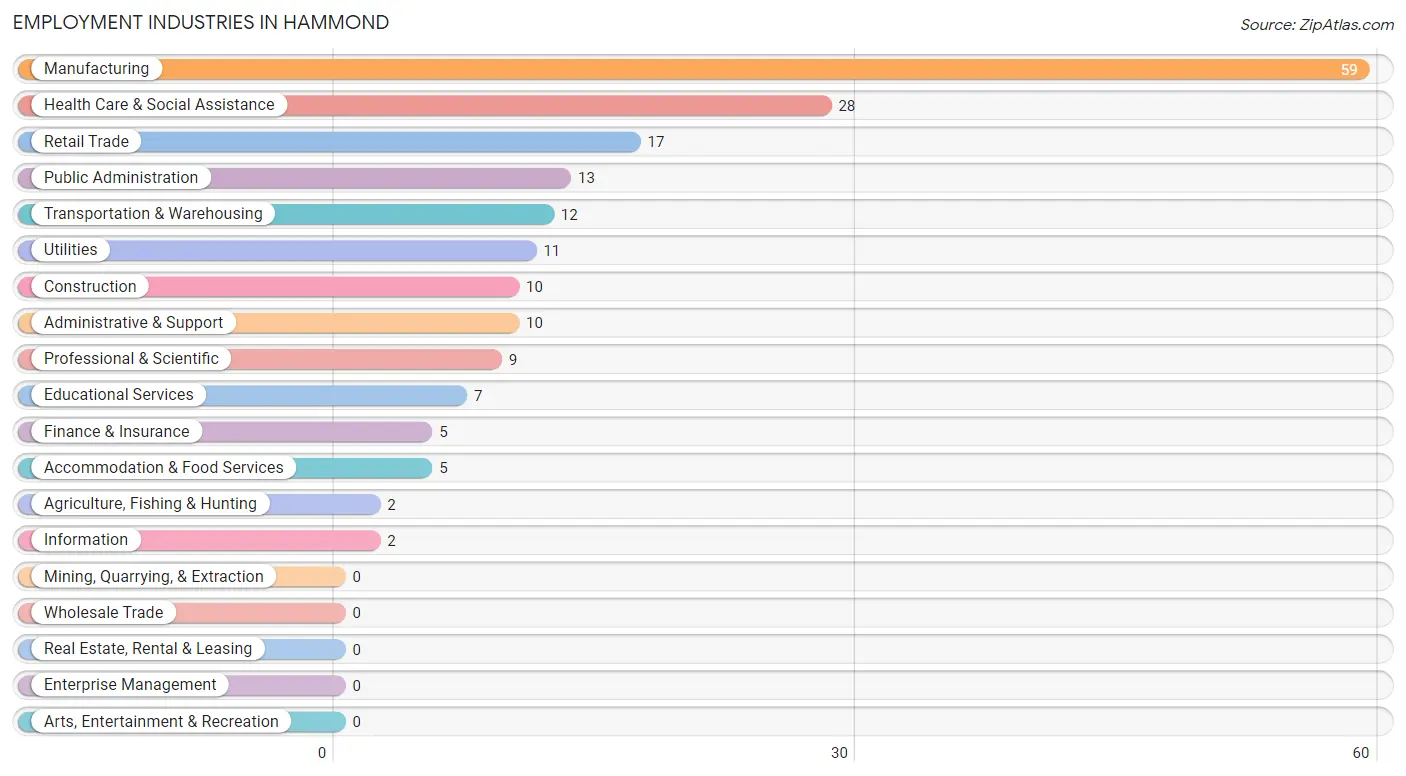
Employment Industries in Hammond
The major employment industries in Hammond include Manufacturing (59 | 30.7%), Health Care & Social Assistance (28 | 14.6%), Retail Trade (17 | 8.8%), Public Administration (13 | 6.8%), and Transportation & Warehousing (12 | 6.2%).
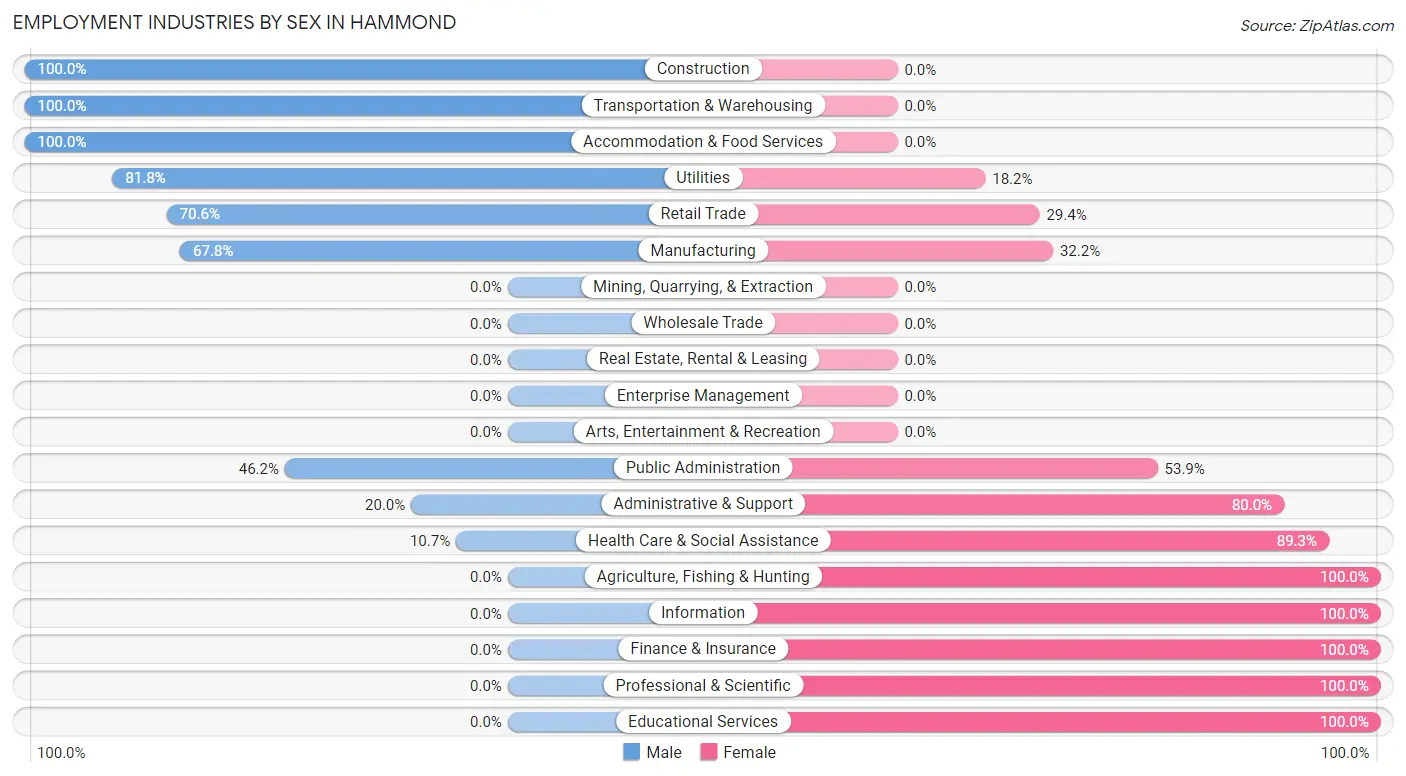
Employment Industries by Sex in Hammond
The Hammond industries that see more men than women are Construction (100.0%), Transportation & Warehousing (100.0%), and Accommodation & Food Services (100.0%), whereas the industries that tend to have a higher number of women are Agriculture, Fishing & Hunting (100.0%), Information (100.0%), and Finance & Insurance (100.0%).
| Industry | Male | Female |
| Agriculture, Fishing & Hunting | 0 (0.0%) | 2 (100.0%) |
| Mining, Quarrying, & Extraction | 0 (0.0%) | 0 (0.0%) |
| Construction | 10 (100.0%) | 0 (0.0%) |
| Manufacturing | 40 (67.8%) | 19 (32.2%) |
| Wholesale Trade | 0 (0.0%) | 0 (0.0%) |
| Retail Trade | 12 (70.6%) | 5 (29.4%) |
| Transportation & Warehousing | 12 (100.0%) | 0 (0.0%) |
| Utilities | 9 (81.8%) | 2 (18.2%) |
| Information | 0 (0.0%) | 2 (100.0%) |
| Finance & Insurance | 0 (0.0%) | 5 (100.0%) |
| Real Estate, Rental & Leasing | 0 (0.0%) | 0 (0.0%) |
| Professional & Scientific | 0 (0.0%) | 9 (100.0%) |
| Enterprise Management | 0 (0.0%) | 0 (0.0%) |
| Administrative & Support | 2 (20.0%) | 8 (80.0%) |
| Educational Services | 0 (0.0%) | 7 (100.0%) |
| Health Care & Social Assistance | 3 (10.7%) | 25 (89.3%) |
| Arts, Entertainment & Recreation | 0 (0.0%) | 0 (0.0%) |
| Accommodation & Food Services | 5 (100.0%) | 0 (0.0%) |
| Public Administration | 6 (46.2%) | 7 (53.8%) |
| Total | 101 (52.6%) | 91 (47.4%) |
Education in Hammond
School Enrollment in Hammond
The most common levels of schooling among the 140 students in Hammond are elementary school (46 | 32.9%), middle school (40 | 28.6%), and high school (28 | 20.0%).
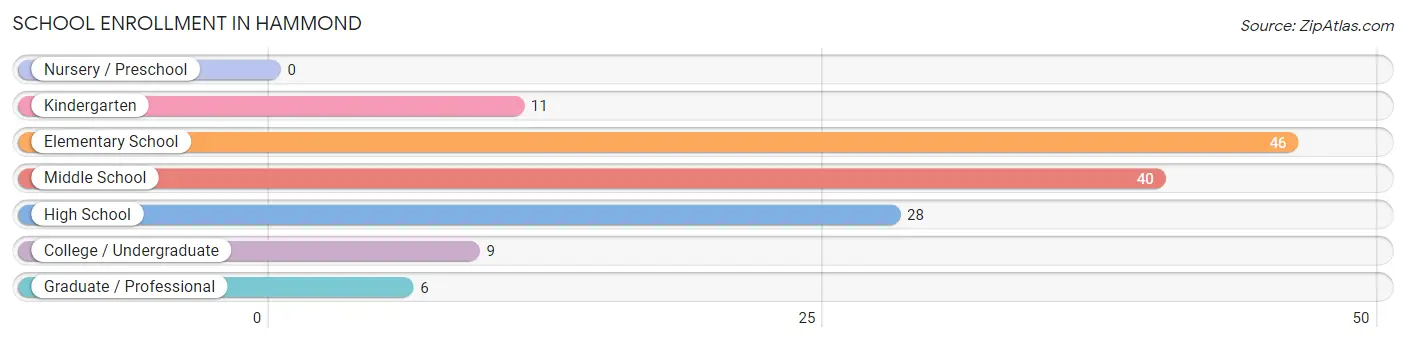
| School Level | # Students | % Students |
| Nursery / Preschool | 0 | 0.0% |
| Kindergarten | 11 | 7.9% |
| Elementary School | 46 | 32.9% |
| Middle School | 40 | 28.6% |
| High School | 28 | 20.0% |
| College / Undergraduate | 9 | 6.4% |
| Graduate / Professional | 6 | 4.3% |
| Total | 140 | 100.0% |
School Enrollment by Age by Funding Source in Hammond
Out of a total of 140 students who are enrolled in schools in Hammond, 29 (20.7%) attend a private institution, while the remaining 111 (79.3%) are enrolled in public schools. The age group of 18 to 19 year olds has the highest likelihood of being enrolled in private schools, with 3 (60.0% in the age bracket) enrolled. Conversely, the age group of 10 to 14 year olds has the lowest likelihood of being enrolled in a private school, with 46 (100.0% in the age bracket) attending a public institution.
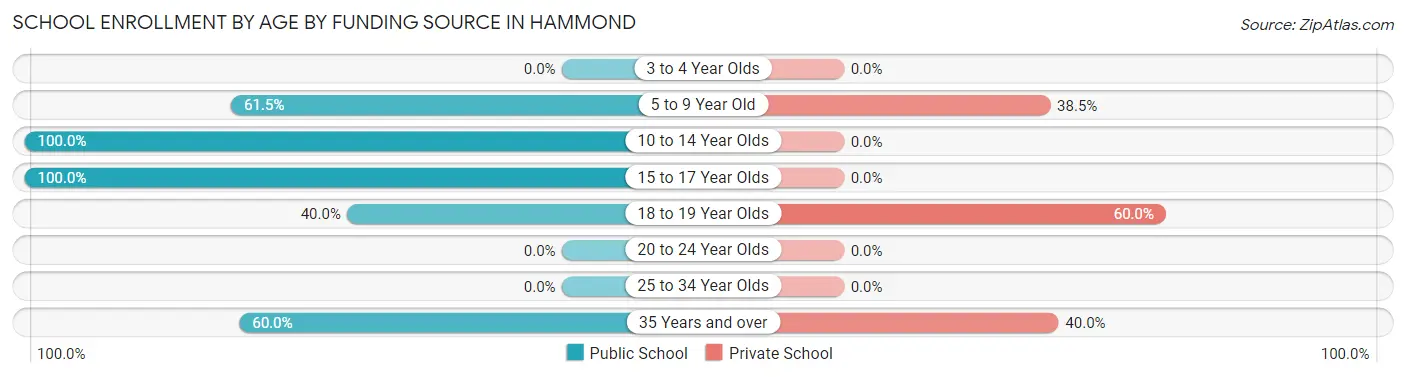
| Age Bracket | Public School | Private School |
| 3 to 4 Year Olds | 0 (0.0%) | 0 (0.0%) |
| 5 to 9 Year Old | 32 (61.5%) | 20 (38.5%) |
| 10 to 14 Year Olds | 46 (100.0%) | 0 (0.0%) |
| 15 to 17 Year Olds | 22 (100.0%) | 0 (0.0%) |
| 18 to 19 Year Olds | 2 (40.0%) | 3 (60.0%) |
| 20 to 24 Year Olds | 0 (0.0%) | 0 (0.0%) |
| 25 to 34 Year Olds | 0 (0.0%) | 0 (0.0%) |
| 35 Years and over | 9 (60.0%) | 6 (40.0%) |
| Total | 111 (79.3%) | 29 (20.7%) |
Educational Attainment by Field of Study in Hammond
Arts & humanities (43 | 53.1%), science & technology (12 | 14.8%), education (12 | 14.8%), bio, nature & agricultural (5 | 6.2%), and liberal arts & history (3 | 3.7%) are the most common fields of study among 81 individuals in Hammond who have obtained a bachelor's degree or higher.
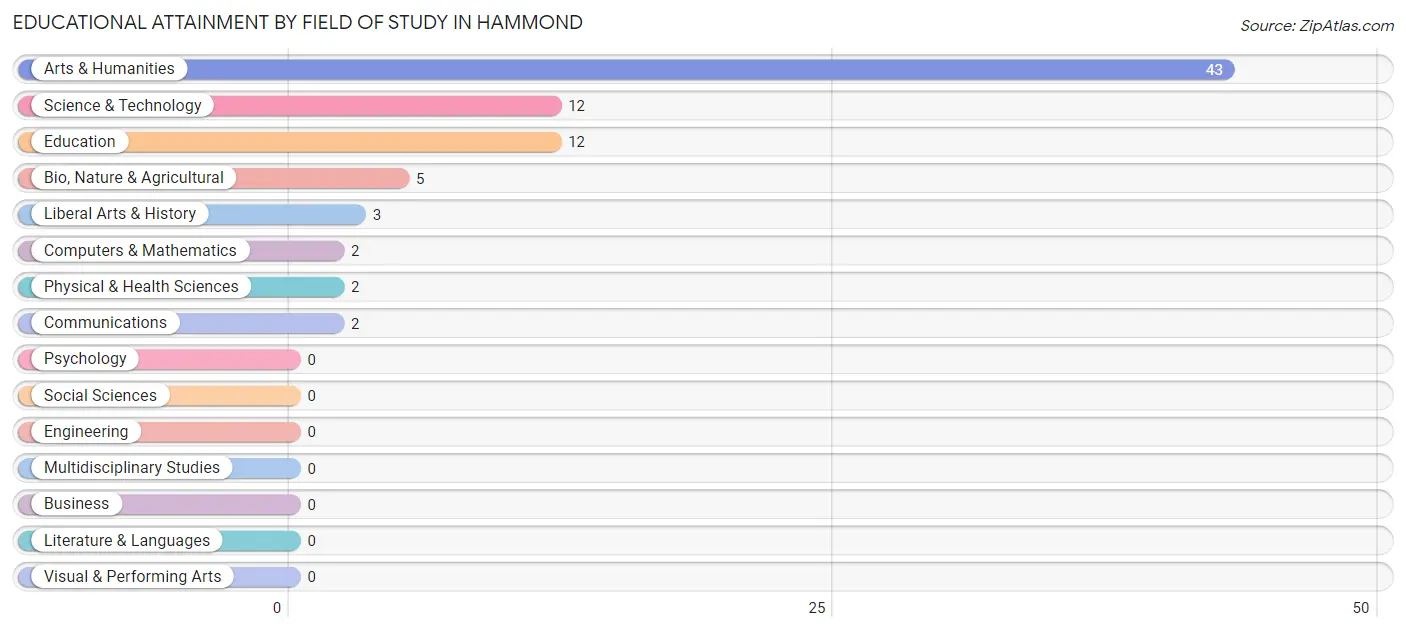
| Field of Study | # Graduates | % Graduates |
| Computers & Mathematics | 2 | 2.5% |
| Bio, Nature & Agricultural | 5 | 6.2% |
| Physical & Health Sciences | 2 | 2.5% |
| Psychology | 0 | 0.0% |
| Social Sciences | 0 | 0.0% |
| Engineering | 0 | 0.0% |
| Multidisciplinary Studies | 0 | 0.0% |
| Science & Technology | 12 | 14.8% |
| Business | 0 | 0.0% |
| Education | 12 | 14.8% |
| Literature & Languages | 0 | 0.0% |
| Liberal Arts & History | 3 | 3.7% |
| Visual & Performing Arts | 0 | 0.0% |
| Communications | 2 | 2.5% |
| Arts & Humanities | 43 | 53.1% |
| Total | 81 | 100.0% |
Transportation & Commute in Hammond
Vehicle Availability by Sex in Hammond
The most prevalent vehicle ownership categories in Hammond are males with 2 vehicles (39, accounting for 38.6%) and females with 2 vehicles (39, making up 42.9%).
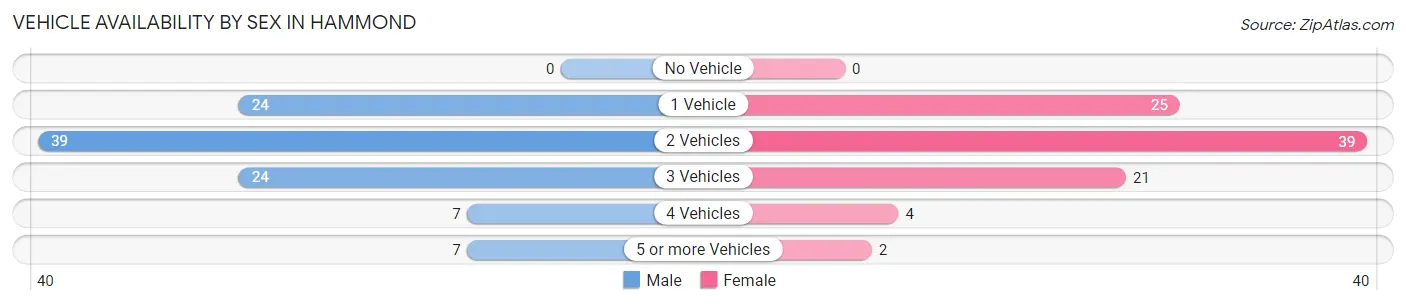
| Vehicles Available | Male | Female |
| No Vehicle | 0 (0.0%) | 0 (0.0%) |
| 1 Vehicle | 24 (23.8%) | 25 (27.5%) |
| 2 Vehicles | 39 (38.6%) | 39 (42.9%) |
| 3 Vehicles | 24 (23.8%) | 21 (23.1%) |
| 4 Vehicles | 7 (6.9%) | 4 (4.4%) |
| 5 or more Vehicles | 7 (6.9%) | 2 (2.2%) |
| Total | 101 (100.0%) | 91 (100.0%) |
Commute Time in Hammond
The most frequently occuring commute durations in Hammond are 30 to 34 minutes (45 commuters, 24.9%), 15 to 19 minutes (22 commuters, 12.1%), and 10 to 14 minutes (19 commuters, 10.5%).
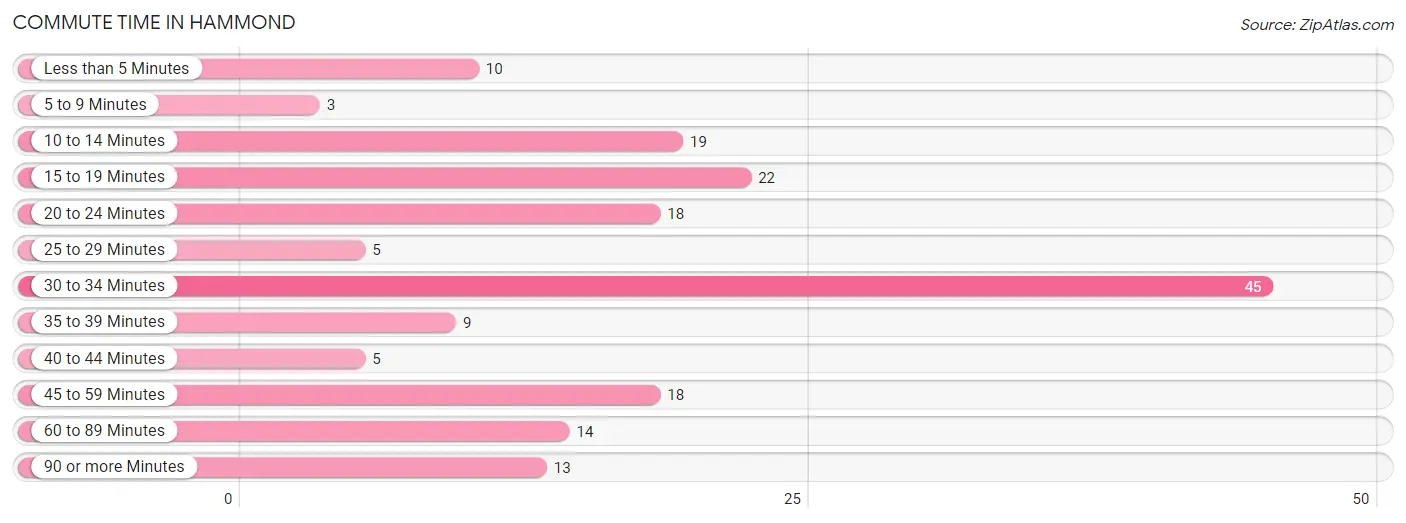
| Commute Time | # Commuters | % Commuters |
| Less than 5 Minutes | 10 | 5.5% |
| 5 to 9 Minutes | 3 | 1.7% |
| 10 to 14 Minutes | 19 | 10.5% |
| 15 to 19 Minutes | 22 | 12.1% |
| 20 to 24 Minutes | 18 | 9.9% |
| 25 to 29 Minutes | 5 | 2.8% |
| 30 to 34 Minutes | 45 | 24.9% |
| 35 to 39 Minutes | 9 | 5.0% |
| 40 to 44 Minutes | 5 | 2.8% |
| 45 to 59 Minutes | 18 | 9.9% |
| 60 to 89 Minutes | 14 | 7.7% |
| 90 or more Minutes | 13 | 7.2% |
Commute Time by Sex in Hammond
The most common commute times in Hammond are 30 to 34 minutes (28 commuters, 27.7%) for males and 30 to 34 minutes (17 commuters, 21.2%) for females.
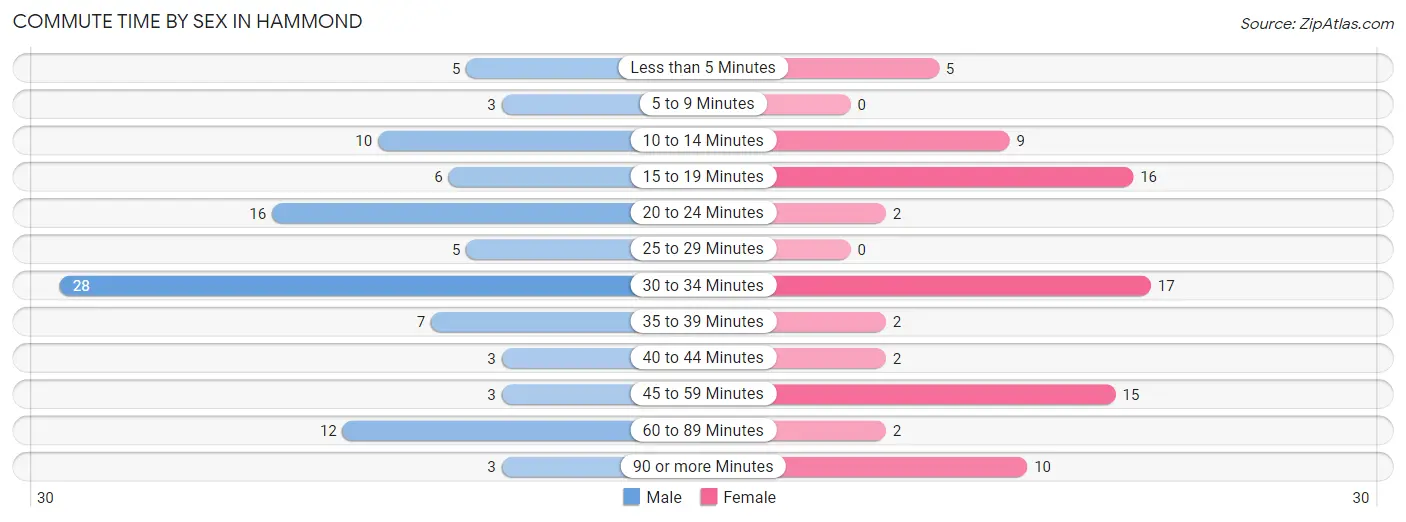
| Commute Time | Male | Female |
| Less than 5 Minutes | 5 (5.0%) | 5 (6.2%) |
| 5 to 9 Minutes | 3 (3.0%) | 0 (0.0%) |
| 10 to 14 Minutes | 10 (9.9%) | 9 (11.3%) |
| 15 to 19 Minutes | 6 (5.9%) | 16 (20.0%) |
| 20 to 24 Minutes | 16 (15.8%) | 2 (2.5%) |
| 25 to 29 Minutes | 5 (5.0%) | 0 (0.0%) |
| 30 to 34 Minutes | 28 (27.7%) | 17 (21.2%) |
| 35 to 39 Minutes | 7 (6.9%) | 2 (2.5%) |
| 40 to 44 Minutes | 3 (3.0%) | 2 (2.5%) |
| 45 to 59 Minutes | 3 (3.0%) | 15 (18.8%) |
| 60 to 89 Minutes | 12 (11.9%) | 2 (2.5%) |
| 90 or more Minutes | 3 (3.0%) | 10 (12.5%) |
Time of Departure to Work by Sex in Hammond
The most frequent times of departure to work in Hammond are 5:00 AM to 5:29 AM (17, 16.8%) for males and 7:00 AM to 7:29 AM (20, 25.0%) for females.
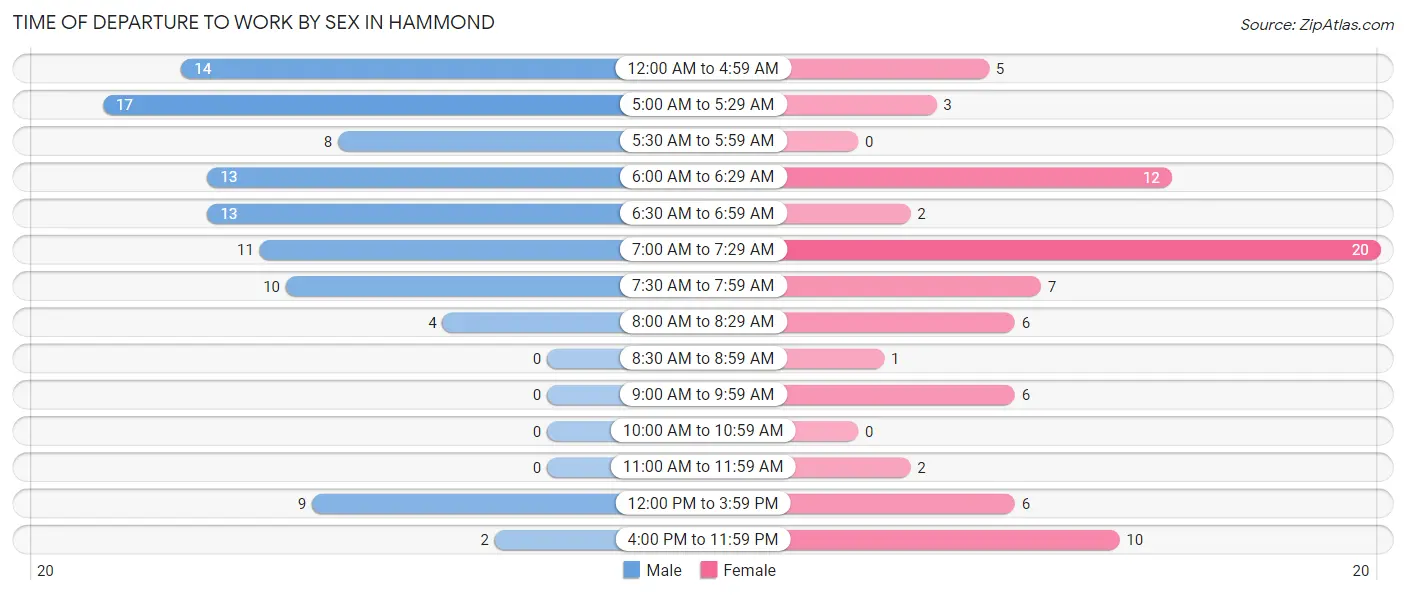
| Time of Departure | Male | Female |
| 12:00 AM to 4:59 AM | 14 (13.9%) | 5 (6.2%) |
| 5:00 AM to 5:29 AM | 17 (16.8%) | 3 (3.7%) |
| 5:30 AM to 5:59 AM | 8 (7.9%) | 0 (0.0%) |
| 6:00 AM to 6:29 AM | 13 (12.9%) | 12 (15.0%) |
| 6:30 AM to 6:59 AM | 13 (12.9%) | 2 (2.5%) |
| 7:00 AM to 7:29 AM | 11 (10.9%) | 20 (25.0%) |
| 7:30 AM to 7:59 AM | 10 (9.9%) | 7 (8.7%) |
| 8:00 AM to 8:29 AM | 4 (4.0%) | 6 (7.5%) |
| 8:30 AM to 8:59 AM | 0 (0.0%) | 1 (1.3%) |
| 9:00 AM to 9:59 AM | 0 (0.0%) | 6 (7.5%) |
| 10:00 AM to 10:59 AM | 0 (0.0%) | 0 (0.0%) |
| 11:00 AM to 11:59 AM | 0 (0.0%) | 2 (2.5%) |
| 12:00 PM to 3:59 PM | 9 (8.9%) | 6 (7.5%) |
| 4:00 PM to 11:59 PM | 2 (2.0%) | 10 (12.5%) |
| Total | 101 (100.0%) | 80 (100.0%) |
Housing Occupancy in Hammond
Occupancy by Ownership in Hammond
Of the total 239 dwellings in Hammond, owner-occupied units account for 193 (80.7%), while renter-occupied units make up 46 (19.3%).
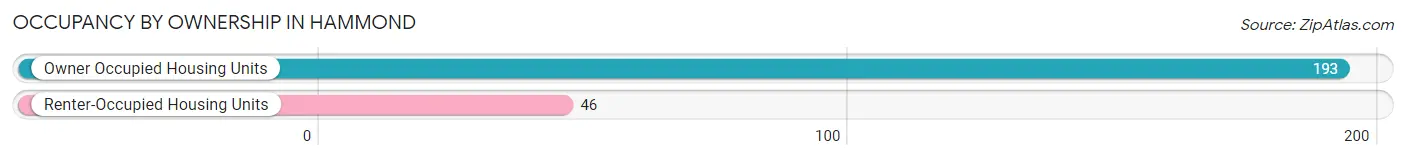
| Occupancy | # Housing Units | % Housing Units |
| Owner Occupied Housing Units | 193 | 80.7% |
| Renter-Occupied Housing Units | 46 | 19.3% |
| Total Occupied Housing Units | 239 | 100.0% |
Occupancy by Household Size in Hammond
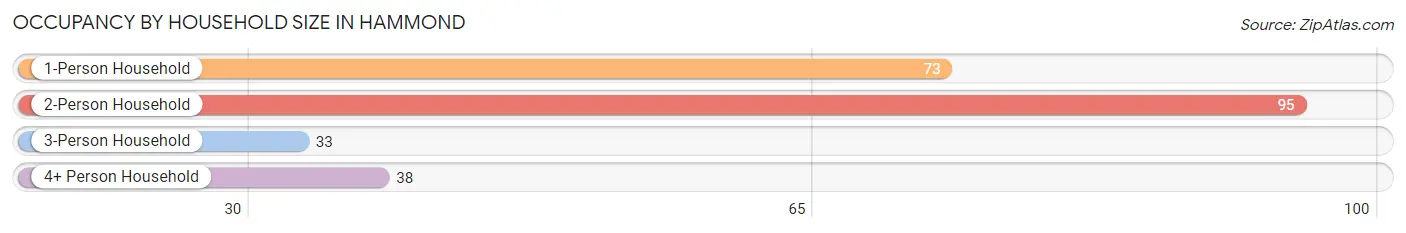
| Household Size | # Housing Units | % Housing Units |
| 1-Person Household | 73 | 30.5% |
| 2-Person Household | 95 | 39.8% |
| 3-Person Household | 33 | 13.8% |
| 4+ Person Household | 38 | 15.9% |
| Total Housing Units | 239 | 100.0% |
Occupancy by Ownership by Household Size in Hammond
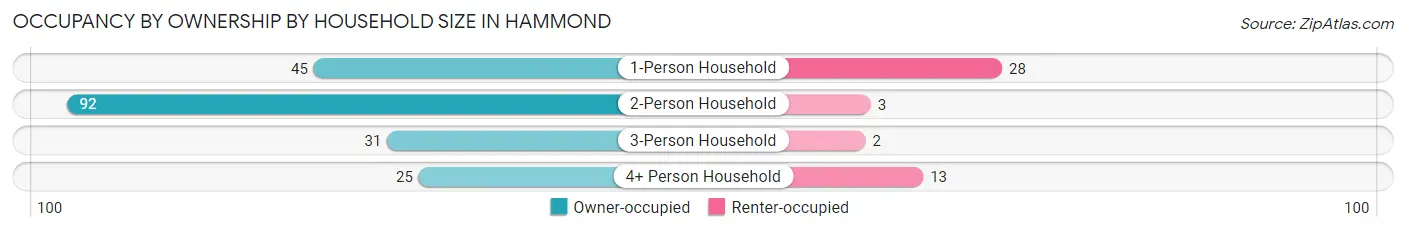
| Household Size | Owner-occupied | Renter-occupied |
| 1-Person Household | 45 (61.6%) | 28 (38.4%) |
| 2-Person Household | 92 (96.8%) | 3 (3.2%) |
| 3-Person Household | 31 (93.9%) | 2 (6.1%) |
| 4+ Person Household | 25 (65.8%) | 13 (34.2%) |
| Total Housing Units | 193 (80.7%) | 46 (19.3%) |
Occupancy by Educational Attainment in Hammond
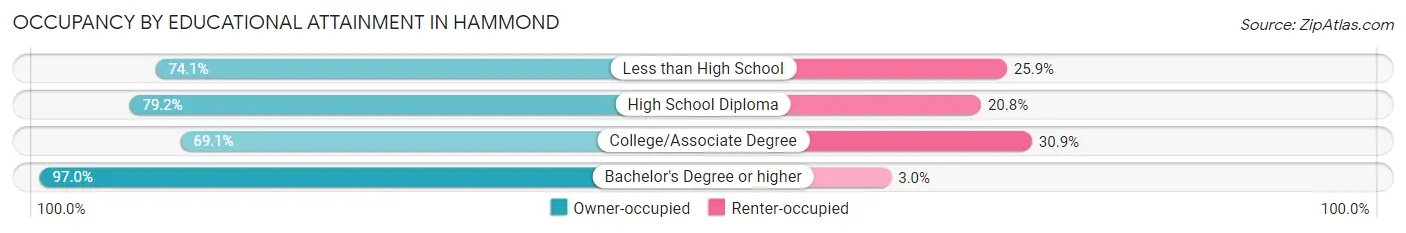
| Household Size | Owner-occupied | Renter-occupied |
| Less than High School | 20 (74.1%) | 7 (25.9%) |
| High School Diploma | 61 (79.2%) | 16 (20.8%) |
| College/Associate Degree | 47 (69.1%) | 21 (30.9%) |
| Bachelor's Degree or higher | 65 (97.0%) | 2 (3.0%) |
Occupancy by Age of Householder in Hammond
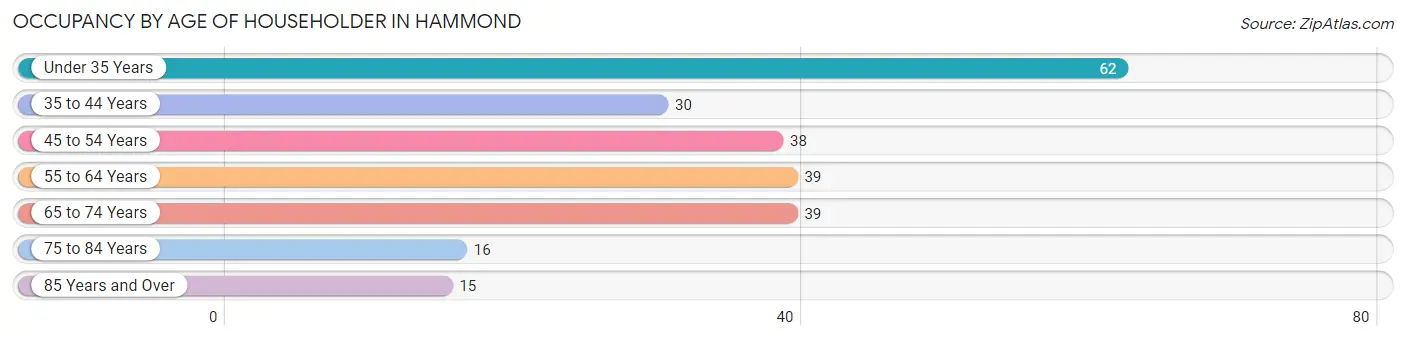
| Age Bracket | # Households | % Households |
| Under 35 Years | 62 | 25.9% |
| 35 to 44 Years | 30 | 12.6% |
| 45 to 54 Years | 38 | 15.9% |
| 55 to 64 Years | 39 | 16.3% |
| 65 to 74 Years | 39 | 16.3% |
| 75 to 84 Years | 16 | 6.7% |
| 85 Years and Over | 15 | 6.3% |
| Total | 239 | 100.0% |
Housing Finances in Hammond
Median Income by Occupancy in Hammond
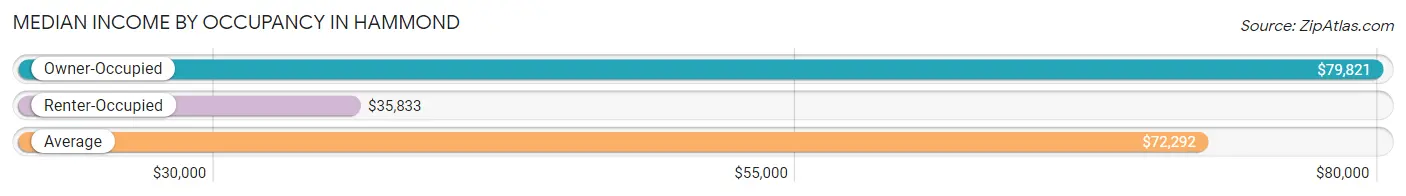
| Occupancy Type | # Households | Median Income |
| Owner-Occupied | 193 (80.7%) | $79,821 |
| Renter-Occupied | 46 (19.3%) | $35,833 |
| Average | 239 (100.0%) | $72,292 |
Occupancy by Householder Income Bracket in Hammond
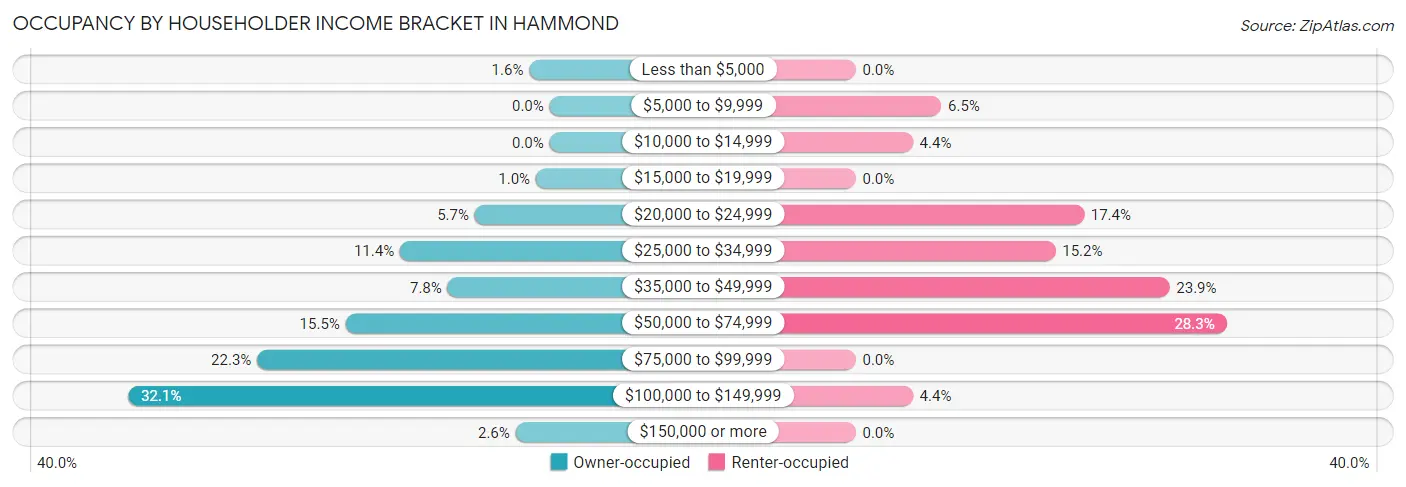
| Income Bracket | Owner-occupied | Renter-occupied |
| Less than $5,000 | 3 (1.5%) | 0 (0.0%) |
| $5,000 to $9,999 | 0 (0.0%) | 3 (6.5%) |
| $10,000 to $14,999 | 0 (0.0%) | 2 (4.3%) |
| $15,000 to $19,999 | 2 (1.0%) | 0 (0.0%) |
| $20,000 to $24,999 | 11 (5.7%) | 8 (17.4%) |
| $25,000 to $34,999 | 22 (11.4%) | 7 (15.2%) |
| $35,000 to $49,999 | 15 (7.8%) | 11 (23.9%) |
| $50,000 to $74,999 | 30 (15.5%) | 13 (28.3%) |
| $75,000 to $99,999 | 43 (22.3%) | 0 (0.0%) |
| $100,000 to $149,999 | 62 (32.1%) | 2 (4.3%) |
| $150,000 or more | 5 (2.6%) | 0 (0.0%) |
| Total | 193 (100.0%) | 46 (100.0%) |
Monthly Housing Cost Tiers in Hammond
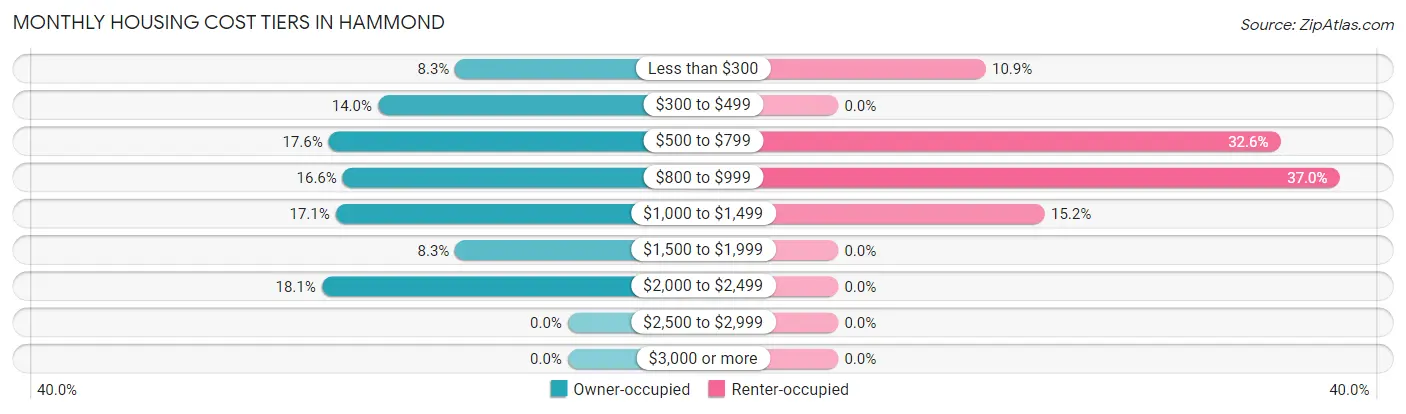
| Monthly Cost | Owner-occupied | Renter-occupied |
| Less than $300 | 16 (8.3%) | 5 (10.9%) |
| $300 to $499 | 27 (14.0%) | 0 (0.0%) |
| $500 to $799 | 34 (17.6%) | 15 (32.6%) |
| $800 to $999 | 32 (16.6%) | 17 (37.0%) |
| $1,000 to $1,499 | 33 (17.1%) | 7 (15.2%) |
| $1,500 to $1,999 | 16 (8.3%) | 0 (0.0%) |
| $2,000 to $2,499 | 35 (18.1%) | 0 (0.0%) |
| $2,500 to $2,999 | 0 (0.0%) | 0 (0.0%) |
| $3,000 or more | 0 (0.0%) | 0 (0.0%) |
| Total | 193 (100.0%) | 46 (100.0%) |
Physical Housing Characteristics in Hammond
Housing Structures in Hammond
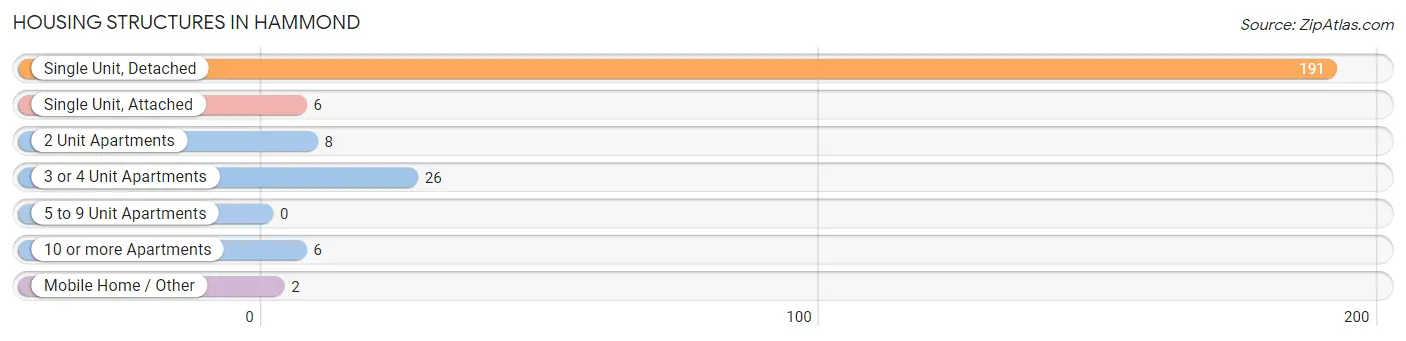
| Structure Type | # Housing Units | % Housing Units |
| Single Unit, Detached | 191 | 79.9% |
| Single Unit, Attached | 6 | 2.5% |
| 2 Unit Apartments | 8 | 3.4% |
| 3 or 4 Unit Apartments | 26 | 10.9% |
| 5 to 9 Unit Apartments | 0 | 0.0% |
| 10 or more Apartments | 6 | 2.5% |
| Mobile Home / Other | 2 | 0.8% |
| Total | 239 | 100.0% |
Housing Structures by Occupancy in Hammond
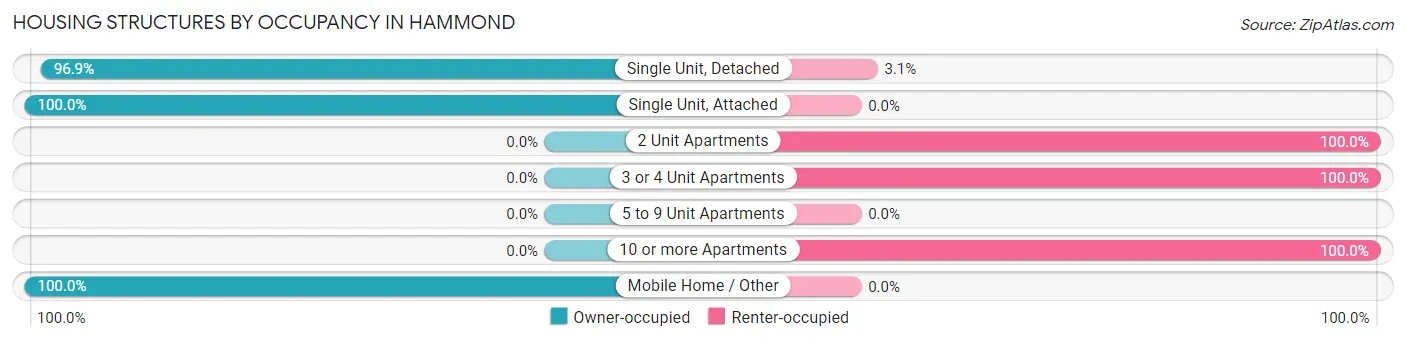
| Structure Type | Owner-occupied | Renter-occupied |
| Single Unit, Detached | 185 (96.9%) | 6 (3.1%) |
| Single Unit, Attached | 6 (100.0%) | 0 (0.0%) |
| 2 Unit Apartments | 0 (0.0%) | 8 (100.0%) |
| 3 or 4 Unit Apartments | 0 (0.0%) | 26 (100.0%) |
| 5 to 9 Unit Apartments | 0 (0.0%) | 0 (0.0%) |
| 10 or more Apartments | 0 (0.0%) | 6 (100.0%) |
| Mobile Home / Other | 2 (100.0%) | 0 (0.0%) |
| Total | 193 (80.7%) | 46 (19.3%) |
Housing Structures by Number of Rooms in Hammond
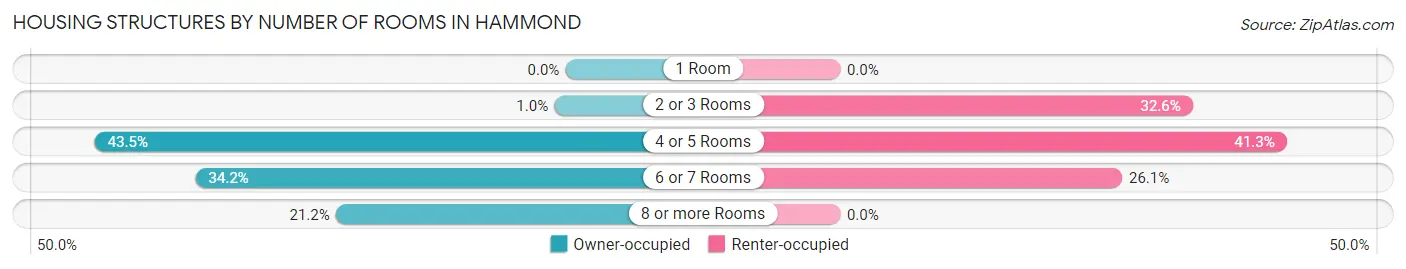
| Number of Rooms | Owner-occupied | Renter-occupied |
| 1 Room | 0 (0.0%) | 0 (0.0%) |
| 2 or 3 Rooms | 2 (1.0%) | 15 (32.6%) |
| 4 or 5 Rooms | 84 (43.5%) | 19 (41.3%) |
| 6 or 7 Rooms | 66 (34.2%) | 12 (26.1%) |
| 8 or more Rooms | 41 (21.2%) | 0 (0.0%) |
| Total | 193 (100.0%) | 46 (100.0%) |
Housing Structure by Heating Type in Hammond
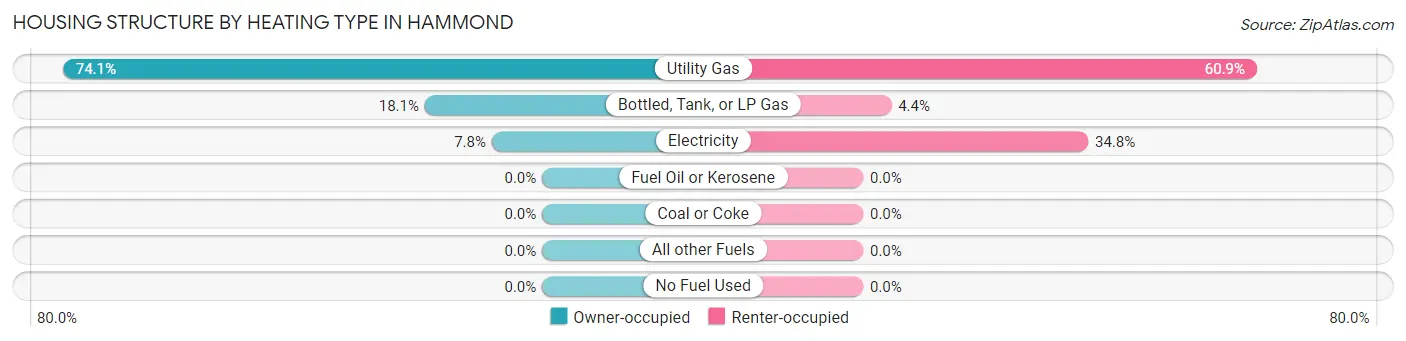
| Heating Type | Owner-occupied | Renter-occupied |
| Utility Gas | 143 (74.1%) | 28 (60.9%) |
| Bottled, Tank, or LP Gas | 35 (18.1%) | 2 (4.3%) |
| Electricity | 15 (7.8%) | 16 (34.8%) |
| Fuel Oil or Kerosene | 0 (0.0%) | 0 (0.0%) |
| Coal or Coke | 0 (0.0%) | 0 (0.0%) |
| All other Fuels | 0 (0.0%) | 0 (0.0%) |
| No Fuel Used | 0 (0.0%) | 0 (0.0%) |
| Total | 193 (100.0%) | 46 (100.0%) |
Household Vehicle Usage in Hammond
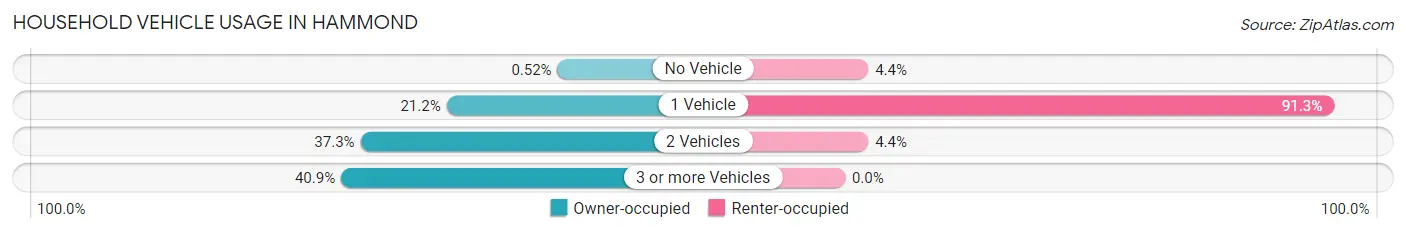
| Vehicles per Household | Owner-occupied | Renter-occupied |
| No Vehicle | 1 (0.5%) | 2 (4.3%) |
| 1 Vehicle | 41 (21.2%) | 42 (91.3%) |
| 2 Vehicles | 72 (37.3%) | 2 (4.3%) |
| 3 or more Vehicles | 79 (40.9%) | 0 (0.0%) |
| Total | 193 (100.0%) | 46 (100.0%) |
Real Estate & Mortgages in Hammond
Real Estate and Mortgage Overview in Hammond
| Characteristic | Without Mortgage | With Mortgage |
| Housing Units | 73 | 120 |
| Median Property Value | $83,200 | $106,300 |
| Median Household Income | $47,917 | $3 |
| Monthly Housing Costs | $450 | $0 |
| Real Estate Taxes | $1,456 | $0 |
Property Value by Mortgage Status in Hammond
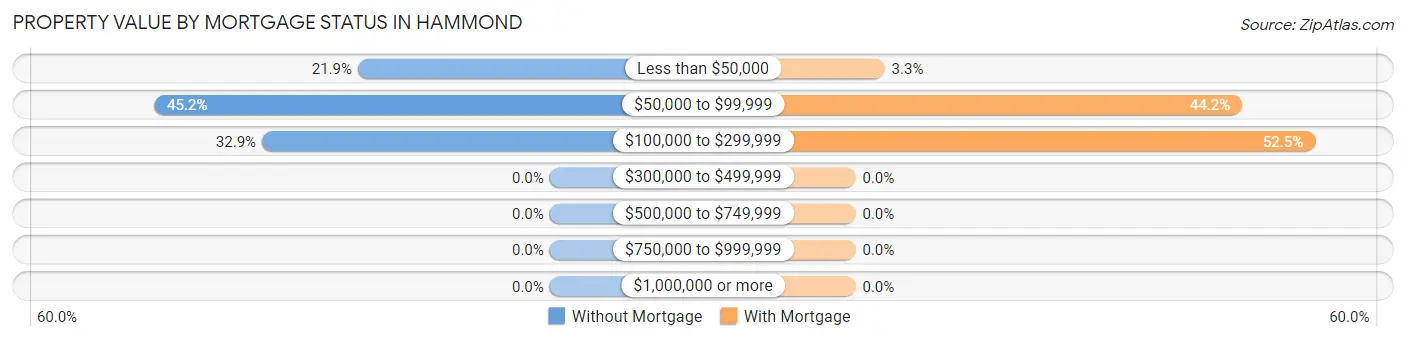
| Property Value | Without Mortgage | With Mortgage |
| Less than $50,000 | 16 (21.9%) | 4 (3.3%) |
| $50,000 to $99,999 | 33 (45.2%) | 53 (44.2%) |
| $100,000 to $299,999 | 24 (32.9%) | 63 (52.5%) |
| $300,000 to $499,999 | 0 (0.0%) | 0 (0.0%) |
| $500,000 to $749,999 | 0 (0.0%) | 0 (0.0%) |
| $750,000 to $999,999 | 0 (0.0%) | 0 (0.0%) |
| $1,000,000 or more | 0 (0.0%) | 0 (0.0%) |
| Total | 73 (100.0%) | 120 (100.0%) |
Household Income by Mortgage Status in Hammond
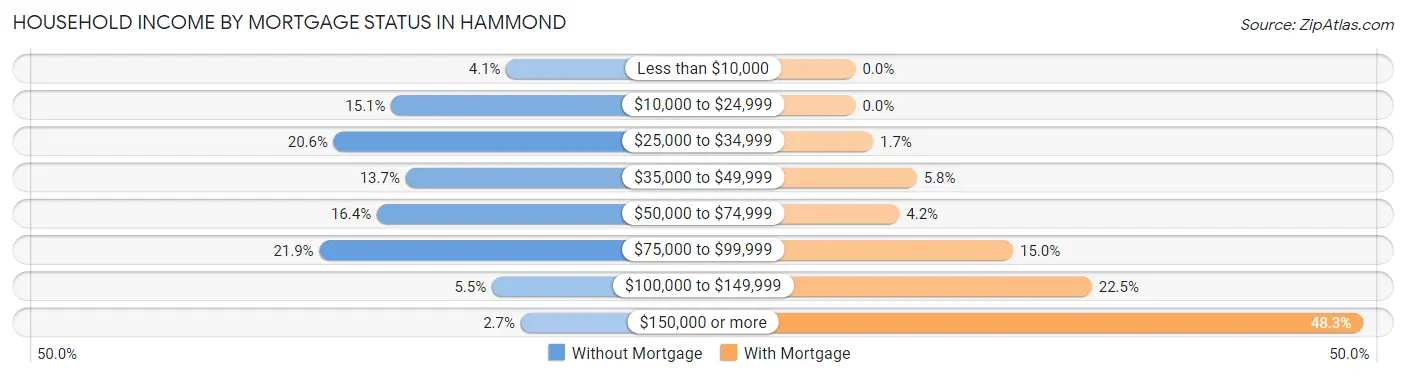
| Household Income | Without Mortgage | With Mortgage |
| Less than $10,000 | 3 (4.1%) | 0 (0.0%) |
| $10,000 to $24,999 | 11 (15.1%) | 0 (0.0%) |
| $25,000 to $34,999 | 15 (20.5%) | 2 (1.7%) |
| $35,000 to $49,999 | 10 (13.7%) | 7 (5.8%) |
| $50,000 to $74,999 | 12 (16.4%) | 5 (4.2%) |
| $75,000 to $99,999 | 16 (21.9%) | 18 (15.0%) |
| $100,000 to $149,999 | 4 (5.5%) | 27 (22.5%) |
| $150,000 or more | 2 (2.7%) | 58 (48.3%) |
| Total | 73 (100.0%) | 120 (100.0%) |
Property Value to Household Income Ratio in Hammond
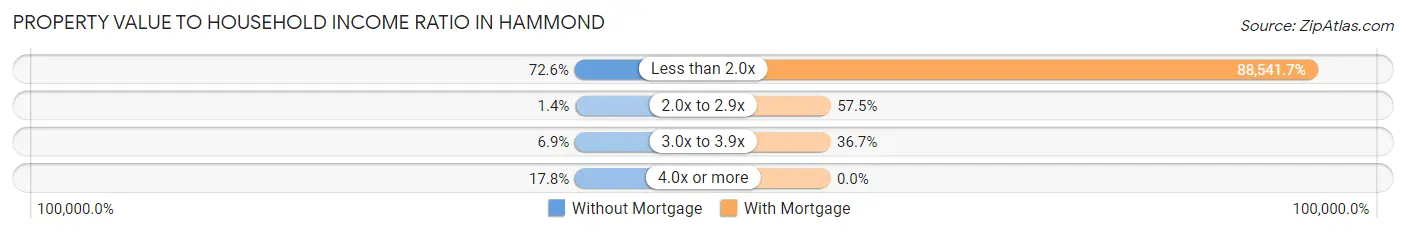
| Value-to-Income Ratio | Without Mortgage | With Mortgage |
| Less than 2.0x | 53 (72.6%) | 106,250 (88,541.7%) |
| 2.0x to 2.9x | 1 (1.4%) | 69 (57.5%) |
| 3.0x to 3.9x | 5 (6.9%) | 44 (36.7%) |
| 4.0x or more | 13 (17.8%) | 0 (0.0%) |
| Total | 73 (100.0%) | 120 (100.0%) |
Real Estate Taxes by Mortgage Status in Hammond
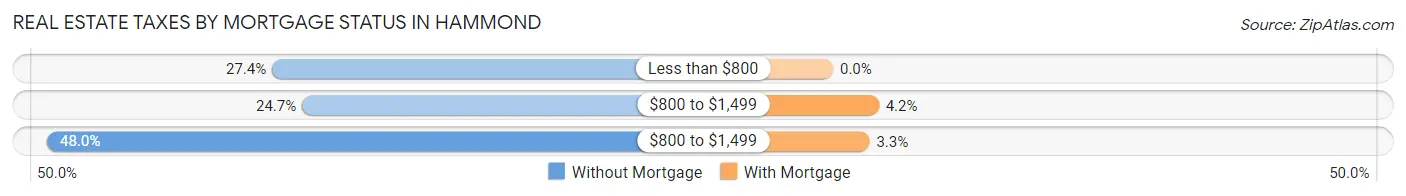
| Property Taxes | Without Mortgage | With Mortgage |
| Less than $800 | 20 (27.4%) | 0 (0.0%) |
| $800 to $1,499 | 18 (24.7%) | 5 (4.2%) |
| $800 to $1,499 | 35 (47.9%) | 4 (3.3%) |
| Total | 73 (100.0%) | 120 (100.0%) |
Health & Disability in Hammond
Health Insurance Coverage by Age in Hammond
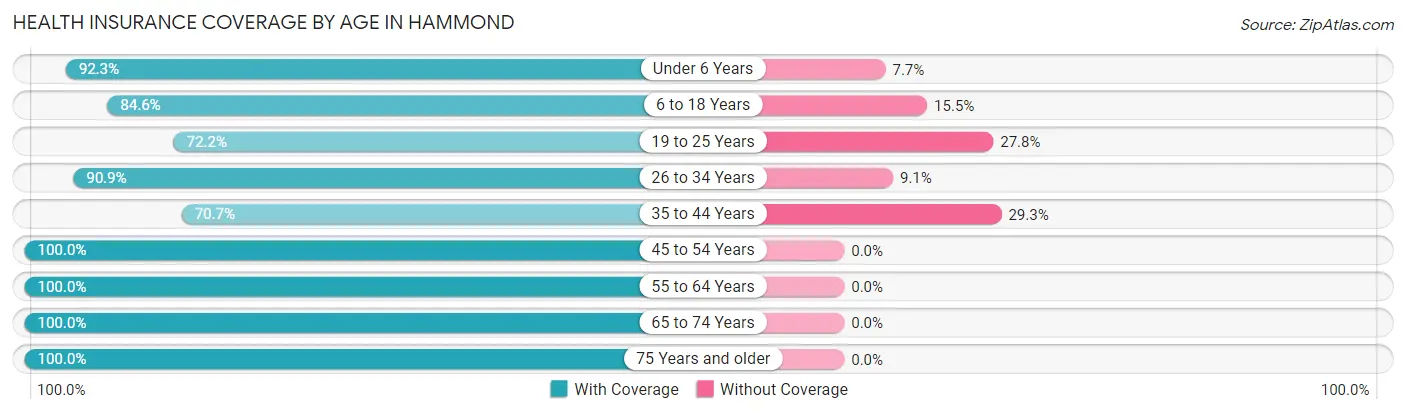
| Age Bracket | With Coverage | Without Coverage |
| Under 6 Years | 24 (92.3%) | 2 (7.7%) |
| 6 to 18 Years | 104 (84.6%) | 19 (15.4%) |
| 19 to 25 Years | 13 (72.2%) | 5 (27.8%) |
| 26 to 34 Years | 90 (90.9%) | 9 (9.1%) |
| 35 to 44 Years | 41 (70.7%) | 17 (29.3%) |
| 45 to 54 Years | 61 (100.0%) | 0 (0.0%) |
| 55 to 64 Years | 60 (100.0%) | 0 (0.0%) |
| 65 to 74 Years | 58 (100.0%) | 0 (0.0%) |
| 75 Years and older | 43 (100.0%) | 0 (0.0%) |
| Total | 494 (90.5%) | 52 (9.5%) |
Health Insurance Coverage by Citizenship Status in Hammond
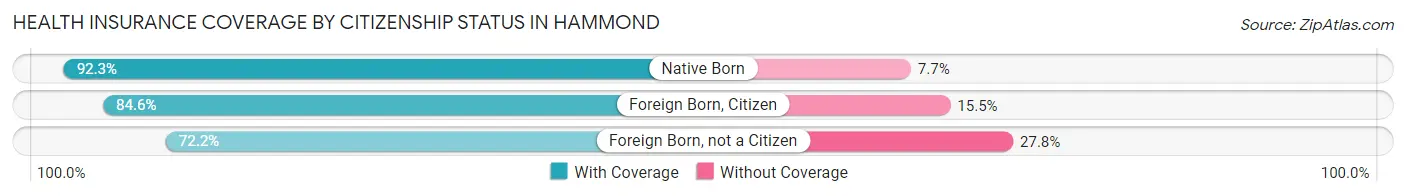
| Citizenship Status | With Coverage | Without Coverage |
| Native Born | 24 (92.3%) | 2 (7.7%) |
| Foreign Born, Citizen | 104 (84.6%) | 19 (15.4%) |
| Foreign Born, not a Citizen | 13 (72.2%) | 5 (27.8%) |
Health Insurance Coverage by Household Income in Hammond
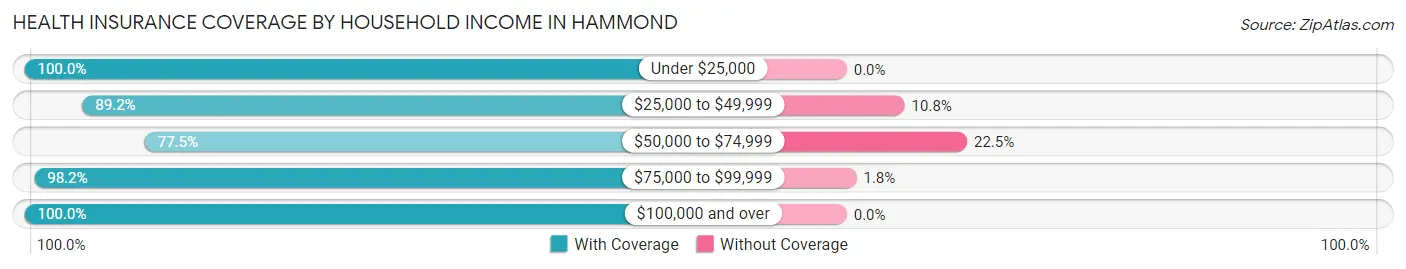
| Household Income | With Coverage | Without Coverage |
| Under $25,000 | 33 (100.0%) | 0 (0.0%) |
| $25,000 to $49,999 | 74 (89.2%) | 9 (10.8%) |
| $50,000 to $74,999 | 141 (77.5%) | 41 (22.5%) |
| $75,000 to $99,999 | 108 (98.2%) | 2 (1.8%) |
| $100,000 and over | 138 (100.0%) | 0 (0.0%) |
Public vs Private Health Insurance Coverage by Age in Hammond
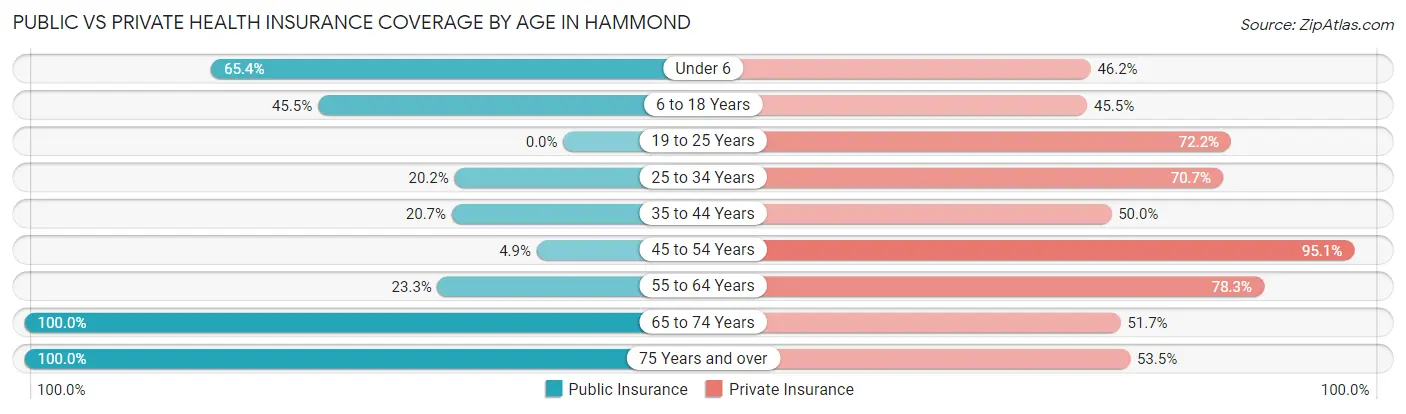
| Age Bracket | Public Insurance | Private Insurance |
| Under 6 | 17 (65.4%) | 12 (46.2%) |
| 6 to 18 Years | 56 (45.5%) | 56 (45.5%) |
| 19 to 25 Years | 0 (0.0%) | 13 (72.2%) |
| 25 to 34 Years | 20 (20.2%) | 70 (70.7%) |
| 35 to 44 Years | 12 (20.7%) | 29 (50.0%) |
| 45 to 54 Years | 3 (4.9%) | 58 (95.1%) |
| 55 to 64 Years | 14 (23.3%) | 47 (78.3%) |
| 65 to 74 Years | 58 (100.0%) | 30 (51.7%) |
| 75 Years and over | 43 (100.0%) | 23 (53.5%) |
| Total | 223 (40.8%) | 338 (61.9%) |
Disability Status by Sex by Age in Hammond
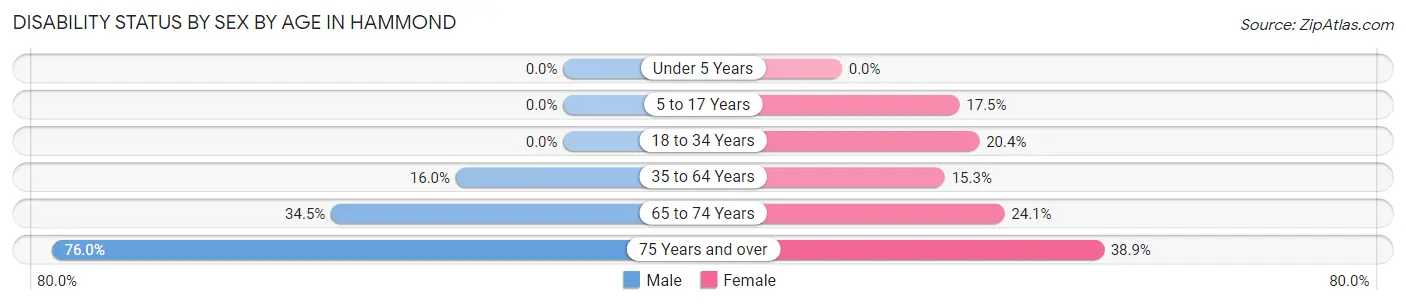
| Age Bracket | Male | Female |
| Under 5 Years | 0 (0.0%) | 0 (0.0%) |
| 5 to 17 Years | 0 (0.0%) | 11 (17.5%) |
| 18 to 34 Years | 0 (0.0%) | 10 (20.4%) |
| 35 to 64 Years | 15 (16.0%) | 13 (15.3%) |
| 65 to 74 Years | 10 (34.5%) | 7 (24.1%) |
| 75 Years and over | 19 (76.0%) | 7 (38.9%) |
Disability Class by Sex by Age in Hammond
Disability Class: Hearing Difficulty
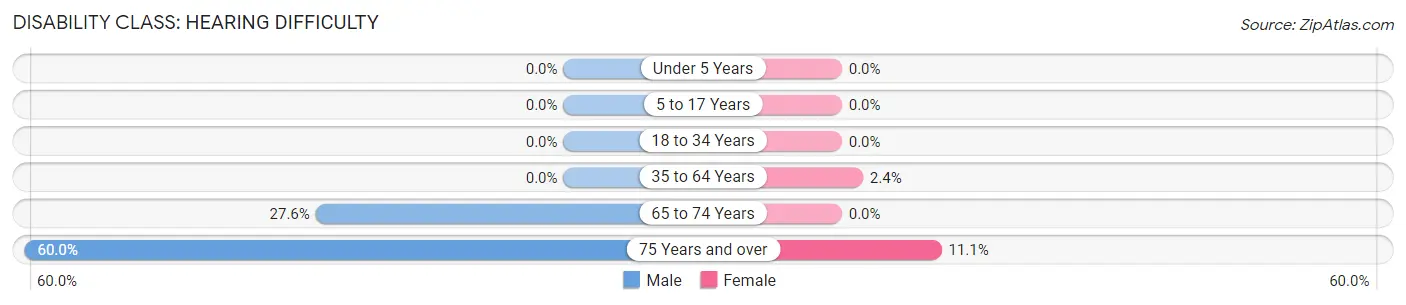
| Age Bracket | Male | Female |
| Under 5 Years | 0 (0.0%) | 0 (0.0%) |
| 5 to 17 Years | 0 (0.0%) | 0 (0.0%) |
| 18 to 34 Years | 0 (0.0%) | 0 (0.0%) |
| 35 to 64 Years | 0 (0.0%) | 2 (2.4%) |
| 65 to 74 Years | 8 (27.6%) | 0 (0.0%) |
| 75 Years and over | 15 (60.0%) | 2 (11.1%) |
Disability Class: Vision Difficulty
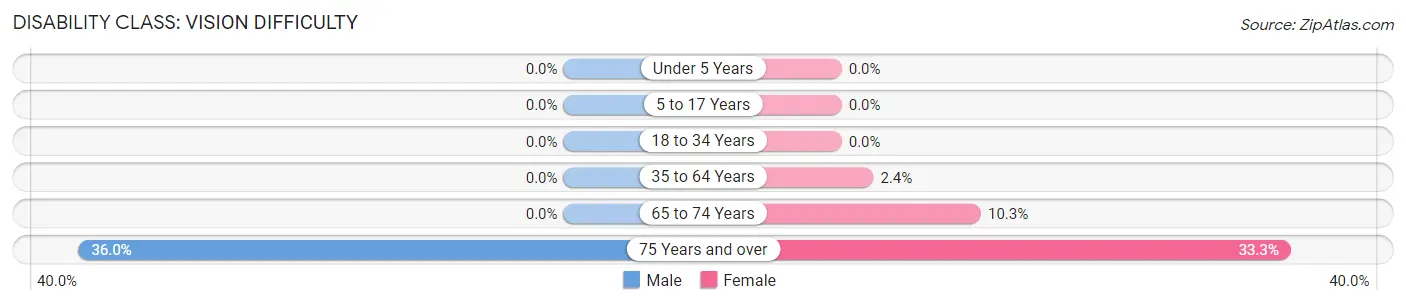
| Age Bracket | Male | Female |
| Under 5 Years | 0 (0.0%) | 0 (0.0%) |
| 5 to 17 Years | 0 (0.0%) | 0 (0.0%) |
| 18 to 34 Years | 0 (0.0%) | 0 (0.0%) |
| 35 to 64 Years | 0 (0.0%) | 2 (2.4%) |
| 65 to 74 Years | 0 (0.0%) | 3 (10.3%) |
| 75 Years and over | 9 (36.0%) | 6 (33.3%) |
Disability Class: Cognitive Difficulty
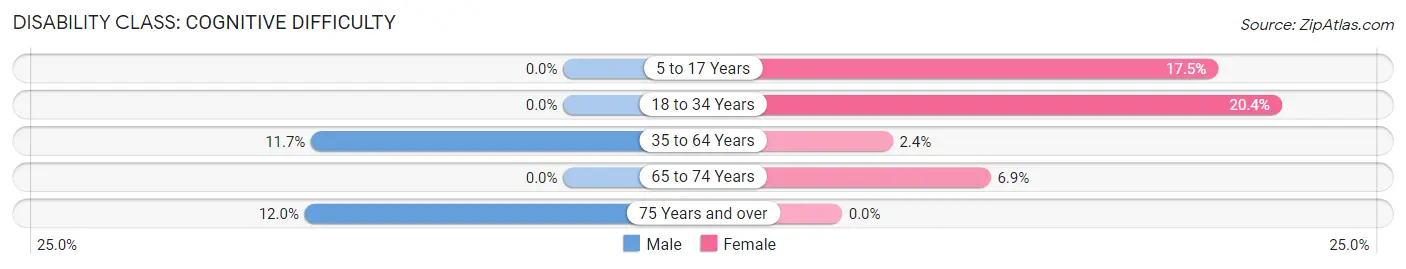
| Age Bracket | Male | Female |
| 5 to 17 Years | 0 (0.0%) | 11 (17.5%) |
| 18 to 34 Years | 0 (0.0%) | 10 (20.4%) |
| 35 to 64 Years | 11 (11.7%) | 2 (2.4%) |
| 65 to 74 Years | 0 (0.0%) | 2 (6.9%) |
| 75 Years and over | 3 (12.0%) | 0 (0.0%) |
Disability Class: Ambulatory Difficulty
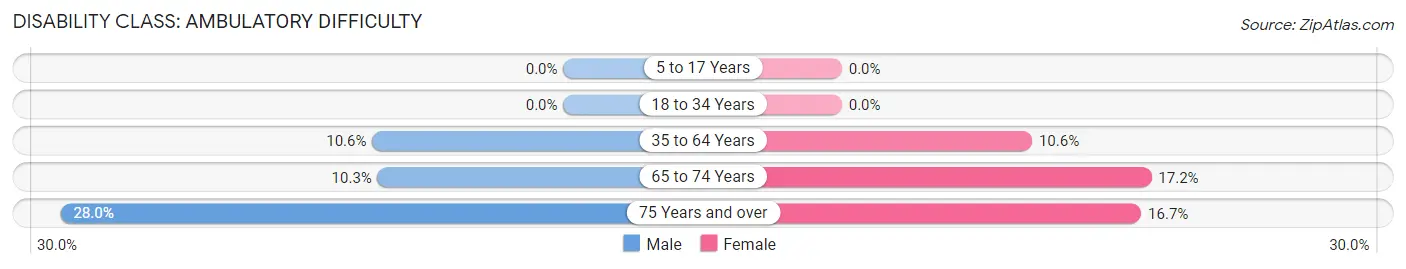
| Age Bracket | Male | Female |
| 5 to 17 Years | 0 (0.0%) | 0 (0.0%) |
| 18 to 34 Years | 0 (0.0%) | 0 (0.0%) |
| 35 to 64 Years | 10 (10.6%) | 9 (10.6%) |
| 65 to 74 Years | 3 (10.3%) | 5 (17.2%) |
| 75 Years and over | 7 (28.0%) | 3 (16.7%) |
Disability Class: Self-Care Difficulty
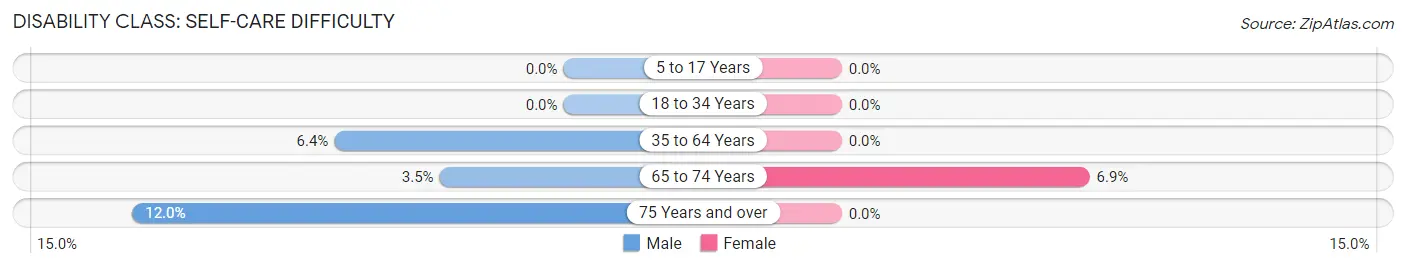
| Age Bracket | Male | Female |
| 5 to 17 Years | 0 (0.0%) | 0 (0.0%) |
| 18 to 34 Years | 0 (0.0%) | 0 (0.0%) |
| 35 to 64 Years | 6 (6.4%) | 0 (0.0%) |
| 65 to 74 Years | 1 (3.5%) | 2 (6.9%) |
| 75 Years and over | 3 (12.0%) | 0 (0.0%) |
Technology Access in Hammond
Computing Device Access in Hammond
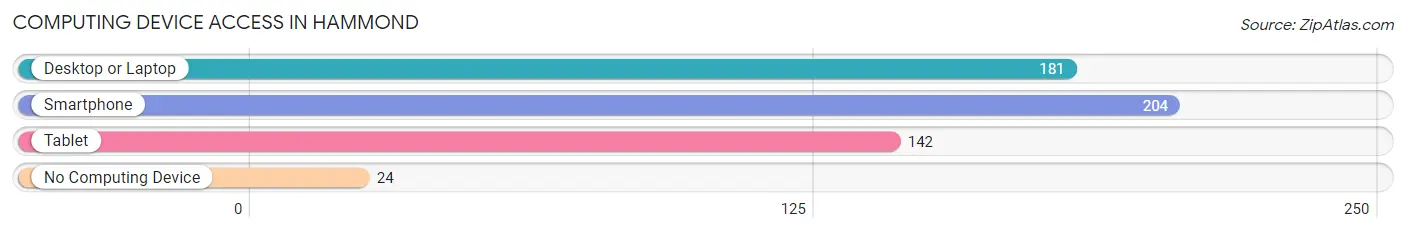
| Device Type | # Households | % Households |
| Desktop or Laptop | 181 | 75.7% |
| Smartphone | 204 | 85.4% |
| Tablet | 142 | 59.4% |
| No Computing Device | 24 | 10.0% |
| Total | 239 | 100.0% |
Internet Access in Hammond
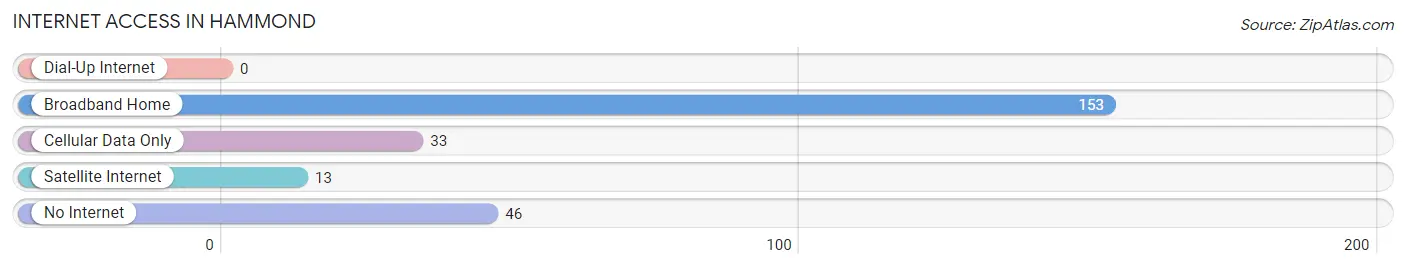
| Internet Type | # Households | % Households |
| Dial-Up Internet | 0 | 0.0% |
| Broadband Home | 153 | 64.0% |
| Cellular Data Only | 33 | 13.8% |
| Satellite Internet | 13 | 5.4% |
| No Internet | 46 | 19.3% |
| Total | 239 | 100.0% |
Hammond Summary
Hammond, Illinois is a city located in Lake County, Illinois, United States. It is part of the Chicago metropolitan area and is located approximately 25 miles southeast of the city of Chicago. As of the 2010 census, the population of Hammond was 80,830, making it the fifth-largest city in the state of Illinois.
History
The area that is now Hammond was first settled in the early 19th century by German and Dutch immigrants. The city was officially incorporated in 1884 and was named after George H. Hammond, a prominent local businessman. In the late 19th century, Hammond became a major industrial center, with the development of the steel industry and the construction of the Illinois and Michigan Canal. The city also became a major transportation hub, with the construction of the Grand Trunk Railroad and the Chicago and Western Indiana Railroad.
Geography
Hammond is located in northeastern Illinois, approximately 25 miles southeast of the city of Chicago. It is situated on the southern shore of Lake Michigan, and is bordered by the cities of East Chicago, Whiting, and Calumet City. The city has a total area of 16.3 square miles, of which 15.9 square miles is land and 0.4 square miles is water.
Economy
Hammond is a major industrial center, with a diverse economy that includes manufacturing, retail, healthcare, and education. The city is home to several major employers, including ArcelorMittal, BP, and the University of Chicago Medical Center. The city also has a thriving tourism industry, with attractions such as the Hammond Marina, the Hammond Museum of History, and the Hammond Civic Center.
Demographics
As of the 2010 census, the population of Hammond was 80,830, with a population density of 4,976 people per square mile. The racial makeup of the city was 64.2% White, 24.3% African American, 0.4% Native American, 2.2% Asian, 0.1% Pacific Islander, 5.3% from other races, and 3.5% from two or more races. Hispanic or Latino of any race were 14.3% of the population.
The median income for a household in the city was $37,945, and the median income for a family was $45,919. The per capita income for the city was $19,945. About 16.2% of families and 19.3% of the population were below the poverty line, including 28.2% of those under age 18 and 8.7% of those age 65 or over.
Common Questions
What is Per Capita Income in Hammond?
Per Capita income in Hammond is $30,093.
What is the Median Family Income in Hammond?
Median Family Income in Hammond is $78,571.
What is the Median Household income in Hammond?
Median Household Income in Hammond is $72,292.
What is Income or Wage Gap in Hammond?
Income or Wage Gap in Hammond is 5.9%.
Women in Hammond earn 94.1 cents for every dollar earned by a man.
What is Inequality or Gini Index in Hammond?
Inequality or Gini Index in Hammond is 0.31.
What is the Total Population of Hammond?
Total Population of Hammond is 546.
What is the Total Male Population of Hammond?
Total Male Population of Hammond is 292.
What is the Total Female Population of Hammond?
Total Female Population of Hammond is 254.
What is the Ratio of Males per 100 Females in Hammond?
There are 114.96 Males per 100 Females in Hammond.
What is the Ratio of Females per 100 Males in Hammond?
There are 86.99 Females per 100 Males in Hammond.
What is the Median Population Age in Hammond?
Median Population Age in Hammond is 37.5 Years.
What is the Average Family Size in Hammond
Average Family Size in Hammond is 2.7 People.
What is the Average Household Size in Hammond
Average Household Size in Hammond is 2.3 People.
How Large is the Labor Force in Hammond?
There are 235 People in the Labor Forcein in Hammond.
What is the Percentage of People in the Labor Force in Hammond?
55.7% of People are in the Labor Force in Hammond.
What is the Unemployment Rate in Hammond?
Unemployment Rate in Hammond is 18.3%.