Greenup, IL Map & Demographics
Greenup Map
Greenup Overview
$25,973
PER CAPITA INCOME
$80,795
AVG FAMILY INCOME
$53,583
AVG HOUSEHOLD INCOME
43.5%
WAGE / INCOME GAP [ % ]
56.5¢/ $1
WAGE / INCOME GAP [ $ ]
0.35
INEQUALITY / GINI INDEX
1,824
TOTAL POPULATION
837
MALE POPULATION
987
FEMALE POPULATION
84.80
MALES / 100 FEMALES
117.92
FEMALES / 100 MALES
35.7
MEDIAN AGE
3.2
AVG FAMILY SIZE
2.4
AVG HOUSEHOLD SIZE
868
LABOR FORCE [ PEOPLE ]
61.9%
PERCENT IN LABOR FORCE
1.7%
UNEMPLOYMENT RATE
Greenup Zip Codes
Greenup Area Codes
Income in Greenup
Income Overview in Greenup
Per Capita Income in Greenup is $25,973, while median incomes of families and households are $80,795 and $53,583 respectively.
| Characteristic | Number | Measure |
| Per Capita Income | 1,824 | $25,973 |
| Median Family Income | 395 | $80,795 |
| Mean Family Income | 395 | $79,156 |
| Median Household Income | 734 | $53,583 |
| Mean Household Income | 734 | $61,478 |
| Income Deficit | 395 | $0 |
| Wage / Income Gap (%) | 1,824 | 43.45% |
| Wage / Income Gap ($) | 1,824 | 56.55¢ per $1 |
| Gini / Inequality Index | 1,824 | 0.35 |
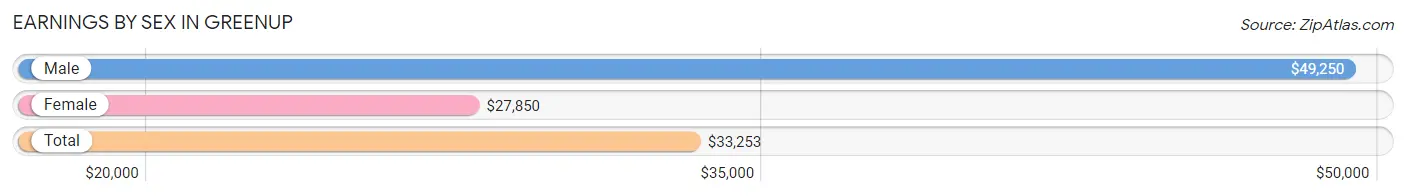
Earnings by Sex in Greenup
Average Earnings in Greenup are $33,253, $49,250 for men and $27,850 for women, a difference of 43.4%.
| Sex | Number | Average Earnings |
| Male | 469 (49.8%) | $49,250 |
| Female | 473 (50.2%) | $27,850 |
| Total | 942 (100.0%) | $33,253 |
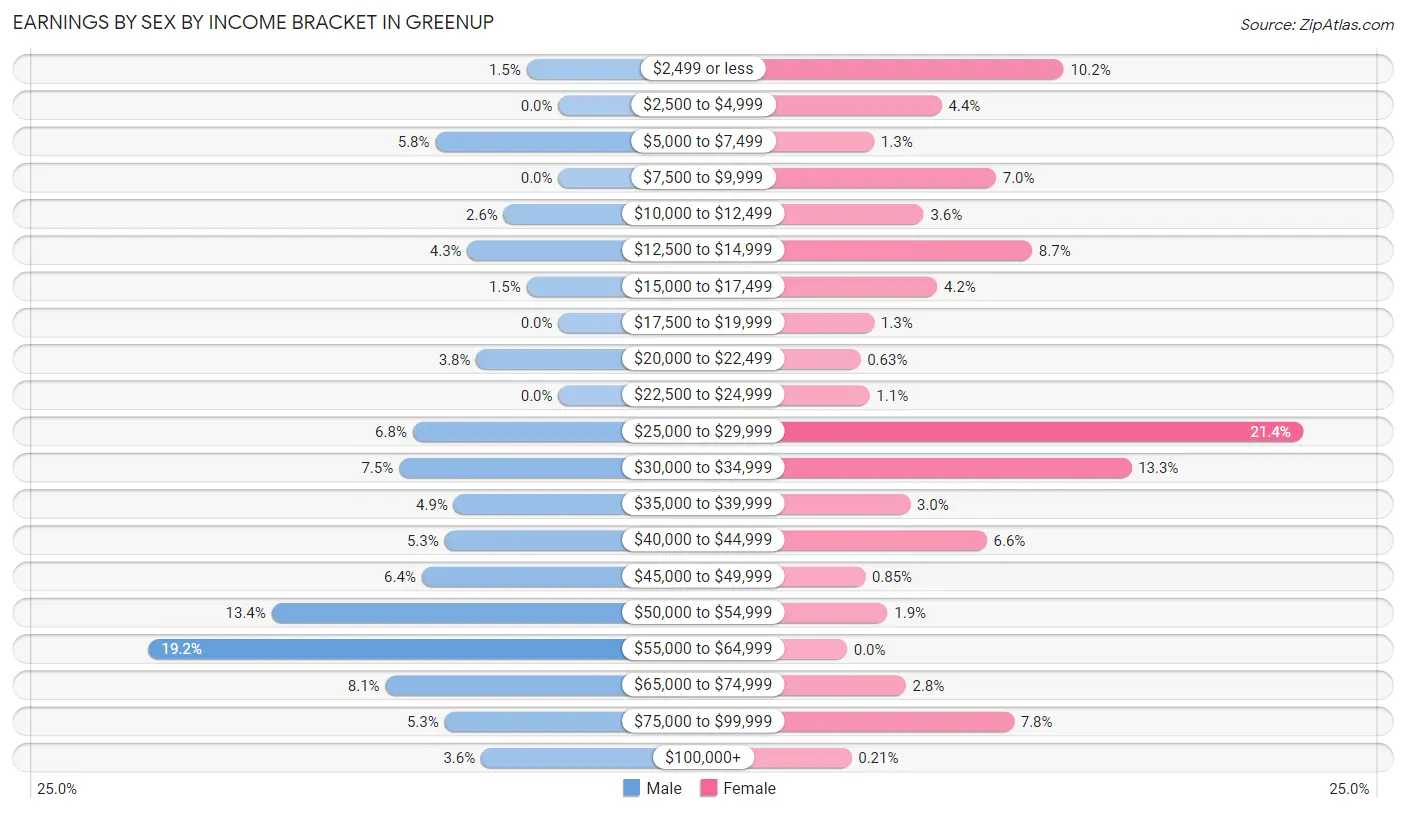
Earnings by Sex by Income Bracket in Greenup
The most common earnings brackets in Greenup are $55,000 to $64,999 for men (90 | 19.2%) and $25,000 to $29,999 for women (101 | 21.3%).
| Income | Male | Female |
| $2,499 or less | 7 (1.5%) | 48 (10.2%) |
| $2,500 to $4,999 | 0 (0.0%) | 21 (4.4%) |
| $5,000 to $7,499 | 27 (5.8%) | 6 (1.3%) |
| $7,500 to $9,999 | 0 (0.0%) | 33 (7.0%) |
| $10,000 to $12,499 | 12 (2.6%) | 17 (3.6%) |
| $12,500 to $14,999 | 20 (4.3%) | 41 (8.7%) |
| $15,000 to $17,499 | 7 (1.5%) | 20 (4.2%) |
| $17,500 to $19,999 | 0 (0.0%) | 6 (1.3%) |
| $20,000 to $22,499 | 18 (3.8%) | 3 (0.6%) |
| $22,500 to $24,999 | 0 (0.0%) | 5 (1.1%) |
| $25,000 to $29,999 | 32 (6.8%) | 101 (21.3%) |
| $30,000 to $34,999 | 35 (7.5%) | 63 (13.3%) |
| $35,000 to $39,999 | 23 (4.9%) | 14 (3.0%) |
| $40,000 to $44,999 | 25 (5.3%) | 31 (6.6%) |
| $45,000 to $49,999 | 30 (6.4%) | 4 (0.9%) |
| $50,000 to $54,999 | 63 (13.4%) | 9 (1.9%) |
| $55,000 to $64,999 | 90 (19.2%) | 0 (0.0%) |
| $65,000 to $74,999 | 38 (8.1%) | 13 (2.8%) |
| $75,000 to $99,999 | 25 (5.3%) | 37 (7.8%) |
| $100,000+ | 17 (3.6%) | 1 (0.2%) |
| Total | 469 (100.0%) | 473 (100.0%) |
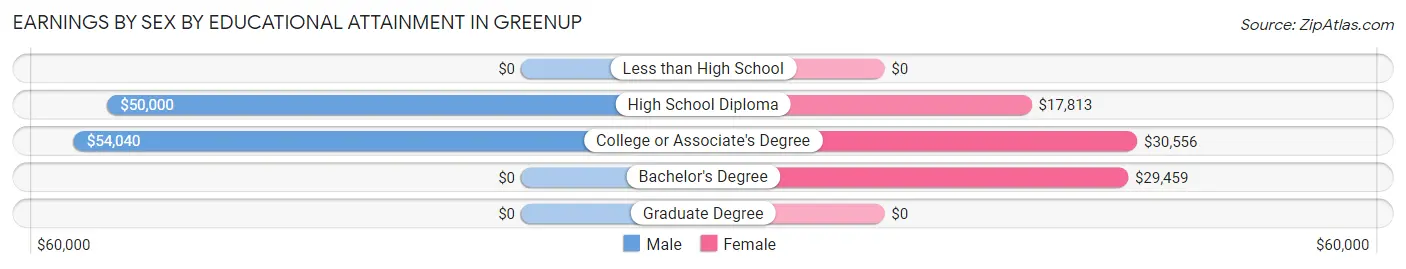
Earnings by Sex by Educational Attainment in Greenup
Average earnings in Greenup are $53,594 for men and $28,483 for women, a difference of 46.9%. Men with an educational attainment of college or associate's degree enjoy the highest average annual earnings of $54,040, while those with high school diploma education earn the least with $50,000. Women with an educational attainment of college or associate's degree earn the most with the average annual earnings of $30,556, while those with high school diploma education have the smallest earnings of $17,813.
| Educational Attainment | Male Income | Female Income |
| Less than High School | - | - |
| High School Diploma | $50,000 | $17,813 |
| College or Associate's Degree | $54,040 | $30,556 |
| Bachelor's Degree | - | - |
| Graduate Degree | - | - |
| Total | $53,594 | $28,483 |
Family Income in Greenup
Family Income Brackets in Greenup
According to the Greenup family income data, there are 135 families falling into the $75,000 to $99,999 income range, which is the most common income bracket and makes up 34.2% of all families.
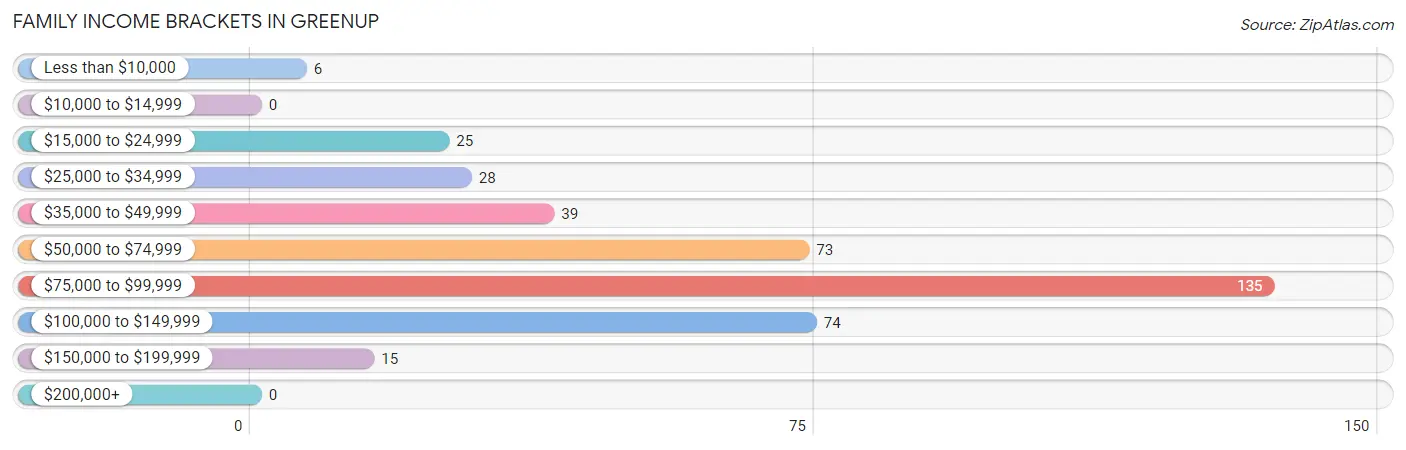
| Income Bracket | # Families | % Families |
| Less than $10,000 | 6 | 1.5% |
| $10,000 to $14,999 | 0 | 0.0% |
| $15,000 to $24,999 | 25 | 6.3% |
| $25,000 to $34,999 | 28 | 7.1% |
| $35,000 to $49,999 | 39 | 9.9% |
| $50,000 to $74,999 | 73 | 18.5% |
| $75,000 to $99,999 | 135 | 34.2% |
| $100,000 to $149,999 | 74 | 18.7% |
| $150,000 to $199,999 | 15 | 3.8% |
| $200,000+ | 0 | 0.0% |
Family Income by Famaliy Size in Greenup
5-person families (20 | 5.1%) account for the highest median family income in Greenup with $98,000 per family, while 2-person families (156 | 39.5%) have the highest median income of $33,750 per family member.
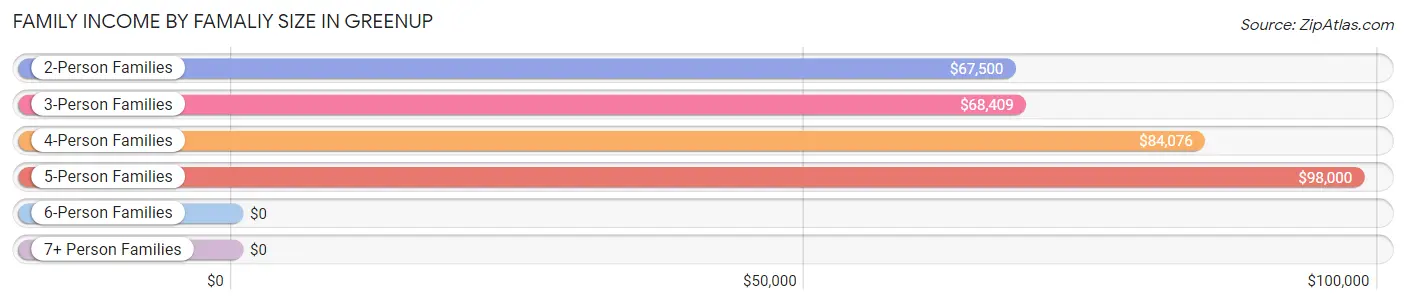
| Income Bracket | # Families | Median Income |
| 2-Person Families | 156 (39.5%) | $67,500 |
| 3-Person Families | 90 (22.8%) | $68,409 |
| 4-Person Families | 114 (28.9%) | $84,076 |
| 5-Person Families | 20 (5.1%) | $98,000 |
| 6-Person Families | 15 (3.8%) | $0 |
| 7+ Person Families | 0 (0.0%) | $0 |
| Total | 395 (100.0%) | $80,795 |
Family Income by Number of Earners in Greenup
The median family income in Greenup is $80,795, with families comprising 3+ earners (26) having the highest median family income of $86,250, while families with no earners (59) have the lowest median family income of $43,125, accounting for 6.6% and 14.9% of families, respectively.
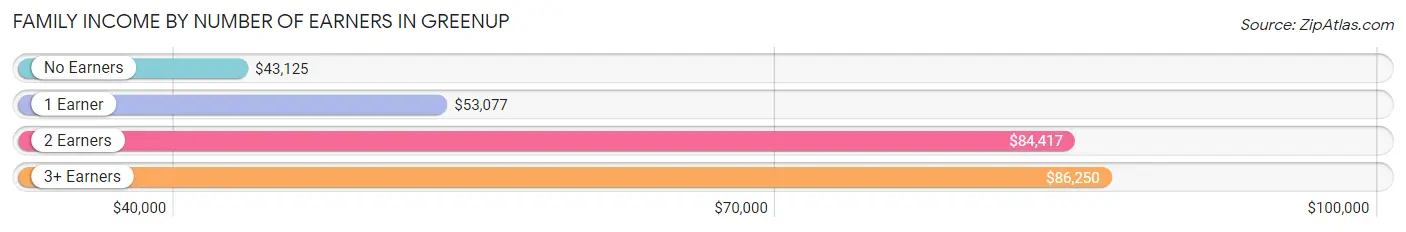
| Number of Earners | # Families | Median Income |
| No Earners | 59 (14.9%) | $43,125 |
| 1 Earner | 76 (19.2%) | $53,077 |
| 2 Earners | 234 (59.2%) | $84,417 |
| 3+ Earners | 26 (6.6%) | $86,250 |
| Total | 395 (100.0%) | $80,795 |
Household Income in Greenup
Household Income Brackets in Greenup
With 166 households falling in the category, the $75,000 to $99,999 income range is the most frequent in Greenup, accounting for 22.6% of all households.
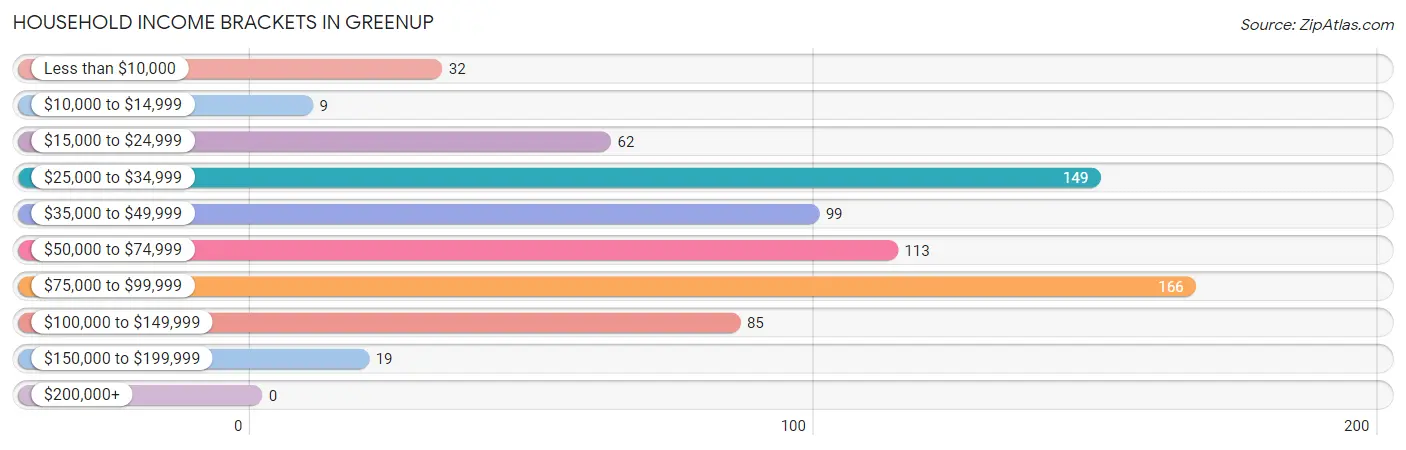
| Income Bracket | # Households | % Households |
| Less than $10,000 | 32 | 4.4% |
| $10,000 to $14,999 | 9 | 1.2% |
| $15,000 to $24,999 | 62 | 8.4% |
| $25,000 to $34,999 | 149 | 20.3% |
| $35,000 to $49,999 | 99 | 13.5% |
| $50,000 to $74,999 | 113 | 15.4% |
| $75,000 to $99,999 | 166 | 22.6% |
| $100,000 to $149,999 | 85 | 11.6% |
| $150,000 to $199,999 | 19 | 2.6% |
| $200,000+ | 0 | 0.0% |
Household Income by Householder Age in Greenup
The median household income in Greenup is $53,583, with the highest median household income of $84,034 found in the 45 to 64 years age bracket for the primary householder. A total of 183 households (24.9%) fall into this category. Meanwhile, the 15 to 24 years age bracket for the primary householder has the lowest median household income of $0, with 34 households (4.6%) in this group.
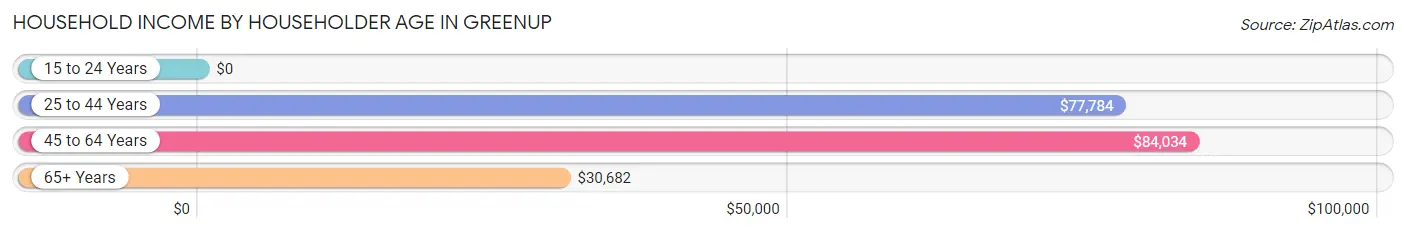
| Income Bracket | # Households | Median Income |
| 15 to 24 Years | 34 (4.6%) | $0 |
| 25 to 44 Years | 261 (35.6%) | $77,784 |
| 45 to 64 Years | 183 (24.9%) | $84,034 |
| 65+ Years | 256 (34.9%) | $30,682 |
| Total | 734 (100.0%) | $53,583 |
Poverty in Greenup
Income Below Poverty by Sex and Age in Greenup
With 9.2% poverty level for males and 10.4% for females among the residents of Greenup, 16 and 17 year old males and 16 and 17 year old females are the most vulnerable to poverty, with 10 males (31.2%) and 15 females (68.2%) in their respective age groups living below the poverty level.
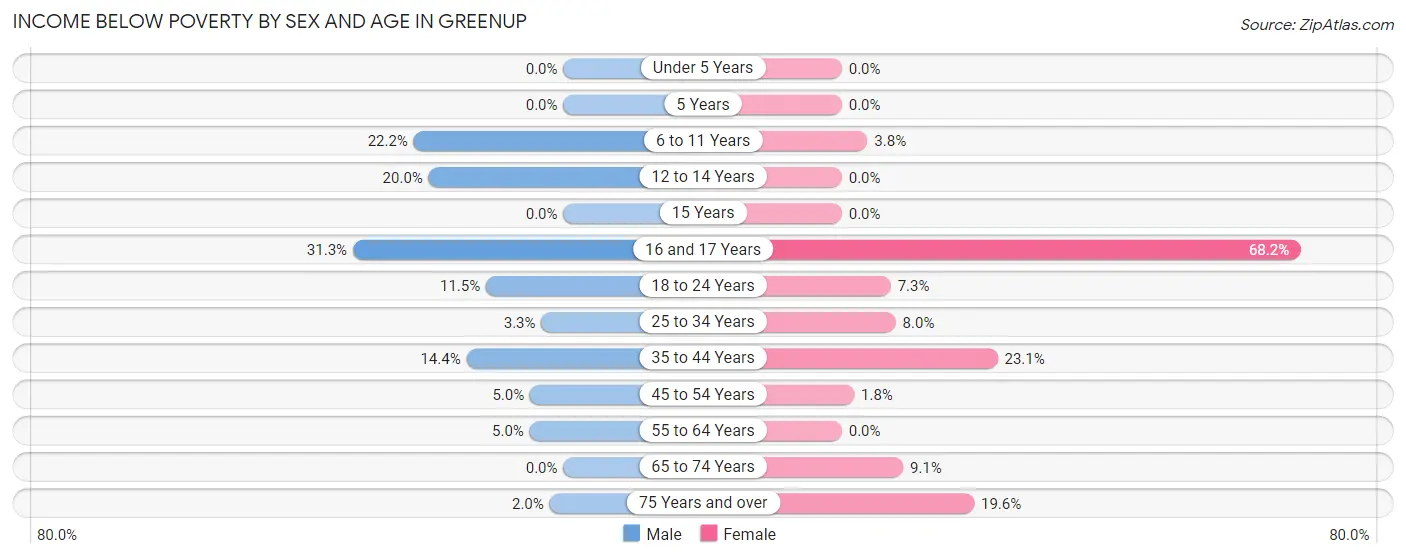
| Age Bracket | Male | Female |
| Under 5 Years | 0 (0.0%) | 0 (0.0%) |
| 5 Years | 0 (0.0%) | 0 (0.0%) |
| 6 to 11 Years | 18 (22.2%) | 3 (3.8%) |
| 12 to 14 Years | 4 (20.0%) | 0 (0.0%) |
| 15 Years | 0 (0.0%) | 0 (0.0%) |
| 16 and 17 Years | 10 (31.2%) | 15 (68.2%) |
| 18 to 24 Years | 7 (11.5%) | 8 (7.3%) |
| 25 to 34 Years | 3 (3.3%) | 8 (8.0%) |
| 35 to 44 Years | 23 (14.4%) | 31 (23.1%) |
| 45 to 54 Years | 5 (5.0%) | 2 (1.8%) |
| 55 to 64 Years | 4 (5.0%) | 0 (0.0%) |
| 65 to 74 Years | 0 (0.0%) | 9 (9.1%) |
| 75 Years and over | 2 (2.0%) | 22 (19.6%) |
| Total | 76 (9.2%) | 98 (10.4%) |
Income Above Poverty by Sex and Age in Greenup
According to the poverty statistics in Greenup, males aged under 5 years and females aged under 5 years are the age groups that are most secure financially, with 100.0% of males and 100.0% of females in these age groups living above the poverty line.
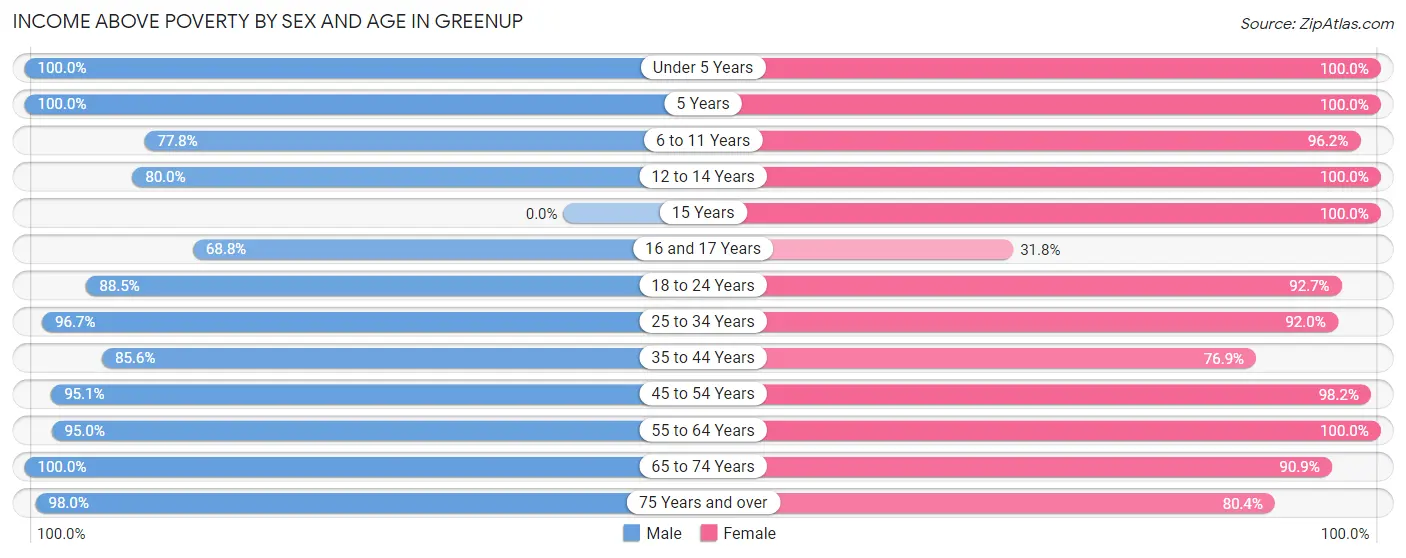
| Age Bracket | Male | Female |
| Under 5 Years | 56 (100.0%) | 52 (100.0%) |
| 5 Years | 3 (100.0%) | 43 (100.0%) |
| 6 to 11 Years | 63 (77.8%) | 76 (96.2%) |
| 12 to 14 Years | 16 (80.0%) | 44 (100.0%) |
| 15 Years | 0 (0.0%) | 16 (100.0%) |
| 16 and 17 Years | 22 (68.8%) | 7 (31.8%) |
| 18 to 24 Years | 54 (88.5%) | 102 (92.7%) |
| 25 to 34 Years | 89 (96.7%) | 92 (92.0%) |
| 35 to 44 Years | 137 (85.6%) | 103 (76.9%) |
| 45 to 54 Years | 96 (95.1%) | 107 (98.2%) |
| 55 to 64 Years | 76 (95.0%) | 21 (100.0%) |
| 65 to 74 Years | 38 (100.0%) | 90 (90.9%) |
| 75 Years and over | 96 (98.0%) | 90 (80.4%) |
| Total | 746 (90.7%) | 843 (89.6%) |
Income Below Poverty Among Married-Couple Families in Greenup
The poverty statistics for married-couple families in Greenup show that 0.9% or 3 of the total 315 families live below the poverty line. Families with no children have the highest poverty rate of 2.0%, comprising of 3 families. On the other hand, families with 1 or 2 children have the lowest poverty rate of 0.0%, which includes 0 families.
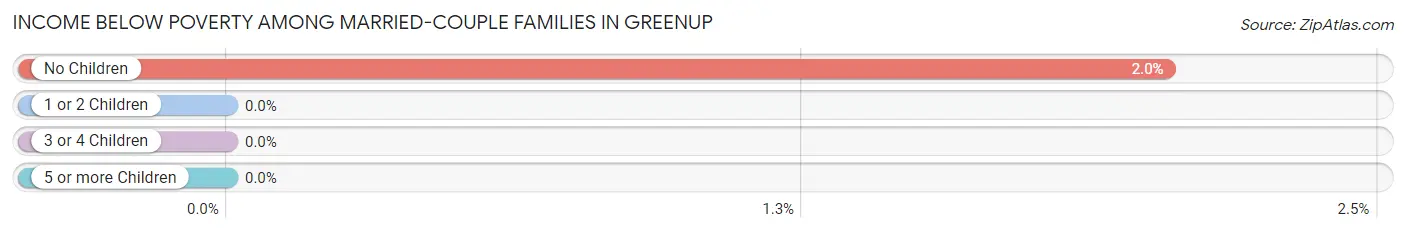
| Children | Above Poverty | Below Poverty |
| No Children | 144 (98.0%) | 3 (2.0%) |
| 1 or 2 Children | 152 (100.0%) | 0 (0.0%) |
| 3 or 4 Children | 16 (100.0%) | 0 (0.0%) |
| 5 or more Children | 0 (0.0%) | 0 (0.0%) |
| Total | 312 (99.1%) | 3 (0.9%) |
Income Below Poverty Among Single-Parent Households in Greenup
According to the poverty data in Greenup, 83.3% or 5 single-father households and 8.1% or 6 single-mother households are living below the poverty line. Among single-father households, those with no children have the highest poverty rate, with 2 households (100.0%) experiencing poverty. Likewise, among single-mother households, those with 3 or 4 children have the highest poverty rate, with 4 households (17.4%) falling below the poverty line.
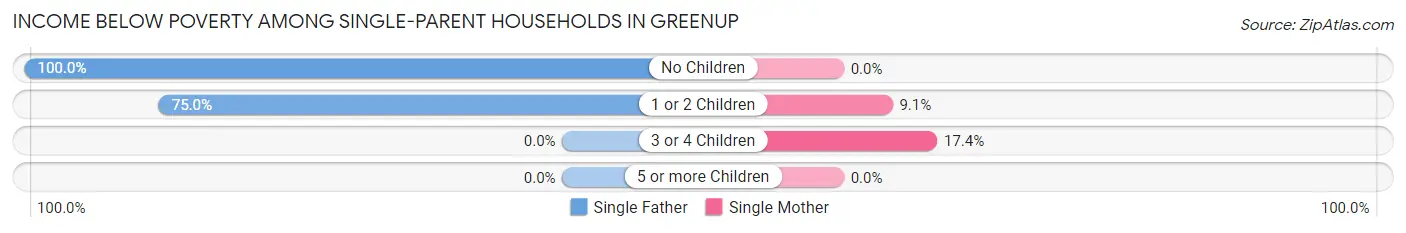
| Children | Single Father | Single Mother |
| No Children | 2 (100.0%) | 0 (0.0%) |
| 1 or 2 Children | 3 (75.0%) | 2 (9.1%) |
| 3 or 4 Children | 0 (0.0%) | 4 (17.4%) |
| 5 or more Children | 0 (0.0%) | 0 (0.0%) |
| Total | 5 (83.3%) | 6 (8.1%) |
Income Below Poverty Among Married-Couple vs Single-Parent Households in Greenup
The poverty data for Greenup shows that 3 of the married-couple family households (0.9%) and 11 of the single-parent households (13.8%) are living below the poverty level. Within the married-couple family households, those with no children have the highest poverty rate, with 3 households (2.0%) falling below the poverty line. Among the single-parent households, those with 1 or 2 children have the highest poverty rate, with 5 household (19.2%) living below poverty.
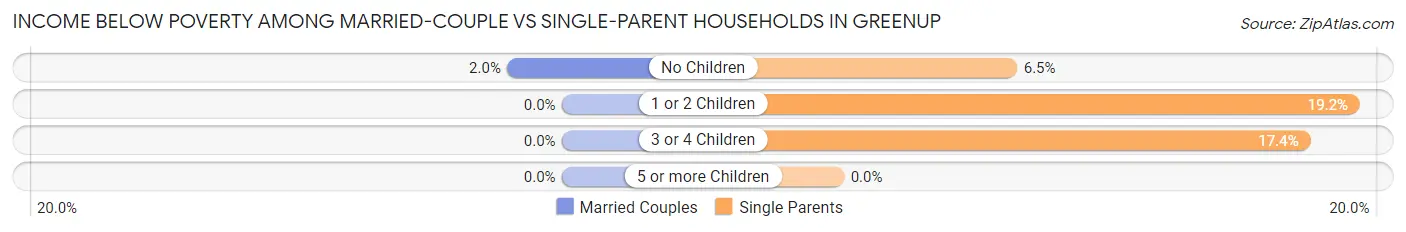
| Children | Married-Couple Families | Single-Parent Households |
| No Children | 3 (2.0%) | 2 (6.5%) |
| 1 or 2 Children | 0 (0.0%) | 5 (19.2%) |
| 3 or 4 Children | 0 (0.0%) | 4 (17.4%) |
| 5 or more Children | 0 (0.0%) | 0 (0.0%) |
| Total | 3 (0.9%) | 11 (13.8%) |
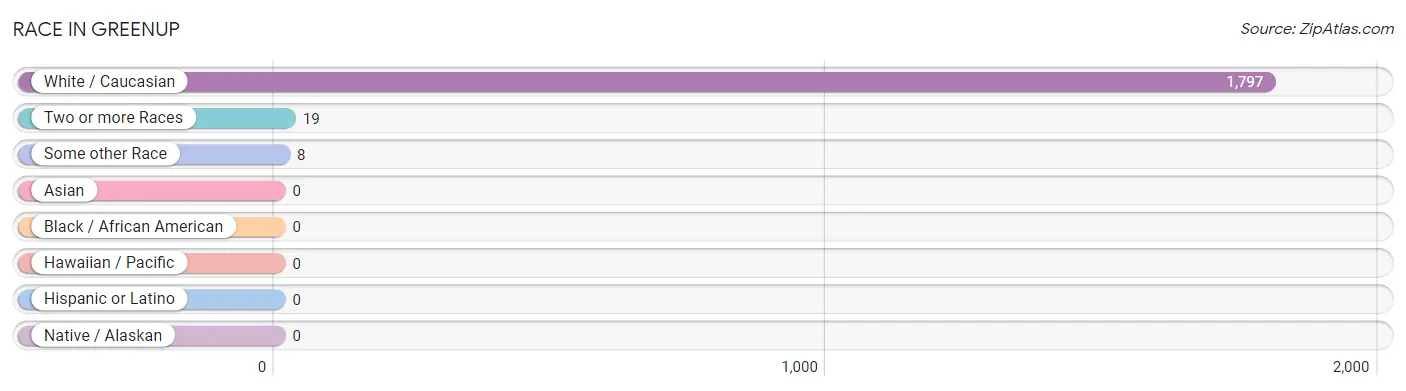
Race in Greenup
The most populous races in Greenup are White / Caucasian (1,797 | 98.5%), Two or more Races (19 | 1.0%), and Some other Race (8 | 0.4%).
| Race | # Population | % Population |
| Asian | 0 | 0.0% |
| Black / African American | 0 | 0.0% |
| Hawaiian / Pacific | 0 | 0.0% |
| Hispanic or Latino | 0 | 0.0% |
| Native / Alaskan | 0 | 0.0% |
| White / Caucasian | 1,797 | 98.5% |
| Two or more Races | 19 | 1.0% |
| Some other Race | 8 | 0.4% |
| Total | 1,824 | 100.0% |
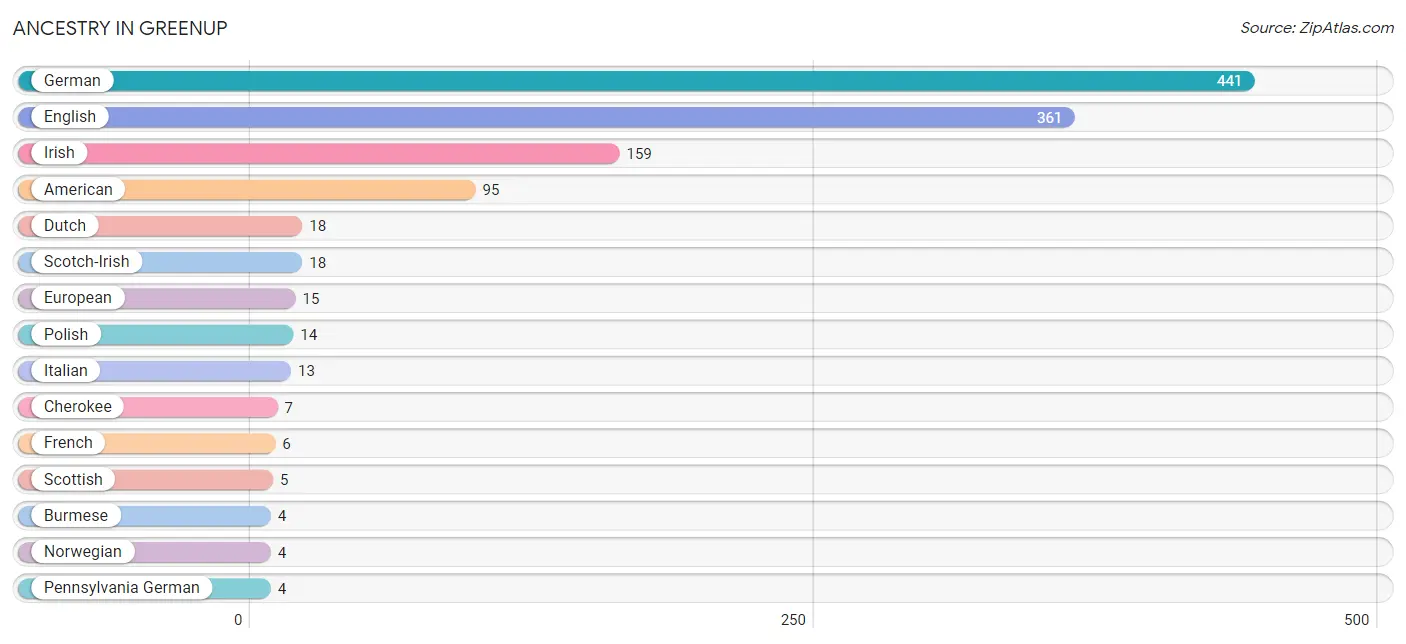
Ancestry in Greenup
The most populous ancestries reported in Greenup are German (441 | 24.2%), English (361 | 19.8%), Irish (159 | 8.7%), American (95 | 5.2%), and Dutch (18 | 1.0%), together accounting for 58.9% of all Greenup residents.
| Ancestry | # Population | % Population |
| American | 95 | 5.2% |
| Burmese | 4 | 0.2% |
| Cherokee | 7 | 0.4% |
| Dutch | 18 | 1.0% |
| English | 361 | 19.8% |
| European | 15 | 0.8% |
| French | 6 | 0.3% |
| German | 441 | 24.2% |
| Irish | 159 | 8.7% |
| Italian | 13 | 0.7% |
| Norwegian | 4 | 0.2% |
| Pennsylvania German | 4 | 0.2% |
| Polish | 14 | 0.8% |
| Scotch-Irish | 18 | 1.0% |
| Scottish | 5 | 0.3% |
| Swedish | 3 | 0.2% |
| Welsh | 2 | 0.1% | View All 17 Rows |
Immigrants in Greenup

| Immigration Origin | # Population | % Population | View All 0 Rows |
Sex and Age in Greenup
Sex and Age in Greenup
The most populous age groups in Greenup are 35 to 39 Years (98 | 11.7%) for men and 5 to 9 Years (110 | 11.1%) for women.
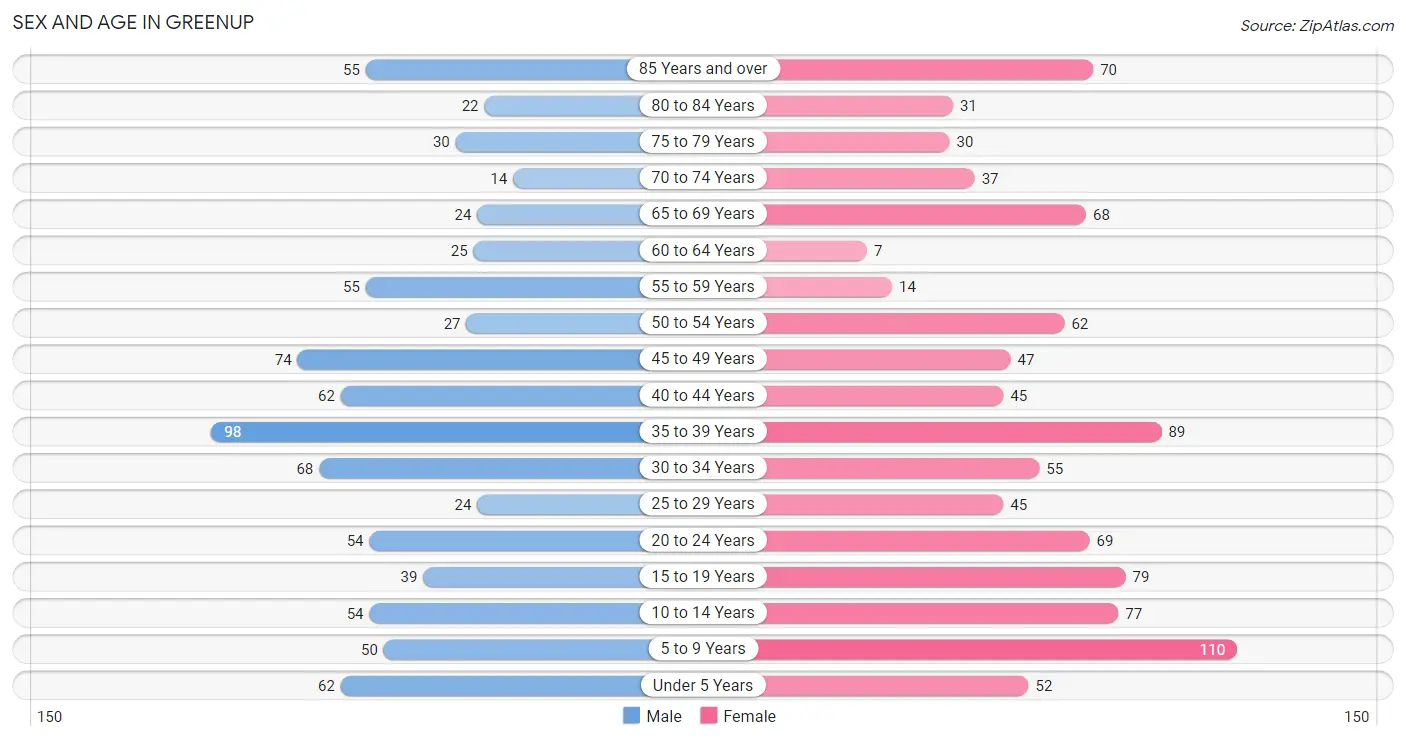
| Age Bracket | Male | Female |
| Under 5 Years | 62 (7.4%) | 52 (5.3%) |
| 5 to 9 Years | 50 (6.0%) | 110 (11.1%) |
| 10 to 14 Years | 54 (6.5%) | 77 (7.8%) |
| 15 to 19 Years | 39 (4.7%) | 79 (8.0%) |
| 20 to 24 Years | 54 (6.5%) | 69 (7.0%) |
| 25 to 29 Years | 24 (2.9%) | 45 (4.6%) |
| 30 to 34 Years | 68 (8.1%) | 55 (5.6%) |
| 35 to 39 Years | 98 (11.7%) | 89 (9.0%) |
| 40 to 44 Years | 62 (7.4%) | 45 (4.6%) |
| 45 to 49 Years | 74 (8.8%) | 47 (4.8%) |
| 50 to 54 Years | 27 (3.2%) | 62 (6.3%) |
| 55 to 59 Years | 55 (6.6%) | 14 (1.4%) |
| 60 to 64 Years | 25 (3.0%) | 7 (0.7%) |
| 65 to 69 Years | 24 (2.9%) | 68 (6.9%) |
| 70 to 74 Years | 14 (1.7%) | 37 (3.7%) |
| 75 to 79 Years | 30 (3.6%) | 30 (3.0%) |
| 80 to 84 Years | 22 (2.6%) | 31 (3.1%) |
| 85 Years and over | 55 (6.6%) | 70 (7.1%) |
| Total | 837 (100.0%) | 987 (100.0%) |
Families and Households in Greenup
Median Family Size in Greenup
The median family size in Greenup is 3.25 persons per family, with single female/mother families (74 | 18.7%) accounting for the largest median family size of 3.58 persons per family. On the other hand, single male/father families (6 | 1.5%) represent the smallest median family size with 2.17 persons per family.
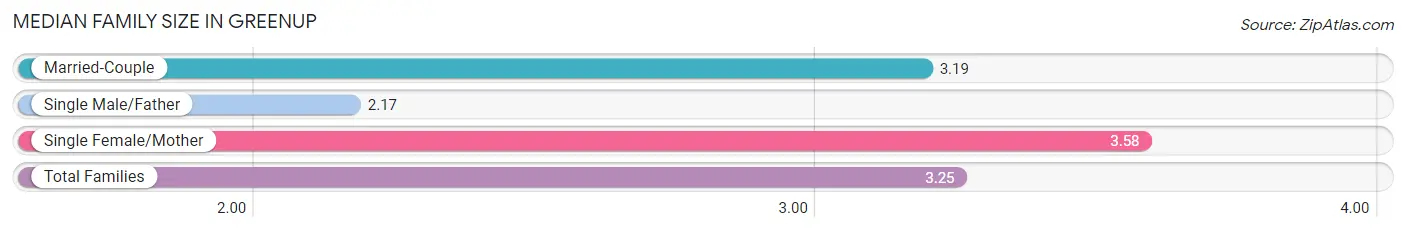
| Family Type | # Families | Family Size |
| Married-Couple | 315 (79.7%) | 3.19 |
| Single Male/Father | 6 (1.5%) | 2.17 |
| Single Female/Mother | 74 (18.7%) | 3.58 |
| Total Families | 395 (100.0%) | 3.25 |
Median Household Size in Greenup
The median household size in Greenup is 2.44 persons per household, with single male/father households (6 | 0.8%) accounting for the largest median household size of 4.5 persons per household. non-family households (339 | 46.2%) represent the smallest median household size with 1.35 persons per household.
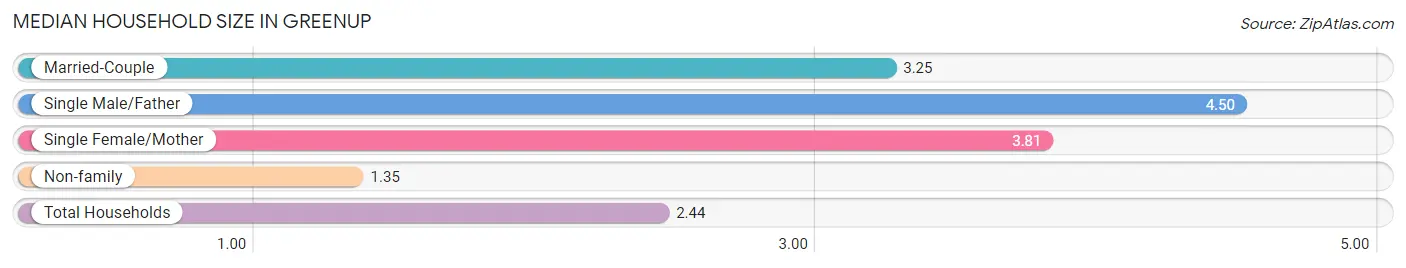
| Household Type | # Households | Household Size |
| Married-Couple | 315 (42.9%) | 3.25 |
| Single Male/Father | 6 (0.8%) | 4.50 |
| Single Female/Mother | 74 (10.1%) | 3.81 |
| Non-family | 339 (46.2%) | 1.35 |
| Total Households | 734 (100.0%) | 2.44 |
Household Size by Marriage Status in Greenup
Out of a total of 734 households in Greenup, 395 (53.8%) are family households, while 339 (46.2%) are nonfamily households. The most numerous type of family households are 2-person households, comprising 144, and the most common type of nonfamily households are 1-person households, comprising 314.
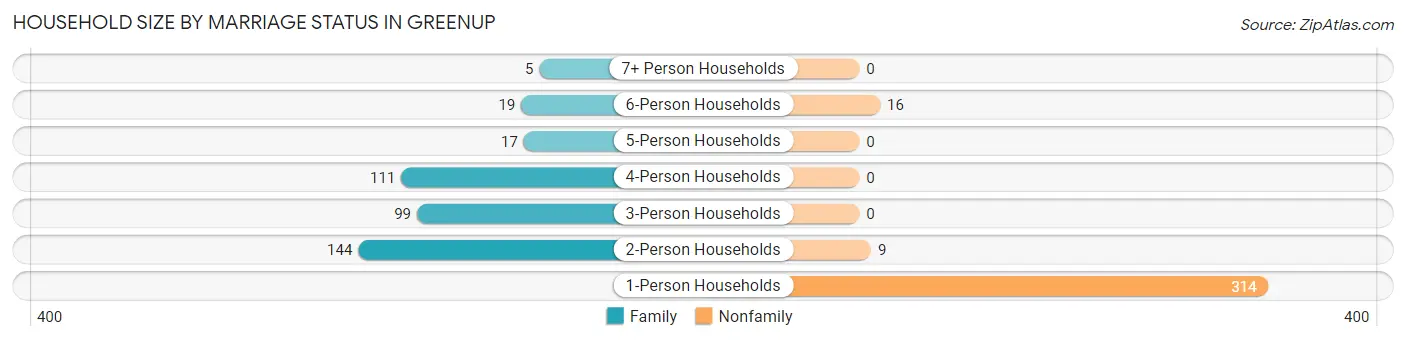
| Household Size | Family Households | Nonfamily Households |
| 1-Person Households | - | 314 (42.8%) |
| 2-Person Households | 144 (19.6%) | 9 (1.2%) |
| 3-Person Households | 99 (13.5%) | 0 (0.0%) |
| 4-Person Households | 111 (15.1%) | 0 (0.0%) |
| 5-Person Households | 17 (2.3%) | 0 (0.0%) |
| 6-Person Households | 19 (2.6%) | 16 (2.2%) |
| 7+ Person Households | 5 (0.7%) | 0 (0.0%) |
| Total | 395 (53.8%) | 339 (46.2%) |
Female Fertility in Greenup
Fertility by Age in Greenup
Average fertility rate in Greenup is 108.0 births per 1,000 women. Women in the age bracket of 20 to 34 years have the highest fertility rate with 219.0 births per 1,000 women. Women in the age bracket of 20 to 34 years acount for 78.7% of all women with births.
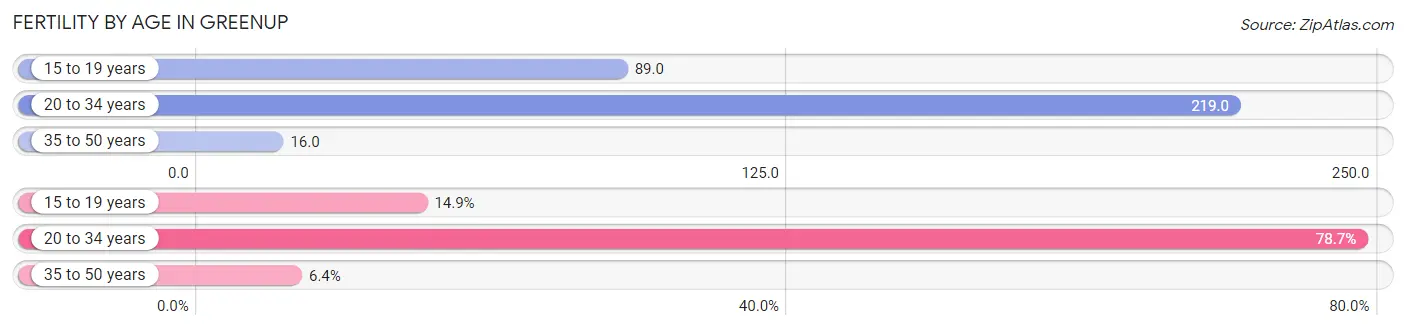
| Age Bracket | Women with Births | Births / 1,000 Women |
| 15 to 19 years | 7 (14.9%) | 89.0 |
| 20 to 34 years | 37 (78.7%) | 219.0 |
| 35 to 50 years | 3 (6.4%) | 16.0 |
| Total | 47 (100.0%) | 108.0 |
Fertility by Age by Marriage Status in Greenup
48.9% of women with births (47) in Greenup are married. The highest percentage of unmarried women with births falls into 15 to 19 years age bracket with 100.0% of them unmarried at the time of birth, while the lowest percentage of unmarried women with births belong to 35 to 50 years age bracket with 0.0% of them unmarried.
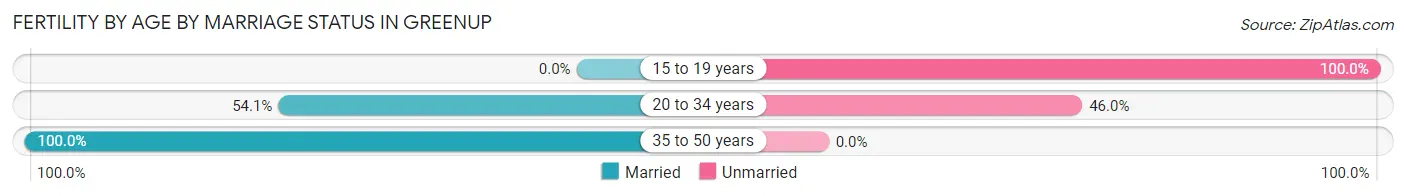
| Age Bracket | Married | Unmarried |
| 15 to 19 years | 0 (0.0%) | 7 (100.0%) |
| 20 to 34 years | 20 (54.0%) | 17 (46.0%) |
| 35 to 50 years | 3 (100.0%) | 0 (0.0%) |
| Total | 23 (48.9%) | 24 (51.1%) |
Fertility by Education in Greenup
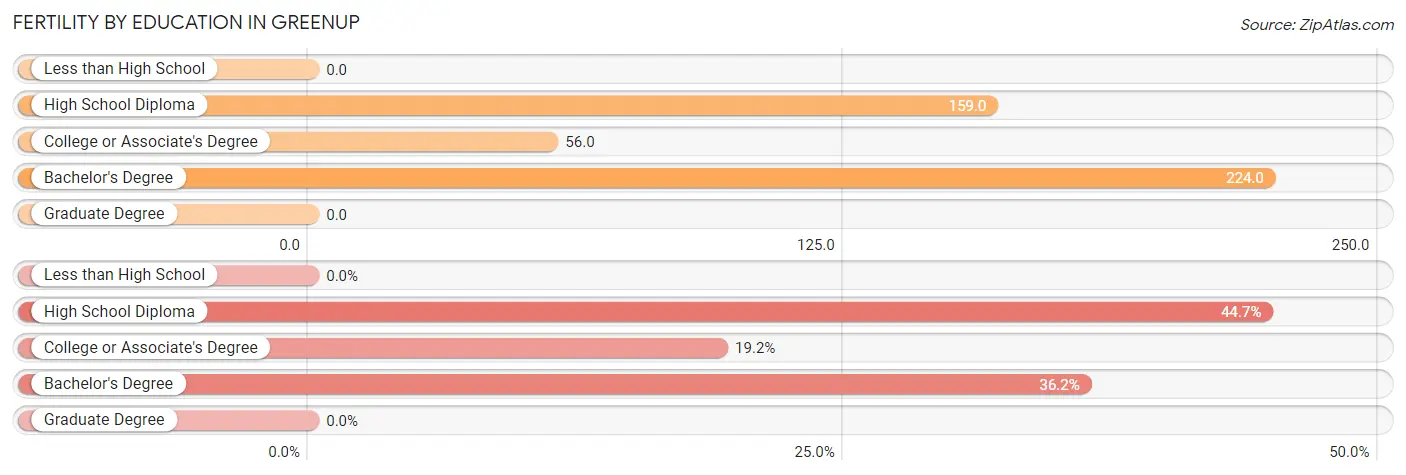
| Educational Attainment | Women with Births | Births / 1,000 Women |
| Less than High School | 0 (0.0%) | 0.0 |
| High School Diploma | 21 (44.7%) | 159.0 |
| College or Associate's Degree | 9 (19.2%) | 56.0 |
| Bachelor's Degree | 17 (36.2%) | 224.0 |
| Graduate Degree | 0 (0.0%) | 0.0 |
| Total | 47 (100.0%) | 108.0 |
Fertility by Education by Marriage Status in Greenup
51.1% of women with births in Greenup are unmarried. Women with the educational attainment of bachelor's degree are most likely to be married with 100.0% of them married at childbirth, while women with the educational attainment of college or associate's degree are least likely to be married with 100.0% of them unmarried at childbirth.
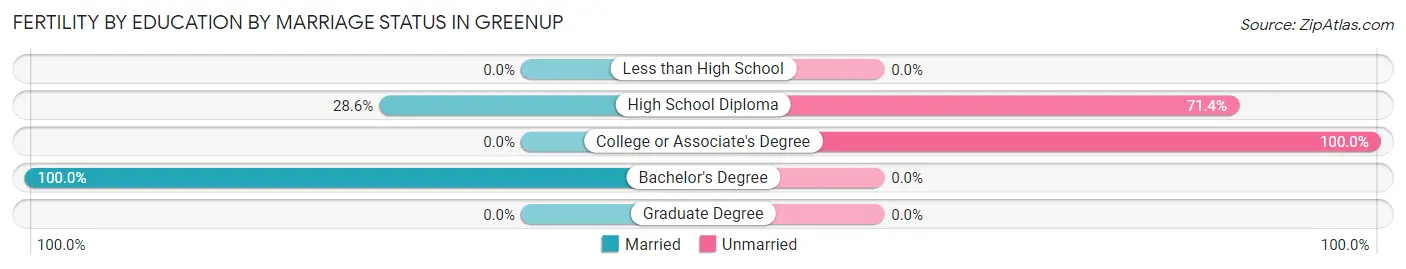
| Educational Attainment | Married | Unmarried |
| Less than High School | 0 (0.0%) | 0 (0.0%) |
| High School Diploma | 6 (28.6%) | 15 (71.4%) |
| College or Associate's Degree | 0 (0.0%) | 9 (100.0%) |
| Bachelor's Degree | 17 (100.0%) | 0 (0.0%) |
| Graduate Degree | 0 (0.0%) | 0 (0.0%) |
| Total | 23 (48.9%) | 24 (51.1%) |
Employment Characteristics in Greenup
Employment by Class of Employer in Greenup
Among the 838 employed individuals in Greenup, private company employees (630 | 75.2%), not-for-profit organizations (81 | 9.7%), and local government employees (46 | 5.5%) make up the most common classes of employment.
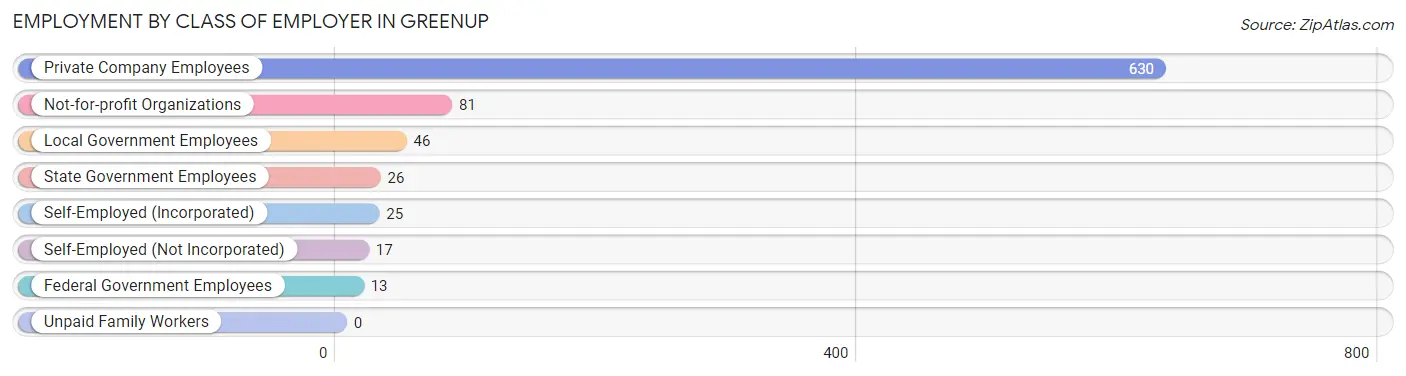
| Employer Class | # Employees | % Employees |
| Private Company Employees | 630 | 75.2% |
| Self-Employed (Incorporated) | 25 | 3.0% |
| Self-Employed (Not Incorporated) | 17 | 2.0% |
| Not-for-profit Organizations | 81 | 9.7% |
| Local Government Employees | 46 | 5.5% |
| State Government Employees | 26 | 3.1% |
| Federal Government Employees | 13 | 1.5% |
| Unpaid Family Workers | 0 | 0.0% |
| Total | 838 | 100.0% |
Employment Status by Age in Greenup
According to the labor force statistics for Greenup, out of the total population over 16 years of age (1,403), 61.9% or 868 individuals are in the labor force, with 1.7% or 15 of them unemployed. The age group with the highest labor force participation rate is 25 to 29 years, with 95.7% or 66 individuals in the labor force. Within the labor force, the 30 to 34 years age range has the highest percentage of unemployed individuals, with 7.8% or 8 of them being unemployed.
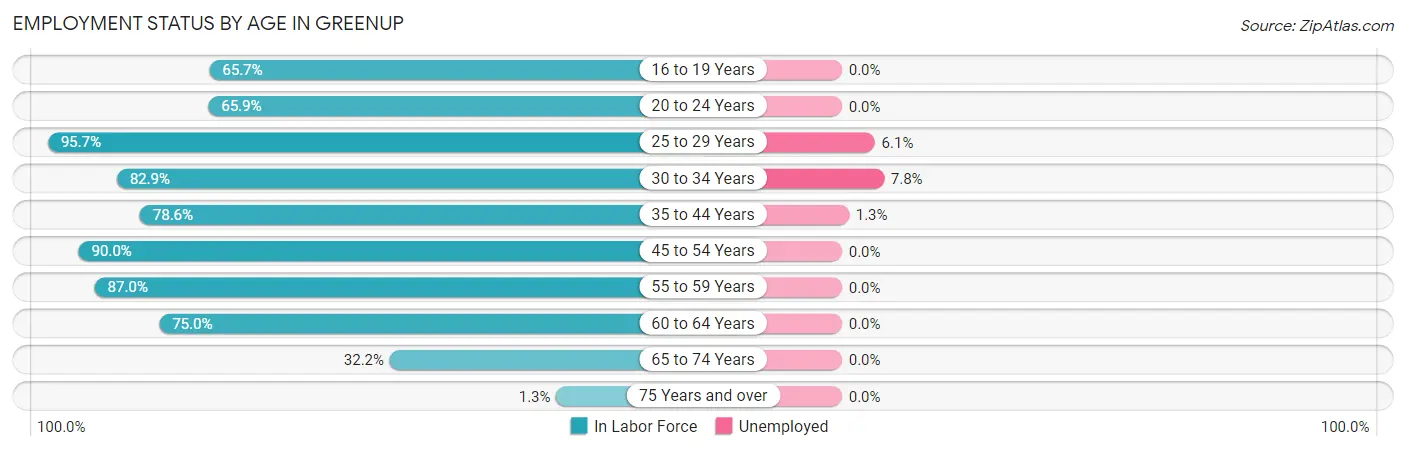
| Age Bracket | In Labor Force | Unemployed |
| 16 to 19 Years | 67 (65.7%) | 0 (0.0%) |
| 20 to 24 Years | 81 (65.9%) | 0 (0.0%) |
| 25 to 29 Years | 66 (95.7%) | 4 (6.1%) |
| 30 to 34 Years | 102 (82.9%) | 8 (7.8%) |
| 35 to 44 Years | 231 (78.6%) | 3 (1.3%) |
| 45 to 54 Years | 189 (90.0%) | 0 (0.0%) |
| 55 to 59 Years | 60 (87.0%) | 0 (0.0%) |
| 60 to 64 Years | 24 (75.0%) | 0 (0.0%) |
| 65 to 74 Years | 46 (32.2%) | 0 (0.0%) |
| 75 Years and over | 3 (1.3%) | 0 (0.0%) |
| Total | 868 (61.9%) | 15 (1.7%) |
Employment Status by Educational Attainment in Greenup
According to labor force statistics for Greenup, 84.3% of individuals (672) out of the total population between 25 and 64 years of age (797) are in the labor force, with 2.2% or 15 of them being unemployed. The group with the highest labor force participation rate are those with the educational attainment of bachelor's degree or higher, with 96.6% or 115 individuals in the labor force. Within the labor force, individuals with high school diploma education have the highest percentage of unemployment, with 4.0% or 11 of them being unemployed.
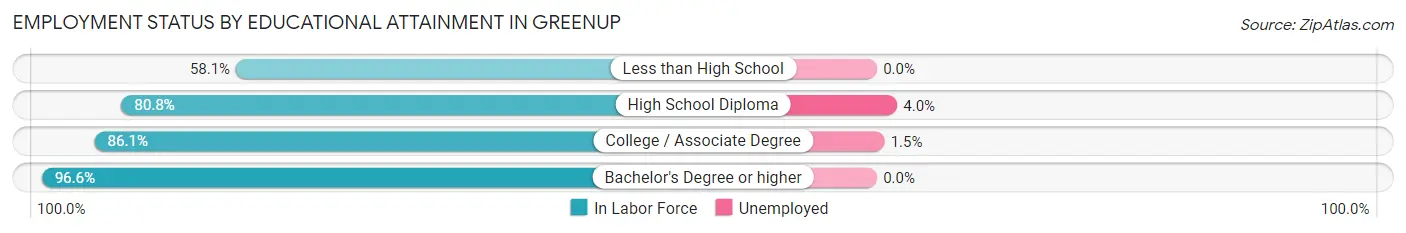
| Educational Attainment | In Labor Force | Unemployed |
| Less than High School | 18 (58.1%) | 0 (0.0%) |
| High School Diploma | 273 (80.8%) | 14 (4.0%) |
| College / Associate Degree | 266 (86.1%) | 5 (1.5%) |
| Bachelor's Degree or higher | 115 (96.6%) | 0 (0.0%) |
| Total | 672 (84.3%) | 18 (2.2%) |
Employment Occupations by Sex in Greenup
Management, Business, Science and Arts Occupations
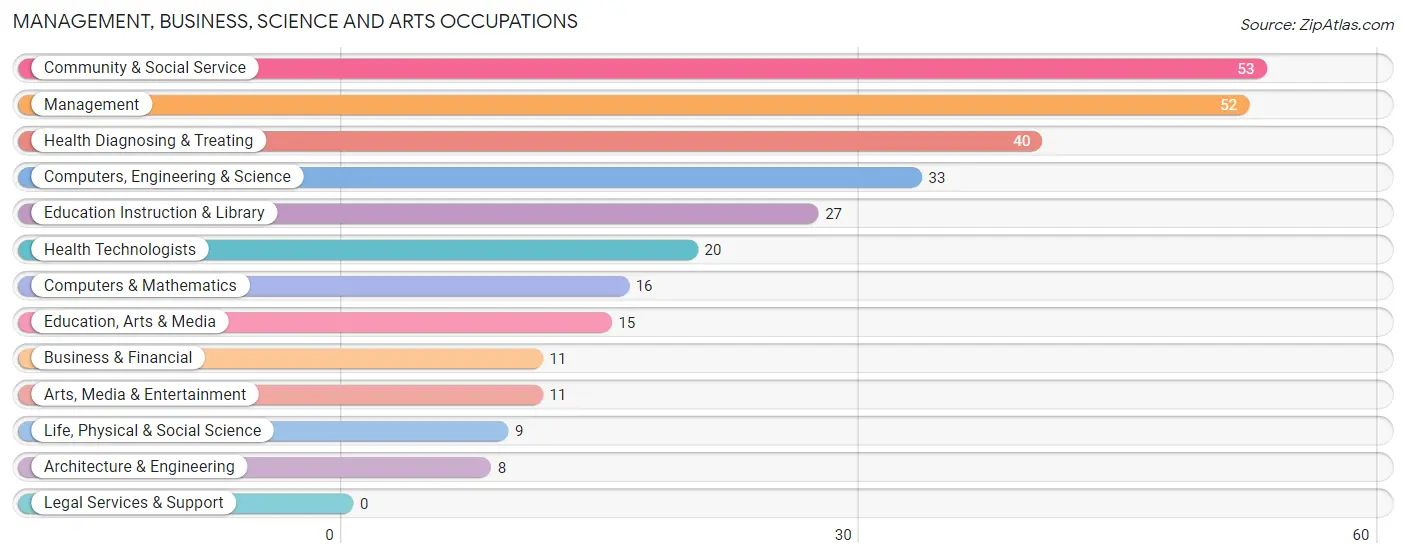
The most common Management, Business, Science and Arts occupations in Greenup are Community & Social Service (53 | 6.2%), Management (52 | 6.1%), Health Diagnosing & Treating (40 | 4.7%), Computers, Engineering & Science (33 | 3.9%), and Education Instruction & Library (27 | 3.2%).
Management, Business, Science and Arts Occupations by Sex
Within the Management, Business, Science and Arts occupations in Greenup, the most male-oriented occupations are Architecture & Engineering (100.0%), Business & Financial (63.6%), and Computers, Engineering & Science (51.5%), while the most female-oriented occupations are Education, Arts & Media (100.0%), Health Technologists (100.0%), and Education Instruction & Library (96.3%).
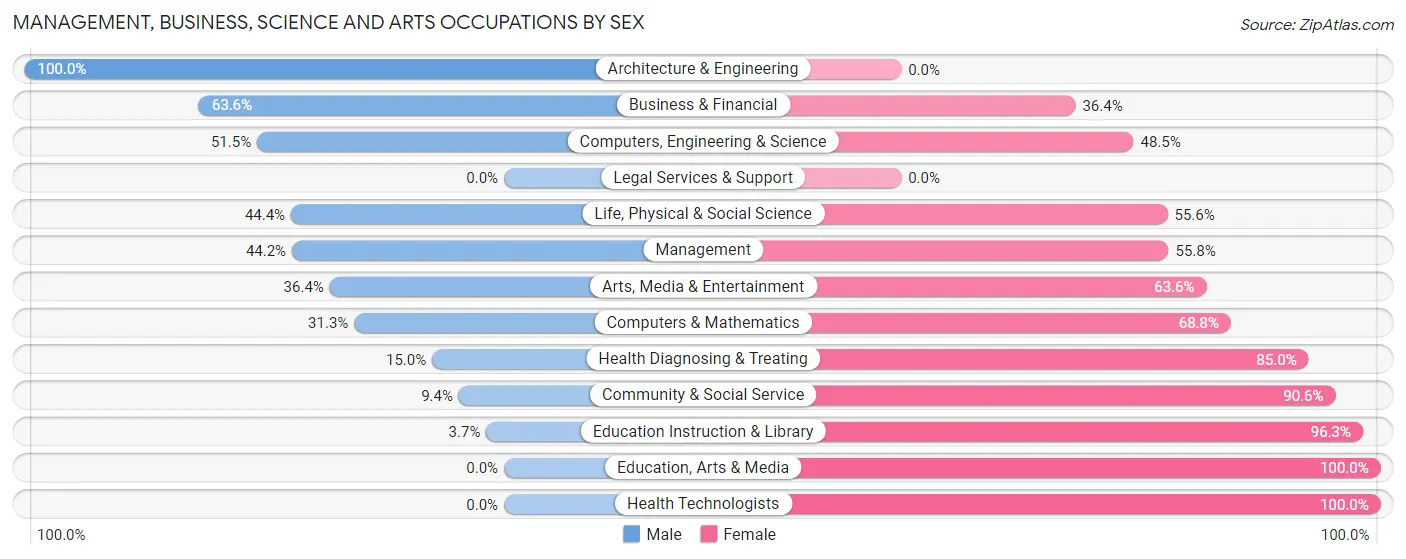
| Occupation | Male | Female |
| Management | 23 (44.2%) | 29 (55.8%) |
| Business & Financial | 7 (63.6%) | 4 (36.4%) |
| Computers, Engineering & Science | 17 (51.5%) | 16 (48.5%) |
| Computers & Mathematics | 5 (31.2%) | 11 (68.8%) |
| Architecture & Engineering | 8 (100.0%) | 0 (0.0%) |
| Life, Physical & Social Science | 4 (44.4%) | 5 (55.6%) |
| Community & Social Service | 5 (9.4%) | 48 (90.6%) |
| Education, Arts & Media | 0 (0.0%) | 15 (100.0%) |
| Legal Services & Support | 0 (0.0%) | 0 (0.0%) |
| Education Instruction & Library | 1 (3.7%) | 26 (96.3%) |
| Arts, Media & Entertainment | 4 (36.4%) | 7 (63.6%) |
| Health Diagnosing & Treating | 6 (15.0%) | 34 (85.0%) |
| Health Technologists | 0 (0.0%) | 20 (100.0%) |
| Total (Category) | 58 (30.7%) | 131 (69.3%) |
| Total (Overall) | 427 (50.0%) | 427 (50.0%) |
Services Occupations
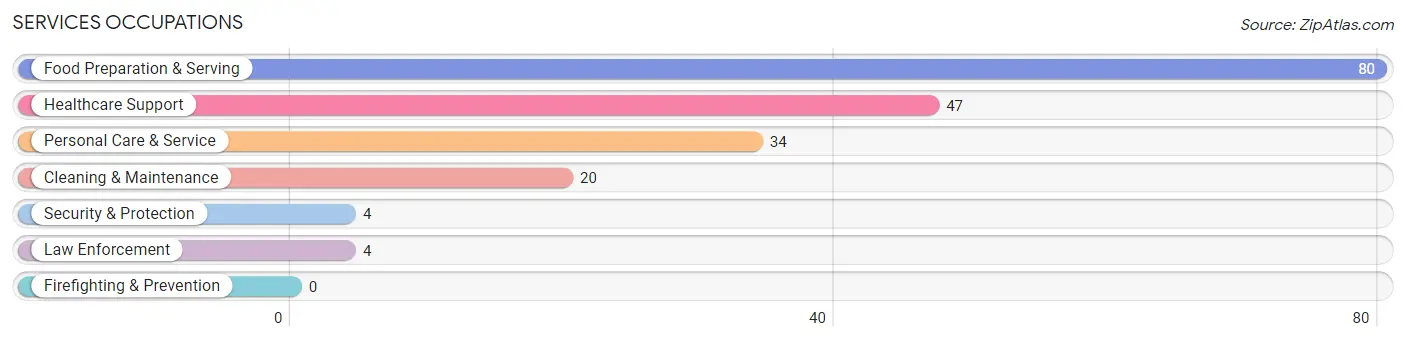
The most common Services occupations in Greenup are Food Preparation & Serving (80 | 9.4%), Healthcare Support (47 | 5.5%), Personal Care & Service (34 | 4.0%), Cleaning & Maintenance (20 | 2.3%), and Security & Protection (4 | 0.5%).
Services Occupations by Sex
Within the Services occupations in Greenup, the most male-oriented occupations are Security & Protection (100.0%), Law Enforcement (100.0%), and Cleaning & Maintenance (100.0%), while the most female-oriented occupations are Healthcare Support (100.0%), Personal Care & Service (100.0%), and Food Preparation & Serving (71.3%).
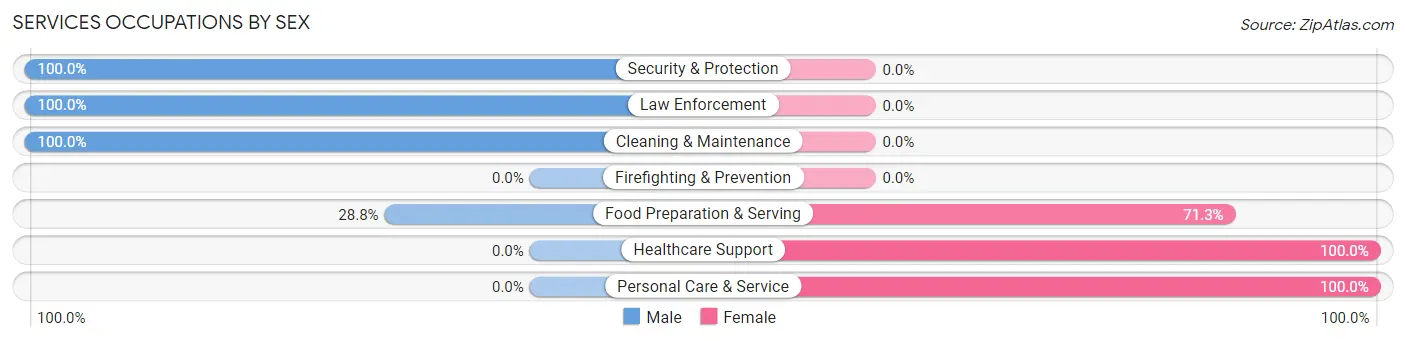
| Occupation | Male | Female |
| Healthcare Support | 0 (0.0%) | 47 (100.0%) |
| Security & Protection | 4 (100.0%) | 0 (0.0%) |
| Firefighting & Prevention | 0 (0.0%) | 0 (0.0%) |
| Law Enforcement | 4 (100.0%) | 0 (0.0%) |
| Food Preparation & Serving | 23 (28.7%) | 57 (71.3%) |
| Cleaning & Maintenance | 20 (100.0%) | 0 (0.0%) |
| Personal Care & Service | 0 (0.0%) | 34 (100.0%) |
| Total (Category) | 47 (25.4%) | 138 (74.6%) |
| Total (Overall) | 427 (50.0%) | 427 (50.0%) |
Sales and Office Occupations
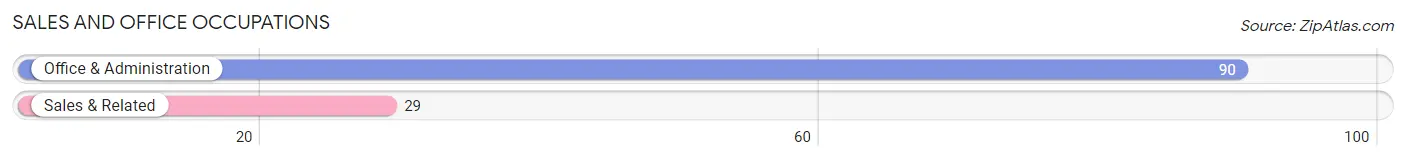
The most common Sales and Office occupations in Greenup are Office & Administration (90 | 10.5%), and Sales & Related (29 | 3.4%).
Sales and Office Occupations by Sex
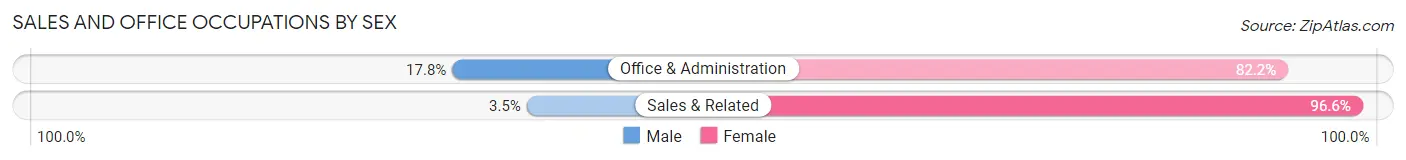
| Occupation | Male | Female |
| Sales & Related | 1 (3.5%) | 28 (96.6%) |
| Office & Administration | 16 (17.8%) | 74 (82.2%) |
| Total (Category) | 17 (14.3%) | 102 (85.7%) |
| Total (Overall) | 427 (50.0%) | 427 (50.0%) |
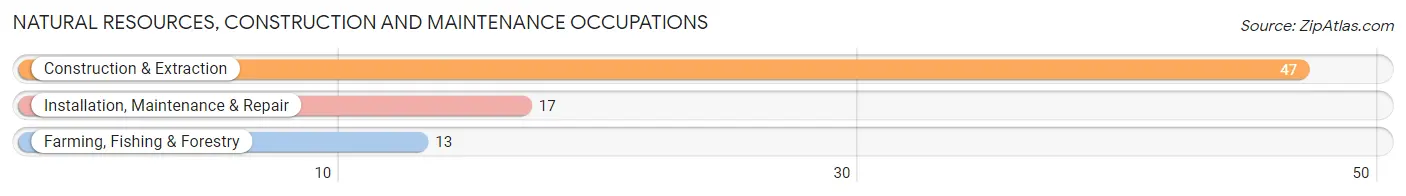
Natural Resources, Construction and Maintenance Occupations
The most common Natural Resources, Construction and Maintenance occupations in Greenup are Construction & Extraction (47 | 5.5%), Installation, Maintenance & Repair (17 | 2.0%), and Farming, Fishing & Forestry (13 | 1.5%).
Natural Resources, Construction and Maintenance Occupations by Sex
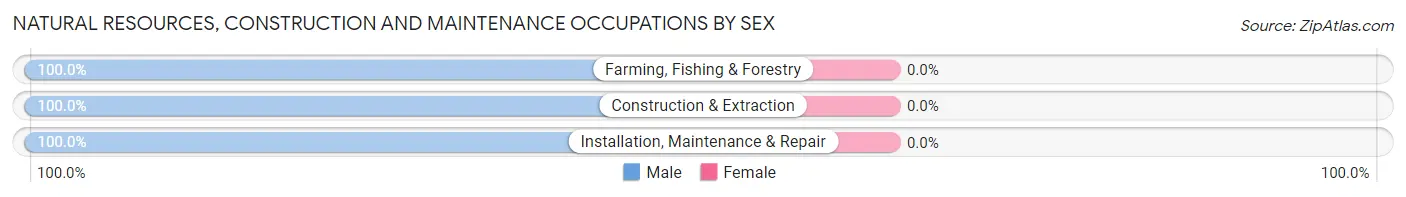
| Occupation | Male | Female |
| Farming, Fishing & Forestry | 13 (100.0%) | 0 (0.0%) |
| Construction & Extraction | 47 (100.0%) | 0 (0.0%) |
| Installation, Maintenance & Repair | 17 (100.0%) | 0 (0.0%) |
| Total (Category) | 77 (100.0%) | 0 (0.0%) |
| Total (Overall) | 427 (50.0%) | 427 (50.0%) |
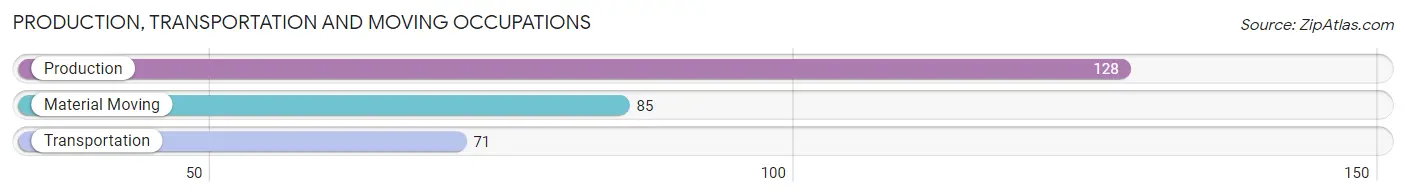
Production, Transportation and Moving Occupations
The most common Production, Transportation and Moving occupations in Greenup are Production (128 | 15.0%), Material Moving (85 | 10.0%), and Transportation (71 | 8.3%).
Production, Transportation and Moving Occupations by Sex
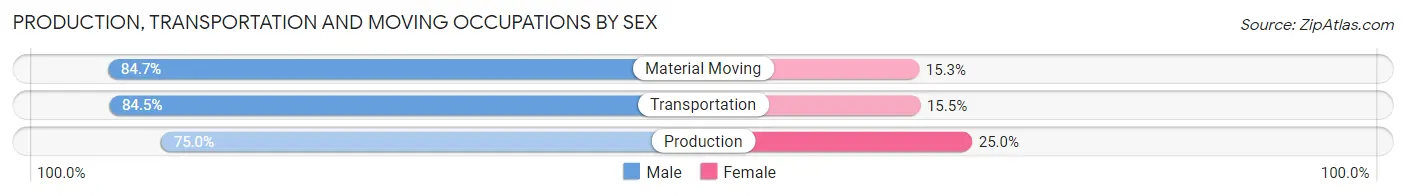
| Occupation | Male | Female |
| Production | 96 (75.0%) | 32 (25.0%) |
| Transportation | 60 (84.5%) | 11 (15.5%) |
| Material Moving | 72 (84.7%) | 13 (15.3%) |
| Total (Category) | 228 (80.3%) | 56 (19.7%) |
| Total (Overall) | 427 (50.0%) | 427 (50.0%) |
Employment Industries by Sex in Greenup
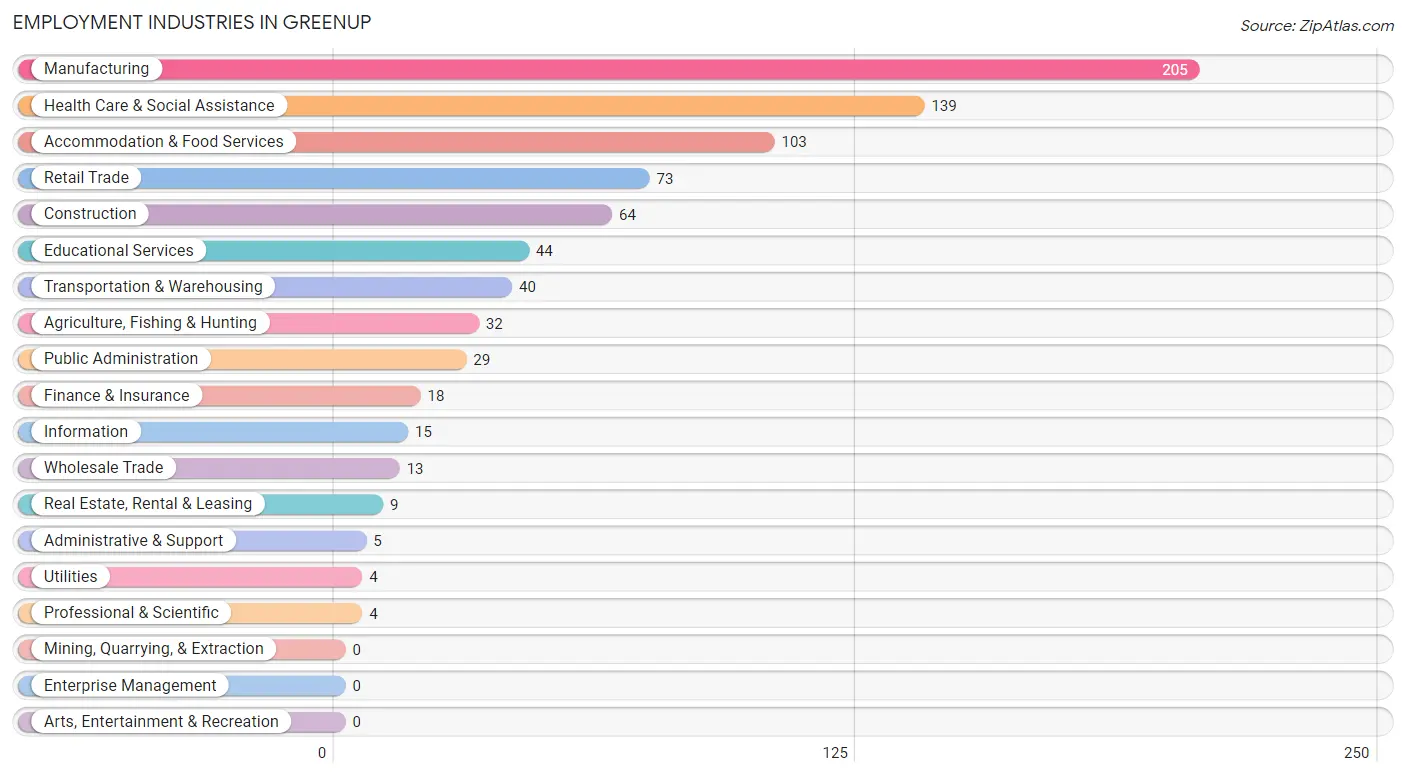
Employment Industries in Greenup
The major employment industries in Greenup include Manufacturing (205 | 24.0%), Health Care & Social Assistance (139 | 16.3%), Accommodation & Food Services (103 | 12.1%), Retail Trade (73 | 8.6%), and Construction (64 | 7.5%).
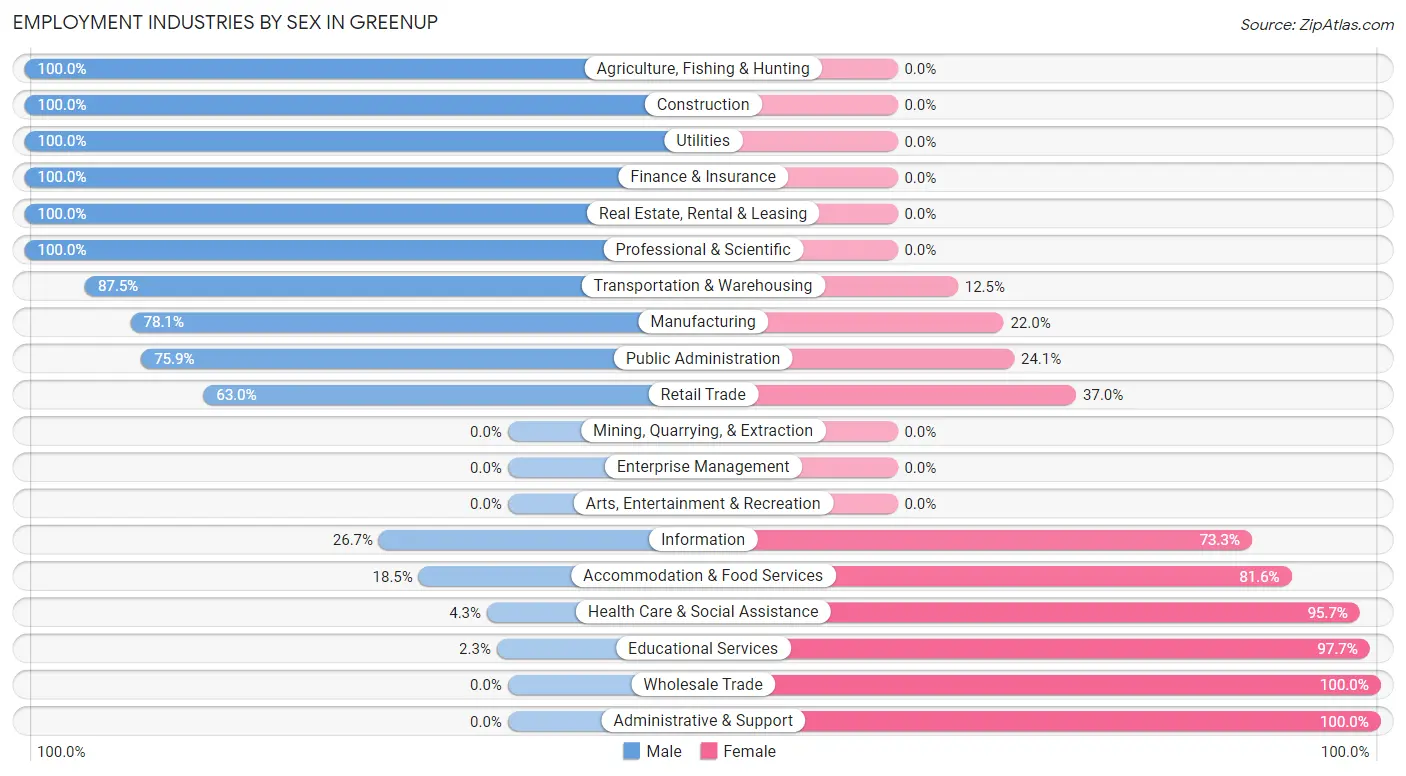
Employment Industries by Sex in Greenup
The Greenup industries that see more men than women are Agriculture, Fishing & Hunting (100.0%), Construction (100.0%), and Utilities (100.0%), whereas the industries that tend to have a higher number of women are Wholesale Trade (100.0%), Administrative & Support (100.0%), and Educational Services (97.7%).
| Industry | Male | Female |
| Agriculture, Fishing & Hunting | 32 (100.0%) | 0 (0.0%) |
| Mining, Quarrying, & Extraction | 0 (0.0%) | 0 (0.0%) |
| Construction | 64 (100.0%) | 0 (0.0%) |
| Manufacturing | 160 (78.0%) | 45 (22.0%) |
| Wholesale Trade | 0 (0.0%) | 13 (100.0%) |
| Retail Trade | 46 (63.0%) | 27 (37.0%) |
| Transportation & Warehousing | 35 (87.5%) | 5 (12.5%) |
| Utilities | 4 (100.0%) | 0 (0.0%) |
| Information | 4 (26.7%) | 11 (73.3%) |
| Finance & Insurance | 18 (100.0%) | 0 (0.0%) |
| Real Estate, Rental & Leasing | 9 (100.0%) | 0 (0.0%) |
| Professional & Scientific | 4 (100.0%) | 0 (0.0%) |
| Enterprise Management | 0 (0.0%) | 0 (0.0%) |
| Administrative & Support | 0 (0.0%) | 5 (100.0%) |
| Educational Services | 1 (2.3%) | 43 (97.7%) |
| Health Care & Social Assistance | 6 (4.3%) | 133 (95.7%) |
| Arts, Entertainment & Recreation | 0 (0.0%) | 0 (0.0%) |
| Accommodation & Food Services | 19 (18.4%) | 84 (81.6%) |
| Public Administration | 22 (75.9%) | 7 (24.1%) |
| Total | 427 (50.0%) | 427 (50.0%) |
Education in Greenup
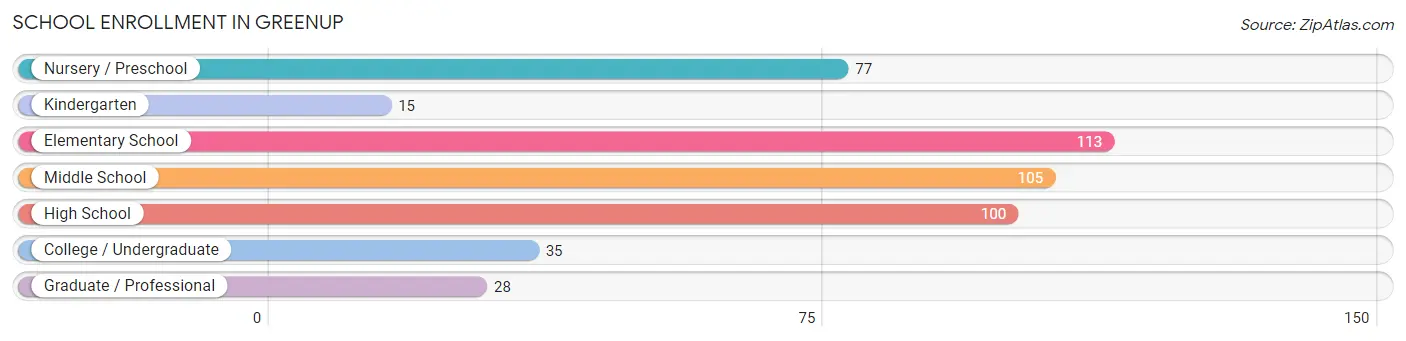
School Enrollment in Greenup
The most common levels of schooling among the 473 students in Greenup are elementary school (113 | 23.9%), middle school (105 | 22.2%), and high school (100 | 21.1%).
| School Level | # Students | % Students |
| Nursery / Preschool | 77 | 16.3% |
| Kindergarten | 15 | 3.2% |
| Elementary School | 113 | 23.9% |
| Middle School | 105 | 22.2% |
| High School | 100 | 21.1% |
| College / Undergraduate | 35 | 7.4% |
| Graduate / Professional | 28 | 5.9% |
| Total | 473 | 100.0% |
School Enrollment by Age by Funding Source in Greenup
Out of a total of 473 students who are enrolled in schools in Greenup, 26 (5.5%) attend a private institution, while the remaining 447 (94.5%) are enrolled in public schools. The age group of 18 to 19 year olds has the highest likelihood of being enrolled in private schools, with 17 (70.8% in the age bracket) enrolled. Conversely, the age group of 3 to 4 year olds has the lowest likelihood of being enrolled in a private school, with 34 (100.0% in the age bracket) attending a public institution.
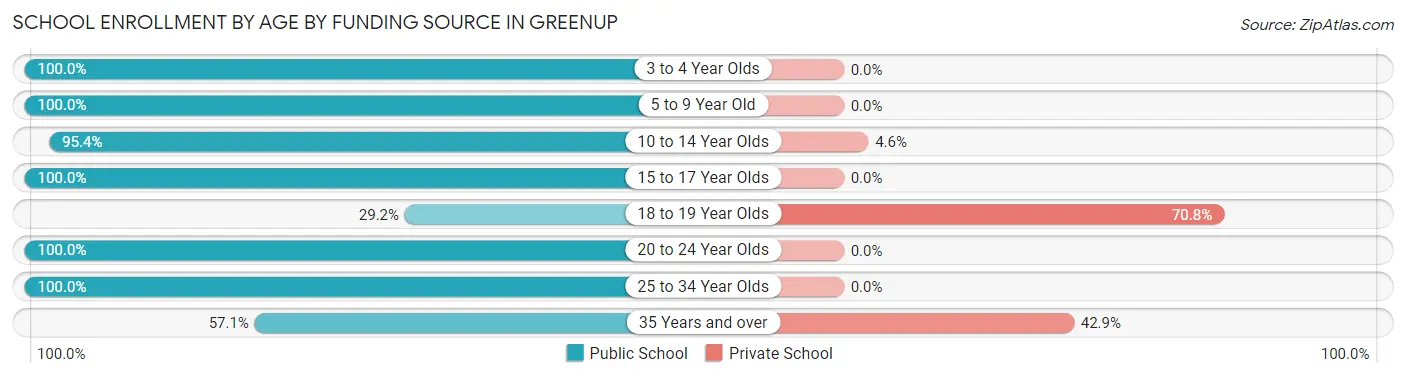
| Age Bracket | Public School | Private School |
| 3 to 4 Year Olds | 34 (100.0%) | 0 (0.0%) |
| 5 to 9 Year Old | 157 (100.0%) | 0 (0.0%) |
| 10 to 14 Year Olds | 125 (95.4%) | 6 (4.6%) |
| 15 to 17 Year Olds | 70 (100.0%) | 0 (0.0%) |
| 18 to 19 Year Olds | 7 (29.2%) | 17 (70.8%) |
| 20 to 24 Year Olds | 23 (100.0%) | 0 (0.0%) |
| 25 to 34 Year Olds | 27 (100.0%) | 0 (0.0%) |
| 35 Years and over | 4 (57.1%) | 3 (42.9%) |
| Total | 447 (94.5%) | 26 (5.5%) |
Educational Attainment by Field of Study in Greenup
Education (65 | 42.8%), science & technology (25 | 16.5%), business (22 | 14.5%), bio, nature & agricultural (16 | 10.5%), and visual & performing arts (8 | 5.3%) are the most common fields of study among 152 individuals in Greenup who have obtained a bachelor's degree or higher.
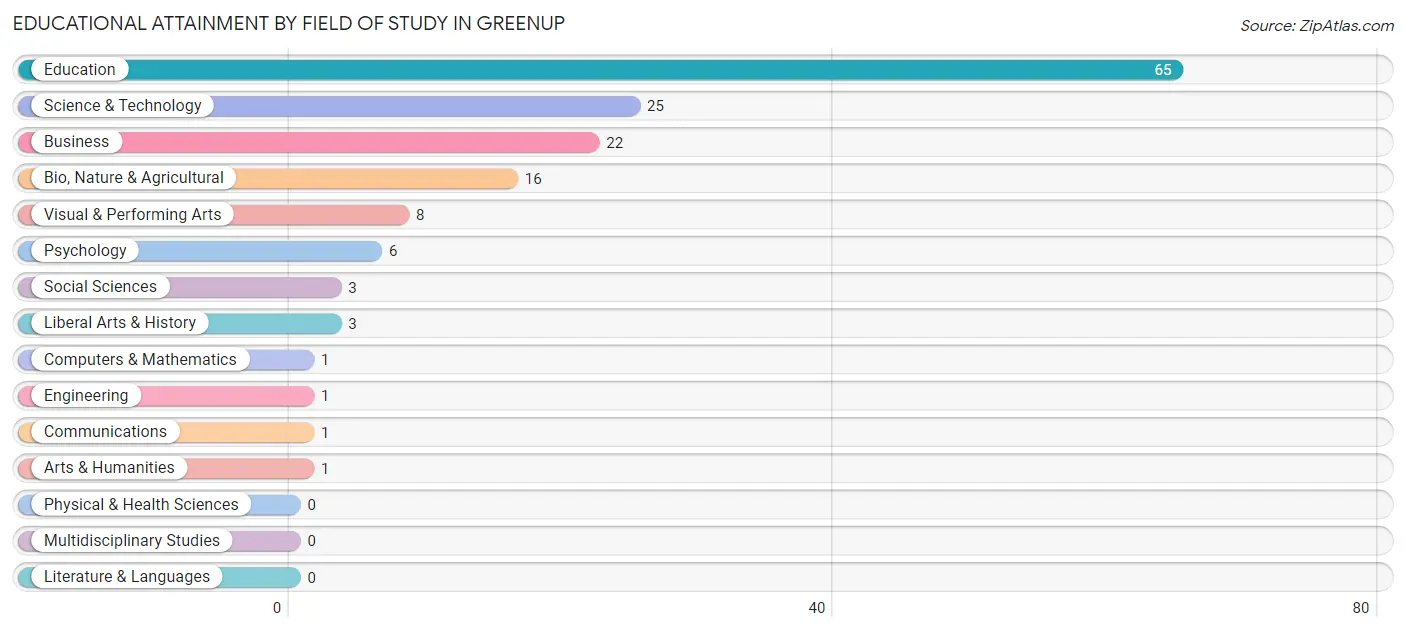
| Field of Study | # Graduates | % Graduates |
| Computers & Mathematics | 1 | 0.7% |
| Bio, Nature & Agricultural | 16 | 10.5% |
| Physical & Health Sciences | 0 | 0.0% |
| Psychology | 6 | 4.0% |
| Social Sciences | 3 | 2.0% |
| Engineering | 1 | 0.7% |
| Multidisciplinary Studies | 0 | 0.0% |
| Science & Technology | 25 | 16.5% |
| Business | 22 | 14.5% |
| Education | 65 | 42.8% |
| Literature & Languages | 0 | 0.0% |
| Liberal Arts & History | 3 | 2.0% |
| Visual & Performing Arts | 8 | 5.3% |
| Communications | 1 | 0.7% |
| Arts & Humanities | 1 | 0.7% |
| Total | 152 | 100.0% |
Transportation & Commute in Greenup
Vehicle Availability by Sex in Greenup
The most prevalent vehicle ownership categories in Greenup are males with 3 vehicles (155, accounting for 37.7%) and females with 3 vehicles (153, making up 36.3%).
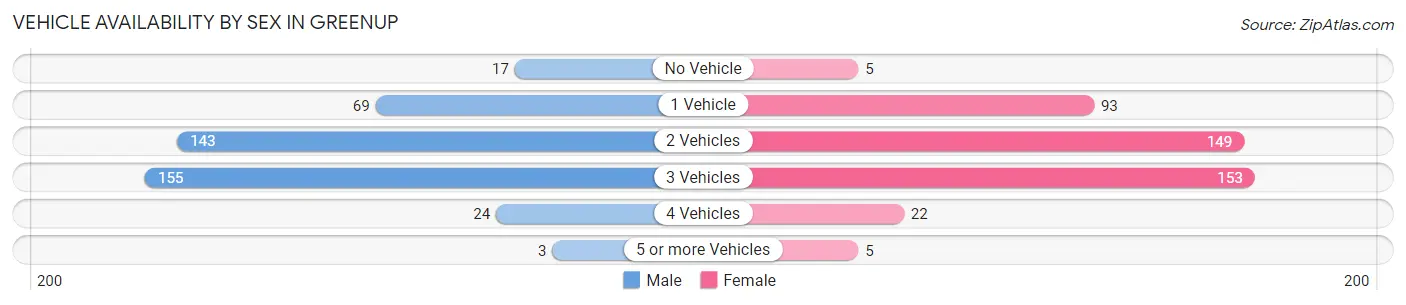
| Vehicles Available | Male | Female |
| No Vehicle | 17 (4.1%) | 5 (1.2%) |
| 1 Vehicle | 69 (16.8%) | 93 (21.8%) |
| 2 Vehicles | 143 (34.8%) | 149 (34.9%) |
| 3 Vehicles | 155 (37.7%) | 153 (35.8%) |
| 4 Vehicles | 24 (5.8%) | 22 (5.1%) |
| 5 or more Vehicles | 3 (0.7%) | 5 (1.2%) |
| Total | 411 (100.0%) | 427 (100.0%) |
Commute Time in Greenup
The most frequently occuring commute durations in Greenup are 5 to 9 minutes (212 commuters, 26.5%), 30 to 34 minutes (154 commuters, 19.2%), and less than 5 minutes (105 commuters, 13.1%).
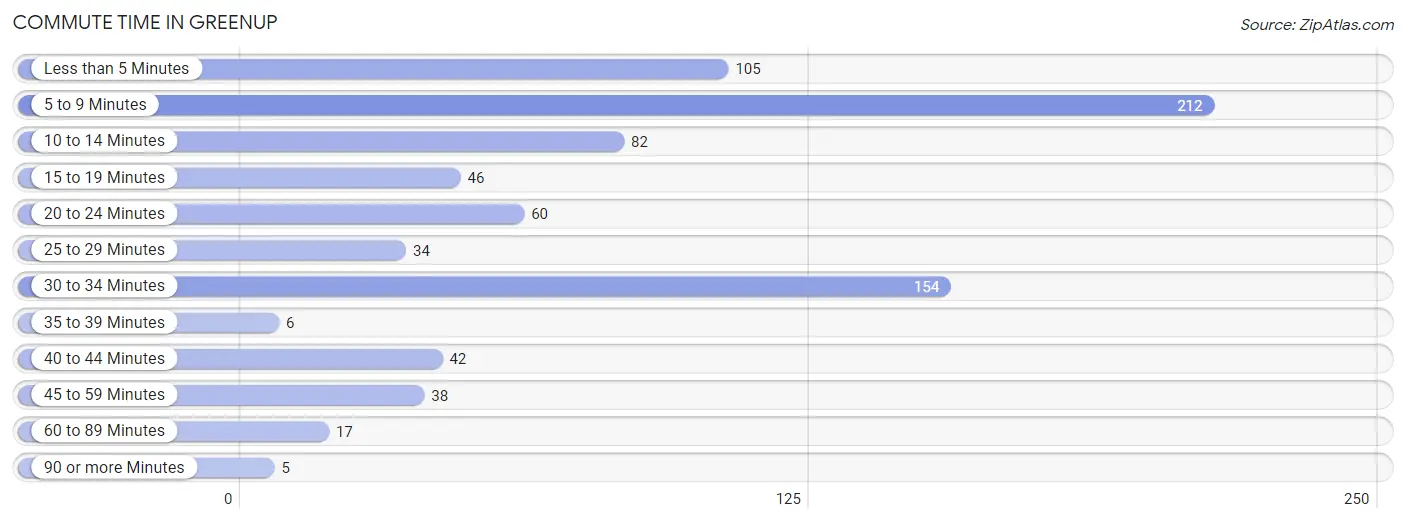
| Commute Time | # Commuters | % Commuters |
| Less than 5 Minutes | 105 | 13.1% |
| 5 to 9 Minutes | 212 | 26.5% |
| 10 to 14 Minutes | 82 | 10.2% |
| 15 to 19 Minutes | 46 | 5.7% |
| 20 to 24 Minutes | 60 | 7.5% |
| 25 to 29 Minutes | 34 | 4.2% |
| 30 to 34 Minutes | 154 | 19.2% |
| 35 to 39 Minutes | 6 | 0.7% |
| 40 to 44 Minutes | 42 | 5.2% |
| 45 to 59 Minutes | 38 | 4.7% |
| 60 to 89 Minutes | 17 | 2.1% |
| 90 or more Minutes | 5 | 0.6% |
Commute Time by Sex in Greenup
The most common commute times in Greenup are 5 to 9 minutes (127 commuters, 31.9%) for males and 30 to 34 minutes (128 commuters, 31.8%) for females.
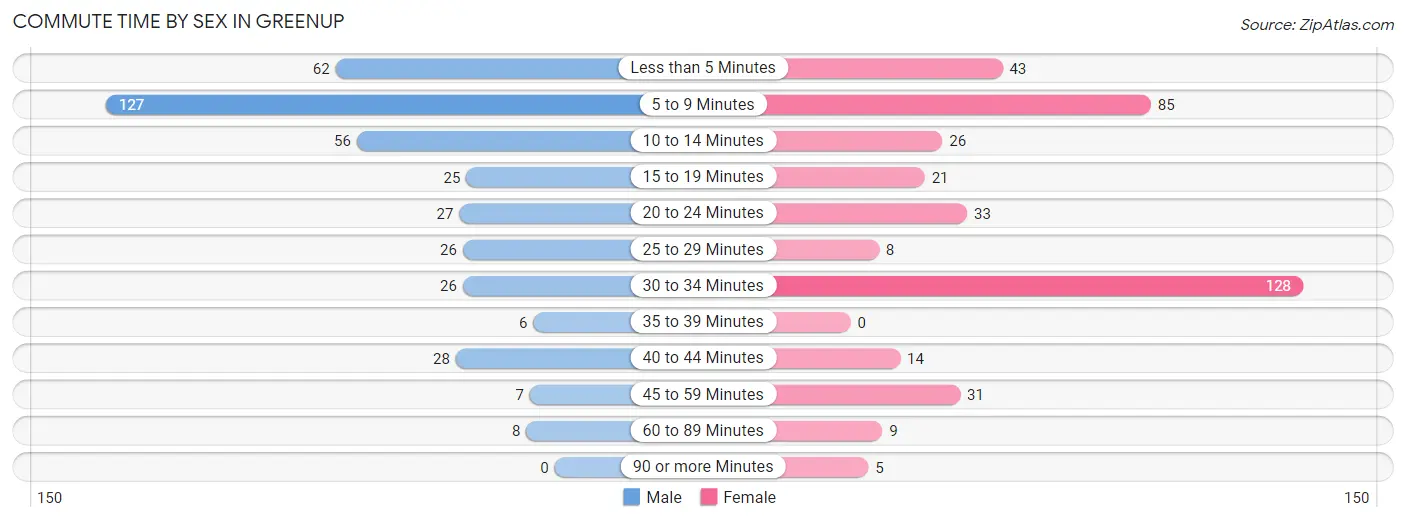
| Commute Time | Male | Female |
| Less than 5 Minutes | 62 (15.6%) | 43 (10.7%) |
| 5 to 9 Minutes | 127 (31.9%) | 85 (21.1%) |
| 10 to 14 Minutes | 56 (14.1%) | 26 (6.5%) |
| 15 to 19 Minutes | 25 (6.3%) | 21 (5.2%) |
| 20 to 24 Minutes | 27 (6.8%) | 33 (8.2%) |
| 25 to 29 Minutes | 26 (6.5%) | 8 (2.0%) |
| 30 to 34 Minutes | 26 (6.5%) | 128 (31.8%) |
| 35 to 39 Minutes | 6 (1.5%) | 0 (0.0%) |
| 40 to 44 Minutes | 28 (7.0%) | 14 (3.5%) |
| 45 to 59 Minutes | 7 (1.8%) | 31 (7.7%) |
| 60 to 89 Minutes | 8 (2.0%) | 9 (2.2%) |
| 90 or more Minutes | 0 (0.0%) | 5 (1.2%) |
Time of Departure to Work by Sex in Greenup
The most frequent times of departure to work in Greenup are 6:30 AM to 6:59 AM (82, 20.6%) for males and 6:30 AM to 6:59 AM (68, 16.9%) for females.
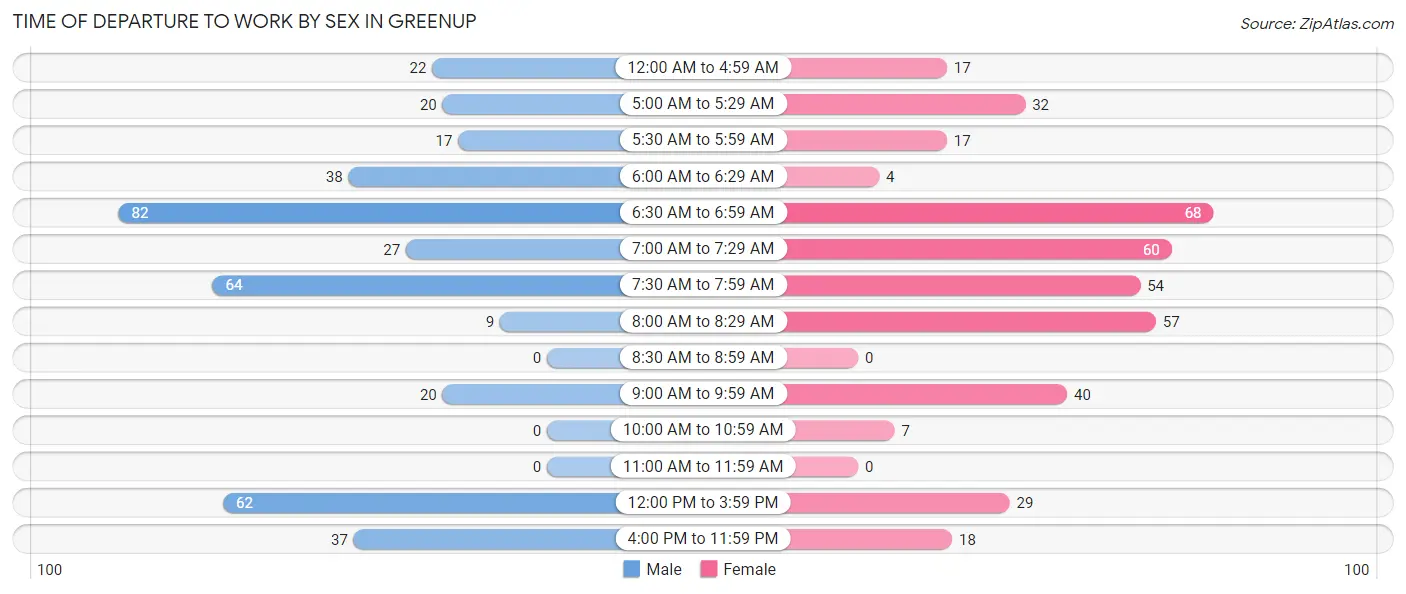
| Time of Departure | Male | Female |
| 12:00 AM to 4:59 AM | 22 (5.5%) | 17 (4.2%) |
| 5:00 AM to 5:29 AM | 20 (5.0%) | 32 (7.9%) |
| 5:30 AM to 5:59 AM | 17 (4.3%) | 17 (4.2%) |
| 6:00 AM to 6:29 AM | 38 (9.6%) | 4 (1.0%) |
| 6:30 AM to 6:59 AM | 82 (20.6%) | 68 (16.9%) |
| 7:00 AM to 7:29 AM | 27 (6.8%) | 60 (14.9%) |
| 7:30 AM to 7:59 AM | 64 (16.1%) | 54 (13.4%) |
| 8:00 AM to 8:29 AM | 9 (2.3%) | 57 (14.1%) |
| 8:30 AM to 8:59 AM | 0 (0.0%) | 0 (0.0%) |
| 9:00 AM to 9:59 AM | 20 (5.0%) | 40 (9.9%) |
| 10:00 AM to 10:59 AM | 0 (0.0%) | 7 (1.7%) |
| 11:00 AM to 11:59 AM | 0 (0.0%) | 0 (0.0%) |
| 12:00 PM to 3:59 PM | 62 (15.6%) | 29 (7.2%) |
| 4:00 PM to 11:59 PM | 37 (9.3%) | 18 (4.5%) |
| Total | 398 (100.0%) | 403 (100.0%) |
Housing Occupancy in Greenup
Occupancy by Ownership in Greenup
Of the total 734 dwellings in Greenup, owner-occupied units account for 541 (73.7%), while renter-occupied units make up 193 (26.3%).
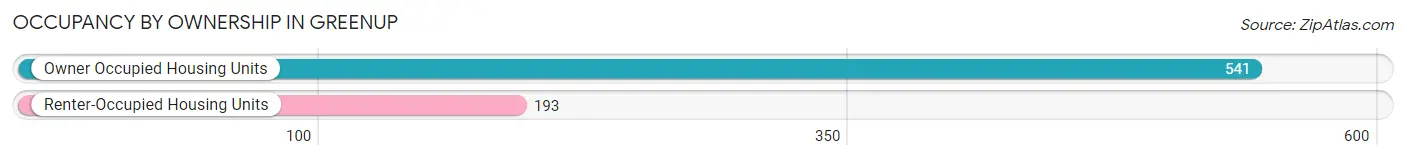
| Occupancy | # Housing Units | % Housing Units |
| Owner Occupied Housing Units | 541 | 73.7% |
| Renter-Occupied Housing Units | 193 | 26.3% |
| Total Occupied Housing Units | 734 | 100.0% |
Occupancy by Household Size in Greenup
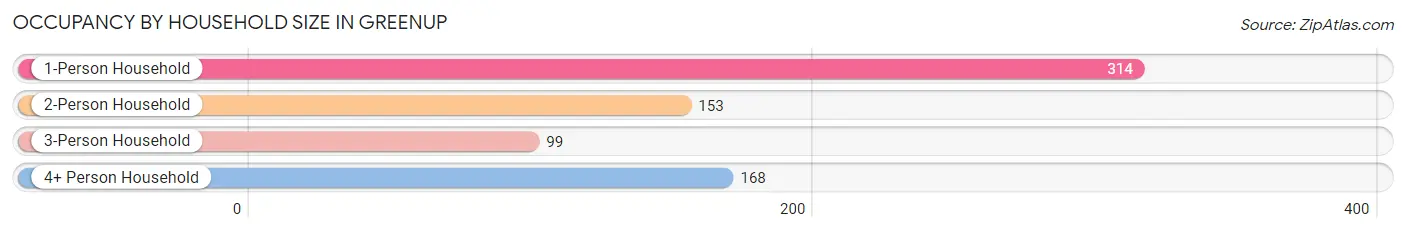
| Household Size | # Housing Units | % Housing Units |
| 1-Person Household | 314 | 42.8% |
| 2-Person Household | 153 | 20.8% |
| 3-Person Household | 99 | 13.5% |
| 4+ Person Household | 168 | 22.9% |
| Total Housing Units | 734 | 100.0% |
Occupancy by Ownership by Household Size in Greenup
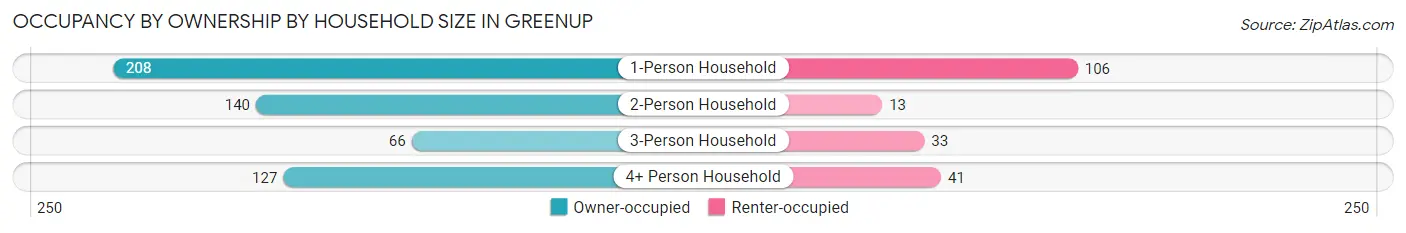
| Household Size | Owner-occupied | Renter-occupied |
| 1-Person Household | 208 (66.2%) | 106 (33.8%) |
| 2-Person Household | 140 (91.5%) | 13 (8.5%) |
| 3-Person Household | 66 (66.7%) | 33 (33.3%) |
| 4+ Person Household | 127 (75.6%) | 41 (24.4%) |
| Total Housing Units | 541 (73.7%) | 193 (26.3%) |
Occupancy by Educational Attainment in Greenup
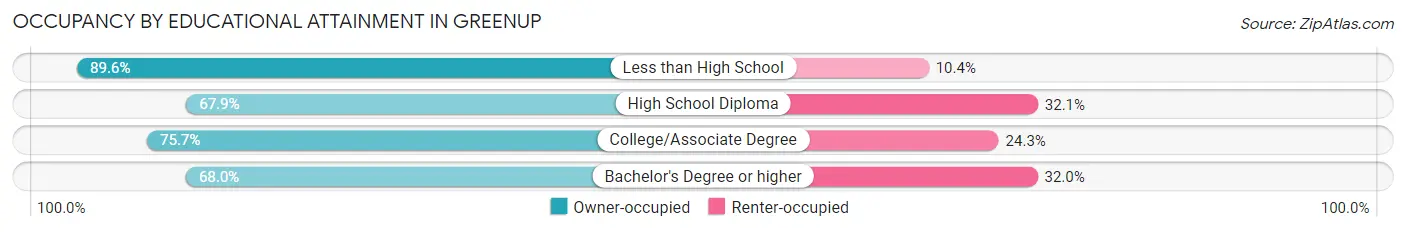
| Household Size | Owner-occupied | Renter-occupied |
| Less than High School | 86 (89.6%) | 10 (10.4%) |
| High School Diploma | 195 (67.9%) | 92 (32.1%) |
| College/Associate Degree | 209 (75.7%) | 67 (24.3%) |
| Bachelor's Degree or higher | 51 (68.0%) | 24 (32.0%) |
Occupancy by Age of Householder in Greenup
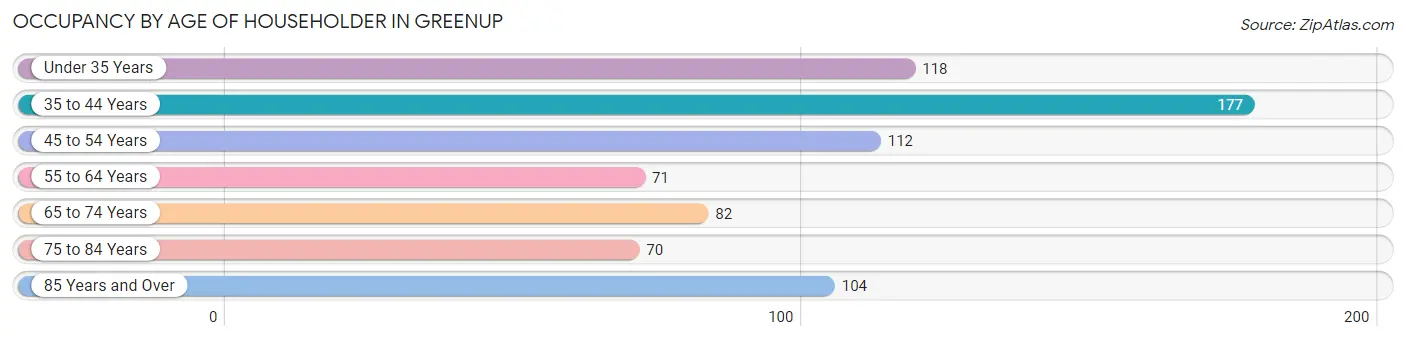
| Age Bracket | # Households | % Households |
| Under 35 Years | 118 | 16.1% |
| 35 to 44 Years | 177 | 24.1% |
| 45 to 54 Years | 112 | 15.3% |
| 55 to 64 Years | 71 | 9.7% |
| 65 to 74 Years | 82 | 11.2% |
| 75 to 84 Years | 70 | 9.5% |
| 85 Years and Over | 104 | 14.2% |
| Total | 734 | 100.0% |
Housing Finances in Greenup
Median Income by Occupancy in Greenup
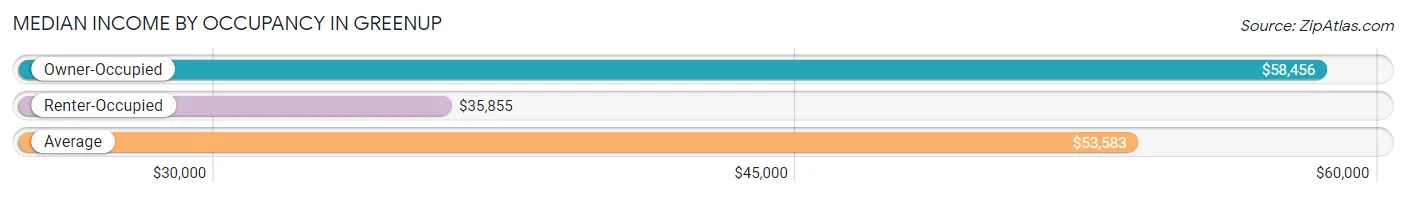
| Occupancy Type | # Households | Median Income |
| Owner-Occupied | 541 (73.7%) | $58,456 |
| Renter-Occupied | 193 (26.3%) | $35,855 |
| Average | 734 (100.0%) | $53,583 |
Occupancy by Householder Income Bracket in Greenup
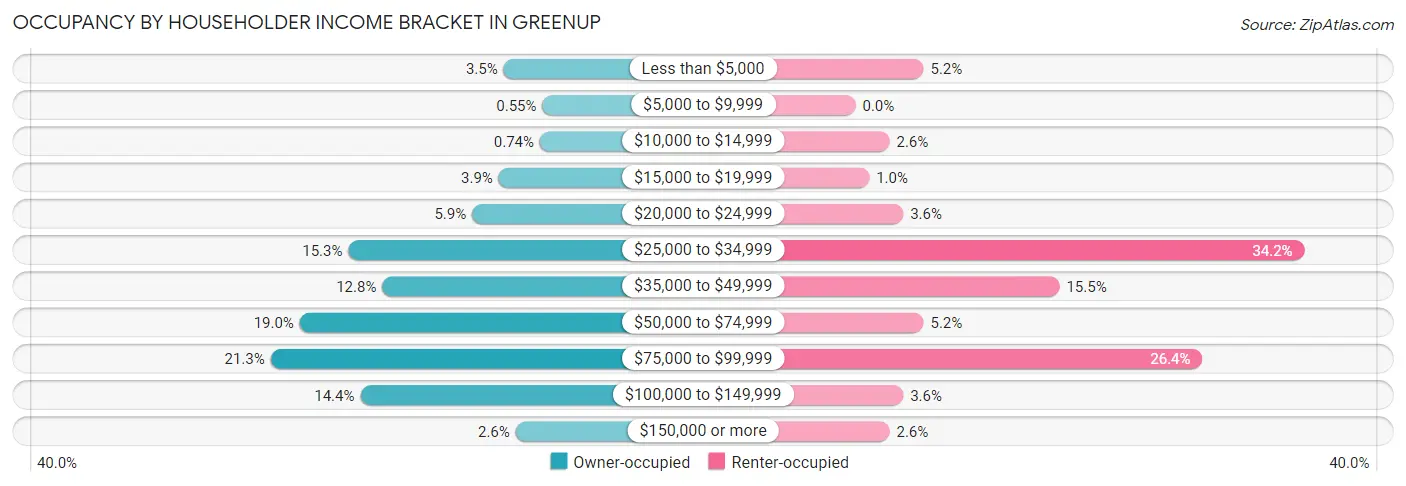
| Income Bracket | Owner-occupied | Renter-occupied |
| Less than $5,000 | 19 (3.5%) | 10 (5.2%) |
| $5,000 to $9,999 | 3 (0.5%) | 0 (0.0%) |
| $10,000 to $14,999 | 4 (0.7%) | 5 (2.6%) |
| $15,000 to $19,999 | 21 (3.9%) | 2 (1.0%) |
| $20,000 to $24,999 | 32 (5.9%) | 7 (3.6%) |
| $25,000 to $34,999 | 83 (15.3%) | 66 (34.2%) |
| $35,000 to $49,999 | 69 (12.8%) | 30 (15.5%) |
| $50,000 to $74,999 | 103 (19.0%) | 10 (5.2%) |
| $75,000 to $99,999 | 115 (21.3%) | 51 (26.4%) |
| $100,000 to $149,999 | 78 (14.4%) | 7 (3.6%) |
| $150,000 or more | 14 (2.6%) | 5 (2.6%) |
| Total | 541 (100.0%) | 193 (100.0%) |
Monthly Housing Cost Tiers in Greenup
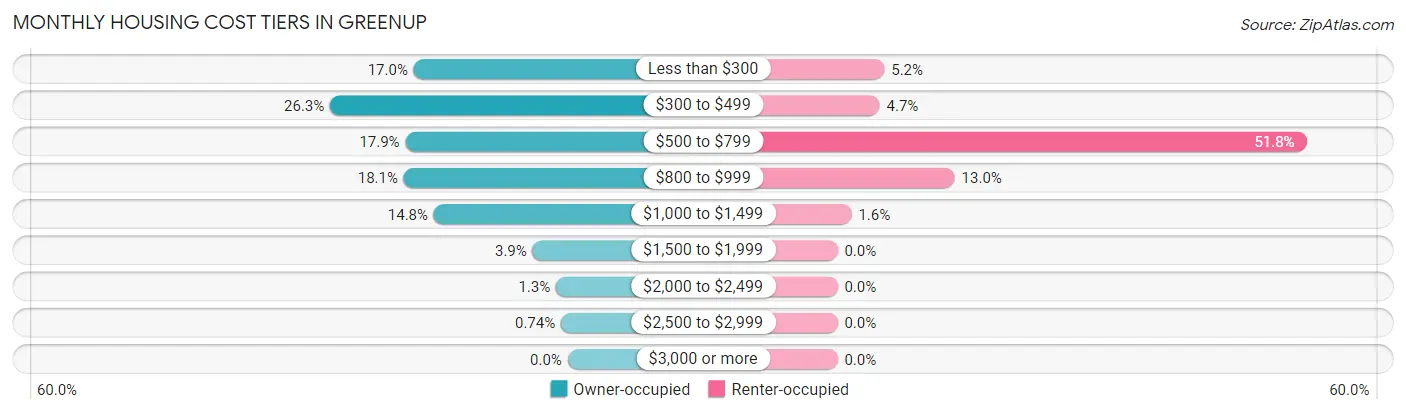
| Monthly Cost | Owner-occupied | Renter-occupied |
| Less than $300 | 92 (17.0%) | 10 (5.2%) |
| $300 to $499 | 142 (26.3%) | 9 (4.7%) |
| $500 to $799 | 97 (17.9%) | 100 (51.8%) |
| $800 to $999 | 98 (18.1%) | 25 (13.0%) |
| $1,000 to $1,499 | 80 (14.8%) | 3 (1.5%) |
| $1,500 to $1,999 | 21 (3.9%) | 0 (0.0%) |
| $2,000 to $2,499 | 7 (1.3%) | 0 (0.0%) |
| $2,500 to $2,999 | 4 (0.7%) | 0 (0.0%) |
| $3,000 or more | 0 (0.0%) | 0 (0.0%) |
| Total | 541 (100.0%) | 193 (100.0%) |
Physical Housing Characteristics in Greenup
Housing Structures in Greenup
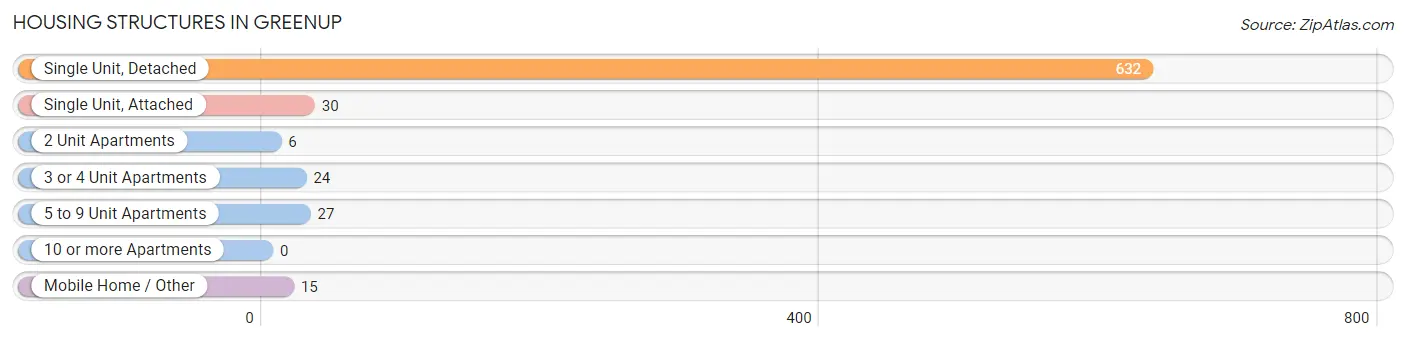
| Structure Type | # Housing Units | % Housing Units |
| Single Unit, Detached | 632 | 86.1% |
| Single Unit, Attached | 30 | 4.1% |
| 2 Unit Apartments | 6 | 0.8% |
| 3 or 4 Unit Apartments | 24 | 3.3% |
| 5 to 9 Unit Apartments | 27 | 3.7% |
| 10 or more Apartments | 0 | 0.0% |
| Mobile Home / Other | 15 | 2.0% |
| Total | 734 | 100.0% |
Housing Structures by Occupancy in Greenup
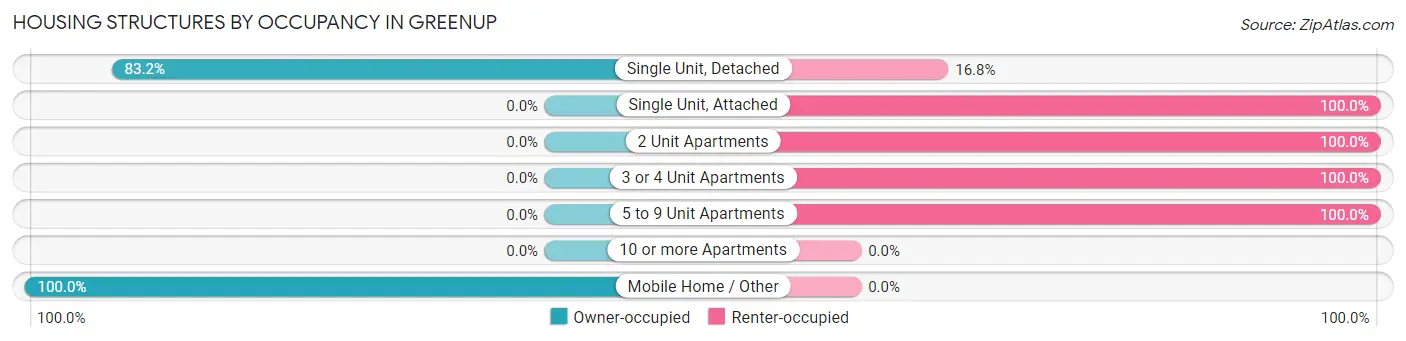
| Structure Type | Owner-occupied | Renter-occupied |
| Single Unit, Detached | 526 (83.2%) | 106 (16.8%) |
| Single Unit, Attached | 0 (0.0%) | 30 (100.0%) |
| 2 Unit Apartments | 0 (0.0%) | 6 (100.0%) |
| 3 or 4 Unit Apartments | 0 (0.0%) | 24 (100.0%) |
| 5 to 9 Unit Apartments | 0 (0.0%) | 27 (100.0%) |
| 10 or more Apartments | 0 (0.0%) | 0 (0.0%) |
| Mobile Home / Other | 15 (100.0%) | 0 (0.0%) |
| Total | 541 (73.7%) | 193 (26.3%) |
Housing Structures by Number of Rooms in Greenup
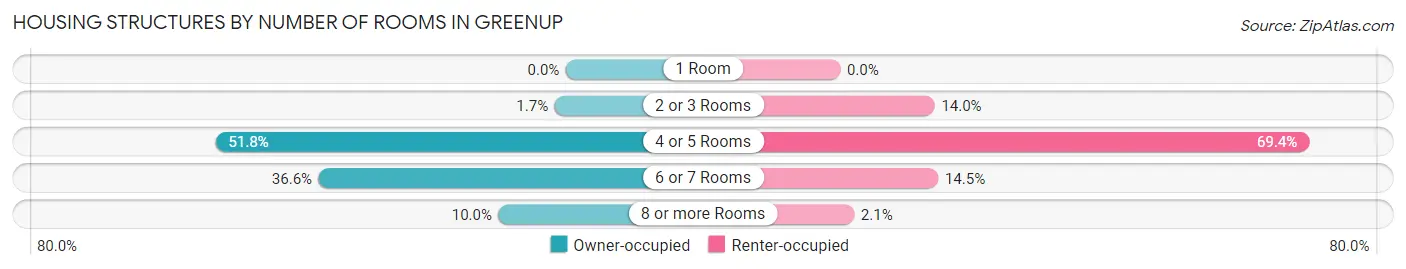
| Number of Rooms | Owner-occupied | Renter-occupied |
| 1 Room | 0 (0.0%) | 0 (0.0%) |
| 2 or 3 Rooms | 9 (1.7%) | 27 (14.0%) |
| 4 or 5 Rooms | 280 (51.8%) | 134 (69.4%) |
| 6 or 7 Rooms | 198 (36.6%) | 28 (14.5%) |
| 8 or more Rooms | 54 (10.0%) | 4 (2.1%) |
| Total | 541 (100.0%) | 193 (100.0%) |
Housing Structure by Heating Type in Greenup
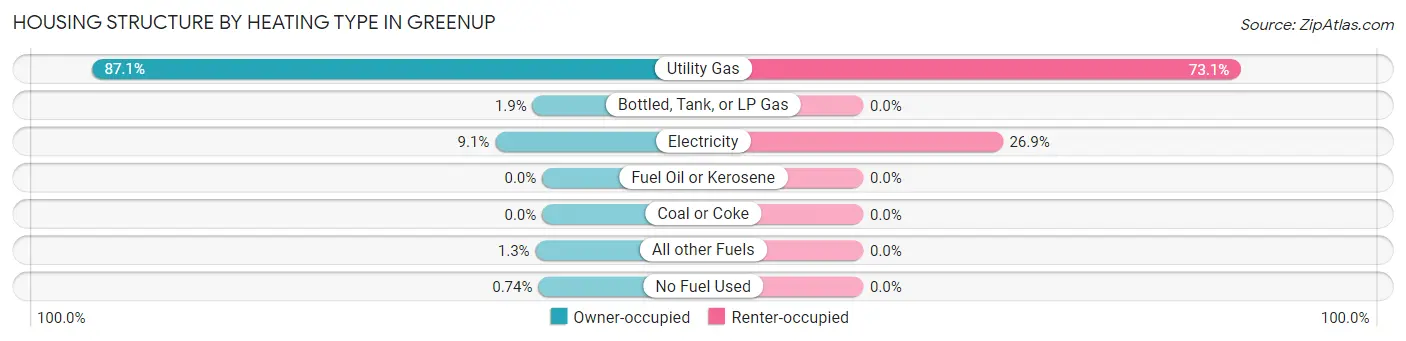
| Heating Type | Owner-occupied | Renter-occupied |
| Utility Gas | 471 (87.1%) | 141 (73.1%) |
| Bottled, Tank, or LP Gas | 10 (1.8%) | 0 (0.0%) |
| Electricity | 49 (9.1%) | 52 (26.9%) |
| Fuel Oil or Kerosene | 0 (0.0%) | 0 (0.0%) |
| Coal or Coke | 0 (0.0%) | 0 (0.0%) |
| All other Fuels | 7 (1.3%) | 0 (0.0%) |
| No Fuel Used | 4 (0.7%) | 0 (0.0%) |
| Total | 541 (100.0%) | 193 (100.0%) |
Household Vehicle Usage in Greenup
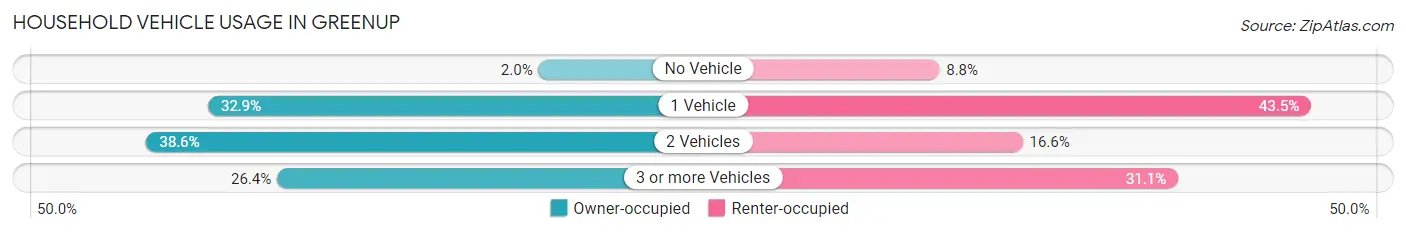
| Vehicles per Household | Owner-occupied | Renter-occupied |
| No Vehicle | 11 (2.0%) | 17 (8.8%) |
| 1 Vehicle | 178 (32.9%) | 84 (43.5%) |
| 2 Vehicles | 209 (38.6%) | 32 (16.6%) |
| 3 or more Vehicles | 143 (26.4%) | 60 (31.1%) |
| Total | 541 (100.0%) | 193 (100.0%) |
Real Estate & Mortgages in Greenup
Real Estate and Mortgage Overview in Greenup
| Characteristic | Without Mortgage | With Mortgage |
| Housing Units | 310 | 231 |
| Median Property Value | $84,700 | $98,800 |
| Median Household Income | $38,929 | $11 |
| Monthly Housing Costs | $395 | $0 |
| Real Estate Taxes | $1,410 | $3 |
Property Value by Mortgage Status in Greenup
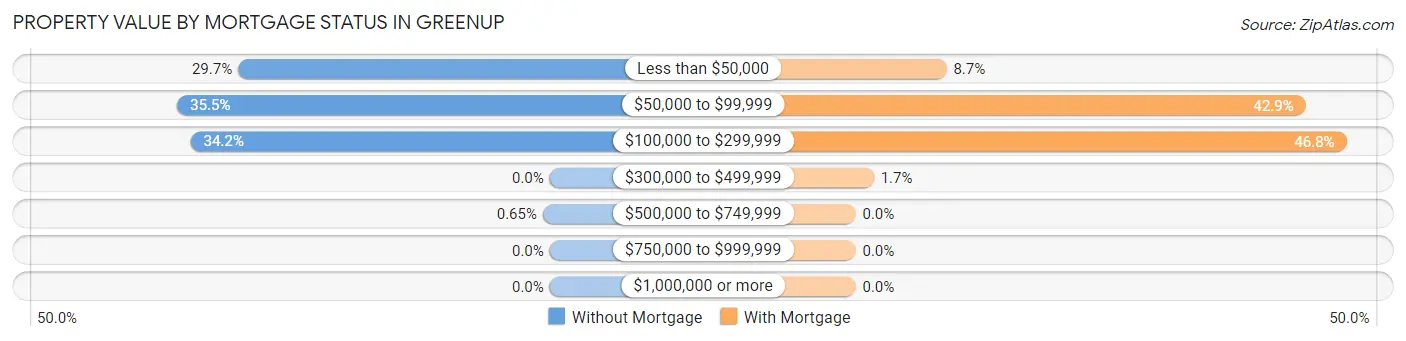
| Property Value | Without Mortgage | With Mortgage |
| Less than $50,000 | 92 (29.7%) | 20 (8.7%) |
| $50,000 to $99,999 | 110 (35.5%) | 99 (42.9%) |
| $100,000 to $299,999 | 106 (34.2%) | 108 (46.8%) |
| $300,000 to $499,999 | 0 (0.0%) | 4 (1.7%) |
| $500,000 to $749,999 | 2 (0.6%) | 0 (0.0%) |
| $750,000 to $999,999 | 0 (0.0%) | 0 (0.0%) |
| $1,000,000 or more | 0 (0.0%) | 0 (0.0%) |
| Total | 310 (100.0%) | 231 (100.0%) |
Household Income by Mortgage Status in Greenup
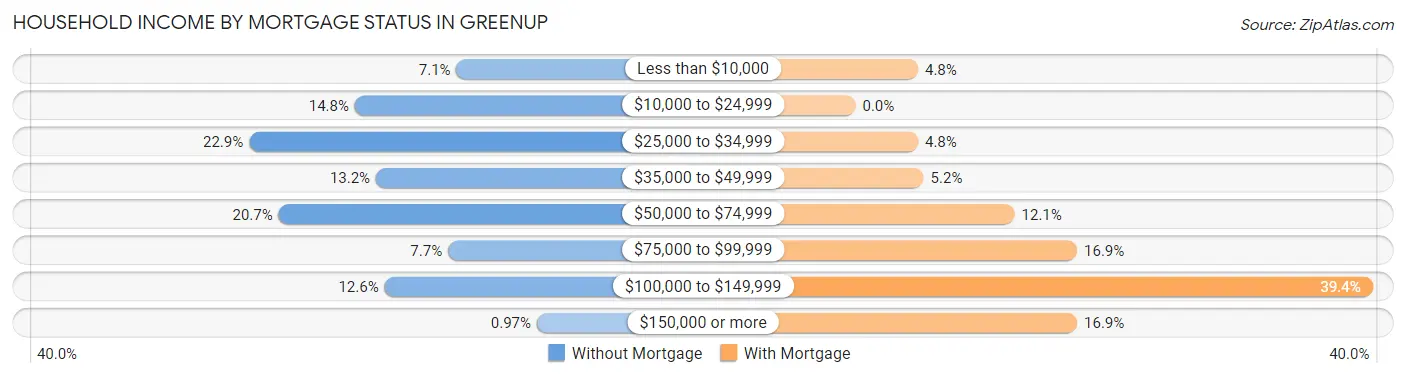
| Household Income | Without Mortgage | With Mortgage |
| Less than $10,000 | 22 (7.1%) | 11 (4.8%) |
| $10,000 to $24,999 | 46 (14.8%) | 0 (0.0%) |
| $25,000 to $34,999 | 71 (22.9%) | 11 (4.8%) |
| $35,000 to $49,999 | 41 (13.2%) | 12 (5.2%) |
| $50,000 to $74,999 | 64 (20.6%) | 28 (12.1%) |
| $75,000 to $99,999 | 24 (7.7%) | 39 (16.9%) |
| $100,000 to $149,999 | 39 (12.6%) | 91 (39.4%) |
| $150,000 or more | 3 (1.0%) | 39 (16.9%) |
| Total | 310 (100.0%) | 231 (100.0%) |
Property Value to Household Income Ratio in Greenup
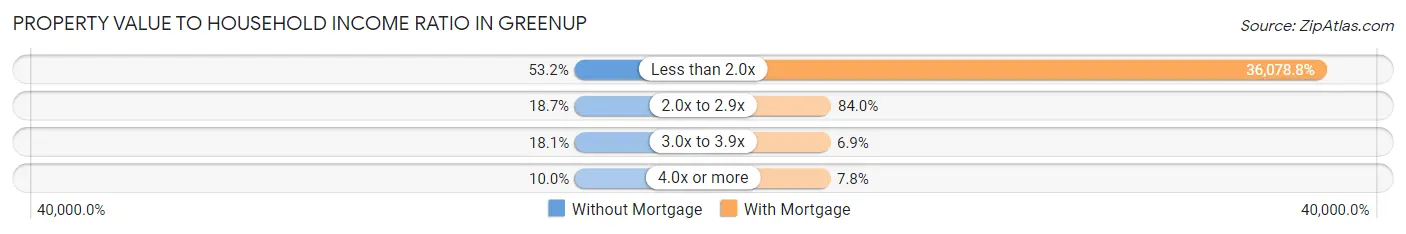
| Value-to-Income Ratio | Without Mortgage | With Mortgage |
| Less than 2.0x | 165 (53.2%) | 83,342 (36,078.8%) |
| 2.0x to 2.9x | 58 (18.7%) | 194 (84.0%) |
| 3.0x to 3.9x | 56 (18.1%) | 16 (6.9%) |
| 4.0x or more | 31 (10.0%) | 18 (7.8%) |
| Total | 310 (100.0%) | 231 (100.0%) |
Real Estate Taxes by Mortgage Status in Greenup
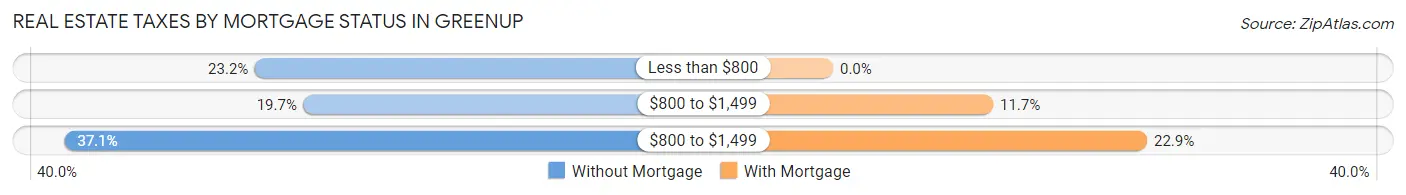
| Property Taxes | Without Mortgage | With Mortgage |
| Less than $800 | 72 (23.2%) | 0 (0.0%) |
| $800 to $1,499 | 61 (19.7%) | 27 (11.7%) |
| $800 to $1,499 | 115 (37.1%) | 53 (22.9%) |
| Total | 310 (100.0%) | 231 (100.0%) |
Health & Disability in Greenup
Health Insurance Coverage by Age in Greenup
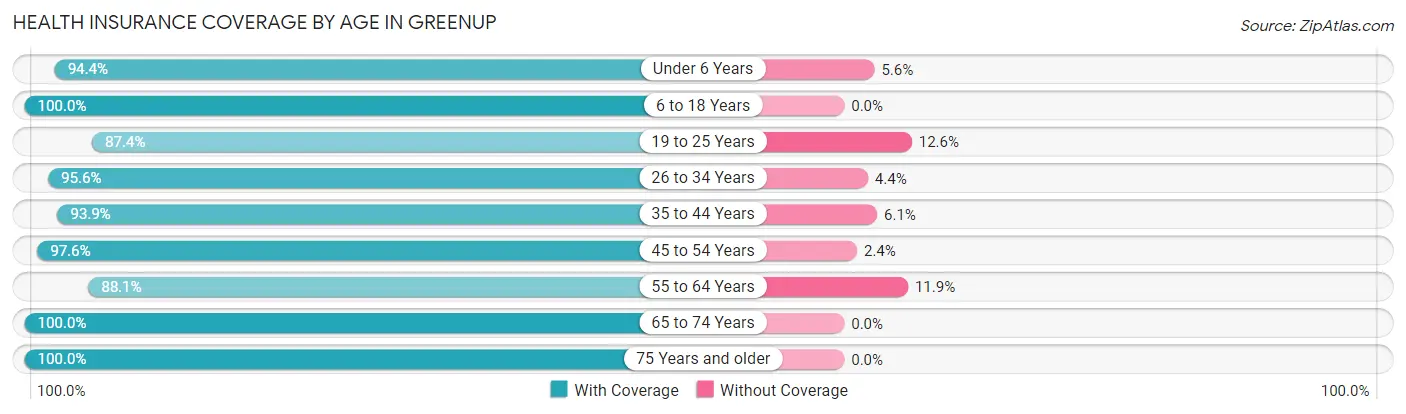
| Age Bracket | With Coverage | Without Coverage |
| Under 6 Years | 151 (94.4%) | 9 (5.6%) |
| 6 to 18 Years | 353 (100.0%) | 0 (0.0%) |
| 19 to 25 Years | 125 (87.4%) | 18 (12.6%) |
| 26 to 34 Years | 174 (95.6%) | 8 (4.4%) |
| 35 to 44 Years | 276 (93.9%) | 18 (6.1%) |
| 45 to 54 Years | 205 (97.6%) | 5 (2.4%) |
| 55 to 64 Years | 89 (88.1%) | 12 (11.9%) |
| 65 to 74 Years | 137 (100.0%) | 0 (0.0%) |
| 75 Years and older | 210 (100.0%) | 0 (0.0%) |
| Total | 1,720 (96.1%) | 70 (3.9%) |
Health Insurance Coverage by Citizenship Status in Greenup
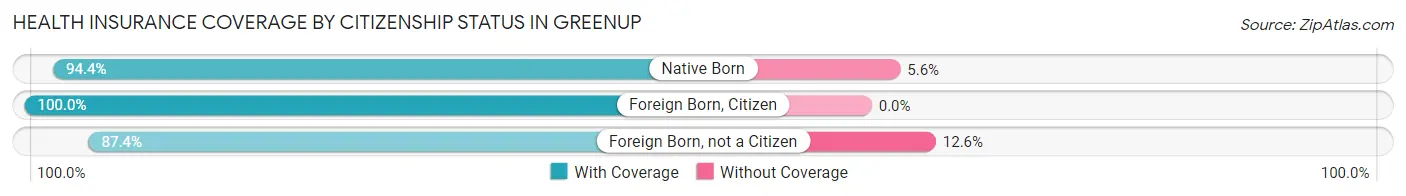
| Citizenship Status | With Coverage | Without Coverage |
| Native Born | 151 (94.4%) | 9 (5.6%) |
| Foreign Born, Citizen | 353 (100.0%) | 0 (0.0%) |
| Foreign Born, not a Citizen | 125 (87.4%) | 18 (12.6%) |
Health Insurance Coverage by Household Income in Greenup
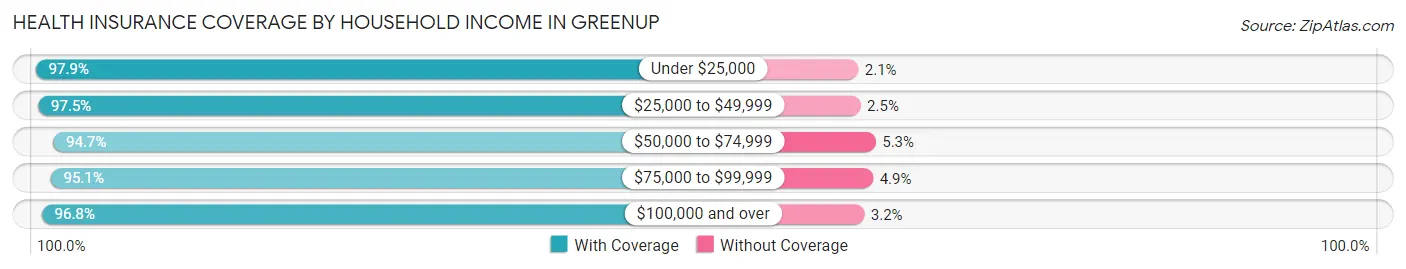
| Household Income | With Coverage | Without Coverage |
| Under $25,000 | 142 (97.9%) | 3 (2.1%) |
| $25,000 to $49,999 | 351 (97.5%) | 9 (2.5%) |
| $50,000 to $74,999 | 266 (94.7%) | 15 (5.3%) |
| $75,000 to $99,999 | 627 (95.1%) | 32 (4.9%) |
| $100,000 and over | 334 (96.8%) | 11 (3.2%) |
Public vs Private Health Insurance Coverage by Age in Greenup
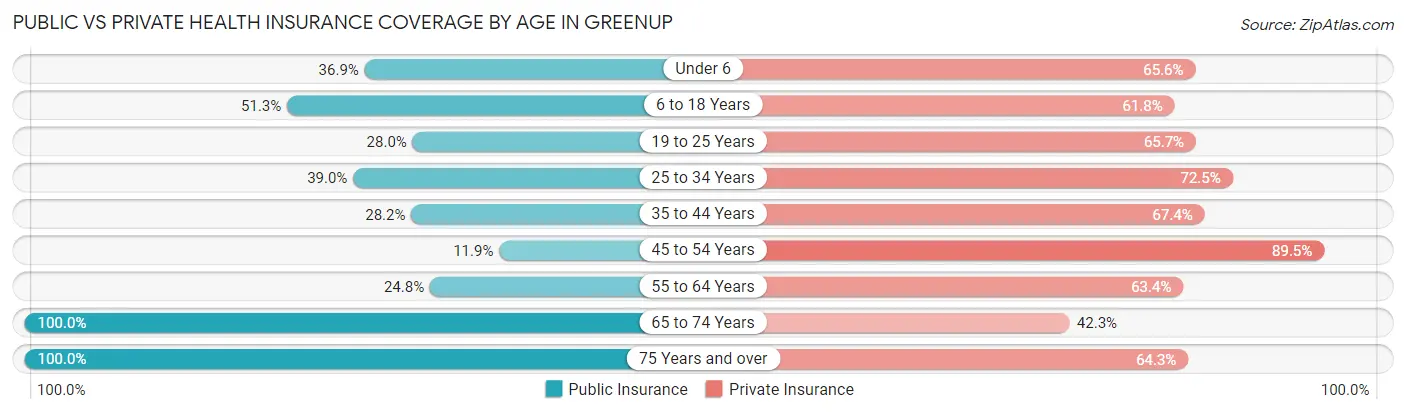
| Age Bracket | Public Insurance | Private Insurance |
| Under 6 | 59 (36.9%) | 105 (65.6%) |
| 6 to 18 Years | 181 (51.3%) | 218 (61.8%) |
| 19 to 25 Years | 40 (28.0%) | 94 (65.7%) |
| 25 to 34 Years | 71 (39.0%) | 132 (72.5%) |
| 35 to 44 Years | 83 (28.2%) | 198 (67.3%) |
| 45 to 54 Years | 25 (11.9%) | 188 (89.5%) |
| 55 to 64 Years | 25 (24.7%) | 64 (63.4%) |
| 65 to 74 Years | 137 (100.0%) | 58 (42.3%) |
| 75 Years and over | 210 (100.0%) | 135 (64.3%) |
| Total | 831 (46.4%) | 1,192 (66.6%) |
Disability Status by Sex by Age in Greenup
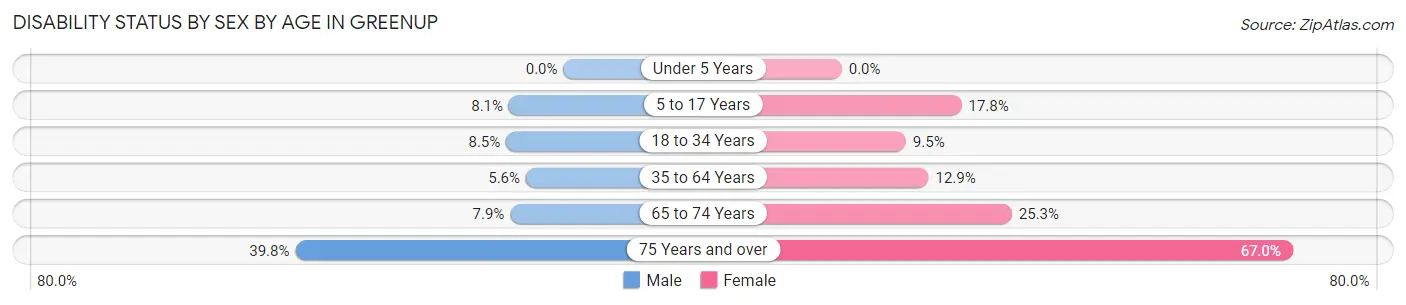
| Age Bracket | Male | Female |
| Under 5 Years | 0 (0.0%) | 0 (0.0%) |
| 5 to 17 Years | 11 (8.1%) | 40 (17.8%) |
| 18 to 34 Years | 13 (8.5%) | 20 (9.5%) |
| 35 to 64 Years | 19 (5.6%) | 34 (12.9%) |
| 65 to 74 Years | 3 (7.9%) | 25 (25.3%) |
| 75 Years and over | 39 (39.8%) | 75 (67.0%) |
Disability Class by Sex by Age in Greenup
Disability Class: Hearing Difficulty
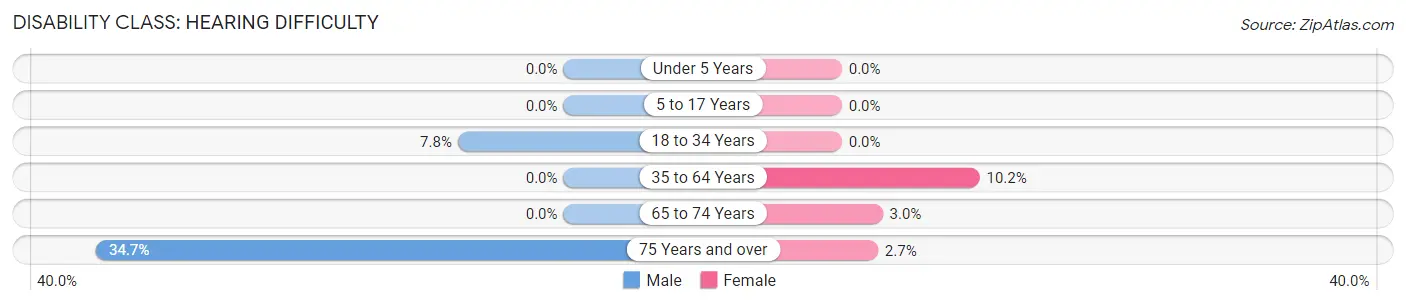
| Age Bracket | Male | Female |
| Under 5 Years | 0 (0.0%) | 0 (0.0%) |
| 5 to 17 Years | 0 (0.0%) | 0 (0.0%) |
| 18 to 34 Years | 12 (7.8%) | 0 (0.0%) |
| 35 to 64 Years | 0 (0.0%) | 27 (10.2%) |
| 65 to 74 Years | 0 (0.0%) | 3 (3.0%) |
| 75 Years and over | 34 (34.7%) | 3 (2.7%) |
Disability Class: Vision Difficulty
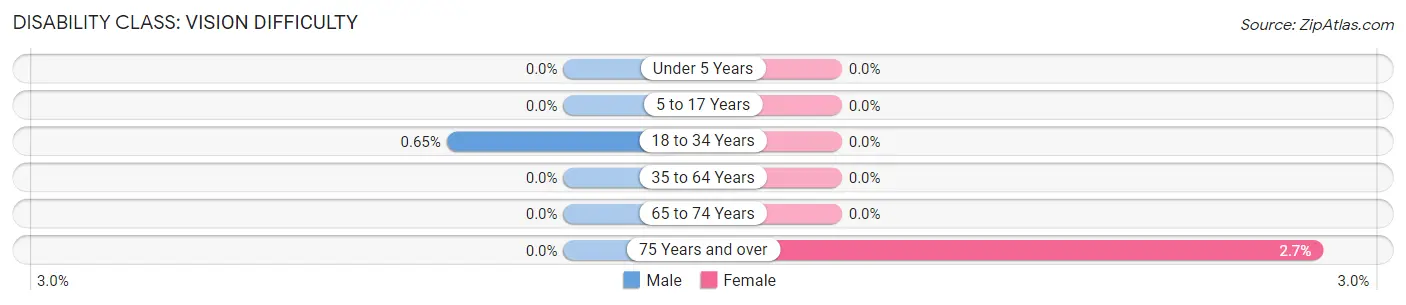
| Age Bracket | Male | Female |
| Under 5 Years | 0 (0.0%) | 0 (0.0%) |
| 5 to 17 Years | 0 (0.0%) | 0 (0.0%) |
| 18 to 34 Years | 1 (0.6%) | 0 (0.0%) |
| 35 to 64 Years | 0 (0.0%) | 0 (0.0%) |
| 65 to 74 Years | 0 (0.0%) | 0 (0.0%) |
| 75 Years and over | 0 (0.0%) | 3 (2.7%) |
Disability Class: Cognitive Difficulty
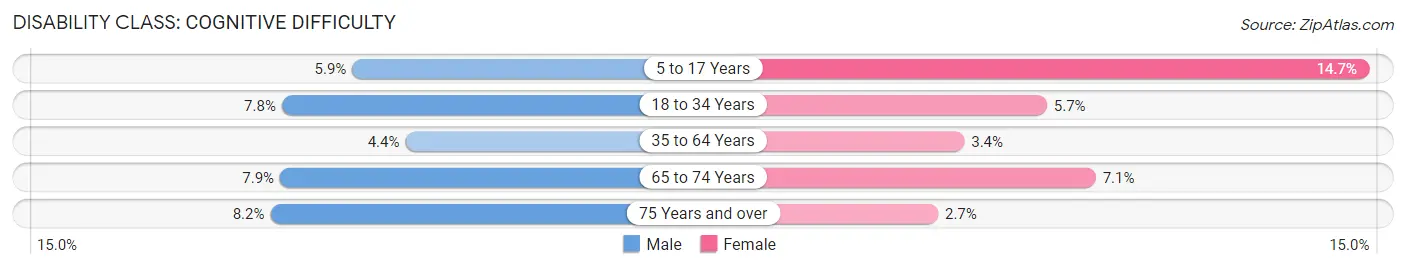
| Age Bracket | Male | Female |
| 5 to 17 Years | 8 (5.9%) | 33 (14.7%) |
| 18 to 34 Years | 12 (7.8%) | 12 (5.7%) |
| 35 to 64 Years | 15 (4.4%) | 9 (3.4%) |
| 65 to 74 Years | 3 (7.9%) | 7 (7.1%) |
| 75 Years and over | 8 (8.2%) | 3 (2.7%) |
Disability Class: Ambulatory Difficulty
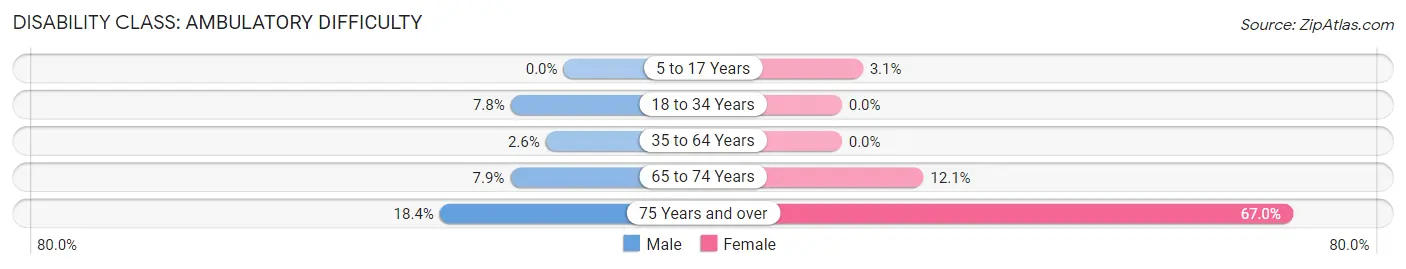
| Age Bracket | Male | Female |
| 5 to 17 Years | 0 (0.0%) | 7 (3.1%) |
| 18 to 34 Years | 12 (7.8%) | 0 (0.0%) |
| 35 to 64 Years | 9 (2.6%) | 0 (0.0%) |
| 65 to 74 Years | 3 (7.9%) | 12 (12.1%) |
| 75 Years and over | 18 (18.4%) | 75 (67.0%) |
Disability Class: Self-Care Difficulty
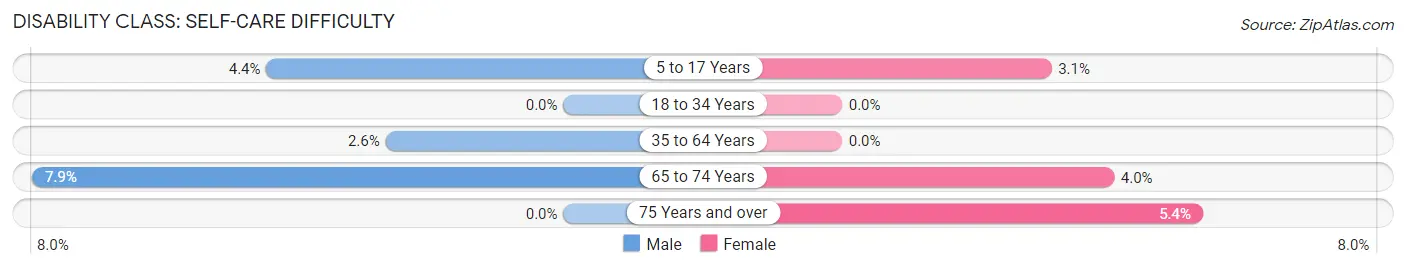
| Age Bracket | Male | Female |
| 5 to 17 Years | 6 (4.4%) | 7 (3.1%) |
| 18 to 34 Years | 0 (0.0%) | 0 (0.0%) |
| 35 to 64 Years | 9 (2.6%) | 0 (0.0%) |
| 65 to 74 Years | 3 (7.9%) | 4 (4.0%) |
| 75 Years and over | 0 (0.0%) | 6 (5.4%) |
Technology Access in Greenup
Computing Device Access in Greenup
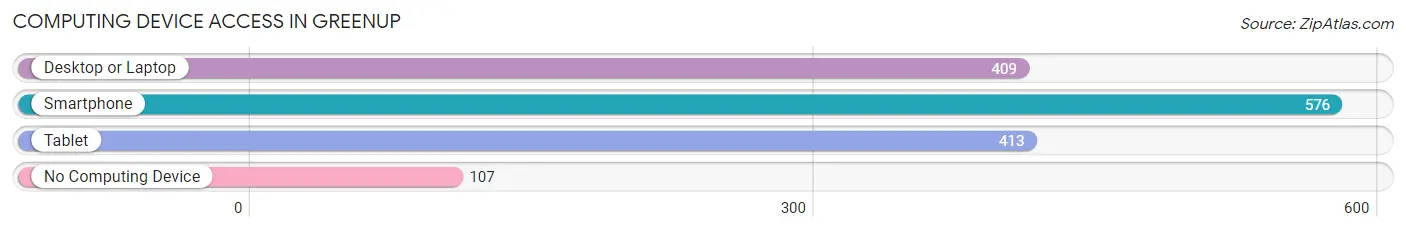
| Device Type | # Households | % Households |
| Desktop or Laptop | 409 | 55.7% |
| Smartphone | 576 | 78.5% |
| Tablet | 413 | 56.3% |
| No Computing Device | 107 | 14.6% |
| Total | 734 | 100.0% |
Internet Access in Greenup
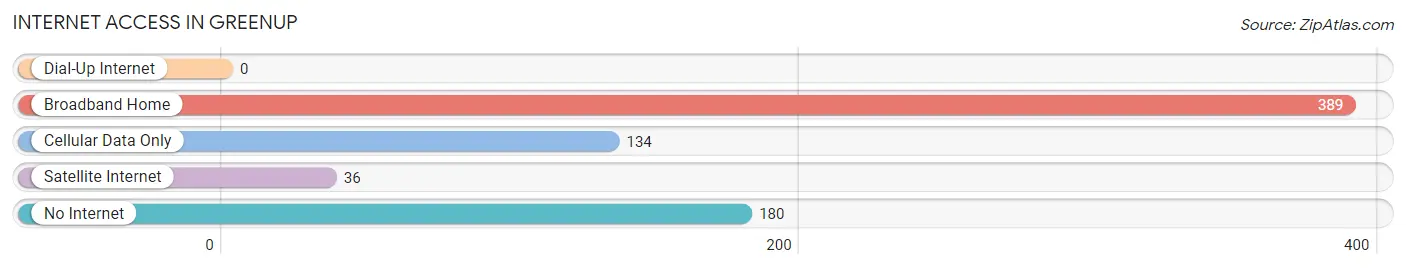
| Internet Type | # Households | % Households |
| Dial-Up Internet | 0 | 0.0% |
| Broadband Home | 389 | 53.0% |
| Cellular Data Only | 134 | 18.3% |
| Satellite Internet | 36 | 4.9% |
| No Internet | 180 | 24.5% |
| Total | 734 | 100.0% |
Greenup Summary
History
Greenup, Illinois is a small town located in Cumberland County, Illinois. It is situated on the banks of the Embarras River, and is the county seat of Cumberland County. The town was founded in 1854 by William Greenup, a local farmer and businessman. Greenup was originally known as Greenup Station, and was a stop on the Illinois Central Railroad. The town was officially incorporated in 1858.
Greenup has a rich history of industry and agriculture. In the late 19th century, the town was home to several coal mines, as well as a number of brickyards and other businesses. The town was also home to a large number of farms, which provided the town with much of its economic stability.
In the early 20th century, Greenup was home to a number of manufacturing businesses, including a furniture factory, a canning factory, and a shoe factory. The town also had a number of retail stores, including a grocery store, a hardware store, and a drug store.
In the late 20th century, Greenup experienced a period of decline. Many of the town’s businesses closed, and the population began to decline. However, in recent years, the town has seen a resurgence in population and economic activity.
Geography
Greenup is located in the eastern part of Cumberland County, Illinois. The town is situated on the banks of the Embarras River, and is surrounded by rolling hills and farmland. The town is located approximately 30 miles south of Champaign, and is about an hour’s drive from Indianapolis, Indiana.
The climate in Greenup is generally mild, with hot summers and cold winters. The average temperature in the summer is around 75 degrees Fahrenheit, and the average temperature in the winter is around 35 degrees Fahrenheit.
Economy
Greenup’s economy is largely based on agriculture and manufacturing. The town is home to a number of farms, which produce a variety of crops, including corn, soybeans, and wheat. The town is also home to a number of manufacturing businesses, including a furniture factory, a canning factory, and a shoe factory.
In addition to agriculture and manufacturing, Greenup is home to a number of retail stores, including a grocery store, a hardware store, and a drug store. The town is also home to a number of restaurants, bars, and other businesses.
Demographics
As of the 2010 census, the population of Greenup was 1,845. The town is predominantly white, with a small African American population. The median household income in Greenup is $41,250, and the median home value is $90,000. The town has a poverty rate of 16.3%, and the unemployment rate is 5.2%.
Common Questions
What is Per Capita Income in Greenup?
Per Capita income in Greenup is $25,973.
What is the Median Family Income in Greenup?
Median Family Income in Greenup is $80,795.
What is the Median Household income in Greenup?
Median Household Income in Greenup is $53,583.
What is Income or Wage Gap in Greenup?
Income or Wage Gap in Greenup is 43.5%.
Women in Greenup earn 56.5 cents for every dollar earned by a man.
What is Inequality or Gini Index in Greenup?
Inequality or Gini Index in Greenup is 0.35.
What is the Total Population of Greenup?
Total Population of Greenup is 1,824.
What is the Total Male Population of Greenup?
Total Male Population of Greenup is 837.
What is the Total Female Population of Greenup?
Total Female Population of Greenup is 987.
What is the Ratio of Males per 100 Females in Greenup?
There are 84.80 Males per 100 Females in Greenup.
What is the Ratio of Females per 100 Males in Greenup?
There are 117.92 Females per 100 Males in Greenup.
What is the Median Population Age in Greenup?
Median Population Age in Greenup is 35.7 Years.
What is the Average Family Size in Greenup
Average Family Size in Greenup is 3.2 People.
What is the Average Household Size in Greenup
Average Household Size in Greenup is 2.4 People.
How Large is the Labor Force in Greenup?
There are 868 People in the Labor Forcein in Greenup.
What is the Percentage of People in the Labor Force in Greenup?
61.9% of People are in the Labor Force in Greenup.
What is the Unemployment Rate in Greenup?
Unemployment Rate in Greenup is 1.7%.