Grant Park, IL Map & Demographics
Grant Park Map
Grant Park Overview
$26,032
PER CAPITA INCOME
$85,547
AVG FAMILY INCOME
$76,750
AVG HOUSEHOLD INCOME
50.5%
WAGE / INCOME GAP [ % ]
49.5¢/ $1
WAGE / INCOME GAP [ $ ]
0.35
INEQUALITY / GINI INDEX
1,641
TOTAL POPULATION
836
MALE POPULATION
805
FEMALE POPULATION
103.85
MALES / 100 FEMALES
96.29
FEMALES / 100 MALES
34.3
MEDIAN AGE
4.0
AVG FAMILY SIZE
3.3
AVG HOUSEHOLD SIZE
662
LABOR FORCE [ PEOPLE ]
59.5%
PERCENT IN LABOR FORCE
7.6%
UNEMPLOYMENT RATE
Grant Park Zip Codes
Grant Park Area Codes
Income in Grant Park
Income Overview in Grant Park
Per Capita Income in Grant Park is $26,032, while median incomes of families and households are $85,547 and $76,750 respectively.
| Characteristic | Number | Measure |
| Per Capita Income | 1,641 | $26,032 |
| Median Family Income | 355 | $85,547 |
| Mean Family Income | 355 | $93,978 |
| Median Household Income | 489 | $76,750 |
| Mean Household Income | 489 | $83,982 |
| Income Deficit | 355 | $0 |
| Wage / Income Gap (%) | 1,641 | 50.53% |
| Wage / Income Gap ($) | 1,641 | 49.47¢ per $1 |
| Gini / Inequality Index | 1,641 | 0.35 |
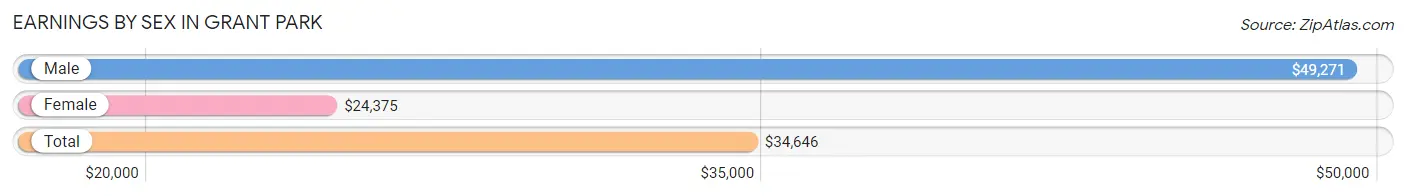
Earnings by Sex in Grant Park
Average Earnings in Grant Park are $34,646, $49,271 for men and $24,375 for women, a difference of 50.5%.
| Sex | Number | Average Earnings |
| Male | 359 (53.3%) | $49,271 |
| Female | 314 (46.7%) | $24,375 |
| Total | 673 (100.0%) | $34,646 |
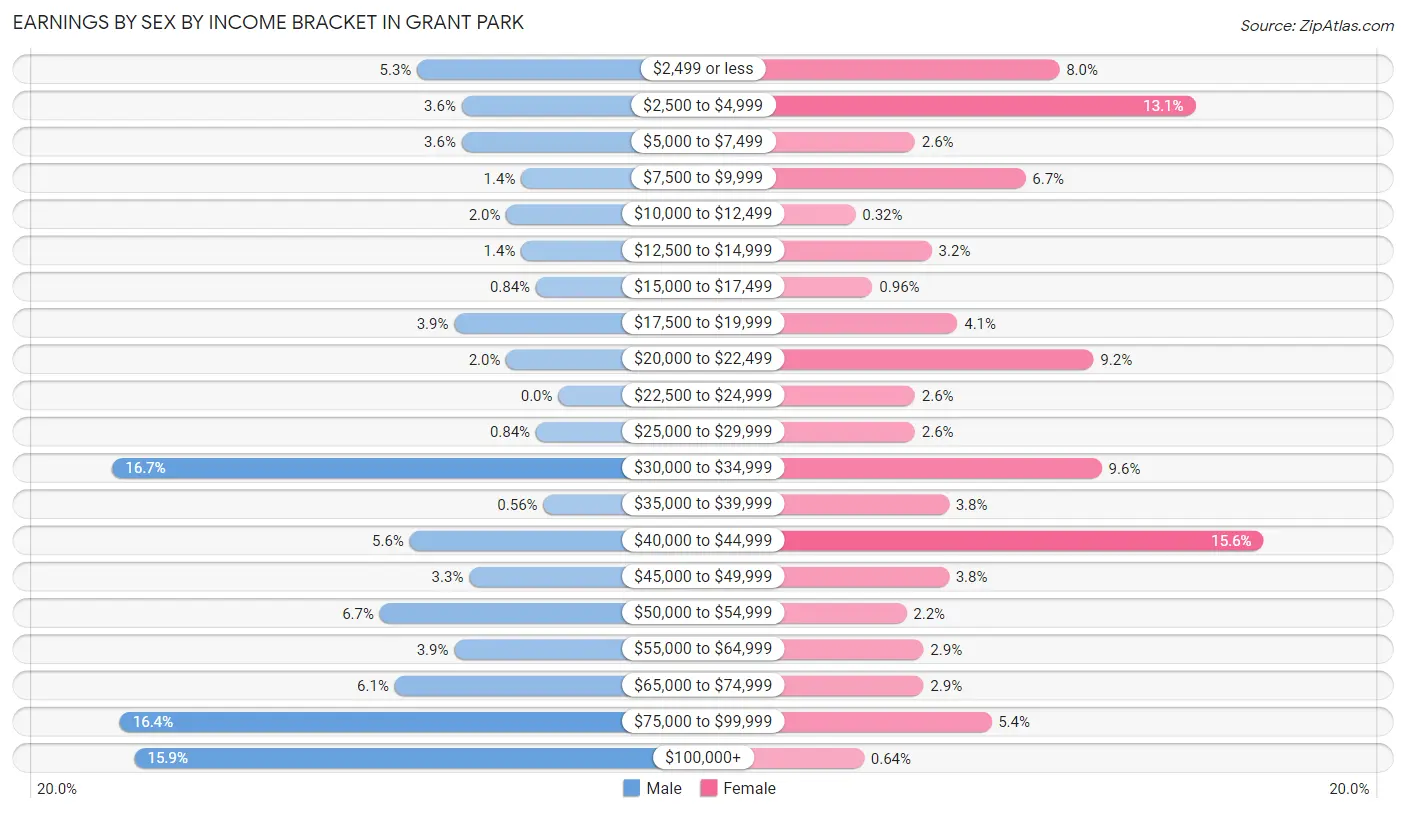
Earnings by Sex by Income Bracket in Grant Park
The most common earnings brackets in Grant Park are $30,000 to $34,999 for men (60 | 16.7%) and $40,000 to $44,999 for women (49 | 15.6%).
| Income | Male | Female |
| $2,499 or less | 19 (5.3%) | 25 (8.0%) |
| $2,500 to $4,999 | 13 (3.6%) | 41 (13.1%) |
| $5,000 to $7,499 | 13 (3.6%) | 8 (2.5%) |
| $7,500 to $9,999 | 5 (1.4%) | 21 (6.7%) |
| $10,000 to $12,499 | 7 (1.9%) | 1 (0.3%) |
| $12,500 to $14,999 | 5 (1.4%) | 10 (3.2%) |
| $15,000 to $17,499 | 3 (0.8%) | 3 (1.0%) |
| $17,500 to $19,999 | 14 (3.9%) | 13 (4.1%) |
| $20,000 to $22,499 | 7 (1.9%) | 29 (9.2%) |
| $22,500 to $24,999 | 0 (0.0%) | 8 (2.5%) |
| $25,000 to $29,999 | 3 (0.8%) | 8 (2.5%) |
| $30,000 to $34,999 | 60 (16.7%) | 30 (9.6%) |
| $35,000 to $39,999 | 2 (0.6%) | 12 (3.8%) |
| $40,000 to $44,999 | 20 (5.6%) | 49 (15.6%) |
| $45,000 to $49,999 | 12 (3.3%) | 12 (3.8%) |
| $50,000 to $54,999 | 24 (6.7%) | 7 (2.2%) |
| $55,000 to $64,999 | 14 (3.9%) | 9 (2.9%) |
| $65,000 to $74,999 | 22 (6.1%) | 9 (2.9%) |
| $75,000 to $99,999 | 59 (16.4%) | 17 (5.4%) |
| $100,000+ | 57 (15.9%) | 2 (0.6%) |
| Total | 359 (100.0%) | 314 (100.0%) |
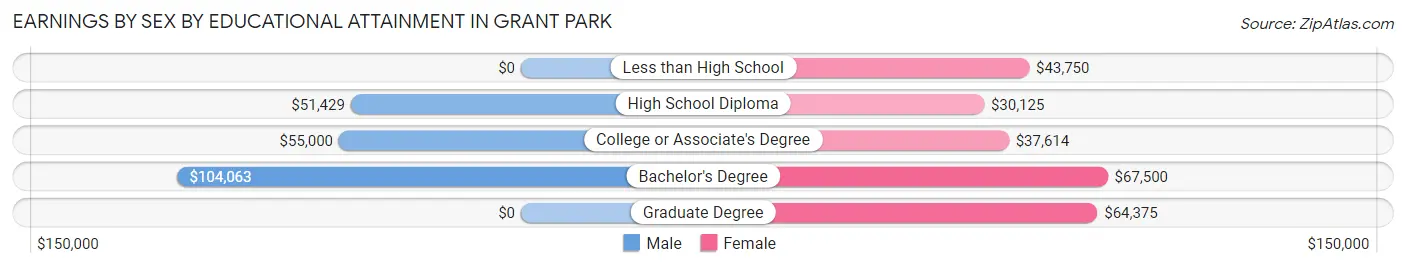
Earnings by Sex by Educational Attainment in Grant Park
Average earnings in Grant Park are $59,375 for men and $32,232 for women, a difference of 45.7%. Men with an educational attainment of bachelor's degree enjoy the highest average annual earnings of $104,063, while those with high school diploma education earn the least with $51,429. Women with an educational attainment of bachelor's degree earn the most with the average annual earnings of $67,500, while those with high school diploma education have the smallest earnings of $30,125.
| Educational Attainment | Male Income | Female Income |
| Less than High School | - | - |
| High School Diploma | $51,429 | $30,125 |
| College or Associate's Degree | $55,000 | $37,614 |
| Bachelor's Degree | $104,063 | $67,500 |
| Graduate Degree | - | - |
| Total | $59,375 | $32,232 |
Family Income in Grant Park
Family Income Brackets in Grant Park
According to the Grant Park family income data, there are 90 families falling into the $50,000 to $74,999 income range, which is the most common income bracket and makes up 25.4% of all families. Conversely, the $10,000 to $14,999 income bracket is the least frequent group with only 3 families (0.9%) belonging to this category.
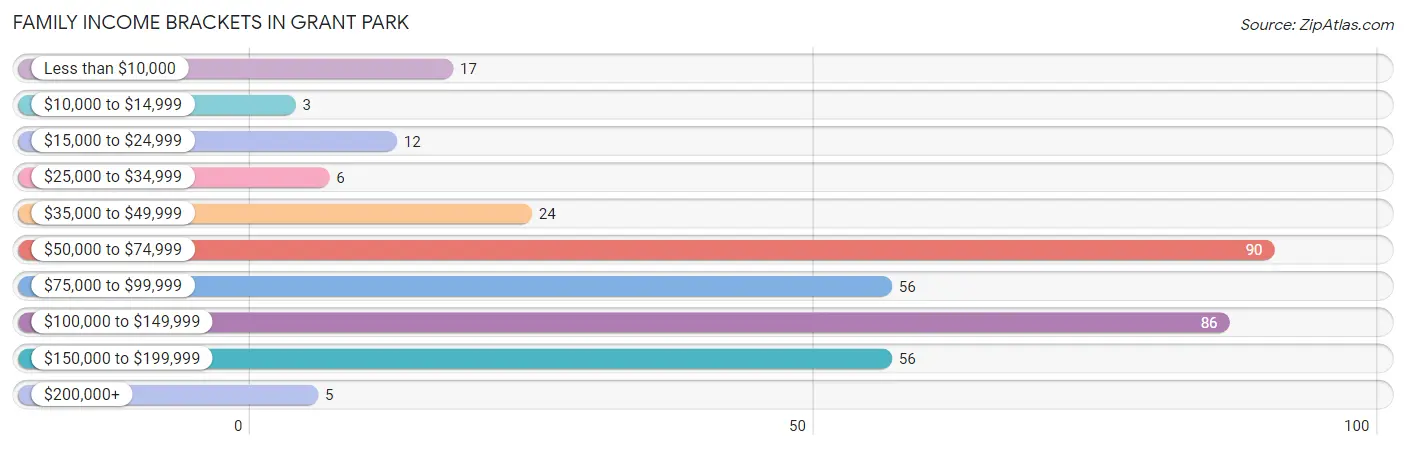
| Income Bracket | # Families | % Families |
| Less than $10,000 | 17 | 4.8% |
| $10,000 to $14,999 | 3 | 0.8% |
| $15,000 to $24,999 | 12 | 3.4% |
| $25,000 to $34,999 | 6 | 1.7% |
| $35,000 to $49,999 | 24 | 6.8% |
| $50,000 to $74,999 | 90 | 25.4% |
| $75,000 to $99,999 | 56 | 15.8% |
| $100,000 to $149,999 | 86 | 24.2% |
| $150,000 to $199,999 | 56 | 15.8% |
| $200,000+ | 5 | 1.4% |
Family Income by Famaliy Size in Grant Park
5-person families (45 | 12.7%) account for the highest median family income in Grant Park with $138,259 per family, while 2-person families (131 | 36.9%) have the highest median income of $39,792 per family member.
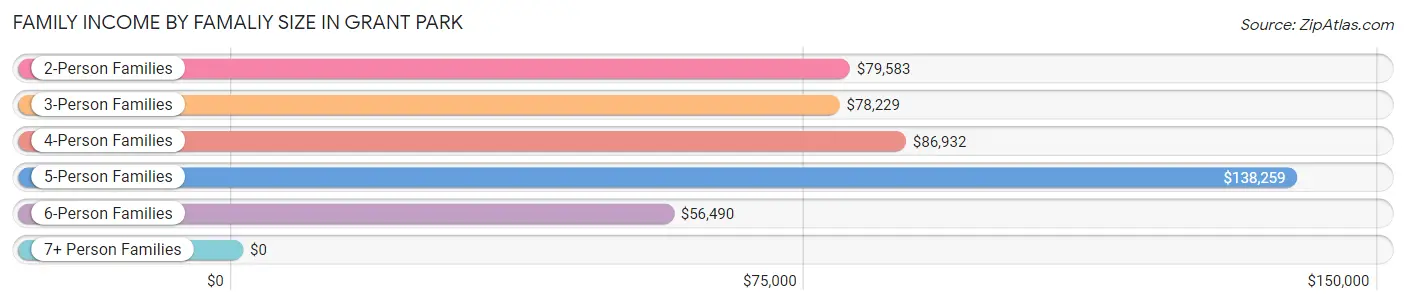
| Income Bracket | # Families | Median Income |
| 2-Person Families | 131 (36.9%) | $79,583 |
| 3-Person Families | 93 (26.2%) | $78,229 |
| 4-Person Families | 55 (15.5%) | $86,932 |
| 5-Person Families | 45 (12.7%) | $138,259 |
| 6-Person Families | 31 (8.7%) | $56,490 |
| 7+ Person Families | 0 (0.0%) | $0 |
| Total | 355 (100.0%) | $85,547 |
Family Income by Number of Earners in Grant Park
The median family income in Grant Park is $85,547, with families comprising 3+ earners (59) having the highest median family income of $138,348, while families with no earners (87) have the lowest median family income of $56,393, accounting for 16.6% and 24.5% of families, respectively.
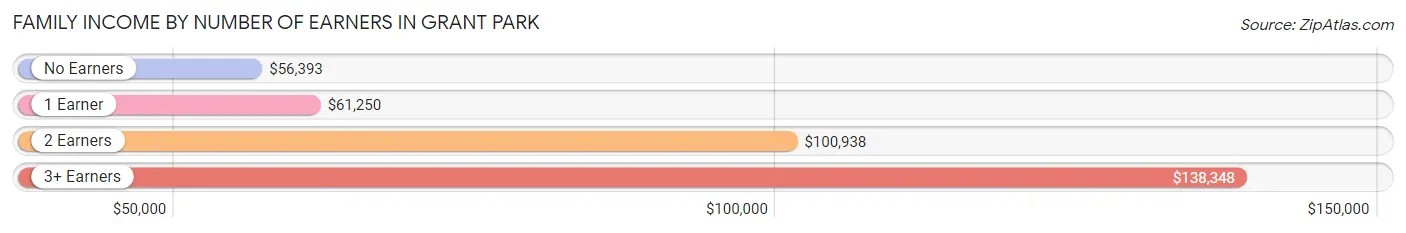
| Number of Earners | # Families | Median Income |
| No Earners | 87 (24.5%) | $56,393 |
| 1 Earner | 92 (25.9%) | $61,250 |
| 2 Earners | 117 (33.0%) | $100,938 |
| 3+ Earners | 59 (16.6%) | $138,348 |
| Total | 355 (100.0%) | $85,547 |
Household Income in Grant Park
Household Income Brackets in Grant Park
With 100 households falling in the category, the $100,000 to $149,999 income range is the most frequent in Grant Park, accounting for 20.4% of all households. In contrast, only 6 households (1.2%) fall into the $200,000+ income bracket, making it the least populous group.
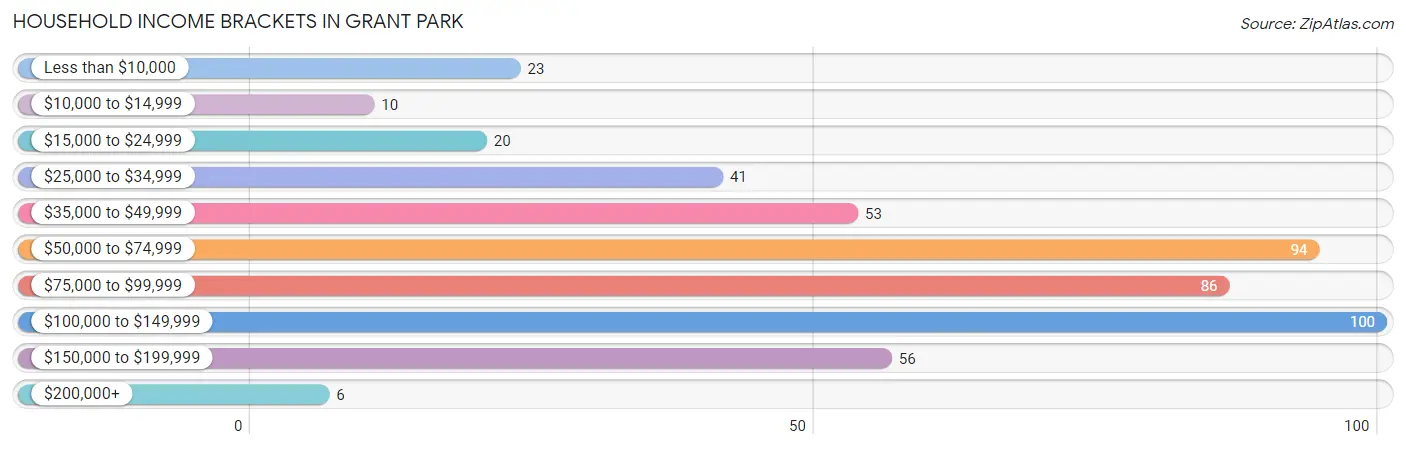
| Income Bracket | # Households | % Households |
| Less than $10,000 | 23 | 4.7% |
| $10,000 to $14,999 | 10 | 2.0% |
| $15,000 to $24,999 | 20 | 4.1% |
| $25,000 to $34,999 | 41 | 8.4% |
| $35,000 to $49,999 | 53 | 10.8% |
| $50,000 to $74,999 | 94 | 19.2% |
| $75,000 to $99,999 | 86 | 17.6% |
| $100,000 to $149,999 | 100 | 20.4% |
| $150,000 to $199,999 | 56 | 11.5% |
| $200,000+ | 6 | 1.2% |
Household Income by Householder Age in Grant Park
The median household income in Grant Park is $76,750, with the highest median household income of $87,159 found in the 45 to 64 years age bracket for the primary householder. A total of 153 households (31.3%) fall into this category.
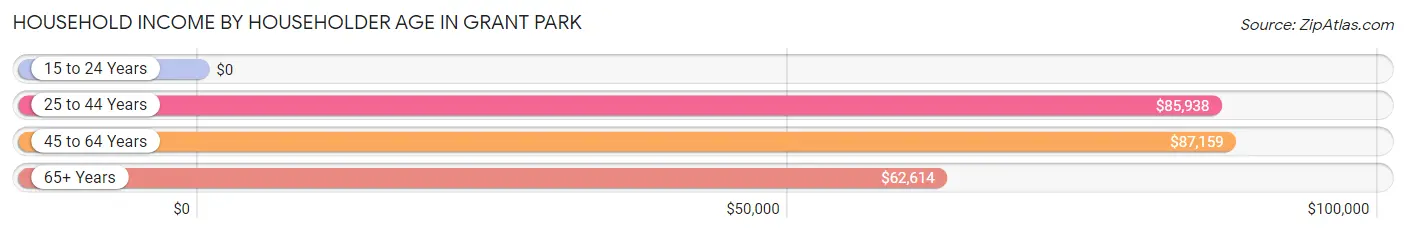
| Income Bracket | # Households | Median Income |
| 15 to 24 Years | 0 (0.0%) | $0 |
| 25 to 44 Years | 131 (26.8%) | $85,938 |
| 45 to 64 Years | 153 (31.3%) | $87,159 |
| 65+ Years | 205 (41.9%) | $62,614 |
| Total | 489 (100.0%) | $76,750 |
Poverty in Grant Park
Income Below Poverty by Sex and Age in Grant Park
With 5.3% poverty level for males and 10.2% for females among the residents of Grant Park, 55 to 64 year old males and 15 year old females are the most vulnerable to poverty, with 10 males (12.3%) and 7 females (53.8%) in their respective age groups living below the poverty level.
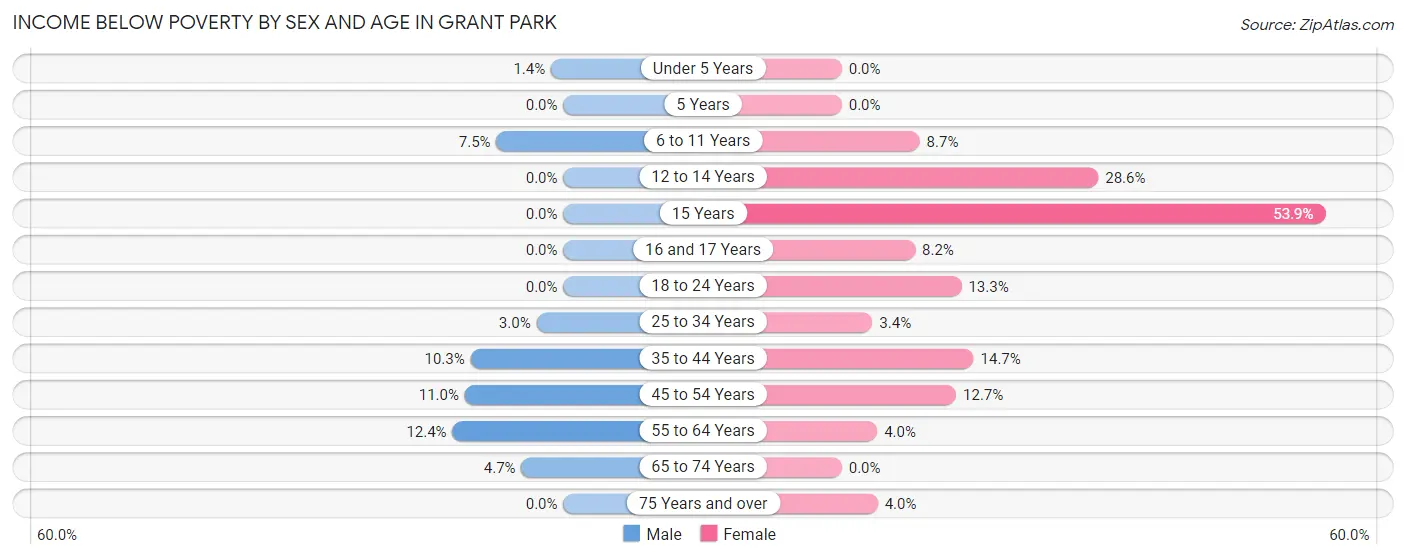
| Age Bracket | Male | Female |
| Under 5 Years | 2 (1.4%) | 0 (0.0%) |
| 5 Years | 0 (0.0%) | 0 (0.0%) |
| 6 to 11 Years | 7 (7.4%) | 13 (8.7%) |
| 12 to 14 Years | 0 (0.0%) | 22 (28.6%) |
| 15 Years | 0 (0.0%) | 7 (53.8%) |
| 16 and 17 Years | 0 (0.0%) | 4 (8.2%) |
| 18 to 24 Years | 0 (0.0%) | 4 (13.3%) |
| 25 to 34 Years | 2 (3.0%) | 3 (3.4%) |
| 35 to 44 Years | 9 (10.3%) | 16 (14.7%) |
| 45 to 54 Years | 9 (11.0%) | 7 (12.7%) |
| 55 to 64 Years | 10 (12.3%) | 3 (4.0%) |
| 65 to 74 Years | 5 (4.7%) | 0 (0.0%) |
| 75 Years and over | 0 (0.0%) | 3 (4.0%) |
| Total | 44 (5.3%) | 82 (10.2%) |
Income Above Poverty by Sex and Age in Grant Park
According to the poverty statistics in Grant Park, males aged 5 years and females aged under 5 years are the age groups that are most secure financially, with 100.0% of males and 100.0% of females in these age groups living above the poverty line.
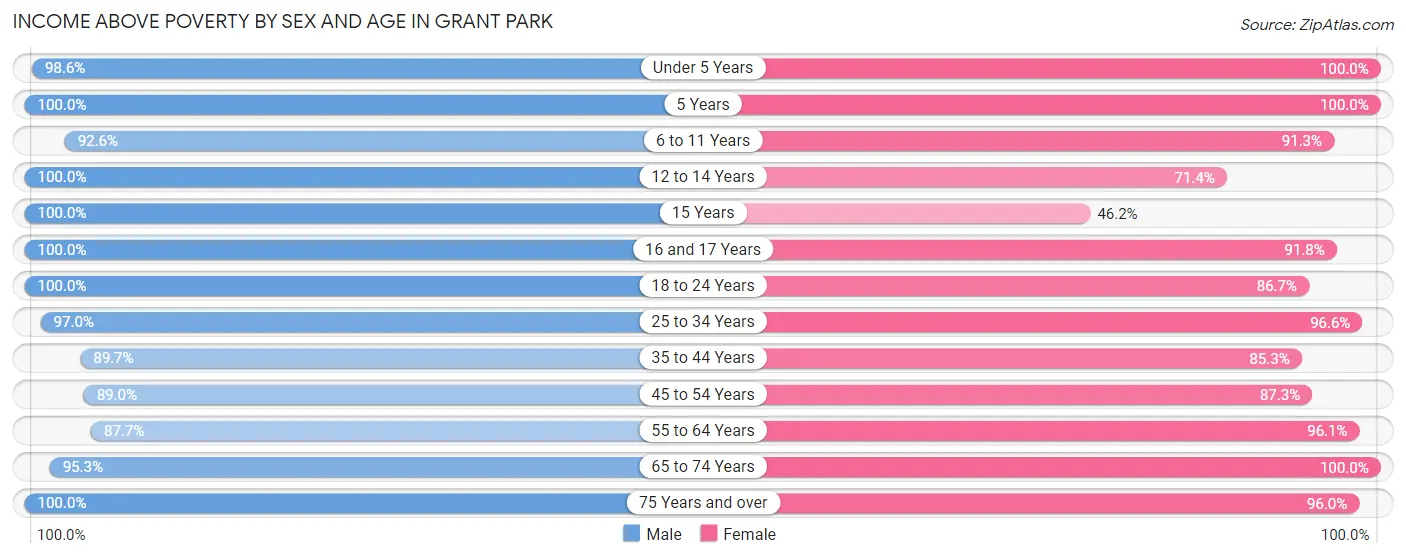
| Age Bracket | Male | Female |
| Under 5 Years | 144 (98.6%) | 12 (100.0%) |
| 5 Years | 2 (100.0%) | 2 (100.0%) |
| 6 to 11 Years | 87 (92.5%) | 137 (91.3%) |
| 12 to 14 Years | 29 (100.0%) | 55 (71.4%) |
| 15 Years | 4 (100.0%) | 6 (46.2%) |
| 16 and 17 Years | 46 (100.0%) | 45 (91.8%) |
| 18 to 24 Years | 42 (100.0%) | 26 (86.7%) |
| 25 to 34 Years | 65 (97.0%) | 85 (96.6%) |
| 35 to 44 Years | 78 (89.7%) | 93 (85.3%) |
| 45 to 54 Years | 73 (89.0%) | 48 (87.3%) |
| 55 to 64 Years | 71 (87.6%) | 73 (96.1%) |
| 65 to 74 Years | 102 (95.3%) | 69 (100.0%) |
| 75 Years and over | 49 (100.0%) | 72 (96.0%) |
| Total | 792 (94.7%) | 723 (89.8%) |
Income Below Poverty Among Married-Couple Families in Grant Park
The poverty statistics for married-couple families in Grant Park show that 2.6% or 7 of the total 270 families live below the poverty line. Families with 1 or 2 children have the highest poverty rate of 4.9%, comprising of 4 families. On the other hand, families with 3 or 4 children have the lowest poverty rate of 0.0%, which includes 0 families.
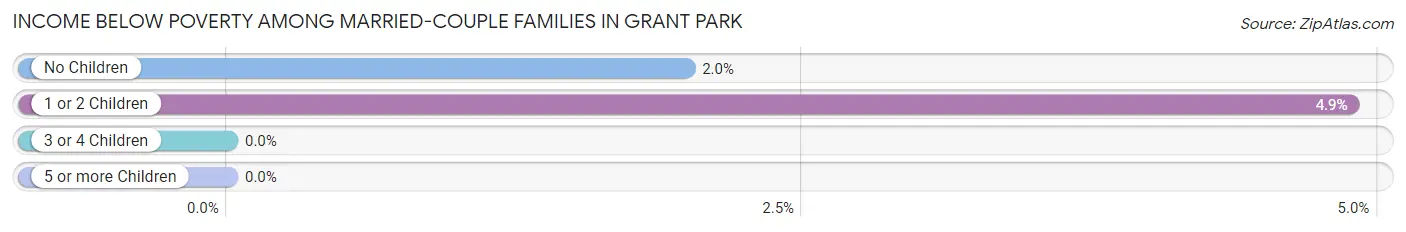
| Children | Above Poverty | Below Poverty |
| No Children | 148 (98.0%) | 3 (2.0%) |
| 1 or 2 Children | 78 (95.1%) | 4 (4.9%) |
| 3 or 4 Children | 37 (100.0%) | 0 (0.0%) |
| 5 or more Children | 0 (0.0%) | 0 (0.0%) |
| Total | 263 (97.4%) | 7 (2.6%) |
Income Below Poverty Among Single-Parent Households in Grant Park
According to the poverty data in Grant Park, 12.0% or 6 single-father households and 45.7% or 16 single-mother households are living below the poverty line. Among single-father households, those with 1 or 2 children have the highest poverty rate, with 6 households (40.0%) experiencing poverty. Likewise, among single-mother households, those with 3 or 4 children have the highest poverty rate, with 3 households (100.0%) falling below the poverty line.
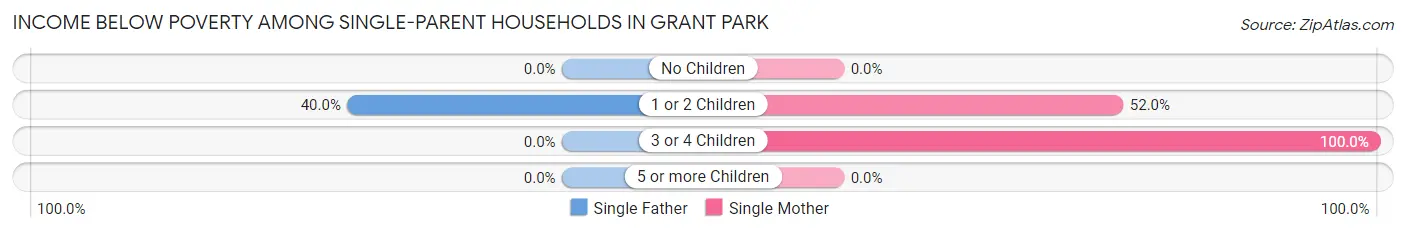
| Children | Single Father | Single Mother |
| No Children | 0 (0.0%) | 0 (0.0%) |
| 1 or 2 Children | 6 (40.0%) | 13 (52.0%) |
| 3 or 4 Children | 0 (0.0%) | 3 (100.0%) |
| 5 or more Children | 0 (0.0%) | 0 (0.0%) |
| Total | 6 (12.0%) | 16 (45.7%) |
Income Below Poverty Among Married-Couple vs Single-Parent Households in Grant Park
The poverty data for Grant Park shows that 7 of the married-couple family households (2.6%) and 22 of the single-parent households (25.9%) are living below the poverty level. Within the married-couple family households, those with 1 or 2 children have the highest poverty rate, with 4 households (4.9%) falling below the poverty line. Among the single-parent households, those with 1 or 2 children have the highest poverty rate, with 19 household (47.5%) living below poverty.
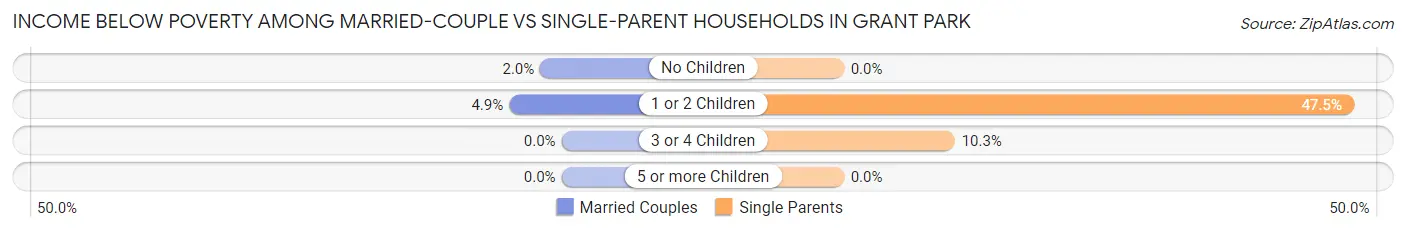
| Children | Married-Couple Families | Single-Parent Households |
| No Children | 3 (2.0%) | 0 (0.0%) |
| 1 or 2 Children | 4 (4.9%) | 19 (47.5%) |
| 3 or 4 Children | 0 (0.0%) | 3 (10.3%) |
| 5 or more Children | 0 (0.0%) | 0 (0.0%) |
| Total | 7 (2.6%) | 22 (25.9%) |
Race in Grant Park
The most populous races in Grant Park are White / Caucasian (1,586 | 96.7%), Hispanic or Latino (49 | 3.0%), and Two or more Races (33 | 2.0%).
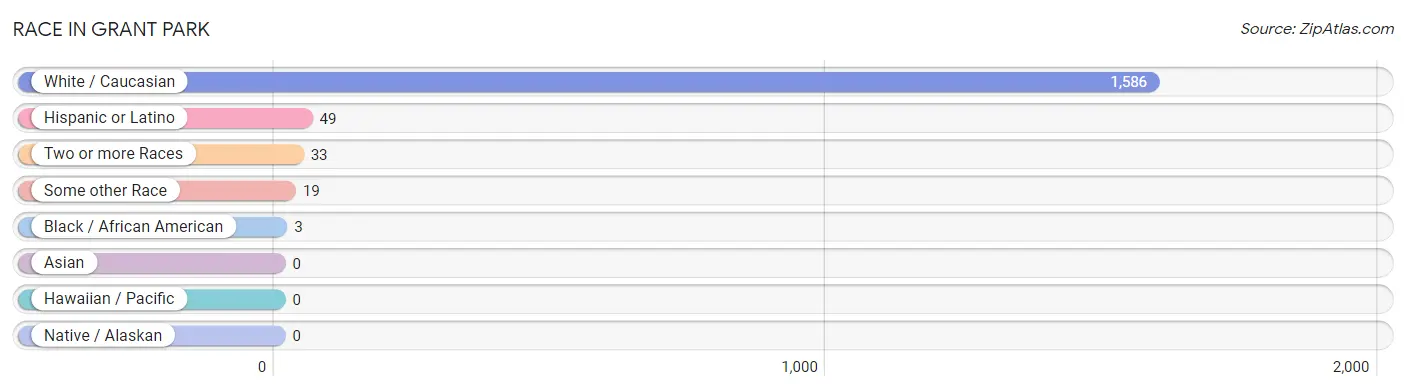
| Race | # Population | % Population |
| Asian | 0 | 0.0% |
| Black / African American | 3 | 0.2% |
| Hawaiian / Pacific | 0 | 0.0% |
| Hispanic or Latino | 49 | 3.0% |
| Native / Alaskan | 0 | 0.0% |
| White / Caucasian | 1,586 | 96.7% |
| Two or more Races | 33 | 2.0% |
| Some other Race | 19 | 1.2% |
| Total | 1,641 | 100.0% |
Ancestry in Grant Park
The most populous ancestries reported in Grant Park are German (714 | 43.5%), Polish (345 | 21.0%), English (218 | 13.3%), Irish (138 | 8.4%), and Italian (103 | 6.3%), together accounting for 92.5% of all Grant Park residents.
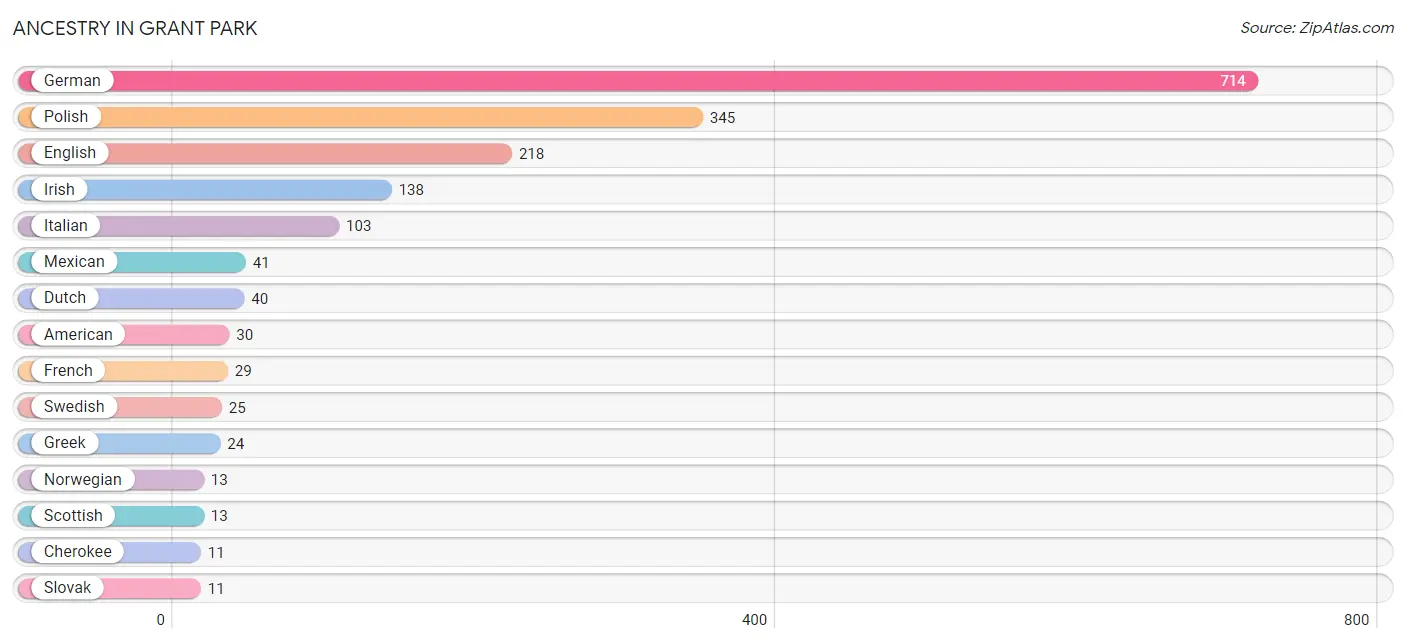
| Ancestry | # Population | % Population |
| American | 30 | 1.8% |
| Austrian | 7 | 0.4% |
| Canadian | 4 | 0.2% |
| Cherokee | 11 | 0.7% |
| Czech | 4 | 0.2% |
| Czechoslovakian | 3 | 0.2% |
| Danish | 8 | 0.5% |
| Dutch | 40 | 2.4% |
| Eastern European | 3 | 0.2% |
| English | 218 | 13.3% |
| Finnish | 3 | 0.2% |
| French | 29 | 1.8% |
| French Canadian | 10 | 0.6% |
| German | 714 | 43.5% |
| Greek | 24 | 1.5% |
| Hungarian | 10 | 0.6% |
| Irish | 138 | 8.4% |
| Italian | 103 | 6.3% |
| Lithuanian | 7 | 0.4% |
| Mexican | 41 | 2.5% |
| Norwegian | 13 | 0.8% |
| Polish | 345 | 21.0% |
| Puerto Rican | 4 | 0.2% |
| Russian | 1 | 0.1% |
| Scandinavian | 4 | 0.2% |
| Scotch-Irish | 3 | 0.2% |
| Scottish | 13 | 0.8% |
| Slovak | 11 | 0.7% |
| Spanish | 4 | 0.2% |
| Swedish | 25 | 1.5% | View All 30 Rows |
Immigrants in Grant Park
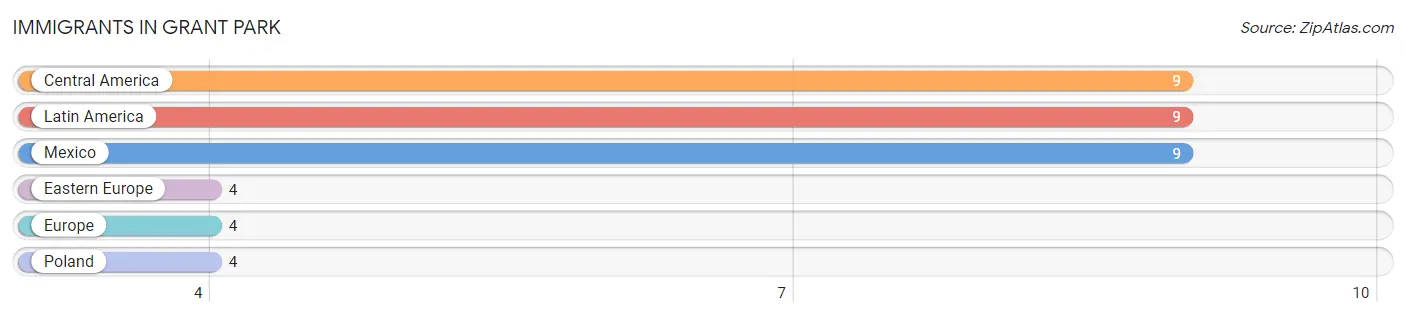
The most numerous immigrant groups reported in Grant Park came from Central America (9 | 0.5%), Latin America (9 | 0.5%), Mexico (9 | 0.5%), Eastern Europe (4 | 0.2%), and Europe (4 | 0.2%), together accounting for 2.1% of all Grant Park residents.
| Immigration Origin | # Population | % Population |
| Central America | 9 | 0.5% |
| Eastern Europe | 4 | 0.2% |
| Europe | 4 | 0.2% |
| Latin America | 9 | 0.5% |
| Mexico | 9 | 0.5% |
| Poland | 4 | 0.2% | View All 6 Rows |
Sex and Age in Grant Park
Sex and Age in Grant Park
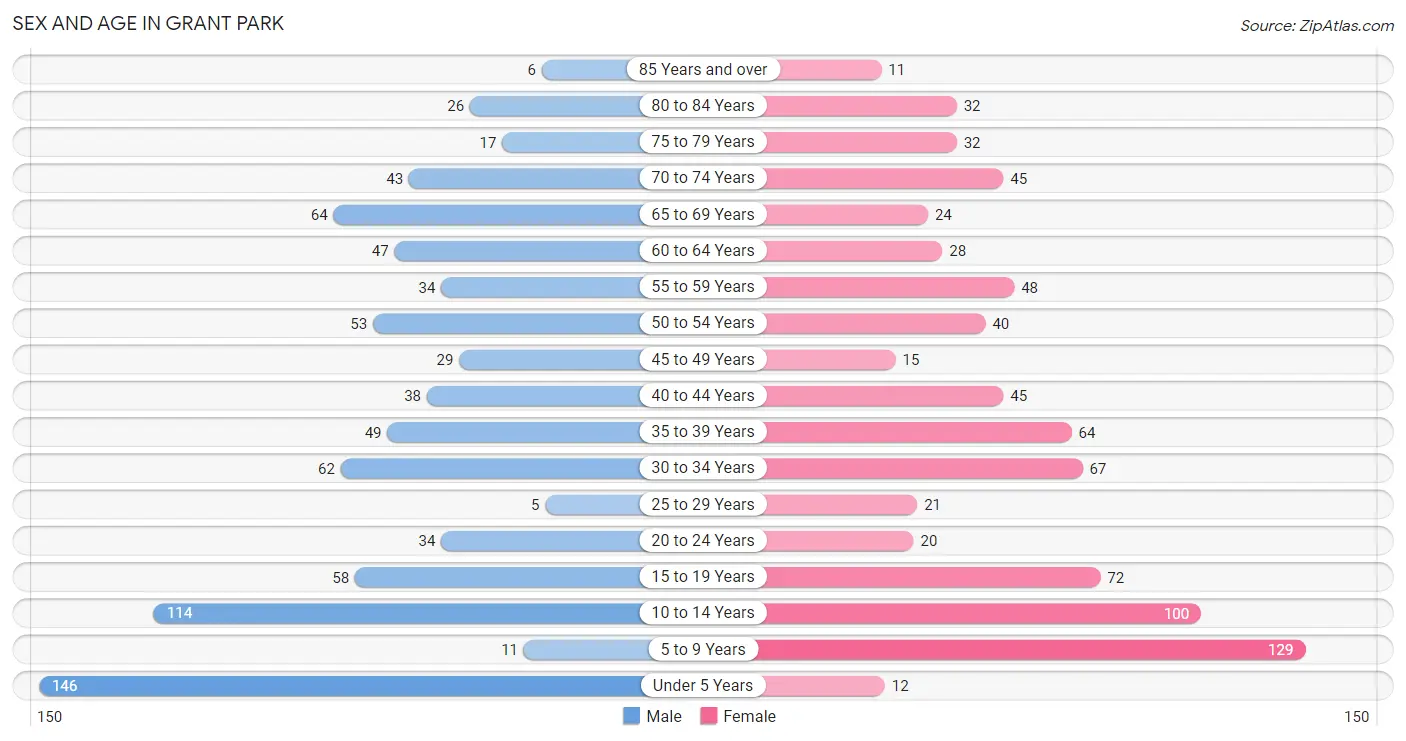
The most populous age groups in Grant Park are Under 5 Years (146 | 17.5%) for men and 5 to 9 Years (129 | 16.0%) for women.
| Age Bracket | Male | Female |
| Under 5 Years | 146 (17.5%) | 12 (1.5%) |
| 5 to 9 Years | 11 (1.3%) | 129 (16.0%) |
| 10 to 14 Years | 114 (13.6%) | 100 (12.4%) |
| 15 to 19 Years | 58 (6.9%) | 72 (8.9%) |
| 20 to 24 Years | 34 (4.1%) | 20 (2.5%) |
| 25 to 29 Years | 5 (0.6%) | 21 (2.6%) |
| 30 to 34 Years | 62 (7.4%) | 67 (8.3%) |
| 35 to 39 Years | 49 (5.9%) | 64 (8.0%) |
| 40 to 44 Years | 38 (4.5%) | 45 (5.6%) |
| 45 to 49 Years | 29 (3.5%) | 15 (1.9%) |
| 50 to 54 Years | 53 (6.3%) | 40 (5.0%) |
| 55 to 59 Years | 34 (4.1%) | 48 (6.0%) |
| 60 to 64 Years | 47 (5.6%) | 28 (3.5%) |
| 65 to 69 Years | 64 (7.7%) | 24 (3.0%) |
| 70 to 74 Years | 43 (5.1%) | 45 (5.6%) |
| 75 to 79 Years | 17 (2.0%) | 32 (4.0%) |
| 80 to 84 Years | 26 (3.1%) | 32 (4.0%) |
| 85 Years and over | 6 (0.7%) | 11 (1.4%) |
| Total | 836 (100.0%) | 805 (100.0%) |
Families and Households in Grant Park
Median Family Size in Grant Park
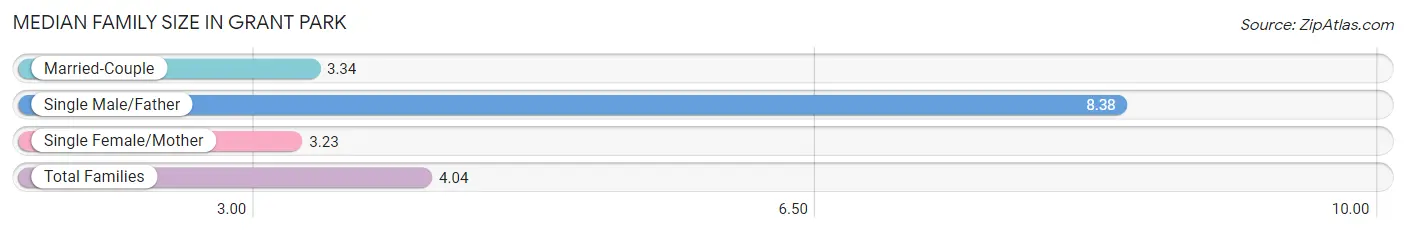
The median family size in Grant Park is 4.04 persons per family, with single male/father families (50 | 14.1%) accounting for the largest median family size of 8.38 persons per family. On the other hand, single female/mother families (35 | 9.9%) represent the smallest median family size with 3.23 persons per family.
| Family Type | # Families | Family Size |
| Married-Couple | 270 (76.1%) | 3.34 |
| Single Male/Father | 50 (14.1%) | 8.38 |
| Single Female/Mother | 35 (9.9%) | 3.23 |
| Total Families | 355 (100.0%) | 4.04 |
Median Household Size in Grant Park
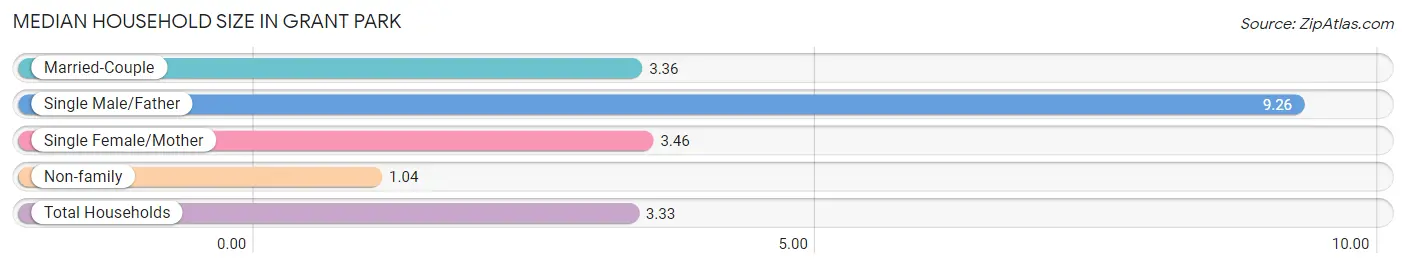
The median household size in Grant Park is 3.33 persons per household, with single male/father households (50 | 10.2%) accounting for the largest median household size of 9.26 persons per household. non-family households (134 | 27.4%) represent the smallest median household size with 1.04 persons per household.
| Household Type | # Households | Household Size |
| Married-Couple | 270 (55.2%) | 3.36 |
| Single Male/Father | 50 (10.2%) | 9.26 |
| Single Female/Mother | 35 (7.2%) | 3.46 |
| Non-family | 134 (27.4%) | 1.04 |
| Total Households | 489 (100.0%) | 3.33 |
Household Size by Marriage Status in Grant Park
Out of a total of 489 households in Grant Park, 355 (72.6%) are family households, while 134 (27.4%) are nonfamily households. The most numerous type of family households are 2-person households, comprising 131, and the most common type of nonfamily households are 1-person households, comprising 128.
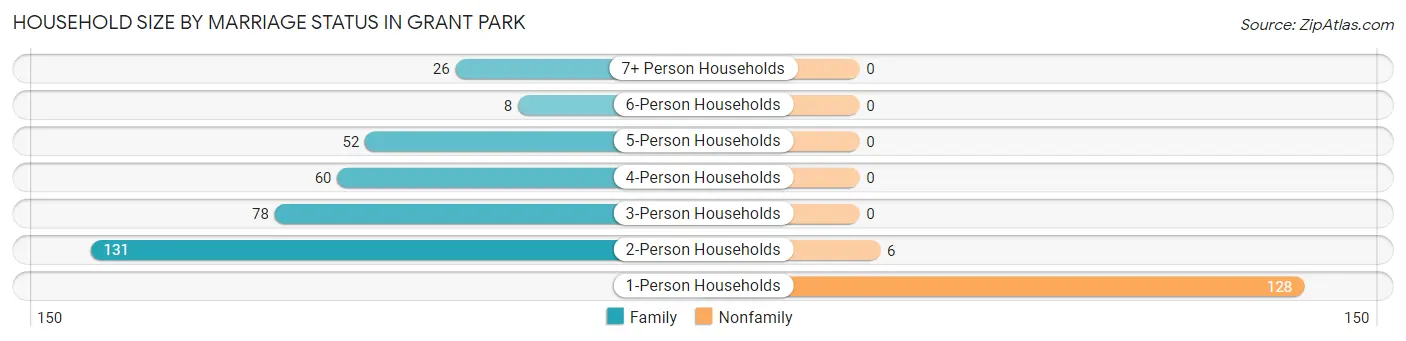
| Household Size | Family Households | Nonfamily Households |
| 1-Person Households | - | 128 (26.2%) |
| 2-Person Households | 131 (26.8%) | 6 (1.2%) |
| 3-Person Households | 78 (16.0%) | 0 (0.0%) |
| 4-Person Households | 60 (12.3%) | 0 (0.0%) |
| 5-Person Households | 52 (10.6%) | 0 (0.0%) |
| 6-Person Households | 8 (1.6%) | 0 (0.0%) |
| 7+ Person Households | 26 (5.3%) | 0 (0.0%) |
| Total | 355 (72.6%) | 134 (27.4%) |
Female Fertility in Grant Park
Fertility by Age in Grant Park
Average fertility rate in Grant Park is 6.0 births per 1,000 women. Women in the age bracket of 20 to 34 years have the highest fertility rate with 19.0 births per 1,000 women. Women in the age bracket of 20 to 34 years acount for 100.0% of all women with births.
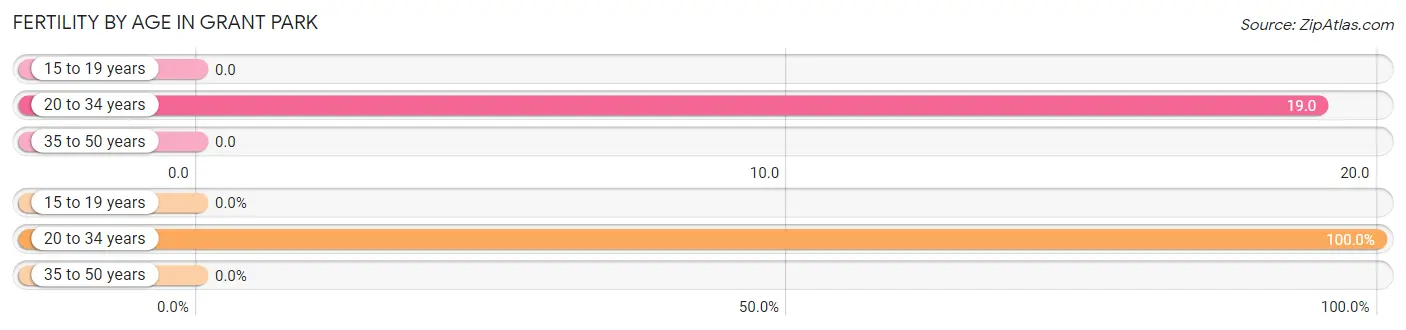
| Age Bracket | Women with Births | Births / 1,000 Women |
| 15 to 19 years | 0 (0.0%) | 0.0 |
| 20 to 34 years | 2 (100.0%) | 19.0 |
| 35 to 50 years | 0 (0.0%) | 0.0 |
| Total | 2 (100.0%) | 6.0 |
Fertility by Age by Marriage Status in Grant Park
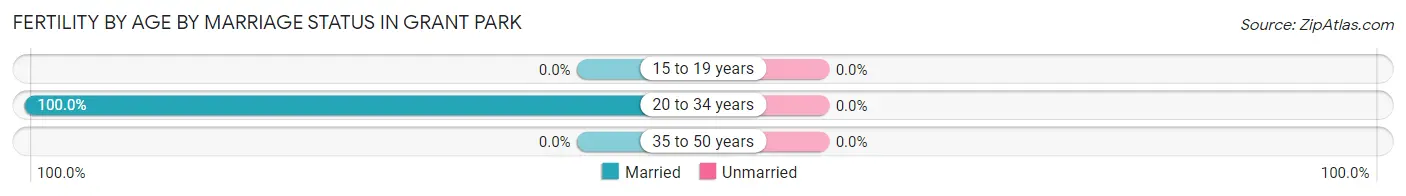
| Age Bracket | Married | Unmarried |
| 15 to 19 years | 0 (0.0%) | 0 (0.0%) |
| 20 to 34 years | 2 (100.0%) | 0 (0.0%) |
| 35 to 50 years | 0 (0.0%) | 0 (0.0%) |
| Total | 2 (100.0%) | 0 (0.0%) |
Fertility by Education in Grant Park
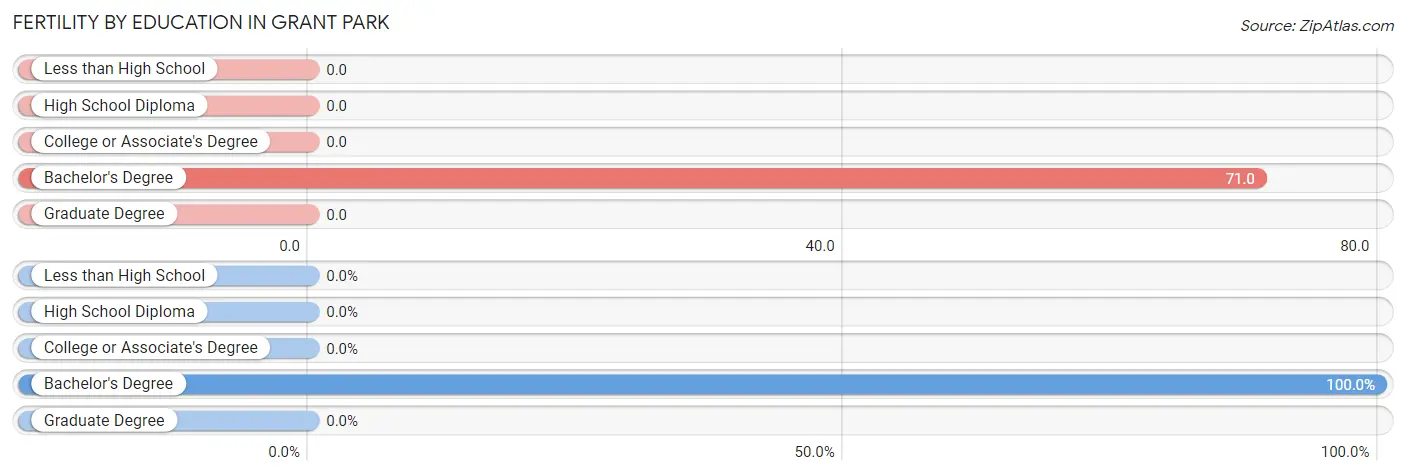
| Educational Attainment | Women with Births | Births / 1,000 Women |
| Less than High School | 0 (0.0%) | 0.0 |
| High School Diploma | 0 (0.0%) | 0.0 |
| College or Associate's Degree | 0 (0.0%) | 0.0 |
| Bachelor's Degree | 2 (100.0%) | 71.0 |
| Graduate Degree | 0 (0.0%) | 0.0 |
| Total | 2 (100.0%) | 6.0 |
Fertility by Education by Marriage Status in Grant Park
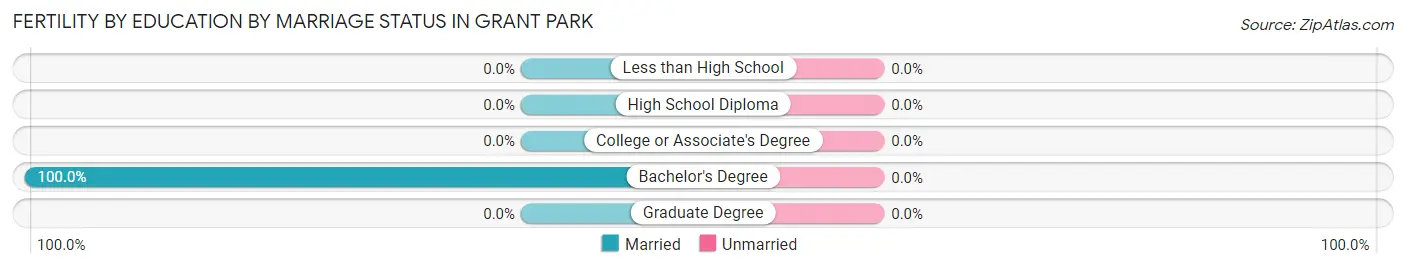
| Educational Attainment | Married | Unmarried |
| Less than High School | 0 (0.0%) | 0 (0.0%) |
| High School Diploma | 0 (0.0%) | 0 (0.0%) |
| College or Associate's Degree | 0 (0.0%) | 0 (0.0%) |
| Bachelor's Degree | 2 (100.0%) | 0 (0.0%) |
| Graduate Degree | 0 (0.0%) | 0 (0.0%) |
| Total | 2 (100.0%) | 0 (0.0%) |
Employment Characteristics in Grant Park
Employment by Class of Employer in Grant Park
Among the 597 employed individuals in Grant Park, private company employees (461 | 77.2%), not-for-profit organizations (39 | 6.5%), and self-employed (not incorporated) (33 | 5.5%) make up the most common classes of employment.
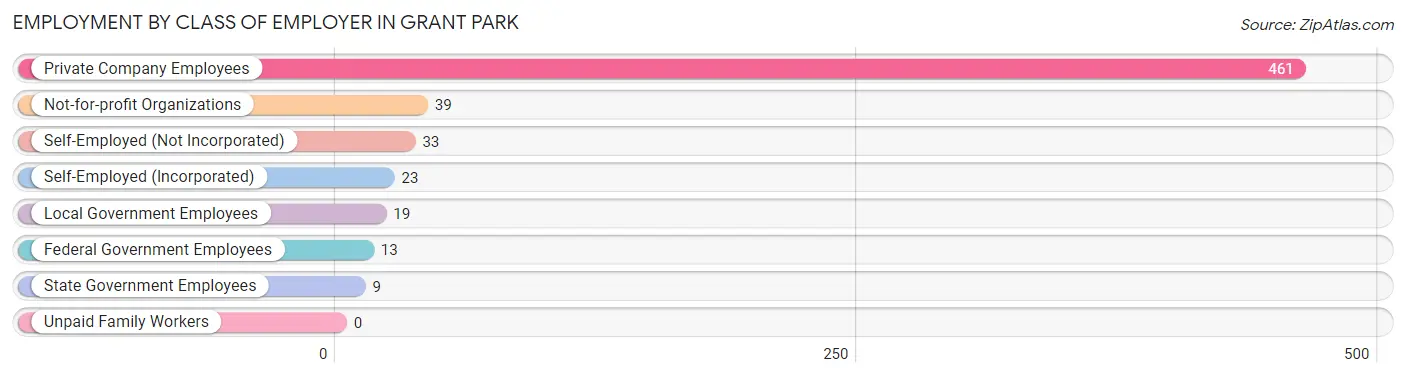
| Employer Class | # Employees | % Employees |
| Private Company Employees | 461 | 77.2% |
| Self-Employed (Incorporated) | 23 | 3.8% |
| Self-Employed (Not Incorporated) | 33 | 5.5% |
| Not-for-profit Organizations | 39 | 6.5% |
| Local Government Employees | 19 | 3.2% |
| State Government Employees | 9 | 1.5% |
| Federal Government Employees | 13 | 2.2% |
| Unpaid Family Workers | 0 | 0.0% |
| Total | 597 | 100.0% |
Employment Status by Age in Grant Park
According to the labor force statistics for Grant Park, out of the total population over 16 years of age (1,112), 59.5% or 662 individuals are in the labor force, with 7.6% or 50 of them unemployed. The age group with the highest labor force participation rate is 20 to 24 years, with 100.0% or 54 individuals in the labor force. Within the labor force, the 16 to 19 years age range has the highest percentage of unemployed individuals, with 40.0% or 22 of them being unemployed.
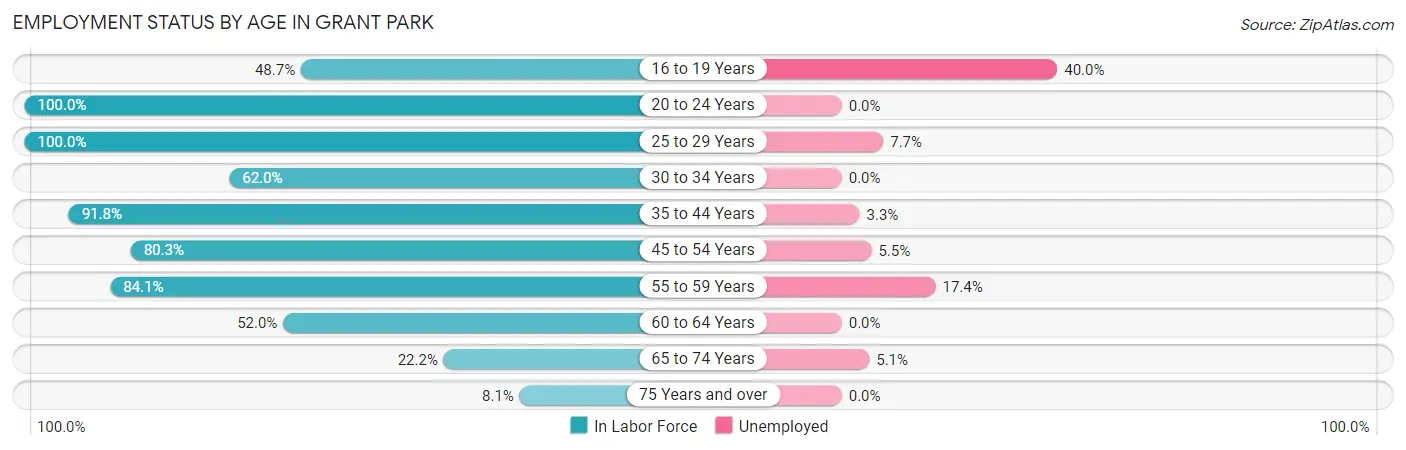
| Age Bracket | In Labor Force | Unemployed |
| 16 to 19 Years | 55 (48.7%) | 22 (40.0%) |
| 20 to 24 Years | 54 (100.0%) | 0 (0.0%) |
| 25 to 29 Years | 26 (100.0%) | 2 (7.7%) |
| 30 to 34 Years | 80 (62.0%) | 0 (0.0%) |
| 35 to 44 Years | 180 (91.8%) | 6 (3.3%) |
| 45 to 54 Years | 110 (80.3%) | 6 (5.5%) |
| 55 to 59 Years | 69 (84.1%) | 12 (17.4%) |
| 60 to 64 Years | 39 (52.0%) | 0 (0.0%) |
| 65 to 74 Years | 39 (22.2%) | 2 (5.1%) |
| 75 Years and over | 10 (8.1%) | 0 (0.0%) |
| Total | 662 (59.5%) | 50 (7.6%) |
Employment Status by Educational Attainment in Grant Park
According to labor force statistics for Grant Park, 78.1% of individuals (504) out of the total population between 25 and 64 years of age (645) are in the labor force, with 5.2% or 26 of them being unemployed. The group with the highest labor force participation rate are those with the educational attainment of high school diploma, with 86.2% or 219 individuals in the labor force. Within the labor force, individuals with less than high school education have the highest percentage of unemployment, with 14.8% or 4 of them being unemployed.
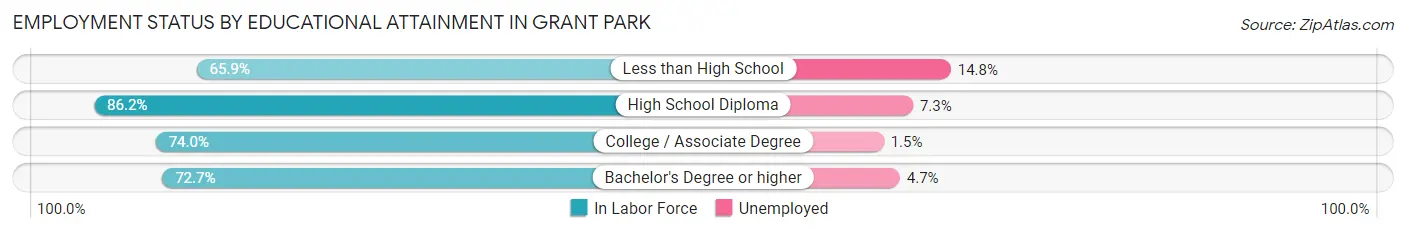
| Educational Attainment | In Labor Force | Unemployed |
| Less than High School | 27 (65.9%) | 6 (14.8%) |
| High School Diploma | 219 (86.2%) | 19 (7.3%) |
| College / Associate Degree | 194 (74.0%) | 4 (1.5%) |
| Bachelor's Degree or higher | 64 (72.7%) | 4 (4.7%) |
| Total | 504 (78.1%) | 34 (5.2%) |
Employment Occupations by Sex in Grant Park
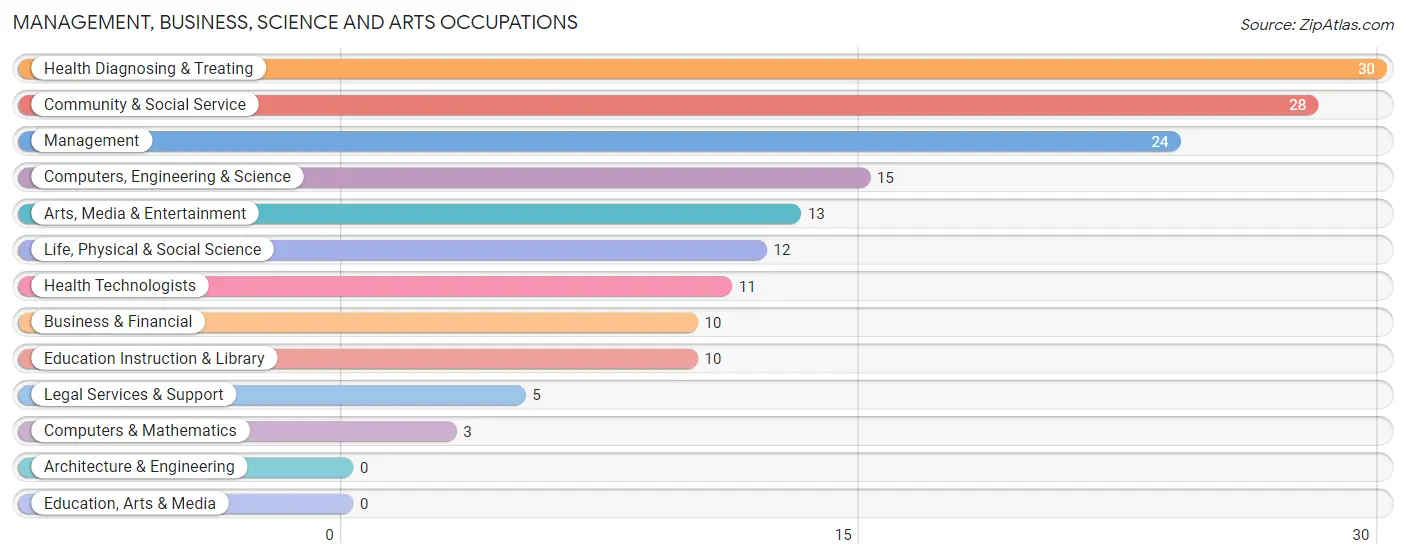
Management, Business, Science and Arts Occupations
The most common Management, Business, Science and Arts occupations in Grant Park are Health Diagnosing & Treating (30 | 4.9%), Community & Social Service (28 | 4.6%), Management (24 | 3.9%), Computers, Engineering & Science (15 | 2.5%), and Arts, Media & Entertainment (13 | 2.1%).
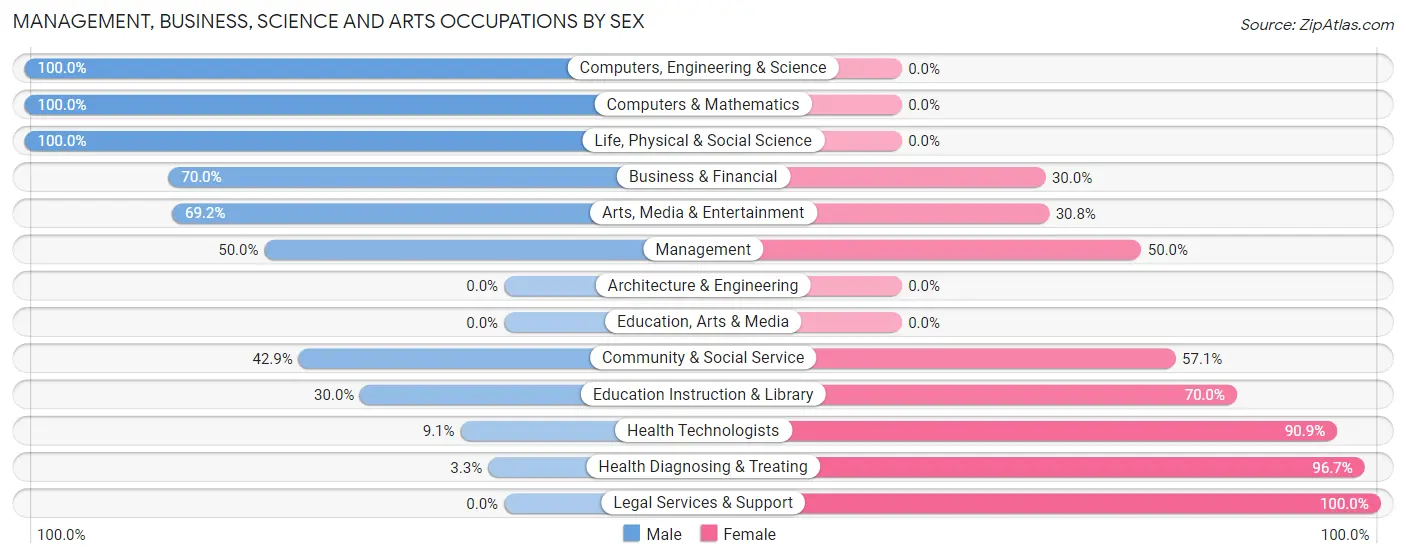
Management, Business, Science and Arts Occupations by Sex
Within the Management, Business, Science and Arts occupations in Grant Park, the most male-oriented occupations are Computers, Engineering & Science (100.0%), Computers & Mathematics (100.0%), and Life, Physical & Social Science (100.0%), while the most female-oriented occupations are Legal Services & Support (100.0%), Health Diagnosing & Treating (96.7%), and Health Technologists (90.9%).
| Occupation | Male | Female |
| Management | 12 (50.0%) | 12 (50.0%) |
| Business & Financial | 7 (70.0%) | 3 (30.0%) |
| Computers, Engineering & Science | 15 (100.0%) | 0 (0.0%) |
| Computers & Mathematics | 3 (100.0%) | 0 (0.0%) |
| Architecture & Engineering | 0 (0.0%) | 0 (0.0%) |
| Life, Physical & Social Science | 12 (100.0%) | 0 (0.0%) |
| Community & Social Service | 12 (42.9%) | 16 (57.1%) |
| Education, Arts & Media | 0 (0.0%) | 0 (0.0%) |
| Legal Services & Support | 0 (0.0%) | 5 (100.0%) |
| Education Instruction & Library | 3 (30.0%) | 7 (70.0%) |
| Arts, Media & Entertainment | 9 (69.2%) | 4 (30.8%) |
| Health Diagnosing & Treating | 1 (3.3%) | 29 (96.7%) |
| Health Technologists | 1 (9.1%) | 10 (90.9%) |
| Total (Category) | 47 (43.9%) | 60 (56.1%) |
| Total (Overall) | 324 (52.9%) | 288 (47.1%) |
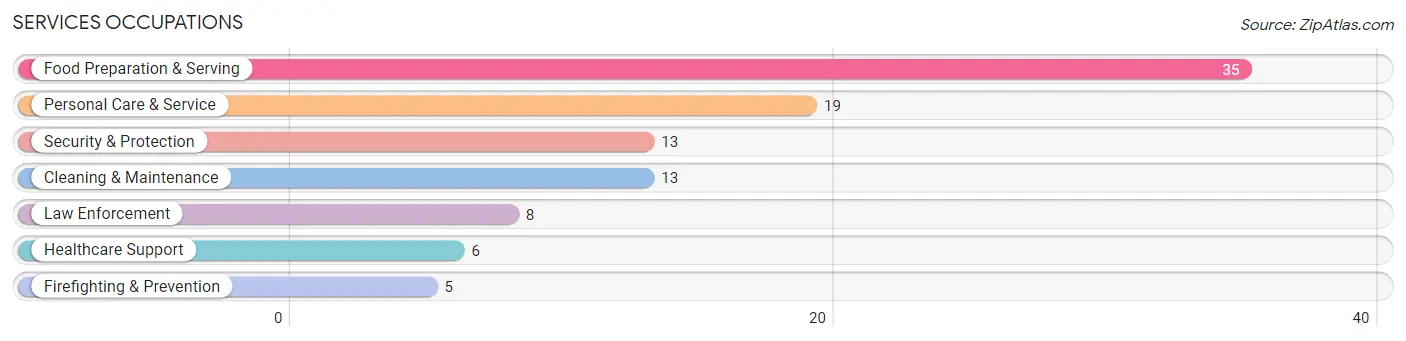
Services Occupations
The most common Services occupations in Grant Park are Food Preparation & Serving (35 | 5.7%), Personal Care & Service (19 | 3.1%), Security & Protection (13 | 2.1%), Cleaning & Maintenance (13 | 2.1%), and Law Enforcement (8 | 1.3%).
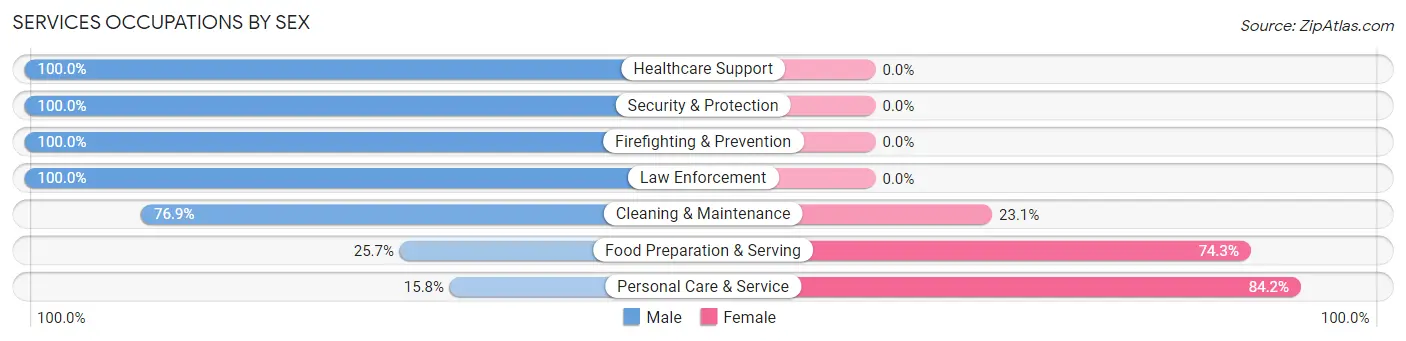
Services Occupations by Sex
Within the Services occupations in Grant Park, the most male-oriented occupations are Healthcare Support (100.0%), Security & Protection (100.0%), and Firefighting & Prevention (100.0%), while the most female-oriented occupations are Personal Care & Service (84.2%), Food Preparation & Serving (74.3%), and Cleaning & Maintenance (23.1%).
| Occupation | Male | Female |
| Healthcare Support | 6 (100.0%) | 0 (0.0%) |
| Security & Protection | 13 (100.0%) | 0 (0.0%) |
| Firefighting & Prevention | 5 (100.0%) | 0 (0.0%) |
| Law Enforcement | 8 (100.0%) | 0 (0.0%) |
| Food Preparation & Serving | 9 (25.7%) | 26 (74.3%) |
| Cleaning & Maintenance | 10 (76.9%) | 3 (23.1%) |
| Personal Care & Service | 3 (15.8%) | 16 (84.2%) |
| Total (Category) | 41 (47.7%) | 45 (52.3%) |
| Total (Overall) | 324 (52.9%) | 288 (47.1%) |
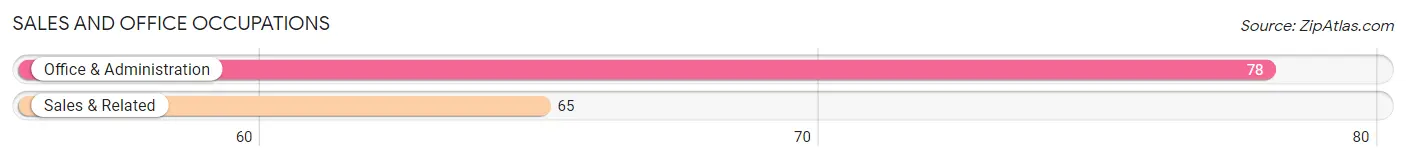
Sales and Office Occupations
The most common Sales and Office occupations in Grant Park are Office & Administration (78 | 12.8%), and Sales & Related (65 | 10.6%).
Sales and Office Occupations by Sex
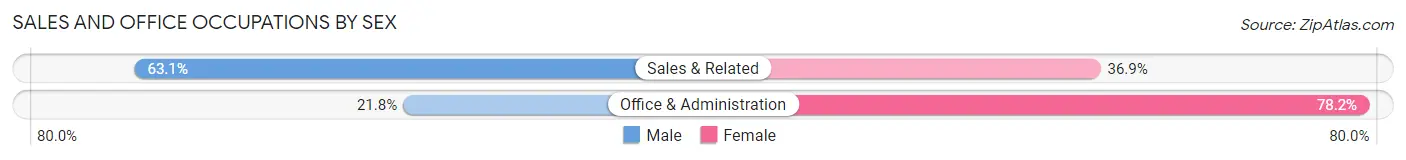
| Occupation | Male | Female |
| Sales & Related | 41 (63.1%) | 24 (36.9%) |
| Office & Administration | 17 (21.8%) | 61 (78.2%) |
| Total (Category) | 58 (40.6%) | 85 (59.4%) |
| Total (Overall) | 324 (52.9%) | 288 (47.1%) |
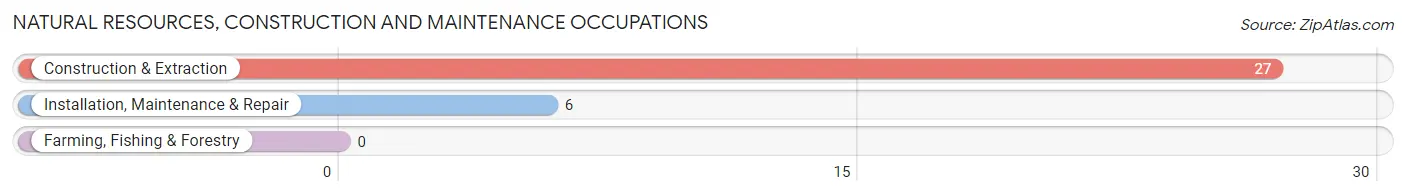
Natural Resources, Construction and Maintenance Occupations
The most common Natural Resources, Construction and Maintenance occupations in Grant Park are Construction & Extraction (27 | 4.4%), and Installation, Maintenance & Repair (6 | 1.0%).
Natural Resources, Construction and Maintenance Occupations by Sex
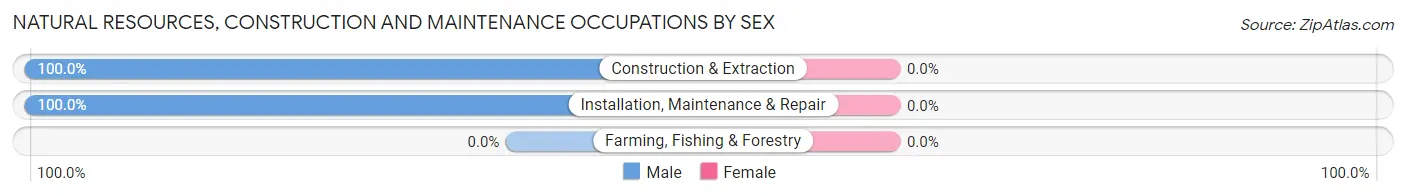
| Occupation | Male | Female |
| Farming, Fishing & Forestry | 0 (0.0%) | 0 (0.0%) |
| Construction & Extraction | 27 (100.0%) | 0 (0.0%) |
| Installation, Maintenance & Repair | 6 (100.0%) | 0 (0.0%) |
| Total (Category) | 33 (100.0%) | 0 (0.0%) |
| Total (Overall) | 324 (52.9%) | 288 (47.1%) |
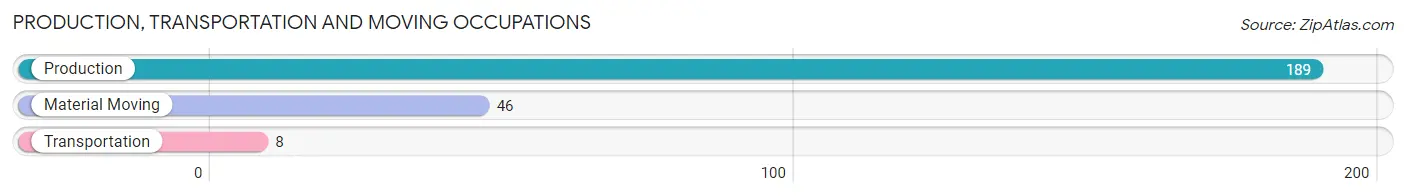
Production, Transportation and Moving Occupations
The most common Production, Transportation and Moving occupations in Grant Park are Production (189 | 30.9%), Material Moving (46 | 7.5%), and Transportation (8 | 1.3%).
Production, Transportation and Moving Occupations by Sex
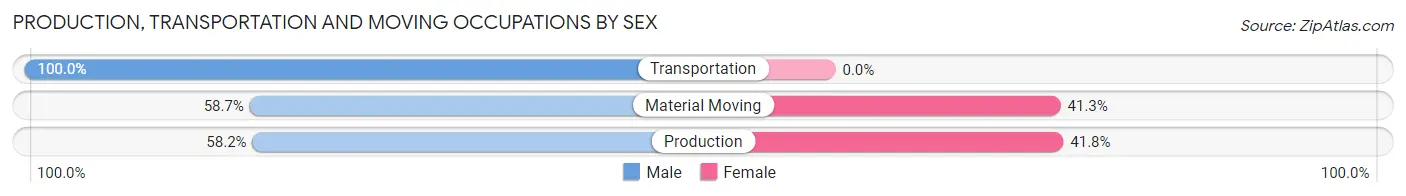
| Occupation | Male | Female |
| Production | 110 (58.2%) | 79 (41.8%) |
| Transportation | 8 (100.0%) | 0 (0.0%) |
| Material Moving | 27 (58.7%) | 19 (41.3%) |
| Total (Category) | 145 (59.7%) | 98 (40.3%) |
| Total (Overall) | 324 (52.9%) | 288 (47.1%) |
Employment Industries by Sex in Grant Park
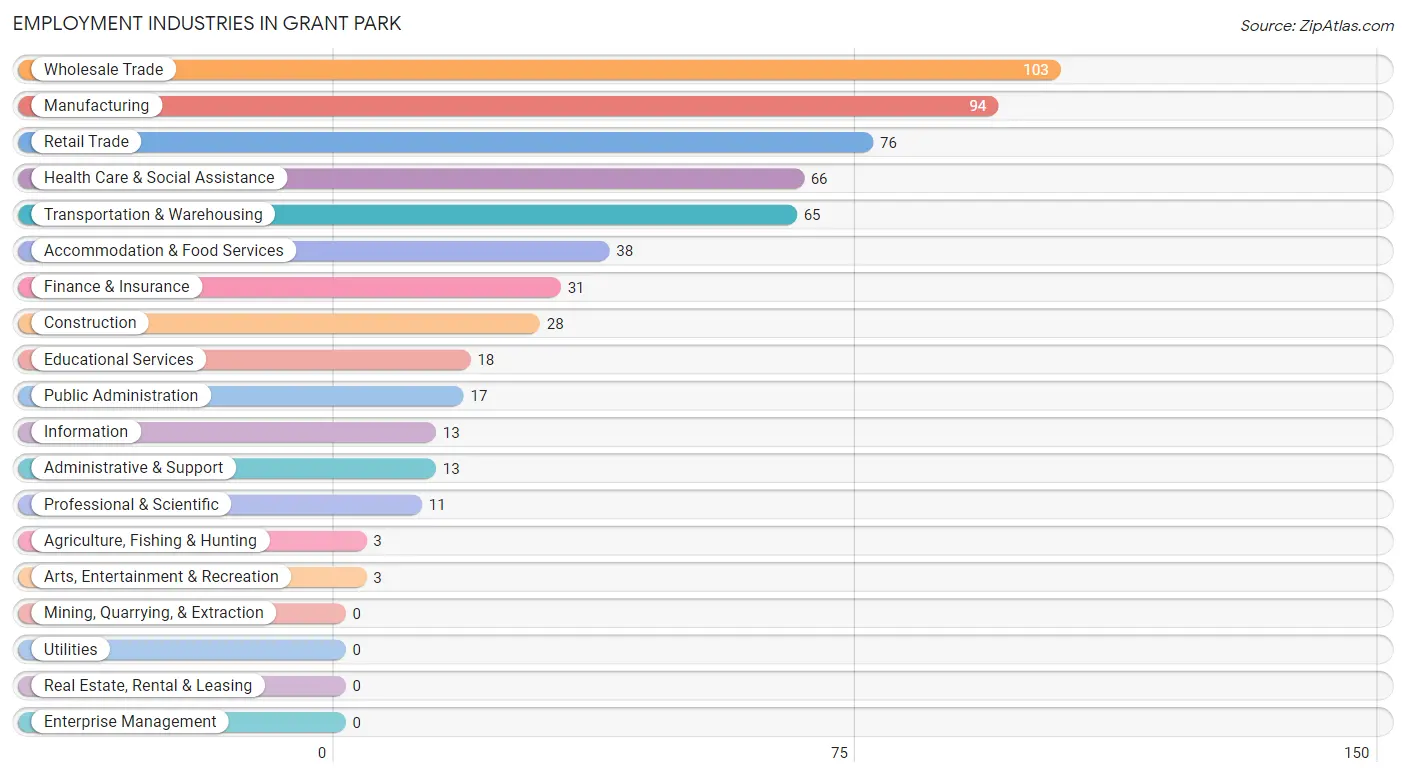
Employment Industries in Grant Park
The major employment industries in Grant Park include Wholesale Trade (103 | 16.8%), Manufacturing (94 | 15.4%), Retail Trade (76 | 12.4%), Health Care & Social Assistance (66 | 10.8%), and Transportation & Warehousing (65 | 10.6%).
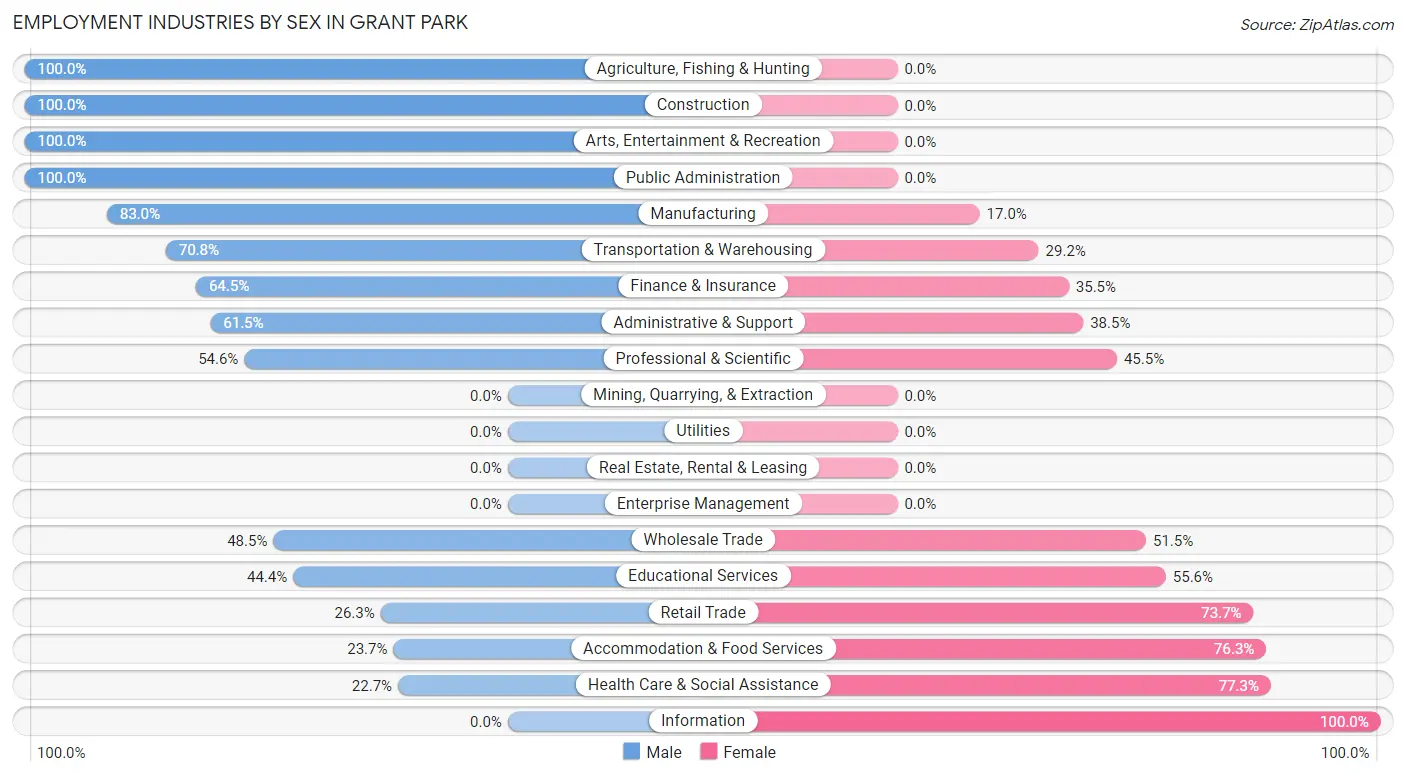
Employment Industries by Sex in Grant Park
The Grant Park industries that see more men than women are Agriculture, Fishing & Hunting (100.0%), Construction (100.0%), and Arts, Entertainment & Recreation (100.0%), whereas the industries that tend to have a higher number of women are Information (100.0%), Health Care & Social Assistance (77.3%), and Accommodation & Food Services (76.3%).
| Industry | Male | Female |
| Agriculture, Fishing & Hunting | 3 (100.0%) | 0 (0.0%) |
| Mining, Quarrying, & Extraction | 0 (0.0%) | 0 (0.0%) |
| Construction | 28 (100.0%) | 0 (0.0%) |
| Manufacturing | 78 (83.0%) | 16 (17.0%) |
| Wholesale Trade | 50 (48.5%) | 53 (51.5%) |
| Retail Trade | 20 (26.3%) | 56 (73.7%) |
| Transportation & Warehousing | 46 (70.8%) | 19 (29.2%) |
| Utilities | 0 (0.0%) | 0 (0.0%) |
| Information | 0 (0.0%) | 13 (100.0%) |
| Finance & Insurance | 20 (64.5%) | 11 (35.5%) |
| Real Estate, Rental & Leasing | 0 (0.0%) | 0 (0.0%) |
| Professional & Scientific | 6 (54.5%) | 5 (45.5%) |
| Enterprise Management | 0 (0.0%) | 0 (0.0%) |
| Administrative & Support | 8 (61.5%) | 5 (38.5%) |
| Educational Services | 8 (44.4%) | 10 (55.6%) |
| Health Care & Social Assistance | 15 (22.7%) | 51 (77.3%) |
| Arts, Entertainment & Recreation | 3 (100.0%) | 0 (0.0%) |
| Accommodation & Food Services | 9 (23.7%) | 29 (76.3%) |
| Public Administration | 17 (100.0%) | 0 (0.0%) |
| Total | 324 (52.9%) | 288 (47.1%) |
Education in Grant Park
School Enrollment in Grant Park
The most common levels of schooling among the 341 students in Grant Park are high school (127 | 37.2%), middle school (124 | 36.4%), and elementary school (39 | 11.4%).
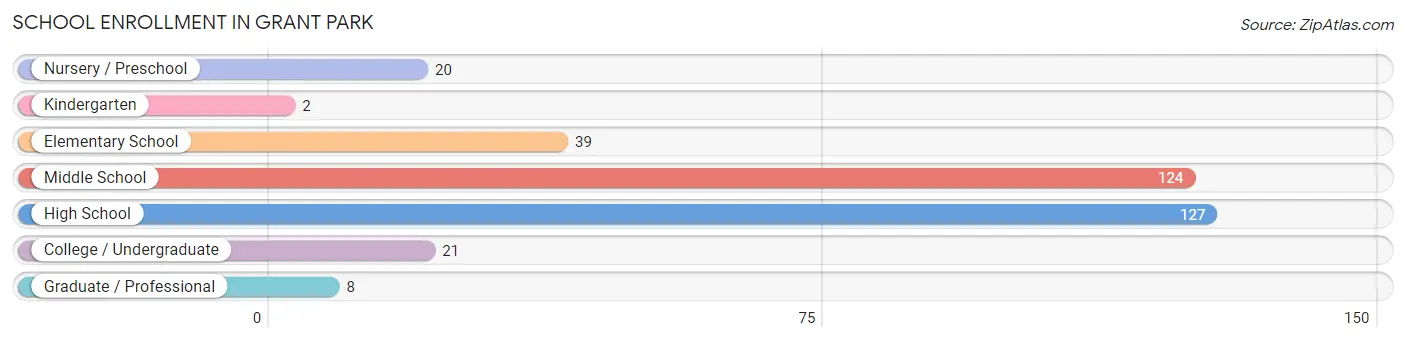
| School Level | # Students | % Students |
| Nursery / Preschool | 20 | 5.9% |
| Kindergarten | 2 | 0.6% |
| Elementary School | 39 | 11.4% |
| Middle School | 124 | 36.4% |
| High School | 127 | 37.2% |
| College / Undergraduate | 21 | 6.2% |
| Graduate / Professional | 8 | 2.4% |
| Total | 341 | 100.0% |
School Enrollment by Age by Funding Source in Grant Park
Out of a total of 341 students who are enrolled in schools in Grant Park, 39 (11.4%) attend a private institution, while the remaining 302 (88.6%) are enrolled in public schools. The age group of 20 to 24 year olds has the highest likelihood of being enrolled in private schools, with 4 (28.6% in the age bracket) enrolled. Conversely, the age group of 18 to 19 year olds has the lowest likelihood of being enrolled in a private school, with 12 (100.0% in the age bracket) attending a public institution.
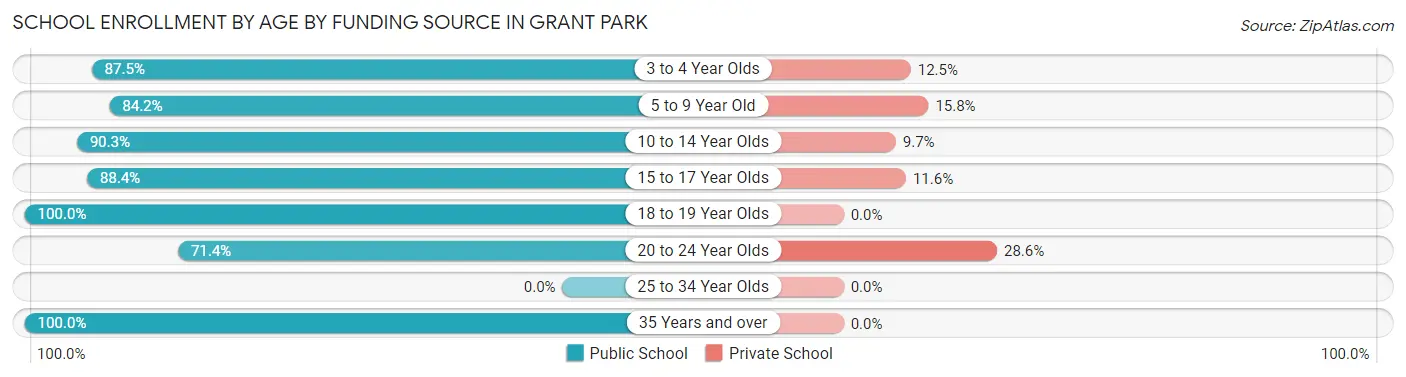
| Age Bracket | Public School | Private School |
| 3 to 4 Year Olds | 14 (87.5%) | 2 (12.5%) |
| 5 to 9 Year Old | 32 (84.2%) | 6 (15.8%) |
| 10 to 14 Year Olds | 130 (90.3%) | 14 (9.7%) |
| 15 to 17 Year Olds | 99 (88.4%) | 13 (11.6%) |
| 18 to 19 Year Olds | 12 (100.0%) | 0 (0.0%) |
| 20 to 24 Year Olds | 10 (71.4%) | 4 (28.6%) |
| 25 to 34 Year Olds | 0 (0.0%) | 0 (0.0%) |
| 35 Years and over | 5 (100.0%) | 0 (0.0%) |
| Total | 302 (88.6%) | 39 (11.4%) |
Educational Attainment by Field of Study in Grant Park
Business (31 | 24.6%), education (17 | 13.5%), science & technology (16 | 12.7%), bio, nature & agricultural (15 | 11.9%), and engineering (10 | 7.9%) are the most common fields of study among 126 individuals in Grant Park who have obtained a bachelor's degree or higher.
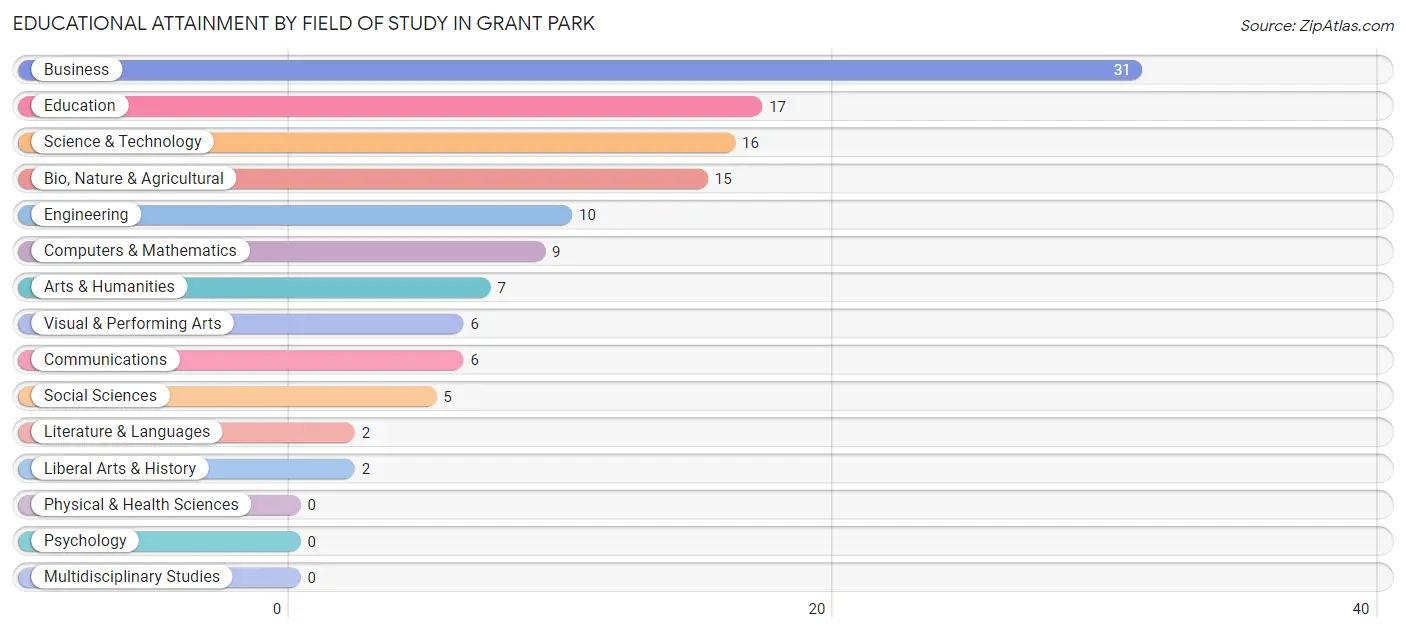
| Field of Study | # Graduates | % Graduates |
| Computers & Mathematics | 9 | 7.1% |
| Bio, Nature & Agricultural | 15 | 11.9% |
| Physical & Health Sciences | 0 | 0.0% |
| Psychology | 0 | 0.0% |
| Social Sciences | 5 | 4.0% |
| Engineering | 10 | 7.9% |
| Multidisciplinary Studies | 0 | 0.0% |
| Science & Technology | 16 | 12.7% |
| Business | 31 | 24.6% |
| Education | 17 | 13.5% |
| Literature & Languages | 2 | 1.6% |
| Liberal Arts & History | 2 | 1.6% |
| Visual & Performing Arts | 6 | 4.8% |
| Communications | 6 | 4.8% |
| Arts & Humanities | 7 | 5.6% |
| Total | 126 | 100.0% |
Transportation & Commute in Grant Park
Vehicle Availability by Sex in Grant Park
The most prevalent vehicle ownership categories in Grant Park are males with 3 vehicles (135, accounting for 42.3%) and females with 3 vehicles (107, making up 49.4%).
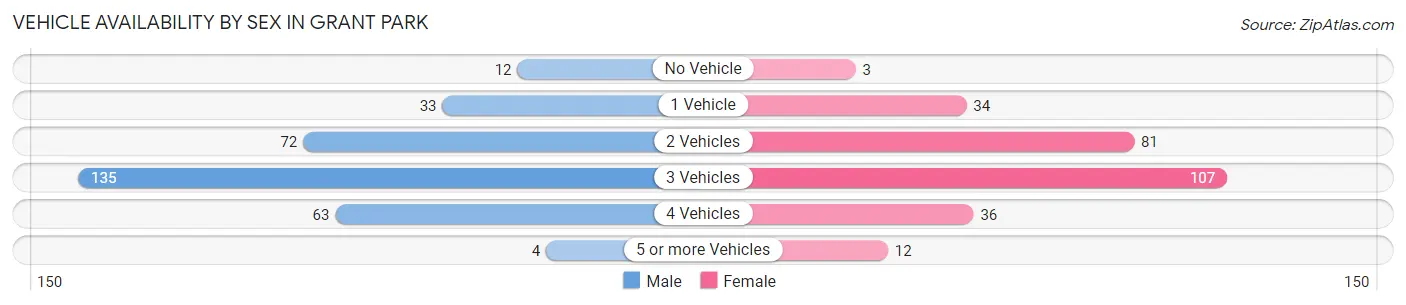
| Vehicles Available | Male | Female |
| No Vehicle | 12 (3.8%) | 3 (1.1%) |
| 1 Vehicle | 33 (10.3%) | 34 (12.4%) |
| 2 Vehicles | 72 (22.6%) | 81 (29.7%) |
| 3 Vehicles | 135 (42.3%) | 107 (39.2%) |
| 4 Vehicles | 63 (19.8%) | 36 (13.2%) |
| 5 or more Vehicles | 4 (1.3%) | 12 (4.4%) |
| Total | 319 (100.0%) | 273 (100.0%) |
Commute Time in Grant Park
The most frequently occuring commute durations in Grant Park are 30 to 34 minutes (157 commuters, 27.8%), 25 to 29 minutes (100 commuters, 17.7%), and 45 to 59 minutes (61 commuters, 10.8%).
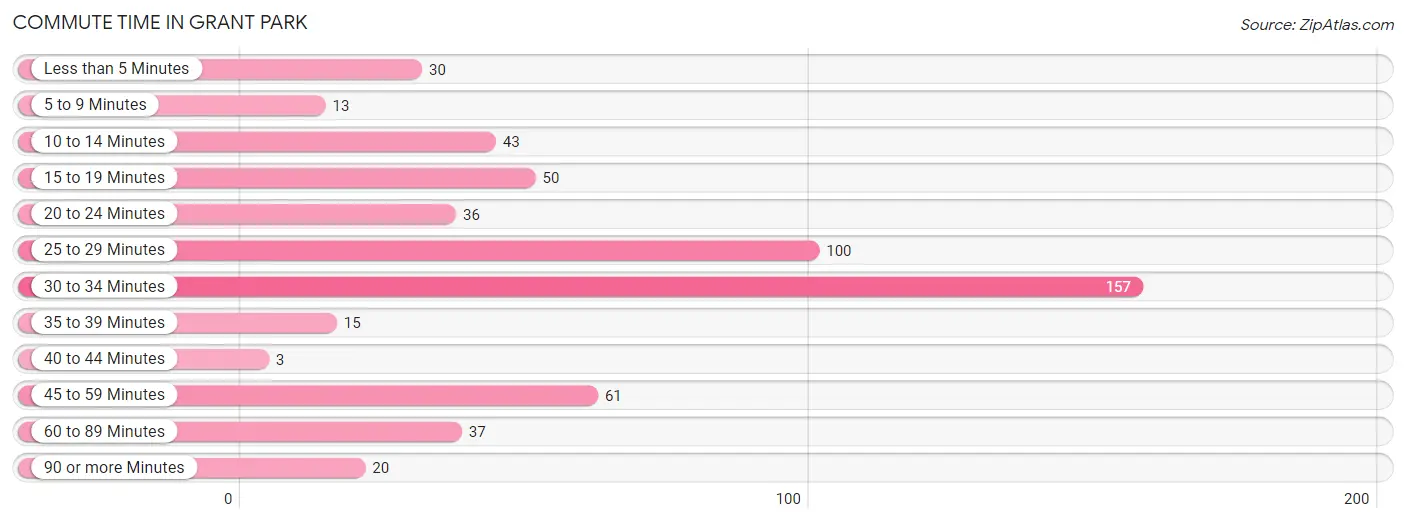
| Commute Time | # Commuters | % Commuters |
| Less than 5 Minutes | 30 | 5.3% |
| 5 to 9 Minutes | 13 | 2.3% |
| 10 to 14 Minutes | 43 | 7.6% |
| 15 to 19 Minutes | 50 | 8.8% |
| 20 to 24 Minutes | 36 | 6.4% |
| 25 to 29 Minutes | 100 | 17.7% |
| 30 to 34 Minutes | 157 | 27.8% |
| 35 to 39 Minutes | 15 | 2.6% |
| 40 to 44 Minutes | 3 | 0.5% |
| 45 to 59 Minutes | 61 | 10.8% |
| 60 to 89 Minutes | 37 | 6.6% |
| 90 or more Minutes | 20 | 3.5% |
Commute Time by Sex in Grant Park
The most common commute times in Grant Park are 30 to 34 minutes (97 commuters, 30.6%) for males and 30 to 34 minutes (60 commuters, 24.2%) for females.
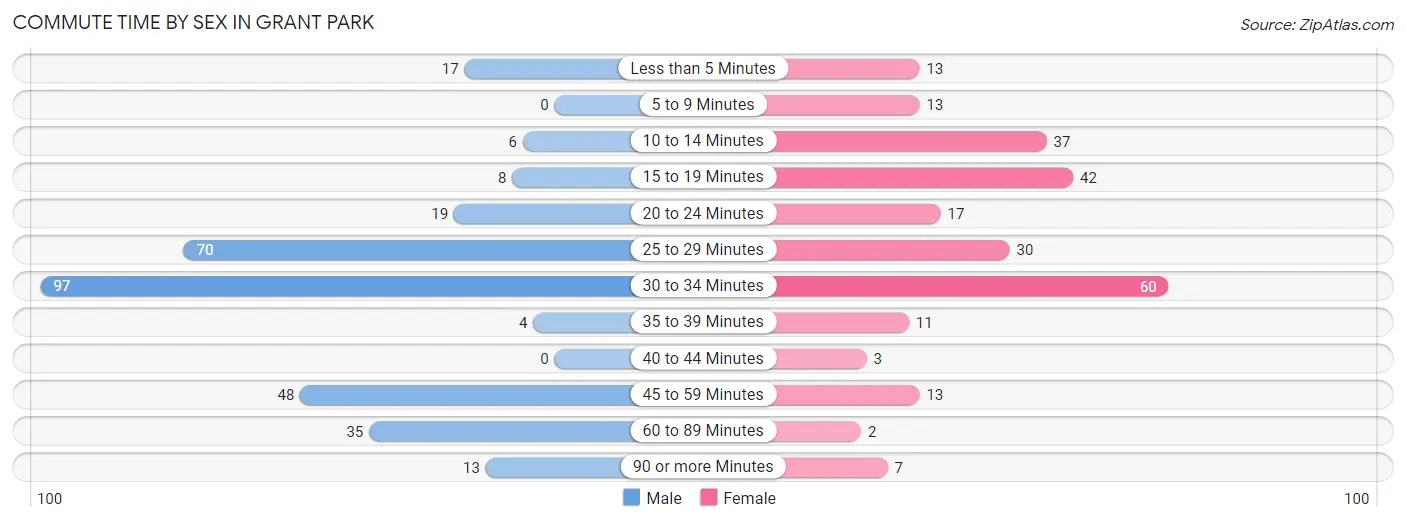
| Commute Time | Male | Female |
| Less than 5 Minutes | 17 (5.4%) | 13 (5.2%) |
| 5 to 9 Minutes | 0 (0.0%) | 13 (5.2%) |
| 10 to 14 Minutes | 6 (1.9%) | 37 (14.9%) |
| 15 to 19 Minutes | 8 (2.5%) | 42 (16.9%) |
| 20 to 24 Minutes | 19 (6.0%) | 17 (6.9%) |
| 25 to 29 Minutes | 70 (22.1%) | 30 (12.1%) |
| 30 to 34 Minutes | 97 (30.6%) | 60 (24.2%) |
| 35 to 39 Minutes | 4 (1.3%) | 11 (4.4%) |
| 40 to 44 Minutes | 0 (0.0%) | 3 (1.2%) |
| 45 to 59 Minutes | 48 (15.1%) | 13 (5.2%) |
| 60 to 89 Minutes | 35 (11.0%) | 2 (0.8%) |
| 90 or more Minutes | 13 (4.1%) | 7 (2.8%) |
Time of Departure to Work by Sex in Grant Park
The most frequent times of departure to work in Grant Park are 12:00 AM to 4:59 AM (64, 20.2%) for males and 8:30 AM to 8:59 AM (51, 20.6%) for females.
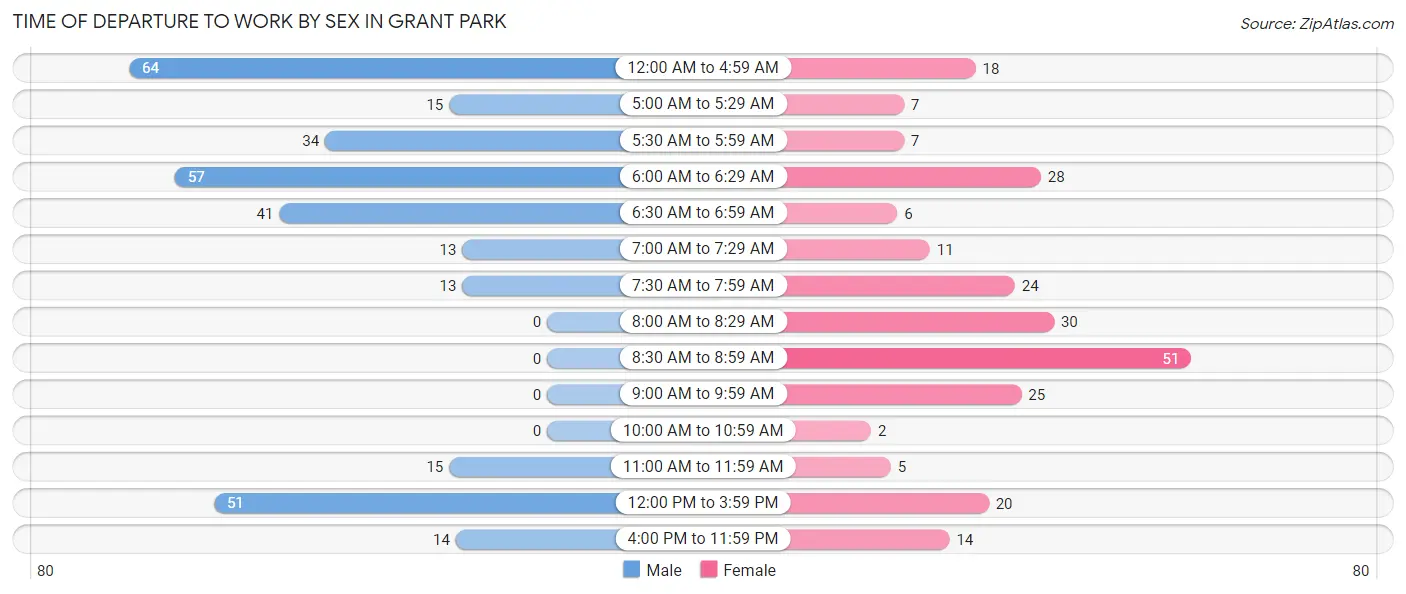
| Time of Departure | Male | Female |
| 12:00 AM to 4:59 AM | 64 (20.2%) | 18 (7.3%) |
| 5:00 AM to 5:29 AM | 15 (4.7%) | 7 (2.8%) |
| 5:30 AM to 5:59 AM | 34 (10.7%) | 7 (2.8%) |
| 6:00 AM to 6:29 AM | 57 (18.0%) | 28 (11.3%) |
| 6:30 AM to 6:59 AM | 41 (12.9%) | 6 (2.4%) |
| 7:00 AM to 7:29 AM | 13 (4.1%) | 11 (4.4%) |
| 7:30 AM to 7:59 AM | 13 (4.1%) | 24 (9.7%) |
| 8:00 AM to 8:29 AM | 0 (0.0%) | 30 (12.1%) |
| 8:30 AM to 8:59 AM | 0 (0.0%) | 51 (20.6%) |
| 9:00 AM to 9:59 AM | 0 (0.0%) | 25 (10.1%) |
| 10:00 AM to 10:59 AM | 0 (0.0%) | 2 (0.8%) |
| 11:00 AM to 11:59 AM | 15 (4.7%) | 5 (2.0%) |
| 12:00 PM to 3:59 PM | 51 (16.1%) | 20 (8.1%) |
| 4:00 PM to 11:59 PM | 14 (4.4%) | 14 (5.7%) |
| Total | 317 (100.0%) | 248 (100.0%) |
Housing Occupancy in Grant Park
Occupancy by Ownership in Grant Park
Of the total 489 dwellings in Grant Park, owner-occupied units account for 358 (73.2%), while renter-occupied units make up 131 (26.8%).
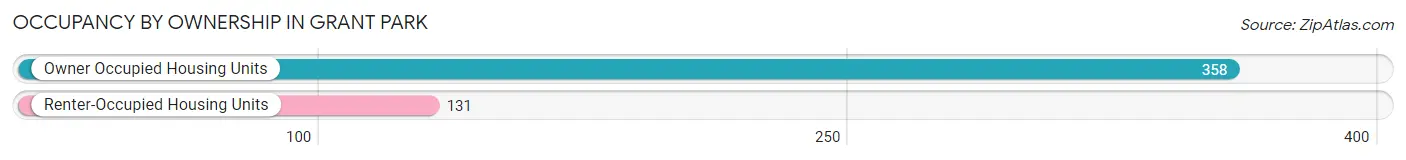
| Occupancy | # Housing Units | % Housing Units |
| Owner Occupied Housing Units | 358 | 73.2% |
| Renter-Occupied Housing Units | 131 | 26.8% |
| Total Occupied Housing Units | 489 | 100.0% |
Occupancy by Household Size in Grant Park
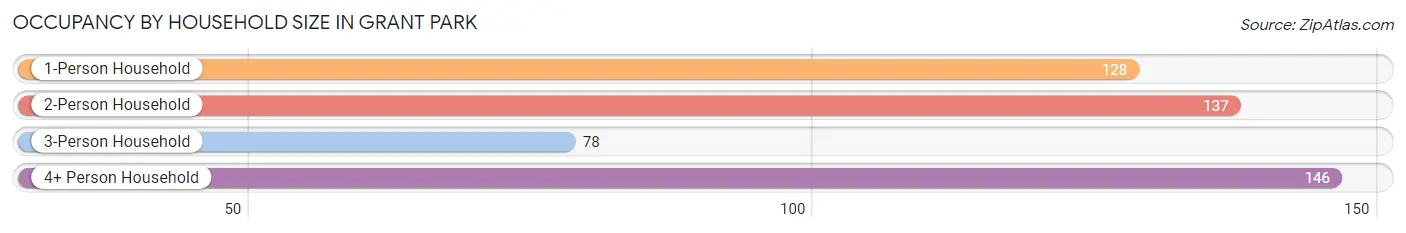
| Household Size | # Housing Units | % Housing Units |
| 1-Person Household | 128 | 26.2% |
| 2-Person Household | 137 | 28.0% |
| 3-Person Household | 78 | 16.0% |
| 4+ Person Household | 146 | 29.9% |
| Total Housing Units | 489 | 100.0% |
Occupancy by Ownership by Household Size in Grant Park
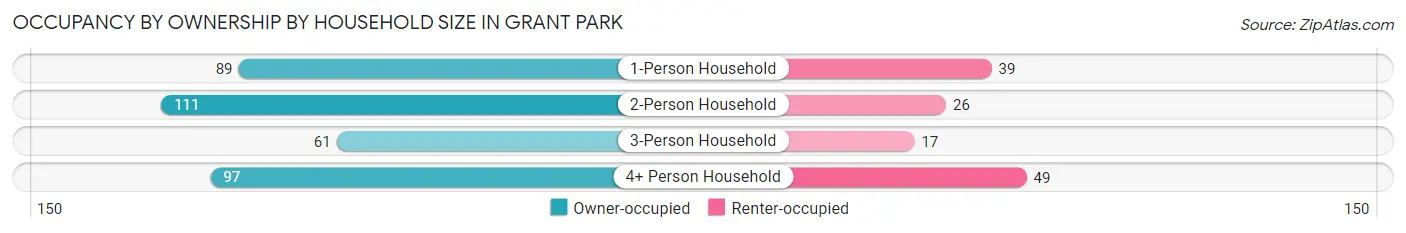
| Household Size | Owner-occupied | Renter-occupied |
| 1-Person Household | 89 (69.5%) | 39 (30.5%) |
| 2-Person Household | 111 (81.0%) | 26 (19.0%) |
| 3-Person Household | 61 (78.2%) | 17 (21.8%) |
| 4+ Person Household | 97 (66.4%) | 49 (33.6%) |
| Total Housing Units | 358 (73.2%) | 131 (26.8%) |
Occupancy by Educational Attainment in Grant Park
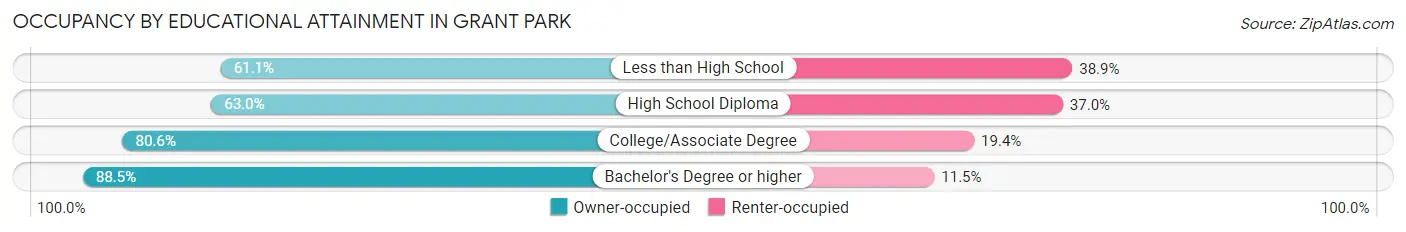
| Household Size | Owner-occupied | Renter-occupied |
| Less than High School | 11 (61.1%) | 7 (38.9%) |
| High School Diploma | 131 (63.0%) | 77 (37.0%) |
| College/Associate Degree | 170 (80.6%) | 41 (19.4%) |
| Bachelor's Degree or higher | 46 (88.5%) | 6 (11.5%) |
Occupancy by Age of Householder in Grant Park
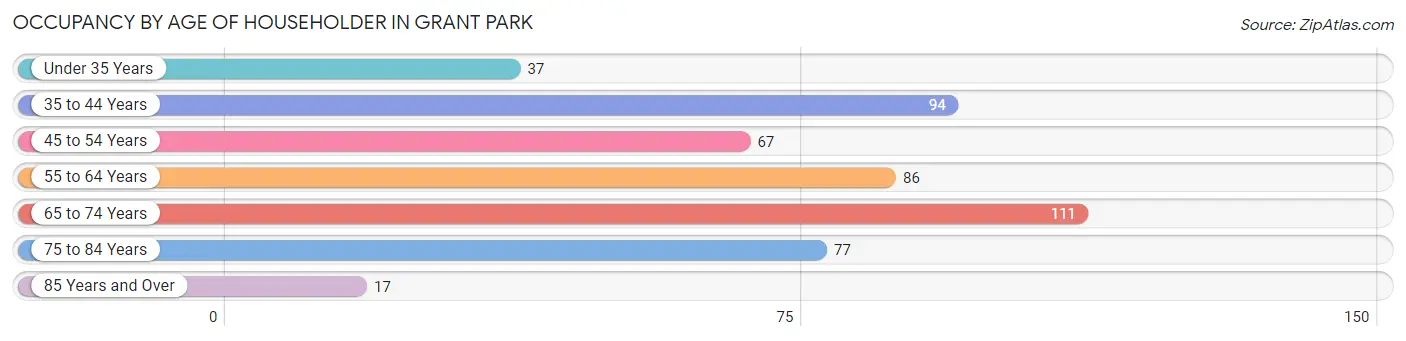
| Age Bracket | # Households | % Households |
| Under 35 Years | 37 | 7.6% |
| 35 to 44 Years | 94 | 19.2% |
| 45 to 54 Years | 67 | 13.7% |
| 55 to 64 Years | 86 | 17.6% |
| 65 to 74 Years | 111 | 22.7% |
| 75 to 84 Years | 77 | 15.8% |
| 85 Years and Over | 17 | 3.5% |
| Total | 489 | 100.0% |
Housing Finances in Grant Park
Median Income by Occupancy in Grant Park
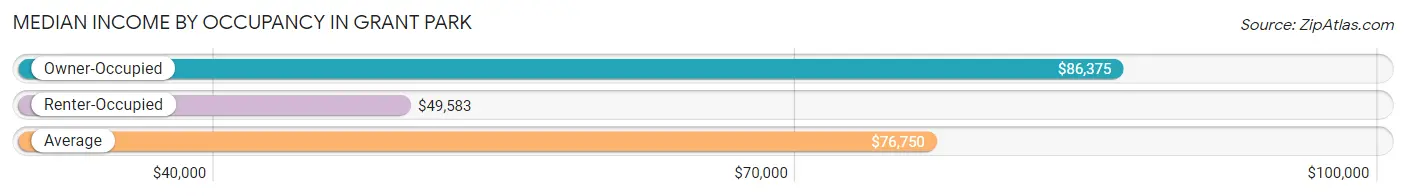
| Occupancy Type | # Households | Median Income |
| Owner-Occupied | 358 (73.2%) | $86,375 |
| Renter-Occupied | 131 (26.8%) | $49,583 |
| Average | 489 (100.0%) | $76,750 |
Occupancy by Householder Income Bracket in Grant Park
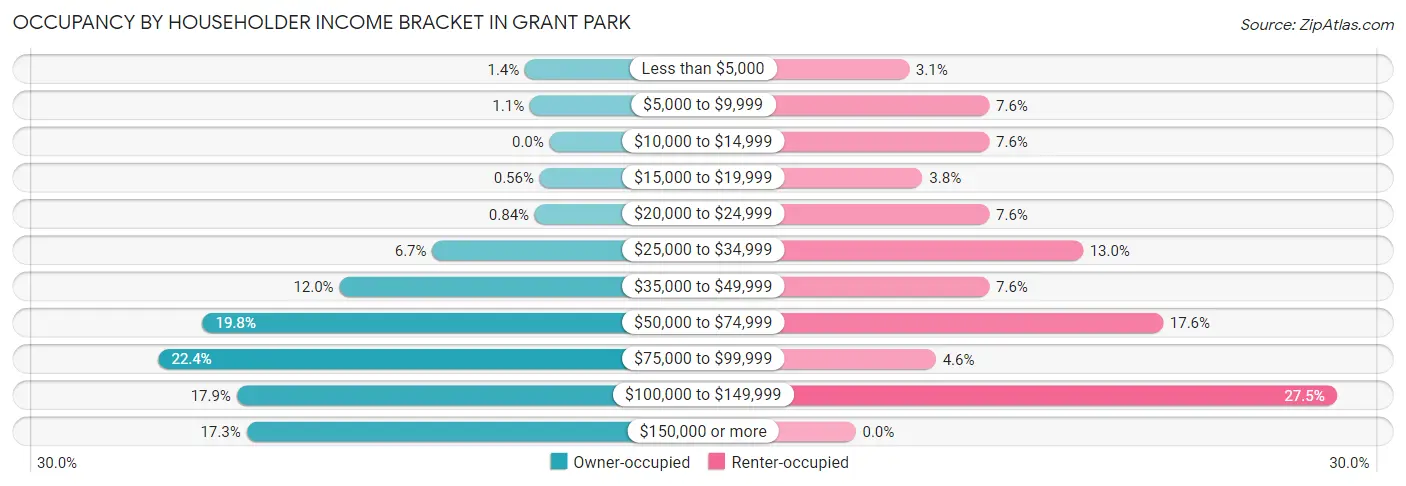
| Income Bracket | Owner-occupied | Renter-occupied |
| Less than $5,000 | 5 (1.4%) | 4 (3.0%) |
| $5,000 to $9,999 | 4 (1.1%) | 10 (7.6%) |
| $10,000 to $14,999 | 0 (0.0%) | 10 (7.6%) |
| $15,000 to $19,999 | 2 (0.6%) | 5 (3.8%) |
| $20,000 to $24,999 | 3 (0.8%) | 10 (7.6%) |
| $25,000 to $34,999 | 24 (6.7%) | 17 (13.0%) |
| $35,000 to $49,999 | 43 (12.0%) | 10 (7.6%) |
| $50,000 to $74,999 | 71 (19.8%) | 23 (17.6%) |
| $75,000 to $99,999 | 80 (22.4%) | 6 (4.6%) |
| $100,000 to $149,999 | 64 (17.9%) | 36 (27.5%) |
| $150,000 or more | 62 (17.3%) | 0 (0.0%) |
| Total | 358 (100.0%) | 131 (100.0%) |
Monthly Housing Cost Tiers in Grant Park
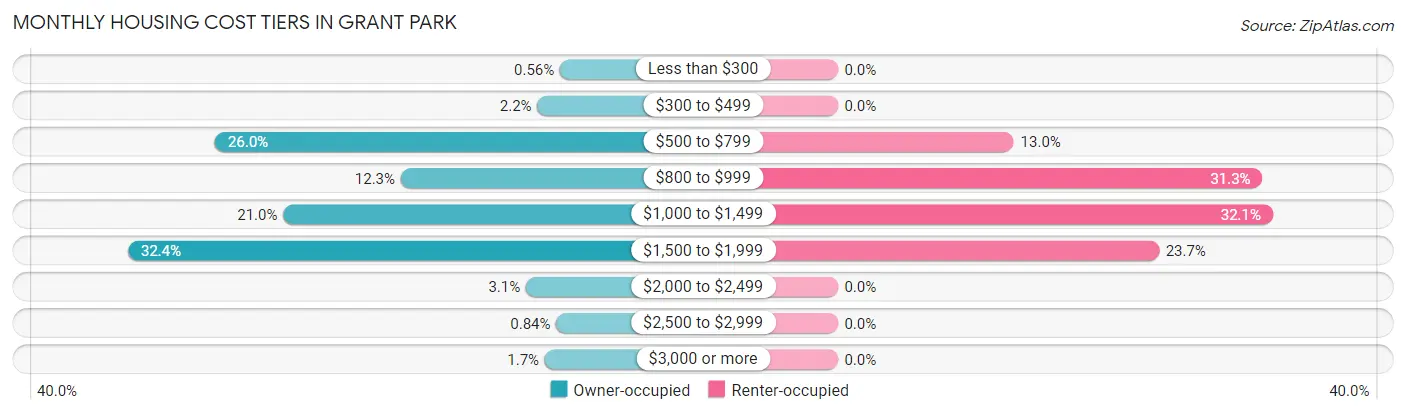
| Monthly Cost | Owner-occupied | Renter-occupied |
| Less than $300 | 2 (0.6%) | 0 (0.0%) |
| $300 to $499 | 8 (2.2%) | 0 (0.0%) |
| $500 to $799 | 93 (26.0%) | 17 (13.0%) |
| $800 to $999 | 44 (12.3%) | 41 (31.3%) |
| $1,000 to $1,499 | 75 (20.9%) | 42 (32.1%) |
| $1,500 to $1,999 | 116 (32.4%) | 31 (23.7%) |
| $2,000 to $2,499 | 11 (3.1%) | 0 (0.0%) |
| $2,500 to $2,999 | 3 (0.8%) | 0 (0.0%) |
| $3,000 or more | 6 (1.7%) | 0 (0.0%) |
| Total | 358 (100.0%) | 131 (100.0%) |
Physical Housing Characteristics in Grant Park
Housing Structures in Grant Park
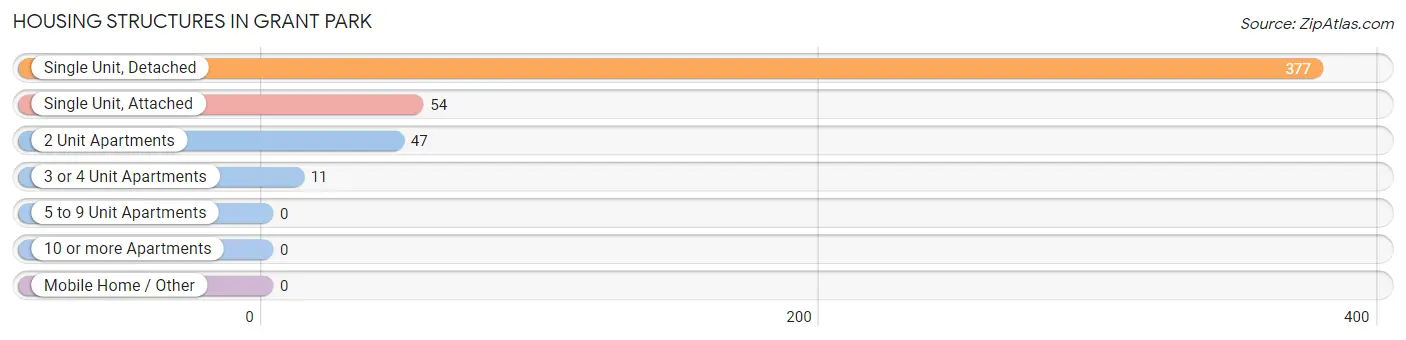
| Structure Type | # Housing Units | % Housing Units |
| Single Unit, Detached | 377 | 77.1% |
| Single Unit, Attached | 54 | 11.0% |
| 2 Unit Apartments | 47 | 9.6% |
| 3 or 4 Unit Apartments | 11 | 2.2% |
| 5 to 9 Unit Apartments | 0 | 0.0% |
| 10 or more Apartments | 0 | 0.0% |
| Mobile Home / Other | 0 | 0.0% |
| Total | 489 | 100.0% |
Housing Structures by Occupancy in Grant Park
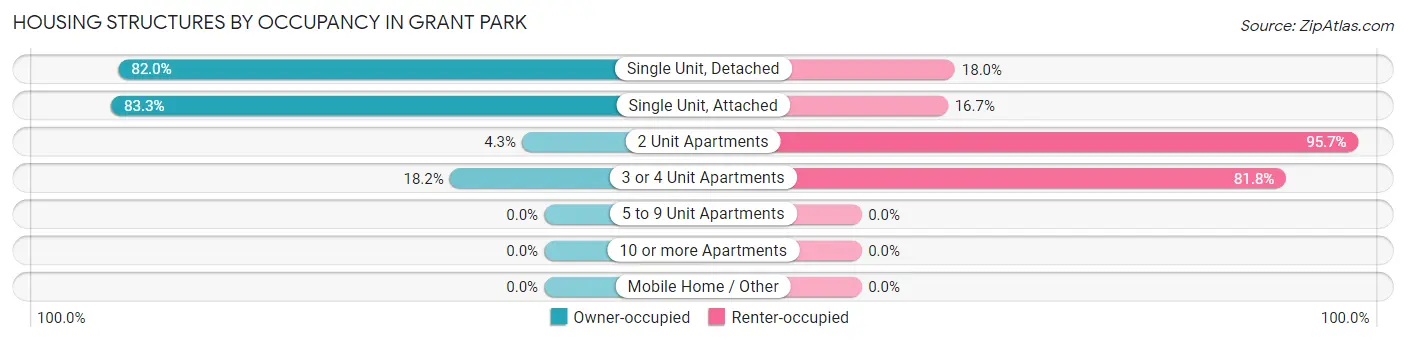
| Structure Type | Owner-occupied | Renter-occupied |
| Single Unit, Detached | 309 (82.0%) | 68 (18.0%) |
| Single Unit, Attached | 45 (83.3%) | 9 (16.7%) |
| 2 Unit Apartments | 2 (4.3%) | 45 (95.7%) |
| 3 or 4 Unit Apartments | 2 (18.2%) | 9 (81.8%) |
| 5 to 9 Unit Apartments | 0 (0.0%) | 0 (0.0%) |
| 10 or more Apartments | 0 (0.0%) | 0 (0.0%) |
| Mobile Home / Other | 0 (0.0%) | 0 (0.0%) |
| Total | 358 (73.2%) | 131 (26.8%) |
Housing Structures by Number of Rooms in Grant Park
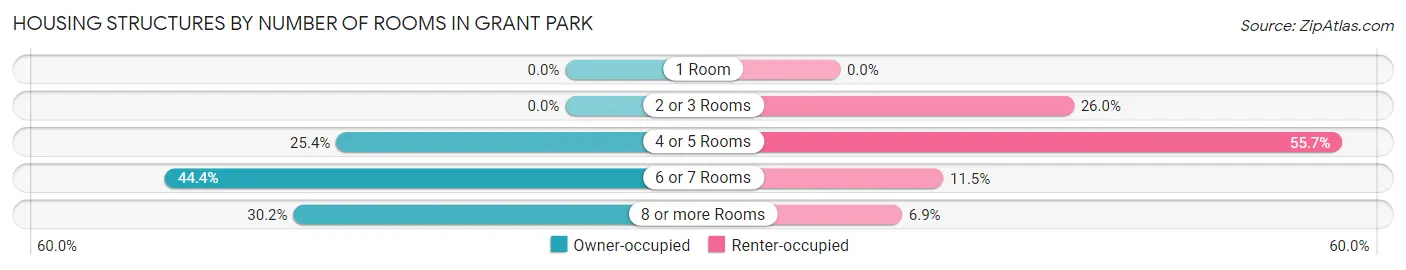
| Number of Rooms | Owner-occupied | Renter-occupied |
| 1 Room | 0 (0.0%) | 0 (0.0%) |
| 2 or 3 Rooms | 0 (0.0%) | 34 (26.0%) |
| 4 or 5 Rooms | 91 (25.4%) | 73 (55.7%) |
| 6 or 7 Rooms | 159 (44.4%) | 15 (11.5%) |
| 8 or more Rooms | 108 (30.2%) | 9 (6.9%) |
| Total | 358 (100.0%) | 131 (100.0%) |
Housing Structure by Heating Type in Grant Park
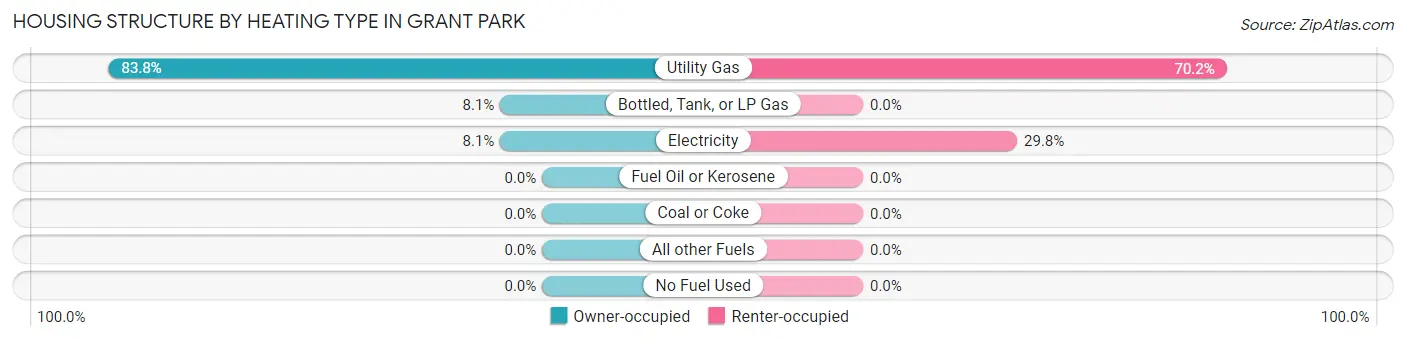
| Heating Type | Owner-occupied | Renter-occupied |
| Utility Gas | 300 (83.8%) | 92 (70.2%) |
| Bottled, Tank, or LP Gas | 29 (8.1%) | 0 (0.0%) |
| Electricity | 29 (8.1%) | 39 (29.8%) |
| Fuel Oil or Kerosene | 0 (0.0%) | 0 (0.0%) |
| Coal or Coke | 0 (0.0%) | 0 (0.0%) |
| All other Fuels | 0 (0.0%) | 0 (0.0%) |
| No Fuel Used | 0 (0.0%) | 0 (0.0%) |
| Total | 358 (100.0%) | 131 (100.0%) |
Household Vehicle Usage in Grant Park
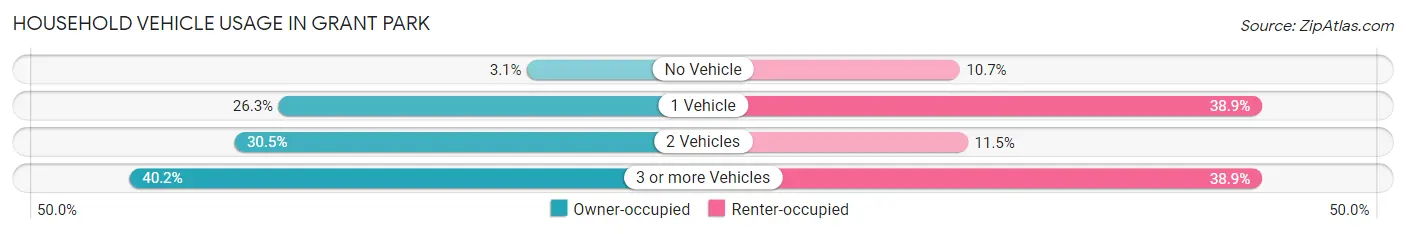
| Vehicles per Household | Owner-occupied | Renter-occupied |
| No Vehicle | 11 (3.1%) | 14 (10.7%) |
| 1 Vehicle | 94 (26.3%) | 51 (38.9%) |
| 2 Vehicles | 109 (30.4%) | 15 (11.5%) |
| 3 or more Vehicles | 144 (40.2%) | 51 (38.9%) |
| Total | 358 (100.0%) | 131 (100.0%) |
Real Estate & Mortgages in Grant Park
Real Estate and Mortgage Overview in Grant Park
| Characteristic | Without Mortgage | With Mortgage |
| Housing Units | 138 | 220 |
| Median Property Value | $175,800 | $187,500 |
| Median Household Income | $59,286 | $48 |
| Monthly Housing Costs | $687 | $6 |
| Real Estate Taxes | $4,314 | $0 |
Property Value by Mortgage Status in Grant Park
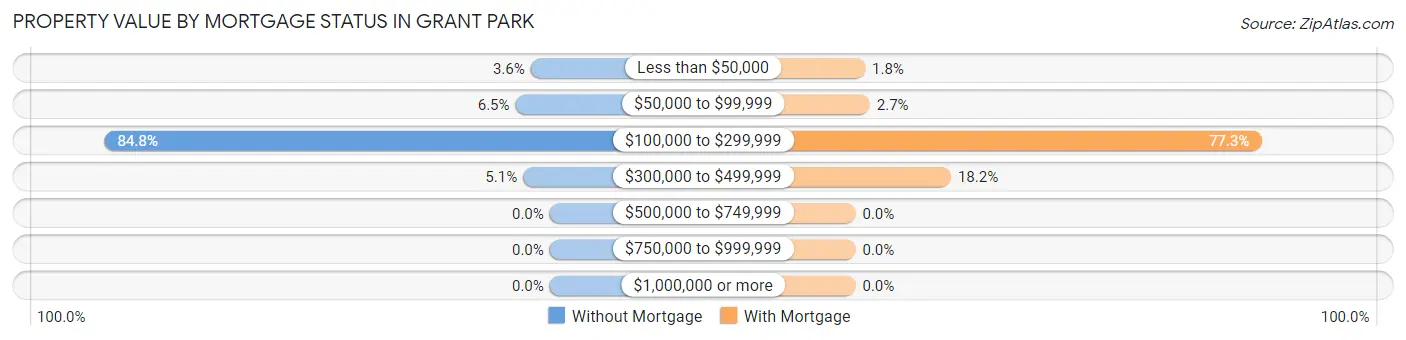
| Property Value | Without Mortgage | With Mortgage |
| Less than $50,000 | 5 (3.6%) | 4 (1.8%) |
| $50,000 to $99,999 | 9 (6.5%) | 6 (2.7%) |
| $100,000 to $299,999 | 117 (84.8%) | 170 (77.3%) |
| $300,000 to $499,999 | 7 (5.1%) | 40 (18.2%) |
| $500,000 to $749,999 | 0 (0.0%) | 0 (0.0%) |
| $750,000 to $999,999 | 0 (0.0%) | 0 (0.0%) |
| $1,000,000 or more | 0 (0.0%) | 0 (0.0%) |
| Total | 138 (100.0%) | 220 (100.0%) |
Household Income by Mortgage Status in Grant Park
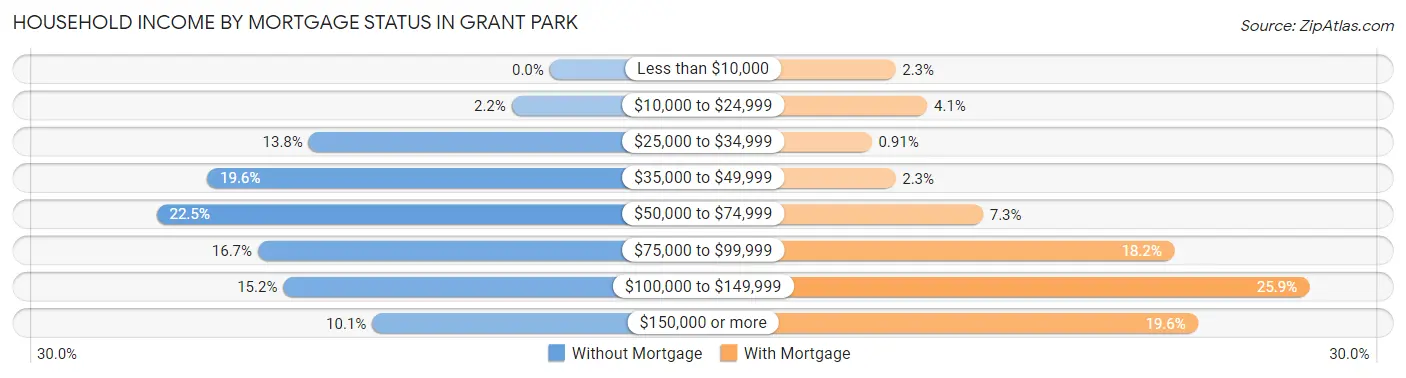
| Household Income | Without Mortgage | With Mortgage |
| Less than $10,000 | 0 (0.0%) | 5 (2.3%) |
| $10,000 to $24,999 | 3 (2.2%) | 9 (4.1%) |
| $25,000 to $34,999 | 19 (13.8%) | 2 (0.9%) |
| $35,000 to $49,999 | 27 (19.6%) | 5 (2.3%) |
| $50,000 to $74,999 | 31 (22.5%) | 16 (7.3%) |
| $75,000 to $99,999 | 23 (16.7%) | 40 (18.2%) |
| $100,000 to $149,999 | 21 (15.2%) | 57 (25.9%) |
| $150,000 or more | 14 (10.1%) | 43 (19.6%) |
| Total | 138 (100.0%) | 220 (100.0%) |
Property Value to Household Income Ratio in Grant Park
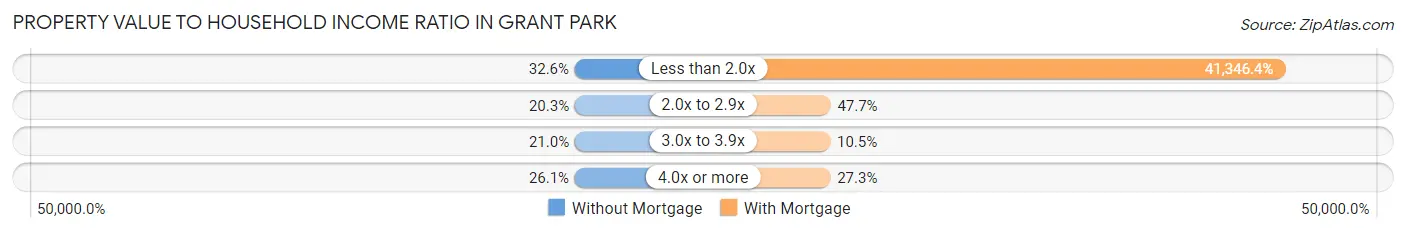
| Value-to-Income Ratio | Without Mortgage | With Mortgage |
| Less than 2.0x | 45 (32.6%) | 90,962 (41,346.4%) |
| 2.0x to 2.9x | 28 (20.3%) | 105 (47.7%) |
| 3.0x to 3.9x | 29 (21.0%) | 23 (10.4%) |
| 4.0x or more | 36 (26.1%) | 60 (27.3%) |
| Total | 138 (100.0%) | 220 (100.0%) |
Real Estate Taxes by Mortgage Status in Grant Park
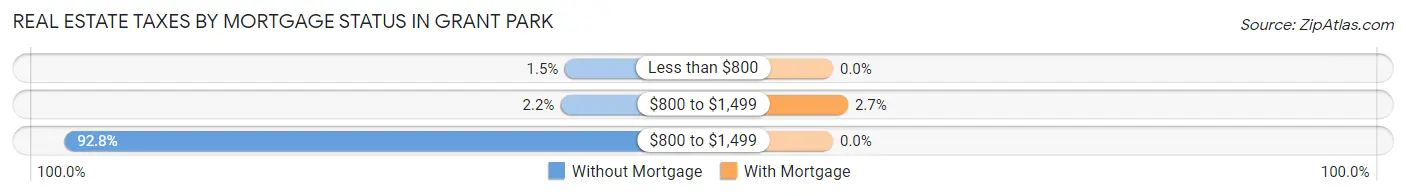
| Property Taxes | Without Mortgage | With Mortgage |
| Less than $800 | 2 (1.5%) | 0 (0.0%) |
| $800 to $1,499 | 3 (2.2%) | 6 (2.7%) |
| $800 to $1,499 | 128 (92.7%) | 0 (0.0%) |
| Total | 138 (100.0%) | 220 (100.0%) |
Health & Disability in Grant Park
Health Insurance Coverage by Age in Grant Park
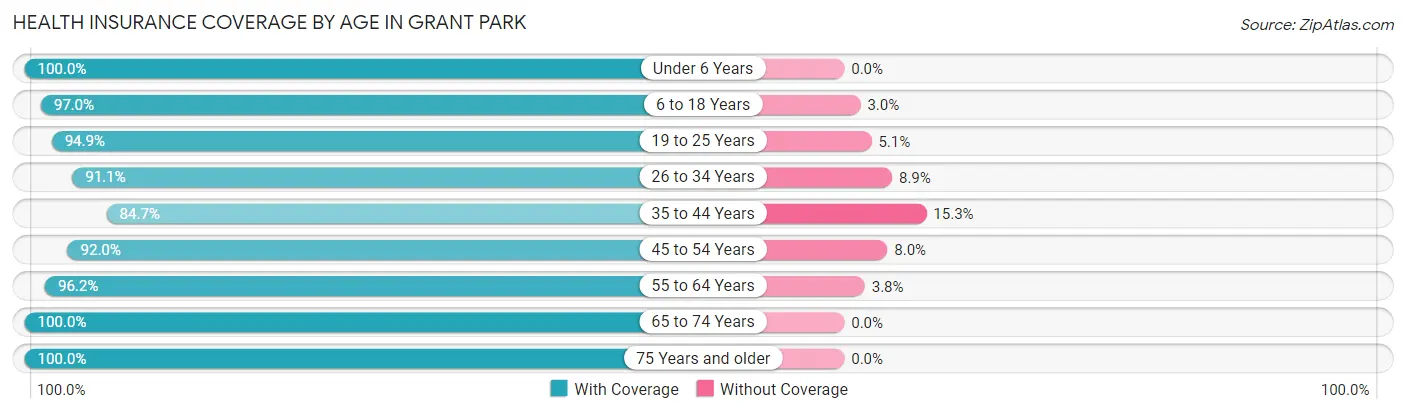
| Age Bracket | With Coverage | Without Coverage |
| Under 6 Years | 162 (100.0%) | 0 (0.0%) |
| 6 to 18 Years | 450 (97.0%) | 14 (3.0%) |
| 19 to 25 Years | 75 (94.9%) | 4 (5.1%) |
| 26 to 34 Years | 133 (91.1%) | 13 (8.9%) |
| 35 to 44 Years | 166 (84.7%) | 30 (15.3%) |
| 45 to 54 Years | 126 (92.0%) | 11 (8.0%) |
| 55 to 64 Years | 151 (96.2%) | 6 (3.8%) |
| 65 to 74 Years | 176 (100.0%) | 0 (0.0%) |
| 75 Years and older | 124 (100.0%) | 0 (0.0%) |
| Total | 1,563 (95.3%) | 78 (4.8%) |
Health Insurance Coverage by Citizenship Status in Grant Park
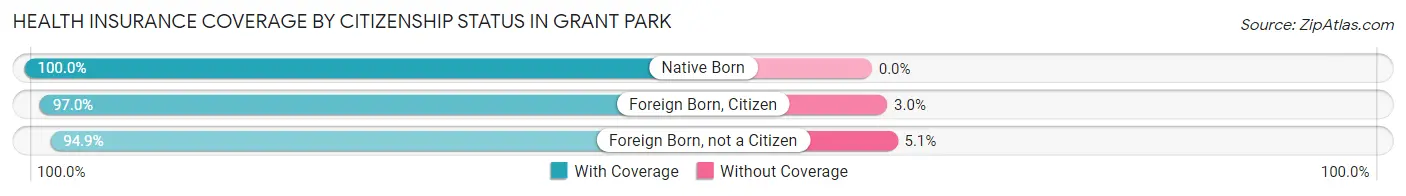
| Citizenship Status | With Coverage | Without Coverage |
| Native Born | 162 (100.0%) | 0 (0.0%) |
| Foreign Born, Citizen | 450 (97.0%) | 14 (3.0%) |
| Foreign Born, not a Citizen | 75 (94.9%) | 4 (5.1%) |
Health Insurance Coverage by Household Income in Grant Park
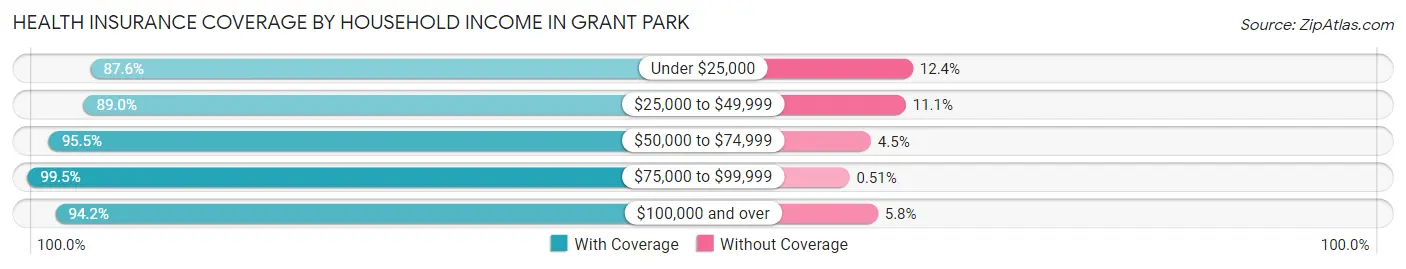
| Household Income | With Coverage | Without Coverage |
| Under $25,000 | 92 (87.6%) | 13 (12.4%) |
| $25,000 to $49,999 | 169 (88.9%) | 21 (11.1%) |
| $50,000 to $74,999 | 190 (95.5%) | 9 (4.5%) |
| $75,000 to $99,999 | 582 (99.5%) | 3 (0.5%) |
| $100,000 and over | 519 (94.2%) | 32 (5.8%) |
Public vs Private Health Insurance Coverage by Age in Grant Park
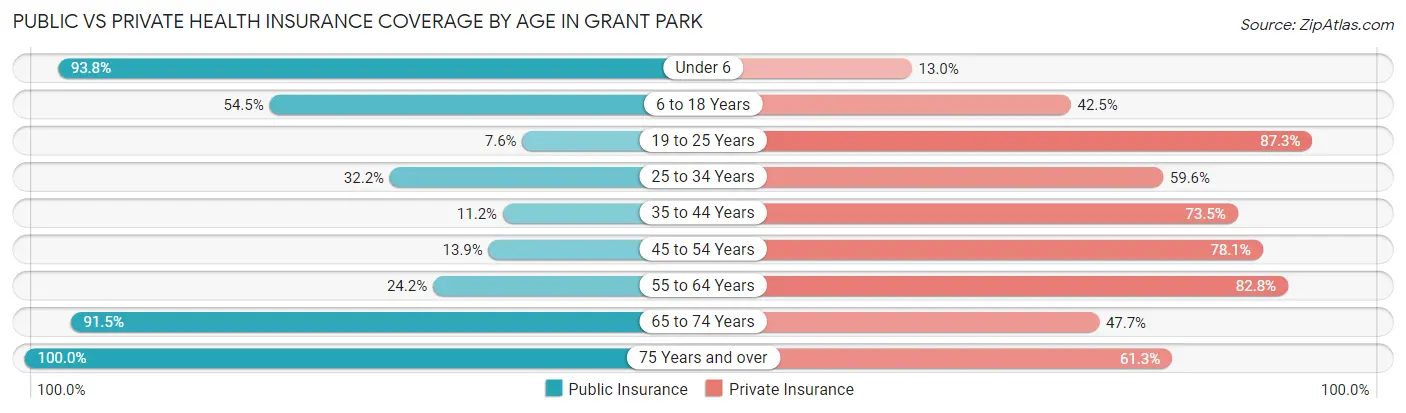
| Age Bracket | Public Insurance | Private Insurance |
| Under 6 | 152 (93.8%) | 21 (13.0%) |
| 6 to 18 Years | 253 (54.5%) | 197 (42.5%) |
| 19 to 25 Years | 6 (7.6%) | 69 (87.3%) |
| 25 to 34 Years | 47 (32.2%) | 87 (59.6%) |
| 35 to 44 Years | 22 (11.2%) | 144 (73.5%) |
| 45 to 54 Years | 19 (13.9%) | 107 (78.1%) |
| 55 to 64 Years | 38 (24.2%) | 130 (82.8%) |
| 65 to 74 Years | 161 (91.5%) | 84 (47.7%) |
| 75 Years and over | 124 (100.0%) | 76 (61.3%) |
| Total | 822 (50.1%) | 915 (55.8%) |
Disability Status by Sex by Age in Grant Park
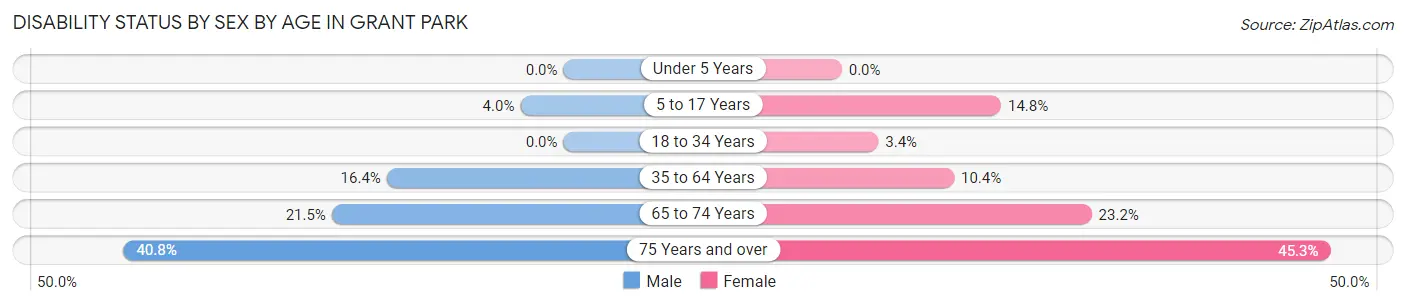
| Age Bracket | Male | Female |
| Under 5 Years | 0 (0.0%) | 0 (0.0%) |
| 5 to 17 Years | 7 (4.0%) | 43 (14.8%) |
| 18 to 34 Years | 0 (0.0%) | 4 (3.4%) |
| 35 to 64 Years | 41 (16.4%) | 25 (10.4%) |
| 65 to 74 Years | 23 (21.5%) | 16 (23.2%) |
| 75 Years and over | 20 (40.8%) | 34 (45.3%) |
Disability Class by Sex by Age in Grant Park
Disability Class: Hearing Difficulty
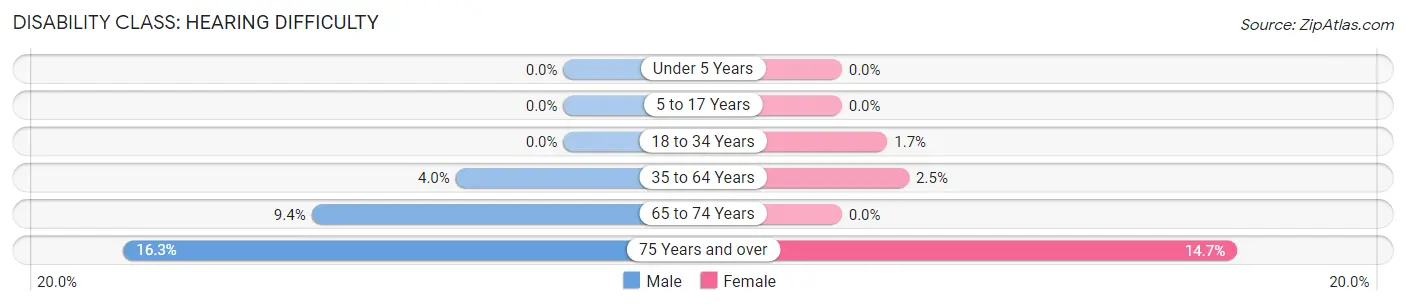
| Age Bracket | Male | Female |
| Under 5 Years | 0 (0.0%) | 0 (0.0%) |
| 5 to 17 Years | 0 (0.0%) | 0 (0.0%) |
| 18 to 34 Years | 0 (0.0%) | 2 (1.7%) |
| 35 to 64 Years | 10 (4.0%) | 6 (2.5%) |
| 65 to 74 Years | 10 (9.3%) | 0 (0.0%) |
| 75 Years and over | 8 (16.3%) | 11 (14.7%) |
Disability Class: Vision Difficulty
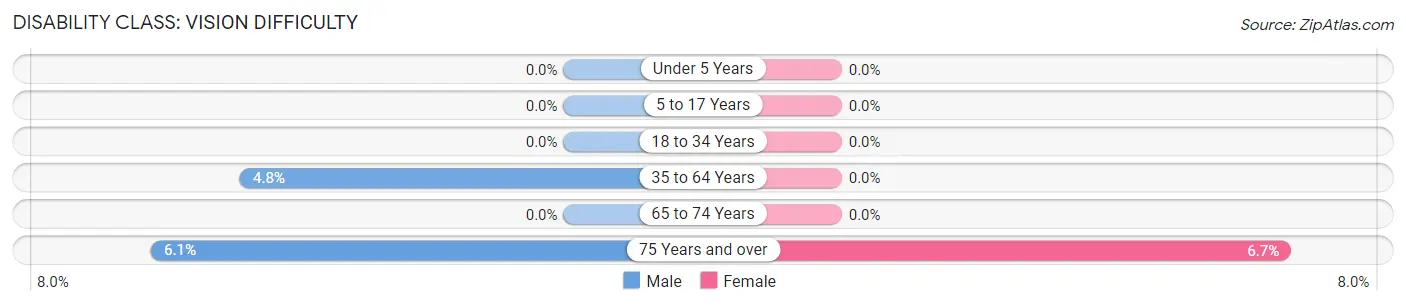
| Age Bracket | Male | Female |
| Under 5 Years | 0 (0.0%) | 0 (0.0%) |
| 5 to 17 Years | 0 (0.0%) | 0 (0.0%) |
| 18 to 34 Years | 0 (0.0%) | 0 (0.0%) |
| 35 to 64 Years | 12 (4.8%) | 0 (0.0%) |
| 65 to 74 Years | 0 (0.0%) | 0 (0.0%) |
| 75 Years and over | 3 (6.1%) | 5 (6.7%) |
Disability Class: Cognitive Difficulty
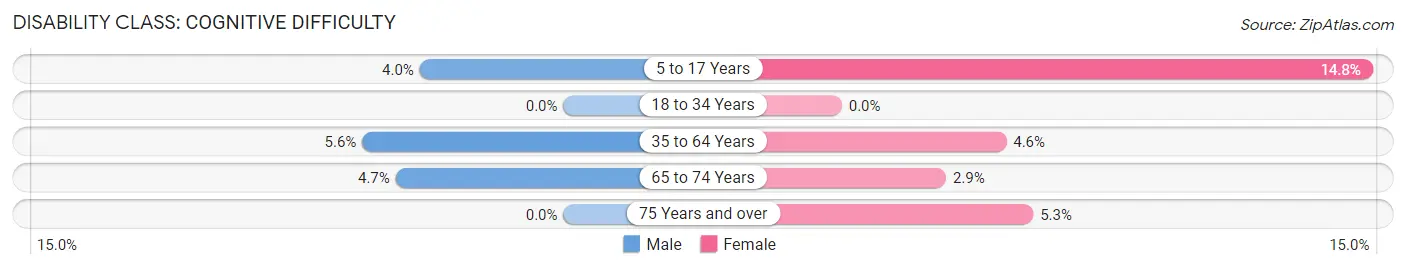
| Age Bracket | Male | Female |
| 5 to 17 Years | 7 (4.0%) | 43 (14.8%) |
| 18 to 34 Years | 0 (0.0%) | 0 (0.0%) |
| 35 to 64 Years | 14 (5.6%) | 11 (4.6%) |
| 65 to 74 Years | 5 (4.7%) | 2 (2.9%) |
| 75 Years and over | 0 (0.0%) | 4 (5.3%) |
Disability Class: Ambulatory Difficulty
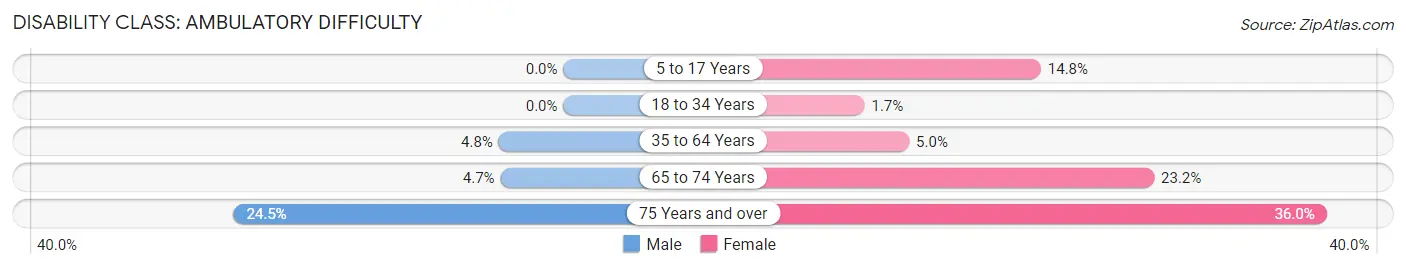
| Age Bracket | Male | Female |
| 5 to 17 Years | 0 (0.0%) | 43 (14.8%) |
| 18 to 34 Years | 0 (0.0%) | 2 (1.7%) |
| 35 to 64 Years | 12 (4.8%) | 12 (5.0%) |
| 65 to 74 Years | 5 (4.7%) | 16 (23.2%) |
| 75 Years and over | 12 (24.5%) | 27 (36.0%) |
Disability Class: Self-Care Difficulty
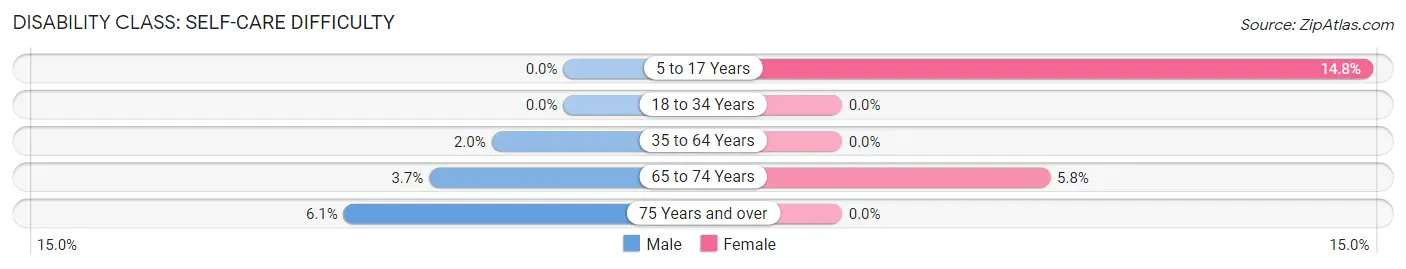
| Age Bracket | Male | Female |
| 5 to 17 Years | 0 (0.0%) | 43 (14.8%) |
| 18 to 34 Years | 0 (0.0%) | 0 (0.0%) |
| 35 to 64 Years | 5 (2.0%) | 0 (0.0%) |
| 65 to 74 Years | 4 (3.7%) | 4 (5.8%) |
| 75 Years and over | 3 (6.1%) | 0 (0.0%) |
Technology Access in Grant Park
Computing Device Access in Grant Park
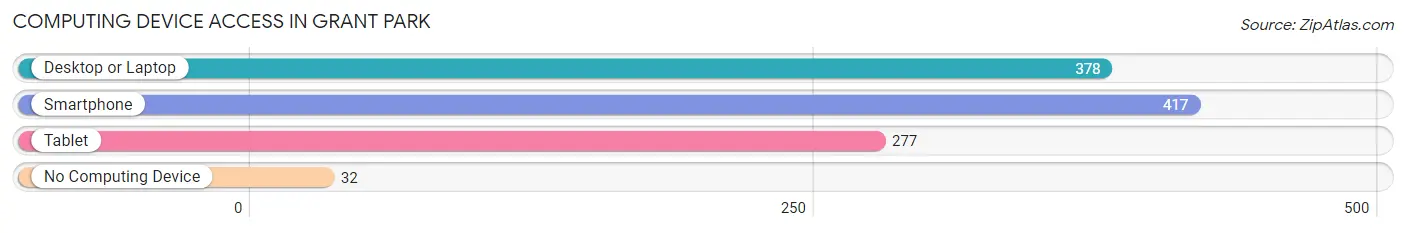
| Device Type | # Households | % Households |
| Desktop or Laptop | 378 | 77.3% |
| Smartphone | 417 | 85.3% |
| Tablet | 277 | 56.7% |
| No Computing Device | 32 | 6.5% |
| Total | 489 | 100.0% |
Internet Access in Grant Park

| Internet Type | # Households | % Households |
| Dial-Up Internet | 0 | 0.0% |
| Broadband Home | 330 | 67.5% |
| Cellular Data Only | 67 | 13.7% |
| Satellite Internet | 43 | 8.8% |
| No Internet | 61 | 12.5% |
| Total | 489 | 100.0% |
Grant Park Summary
Park, Illinois is a small village located in Cook County, Illinois. It is a part of the Chicago metropolitan area and is located approximately 15 miles south of the city. The village is bordered by the city of Chicago to the north, the village of Oak Lawn to the west, the village of Evergreen Park to the south, and the village of Burbank to the east. The population of Grant Park was 2,845 at the 2010 census.
Geography
Grant Park is located at 41°41'17" North, 87°45'17" West (41.6879, -87.7548). According to the United States Census Bureau, the village has a total area of 0.7 square miles (1.8 km2), all land.
History
The area that is now Grant Park was first settled in the early 1800s by German immigrants. The village was originally known as "German Settlement" and was later renamed "Grant Park" in honor of President Ulysses S. Grant. The village was incorporated in 1892.
Demographics
As of the census of 2010, there were 2,845 people, 1,093 households, and 745 families residing in the village. The population density was 4,072.9 people per square mile (1,571.2/km2). There were 1,093 housing units at an average density of 1,541.4 per square mile (595.2/km2). The racial makeup of the village was 87.2% White, 4.2% African American, 0.2% Native American, 0.7% Asian, 5.7% from other races, and 2.0% from two or more races. Hispanic or Latino of any race were 11.3% of the population.
Economy
Grant Park is primarily a residential community, but there are some businesses located in the village. The largest employer in the village is the Grant Park School District, which employs over 500 people. Other employers include a variety of small businesses, such as restaurants, retail stores, and professional services.
The village also has a number of parks and recreational facilities, including a public golf course, a public swimming pool, and several parks. The village also has a library and a museum.
Conclusion
Grant Park, Illinois is a small village located in Cook County, Illinois. It is a part of the Chicago metropolitan area and is located approximately 15 miles south of the city. The village is bordered by the city of Chicago to the north, the village of Oak Lawn to the west, the village of Evergreen Park to the south, and the village of Burbank to the east. The population of Grant Park was 2,845 at the 2010 census. The village is primarily a residential community, but there are some businesses located in the village. The largest employer in the village is the Grant Park School District, which employs over 500 people. Other employers include a variety of small businesses, such as restaurants, retail stores, and professional services. The village also has a number of parks and recreational facilities, including a public golf course, a public swimming pool, and several parks. The village also has a library and a museum.
Common Questions
What is Per Capita Income in Grant Park?
Per Capita income in Grant Park is $26,032.
What is the Median Family Income in Grant Park?
Median Family Income in Grant Park is $85,547.
What is the Median Household income in Grant Park?
Median Household Income in Grant Park is $76,750.
What is Income or Wage Gap in Grant Park?
Income or Wage Gap in Grant Park is 50.5%.
Women in Grant Park earn 49.5 cents for every dollar earned by a man.
What is Inequality or Gini Index in Grant Park?
Inequality or Gini Index in Grant Park is 0.35.
What is the Total Population of Grant Park?
Total Population of Grant Park is 1,641.
What is the Total Male Population of Grant Park?
Total Male Population of Grant Park is 836.
What is the Total Female Population of Grant Park?
Total Female Population of Grant Park is 805.
What is the Ratio of Males per 100 Females in Grant Park?
There are 103.85 Males per 100 Females in Grant Park.
What is the Ratio of Females per 100 Males in Grant Park?
There are 96.29 Females per 100 Males in Grant Park.
What is the Median Population Age in Grant Park?
Median Population Age in Grant Park is 34.3 Years.
What is the Average Family Size in Grant Park
Average Family Size in Grant Park is 4.0 People.
What is the Average Household Size in Grant Park
Average Household Size in Grant Park is 3.3 People.
How Large is the Labor Force in Grant Park?
There are 662 People in the Labor Forcein in Grant Park.
What is the Percentage of People in the Labor Force in Grant Park?
59.5% of People are in the Labor Force in Grant Park.
What is the Unemployment Rate in Grant Park?
Unemployment Rate in Grant Park is 7.6%.