Grandview, IL Map & Demographics
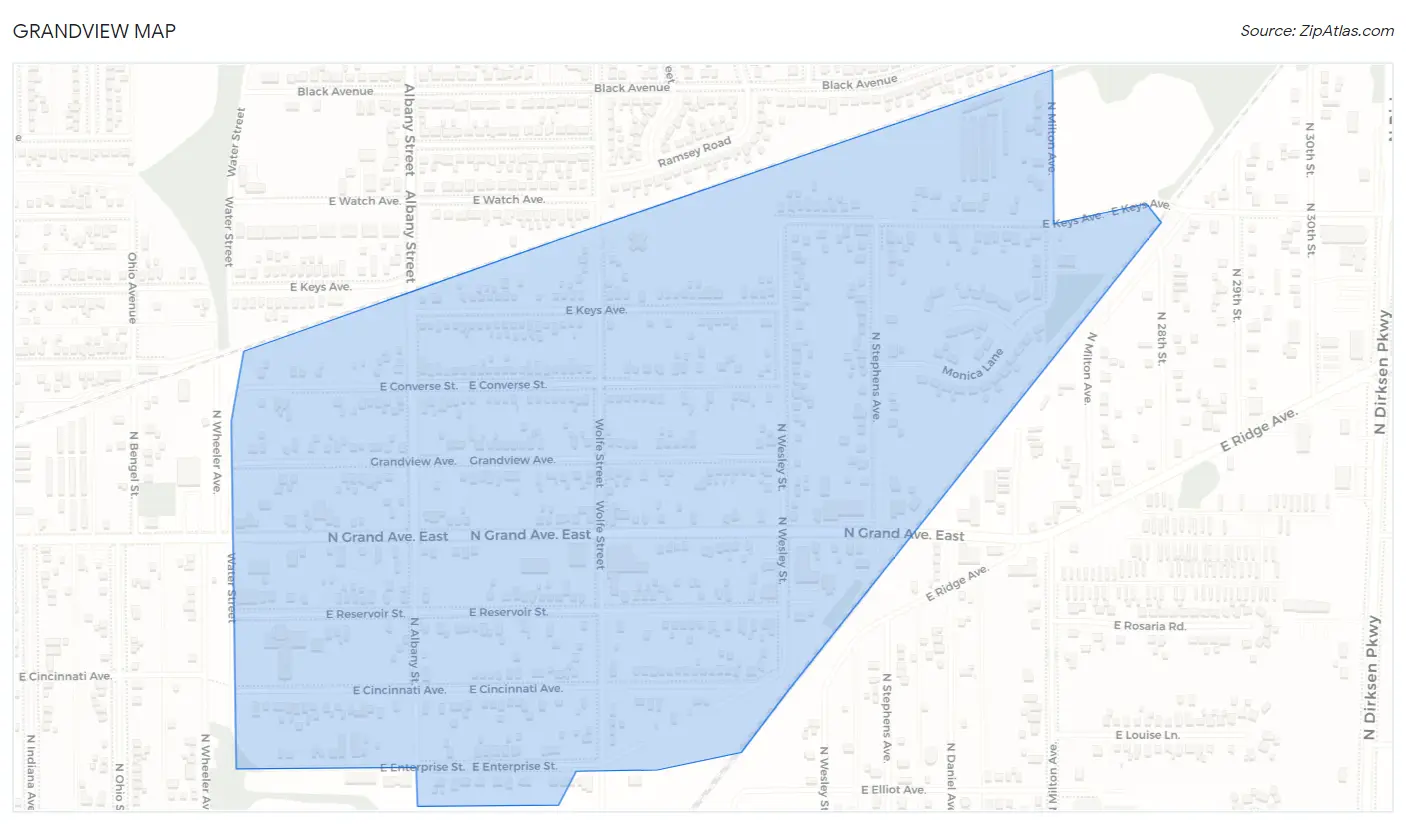
Grandview Map
Grandview Overview
$30,502
PER CAPITA INCOME
$58,958
AVG FAMILY INCOME
$56,750
AVG HOUSEHOLD INCOME
14.9%
WAGE / INCOME GAP [ % ]
85.1¢/ $1
WAGE / INCOME GAP [ $ ]
0.43
INEQUALITY / GINI INDEX
1,391
TOTAL POPULATION
678
MALE POPULATION
713
FEMALE POPULATION
95.09
MALES / 100 FEMALES
105.16
FEMALES / 100 MALES
42.0
MEDIAN AGE
2.8
AVG FAMILY SIZE
2.3
AVG HOUSEHOLD SIZE
751
LABOR FORCE [ PEOPLE ]
63.9%
PERCENT IN LABOR FORCE
9.1%
UNEMPLOYMENT RATE
Grandview Area Codes
Income in Grandview
Income Overview in Grandview
Per Capita Income in Grandview is $30,502, while median incomes of families and households are $58,958 and $56,750 respectively.
| Characteristic | Number | Measure |
| Per Capita Income | 1,391 | $30,502 |
| Median Family Income | 348 | $58,958 |
| Mean Family Income | 348 | $76,480 |
| Median Household Income | 612 | $56,750 |
| Mean Household Income | 612 | $68,140 |
| Income Deficit | 348 | $0 |
| Wage / Income Gap (%) | 1,391 | 14.94% |
| Wage / Income Gap ($) | 1,391 | 85.06¢ per $1 |
| Gini / Inequality Index | 1,391 | 0.43 |
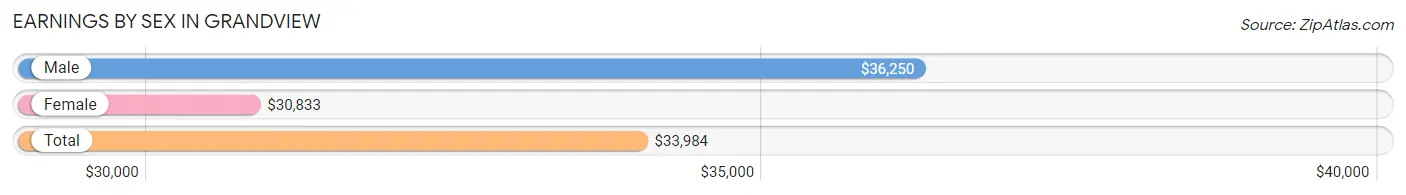
Earnings by Sex in Grandview
Average Earnings in Grandview are $33,984, $36,250 for men and $30,833 for women, a difference of 14.9%.
| Sex | Number | Average Earnings |
| Male | 378 (49.7%) | $36,250 |
| Female | 382 (50.3%) | $30,833 |
| Total | 760 (100.0%) | $33,984 |
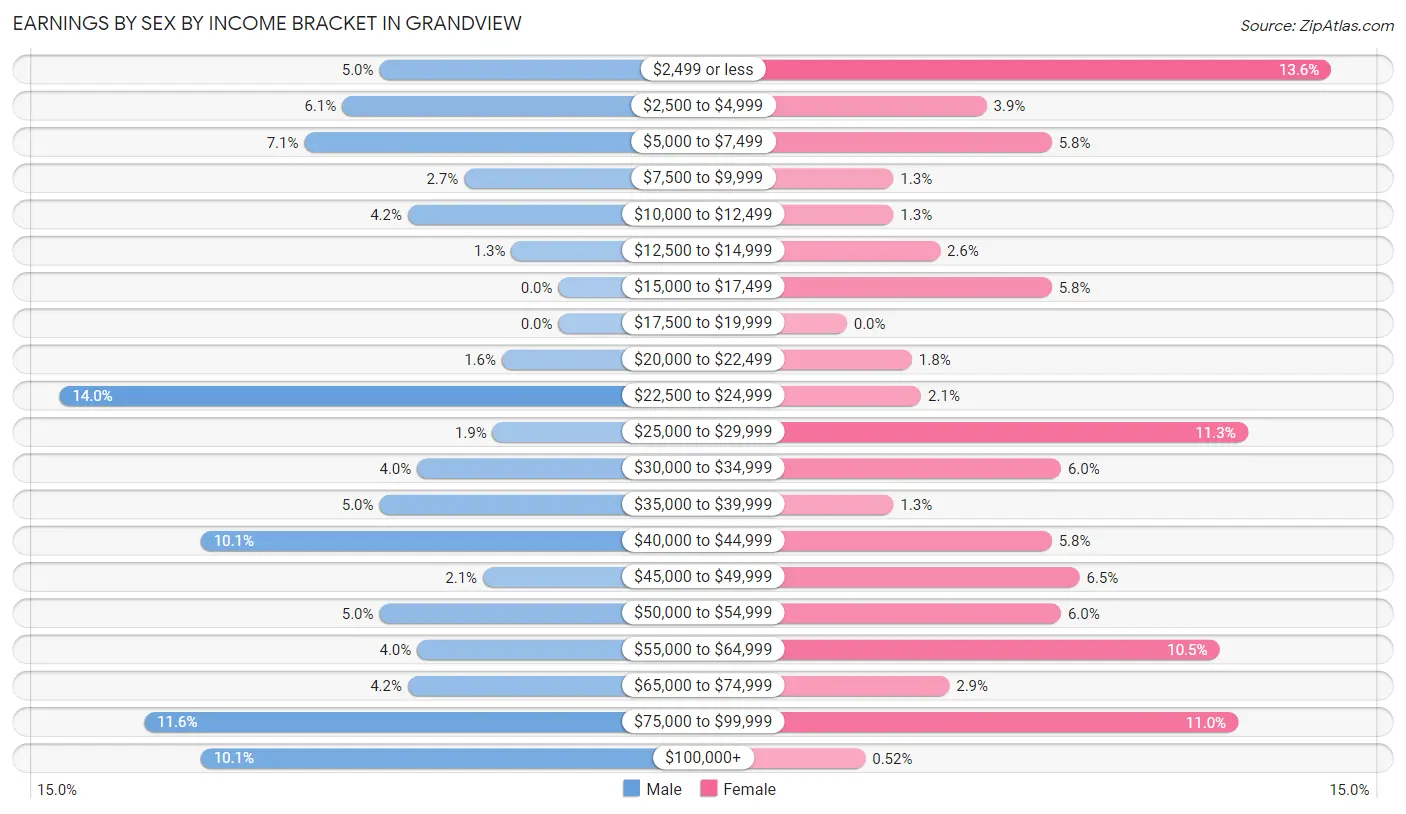
Earnings by Sex by Income Bracket in Grandview
The most common earnings brackets in Grandview are $22,500 to $24,999 for men (53 | 14.0%) and $2,499 or less for women (52 | 13.6%).
| Income | Male | Female |
| $2,499 or less | 19 (5.0%) | 52 (13.6%) |
| $2,500 to $4,999 | 23 (6.1%) | 15 (3.9%) |
| $5,000 to $7,499 | 27 (7.1%) | 22 (5.8%) |
| $7,500 to $9,999 | 10 (2.6%) | 5 (1.3%) |
| $10,000 to $12,499 | 16 (4.2%) | 5 (1.3%) |
| $12,500 to $14,999 | 5 (1.3%) | 10 (2.6%) |
| $15,000 to $17,499 | 0 (0.0%) | 22 (5.8%) |
| $17,500 to $19,999 | 0 (0.0%) | 0 (0.0%) |
| $20,000 to $22,499 | 6 (1.6%) | 7 (1.8%) |
| $22,500 to $24,999 | 53 (14.0%) | 8 (2.1%) |
| $25,000 to $29,999 | 7 (1.8%) | 43 (11.3%) |
| $30,000 to $34,999 | 15 (4.0%) | 23 (6.0%) |
| $35,000 to $39,999 | 19 (5.0%) | 5 (1.3%) |
| $40,000 to $44,999 | 38 (10.1%) | 22 (5.8%) |
| $45,000 to $49,999 | 8 (2.1%) | 25 (6.5%) |
| $50,000 to $54,999 | 19 (5.0%) | 23 (6.0%) |
| $55,000 to $64,999 | 15 (4.0%) | 40 (10.5%) |
| $65,000 to $74,999 | 16 (4.2%) | 11 (2.9%) |
| $75,000 to $99,999 | 44 (11.6%) | 42 (11.0%) |
| $100,000+ | 38 (10.1%) | 2 (0.5%) |
| Total | 378 (100.0%) | 382 (100.0%) |
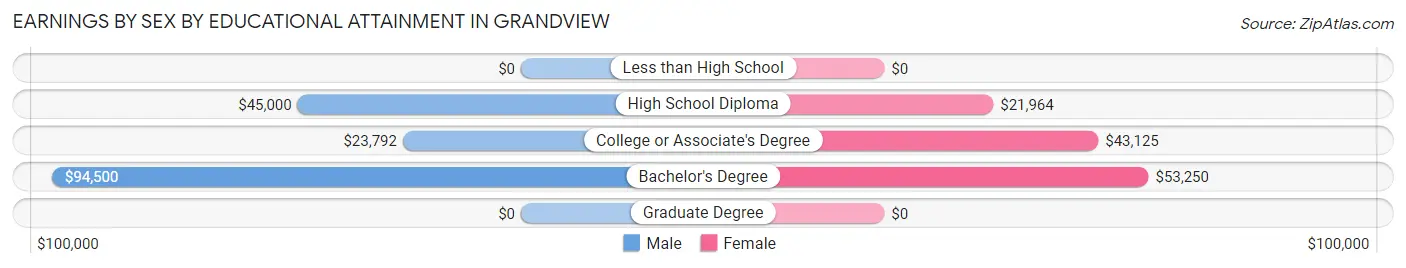
Earnings by Sex by Educational Attainment in Grandview
Average earnings in Grandview are $41,818 for men and $30,625 for women, a difference of 26.8%. Men with an educational attainment of bachelor's degree enjoy the highest average annual earnings of $94,500, while those with college or associate's degree education earn the least with $23,792. Women with an educational attainment of bachelor's degree earn the most with the average annual earnings of $53,250, while those with high school diploma education have the smallest earnings of $21,964.
| Educational Attainment | Male Income | Female Income |
| Less than High School | - | - |
| High School Diploma | $45,000 | $21,964 |
| College or Associate's Degree | $23,792 | $43,125 |
| Bachelor's Degree | $94,500 | $53,250 |
| Graduate Degree | - | - |
| Total | $41,818 | $30,625 |
Family Income in Grandview
Family Income Brackets in Grandview
According to the Grandview family income data, there are 89 families falling into the $75,000 to $99,999 income range, which is the most common income bracket and makes up 25.6% of all families.
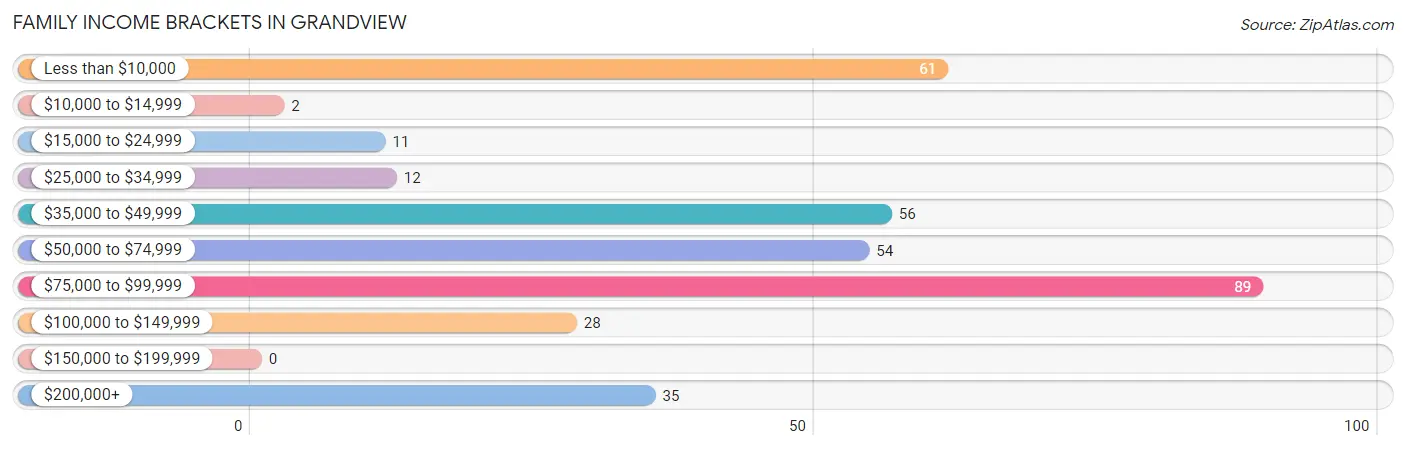
| Income Bracket | # Families | % Families |
| Less than $10,000 | 61 | 17.5% |
| $10,000 to $14,999 | 2 | 0.6% |
| $15,000 to $24,999 | 11 | 3.2% |
| $25,000 to $34,999 | 12 | 3.4% |
| $35,000 to $49,999 | 56 | 16.1% |
| $50,000 to $74,999 | 54 | 15.5% |
| $75,000 to $99,999 | 89 | 25.6% |
| $100,000 to $149,999 | 28 | 8.0% |
| $150,000 to $199,999 | 0 | 0.0% |
| $200,000+ | 35 | 10.1% |
Family Income by Famaliy Size in Grandview
3-person families (94 | 27.0%) account for the highest median family income in Grandview with $83,438 per family, while 3-person families (94 | 27.0%) have the highest median income of $27,813 per family member.
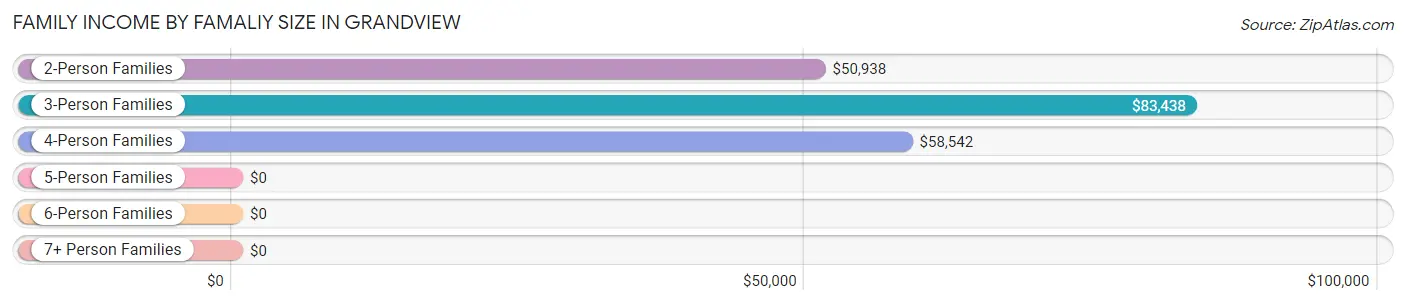
| Income Bracket | # Families | Median Income |
| 2-Person Families | 200 (57.5%) | $50,938 |
| 3-Person Families | 94 (27.0%) | $83,438 |
| 4-Person Families | 38 (10.9%) | $58,542 |
| 5-Person Families | 2 (0.6%) | $0 |
| 6-Person Families | 4 (1.1%) | $0 |
| 7+ Person Families | 10 (2.9%) | $0 |
| Total | 348 (100.0%) | $58,958 |
Family Income by Number of Earners in Grandview
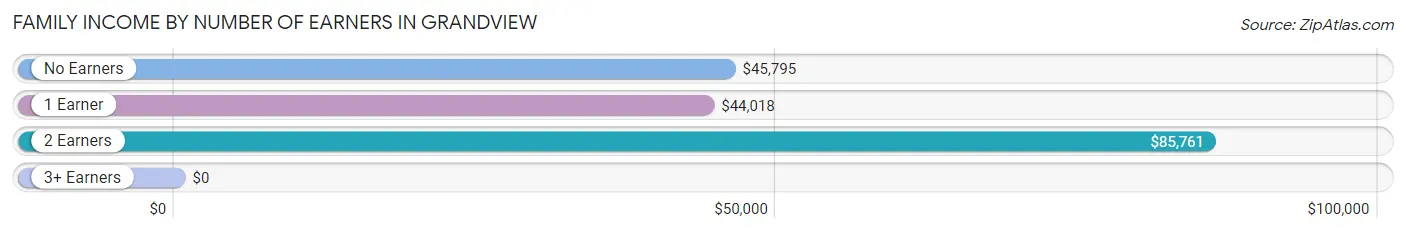
| Number of Earners | # Families | Median Income |
| No Earners | 61 (17.5%) | $45,795 |
| 1 Earner | 127 (36.5%) | $44,018 |
| 2 Earners | 134 (38.5%) | $85,761 |
| 3+ Earners | 26 (7.5%) | $0 |
| Total | 348 (100.0%) | $58,958 |
Household Income in Grandview
Household Income Brackets in Grandview
With 133 households falling in the category, the $75,000 to $99,999 income range is the most frequent in Grandview, accounting for 21.7% of all households. In contrast, only 2 households (0.3%) fall into the $10,000 to $14,999 income bracket, making it the least populous group.
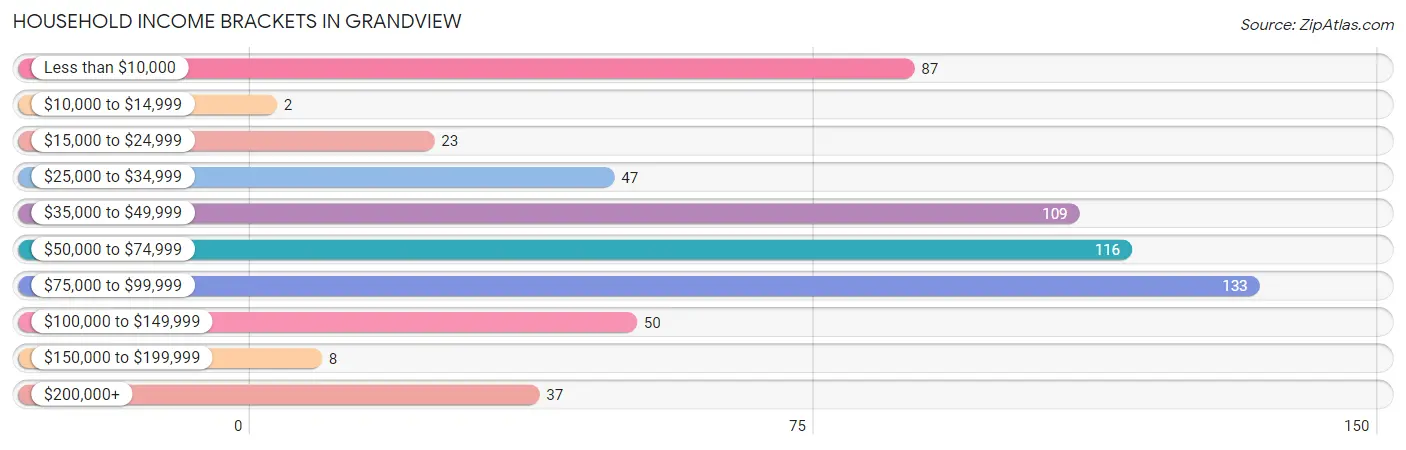
| Income Bracket | # Households | % Households |
| Less than $10,000 | 87 | 14.2% |
| $10,000 to $14,999 | 2 | 0.3% |
| $15,000 to $24,999 | 23 | 3.8% |
| $25,000 to $34,999 | 47 | 7.7% |
| $35,000 to $49,999 | 109 | 17.8% |
| $50,000 to $74,999 | 116 | 19.0% |
| $75,000 to $99,999 | 133 | 21.7% |
| $100,000 to $149,999 | 50 | 8.2% |
| $150,000 to $199,999 | 8 | 1.3% |
| $200,000+ | 37 | 6.0% |
Household Income by Householder Age in Grandview
The median household income in Grandview is $56,750, with the highest median household income of $61,250 found in the 45 to 64 years age bracket for the primary householder. A total of 220 households (35.9%) fall into this category. Meanwhile, the 15 to 24 years age bracket for the primary householder has the lowest median household income of $0, with 10 households (1.6%) in this group.
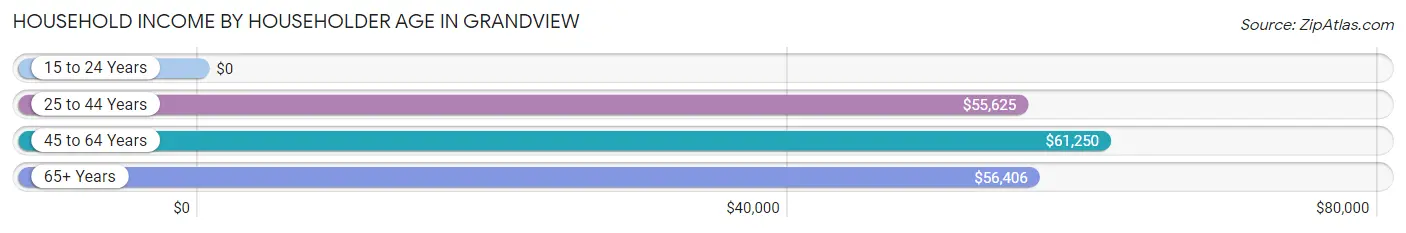
| Income Bracket | # Households | Median Income |
| 15 to 24 Years | 10 (1.6%) | $0 |
| 25 to 44 Years | 227 (37.1%) | $55,625 |
| 45 to 64 Years | 220 (35.9%) | $61,250 |
| 65+ Years | 155 (25.3%) | $56,406 |
| Total | 612 (100.0%) | $56,750 |
Poverty in Grandview
Income Below Poverty by Sex and Age in Grandview
With 26.7% poverty level for males and 18.8% for females among the residents of Grandview, 15 year old males and 16 and 17 year old females are the most vulnerable to poverty, with 25 males (73.5%) and 5 females (100.0%) in their respective age groups living below the poverty level.
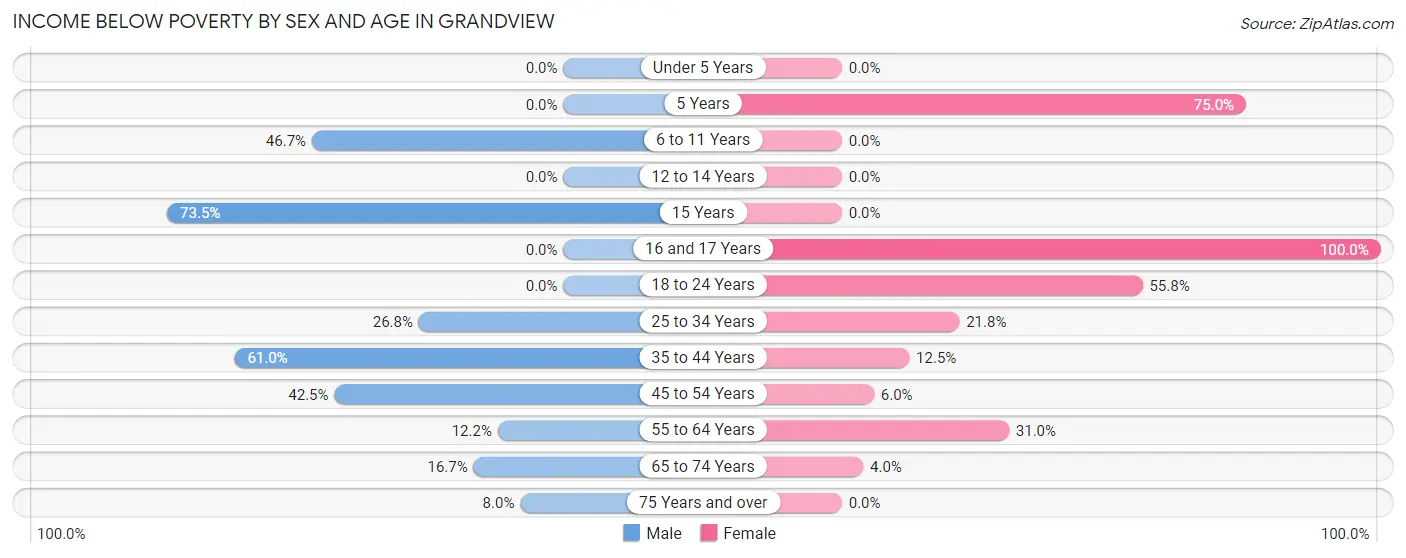
| Age Bracket | Male | Female |
| Under 5 Years | 0 (0.0%) | 0 (0.0%) |
| 5 Years | 0 (0.0%) | 15 (75.0%) |
| 6 to 11 Years | 28 (46.7%) | 0 (0.0%) |
| 12 to 14 Years | 0 (0.0%) | 0 (0.0%) |
| 15 Years | 25 (73.5%) | 0 (0.0%) |
| 16 and 17 Years | 0 (0.0%) | 5 (100.0%) |
| 18 to 24 Years | 0 (0.0%) | 24 (55.8%) |
| 25 to 34 Years | 33 (26.8%) | 29 (21.8%) |
| 35 to 44 Years | 47 (61.0%) | 13 (12.5%) |
| 45 to 54 Years | 17 (42.5%) | 5 (5.9%) |
| 55 to 64 Years | 19 (12.2%) | 40 (31.0%) |
| 65 to 74 Years | 10 (16.7%) | 3 (4.0%) |
| 75 Years and over | 2 (8.0%) | 0 (0.0%) |
| Total | 181 (26.7%) | 134 (18.8%) |
Income Above Poverty by Sex and Age in Grandview
According to the poverty statistics in Grandview, males aged under 5 years and females aged under 5 years are the age groups that are most secure financially, with 100.0% of males and 100.0% of females in these age groups living above the poverty line.
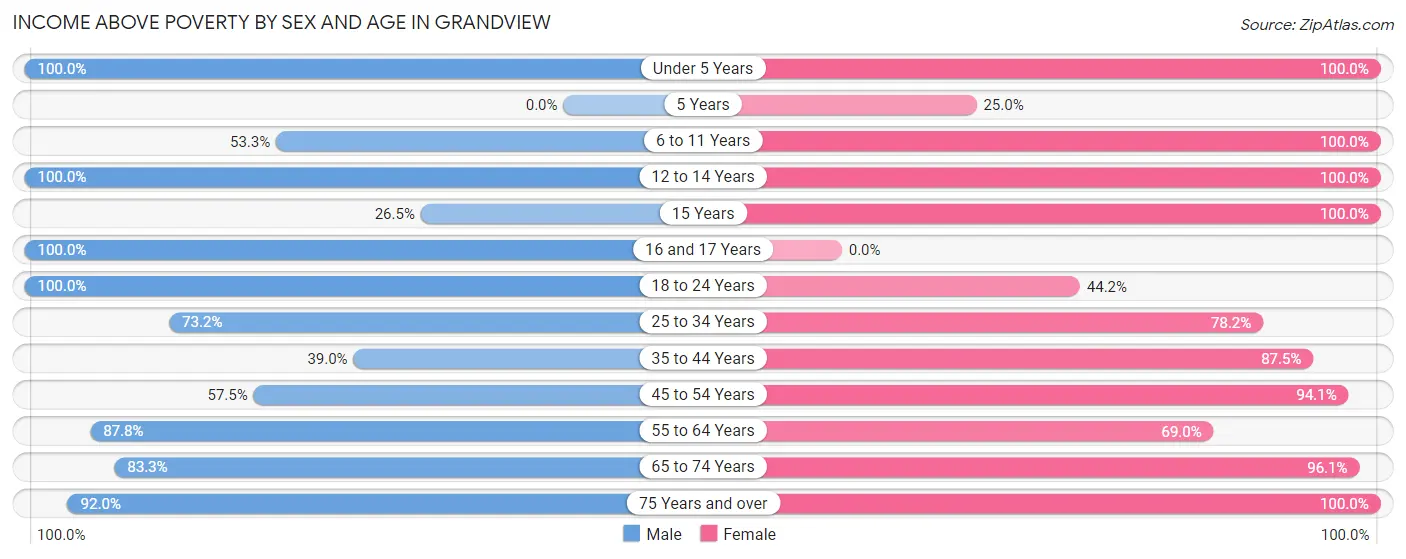
| Age Bracket | Male | Female |
| Under 5 Years | 38 (100.0%) | 22 (100.0%) |
| 5 Years | 0 (0.0%) | 5 (25.0%) |
| 6 to 11 Years | 32 (53.3%) | 20 (100.0%) |
| 12 to 14 Years | 3 (100.0%) | 11 (100.0%) |
| 15 Years | 9 (26.5%) | 7 (100.0%) |
| 16 and 17 Years | 19 (100.0%) | 0 (0.0%) |
| 18 to 24 Years | 43 (100.0%) | 19 (44.2%) |
| 25 to 34 Years | 90 (73.2%) | 104 (78.2%) |
| 35 to 44 Years | 30 (39.0%) | 91 (87.5%) |
| 45 to 54 Years | 23 (57.5%) | 79 (94.1%) |
| 55 to 64 Years | 137 (87.8%) | 89 (69.0%) |
| 65 to 74 Years | 50 (83.3%) | 73 (96.1%) |
| 75 Years and over | 23 (92.0%) | 59 (100.0%) |
| Total | 497 (73.3%) | 579 (81.2%) |
Income Below Poverty Among Married-Couple Families in Grandview
The poverty statistics for married-couple families in Grandview show that 6.0% or 12 of the total 199 families live below the poverty line. Families with 1 or 2 children have the highest poverty rate of 10.5%, comprising of 4 families. On the other hand, families with 3 or 4 children have the lowest poverty rate of 0.0%, which includes 0 families.
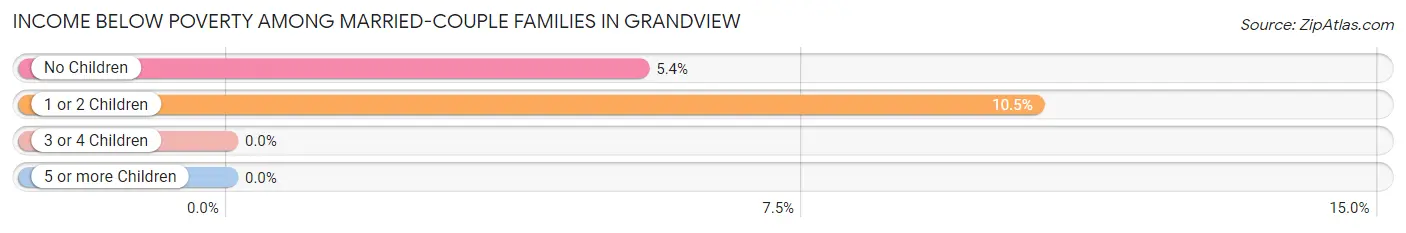
| Children | Above Poverty | Below Poverty |
| No Children | 141 (94.6%) | 8 (5.4%) |
| 1 or 2 Children | 34 (89.5%) | 4 (10.5%) |
| 3 or 4 Children | 12 (100.0%) | 0 (0.0%) |
| 5 or more Children | 0 (0.0%) | 0 (0.0%) |
| Total | 187 (94.0%) | 12 (6.0%) |
Income Below Poverty Among Single-Parent Households in Grandview
According to the poverty data in Grandview, 57.8% or 26 single-father households and 30.8% or 32 single-mother households are living below the poverty line. Among single-father households, those with 1 or 2 children have the highest poverty rate, with 24 households (80.0%) experiencing poverty. Likewise, among single-mother households, those with 1 or 2 children have the highest poverty rate, with 22 households (44.0%) falling below the poverty line.
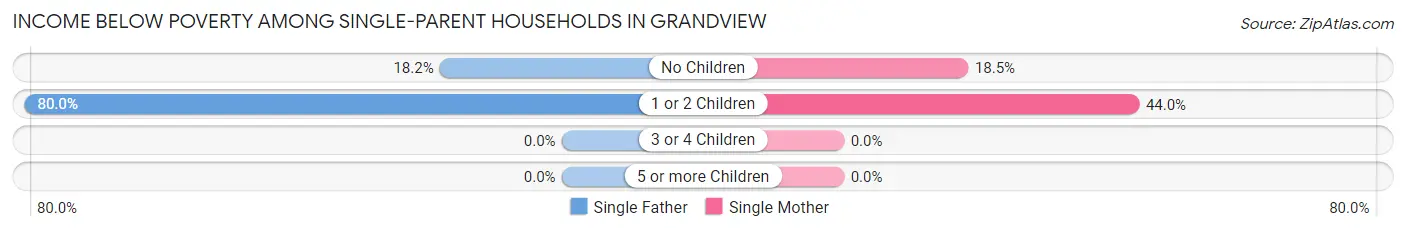
| Children | Single Father | Single Mother |
| No Children | 2 (18.2%) | 10 (18.5%) |
| 1 or 2 Children | 24 (80.0%) | 22 (44.0%) |
| 3 or 4 Children | 0 (0.0%) | 0 (0.0%) |
| 5 or more Children | 0 (0.0%) | 0 (0.0%) |
| Total | 26 (57.8%) | 32 (30.8%) |
Income Below Poverty Among Married-Couple vs Single-Parent Households in Grandview
The poverty data for Grandview shows that 12 of the married-couple family households (6.0%) and 58 of the single-parent households (38.9%) are living below the poverty level. Within the married-couple family households, those with 1 or 2 children have the highest poverty rate, with 4 households (10.5%) falling below the poverty line. Among the single-parent households, those with 1 or 2 children have the highest poverty rate, with 46 household (57.5%) living below poverty.
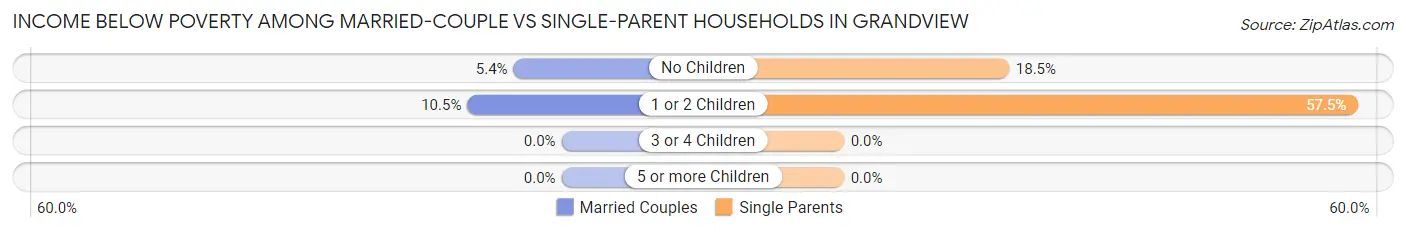
| Children | Married-Couple Families | Single-Parent Households |
| No Children | 8 (5.4%) | 12 (18.5%) |
| 1 or 2 Children | 4 (10.5%) | 46 (57.5%) |
| 3 or 4 Children | 0 (0.0%) | 0 (0.0%) |
| 5 or more Children | 0 (0.0%) | 0 (0.0%) |
| Total | 12 (6.0%) | 58 (38.9%) |
Race in Grandview
The most populous races in Grandview are White / Caucasian (1,182 | 85.0%), Black / African American (98 | 7.0%), and Two or more Races (96 | 6.9%).
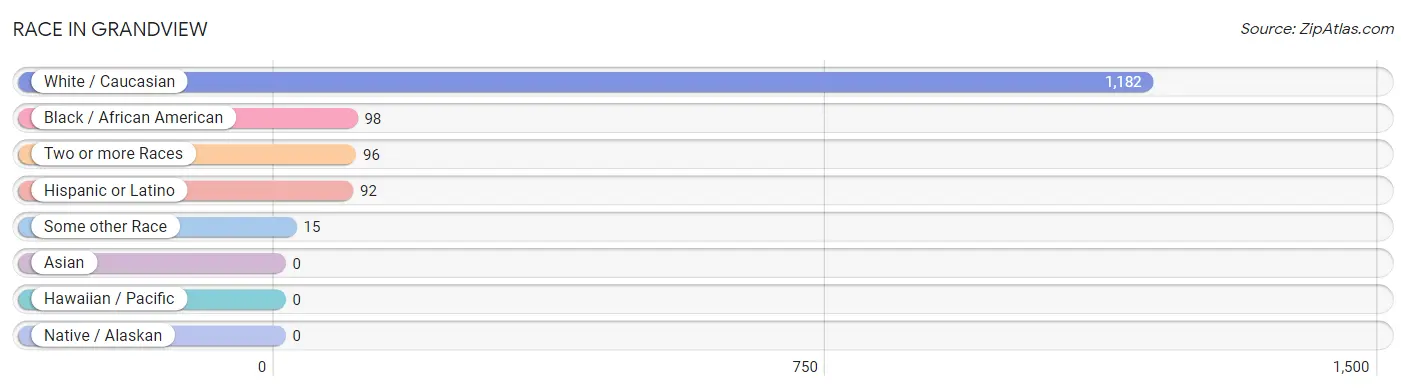
| Race | # Population | % Population |
| Asian | 0 | 0.0% |
| Black / African American | 98 | 7.0% |
| Hawaiian / Pacific | 0 | 0.0% |
| Hispanic or Latino | 92 | 6.6% |
| Native / Alaskan | 0 | 0.0% |
| White / Caucasian | 1,182 | 85.0% |
| Two or more Races | 96 | 6.9% |
| Some other Race | 15 | 1.1% |
| Total | 1,391 | 100.0% |
Ancestry in Grandview
The most populous ancestries reported in Grandview are German (225 | 16.2%), English (195 | 14.0%), Irish (132 | 9.5%), American (82 | 5.9%), and Puerto Rican (66 | 4.7%), together accounting for 50.3% of all Grandview residents.
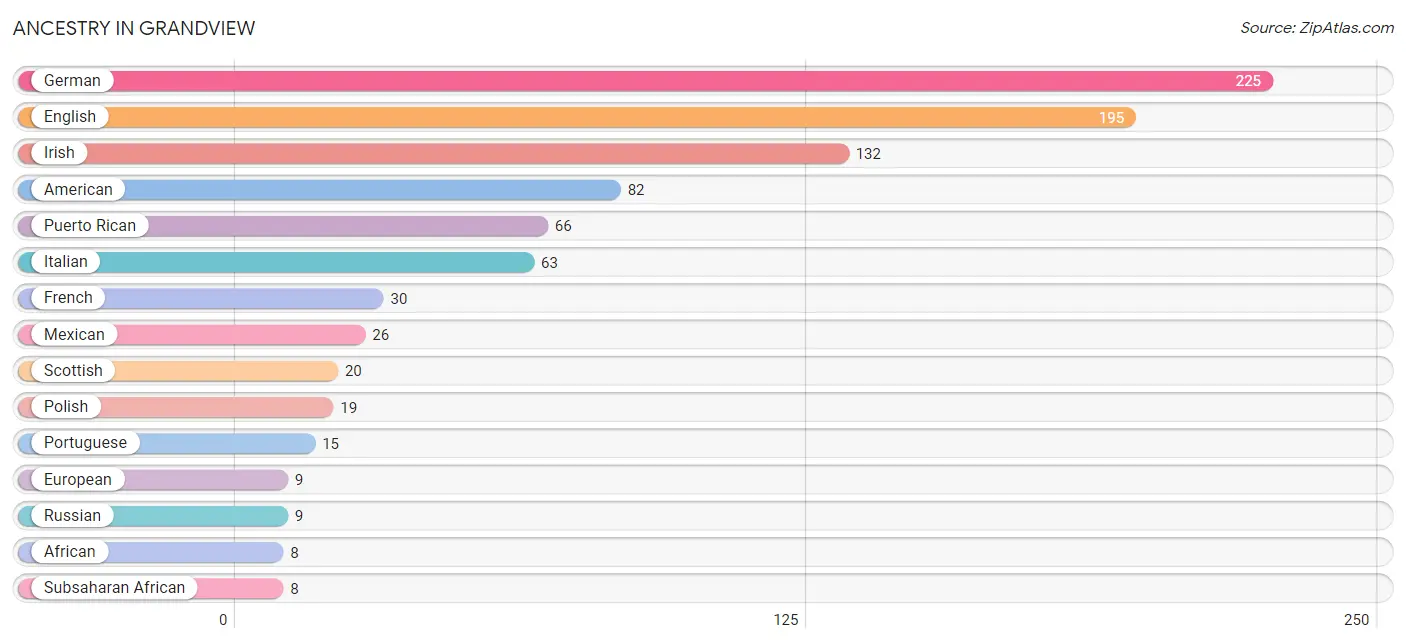
| Ancestry | # Population | % Population |
| African | 8 | 0.6% |
| American | 82 | 5.9% |
| Arab | 6 | 0.4% |
| Austrian | 4 | 0.3% |
| Basque | 3 | 0.2% |
| Cherokee | 1 | 0.1% |
| Dutch | 2 | 0.1% |
| English | 195 | 14.0% |
| European | 9 | 0.6% |
| French | 30 | 2.2% |
| German | 225 | 16.2% |
| Hungarian | 3 | 0.2% |
| Irish | 132 | 9.5% |
| Italian | 63 | 4.5% |
| Lebanese | 6 | 0.4% |
| Lithuanian | 2 | 0.1% |
| Mexican | 26 | 1.9% |
| Norwegian | 3 | 0.2% |
| Polish | 19 | 1.4% |
| Portuguese | 15 | 1.1% |
| Puerto Rican | 66 | 4.7% |
| Russian | 9 | 0.6% |
| Scandinavian | 3 | 0.2% |
| Scotch-Irish | 2 | 0.1% |
| Scottish | 20 | 1.4% |
| Slavic | 3 | 0.2% |
| Subsaharan African | 8 | 0.6% |
| Swedish | 5 | 0.4% |
| Welsh | 3 | 0.2% | View All 29 Rows |
Immigrants in Grandview
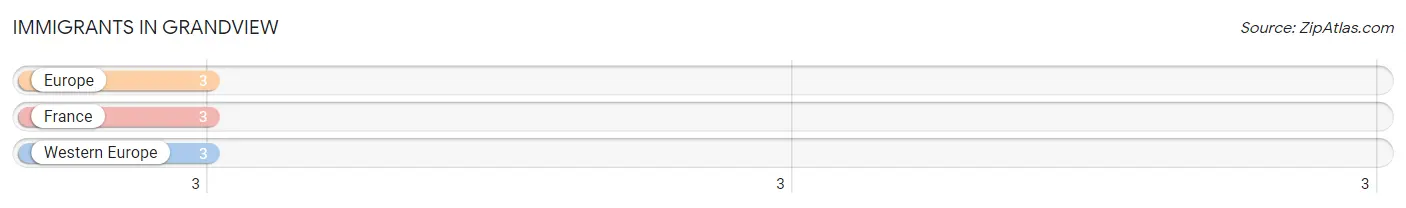
The most numerous immigrant groups reported in Grandview came from Europe (3 | 0.2%), France (3 | 0.2%), and Western Europe (3 | 0.2%), together accounting for 0.7% of all Grandview residents.
| Immigration Origin | # Population | % Population |
| Europe | 3 | 0.2% |
| France | 3 | 0.2% |
| Western Europe | 3 | 0.2% | View All 3 Rows |
Sex and Age in Grandview
Sex and Age in Grandview
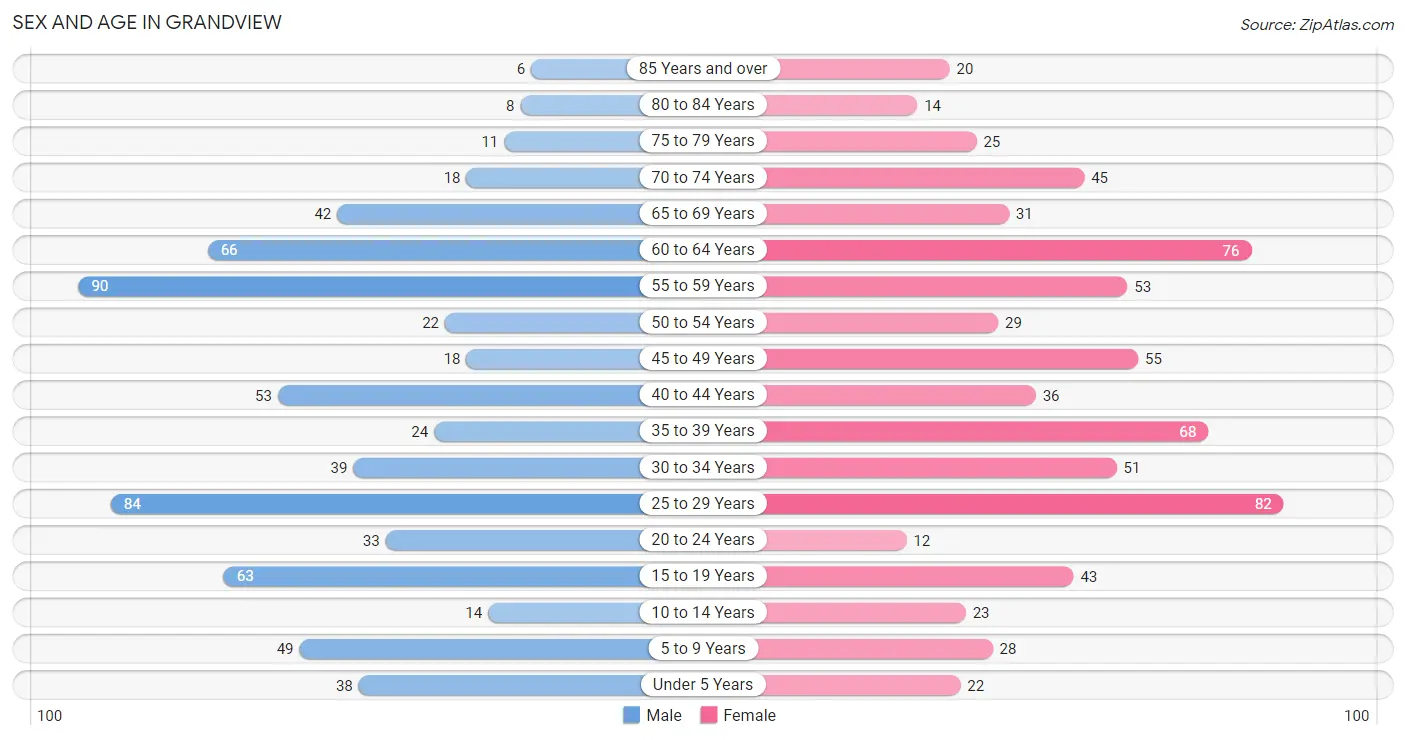
The most populous age groups in Grandview are 55 to 59 Years (90 | 13.3%) for men and 25 to 29 Years (82 | 11.5%) for women.
| Age Bracket | Male | Female |
| Under 5 Years | 38 (5.6%) | 22 (3.1%) |
| 5 to 9 Years | 49 (7.2%) | 28 (3.9%) |
| 10 to 14 Years | 14 (2.1%) | 23 (3.2%) |
| 15 to 19 Years | 63 (9.3%) | 43 (6.0%) |
| 20 to 24 Years | 33 (4.9%) | 12 (1.7%) |
| 25 to 29 Years | 84 (12.4%) | 82 (11.5%) |
| 30 to 34 Years | 39 (5.8%) | 51 (7.1%) |
| 35 to 39 Years | 24 (3.5%) | 68 (9.5%) |
| 40 to 44 Years | 53 (7.8%) | 36 (5.1%) |
| 45 to 49 Years | 18 (2.6%) | 55 (7.7%) |
| 50 to 54 Years | 22 (3.2%) | 29 (4.1%) |
| 55 to 59 Years | 90 (13.3%) | 53 (7.4%) |
| 60 to 64 Years | 66 (9.7%) | 76 (10.7%) |
| 65 to 69 Years | 42 (6.2%) | 31 (4.3%) |
| 70 to 74 Years | 18 (2.6%) | 45 (6.3%) |
| 75 to 79 Years | 11 (1.6%) | 25 (3.5%) |
| 80 to 84 Years | 8 (1.2%) | 14 (2.0%) |
| 85 Years and over | 6 (0.9%) | 20 (2.8%) |
| Total | 678 (100.0%) | 713 (100.0%) |
Families and Households in Grandview
Median Family Size in Grandview
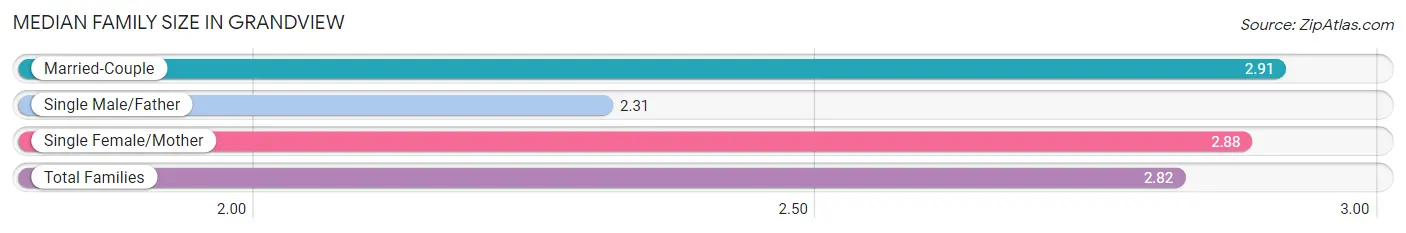
The median family size in Grandview is 2.82 persons per family, with married-couple families (199 | 57.2%) accounting for the largest median family size of 2.91 persons per family. On the other hand, single male/father families (45 | 12.9%) represent the smallest median family size with 2.31 persons per family.
| Family Type | # Families | Family Size |
| Married-Couple | 199 (57.2%) | 2.91 |
| Single Male/Father | 45 (12.9%) | 2.31 |
| Single Female/Mother | 104 (29.9%) | 2.88 |
| Total Families | 348 (100.0%) | 2.82 |
Median Household Size in Grandview
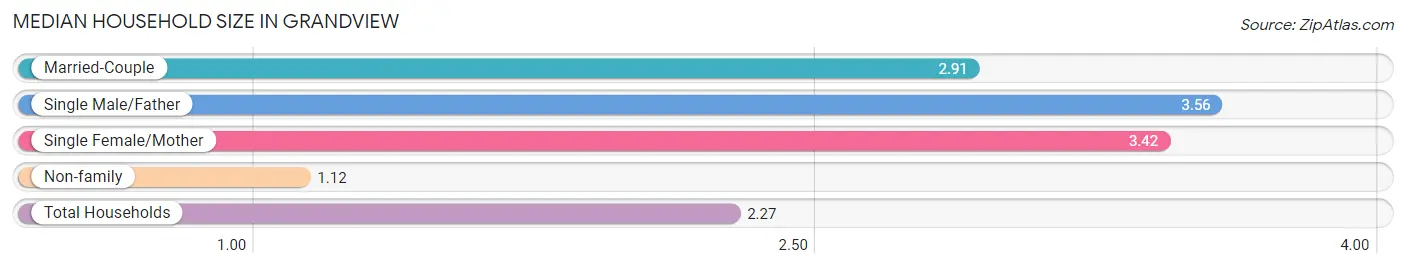
The median household size in Grandview is 2.27 persons per household, with single male/father households (45 | 7.3%) accounting for the largest median household size of 3.56 persons per household. non-family households (264 | 43.1%) represent the smallest median household size with 1.12 persons per household.
| Household Type | # Households | Household Size |
| Married-Couple | 199 (32.5%) | 2.91 |
| Single Male/Father | 45 (7.3%) | 3.56 |
| Single Female/Mother | 104 (17.0%) | 3.42 |
| Non-family | 264 (43.1%) | 1.12 |
| Total Households | 612 (100.0%) | 2.27 |
Household Size by Marriage Status in Grandview
Out of a total of 612 households in Grandview, 348 (56.9%) are family households, while 264 (43.1%) are nonfamily households. The most numerous type of family households are 2-person households, comprising 148, and the most common type of nonfamily households are 1-person households, comprising 236.
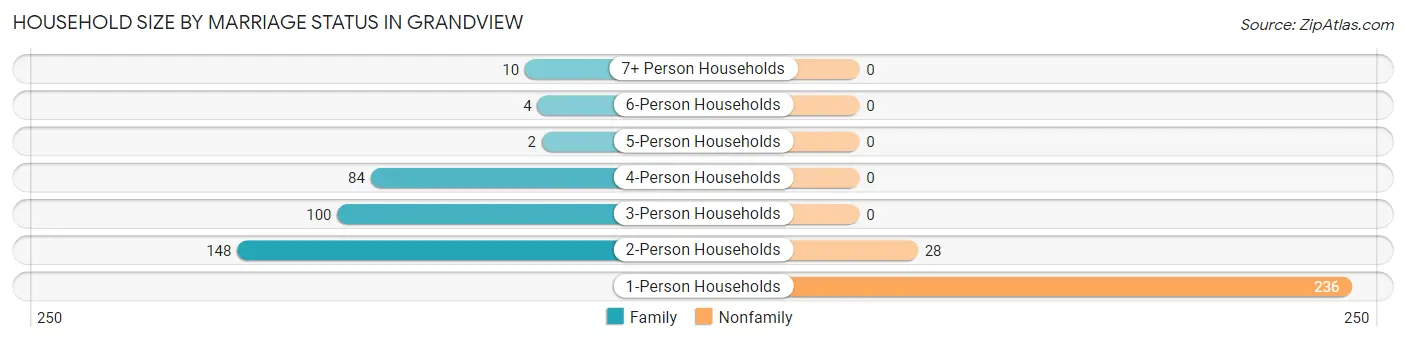
| Household Size | Family Households | Nonfamily Households |
| 1-Person Households | - | 236 (38.6%) |
| 2-Person Households | 148 (24.2%) | 28 (4.6%) |
| 3-Person Households | 100 (16.3%) | 0 (0.0%) |
| 4-Person Households | 84 (13.7%) | 0 (0.0%) |
| 5-Person Households | 2 (0.3%) | 0 (0.0%) |
| 6-Person Households | 4 (0.6%) | 0 (0.0%) |
| 7+ Person Households | 10 (1.6%) | 0 (0.0%) |
| Total | 348 (56.9%) | 264 (43.1%) |
Female Fertility in Grandview
Fertility by Age in Grandview
| Age Bracket | Women with Births | Births / 1,000 Women |
| 15 to 19 years | 0 (0.0%) | 0.0 |
| 20 to 34 years | 0 (0.0%) | 0.0 |
| 35 to 50 years | 0 (0.0%) | 0.0 |
| Total | 0 (0.0%) | 0.0 |
Fertility by Age by Marriage Status in Grandview
| Age Bracket | Married | Unmarried |
| 15 to 19 years | 0 (0.0%) | 0 (0.0%) |
| 20 to 34 years | 0 (0.0%) | 0 (0.0%) |
| 35 to 50 years | 0 (0.0%) | 0 (0.0%) |
| Total | 0 (0.0%) | 0 (0.0%) |
Fertility by Education in Grandview
| Educational Attainment | Women with Births | Births / 1,000 Women |
| Less than High School | 0 (0.0%) | 0.0 |
| High School Diploma | 0 (0.0%) | 0.0 |
| College or Associate's Degree | 0 (0.0%) | 0.0 |
| Bachelor's Degree | 0 (0.0%) | 0.0 |
| Graduate Degree | 0 (0.0%) | 0.0 |
| Total | 0 (0.0%) | 0.0 |
Fertility by Education by Marriage Status in Grandview
| Educational Attainment | Married | Unmarried |
| Less than High School | 0 (0.0%) | 0 (0.0%) |
| High School Diploma | 0 (0.0%) | 0 (0.0%) |
| College or Associate's Degree | 0 (0.0%) | 0 (0.0%) |
| Bachelor's Degree | 0 (0.0%) | 0 (0.0%) |
| Graduate Degree | 0 (0.0%) | 0 (0.0%) |
| Total | 0 (0.0%) | 0 (0.0%) |
Employment Characteristics in Grandview
Employment by Class of Employer in Grandview
Among the 675 employed individuals in Grandview, private company employees (513 | 76.0%), state government employees (58 | 8.6%), and self-employed (not incorporated) (56 | 8.3%) make up the most common classes of employment.
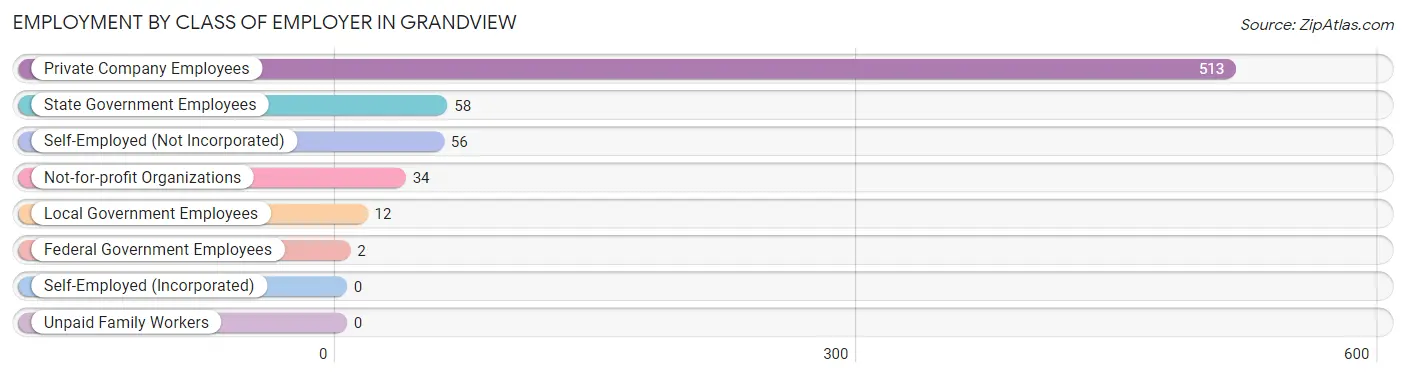
| Employer Class | # Employees | % Employees |
| Private Company Employees | 513 | 76.0% |
| Self-Employed (Incorporated) | 0 | 0.0% |
| Self-Employed (Not Incorporated) | 56 | 8.3% |
| Not-for-profit Organizations | 34 | 5.0% |
| Local Government Employees | 12 | 1.8% |
| State Government Employees | 58 | 8.6% |
| Federal Government Employees | 2 | 0.3% |
| Unpaid Family Workers | 0 | 0.0% |
| Total | 675 | 100.0% |
Employment Status by Age in Grandview
According to the labor force statistics for Grandview, out of the total population over 16 years of age (1,176), 63.9% or 751 individuals are in the labor force, with 9.1% or 68 of them unemployed. The age group with the highest labor force participation rate is 20 to 24 years, with 100.0% or 45 individuals in the labor force. Within the labor force, the 35 to 44 years age range has the highest percentage of unemployed individuals, with 32.2% or 48 of them being unemployed.
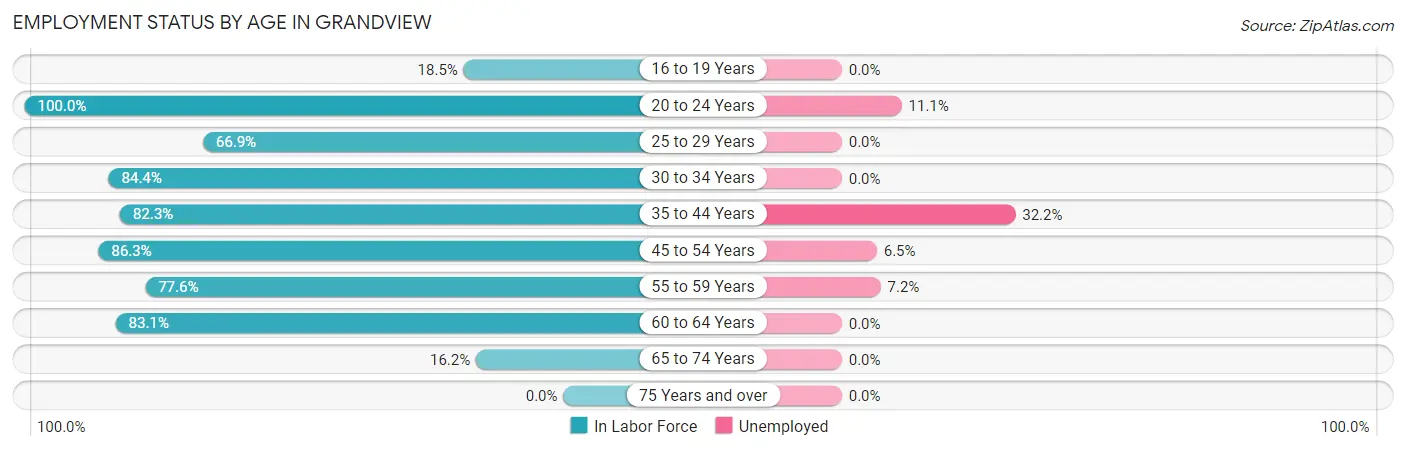
| Age Bracket | In Labor Force | Unemployed |
| 16 to 19 Years | 12 (18.5%) | 0 (0.0%) |
| 20 to 24 Years | 45 (100.0%) | 5 (11.1%) |
| 25 to 29 Years | 111 (66.9%) | 0 (0.0%) |
| 30 to 34 Years | 76 (84.4%) | 0 (0.0%) |
| 35 to 44 Years | 149 (82.3%) | 48 (32.2%) |
| 45 to 54 Years | 107 (86.3%) | 7 (6.5%) |
| 55 to 59 Years | 111 (77.6%) | 8 (7.2%) |
| 60 to 64 Years | 118 (83.1%) | 0 (0.0%) |
| 65 to 74 Years | 22 (16.2%) | 0 (0.0%) |
| 75 Years and over | 0 (0.0%) | 0 (0.0%) |
| Total | 751 (63.9%) | 68 (9.1%) |
Employment Status by Educational Attainment in Grandview
According to labor force statistics for Grandview, 79.4% of individuals (672) out of the total population between 25 and 64 years of age (846) are in the labor force, with 9.4% or 63 of them being unemployed. The group with the highest labor force participation rate are those with the educational attainment of bachelor's degree or higher, with 100.0% or 96 individuals in the labor force. Within the labor force, individuals with college / associate degree education have the highest percentage of unemployment, with 11.3% or 27 of them being unemployed.
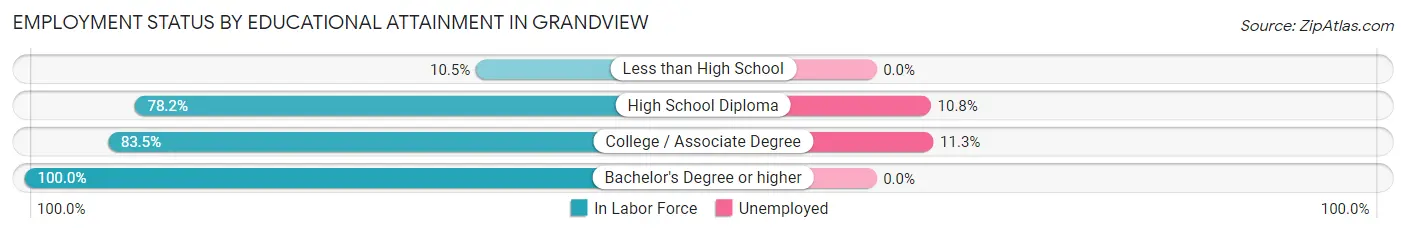
| Educational Attainment | In Labor Force | Unemployed |
| Less than High School | 4 (10.5%) | 0 (0.0%) |
| High School Diploma | 334 (78.2%) | 46 (10.8%) |
| College / Associate Degree | 238 (83.5%) | 32 (11.3%) |
| Bachelor's Degree or higher | 96 (100.0%) | 0 (0.0%) |
| Total | 672 (79.4%) | 80 (9.4%) |
Employment Occupations by Sex in Grandview
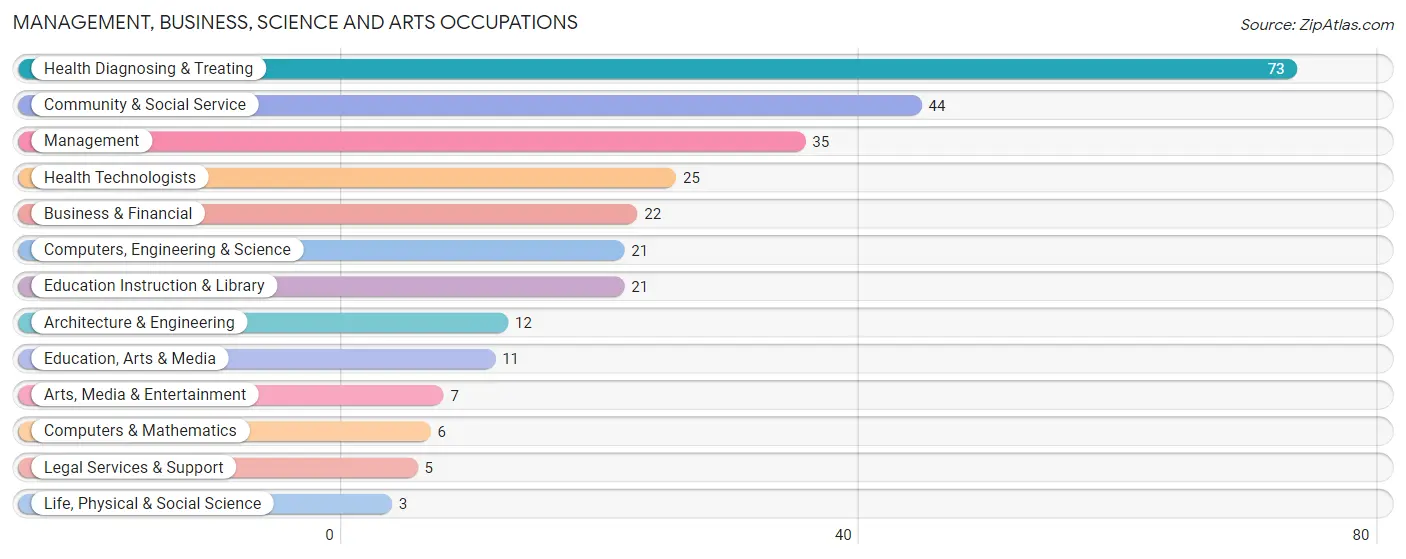
Management, Business, Science and Arts Occupations
The most common Management, Business, Science and Arts occupations in Grandview are Health Diagnosing & Treating (73 | 10.7%), Community & Social Service (44 | 6.4%), Management (35 | 5.1%), Health Technologists (25 | 3.7%), and Business & Financial (22 | 3.2%).
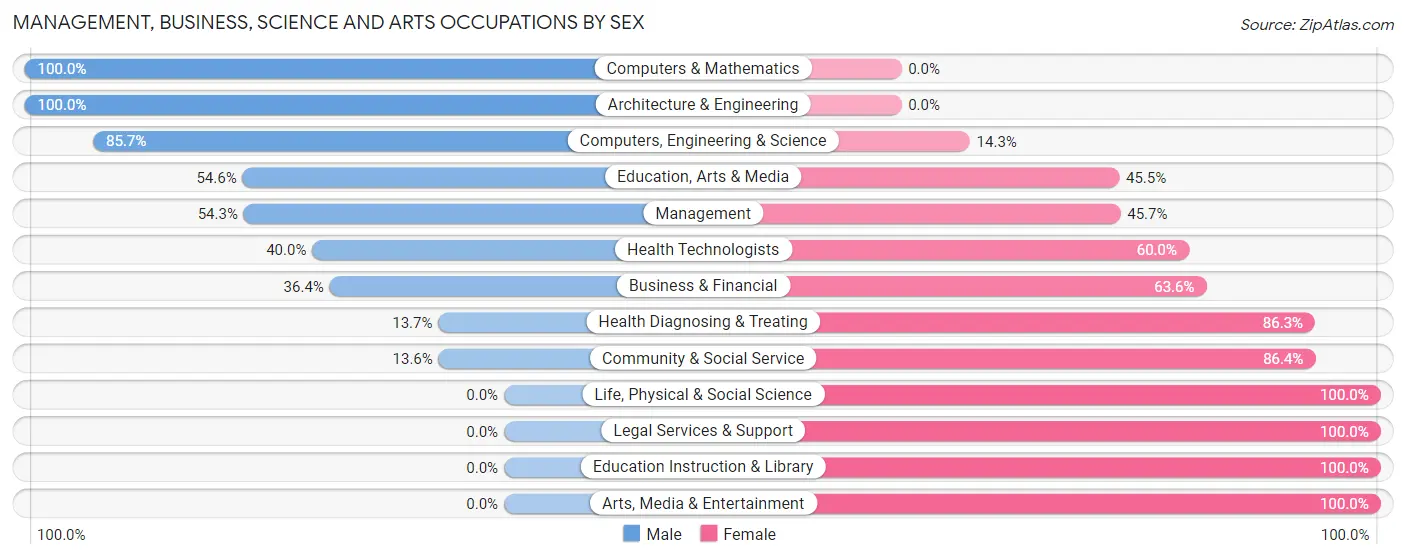
Management, Business, Science and Arts Occupations by Sex
Within the Management, Business, Science and Arts occupations in Grandview, the most male-oriented occupations are Computers & Mathematics (100.0%), Architecture & Engineering (100.0%), and Computers, Engineering & Science (85.7%), while the most female-oriented occupations are Life, Physical & Social Science (100.0%), Legal Services & Support (100.0%), and Education Instruction & Library (100.0%).
| Occupation | Male | Female |
| Management | 19 (54.3%) | 16 (45.7%) |
| Business & Financial | 8 (36.4%) | 14 (63.6%) |
| Computers, Engineering & Science | 18 (85.7%) | 3 (14.3%) |
| Computers & Mathematics | 6 (100.0%) | 0 (0.0%) |
| Architecture & Engineering | 12 (100.0%) | 0 (0.0%) |
| Life, Physical & Social Science | 0 (0.0%) | 3 (100.0%) |
| Community & Social Service | 6 (13.6%) | 38 (86.4%) |
| Education, Arts & Media | 6 (54.5%) | 5 (45.5%) |
| Legal Services & Support | 0 (0.0%) | 5 (100.0%) |
| Education Instruction & Library | 0 (0.0%) | 21 (100.0%) |
| Arts, Media & Entertainment | 0 (0.0%) | 7 (100.0%) |
| Health Diagnosing & Treating | 10 (13.7%) | 63 (86.3%) |
| Health Technologists | 10 (40.0%) | 15 (60.0%) |
| Total (Category) | 61 (31.3%) | 134 (68.7%) |
| Total (Overall) | 313 (45.8%) | 370 (54.2%) |
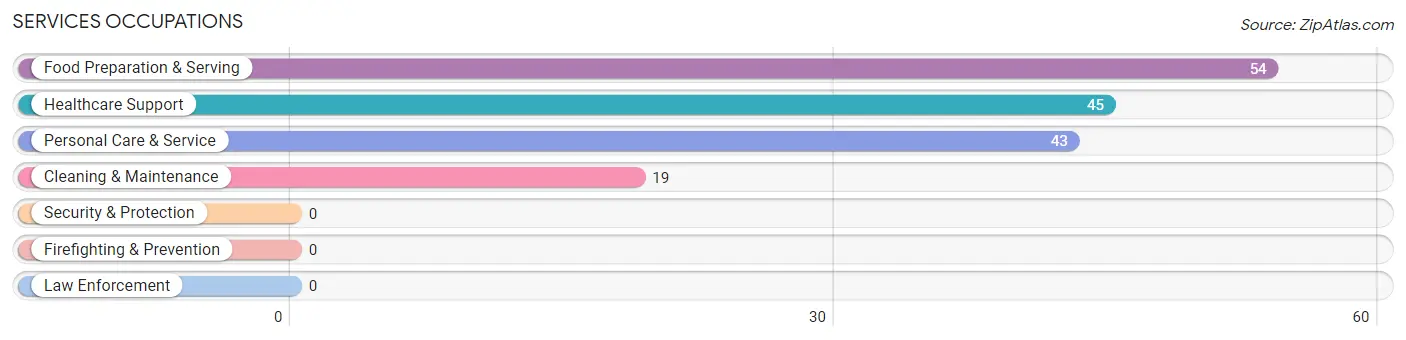
Services Occupations
The most common Services occupations in Grandview are Food Preparation & Serving (54 | 7.9%), Healthcare Support (45 | 6.6%), Personal Care & Service (43 | 6.3%), and Cleaning & Maintenance (19 | 2.8%).
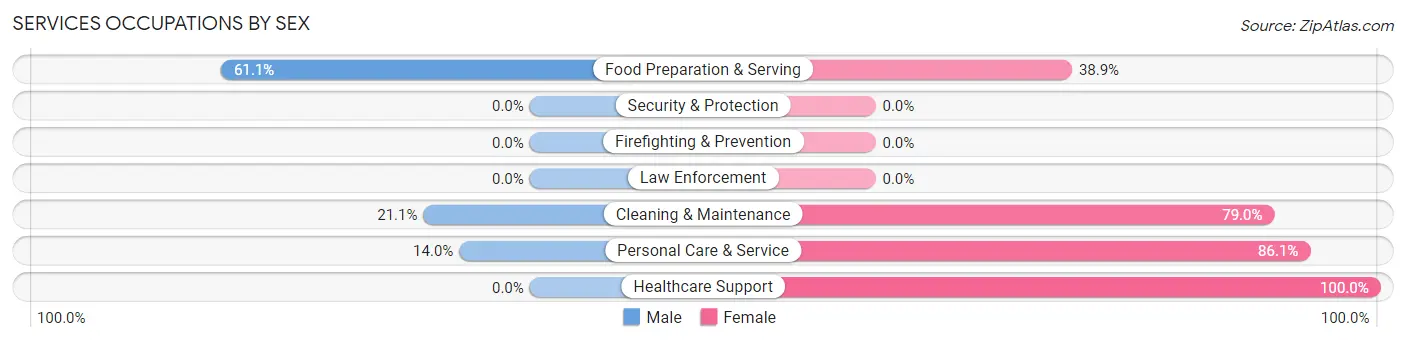
Services Occupations by Sex
Within the Services occupations in Grandview, the most male-oriented occupations are Food Preparation & Serving (61.1%), Cleaning & Maintenance (21.0%), and Personal Care & Service (14.0%), while the most female-oriented occupations are Healthcare Support (100.0%), Personal Care & Service (86.1%), and Cleaning & Maintenance (78.9%).
| Occupation | Male | Female |
| Healthcare Support | 0 (0.0%) | 45 (100.0%) |
| Security & Protection | 0 (0.0%) | 0 (0.0%) |
| Firefighting & Prevention | 0 (0.0%) | 0 (0.0%) |
| Law Enforcement | 0 (0.0%) | 0 (0.0%) |
| Food Preparation & Serving | 33 (61.1%) | 21 (38.9%) |
| Cleaning & Maintenance | 4 (21.0%) | 15 (78.9%) |
| Personal Care & Service | 6 (14.0%) | 37 (86.1%) |
| Total (Category) | 43 (26.7%) | 118 (73.3%) |
| Total (Overall) | 313 (45.8%) | 370 (54.2%) |
Sales and Office Occupations
The most common Sales and Office occupations in Grandview are Office & Administration (101 | 14.8%), and Sales & Related (41 | 6.0%).

Sales and Office Occupations by Sex

| Occupation | Male | Female |
| Sales & Related | 24 (58.5%) | 17 (41.5%) |
| Office & Administration | 19 (18.8%) | 82 (81.2%) |
| Total (Category) | 43 (30.3%) | 99 (69.7%) |
| Total (Overall) | 313 (45.8%) | 370 (54.2%) |
Natural Resources, Construction and Maintenance Occupations
The most common Natural Resources, Construction and Maintenance occupations in Grandview are Installation, Maintenance & Repair (20 | 2.9%), Construction & Extraction (15 | 2.2%), and Farming, Fishing & Forestry (9 | 1.3%).

Natural Resources, Construction and Maintenance Occupations by Sex

| Occupation | Male | Female |
| Farming, Fishing & Forestry | 9 (100.0%) | 0 (0.0%) |
| Construction & Extraction | 15 (100.0%) | 0 (0.0%) |
| Installation, Maintenance & Repair | 20 (100.0%) | 0 (0.0%) |
| Total (Category) | 44 (100.0%) | 0 (0.0%) |
| Total (Overall) | 313 (45.8%) | 370 (54.2%) |
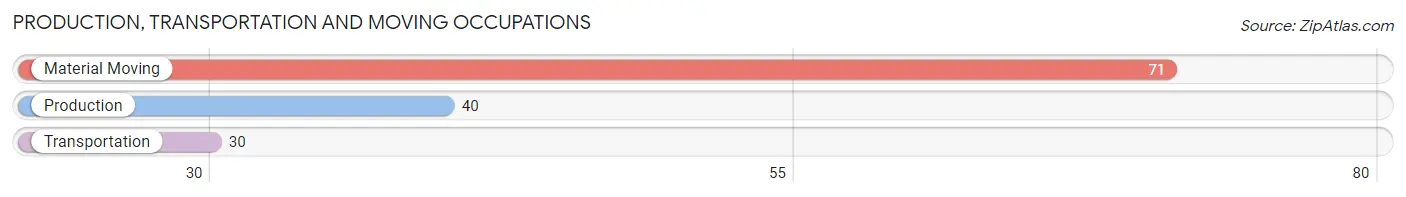
Production, Transportation and Moving Occupations
The most common Production, Transportation and Moving occupations in Grandview are Material Moving (71 | 10.4%), Production (40 | 5.9%), and Transportation (30 | 4.4%).
Production, Transportation and Moving Occupations by Sex
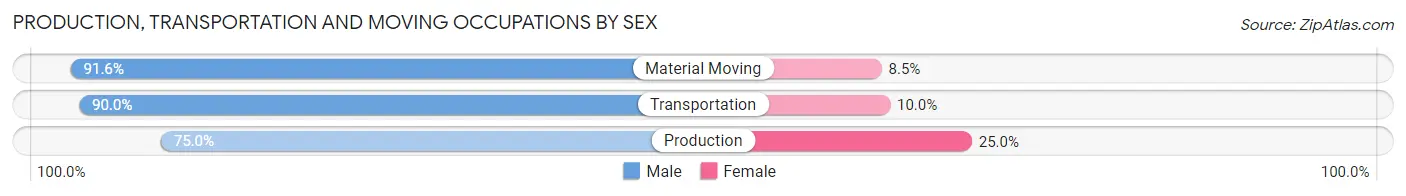
| Occupation | Male | Female |
| Production | 30 (75.0%) | 10 (25.0%) |
| Transportation | 27 (90.0%) | 3 (10.0%) |
| Material Moving | 65 (91.5%) | 6 (8.5%) |
| Total (Category) | 122 (86.5%) | 19 (13.5%) |
| Total (Overall) | 313 (45.8%) | 370 (54.2%) |
Employment Industries by Sex in Grandview
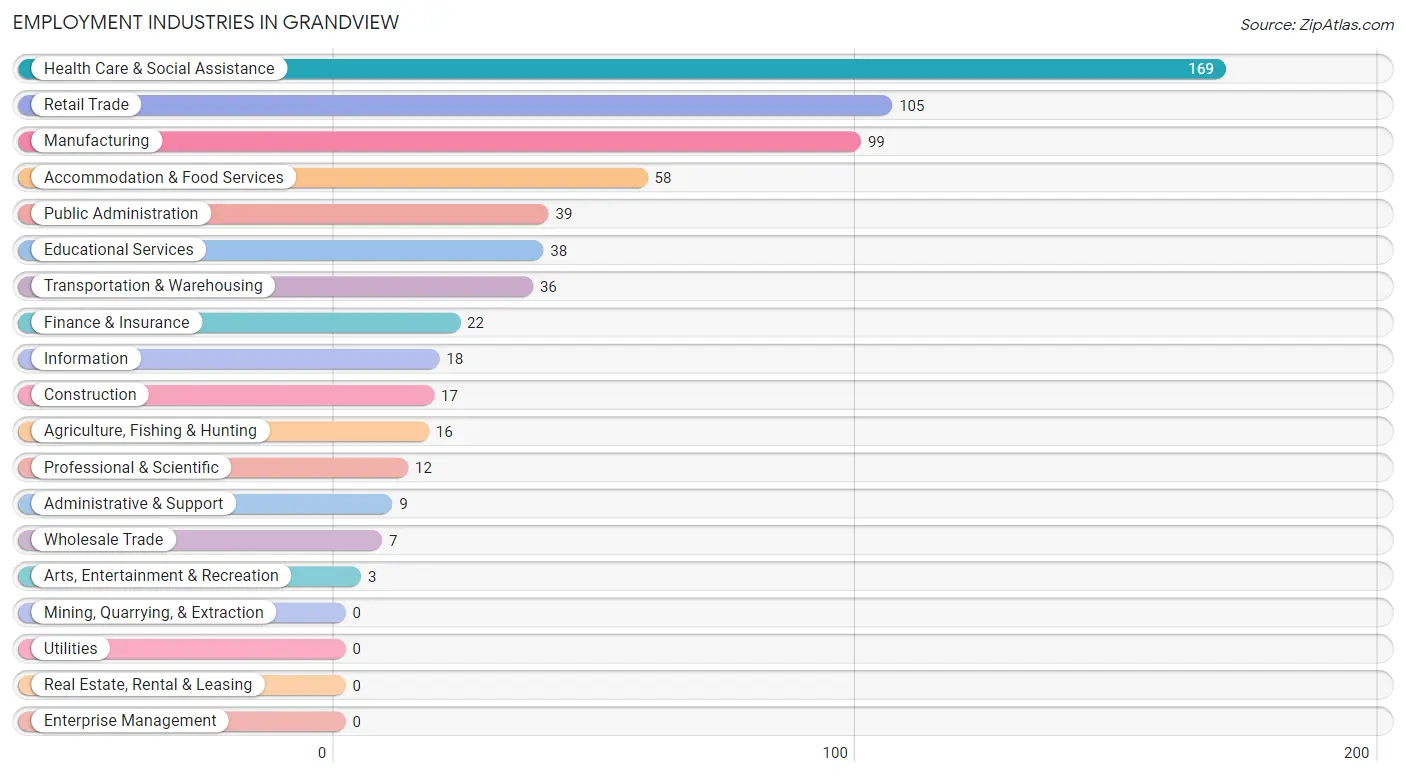
Employment Industries in Grandview
The major employment industries in Grandview include Health Care & Social Assistance (169 | 24.7%), Retail Trade (105 | 15.4%), Manufacturing (99 | 14.5%), Accommodation & Food Services (58 | 8.5%), and Public Administration (39 | 5.7%).
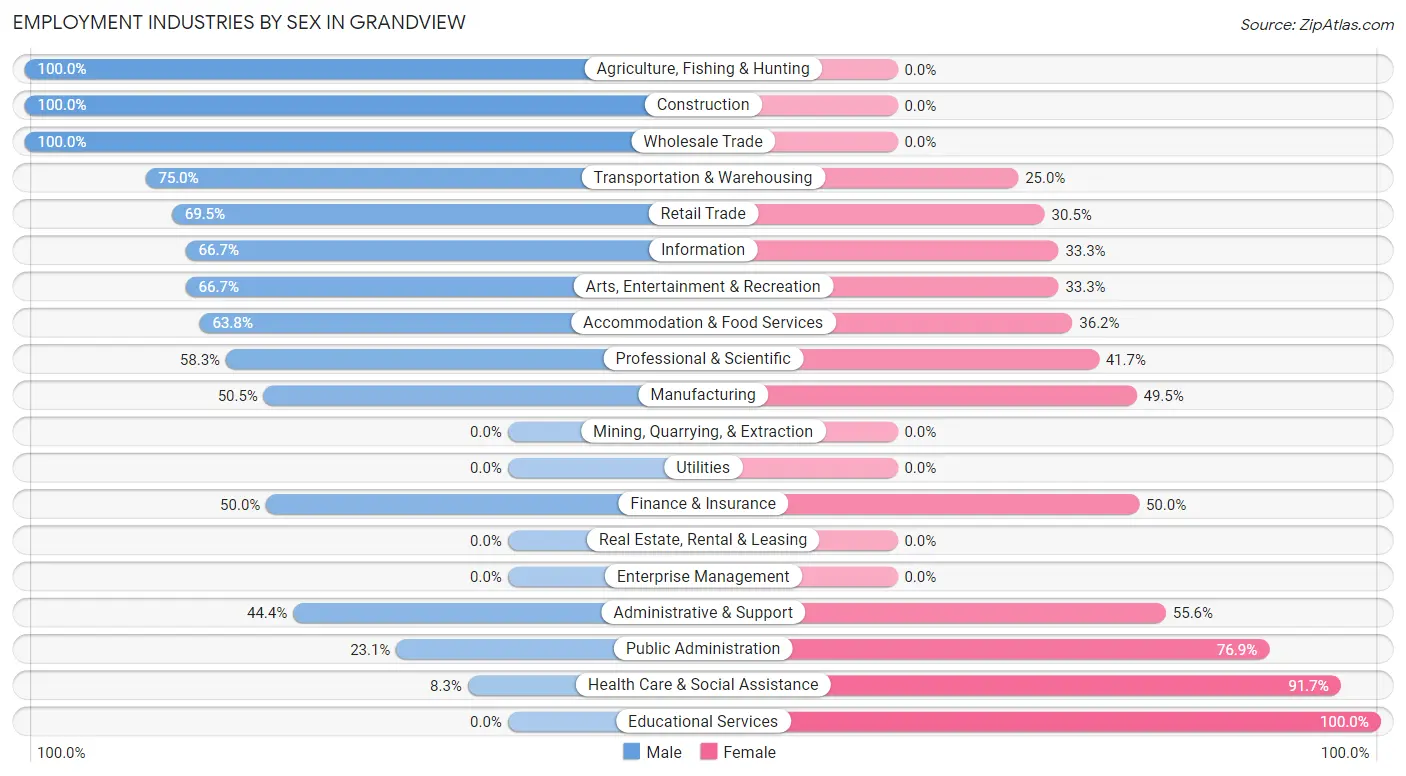
Employment Industries by Sex in Grandview
The Grandview industries that see more men than women are Agriculture, Fishing & Hunting (100.0%), Construction (100.0%), and Wholesale Trade (100.0%), whereas the industries that tend to have a higher number of women are Educational Services (100.0%), Health Care & Social Assistance (91.7%), and Public Administration (76.9%).
| Industry | Male | Female |
| Agriculture, Fishing & Hunting | 16 (100.0%) | 0 (0.0%) |
| Mining, Quarrying, & Extraction | 0 (0.0%) | 0 (0.0%) |
| Construction | 17 (100.0%) | 0 (0.0%) |
| Manufacturing | 50 (50.5%) | 49 (49.5%) |
| Wholesale Trade | 7 (100.0%) | 0 (0.0%) |
| Retail Trade | 73 (69.5%) | 32 (30.5%) |
| Transportation & Warehousing | 27 (75.0%) | 9 (25.0%) |
| Utilities | 0 (0.0%) | 0 (0.0%) |
| Information | 12 (66.7%) | 6 (33.3%) |
| Finance & Insurance | 11 (50.0%) | 11 (50.0%) |
| Real Estate, Rental & Leasing | 0 (0.0%) | 0 (0.0%) |
| Professional & Scientific | 7 (58.3%) | 5 (41.7%) |
| Enterprise Management | 0 (0.0%) | 0 (0.0%) |
| Administrative & Support | 4 (44.4%) | 5 (55.6%) |
| Educational Services | 0 (0.0%) | 38 (100.0%) |
| Health Care & Social Assistance | 14 (8.3%) | 155 (91.7%) |
| Arts, Entertainment & Recreation | 2 (66.7%) | 1 (33.3%) |
| Accommodation & Food Services | 37 (63.8%) | 21 (36.2%) |
| Public Administration | 9 (23.1%) | 30 (76.9%) |
| Total | 313 (45.8%) | 370 (54.2%) |
Education in Grandview
School Enrollment in Grandview
The most common levels of schooling among the 288 students in Grandview are high school (80 | 27.8%), college / undergraduate (63 | 21.9%), and elementary school (60 | 20.8%).
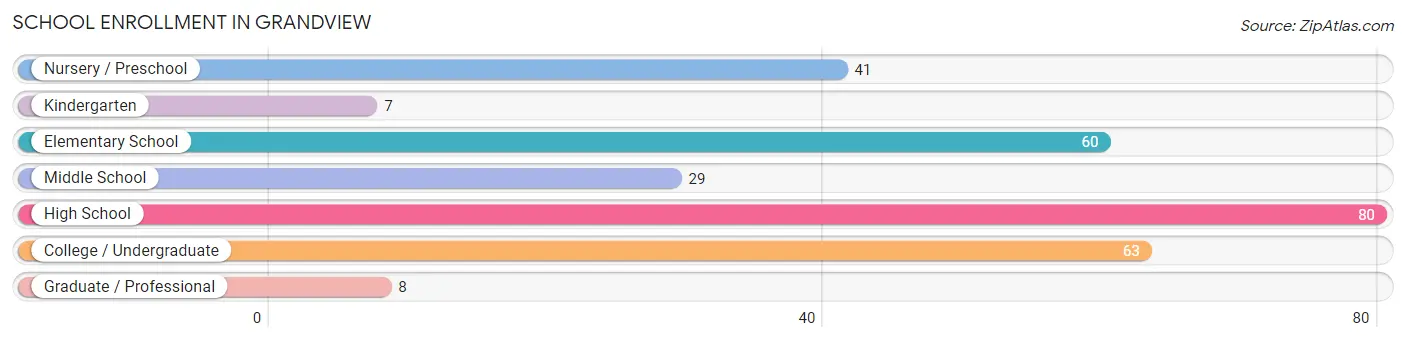
| School Level | # Students | % Students |
| Nursery / Preschool | 41 | 14.2% |
| Kindergarten | 7 | 2.4% |
| Elementary School | 60 | 20.8% |
| Middle School | 29 | 10.1% |
| High School | 80 | 27.8% |
| College / Undergraduate | 63 | 21.9% |
| Graduate / Professional | 8 | 2.8% |
| Total | 288 | 100.0% |
School Enrollment by Age by Funding Source in Grandview
Out of a total of 288 students who are enrolled in schools in Grandview, 31 (10.8%) attend a private institution, while the remaining 257 (89.2%) are enrolled in public schools. The age group of 35 years and over has the highest likelihood of being enrolled in private schools, with 3 (50.0% in the age bracket) enrolled. Conversely, the age group of 15 to 17 year olds has the lowest likelihood of being enrolled in a private school, with 65 (100.0% in the age bracket) attending a public institution.
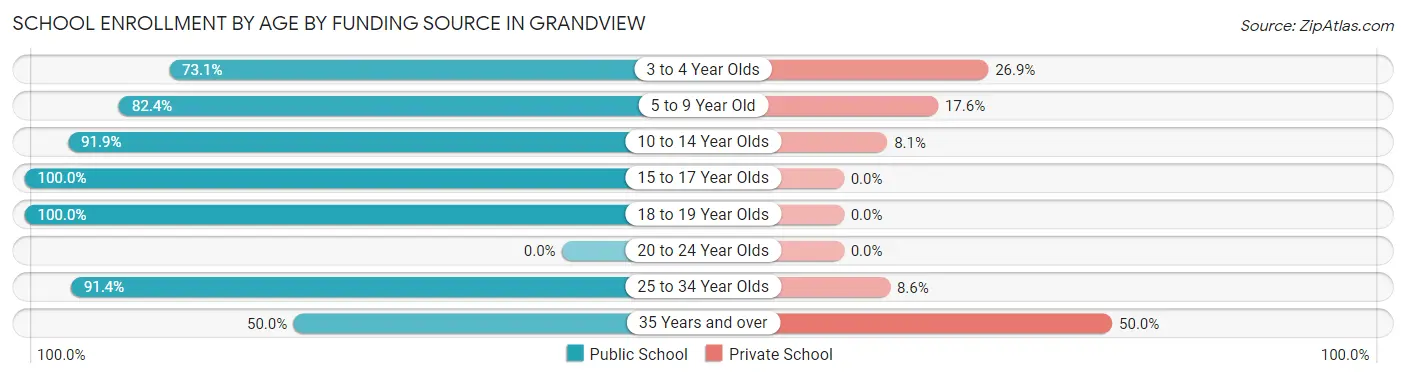
| Age Bracket | Public School | Private School |
| 3 to 4 Year Olds | 19 (73.1%) | 7 (26.9%) |
| 5 to 9 Year Old | 61 (82.4%) | 13 (17.6%) |
| 10 to 14 Year Olds | 34 (91.9%) | 3 (8.1%) |
| 15 to 17 Year Olds | 65 (100.0%) | 0 (0.0%) |
| 18 to 19 Year Olds | 22 (100.0%) | 0 (0.0%) |
| 20 to 24 Year Olds | 0 (0.0%) | 0 (0.0%) |
| 25 to 34 Year Olds | 53 (91.4%) | 5 (8.6%) |
| 35 Years and over | 3 (50.0%) | 3 (50.0%) |
| Total | 257 (89.2%) | 31 (10.8%) |
Educational Attainment by Field of Study in Grandview
Science & technology (38 | 33.6%), education (18 | 15.9%), business (16 | 14.2%), arts & humanities (7 | 6.2%), and multidisciplinary studies (6 | 5.3%) are the most common fields of study among 113 individuals in Grandview who have obtained a bachelor's degree or higher.
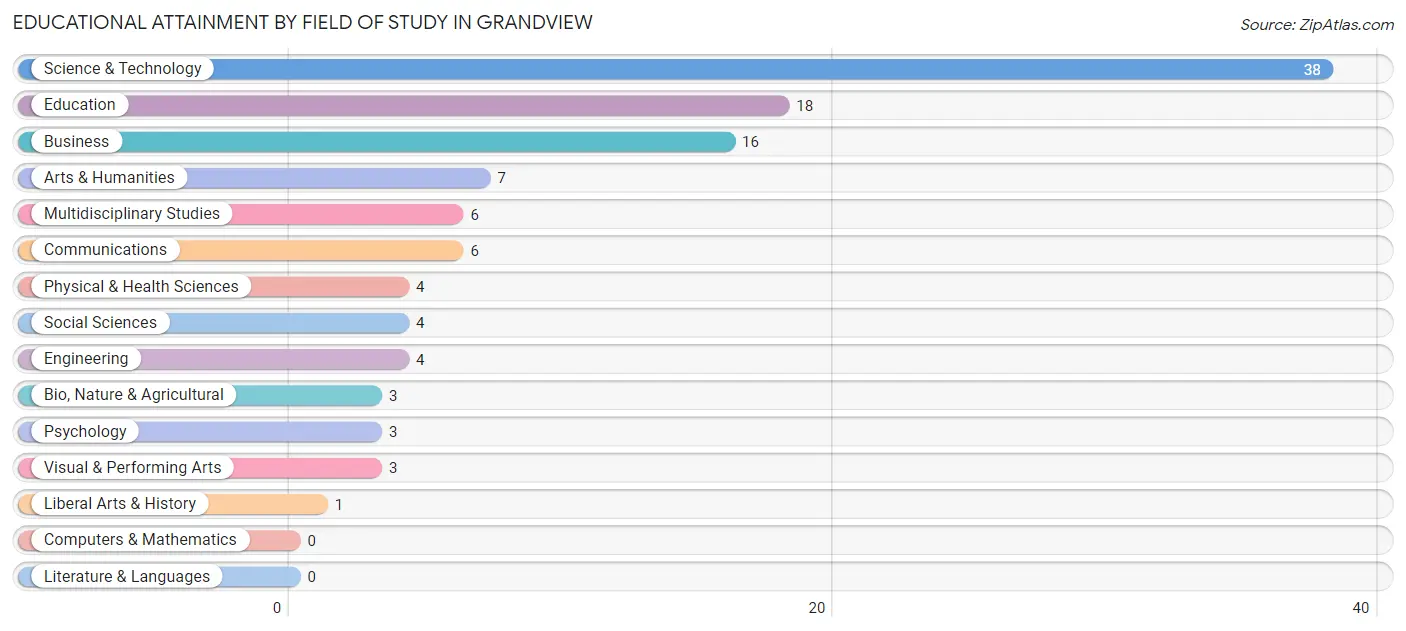
| Field of Study | # Graduates | % Graduates |
| Computers & Mathematics | 0 | 0.0% |
| Bio, Nature & Agricultural | 3 | 2.6% |
| Physical & Health Sciences | 4 | 3.5% |
| Psychology | 3 | 2.6% |
| Social Sciences | 4 | 3.5% |
| Engineering | 4 | 3.5% |
| Multidisciplinary Studies | 6 | 5.3% |
| Science & Technology | 38 | 33.6% |
| Business | 16 | 14.2% |
| Education | 18 | 15.9% |
| Literature & Languages | 0 | 0.0% |
| Liberal Arts & History | 1 | 0.9% |
| Visual & Performing Arts | 3 | 2.6% |
| Communications | 6 | 5.3% |
| Arts & Humanities | 7 | 6.2% |
| Total | 113 | 100.0% |
Transportation & Commute in Grandview
Vehicle Availability by Sex in Grandview
The most prevalent vehicle ownership categories in Grandview are males with 3 vehicles (130, accounting for 42.6%) and females with 3 vehicles (104, making up 35.1%).
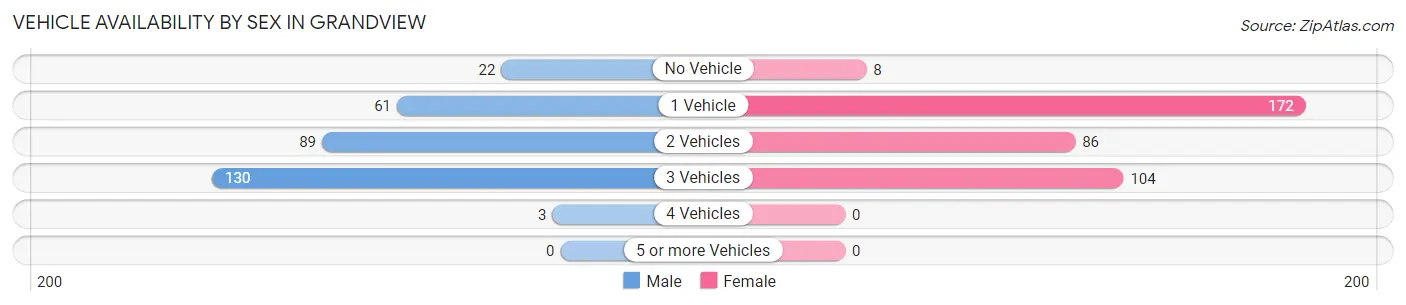
| Vehicles Available | Male | Female |
| No Vehicle | 22 (7.2%) | 8 (2.2%) |
| 1 Vehicle | 61 (20.0%) | 172 (46.5%) |
| 2 Vehicles | 89 (29.2%) | 86 (23.2%) |
| 3 Vehicles | 130 (42.6%) | 104 (28.1%) |
| 4 Vehicles | 3 (1.0%) | 0 (0.0%) |
| 5 or more Vehicles | 0 (0.0%) | 0 (0.0%) |
| Total | 305 (100.0%) | 370 (100.0%) |
Commute Time in Grandview
The most frequently occuring commute durations in Grandview are 15 to 19 minutes (174 commuters, 27.2%), 5 to 9 minutes (144 commuters, 22.5%), and 10 to 14 minutes (125 commuters, 19.5%).
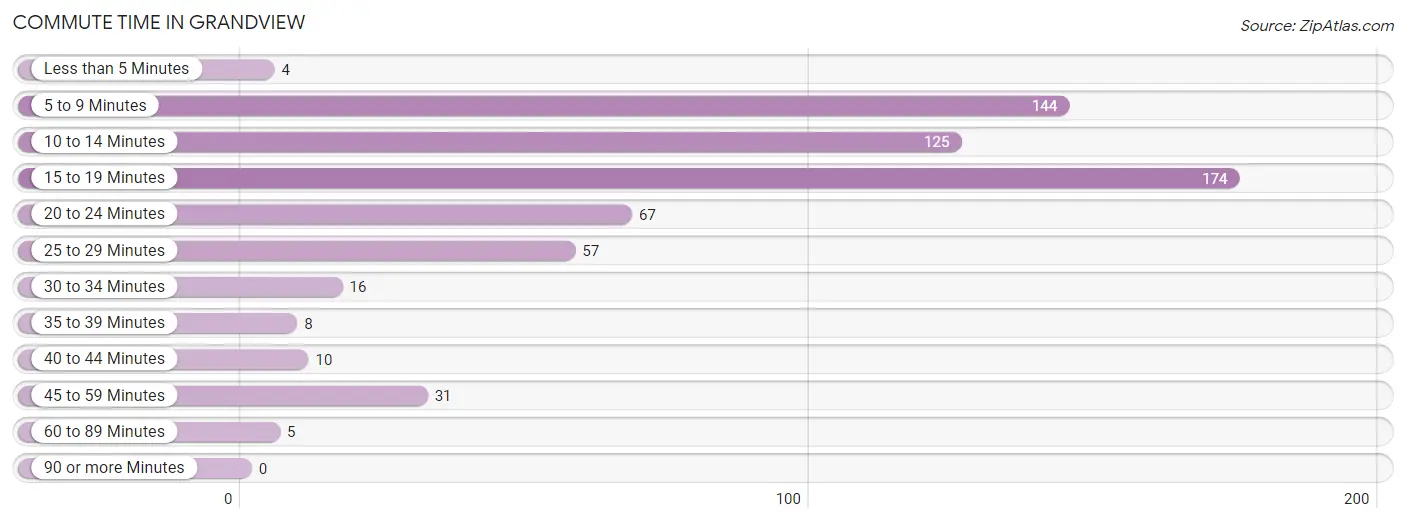
| Commute Time | # Commuters | % Commuters |
| Less than 5 Minutes | 4 | 0.6% |
| 5 to 9 Minutes | 144 | 22.5% |
| 10 to 14 Minutes | 125 | 19.5% |
| 15 to 19 Minutes | 174 | 27.2% |
| 20 to 24 Minutes | 67 | 10.4% |
| 25 to 29 Minutes | 57 | 8.9% |
| 30 to 34 Minutes | 16 | 2.5% |
| 35 to 39 Minutes | 8 | 1.3% |
| 40 to 44 Minutes | 10 | 1.6% |
| 45 to 59 Minutes | 31 | 4.8% |
| 60 to 89 Minutes | 5 | 0.8% |
| 90 or more Minutes | 0 | 0.0% |
Commute Time by Sex in Grandview
The most common commute times in Grandview are 10 to 14 minutes (94 commuters, 32.6%) for males and 15 to 19 minutes (109 commuters, 30.9%) for females.
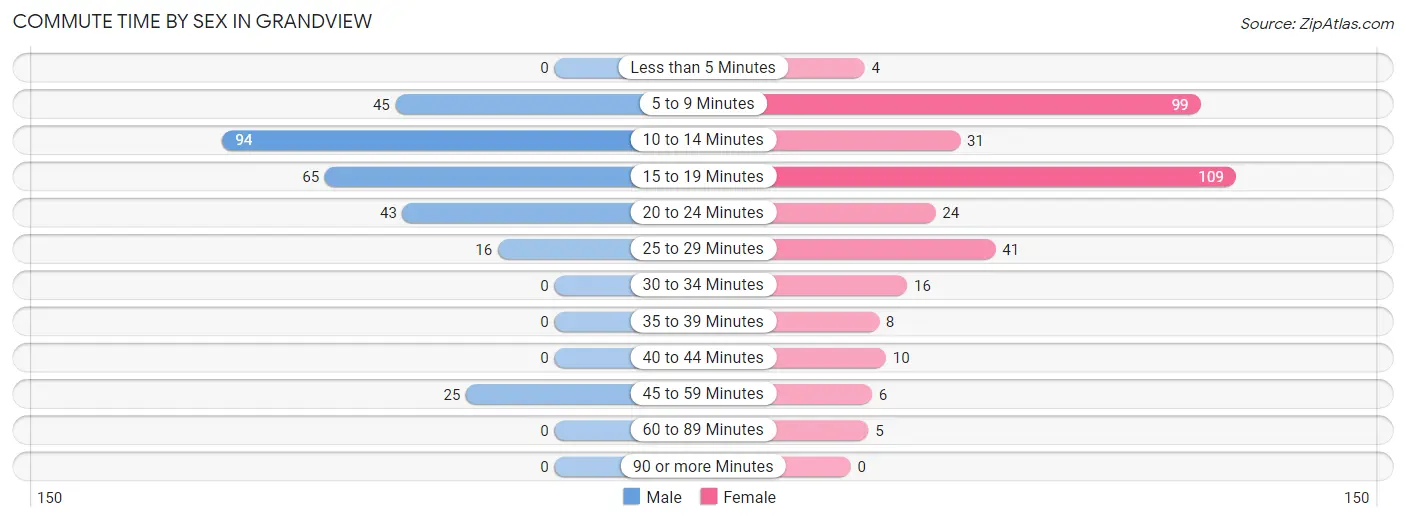
| Commute Time | Male | Female |
| Less than 5 Minutes | 0 (0.0%) | 4 (1.1%) |
| 5 to 9 Minutes | 45 (15.6%) | 99 (28.1%) |
| 10 to 14 Minutes | 94 (32.6%) | 31 (8.8%) |
| 15 to 19 Minutes | 65 (22.6%) | 109 (30.9%) |
| 20 to 24 Minutes | 43 (14.9%) | 24 (6.8%) |
| 25 to 29 Minutes | 16 (5.6%) | 41 (11.6%) |
| 30 to 34 Minutes | 0 (0.0%) | 16 (4.5%) |
| 35 to 39 Minutes | 0 (0.0%) | 8 (2.3%) |
| 40 to 44 Minutes | 0 (0.0%) | 10 (2.8%) |
| 45 to 59 Minutes | 25 (8.7%) | 6 (1.7%) |
| 60 to 89 Minutes | 0 (0.0%) | 5 (1.4%) |
| 90 or more Minutes | 0 (0.0%) | 0 (0.0%) |
Time of Departure to Work by Sex in Grandview
The most frequent times of departure to work in Grandview are 12:00 PM to 3:59 PM (66, 22.9%) for males and 7:00 AM to 7:29 AM (82, 23.2%) for females.
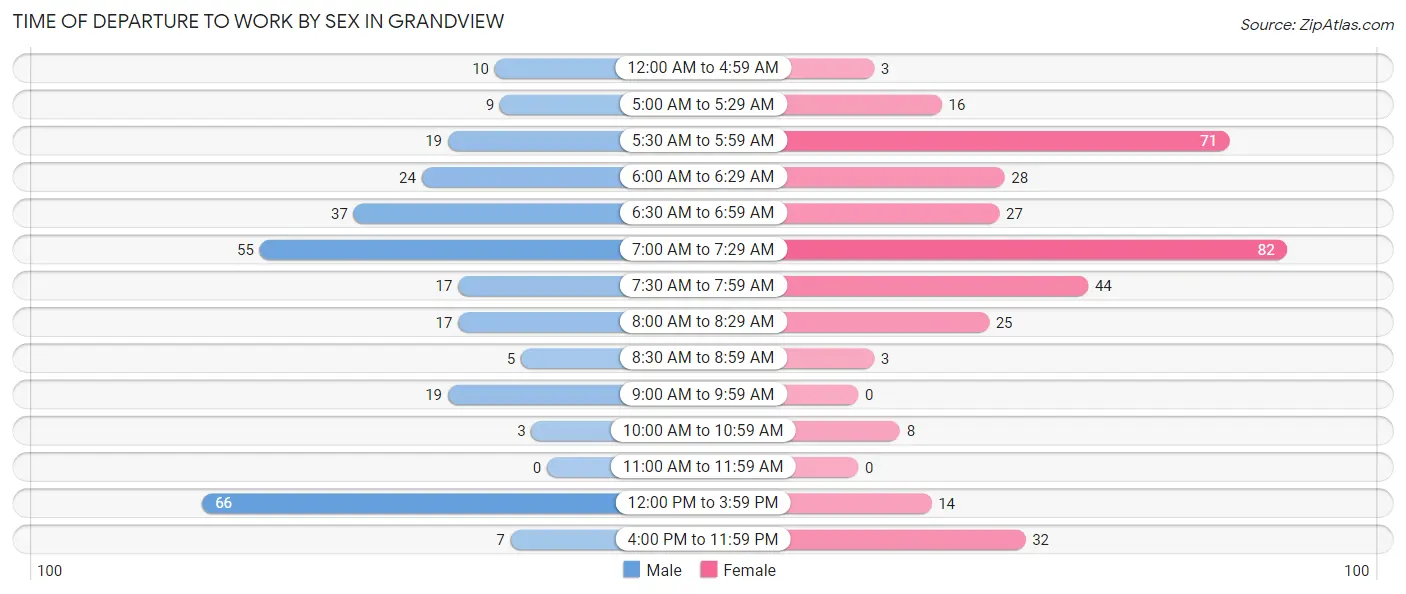
| Time of Departure | Male | Female |
| 12:00 AM to 4:59 AM | 10 (3.5%) | 3 (0.9%) |
| 5:00 AM to 5:29 AM | 9 (3.1%) | 16 (4.5%) |
| 5:30 AM to 5:59 AM | 19 (6.6%) | 71 (20.1%) |
| 6:00 AM to 6:29 AM | 24 (8.3%) | 28 (7.9%) |
| 6:30 AM to 6:59 AM | 37 (12.9%) | 27 (7.6%) |
| 7:00 AM to 7:29 AM | 55 (19.1%) | 82 (23.2%) |
| 7:30 AM to 7:59 AM | 17 (5.9%) | 44 (12.5%) |
| 8:00 AM to 8:29 AM | 17 (5.9%) | 25 (7.1%) |
| 8:30 AM to 8:59 AM | 5 (1.7%) | 3 (0.9%) |
| 9:00 AM to 9:59 AM | 19 (6.6%) | 0 (0.0%) |
| 10:00 AM to 10:59 AM | 3 (1.0%) | 8 (2.3%) |
| 11:00 AM to 11:59 AM | 0 (0.0%) | 0 (0.0%) |
| 12:00 PM to 3:59 PM | 66 (22.9%) | 14 (4.0%) |
| 4:00 PM to 11:59 PM | 7 (2.4%) | 32 (9.1%) |
| Total | 288 (100.0%) | 353 (100.0%) |
Housing Occupancy in Grandview
Occupancy by Ownership in Grandview
Of the total 612 dwellings in Grandview, owner-occupied units account for 383 (62.6%), while renter-occupied units make up 229 (37.4%).
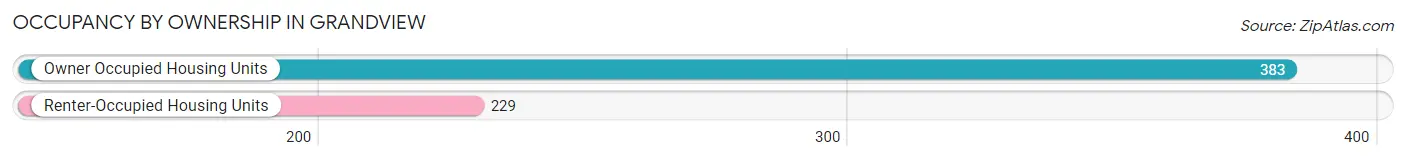
| Occupancy | # Housing Units | % Housing Units |
| Owner Occupied Housing Units | 383 | 62.6% |
| Renter-Occupied Housing Units | 229 | 37.4% |
| Total Occupied Housing Units | 612 | 100.0% |
Occupancy by Household Size in Grandview
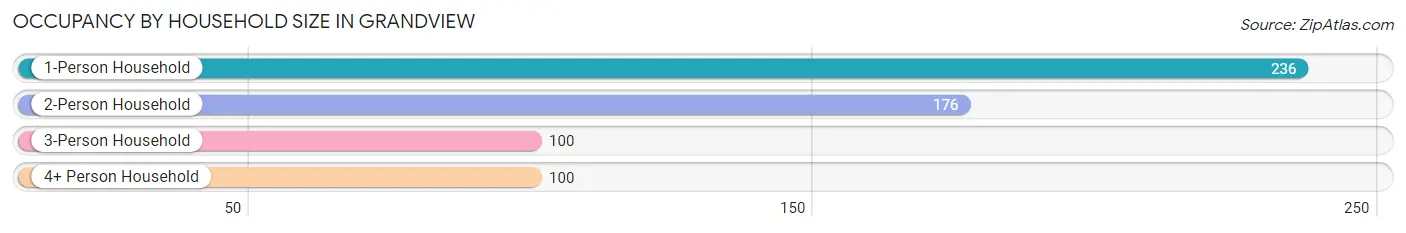
| Household Size | # Housing Units | % Housing Units |
| 1-Person Household | 236 | 38.6% |
| 2-Person Household | 176 | 28.8% |
| 3-Person Household | 100 | 16.3% |
| 4+ Person Household | 100 | 16.3% |
| Total Housing Units | 612 | 100.0% |
Occupancy by Ownership by Household Size in Grandview
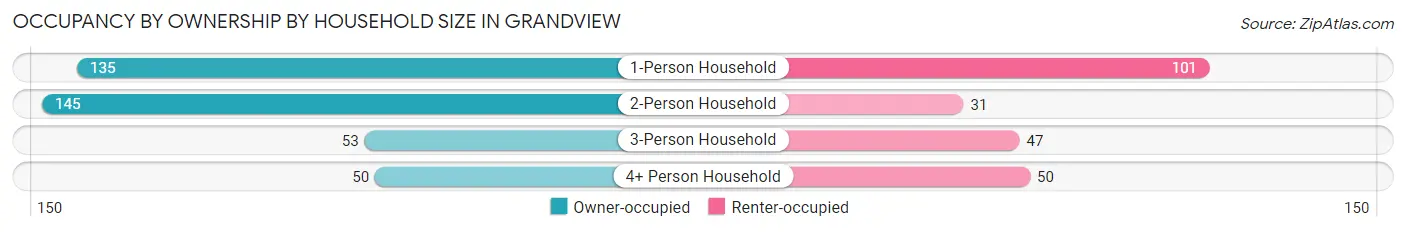
| Household Size | Owner-occupied | Renter-occupied |
| 1-Person Household | 135 (57.2%) | 101 (42.8%) |
| 2-Person Household | 145 (82.4%) | 31 (17.6%) |
| 3-Person Household | 53 (53.0%) | 47 (47.0%) |
| 4+ Person Household | 50 (50.0%) | 50 (50.0%) |
| Total Housing Units | 383 (62.6%) | 229 (37.4%) |
Occupancy by Educational Attainment in Grandview
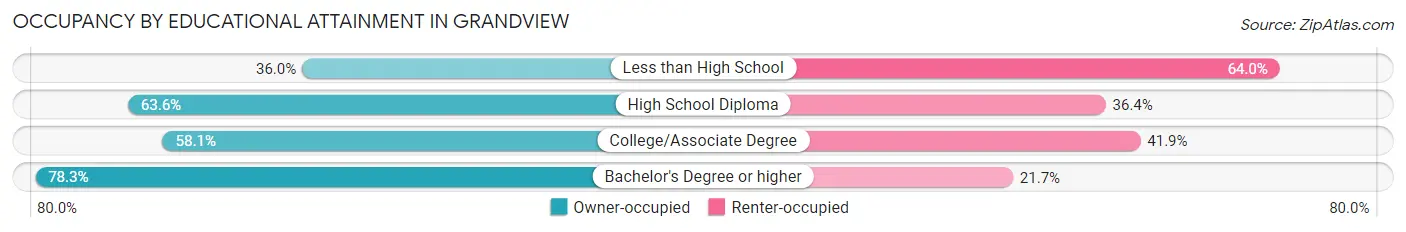
| Household Size | Owner-occupied | Renter-occupied |
| Less than High School | 9 (36.0%) | 16 (64.0%) |
| High School Diploma | 187 (63.6%) | 107 (36.4%) |
| College/Associate Degree | 122 (58.1%) | 88 (41.9%) |
| Bachelor's Degree or higher | 65 (78.3%) | 18 (21.7%) |
Occupancy by Age of Householder in Grandview
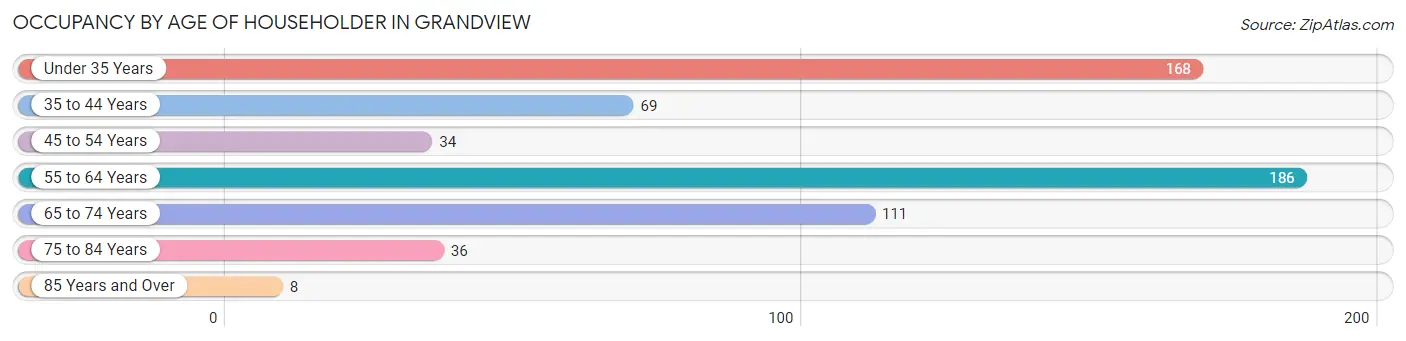
| Age Bracket | # Households | % Households |
| Under 35 Years | 168 | 27.5% |
| 35 to 44 Years | 69 | 11.3% |
| 45 to 54 Years | 34 | 5.6% |
| 55 to 64 Years | 186 | 30.4% |
| 65 to 74 Years | 111 | 18.1% |
| 75 to 84 Years | 36 | 5.9% |
| 85 Years and Over | 8 | 1.3% |
| Total | 612 | 100.0% |
Housing Finances in Grandview
Median Income by Occupancy in Grandview
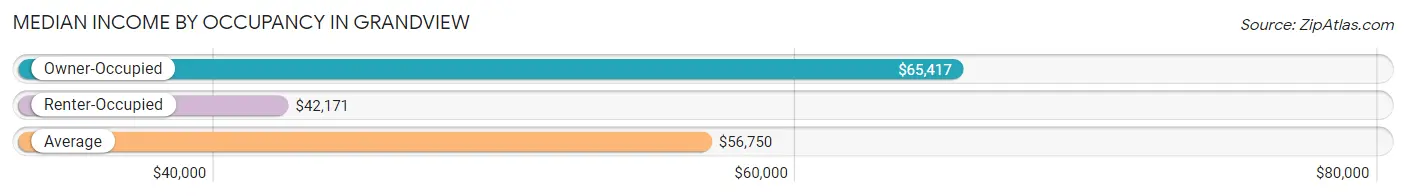
| Occupancy Type | # Households | Median Income |
| Owner-Occupied | 383 (62.6%) | $65,417 |
| Renter-Occupied | 229 (37.4%) | $42,171 |
| Average | 612 (100.0%) | $56,750 |
Occupancy by Householder Income Bracket in Grandview
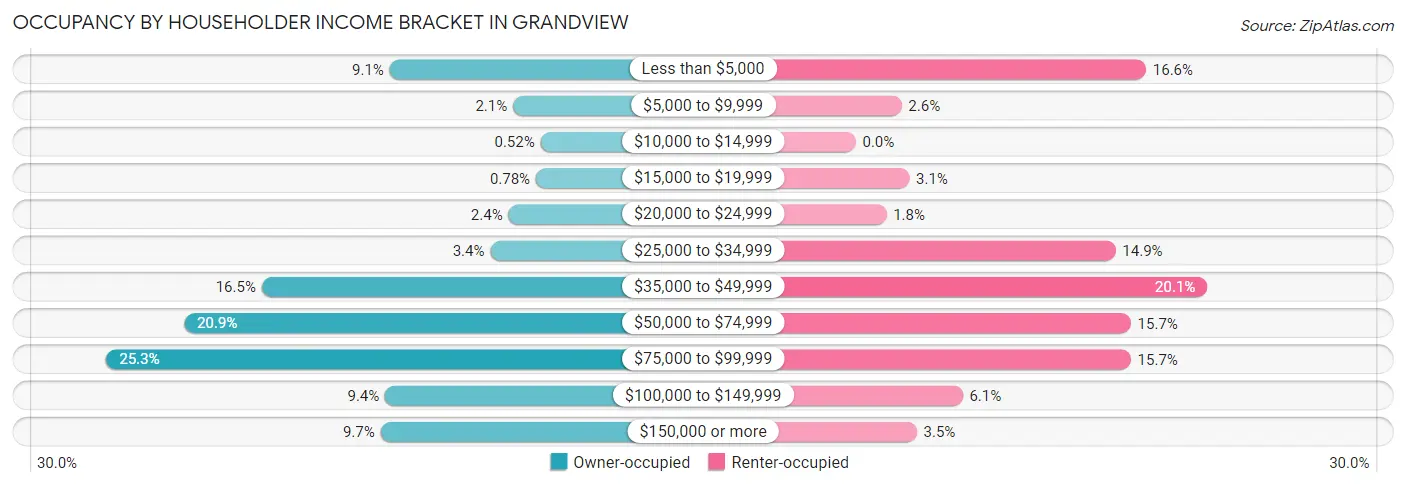
| Income Bracket | Owner-occupied | Renter-occupied |
| Less than $5,000 | 35 (9.1%) | 38 (16.6%) |
| $5,000 to $9,999 | 8 (2.1%) | 6 (2.6%) |
| $10,000 to $14,999 | 2 (0.5%) | 0 (0.0%) |
| $15,000 to $19,999 | 3 (0.8%) | 7 (3.1%) |
| $20,000 to $24,999 | 9 (2.4%) | 4 (1.8%) |
| $25,000 to $34,999 | 13 (3.4%) | 34 (14.8%) |
| $35,000 to $49,999 | 63 (16.5%) | 46 (20.1%) |
| $50,000 to $74,999 | 80 (20.9%) | 36 (15.7%) |
| $75,000 to $99,999 | 97 (25.3%) | 36 (15.7%) |
| $100,000 to $149,999 | 36 (9.4%) | 14 (6.1%) |
| $150,000 or more | 37 (9.7%) | 8 (3.5%) |
| Total | 383 (100.0%) | 229 (100.0%) |
Monthly Housing Cost Tiers in Grandview
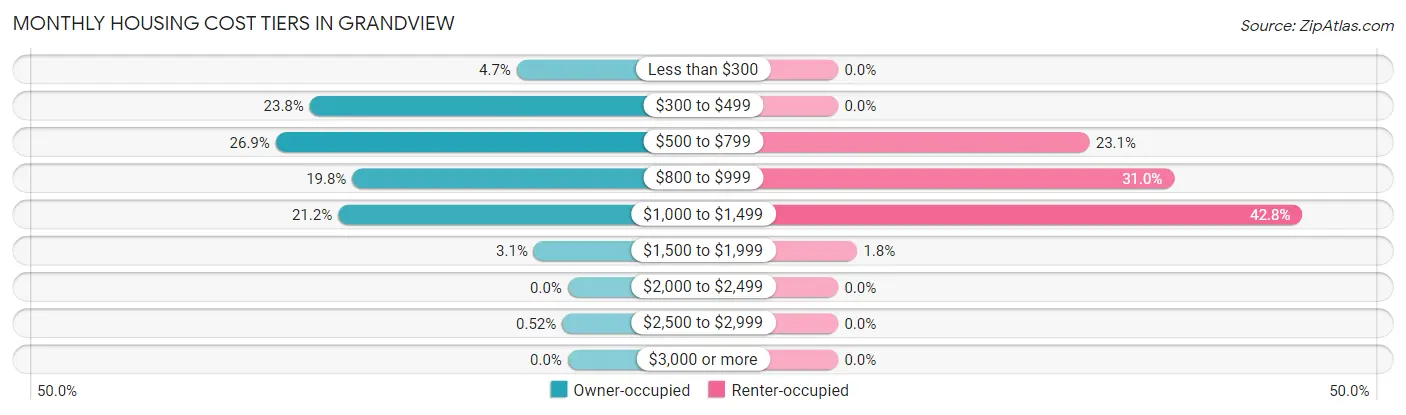
| Monthly Cost | Owner-occupied | Renter-occupied |
| Less than $300 | 18 (4.7%) | 0 (0.0%) |
| $300 to $499 | 91 (23.8%) | 0 (0.0%) |
| $500 to $799 | 103 (26.9%) | 53 (23.1%) |
| $800 to $999 | 76 (19.8%) | 71 (31.0%) |
| $1,000 to $1,499 | 81 (21.1%) | 98 (42.8%) |
| $1,500 to $1,999 | 12 (3.1%) | 4 (1.8%) |
| $2,000 to $2,499 | 0 (0.0%) | 0 (0.0%) |
| $2,500 to $2,999 | 2 (0.5%) | 0 (0.0%) |
| $3,000 or more | 0 (0.0%) | 0 (0.0%) |
| Total | 383 (100.0%) | 229 (100.0%) |
Physical Housing Characteristics in Grandview
Housing Structures in Grandview
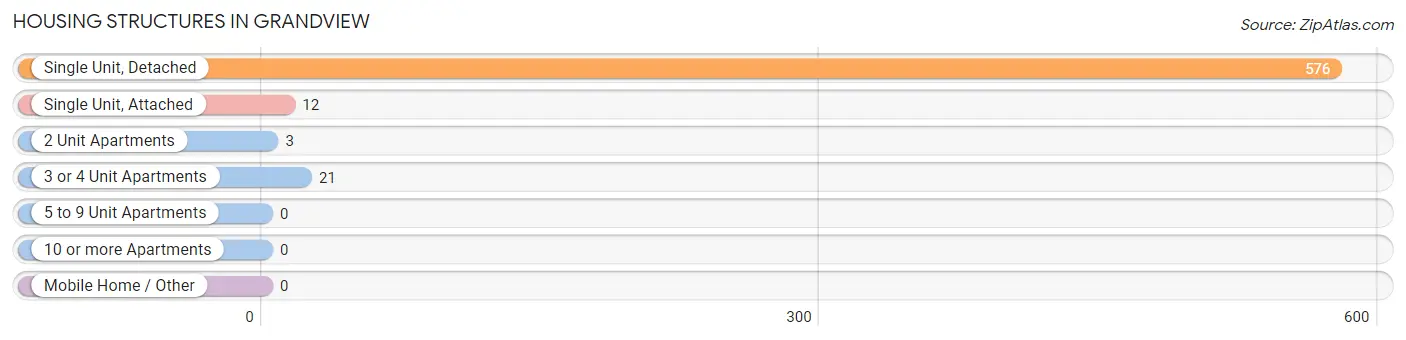
| Structure Type | # Housing Units | % Housing Units |
| Single Unit, Detached | 576 | 94.1% |
| Single Unit, Attached | 12 | 2.0% |
| 2 Unit Apartments | 3 | 0.5% |
| 3 or 4 Unit Apartments | 21 | 3.4% |
| 5 to 9 Unit Apartments | 0 | 0.0% |
| 10 or more Apartments | 0 | 0.0% |
| Mobile Home / Other | 0 | 0.0% |
| Total | 612 | 100.0% |
Housing Structures by Occupancy in Grandview
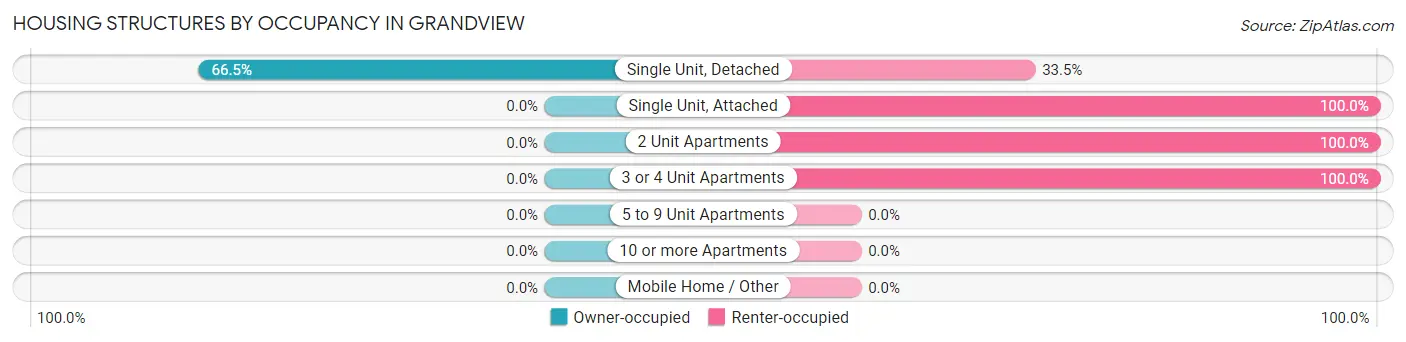
| Structure Type | Owner-occupied | Renter-occupied |
| Single Unit, Detached | 383 (66.5%) | 193 (33.5%) |
| Single Unit, Attached | 0 (0.0%) | 12 (100.0%) |
| 2 Unit Apartments | 0 (0.0%) | 3 (100.0%) |
| 3 or 4 Unit Apartments | 0 (0.0%) | 21 (100.0%) |
| 5 to 9 Unit Apartments | 0 (0.0%) | 0 (0.0%) |
| 10 or more Apartments | 0 (0.0%) | 0 (0.0%) |
| Mobile Home / Other | 0 (0.0%) | 0 (0.0%) |
| Total | 383 (62.6%) | 229 (37.4%) |
Housing Structures by Number of Rooms in Grandview
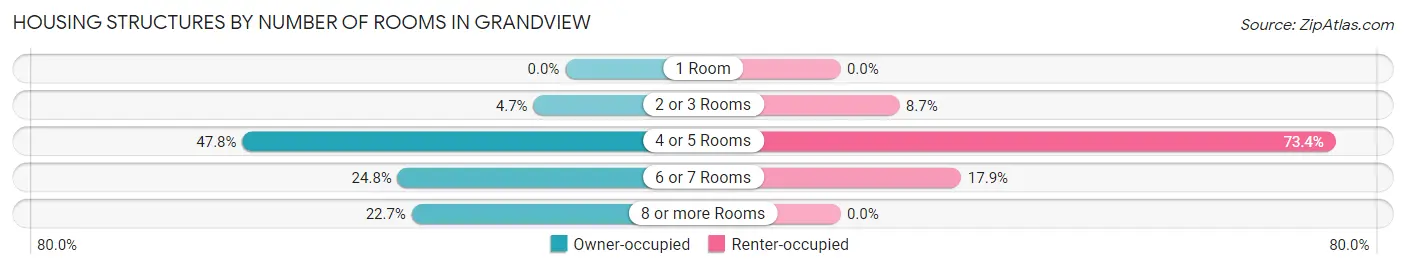
| Number of Rooms | Owner-occupied | Renter-occupied |
| 1 Room | 0 (0.0%) | 0 (0.0%) |
| 2 or 3 Rooms | 18 (4.7%) | 20 (8.7%) |
| 4 or 5 Rooms | 183 (47.8%) | 168 (73.4%) |
| 6 or 7 Rooms | 95 (24.8%) | 41 (17.9%) |
| 8 or more Rooms | 87 (22.7%) | 0 (0.0%) |
| Total | 383 (100.0%) | 229 (100.0%) |
Housing Structure by Heating Type in Grandview
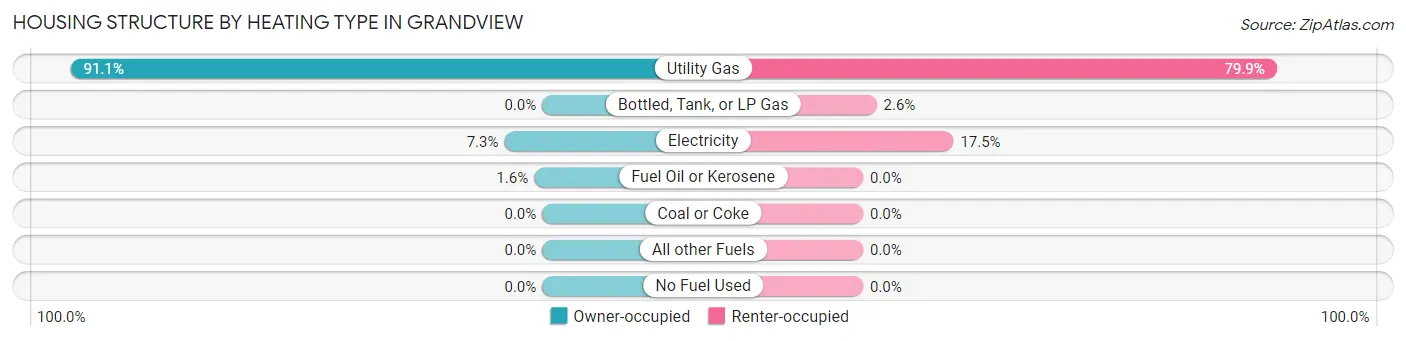
| Heating Type | Owner-occupied | Renter-occupied |
| Utility Gas | 349 (91.1%) | 183 (79.9%) |
| Bottled, Tank, or LP Gas | 0 (0.0%) | 6 (2.6%) |
| Electricity | 28 (7.3%) | 40 (17.5%) |
| Fuel Oil or Kerosene | 6 (1.6%) | 0 (0.0%) |
| Coal or Coke | 0 (0.0%) | 0 (0.0%) |
| All other Fuels | 0 (0.0%) | 0 (0.0%) |
| No Fuel Used | 0 (0.0%) | 0 (0.0%) |
| Total | 383 (100.0%) | 229 (100.0%) |
Household Vehicle Usage in Grandview
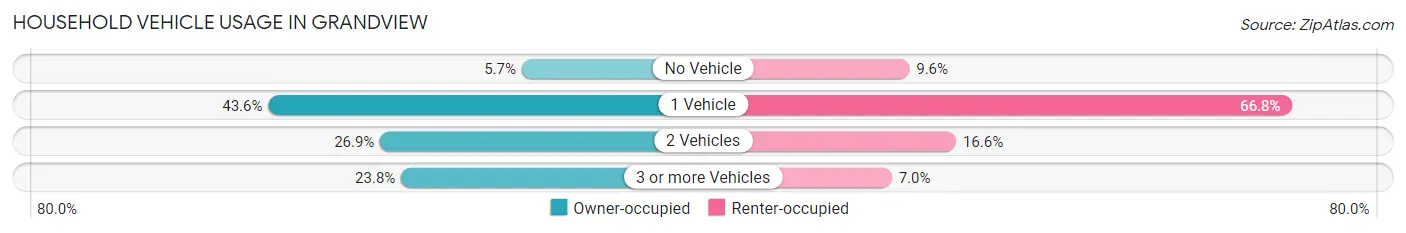
| Vehicles per Household | Owner-occupied | Renter-occupied |
| No Vehicle | 22 (5.7%) | 22 (9.6%) |
| 1 Vehicle | 167 (43.6%) | 153 (66.8%) |
| 2 Vehicles | 103 (26.9%) | 38 (16.6%) |
| 3 or more Vehicles | 91 (23.8%) | 16 (7.0%) |
| Total | 383 (100.0%) | 229 (100.0%) |
Real Estate & Mortgages in Grandview
Real Estate and Mortgage Overview in Grandview
| Characteristic | Without Mortgage | With Mortgage |
| Housing Units | 140 | 243 |
| Median Property Value | $69,700 | $74,600 |
| Median Household Income | $67,500 | $27 |
| Monthly Housing Costs | $455 | $0 |
| Real Estate Taxes | $1,191 | $6 |
Property Value by Mortgage Status in Grandview
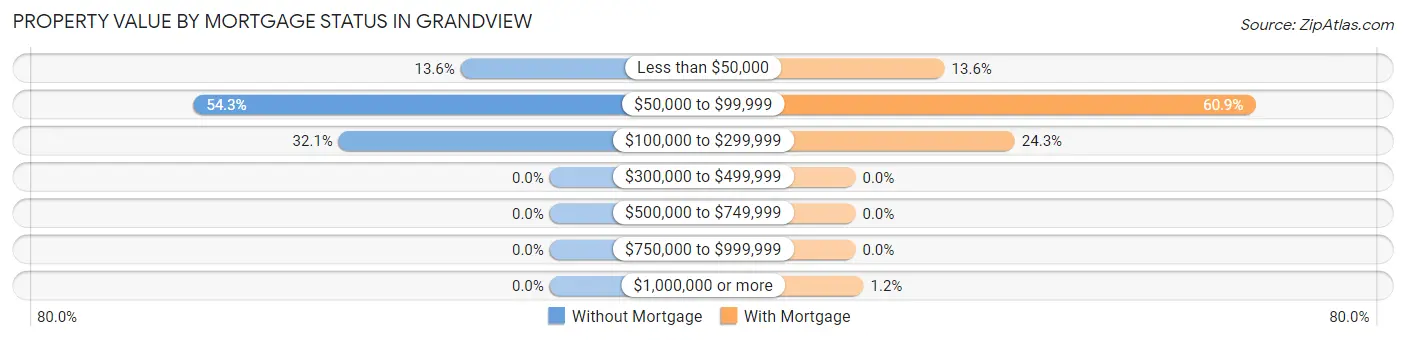
| Property Value | Without Mortgage | With Mortgage |
| Less than $50,000 | 19 (13.6%) | 33 (13.6%) |
| $50,000 to $99,999 | 76 (54.3%) | 148 (60.9%) |
| $100,000 to $299,999 | 45 (32.1%) | 59 (24.3%) |
| $300,000 to $499,999 | 0 (0.0%) | 0 (0.0%) |
| $500,000 to $749,999 | 0 (0.0%) | 0 (0.0%) |
| $750,000 to $999,999 | 0 (0.0%) | 0 (0.0%) |
| $1,000,000 or more | 0 (0.0%) | 3 (1.2%) |
| Total | 140 (100.0%) | 243 (100.0%) |
Household Income by Mortgage Status in Grandview
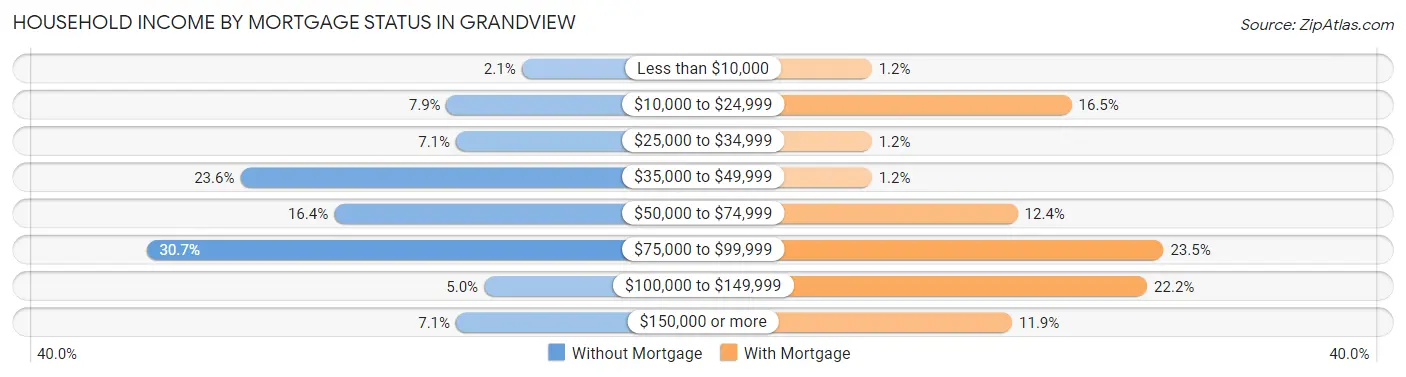
| Household Income | Without Mortgage | With Mortgage |
| Less than $10,000 | 3 (2.1%) | 3 (1.2%) |
| $10,000 to $24,999 | 11 (7.9%) | 40 (16.5%) |
| $25,000 to $34,999 | 10 (7.1%) | 3 (1.2%) |
| $35,000 to $49,999 | 33 (23.6%) | 3 (1.2%) |
| $50,000 to $74,999 | 23 (16.4%) | 30 (12.3%) |
| $75,000 to $99,999 | 43 (30.7%) | 57 (23.5%) |
| $100,000 to $149,999 | 7 (5.0%) | 54 (22.2%) |
| $150,000 or more | 10 (7.1%) | 29 (11.9%) |
| Total | 140 (100.0%) | 243 (100.0%) |
Property Value to Household Income Ratio in Grandview
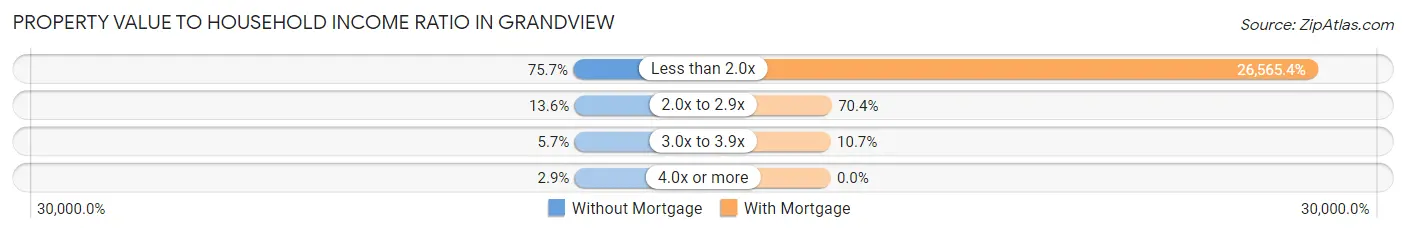
| Value-to-Income Ratio | Without Mortgage | With Mortgage |
| Less than 2.0x | 106 (75.7%) | 64,554 (26,565.4%) |
| 2.0x to 2.9x | 19 (13.6%) | 171 (70.4%) |
| 3.0x to 3.9x | 8 (5.7%) | 26 (10.7%) |
| 4.0x or more | 4 (2.9%) | 0 (0.0%) |
| Total | 140 (100.0%) | 243 (100.0%) |
Real Estate Taxes by Mortgage Status in Grandview
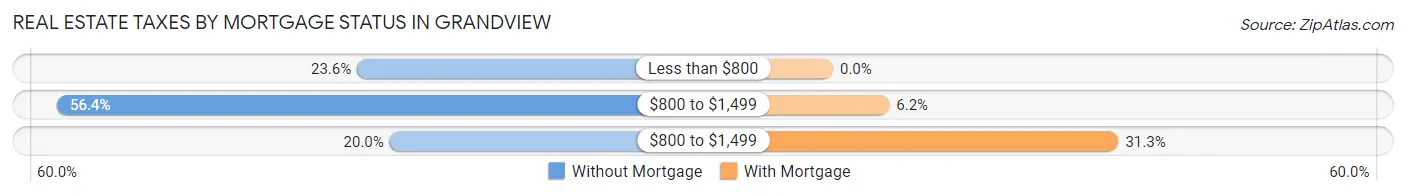
| Property Taxes | Without Mortgage | With Mortgage |
| Less than $800 | 33 (23.6%) | 0 (0.0%) |
| $800 to $1,499 | 79 (56.4%) | 15 (6.2%) |
| $800 to $1,499 | 28 (20.0%) | 76 (31.3%) |
| Total | 140 (100.0%) | 243 (100.0%) |
Health & Disability in Grandview
Health Insurance Coverage by Age in Grandview
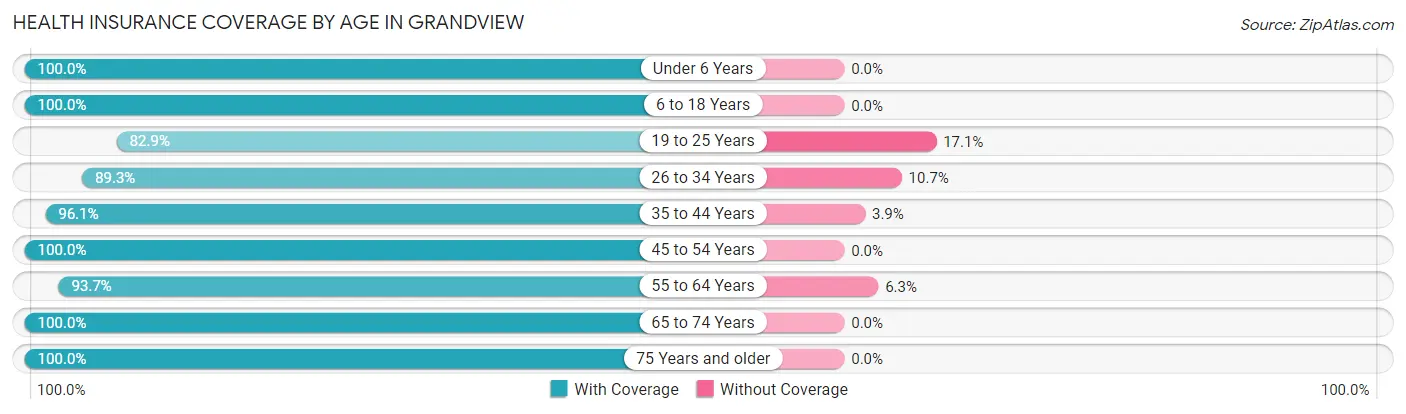
| Age Bracket | With Coverage | Without Coverage |
| Under 6 Years | 80 (100.0%) | 0 (0.0%) |
| 6 to 18 Years | 188 (100.0%) | 0 (0.0%) |
| 19 to 25 Years | 58 (82.9%) | 12 (17.1%) |
| 26 to 34 Years | 217 (89.3%) | 26 (10.7%) |
| 35 to 44 Years | 174 (96.1%) | 7 (3.9%) |
| 45 to 54 Years | 124 (100.0%) | 0 (0.0%) |
| 55 to 64 Years | 267 (93.7%) | 18 (6.3%) |
| 65 to 74 Years | 136 (100.0%) | 0 (0.0%) |
| 75 Years and older | 84 (100.0%) | 0 (0.0%) |
| Total | 1,328 (95.5%) | 63 (4.5%) |
Health Insurance Coverage by Citizenship Status in Grandview

| Citizenship Status | With Coverage | Without Coverage |
| Native Born | 80 (100.0%) | 0 (0.0%) |
| Foreign Born, Citizen | 188 (100.0%) | 0 (0.0%) |
| Foreign Born, not a Citizen | 58 (82.9%) | 12 (17.1%) |
Health Insurance Coverage by Household Income in Grandview
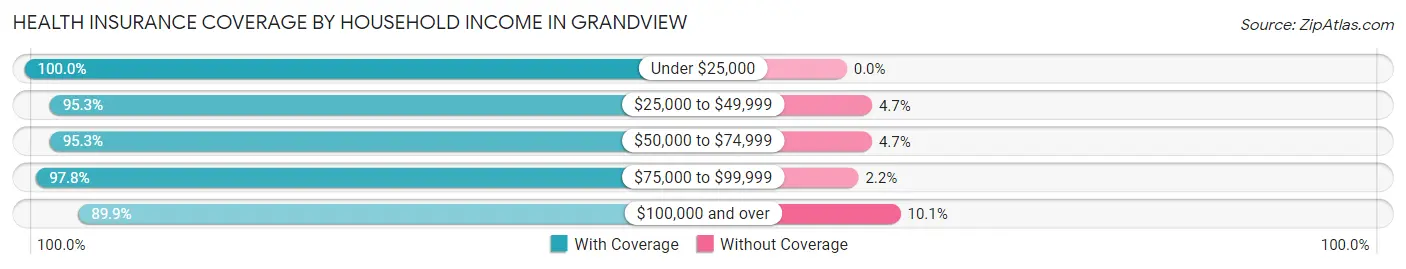
| Household Income | With Coverage | Without Coverage |
| Under $25,000 | 175 (100.0%) | 0 (0.0%) |
| $25,000 to $49,999 | 303 (95.3%) | 15 (4.7%) |
| $50,000 to $74,999 | 243 (95.3%) | 12 (4.7%) |
| $75,000 to $99,999 | 357 (97.8%) | 8 (2.2%) |
| $100,000 and over | 250 (89.9%) | 28 (10.1%) |
Public vs Private Health Insurance Coverage by Age in Grandview
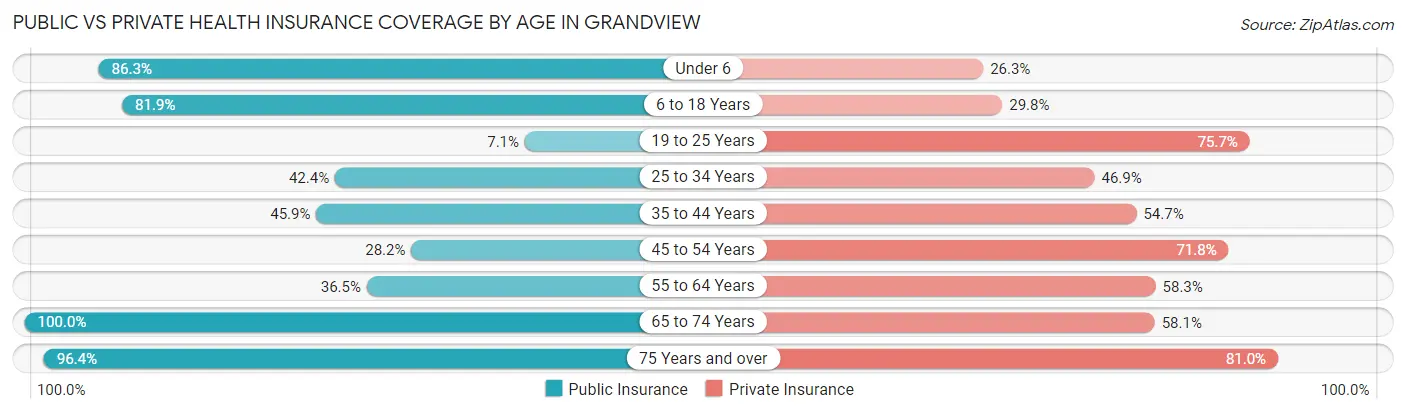
| Age Bracket | Public Insurance | Private Insurance |
| Under 6 | 69 (86.3%) | 21 (26.3%) |
| 6 to 18 Years | 154 (81.9%) | 56 (29.8%) |
| 19 to 25 Years | 5 (7.1%) | 53 (75.7%) |
| 25 to 34 Years | 103 (42.4%) | 114 (46.9%) |
| 35 to 44 Years | 83 (45.9%) | 99 (54.7%) |
| 45 to 54 Years | 35 (28.2%) | 89 (71.8%) |
| 55 to 64 Years | 104 (36.5%) | 166 (58.3%) |
| 65 to 74 Years | 136 (100.0%) | 79 (58.1%) |
| 75 Years and over | 81 (96.4%) | 68 (80.9%) |
| Total | 770 (55.4%) | 745 (53.6%) |
Disability Status by Sex by Age in Grandview
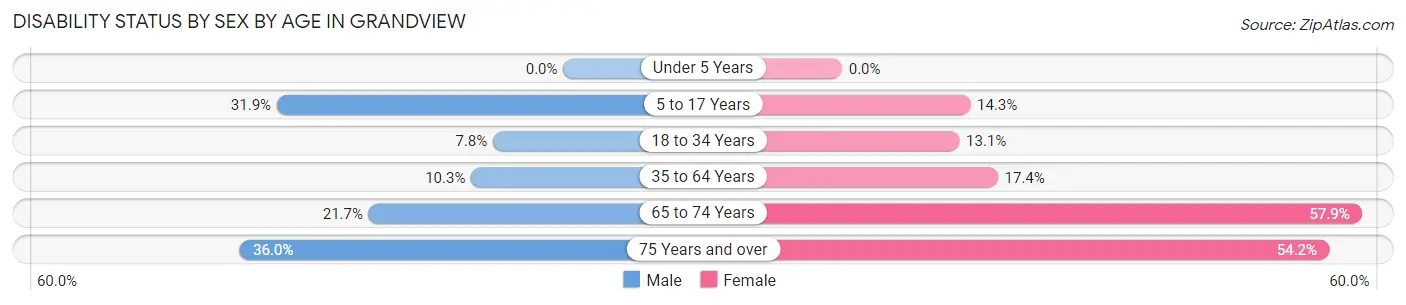
| Age Bracket | Male | Female |
| Under 5 Years | 0 (0.0%) | 0 (0.0%) |
| 5 to 17 Years | 37 (31.9%) | 9 (14.3%) |
| 18 to 34 Years | 13 (7.8%) | 23 (13.1%) |
| 35 to 64 Years | 28 (10.3%) | 55 (17.3%) |
| 65 to 74 Years | 13 (21.7%) | 44 (57.9%) |
| 75 Years and over | 9 (36.0%) | 32 (54.2%) |
Disability Class by Sex by Age in Grandview
Disability Class: Hearing Difficulty
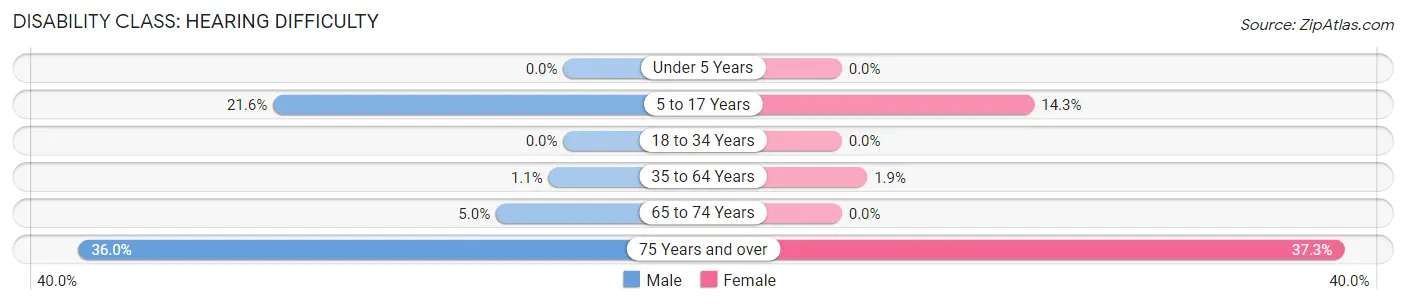
| Age Bracket | Male | Female |
| Under 5 Years | 0 (0.0%) | 0 (0.0%) |
| 5 to 17 Years | 25 (21.5%) | 9 (14.3%) |
| 18 to 34 Years | 0 (0.0%) | 0 (0.0%) |
| 35 to 64 Years | 3 (1.1%) | 6 (1.9%) |
| 65 to 74 Years | 3 (5.0%) | 0 (0.0%) |
| 75 Years and over | 9 (36.0%) | 22 (37.3%) |
Disability Class: Vision Difficulty
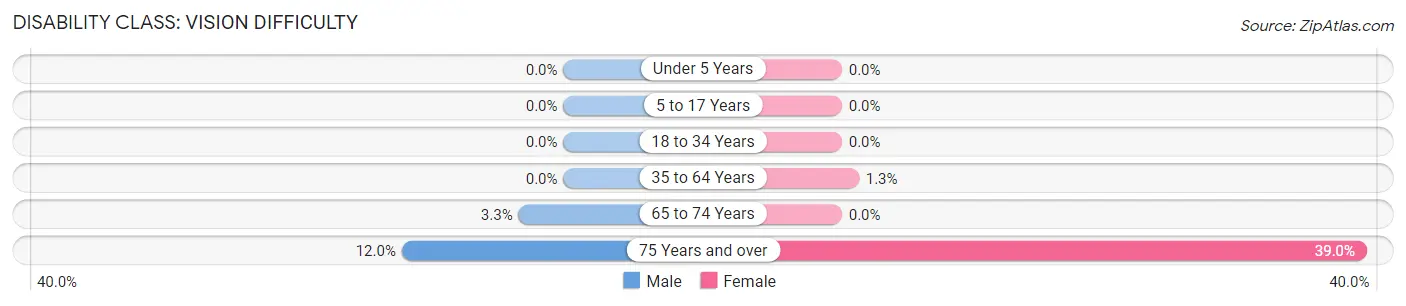
| Age Bracket | Male | Female |
| Under 5 Years | 0 (0.0%) | 0 (0.0%) |
| 5 to 17 Years | 0 (0.0%) | 0 (0.0%) |
| 18 to 34 Years | 0 (0.0%) | 0 (0.0%) |
| 35 to 64 Years | 0 (0.0%) | 4 (1.3%) |
| 65 to 74 Years | 2 (3.3%) | 0 (0.0%) |
| 75 Years and over | 3 (12.0%) | 23 (39.0%) |
Disability Class: Cognitive Difficulty
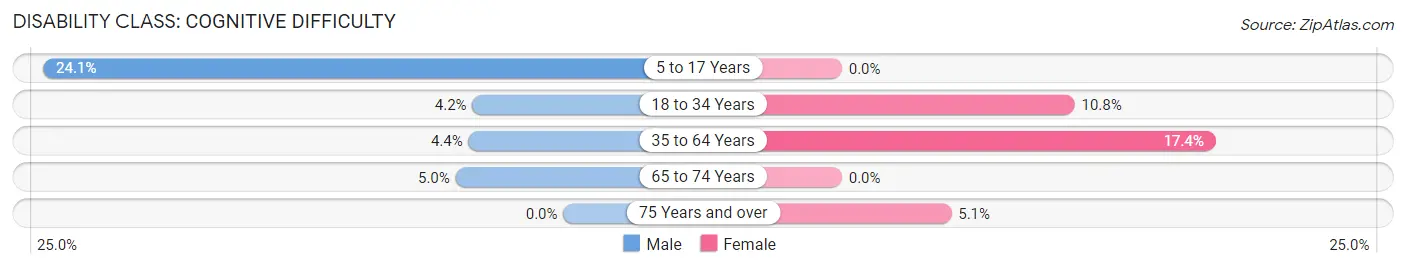
| Age Bracket | Male | Female |
| 5 to 17 Years | 28 (24.1%) | 0 (0.0%) |
| 18 to 34 Years | 7 (4.2%) | 19 (10.8%) |
| 35 to 64 Years | 12 (4.4%) | 55 (17.3%) |
| 65 to 74 Years | 3 (5.0%) | 0 (0.0%) |
| 75 Years and over | 0 (0.0%) | 3 (5.1%) |
Disability Class: Ambulatory Difficulty
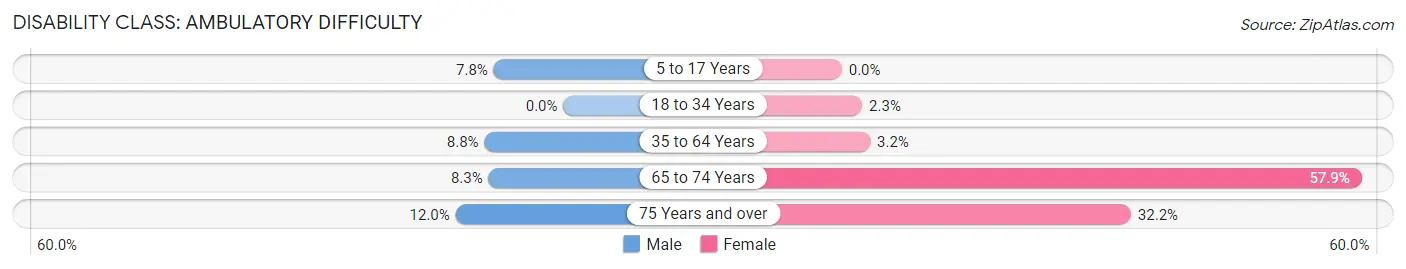
| Age Bracket | Male | Female |
| 5 to 17 Years | 9 (7.8%) | 0 (0.0%) |
| 18 to 34 Years | 0 (0.0%) | 4 (2.3%) |
| 35 to 64 Years | 24 (8.8%) | 10 (3.2%) |
| 65 to 74 Years | 5 (8.3%) | 44 (57.9%) |
| 75 Years and over | 3 (12.0%) | 19 (32.2%) |
Disability Class: Self-Care Difficulty
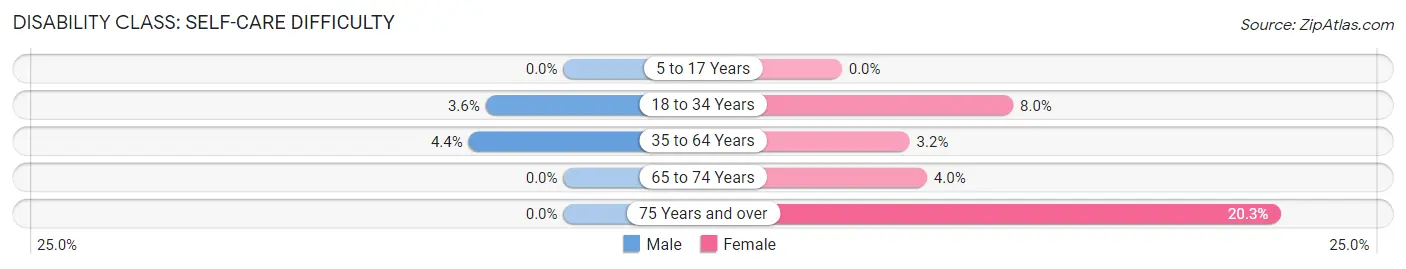
| Age Bracket | Male | Female |
| 5 to 17 Years | 0 (0.0%) | 0 (0.0%) |
| 18 to 34 Years | 6 (3.6%) | 14 (8.0%) |
| 35 to 64 Years | 12 (4.4%) | 10 (3.2%) |
| 65 to 74 Years | 0 (0.0%) | 3 (4.0%) |
| 75 Years and over | 0 (0.0%) | 12 (20.3%) |
Technology Access in Grandview
Computing Device Access in Grandview
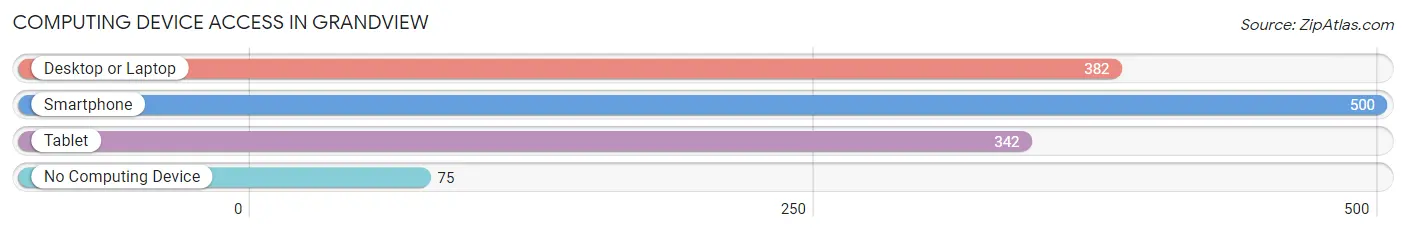
| Device Type | # Households | % Households |
| Desktop or Laptop | 382 | 62.4% |
| Smartphone | 500 | 81.7% |
| Tablet | 342 | 55.9% |
| No Computing Device | 75 | 12.2% |
| Total | 612 | 100.0% |
Internet Access in Grandview
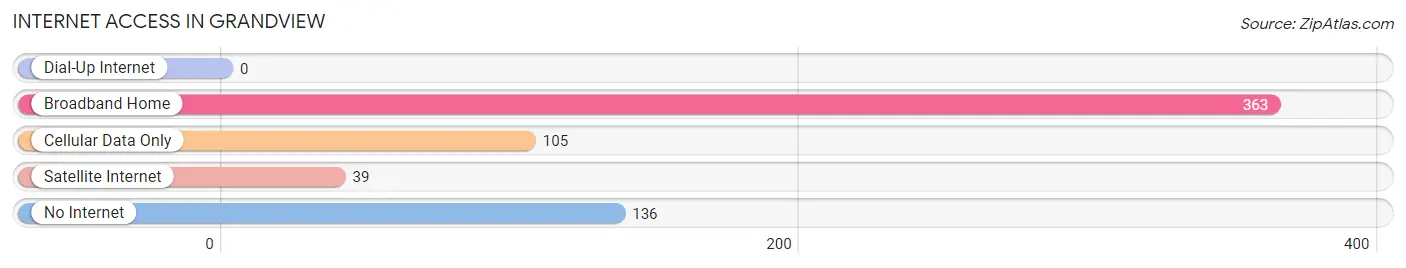
| Internet Type | # Households | % Households |
| Dial-Up Internet | 0 | 0.0% |
| Broadband Home | 363 | 59.3% |
| Cellular Data Only | 105 | 17.2% |
| Satellite Internet | 39 | 6.4% |
| No Internet | 136 | 22.2% |
| Total | 612 | 100.0% |
Grandview Summary
Geography
Grandview is a small village located in the state of Illinois, in the United States. It is situated in the northern part of the state, in the county of Tazewell. Grandview is located at the intersection of two major highways, Interstate 74 and U.S. Route 24. The village is situated on the banks of the Illinois River, and is surrounded by rolling hills and farmland. The village is located approximately 30 miles east of Peoria, and is part of the Peoria Metropolitan Statistical Area.
History
Grandview was founded in 1837 by a group of settlers from Ohio. The village was originally known as Grandview Station, and was a stop on the Illinois Central Railroad. The village was officially incorporated in 1867, and the name was changed to Grandview. The village grew slowly over the years, and by the early 1900s, it had become a thriving agricultural community. The village was home to several grain elevators, a flour mill, and a number of other businesses.
In the 1950s, Grandview began to experience a period of growth and development. The village was home to several new businesses, including a grocery store, a hardware store, and a bank. The village also saw the construction of a new school, a library, and a post office.
Economy
Grandview is a small, rural village, and its economy is largely based on agriculture. The village is home to several grain elevators, and the surrounding area is home to many farms. The village is also home to several small businesses, including a grocery store, a hardware store, and a bank.
Demographics
As of the 2010 census, Grandview had a population of 1,845. The population is largely white, with a small percentage of African Americans and Hispanics. The median household income is $45,000, and the median home value is $90,000. The village is home to a number of churches, and the local school district serves the village and the surrounding area.
Common Questions
What is Per Capita Income in Grandview?
Per Capita income in Grandview is $30,502.
What is the Median Family Income in Grandview?
Median Family Income in Grandview is $58,958.
What is the Median Household income in Grandview?
Median Household Income in Grandview is $56,750.
What is Income or Wage Gap in Grandview?
Income or Wage Gap in Grandview is 14.9%.
Women in Grandview earn 85.1 cents for every dollar earned by a man.
What is Inequality or Gini Index in Grandview?
Inequality or Gini Index in Grandview is 0.43.
What is the Total Population of Grandview?
Total Population of Grandview is 1,391.
What is the Total Male Population of Grandview?
Total Male Population of Grandview is 678.
What is the Total Female Population of Grandview?
Total Female Population of Grandview is 713.
What is the Ratio of Males per 100 Females in Grandview?
There are 95.09 Males per 100 Females in Grandview.
What is the Ratio of Females per 100 Males in Grandview?
There are 105.16 Females per 100 Males in Grandview.
What is the Median Population Age in Grandview?
Median Population Age in Grandview is 42.0 Years.
What is the Average Family Size in Grandview
Average Family Size in Grandview is 2.8 People.
What is the Average Household Size in Grandview
Average Household Size in Grandview is 2.3 People.
How Large is the Labor Force in Grandview?
There are 751 People in the Labor Forcein in Grandview.
What is the Percentage of People in the Labor Force in Grandview?
63.9% of People are in the Labor Force in Grandview.
What is the Unemployment Rate in Grandview?
Unemployment Rate in Grandview is 9.1%.