Golden, IL Map & Demographics
Golden Map
Golden Overview
$28,572
PER CAPITA INCOME
$84,643
AVG FAMILY INCOME
$58,500
AVG HOUSEHOLD INCOME
30.4%
WAGE / INCOME GAP [ % ]
69.6¢/ $1
WAGE / INCOME GAP [ $ ]
0.40
INEQUALITY / GINI INDEX
771
TOTAL POPULATION
371
MALE POPULATION
400
FEMALE POPULATION
92.75
MALES / 100 FEMALES
107.82
FEMALES / 100 MALES
34.2
MEDIAN AGE
3.0
AVG FAMILY SIZE
2.3
AVG HOUSEHOLD SIZE
374
LABOR FORCE [ PEOPLE ]
61.2%
PERCENT IN LABOR FORCE
2.7%
UNEMPLOYMENT RATE
Golden Zip Codes
Golden Area Codes
Income in Golden
Income Overview in Golden
Per Capita Income in Golden is $28,572, while median incomes of families and households are $84,643 and $58,500 respectively.
| Characteristic | Number | Measure |
| Per Capita Income | 771 | $28,572 |
| Median Family Income | 200 | $84,643 |
| Mean Family Income | 200 | $86,537 |
| Median Household Income | 322 | $58,500 |
| Mean Household Income | 322 | $65,987 |
| Income Deficit | 200 | $0 |
| Wage / Income Gap (%) | 771 | 30.36% |
| Wage / Income Gap ($) | 771 | 69.64¢ per $1 |
| Gini / Inequality Index | 771 | 0.40 |
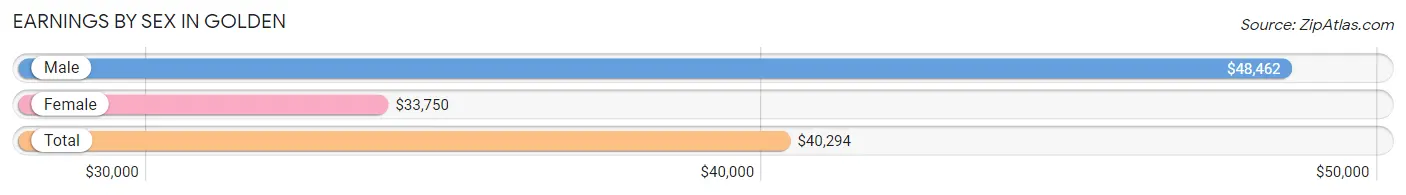
Earnings by Sex in Golden
Average Earnings in Golden are $40,294, $48,462 for men and $33,750 for women, a difference of 30.4%.
| Sex | Number | Average Earnings |
| Male | 196 (51.6%) | $48,462 |
| Female | 184 (48.4%) | $33,750 |
| Total | 380 (100.0%) | $40,294 |
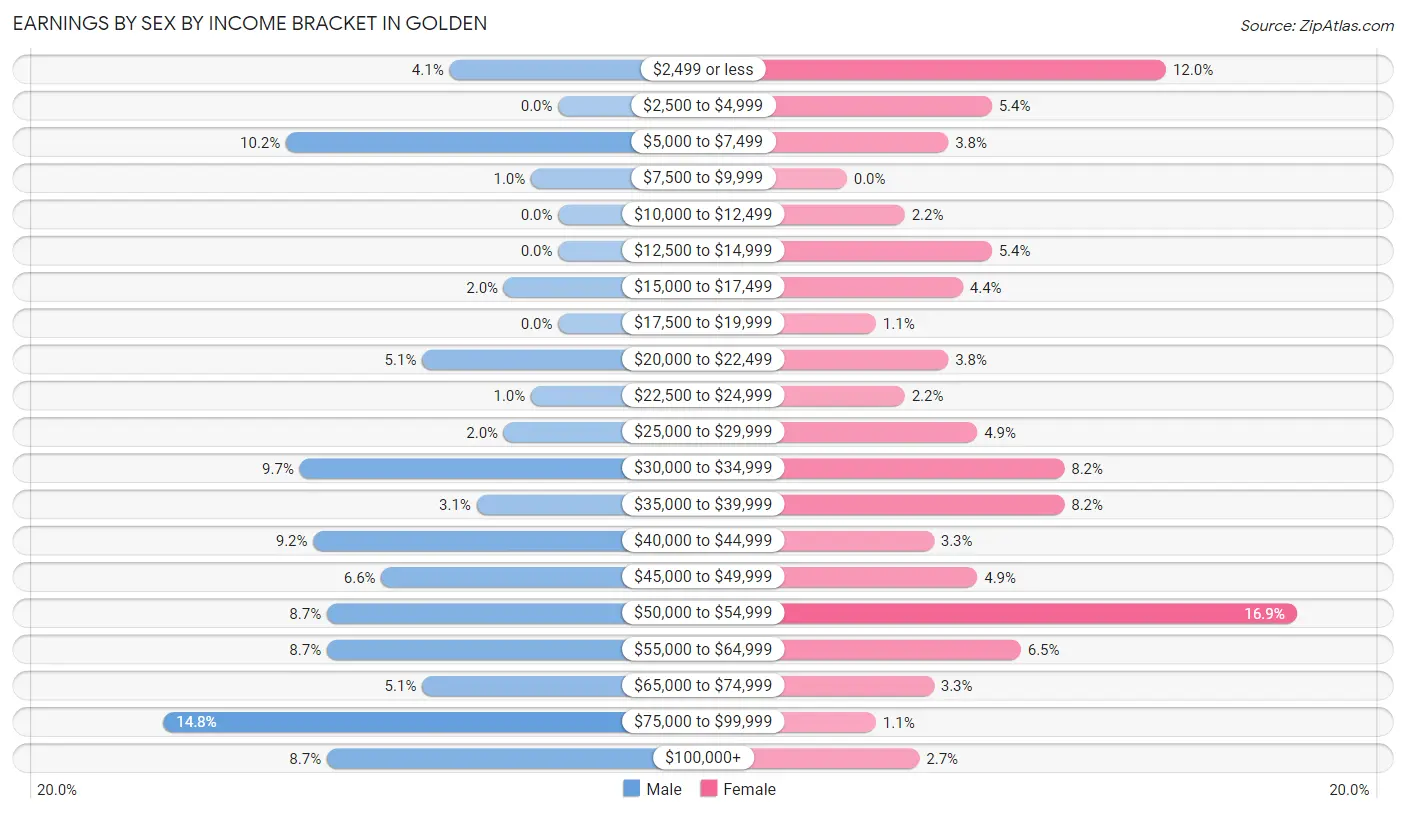
Earnings by Sex by Income Bracket in Golden
The most common earnings brackets in Golden are $75,000 to $99,999 for men (29 | 14.8%) and $50,000 to $54,999 for women (31 | 16.9%).
| Income | Male | Female |
| $2,499 or less | 8 (4.1%) | 22 (12.0%) |
| $2,500 to $4,999 | 0 (0.0%) | 10 (5.4%) |
| $5,000 to $7,499 | 20 (10.2%) | 7 (3.8%) |
| $7,500 to $9,999 | 2 (1.0%) | 0 (0.0%) |
| $10,000 to $12,499 | 0 (0.0%) | 4 (2.2%) |
| $12,500 to $14,999 | 0 (0.0%) | 10 (5.4%) |
| $15,000 to $17,499 | 4 (2.0%) | 8 (4.3%) |
| $17,500 to $19,999 | 0 (0.0%) | 2 (1.1%) |
| $20,000 to $22,499 | 10 (5.1%) | 7 (3.8%) |
| $22,500 to $24,999 | 2 (1.0%) | 4 (2.2%) |
| $25,000 to $29,999 | 4 (2.0%) | 9 (4.9%) |
| $30,000 to $34,999 | 19 (9.7%) | 15 (8.2%) |
| $35,000 to $39,999 | 6 (3.1%) | 15 (8.2%) |
| $40,000 to $44,999 | 18 (9.2%) | 6 (3.3%) |
| $45,000 to $49,999 | 13 (6.6%) | 9 (4.9%) |
| $50,000 to $54,999 | 17 (8.7%) | 31 (16.9%) |
| $55,000 to $64,999 | 17 (8.7%) | 12 (6.5%) |
| $65,000 to $74,999 | 10 (5.1%) | 6 (3.3%) |
| $75,000 to $99,999 | 29 (14.8%) | 2 (1.1%) |
| $100,000+ | 17 (8.7%) | 5 (2.7%) |
| Total | 196 (100.0%) | 184 (100.0%) |
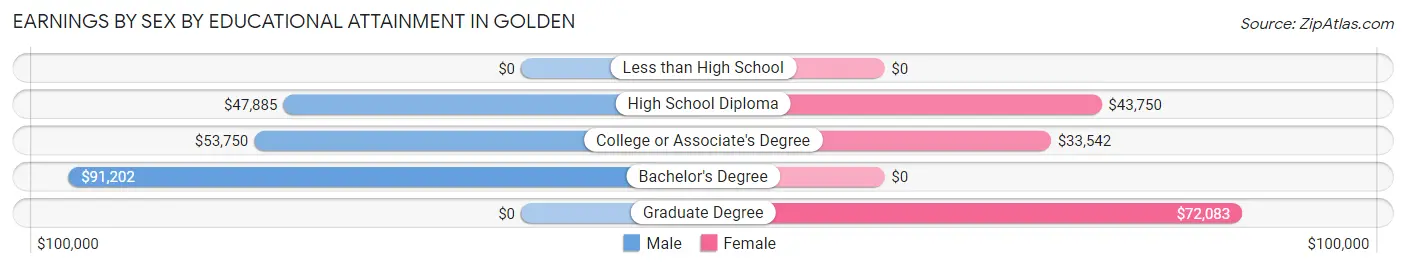
Earnings by Sex by Educational Attainment in Golden
Average earnings in Golden are $54,318 for men and $35,000 for women, a difference of 35.6%. Men with an educational attainment of bachelor's degree enjoy the highest average annual earnings of $91,202, while those with high school diploma education earn the least with $47,885. Women with an educational attainment of graduate degree earn the most with the average annual earnings of $72,083, while those with college or associate's degree education have the smallest earnings of $33,542.
| Educational Attainment | Male Income | Female Income |
| Less than High School | - | - |
| High School Diploma | $47,885 | $43,750 |
| College or Associate's Degree | $53,750 | $33,542 |
| Bachelor's Degree | $91,202 | $0 |
| Graduate Degree | - | - |
| Total | $54,318 | $35,000 |
Family Income in Golden
Family Income Brackets in Golden
According to the Golden family income data, there are 57 families falling into the $100,000 to $149,999 income range, which is the most common income bracket and makes up 28.5% of all families.
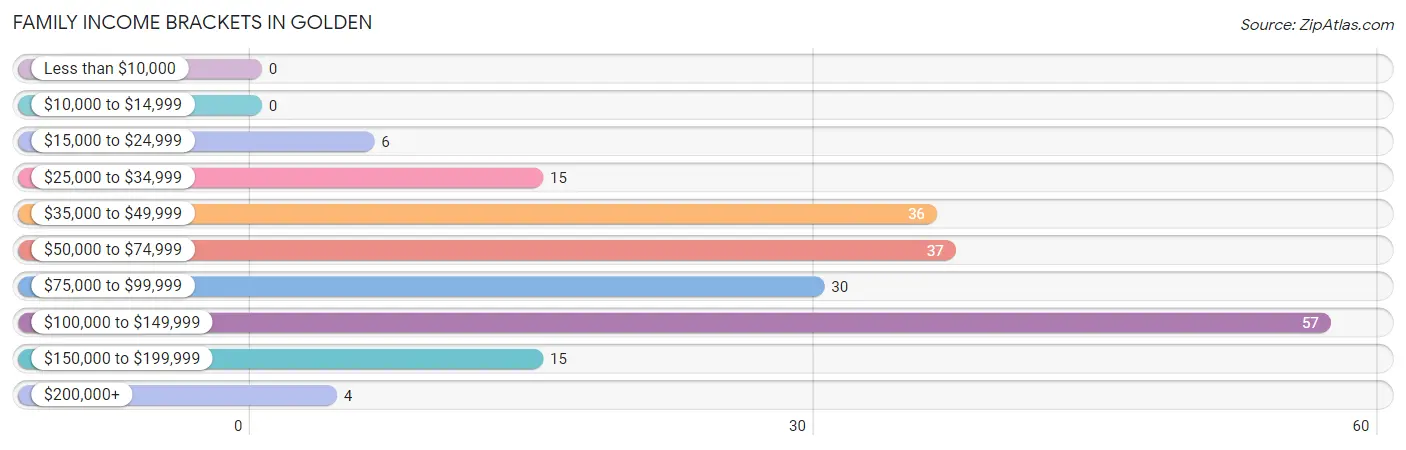
| Income Bracket | # Families | % Families |
| Less than $10,000 | 0 | 0.0% |
| $10,000 to $14,999 | 0 | 0.0% |
| $15,000 to $24,999 | 6 | 3.0% |
| $25,000 to $34,999 | 15 | 7.5% |
| $35,000 to $49,999 | 36 | 18.0% |
| $50,000 to $74,999 | 37 | 18.5% |
| $75,000 to $99,999 | 30 | 15.0% |
| $100,000 to $149,999 | 57 | 28.5% |
| $150,000 to $199,999 | 15 | 7.5% |
| $200,000+ | 4 | 2.0% |
Family Income by Famaliy Size in Golden
3-person families (87 | 43.5%) account for the highest median family income in Golden with $91,875 per family, while 3-person families (87 | 43.5%) have the highest median income of $30,625 per family member.
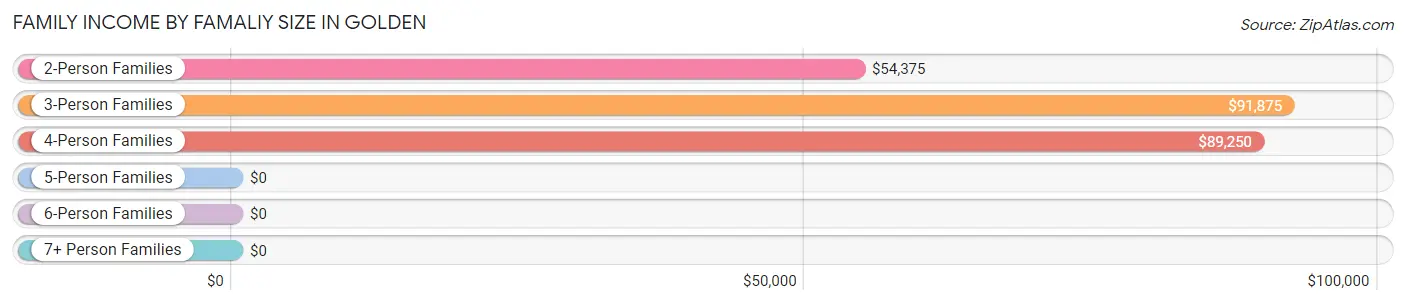
| Income Bracket | # Families | Median Income |
| 2-Person Families | 83 (41.5%) | $54,375 |
| 3-Person Families | 87 (43.5%) | $91,875 |
| 4-Person Families | 18 (9.0%) | $89,250 |
| 5-Person Families | 4 (2.0%) | $0 |
| 6-Person Families | 0 (0.0%) | $0 |
| 7+ Person Families | 8 (4.0%) | $0 |
| Total | 200 (100.0%) | $84,643 |
Family Income by Number of Earners in Golden
The median family income in Golden is $84,643, with families comprising 3+ earners (18) having the highest median family income of $132,500, while families with no earners (32) have the lowest median family income of $40,000, accounting for 9.0% and 16.0% of families, respectively.
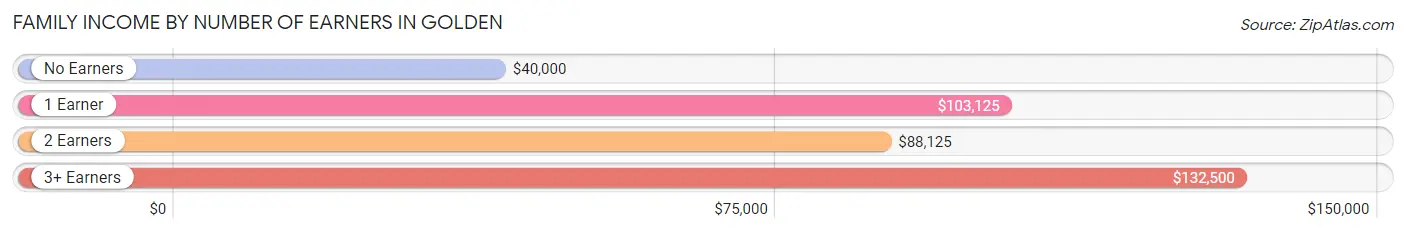
| Number of Earners | # Families | Median Income |
| No Earners | 32 (16.0%) | $40,000 |
| 1 Earner | 83 (41.5%) | $103,125 |
| 2 Earners | 67 (33.5%) | $88,125 |
| 3+ Earners | 18 (9.0%) | $132,500 |
| Total | 200 (100.0%) | $84,643 |
Household Income in Golden
Household Income Brackets in Golden
With 60 households falling in the category, the $50,000 to $74,999 income range is the most frequent in Golden, accounting for 18.6% of all households. In contrast, only 4 households (1.2%) fall into the $200,000+ income bracket, making it the least populous group.
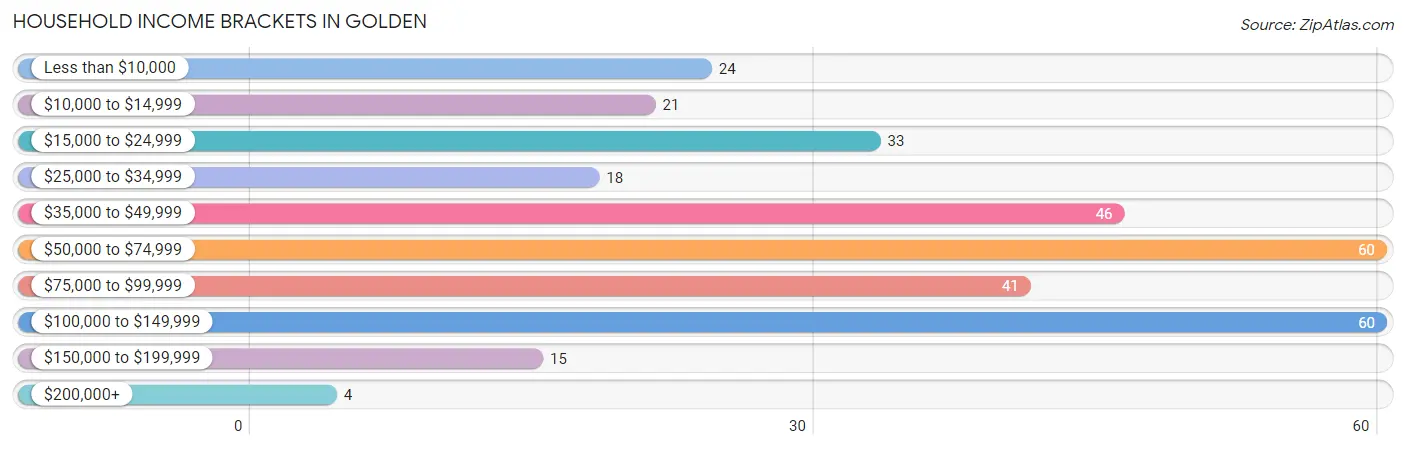
| Income Bracket | # Households | % Households |
| Less than $10,000 | 24 | 7.5% |
| $10,000 to $14,999 | 21 | 6.5% |
| $15,000 to $24,999 | 33 | 10.2% |
| $25,000 to $34,999 | 18 | 5.6% |
| $35,000 to $49,999 | 46 | 14.3% |
| $50,000 to $74,999 | 60 | 18.6% |
| $75,000 to $99,999 | 41 | 12.7% |
| $100,000 to $149,999 | 60 | 18.6% |
| $150,000 to $199,999 | 15 | 4.7% |
| $200,000+ | 4 | 1.2% |
Household Income by Householder Age in Golden
The median household income in Golden is $58,500, with the highest median household income of $89,779 found in the 25 to 44 years age bracket for the primary householder. A total of 99 households (30.7%) fall into this category. Meanwhile, the 65+ years age bracket for the primary householder has the lowest median household income of $30,625, with 115 households (35.7%) in this group.
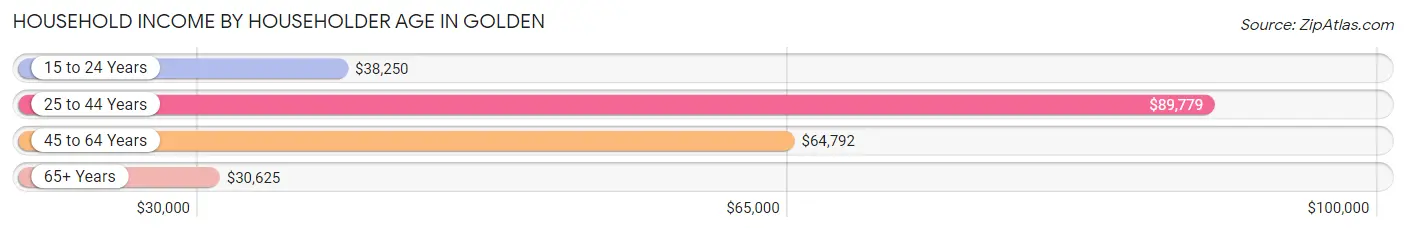
| Income Bracket | # Households | Median Income |
| 15 to 24 Years | 25 (7.8%) | $38,250 |
| 25 to 44 Years | 99 (30.7%) | $89,779 |
| 45 to 64 Years | 83 (25.8%) | $64,792 |
| 65+ Years | 115 (35.7%) | $30,625 |
| Total | 322 (100.0%) | $58,500 |
Poverty in Golden
Income Below Poverty by Sex and Age in Golden
With 4.2% poverty level for males and 12.8% for females among the residents of Golden, 16 and 17 year old males and 65 to 74 year old females are the most vulnerable to poverty, with 6 males (50.0%) and 17 females (32.1%) in their respective age groups living below the poverty level.
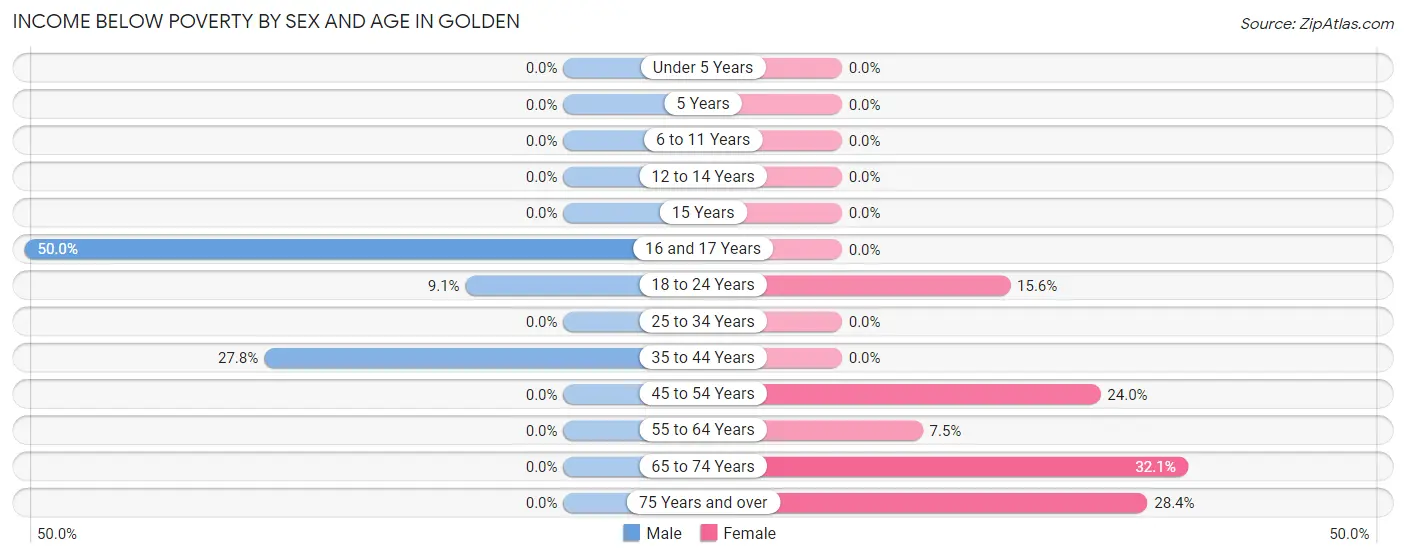
| Age Bracket | Male | Female |
| Under 5 Years | 0 (0.0%) | 0 (0.0%) |
| 5 Years | 0 (0.0%) | 0 (0.0%) |
| 6 to 11 Years | 0 (0.0%) | 0 (0.0%) |
| 12 to 14 Years | 0 (0.0%) | 0 (0.0%) |
| 15 Years | 0 (0.0%) | 0 (0.0%) |
| 16 and 17 Years | 6 (50.0%) | 0 (0.0%) |
| 18 to 24 Years | 4 (9.1%) | 5 (15.6%) |
| 25 to 34 Years | 0 (0.0%) | 0 (0.0%) |
| 35 to 44 Years | 5 (27.8%) | 0 (0.0%) |
| 45 to 54 Years | 0 (0.0%) | 6 (24.0%) |
| 55 to 64 Years | 0 (0.0%) | 3 (7.5%) |
| 65 to 74 Years | 0 (0.0%) | 17 (32.1%) |
| 75 Years and over | 0 (0.0%) | 19 (28.4%) |
| Total | 15 (4.2%) | 50 (12.8%) |
Income Above Poverty by Sex and Age in Golden
According to the poverty statistics in Golden, males aged under 5 years and females aged under 5 years are the age groups that are most secure financially, with 100.0% of males and 100.0% of females in these age groups living above the poverty line.
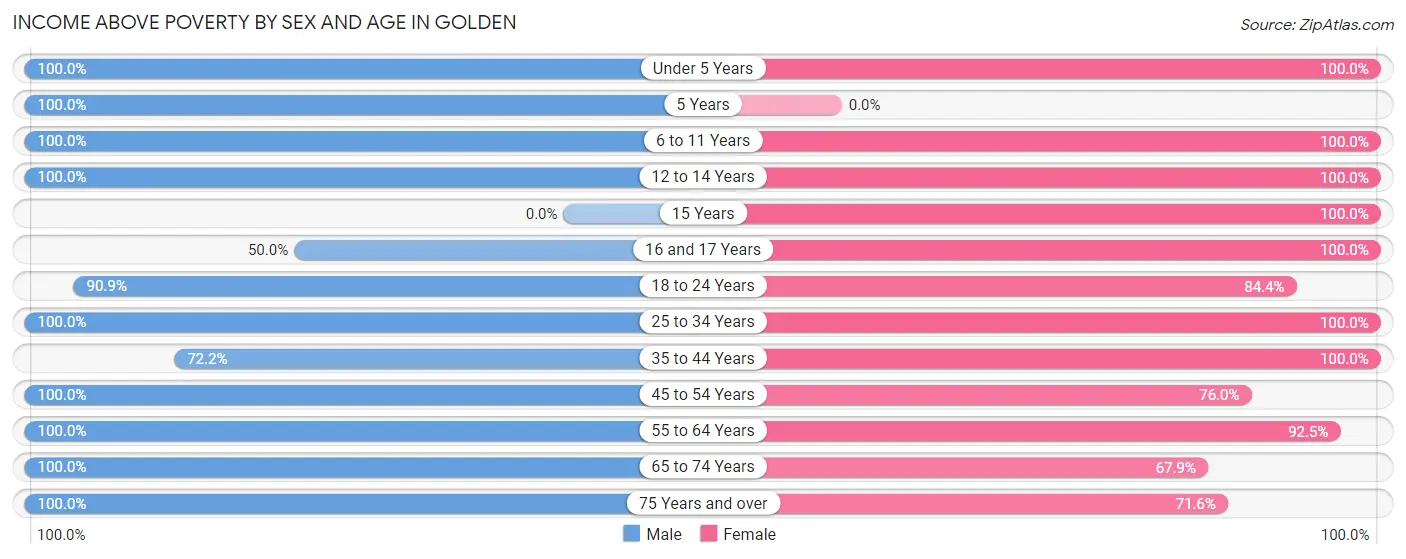
| Age Bracket | Male | Female |
| Under 5 Years | 56 (100.0%) | 28 (100.0%) |
| 5 Years | 3 (100.0%) | 0 (0.0%) |
| 6 to 11 Years | 41 (100.0%) | 20 (100.0%) |
| 12 to 14 Years | 2 (100.0%) | 5 (100.0%) |
| 15 Years | 0 (0.0%) | 5 (100.0%) |
| 16 and 17 Years | 6 (50.0%) | 16 (100.0%) |
| 18 to 24 Years | 40 (90.9%) | 27 (84.4%) |
| 25 to 34 Years | 67 (100.0%) | 66 (100.0%) |
| 35 to 44 Years | 13 (72.2%) | 33 (100.0%) |
| 45 to 54 Years | 41 (100.0%) | 19 (76.0%) |
| 55 to 64 Years | 32 (100.0%) | 37 (92.5%) |
| 65 to 74 Years | 20 (100.0%) | 36 (67.9%) |
| 75 Years and over | 22 (100.0%) | 48 (71.6%) |
| Total | 343 (95.8%) | 340 (87.2%) |
Income Below Poverty Among Married-Couple Families in Golden
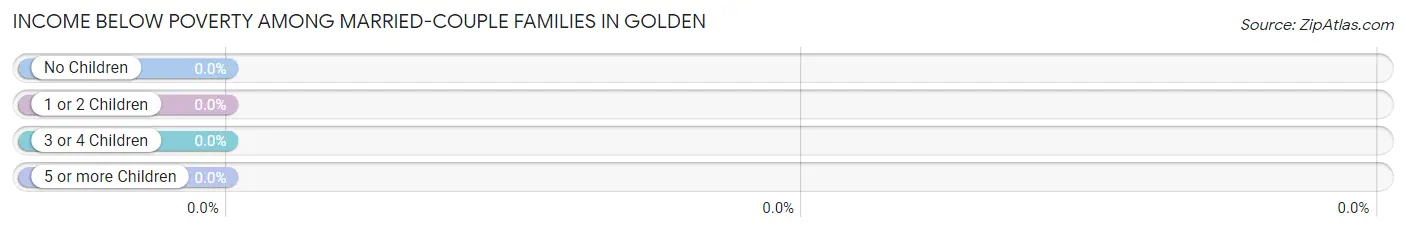
| Children | Above Poverty | Below Poverty |
| No Children | 84 (100.0%) | 0 (0.0%) |
| 1 or 2 Children | 66 (100.0%) | 0 (0.0%) |
| 3 or 4 Children | 1 (100.0%) | 0 (0.0%) |
| 5 or more Children | 7 (100.0%) | 0 (0.0%) |
| Total | 158 (100.0%) | 0 (0.0%) |
Income Below Poverty Among Single-Parent Households in Golden
| Children | Single Father | Single Mother |
| No Children | 0 (0.0%) | 0 (0.0%) |
| 1 or 2 Children | 0 (0.0%) | 0 (0.0%) |
| 3 or 4 Children | 0 (0.0%) | 0 (0.0%) |
| 5 or more Children | 0 (0.0%) | 0 (0.0%) |
| Total | 0 (0.0%) | 0 (0.0%) |
Income Below Poverty Among Married-Couple vs Single-Parent Households in Golden
| Children | Married-Couple Families | Single-Parent Households |
| No Children | 0 (0.0%) | 0 (0.0%) |
| 1 or 2 Children | 0 (0.0%) | 0 (0.0%) |
| 3 or 4 Children | 0 (0.0%) | 0 (0.0%) |
| 5 or more Children | 0 (0.0%) | 0 (0.0%) |
| Total | 0 (0.0%) | 0 (0.0%) |
Race in Golden
The most populous races in Golden are White / Caucasian (767 | 99.5%), and Two or more Races (4 | 0.5%).
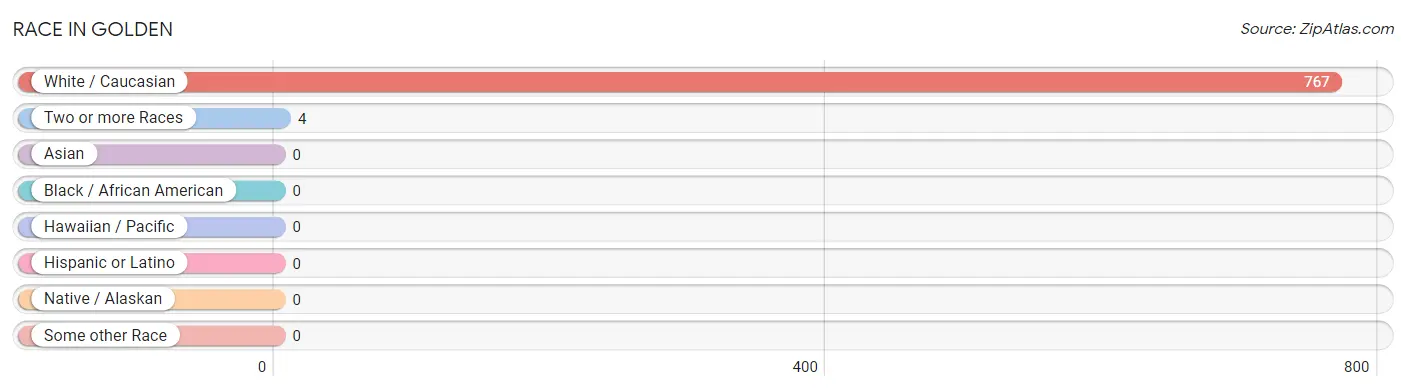
| Race | # Population | % Population |
| Asian | 0 | 0.0% |
| Black / African American | 0 | 0.0% |
| Hawaiian / Pacific | 0 | 0.0% |
| Hispanic or Latino | 0 | 0.0% |
| Native / Alaskan | 0 | 0.0% |
| White / Caucasian | 767 | 99.5% |
| Two or more Races | 4 | 0.5% |
| Some other Race | 0 | 0.0% |
| Total | 771 | 100.0% |
Ancestry in Golden
The most populous ancestries reported in Golden are German (276 | 35.8%), American (65 | 8.4%), Irish (63 | 8.2%), English (28 | 3.6%), and Scottish (21 | 2.7%), together accounting for 58.8% of all Golden residents.
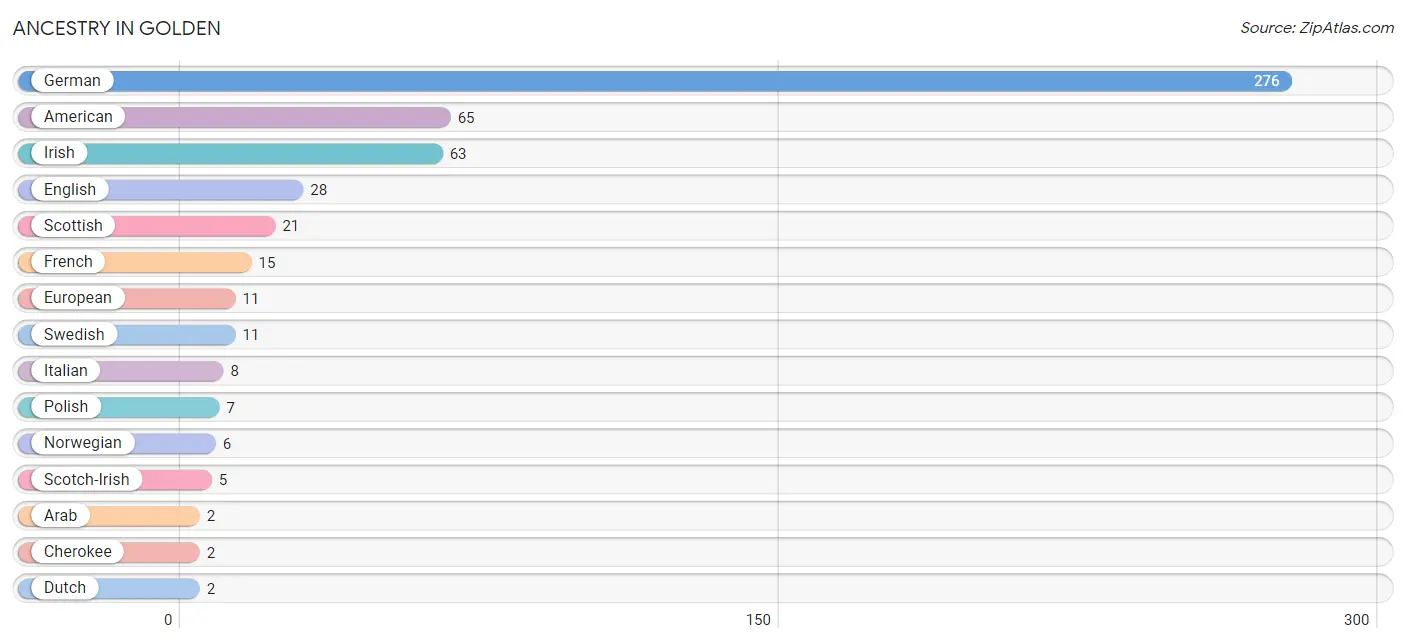
| Ancestry | # Population | % Population |
| American | 65 | 8.4% |
| Arab | 2 | 0.3% |
| Cherokee | 2 | 0.3% |
| Dutch | 2 | 0.3% |
| English | 28 | 3.6% |
| European | 11 | 1.4% |
| French | 15 | 1.9% |
| German | 276 | 35.8% |
| Greek | 2 | 0.3% |
| Irish | 63 | 8.2% |
| Italian | 8 | 1.0% |
| Moroccan | 2 | 0.3% |
| Norwegian | 6 | 0.8% |
| Polish | 7 | 0.9% |
| Scotch-Irish | 5 | 0.6% |
| Scottish | 21 | 2.7% |
| Swedish | 11 | 1.4% | View All 17 Rows |
Immigrants in Golden
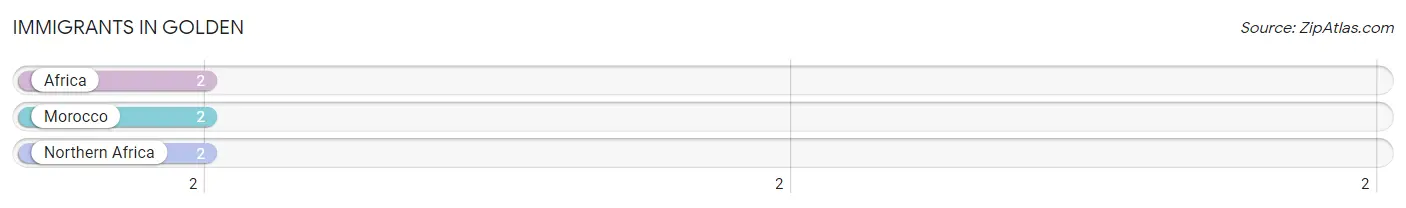
The most numerous immigrant groups reported in Golden came from Africa (2 | 0.3%), Morocco (2 | 0.3%), and Northern Africa (2 | 0.3%), together accounting for 0.8% of all Golden residents.
| Immigration Origin | # Population | % Population |
| Africa | 2 | 0.3% |
| Morocco | 2 | 0.3% |
| Northern Africa | 2 | 0.3% | View All 3 Rows |
Sex and Age in Golden
Sex and Age in Golden
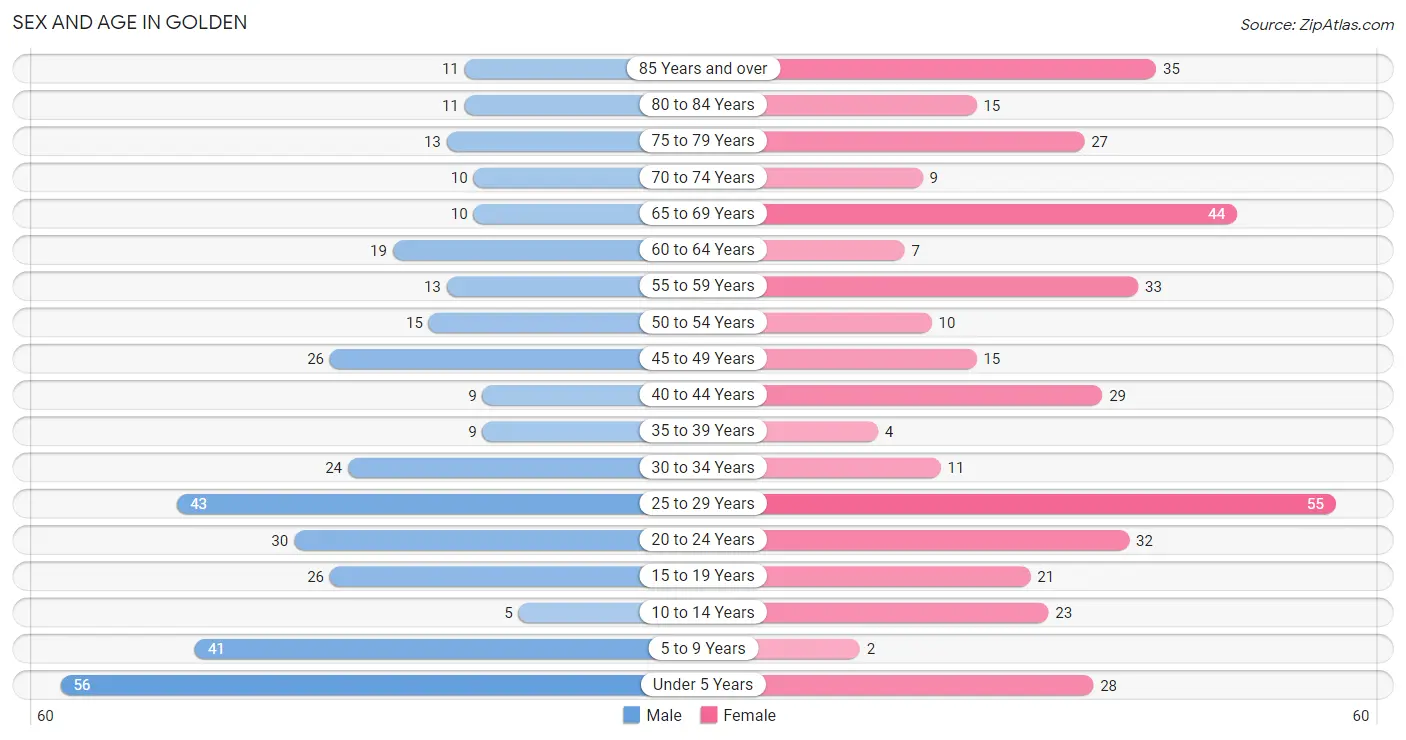
The most populous age groups in Golden are Under 5 Years (56 | 15.1%) for men and 25 to 29 Years (55 | 13.8%) for women.
| Age Bracket | Male | Female |
| Under 5 Years | 56 (15.1%) | 28 (7.0%) |
| 5 to 9 Years | 41 (11.1%) | 2 (0.5%) |
| 10 to 14 Years | 5 (1.3%) | 23 (5.8%) |
| 15 to 19 Years | 26 (7.0%) | 21 (5.2%) |
| 20 to 24 Years | 30 (8.1%) | 32 (8.0%) |
| 25 to 29 Years | 43 (11.6%) | 55 (13.8%) |
| 30 to 34 Years | 24 (6.5%) | 11 (2.8%) |
| 35 to 39 Years | 9 (2.4%) | 4 (1.0%) |
| 40 to 44 Years | 9 (2.4%) | 29 (7.2%) |
| 45 to 49 Years | 26 (7.0%) | 15 (3.7%) |
| 50 to 54 Years | 15 (4.0%) | 10 (2.5%) |
| 55 to 59 Years | 13 (3.5%) | 33 (8.3%) |
| 60 to 64 Years | 19 (5.1%) | 7 (1.8%) |
| 65 to 69 Years | 10 (2.7%) | 44 (11.0%) |
| 70 to 74 Years | 10 (2.7%) | 9 (2.2%) |
| 75 to 79 Years | 13 (3.5%) | 27 (6.8%) |
| 80 to 84 Years | 11 (3.0%) | 15 (3.7%) |
| 85 Years and over | 11 (3.0%) | 35 (8.7%) |
| Total | 371 (100.0%) | 400 (100.0%) |
Families and Households in Golden
Median Family Size in Golden
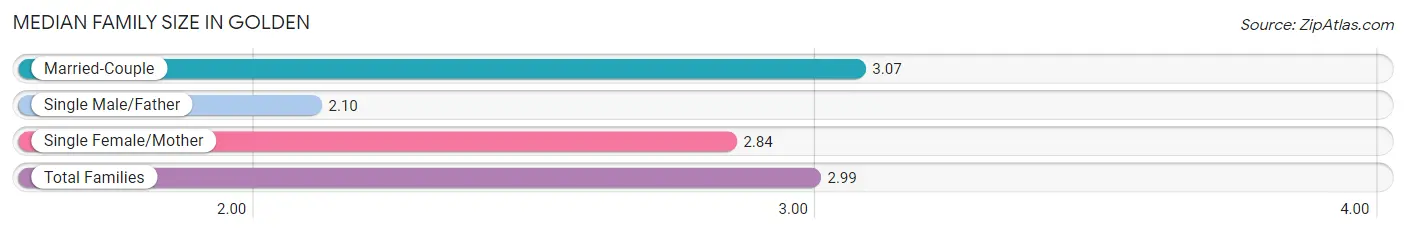
The median family size in Golden is 2.99 persons per family, with married-couple families (158 | 79.0%) accounting for the largest median family size of 3.07 persons per family. On the other hand, single male/father families (10 | 5.0%) represent the smallest median family size with 2.10 persons per family.
| Family Type | # Families | Family Size |
| Married-Couple | 158 (79.0%) | 3.07 |
| Single Male/Father | 10 (5.0%) | 2.10 |
| Single Female/Mother | 32 (16.0%) | 2.84 |
| Total Families | 200 (100.0%) | 2.99 |
Median Household Size in Golden
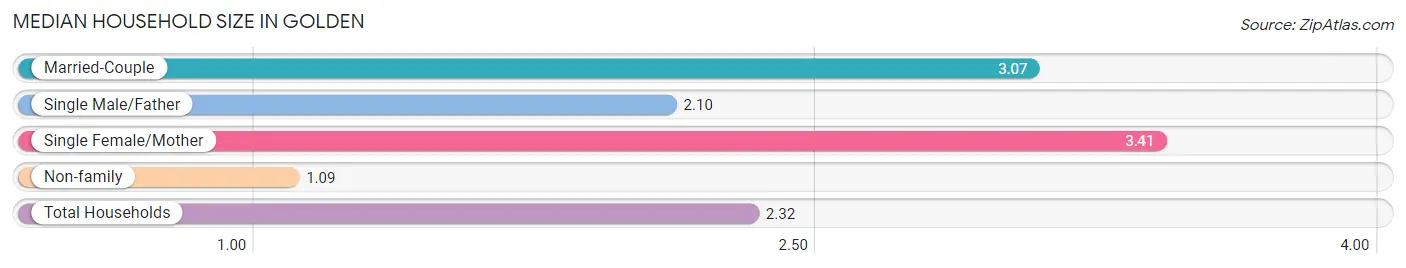
The median household size in Golden is 2.32 persons per household, with single female/mother households (32 | 9.9%) accounting for the largest median household size of 3.41 persons per household. non-family households (122 | 37.9%) represent the smallest median household size with 1.09 persons per household.
| Household Type | # Households | Household Size |
| Married-Couple | 158 (49.1%) | 3.07 |
| Single Male/Father | 10 (3.1%) | 2.10 |
| Single Female/Mother | 32 (9.9%) | 3.41 |
| Non-family | 122 (37.9%) | 1.09 |
| Total Households | 322 (100.0%) | 2.32 |
Household Size by Marriage Status in Golden
Out of a total of 322 households in Golden, 200 (62.1%) are family households, while 122 (37.9%) are nonfamily households. The most numerous type of family households are 2-person households, comprising 83, and the most common type of nonfamily households are 1-person households, comprising 107.
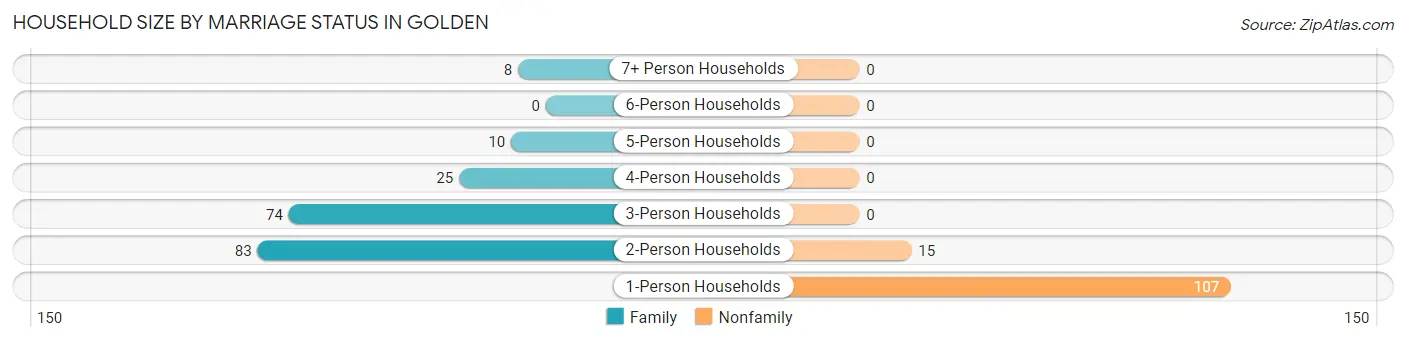
| Household Size | Family Households | Nonfamily Households |
| 1-Person Households | - | 107 (33.2%) |
| 2-Person Households | 83 (25.8%) | 15 (4.7%) |
| 3-Person Households | 74 (23.0%) | 0 (0.0%) |
| 4-Person Households | 25 (7.8%) | 0 (0.0%) |
| 5-Person Households | 10 (3.1%) | 0 (0.0%) |
| 6-Person Households | 0 (0.0%) | 0 (0.0%) |
| 7+ Person Households | 8 (2.5%) | 0 (0.0%) |
| Total | 200 (62.1%) | 122 (37.9%) |
Female Fertility in Golden
Fertility by Age in Golden
Average fertility rate in Golden is 162.0 births per 1,000 women. Women in the age bracket of 20 to 34 years have the highest fertility rate with 276.0 births per 1,000 women. Women in the age bracket of 20 to 34 years acount for 100.0% of all women with births.
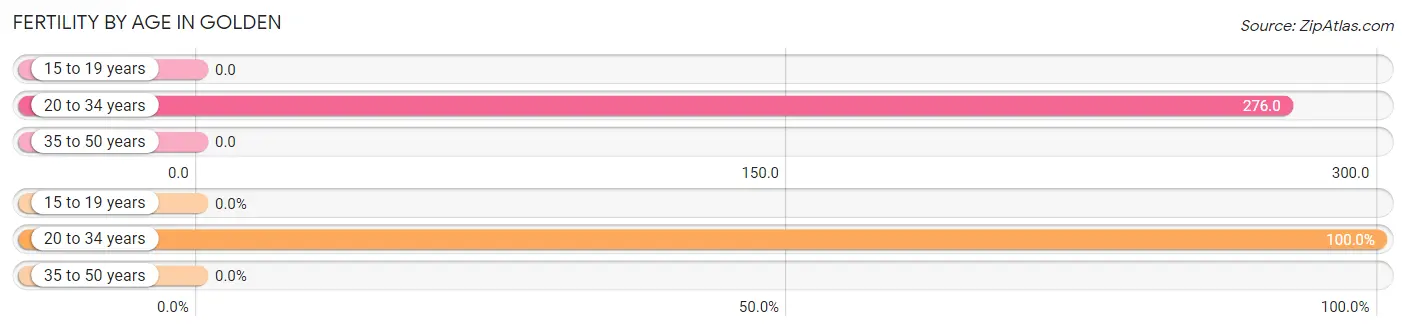
| Age Bracket | Women with Births | Births / 1,000 Women |
| 15 to 19 years | 0 (0.0%) | 0.0 |
| 20 to 34 years | 27 (100.0%) | 276.0 |
| 35 to 50 years | 0 (0.0%) | 0.0 |
| Total | 27 (100.0%) | 162.0 |
Fertility by Age by Marriage Status in Golden
74.1% of women with births (27) in Golden are married. The highest percentage of unmarried women with births falls into 20 to 34 years age bracket with 25.9% of them unmarried at the time of birth, while the lowest percentage of unmarried women with births belong to 20 to 34 years age bracket with 25.9% of them unmarried.
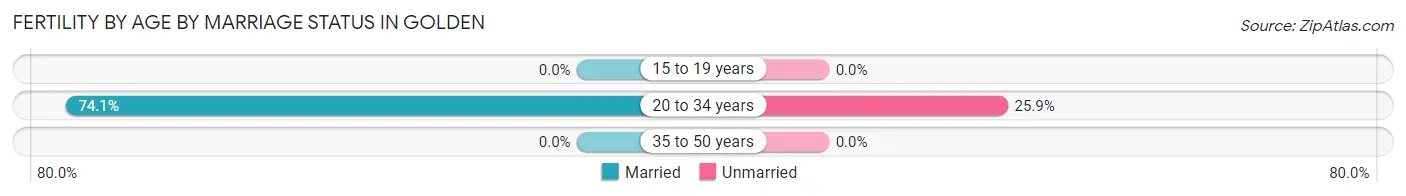
| Age Bracket | Married | Unmarried |
| 15 to 19 years | 0 (0.0%) | 0 (0.0%) |
| 20 to 34 years | 20 (74.1%) | 7 (25.9%) |
| 35 to 50 years | 0 (0.0%) | 0 (0.0%) |
| Total | 20 (74.1%) | 7 (25.9%) |
Fertility by Education in Golden
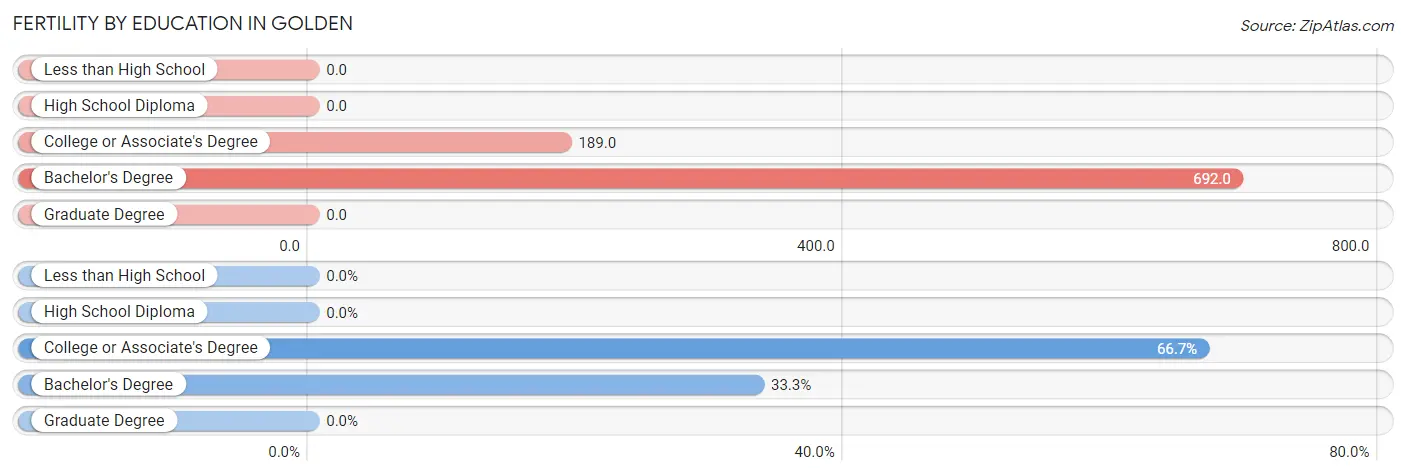
| Educational Attainment | Women with Births | Births / 1,000 Women |
| Less than High School | 0 (0.0%) | 0.0 |
| High School Diploma | 0 (0.0%) | 0.0 |
| College or Associate's Degree | 18 (66.7%) | 189.0 |
| Bachelor's Degree | 9 (33.3%) | 692.0 |
| Graduate Degree | 0 (0.0%) | 0.0 |
| Total | 27 (100.0%) | 162.0 |
Fertility by Education by Marriage Status in Golden
25.9% of women with births in Golden are unmarried. Women with the educational attainment of bachelor's degree are most likely to be married with 100.0% of them married at childbirth, while women with the educational attainment of college or associate's degree are least likely to be married with 38.9% of them unmarried at childbirth.
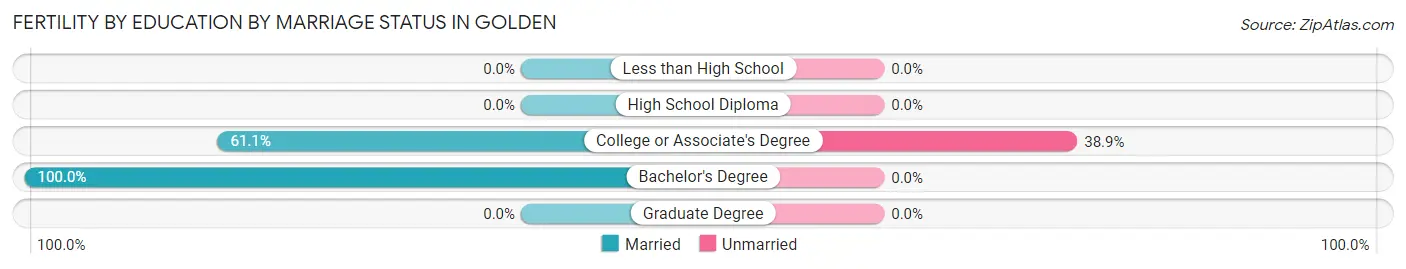
| Educational Attainment | Married | Unmarried |
| Less than High School | 0 (0.0%) | 0 (0.0%) |
| High School Diploma | 0 (0.0%) | 0 (0.0%) |
| College or Associate's Degree | 11 (61.1%) | 7 (38.9%) |
| Bachelor's Degree | 9 (100.0%) | 0 (0.0%) |
| Graduate Degree | 0 (0.0%) | 0 (0.0%) |
| Total | 20 (74.1%) | 7 (25.9%) |
Employment Characteristics in Golden
Employment by Class of Employer in Golden
Among the 361 employed individuals in Golden, private company employees (252 | 69.8%), not-for-profit organizations (42 | 11.6%), and self-employed (not incorporated) (23 | 6.4%) make up the most common classes of employment.
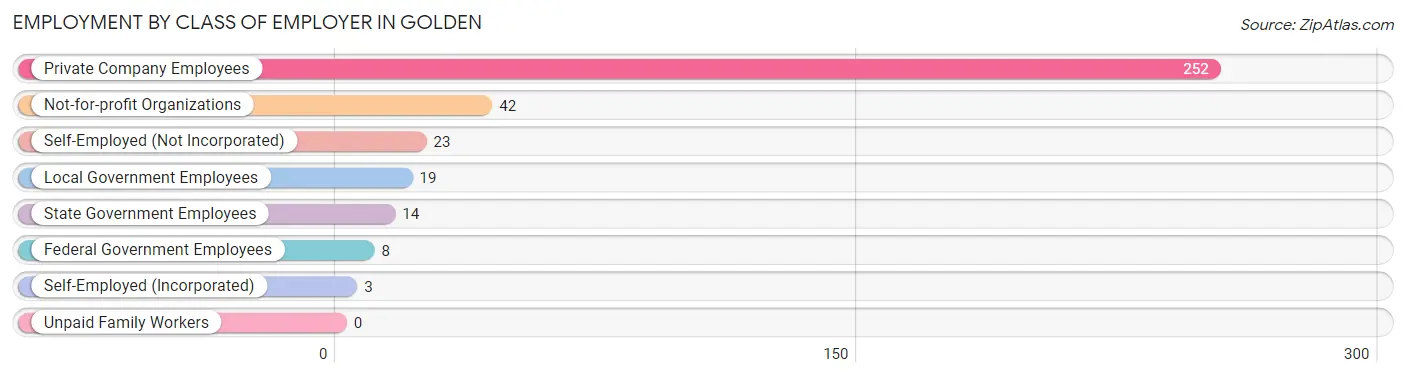
| Employer Class | # Employees | % Employees |
| Private Company Employees | 252 | 69.8% |
| Self-Employed (Incorporated) | 3 | 0.8% |
| Self-Employed (Not Incorporated) | 23 | 6.4% |
| Not-for-profit Organizations | 42 | 11.6% |
| Local Government Employees | 19 | 5.3% |
| State Government Employees | 14 | 3.9% |
| Federal Government Employees | 8 | 2.2% |
| Unpaid Family Workers | 0 | 0.0% |
| Total | 361 | 100.0% |
Employment Status by Age in Golden
According to the labor force statistics for Golden, out of the total population over 16 years of age (611), 61.2% or 374 individuals are in the labor force, with 2.7% or 10 of them unemployed. The age group with the highest labor force participation rate is 20 to 24 years, with 100.0% or 62 individuals in the labor force. Within the labor force, the 16 to 19 years age range has the highest percentage of unemployed individuals, with 40.0% or 8 of them being unemployed.
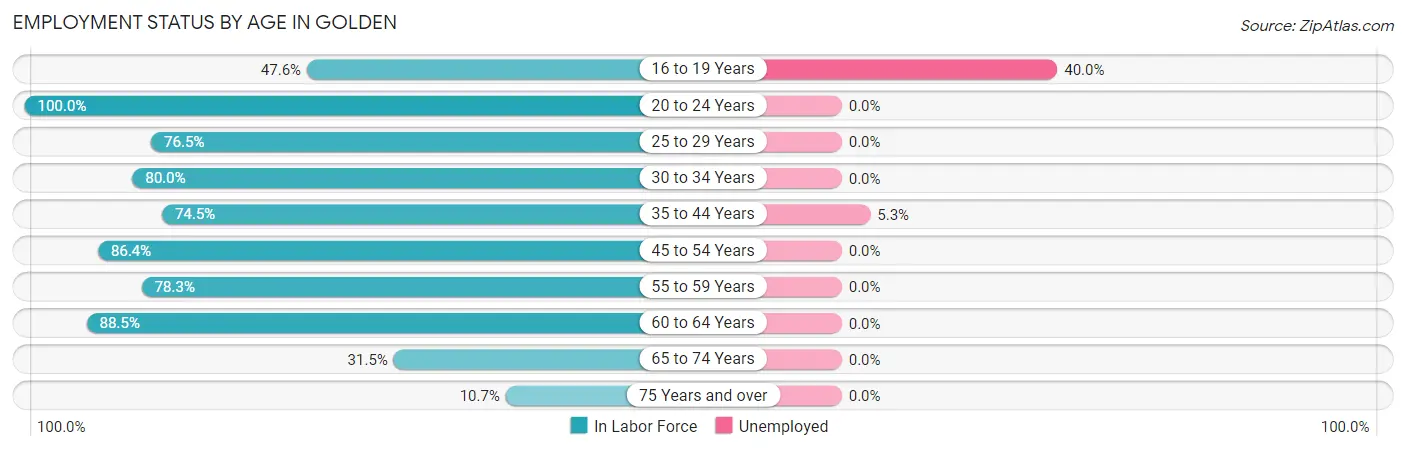
| Age Bracket | In Labor Force | Unemployed |
| 16 to 19 Years | 20 (47.6%) | 8 (40.0%) |
| 20 to 24 Years | 62 (100.0%) | 0 (0.0%) |
| 25 to 29 Years | 75 (76.5%) | 0 (0.0%) |
| 30 to 34 Years | 28 (80.0%) | 0 (0.0%) |
| 35 to 44 Years | 38 (74.5%) | 2 (5.3%) |
| 45 to 54 Years | 57 (86.4%) | 0 (0.0%) |
| 55 to 59 Years | 36 (78.3%) | 0 (0.0%) |
| 60 to 64 Years | 23 (88.5%) | 0 (0.0%) |
| 65 to 74 Years | 23 (31.5%) | 0 (0.0%) |
| 75 Years and over | 12 (10.7%) | 0 (0.0%) |
| Total | 374 (61.2%) | 10 (2.7%) |
Employment Status by Educational Attainment in Golden
According to labor force statistics for Golden, 79.8% of individuals (257) out of the total population between 25 and 64 years of age (322) are in the labor force, with 0.8% or 2 of them being unemployed. The group with the highest labor force participation rate are those with the educational attainment of college / associate degree, with 90.2% or 120 individuals in the labor force. Within the labor force, individuals with college / associate degree education have the highest percentage of unemployment, with 1.7% or 2 of them being unemployed.
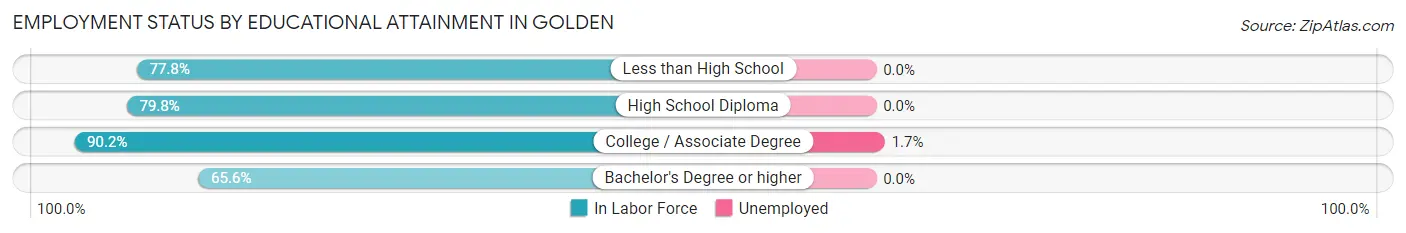
| Educational Attainment | In Labor Force | Unemployed |
| Less than High School | 7 (77.8%) | 0 (0.0%) |
| High School Diploma | 67 (79.8%) | 0 (0.0%) |
| College / Associate Degree | 120 (90.2%) | 2 (1.7%) |
| Bachelor's Degree or higher | 63 (65.6%) | 0 (0.0%) |
| Total | 257 (79.8%) | 3 (0.8%) |
Employment Occupations by Sex in Golden
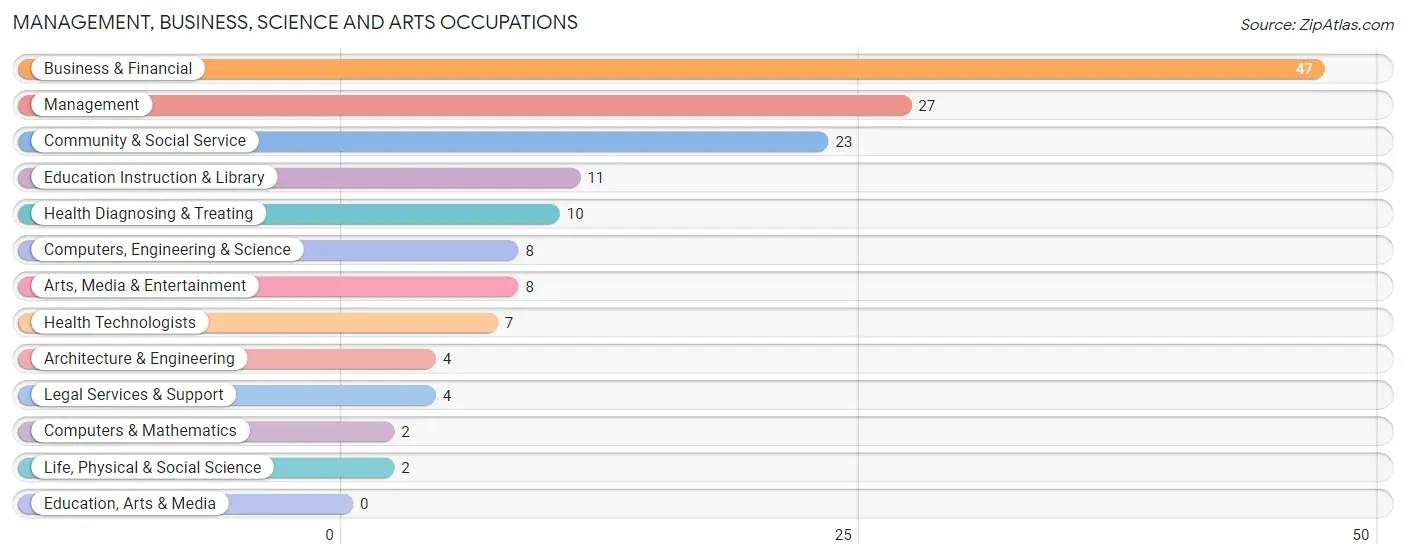
Management, Business, Science and Arts Occupations
The most common Management, Business, Science and Arts occupations in Golden are Business & Financial (47 | 12.9%), Management (27 | 7.4%), Community & Social Service (23 | 6.3%), Education Instruction & Library (11 | 3.0%), and Health Diagnosing & Treating (10 | 2.8%).
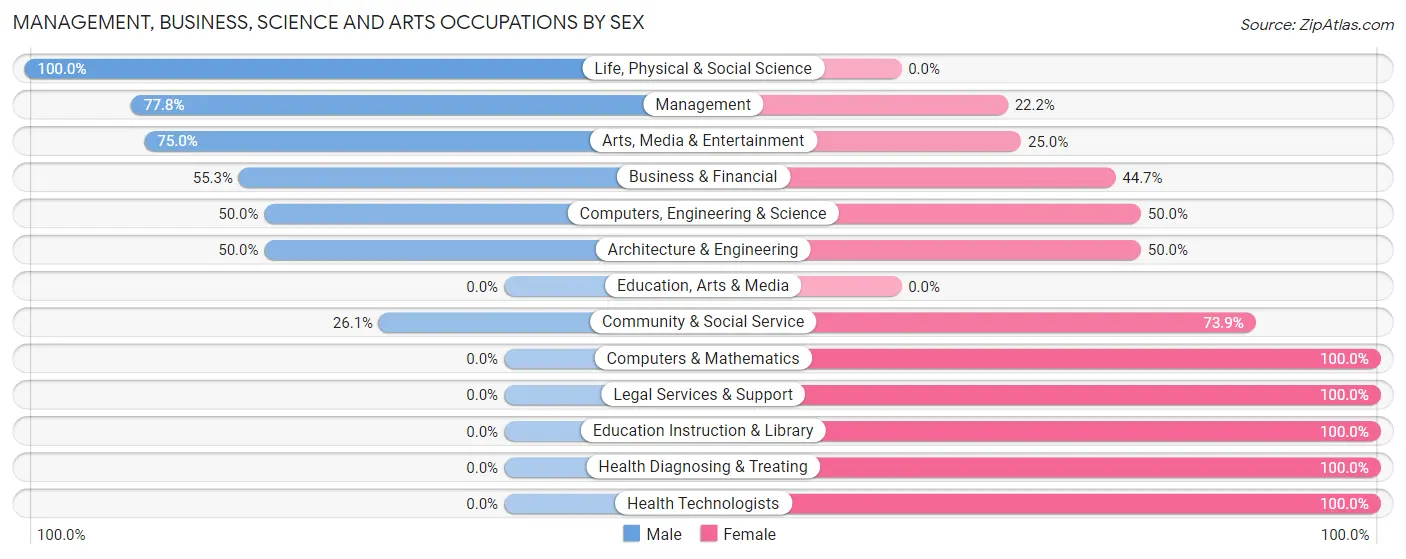
Management, Business, Science and Arts Occupations by Sex
Within the Management, Business, Science and Arts occupations in Golden, the most male-oriented occupations are Life, Physical & Social Science (100.0%), Management (77.8%), and Arts, Media & Entertainment (75.0%), while the most female-oriented occupations are Computers & Mathematics (100.0%), Legal Services & Support (100.0%), and Education Instruction & Library (100.0%).
| Occupation | Male | Female |
| Management | 21 (77.8%) | 6 (22.2%) |
| Business & Financial | 26 (55.3%) | 21 (44.7%) |
| Computers, Engineering & Science | 4 (50.0%) | 4 (50.0%) |
| Computers & Mathematics | 0 (0.0%) | 2 (100.0%) |
| Architecture & Engineering | 2 (50.0%) | 2 (50.0%) |
| Life, Physical & Social Science | 2 (100.0%) | 0 (0.0%) |
| Community & Social Service | 6 (26.1%) | 17 (73.9%) |
| Education, Arts & Media | 0 (0.0%) | 0 (0.0%) |
| Legal Services & Support | 0 (0.0%) | 4 (100.0%) |
| Education Instruction & Library | 0 (0.0%) | 11 (100.0%) |
| Arts, Media & Entertainment | 6 (75.0%) | 2 (25.0%) |
| Health Diagnosing & Treating | 0 (0.0%) | 10 (100.0%) |
| Health Technologists | 0 (0.0%) | 7 (100.0%) |
| Total (Category) | 57 (49.6%) | 58 (50.4%) |
| Total (Overall) | 188 (51.6%) | 176 (48.3%) |
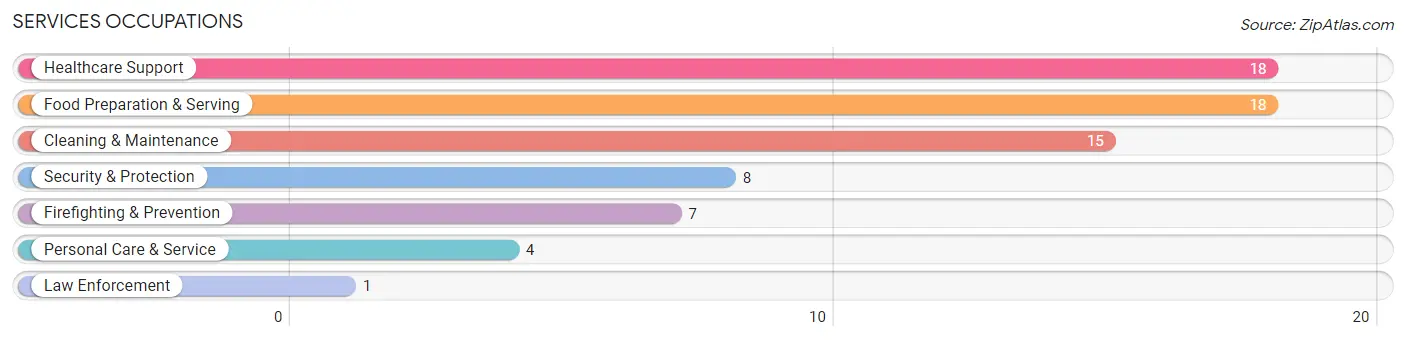
Services Occupations
The most common Services occupations in Golden are Healthcare Support (18 | 5.0%), Food Preparation & Serving (18 | 5.0%), Cleaning & Maintenance (15 | 4.1%), Security & Protection (8 | 2.2%), and Firefighting & Prevention (7 | 1.9%).
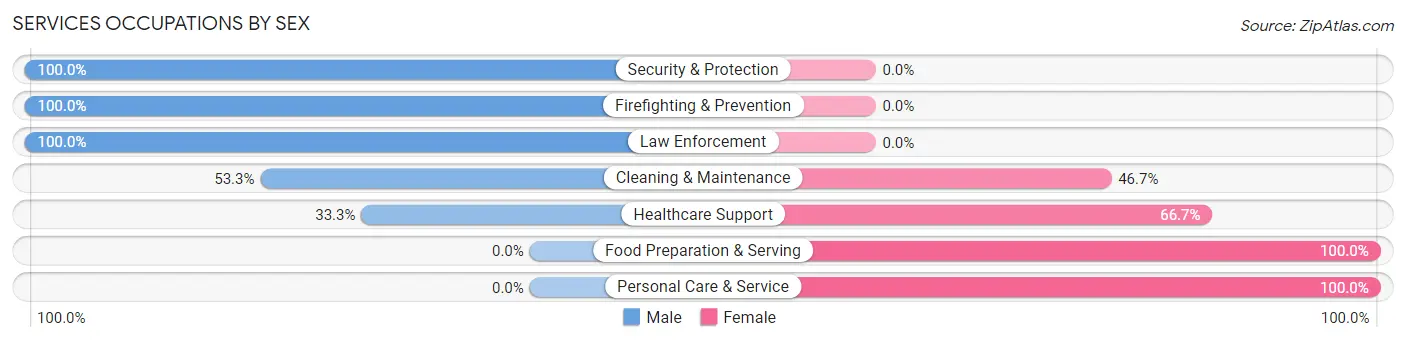
Services Occupations by Sex
Within the Services occupations in Golden, the most male-oriented occupations are Security & Protection (100.0%), Firefighting & Prevention (100.0%), and Law Enforcement (100.0%), while the most female-oriented occupations are Food Preparation & Serving (100.0%), Personal Care & Service (100.0%), and Healthcare Support (66.7%).
| Occupation | Male | Female |
| Healthcare Support | 6 (33.3%) | 12 (66.7%) |
| Security & Protection | 8 (100.0%) | 0 (0.0%) |
| Firefighting & Prevention | 7 (100.0%) | 0 (0.0%) |
| Law Enforcement | 1 (100.0%) | 0 (0.0%) |
| Food Preparation & Serving | 0 (0.0%) | 18 (100.0%) |
| Cleaning & Maintenance | 8 (53.3%) | 7 (46.7%) |
| Personal Care & Service | 0 (0.0%) | 4 (100.0%) |
| Total (Category) | 22 (34.9%) | 41 (65.1%) |
| Total (Overall) | 188 (51.6%) | 176 (48.3%) |
Sales and Office Occupations
The most common Sales and Office occupations in Golden are Office & Administration (40 | 11.0%), and Sales & Related (32 | 8.8%).
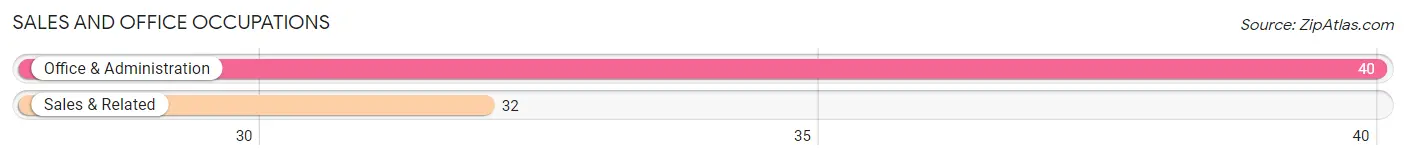
Sales and Office Occupations by Sex
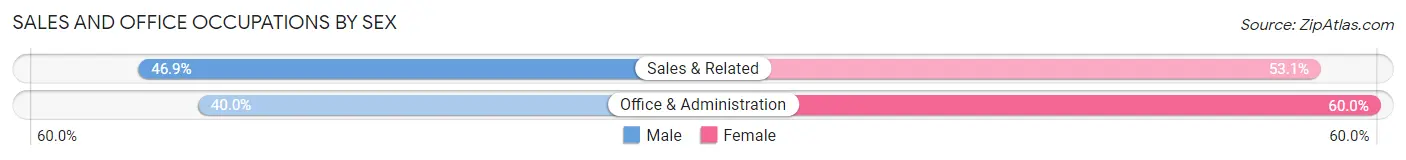
| Occupation | Male | Female |
| Sales & Related | 15 (46.9%) | 17 (53.1%) |
| Office & Administration | 16 (40.0%) | 24 (60.0%) |
| Total (Category) | 31 (43.1%) | 41 (56.9%) |
| Total (Overall) | 188 (51.6%) | 176 (48.3%) |
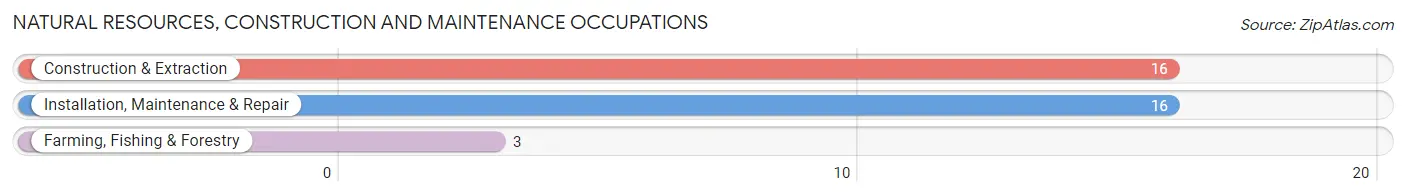
Natural Resources, Construction and Maintenance Occupations
The most common Natural Resources, Construction and Maintenance occupations in Golden are Construction & Extraction (16 | 4.4%), Installation, Maintenance & Repair (16 | 4.4%), and Farming, Fishing & Forestry (3 | 0.8%).
Natural Resources, Construction and Maintenance Occupations by Sex
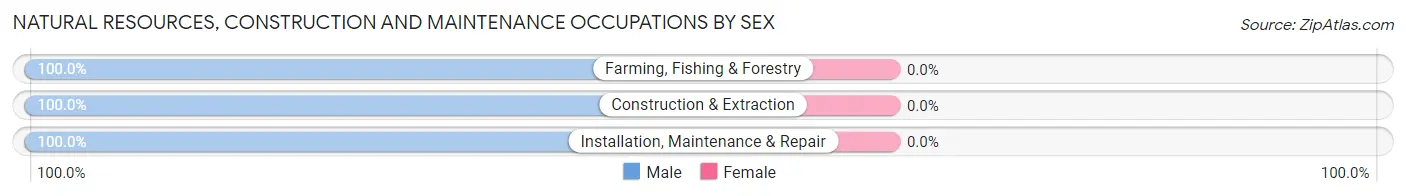
| Occupation | Male | Female |
| Farming, Fishing & Forestry | 3 (100.0%) | 0 (0.0%) |
| Construction & Extraction | 16 (100.0%) | 0 (0.0%) |
| Installation, Maintenance & Repair | 16 (100.0%) | 0 (0.0%) |
| Total (Category) | 35 (100.0%) | 0 (0.0%) |
| Total (Overall) | 188 (51.6%) | 176 (48.3%) |
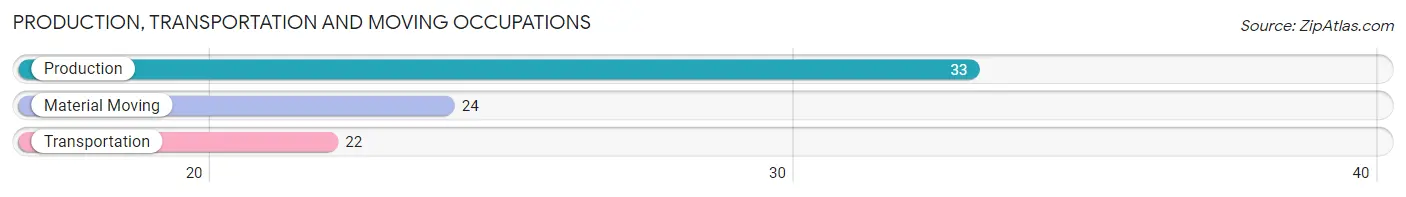
Production, Transportation and Moving Occupations
The most common Production, Transportation and Moving occupations in Golden are Production (33 | 9.1%), Material Moving (24 | 6.6%), and Transportation (22 | 6.0%).
Production, Transportation and Moving Occupations by Sex
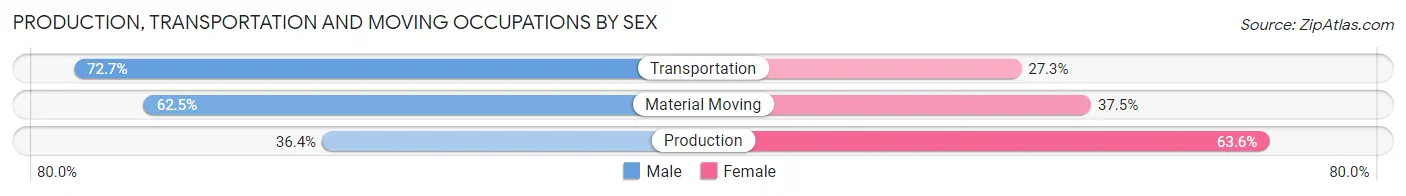
| Occupation | Male | Female |
| Production | 12 (36.4%) | 21 (63.6%) |
| Transportation | 16 (72.7%) | 6 (27.3%) |
| Material Moving | 15 (62.5%) | 9 (37.5%) |
| Total (Category) | 43 (54.4%) | 36 (45.6%) |
| Total (Overall) | 188 (51.6%) | 176 (48.3%) |
Employment Industries by Sex in Golden
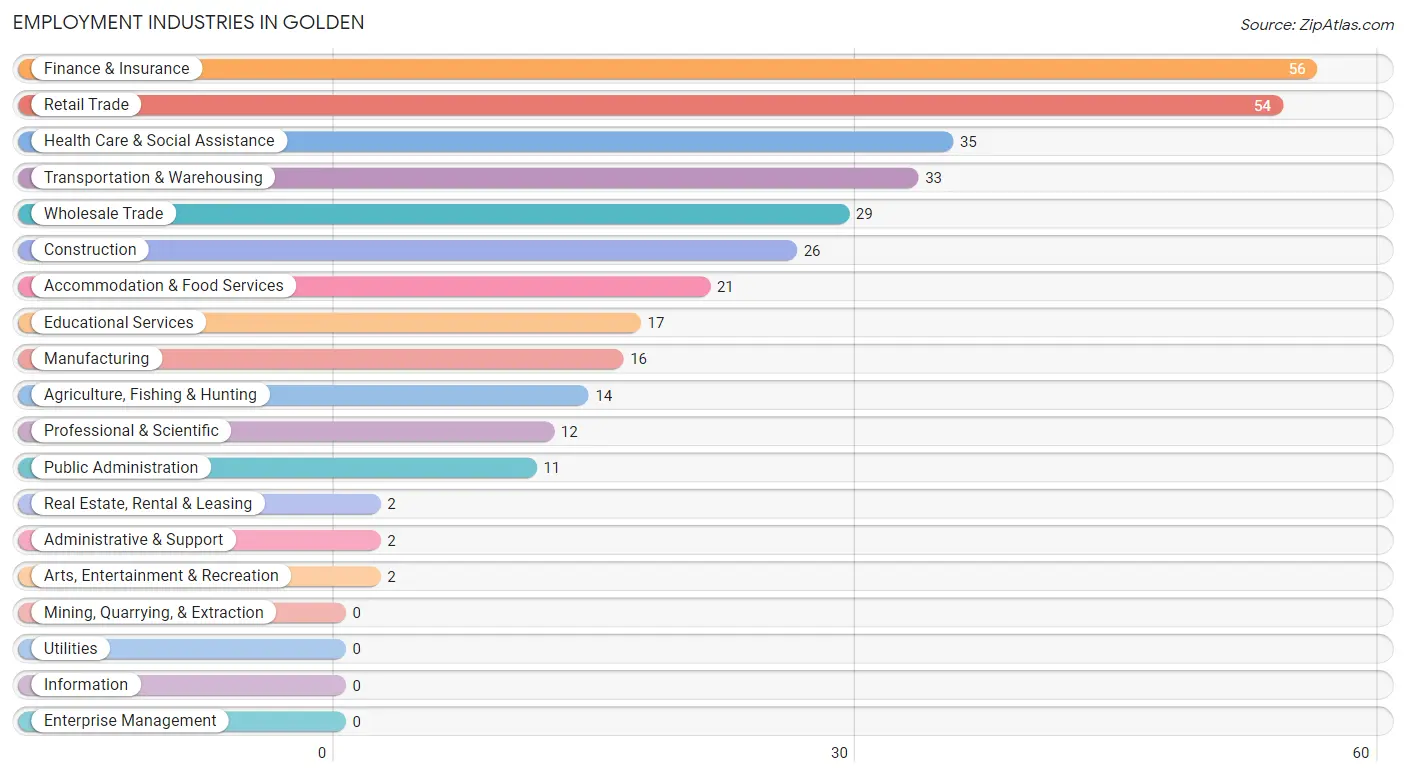
Employment Industries in Golden
The major employment industries in Golden include Finance & Insurance (56 | 15.4%), Retail Trade (54 | 14.8%), Health Care & Social Assistance (35 | 9.6%), Transportation & Warehousing (33 | 9.1%), and Wholesale Trade (29 | 8.0%).
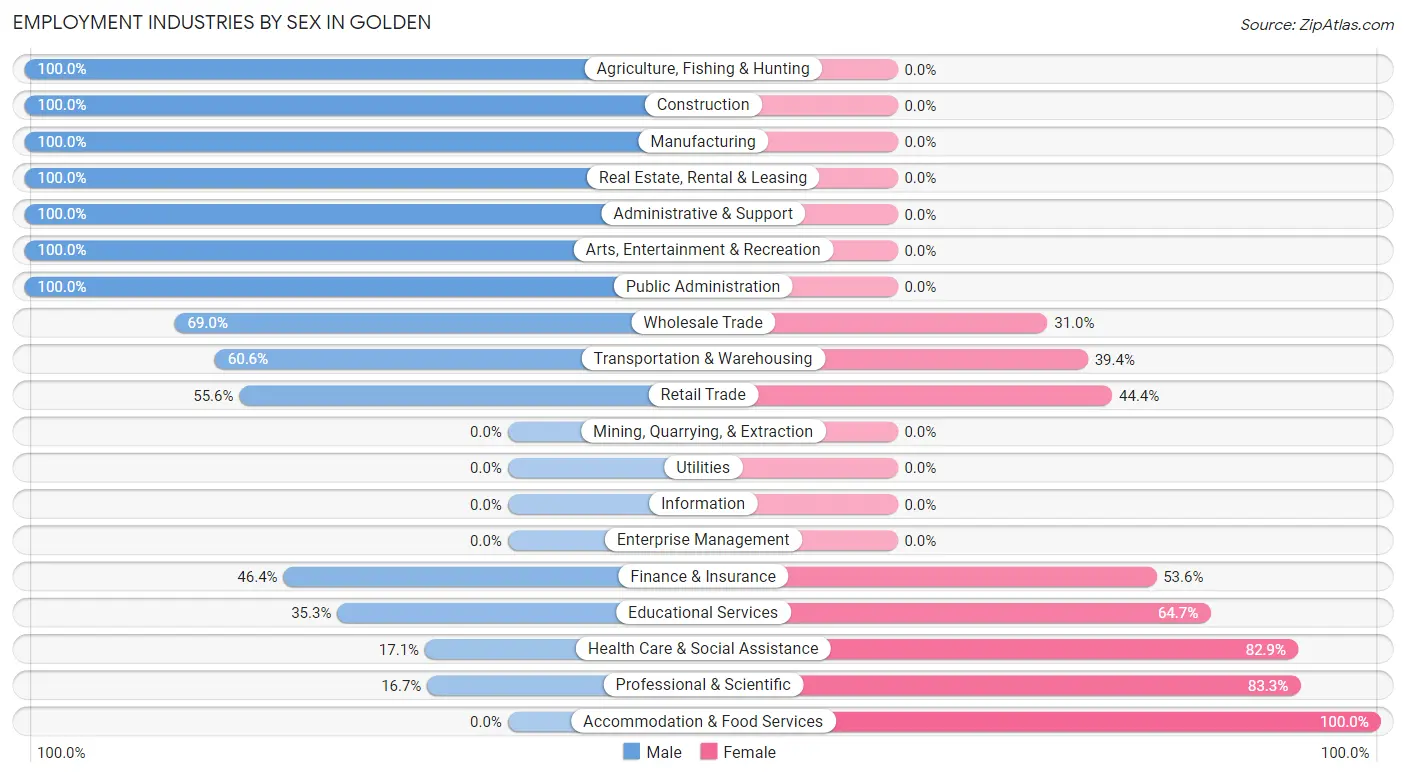
Employment Industries by Sex in Golden
The Golden industries that see more men than women are Agriculture, Fishing & Hunting (100.0%), Construction (100.0%), and Manufacturing (100.0%), whereas the industries that tend to have a higher number of women are Accommodation & Food Services (100.0%), Professional & Scientific (83.3%), and Health Care & Social Assistance (82.9%).
| Industry | Male | Female |
| Agriculture, Fishing & Hunting | 14 (100.0%) | 0 (0.0%) |
| Mining, Quarrying, & Extraction | 0 (0.0%) | 0 (0.0%) |
| Construction | 26 (100.0%) | 0 (0.0%) |
| Manufacturing | 16 (100.0%) | 0 (0.0%) |
| Wholesale Trade | 20 (69.0%) | 9 (31.0%) |
| Retail Trade | 30 (55.6%) | 24 (44.4%) |
| Transportation & Warehousing | 20 (60.6%) | 13 (39.4%) |
| Utilities | 0 (0.0%) | 0 (0.0%) |
| Information | 0 (0.0%) | 0 (0.0%) |
| Finance & Insurance | 26 (46.4%) | 30 (53.6%) |
| Real Estate, Rental & Leasing | 2 (100.0%) | 0 (0.0%) |
| Professional & Scientific | 2 (16.7%) | 10 (83.3%) |
| Enterprise Management | 0 (0.0%) | 0 (0.0%) |
| Administrative & Support | 2 (100.0%) | 0 (0.0%) |
| Educational Services | 6 (35.3%) | 11 (64.7%) |
| Health Care & Social Assistance | 6 (17.1%) | 29 (82.9%) |
| Arts, Entertainment & Recreation | 2 (100.0%) | 0 (0.0%) |
| Accommodation & Food Services | 0 (0.0%) | 21 (100.0%) |
| Public Administration | 11 (100.0%) | 0 (0.0%) |
| Total | 188 (51.6%) | 176 (48.3%) |
Education in Golden
School Enrollment in Golden
The most common levels of schooling among the 129 students in Golden are high school (34 | 26.4%), elementary school (31 | 24.0%), and kindergarten (28 | 21.7%).
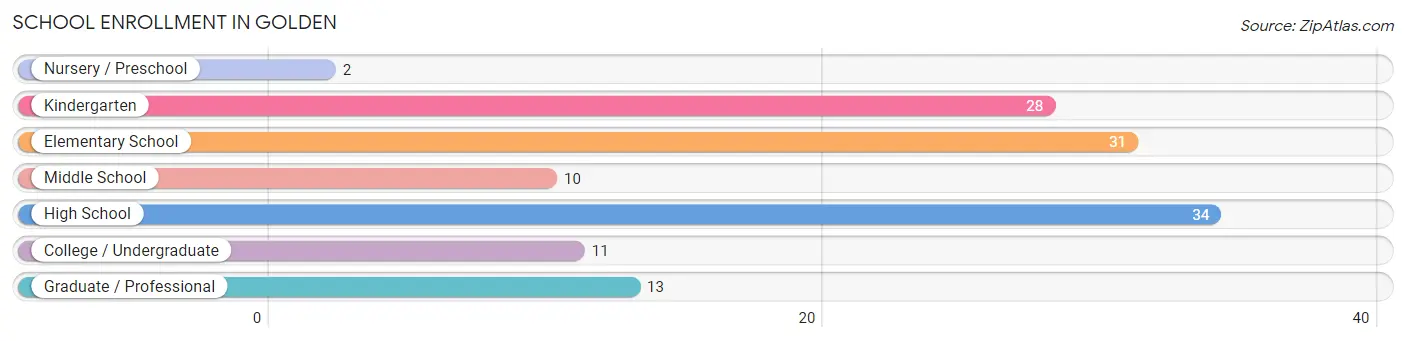
| School Level | # Students | % Students |
| Nursery / Preschool | 2 | 1.5% |
| Kindergarten | 28 | 21.7% |
| Elementary School | 31 | 24.0% |
| Middle School | 10 | 7.7% |
| High School | 34 | 26.4% |
| College / Undergraduate | 11 | 8.5% |
| Graduate / Professional | 13 | 10.1% |
| Total | 129 | 100.0% |
School Enrollment by Age by Funding Source in Golden
Out of a total of 129 students who are enrolled in schools in Golden, 7 (5.4%) attend a private institution, while the remaining 122 (94.6%) are enrolled in public schools. The age group of 20 to 24 year olds has the highest likelihood of being enrolled in private schools, with 4 (28.6% in the age bracket) enrolled. Conversely, the age group of 3 to 4 year olds has the lowest likelihood of being enrolled in a private school, with 2 (100.0% in the age bracket) attending a public institution.
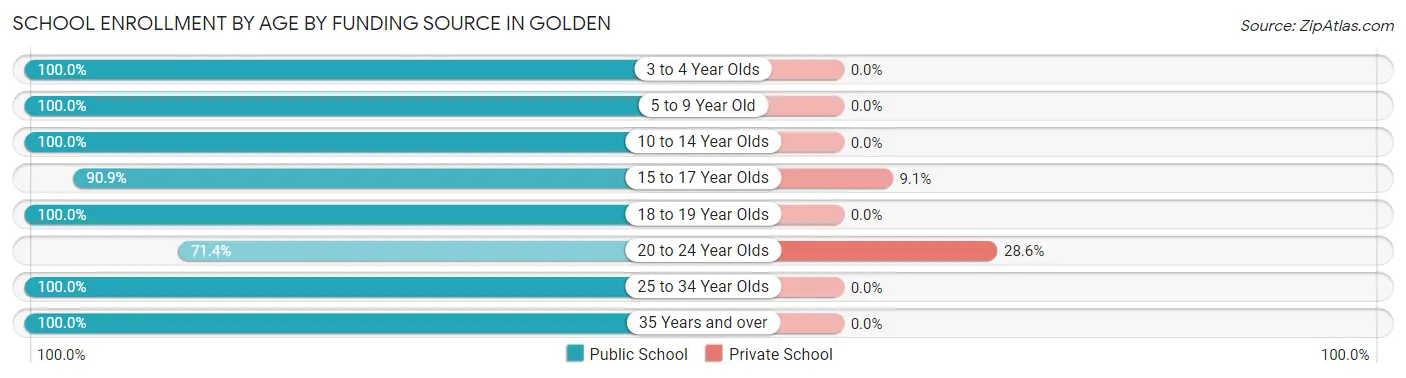
| Age Bracket | Public School | Private School |
| 3 to 4 Year Olds | 2 (100.0%) | 0 (0.0%) |
| 5 to 9 Year Old | 43 (100.0%) | 0 (0.0%) |
| 10 to 14 Year Olds | 28 (100.0%) | 0 (0.0%) |
| 15 to 17 Year Olds | 30 (90.9%) | 3 (9.1%) |
| 18 to 19 Year Olds | 2 (100.0%) | 0 (0.0%) |
| 20 to 24 Year Olds | 10 (71.4%) | 4 (28.6%) |
| 25 to 34 Year Olds | 4 (100.0%) | 0 (0.0%) |
| 35 Years and over | 3 (100.0%) | 0 (0.0%) |
| Total | 122 (94.6%) | 7 (5.4%) |
Educational Attainment by Field of Study in Golden
Business (43 | 32.6%), education (30 | 22.7%), arts & humanities (15 | 11.4%), social sciences (13 | 9.9%), and psychology (12 | 9.1%) are the most common fields of study among 132 individuals in Golden who have obtained a bachelor's degree or higher.
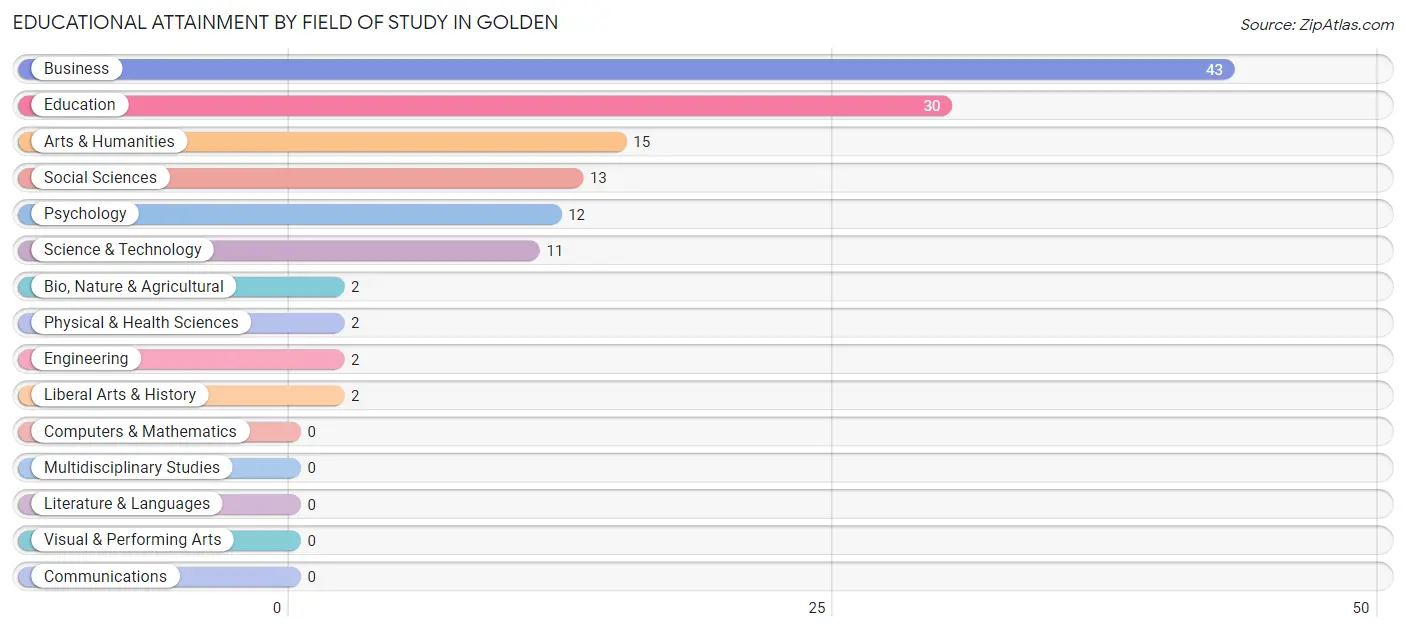
| Field of Study | # Graduates | % Graduates |
| Computers & Mathematics | 0 | 0.0% |
| Bio, Nature & Agricultural | 2 | 1.5% |
| Physical & Health Sciences | 2 | 1.5% |
| Psychology | 12 | 9.1% |
| Social Sciences | 13 | 9.9% |
| Engineering | 2 | 1.5% |
| Multidisciplinary Studies | 0 | 0.0% |
| Science & Technology | 11 | 8.3% |
| Business | 43 | 32.6% |
| Education | 30 | 22.7% |
| Literature & Languages | 0 | 0.0% |
| Liberal Arts & History | 2 | 1.5% |
| Visual & Performing Arts | 0 | 0.0% |
| Communications | 0 | 0.0% |
| Arts & Humanities | 15 | 11.4% |
| Total | 132 | 100.0% |
Transportation & Commute in Golden
Vehicle Availability by Sex in Golden
The most prevalent vehicle ownership categories in Golden are males with 2 vehicles (97, accounting for 51.6%) and females with 2 vehicles (59, making up 56.1%).
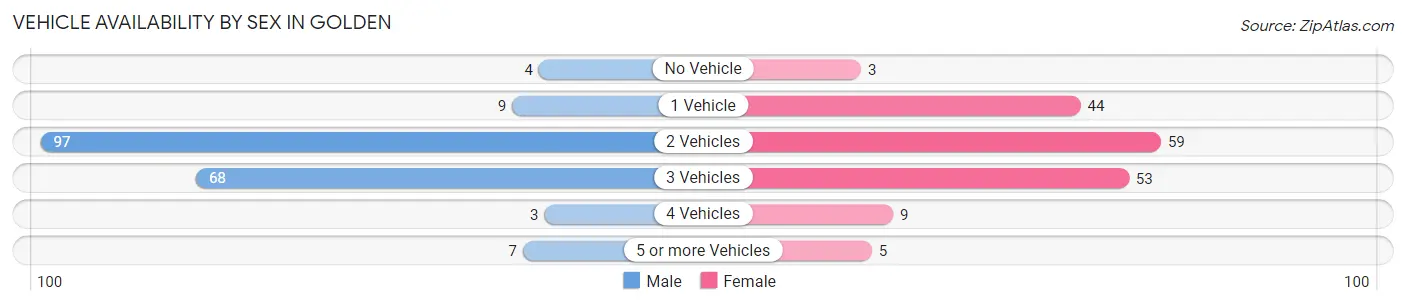
| Vehicles Available | Male | Female |
| No Vehicle | 4 (2.1%) | 3 (1.7%) |
| 1 Vehicle | 9 (4.8%) | 44 (25.4%) |
| 2 Vehicles | 97 (51.6%) | 59 (34.1%) |
| 3 Vehicles | 68 (36.2%) | 53 (30.6%) |
| 4 Vehicles | 3 (1.6%) | 9 (5.2%) |
| 5 or more Vehicles | 7 (3.7%) | 5 (2.9%) |
| Total | 188 (100.0%) | 173 (100.0%) |
Commute Time in Golden
The most frequently occuring commute durations in Golden are 30 to 34 minutes (82 commuters, 23.0%), 45 to 59 minutes (61 commuters, 17.1%), and 35 to 39 minutes (39 commuters, 10.9%).
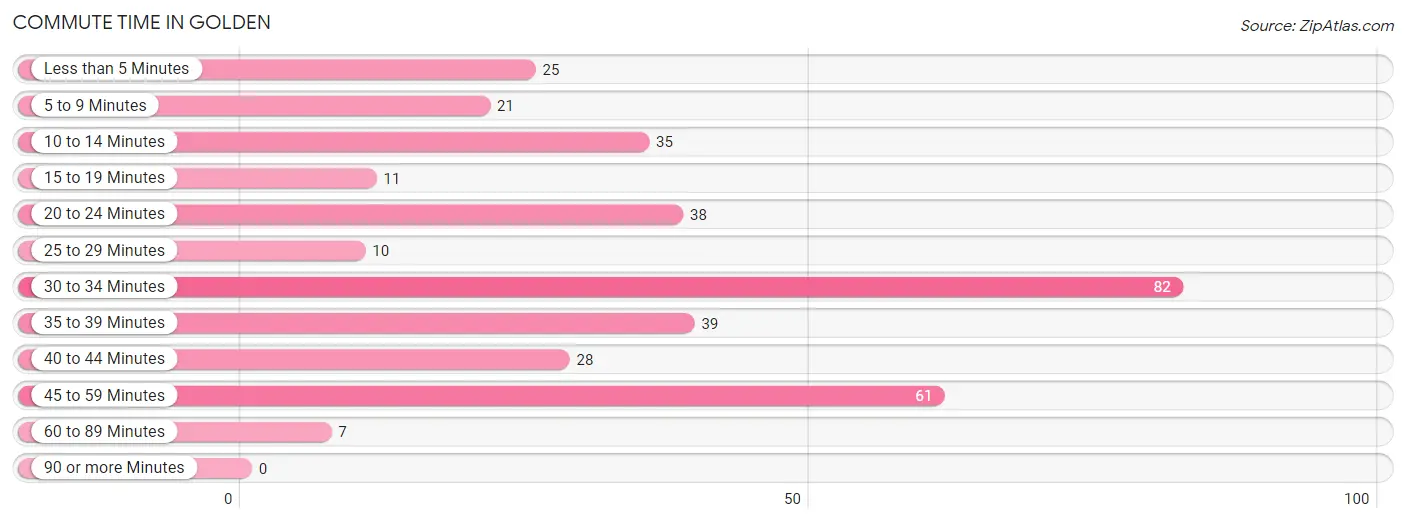
| Commute Time | # Commuters | % Commuters |
| Less than 5 Minutes | 25 | 7.0% |
| 5 to 9 Minutes | 21 | 5.9% |
| 10 to 14 Minutes | 35 | 9.8% |
| 15 to 19 Minutes | 11 | 3.1% |
| 20 to 24 Minutes | 38 | 10.6% |
| 25 to 29 Minutes | 10 | 2.8% |
| 30 to 34 Minutes | 82 | 23.0% |
| 35 to 39 Minutes | 39 | 10.9% |
| 40 to 44 Minutes | 28 | 7.8% |
| 45 to 59 Minutes | 61 | 17.1% |
| 60 to 89 Minutes | 7 | 2.0% |
| 90 or more Minutes | 0 | 0.0% |
Commute Time by Sex in Golden
The most common commute times in Golden are 45 to 59 minutes (40 commuters, 21.3%) for males and 30 to 34 minutes (47 commuters, 27.8%) for females.
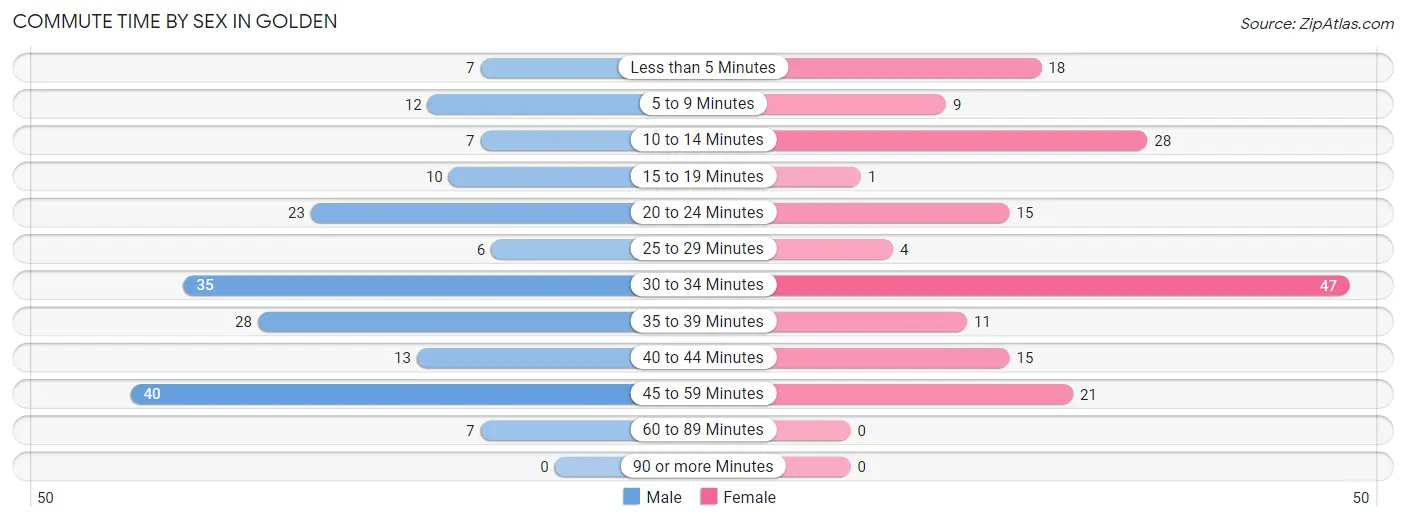
| Commute Time | Male | Female |
| Less than 5 Minutes | 7 (3.7%) | 18 (10.6%) |
| 5 to 9 Minutes | 12 (6.4%) | 9 (5.3%) |
| 10 to 14 Minutes | 7 (3.7%) | 28 (16.6%) |
| 15 to 19 Minutes | 10 (5.3%) | 1 (0.6%) |
| 20 to 24 Minutes | 23 (12.2%) | 15 (8.9%) |
| 25 to 29 Minutes | 6 (3.2%) | 4 (2.4%) |
| 30 to 34 Minutes | 35 (18.6%) | 47 (27.8%) |
| 35 to 39 Minutes | 28 (14.9%) | 11 (6.5%) |
| 40 to 44 Minutes | 13 (6.9%) | 15 (8.9%) |
| 45 to 59 Minutes | 40 (21.3%) | 21 (12.4%) |
| 60 to 89 Minutes | 7 (3.7%) | 0 (0.0%) |
| 90 or more Minutes | 0 (0.0%) | 0 (0.0%) |
Time of Departure to Work by Sex in Golden
The most frequent times of departure to work in Golden are 7:00 AM to 7:29 AM (50, 26.6%) for males and 7:30 AM to 7:59 AM (54, 32.0%) for females.
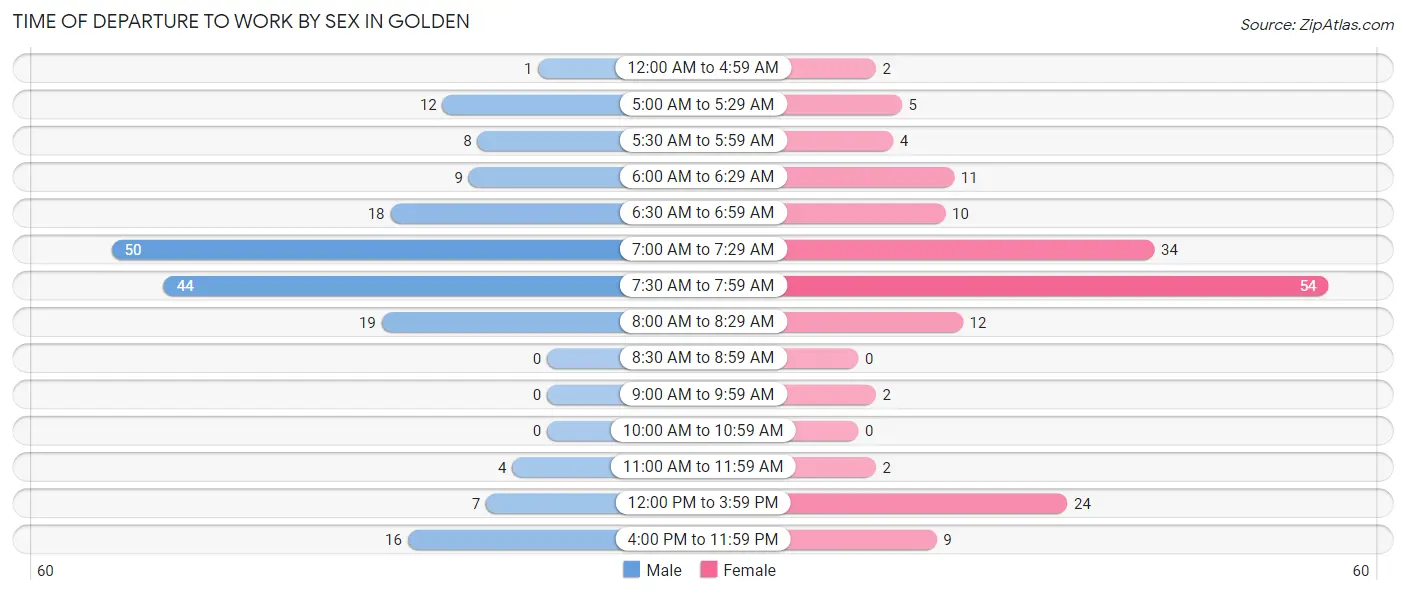
| Time of Departure | Male | Female |
| 12:00 AM to 4:59 AM | 1 (0.5%) | 2 (1.2%) |
| 5:00 AM to 5:29 AM | 12 (6.4%) | 5 (3.0%) |
| 5:30 AM to 5:59 AM | 8 (4.3%) | 4 (2.4%) |
| 6:00 AM to 6:29 AM | 9 (4.8%) | 11 (6.5%) |
| 6:30 AM to 6:59 AM | 18 (9.6%) | 10 (5.9%) |
| 7:00 AM to 7:29 AM | 50 (26.6%) | 34 (20.1%) |
| 7:30 AM to 7:59 AM | 44 (23.4%) | 54 (32.0%) |
| 8:00 AM to 8:29 AM | 19 (10.1%) | 12 (7.1%) |
| 8:30 AM to 8:59 AM | 0 (0.0%) | 0 (0.0%) |
| 9:00 AM to 9:59 AM | 0 (0.0%) | 2 (1.2%) |
| 10:00 AM to 10:59 AM | 0 (0.0%) | 0 (0.0%) |
| 11:00 AM to 11:59 AM | 4 (2.1%) | 2 (1.2%) |
| 12:00 PM to 3:59 PM | 7 (3.7%) | 24 (14.2%) |
| 4:00 PM to 11:59 PM | 16 (8.5%) | 9 (5.3%) |
| Total | 188 (100.0%) | 169 (100.0%) |
Housing Occupancy in Golden
Occupancy by Ownership in Golden
Of the total 322 dwellings in Golden, owner-occupied units account for 254 (78.9%), while renter-occupied units make up 68 (21.1%).
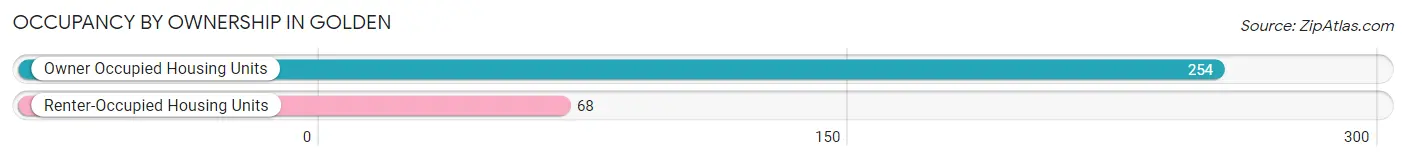
| Occupancy | # Housing Units | % Housing Units |
| Owner Occupied Housing Units | 254 | 78.9% |
| Renter-Occupied Housing Units | 68 | 21.1% |
| Total Occupied Housing Units | 322 | 100.0% |
Occupancy by Household Size in Golden
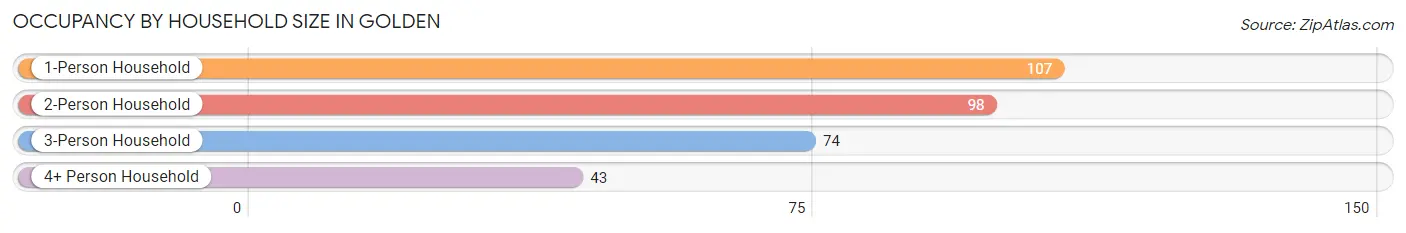
| Household Size | # Housing Units | % Housing Units |
| 1-Person Household | 107 | 33.2% |
| 2-Person Household | 98 | 30.4% |
| 3-Person Household | 74 | 23.0% |
| 4+ Person Household | 43 | 13.4% |
| Total Housing Units | 322 | 100.0% |
Occupancy by Ownership by Household Size in Golden
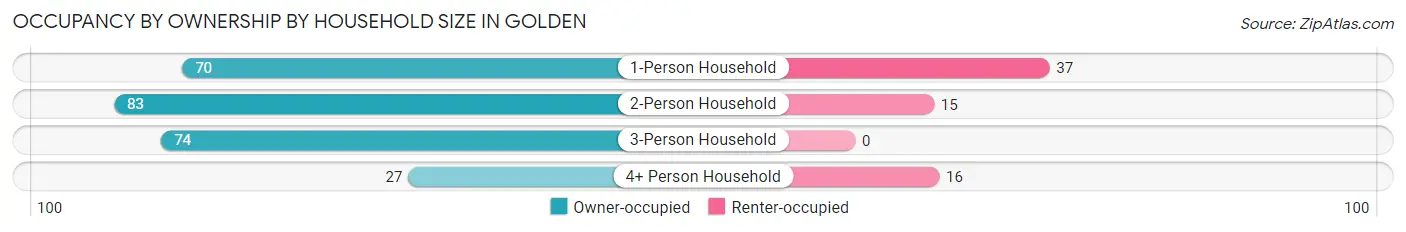
| Household Size | Owner-occupied | Renter-occupied |
| 1-Person Household | 70 (65.4%) | 37 (34.6%) |
| 2-Person Household | 83 (84.7%) | 15 (15.3%) |
| 3-Person Household | 74 (100.0%) | 0 (0.0%) |
| 4+ Person Household | 27 (62.8%) | 16 (37.2%) |
| Total Housing Units | 254 (78.9%) | 68 (21.1%) |
Occupancy by Educational Attainment in Golden
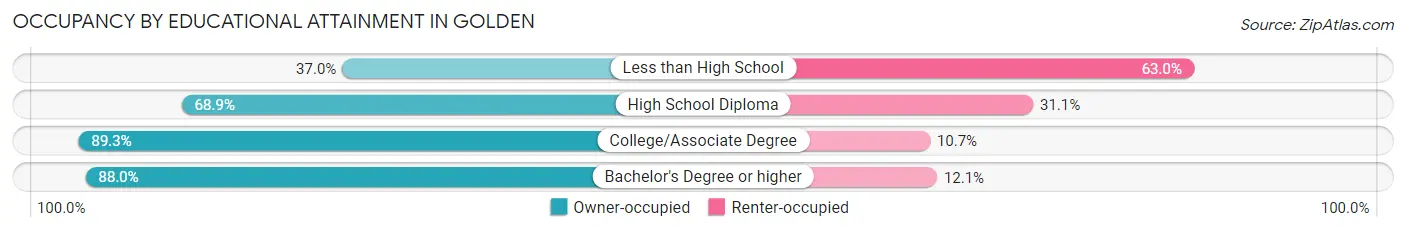
| Household Size | Owner-occupied | Renter-occupied |
| Less than High School | 10 (37.0%) | 17 (63.0%) |
| High School Diploma | 62 (68.9%) | 28 (31.1%) |
| College/Associate Degree | 109 (89.3%) | 13 (10.7%) |
| Bachelor's Degree or higher | 73 (87.9%) | 10 (12.0%) |
Occupancy by Age of Householder in Golden
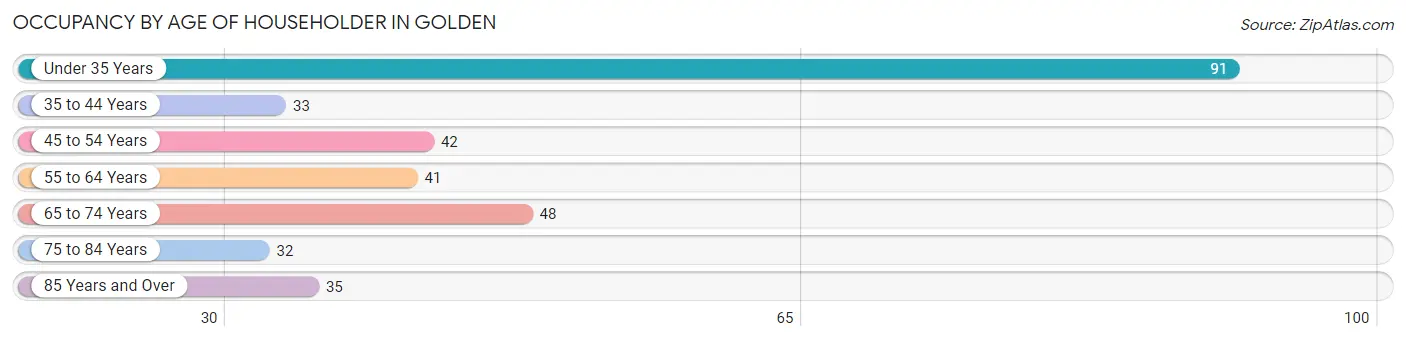
| Age Bracket | # Households | % Households |
| Under 35 Years | 91 | 28.3% |
| 35 to 44 Years | 33 | 10.2% |
| 45 to 54 Years | 42 | 13.0% |
| 55 to 64 Years | 41 | 12.7% |
| 65 to 74 Years | 48 | 14.9% |
| 75 to 84 Years | 32 | 9.9% |
| 85 Years and Over | 35 | 10.9% |
| Total | 322 | 100.0% |
Housing Finances in Golden
Median Income by Occupancy in Golden
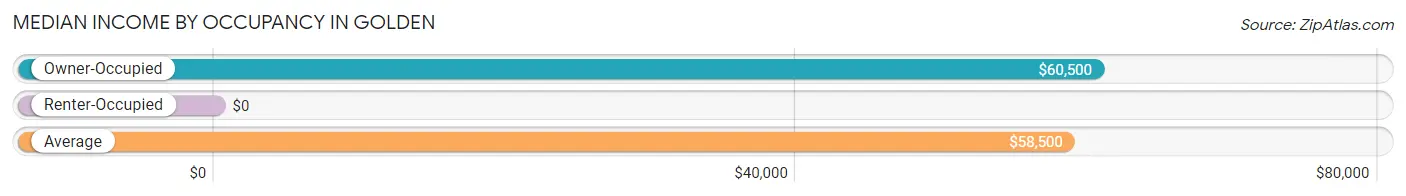
| Occupancy Type | # Households | Median Income |
| Owner-Occupied | 254 (78.9%) | $60,500 |
| Renter-Occupied | 68 (21.1%) | $0 |
| Average | 322 (100.0%) | $58,500 |
Occupancy by Householder Income Bracket in Golden
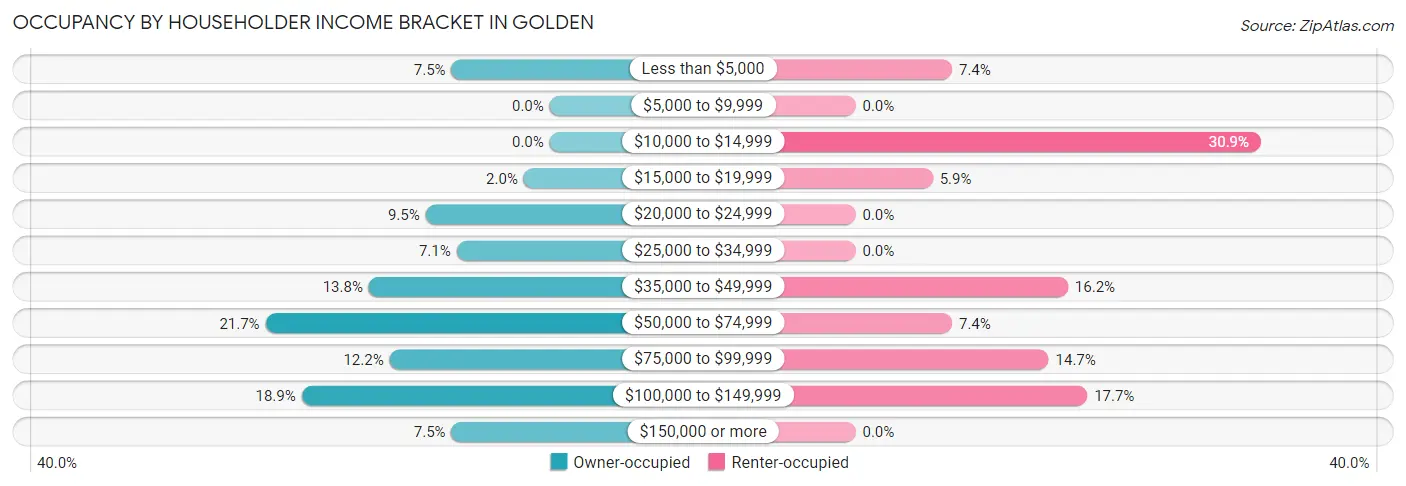
| Income Bracket | Owner-occupied | Renter-occupied |
| Less than $5,000 | 19 (7.5%) | 5 (7.3%) |
| $5,000 to $9,999 | 0 (0.0%) | 0 (0.0%) |
| $10,000 to $14,999 | 0 (0.0%) | 21 (30.9%) |
| $15,000 to $19,999 | 5 (2.0%) | 4 (5.9%) |
| $20,000 to $24,999 | 24 (9.5%) | 0 (0.0%) |
| $25,000 to $34,999 | 18 (7.1%) | 0 (0.0%) |
| $35,000 to $49,999 | 35 (13.8%) | 11 (16.2%) |
| $50,000 to $74,999 | 55 (21.6%) | 5 (7.3%) |
| $75,000 to $99,999 | 31 (12.2%) | 10 (14.7%) |
| $100,000 to $149,999 | 48 (18.9%) | 12 (17.6%) |
| $150,000 or more | 19 (7.5%) | 0 (0.0%) |
| Total | 254 (100.0%) | 68 (100.0%) |
Monthly Housing Cost Tiers in Golden
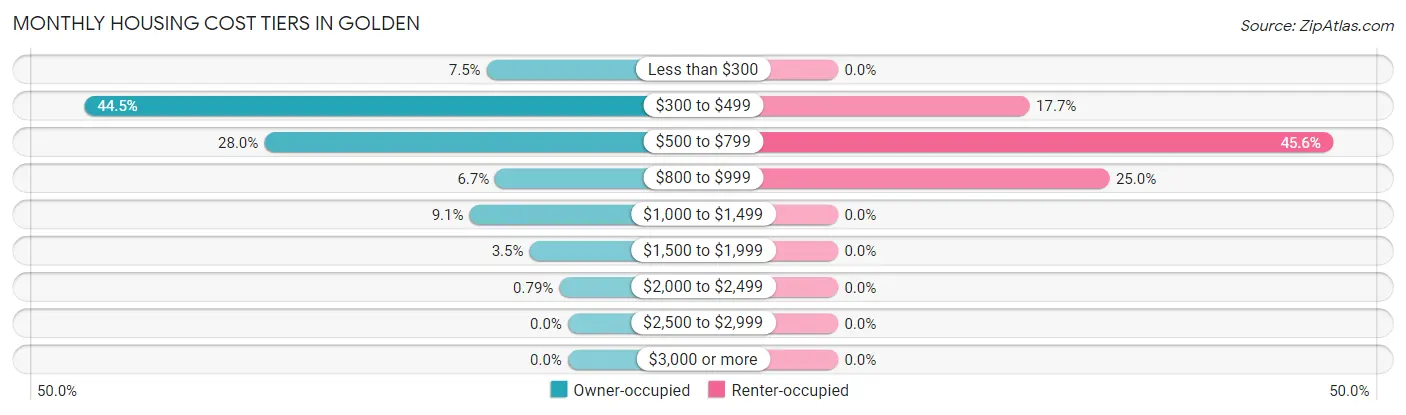
| Monthly Cost | Owner-occupied | Renter-occupied |
| Less than $300 | 19 (7.5%) | 0 (0.0%) |
| $300 to $499 | 113 (44.5%) | 12 (17.6%) |
| $500 to $799 | 71 (28.0%) | 31 (45.6%) |
| $800 to $999 | 17 (6.7%) | 17 (25.0%) |
| $1,000 to $1,499 | 23 (9.1%) | 0 (0.0%) |
| $1,500 to $1,999 | 9 (3.5%) | 0 (0.0%) |
| $2,000 to $2,499 | 2 (0.8%) | 0 (0.0%) |
| $2,500 to $2,999 | 0 (0.0%) | 0 (0.0%) |
| $3,000 or more | 0 (0.0%) | 0 (0.0%) |
| Total | 254 (100.0%) | 68 (100.0%) |
Physical Housing Characteristics in Golden
Housing Structures in Golden
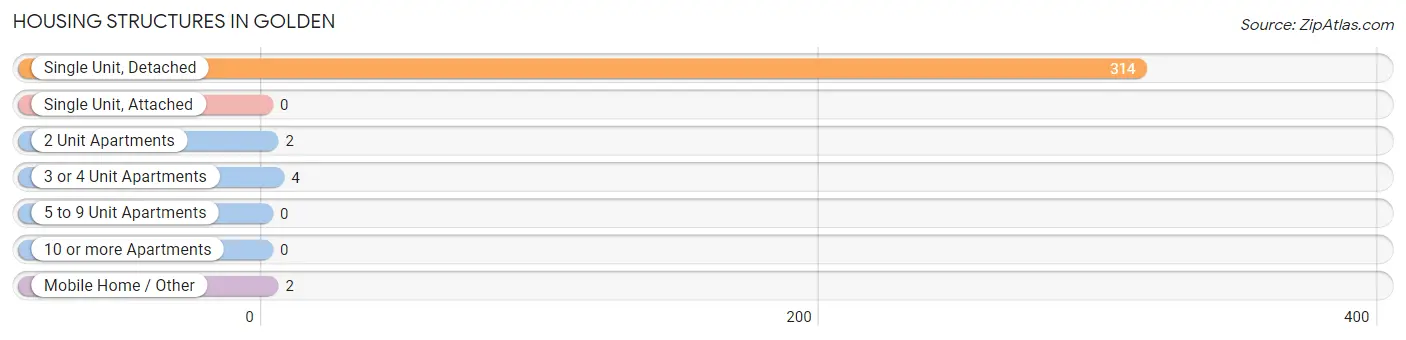
| Structure Type | # Housing Units | % Housing Units |
| Single Unit, Detached | 314 | 97.5% |
| Single Unit, Attached | 0 | 0.0% |
| 2 Unit Apartments | 2 | 0.6% |
| 3 or 4 Unit Apartments | 4 | 1.2% |
| 5 to 9 Unit Apartments | 0 | 0.0% |
| 10 or more Apartments | 0 | 0.0% |
| Mobile Home / Other | 2 | 0.6% |
| Total | 322 | 100.0% |
Housing Structures by Occupancy in Golden
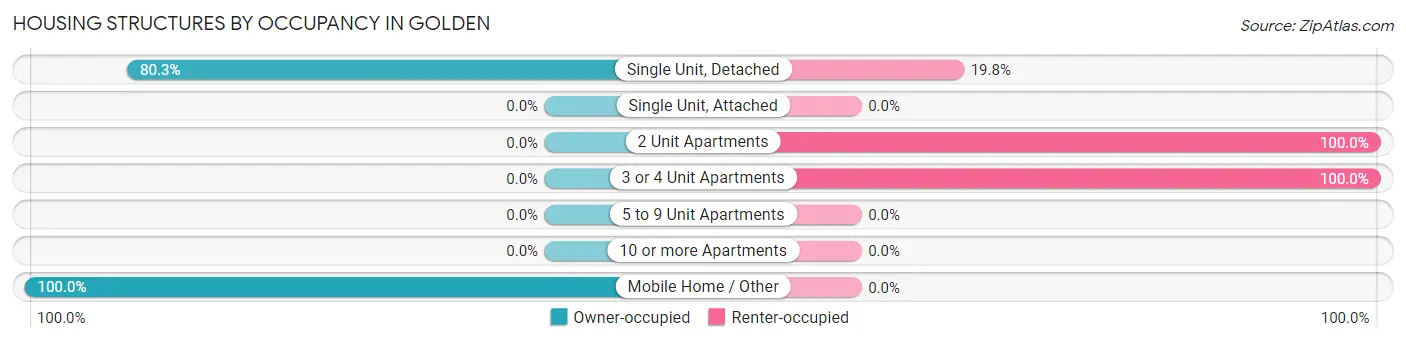
| Structure Type | Owner-occupied | Renter-occupied |
| Single Unit, Detached | 252 (80.2%) | 62 (19.8%) |
| Single Unit, Attached | 0 (0.0%) | 0 (0.0%) |
| 2 Unit Apartments | 0 (0.0%) | 2 (100.0%) |
| 3 or 4 Unit Apartments | 0 (0.0%) | 4 (100.0%) |
| 5 to 9 Unit Apartments | 0 (0.0%) | 0 (0.0%) |
| 10 or more Apartments | 0 (0.0%) | 0 (0.0%) |
| Mobile Home / Other | 2 (100.0%) | 0 (0.0%) |
| Total | 254 (78.9%) | 68 (21.1%) |
Housing Structures by Number of Rooms in Golden
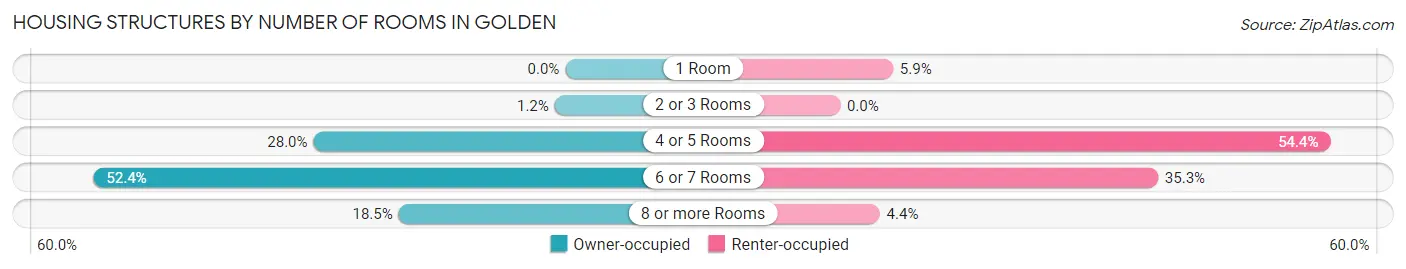
| Number of Rooms | Owner-occupied | Renter-occupied |
| 1 Room | 0 (0.0%) | 4 (5.9%) |
| 2 or 3 Rooms | 3 (1.2%) | 0 (0.0%) |
| 4 or 5 Rooms | 71 (28.0%) | 37 (54.4%) |
| 6 or 7 Rooms | 133 (52.4%) | 24 (35.3%) |
| 8 or more Rooms | 47 (18.5%) | 3 (4.4%) |
| Total | 254 (100.0%) | 68 (100.0%) |
Housing Structure by Heating Type in Golden
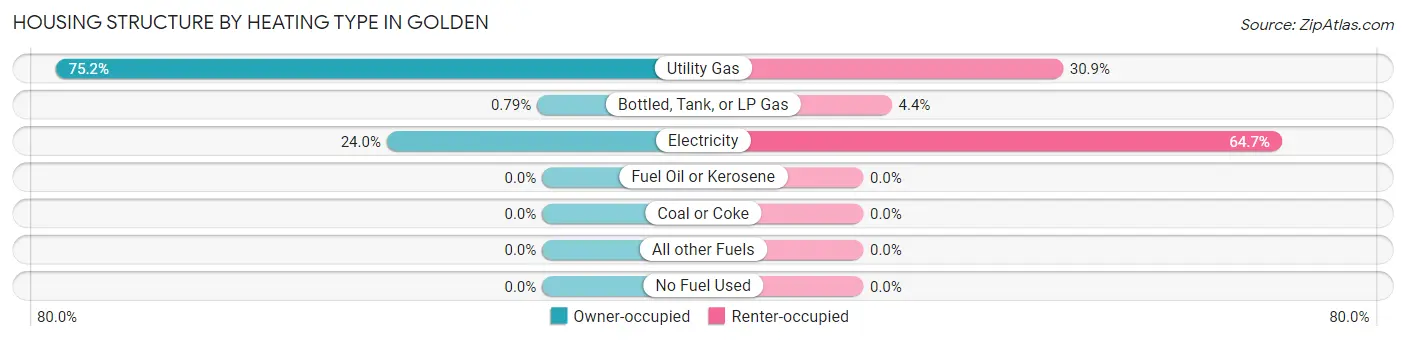
| Heating Type | Owner-occupied | Renter-occupied |
| Utility Gas | 191 (75.2%) | 21 (30.9%) |
| Bottled, Tank, or LP Gas | 2 (0.8%) | 3 (4.4%) |
| Electricity | 61 (24.0%) | 44 (64.7%) |
| Fuel Oil or Kerosene | 0 (0.0%) | 0 (0.0%) |
| Coal or Coke | 0 (0.0%) | 0 (0.0%) |
| All other Fuels | 0 (0.0%) | 0 (0.0%) |
| No Fuel Used | 0 (0.0%) | 0 (0.0%) |
| Total | 254 (100.0%) | 68 (100.0%) |
Household Vehicle Usage in Golden
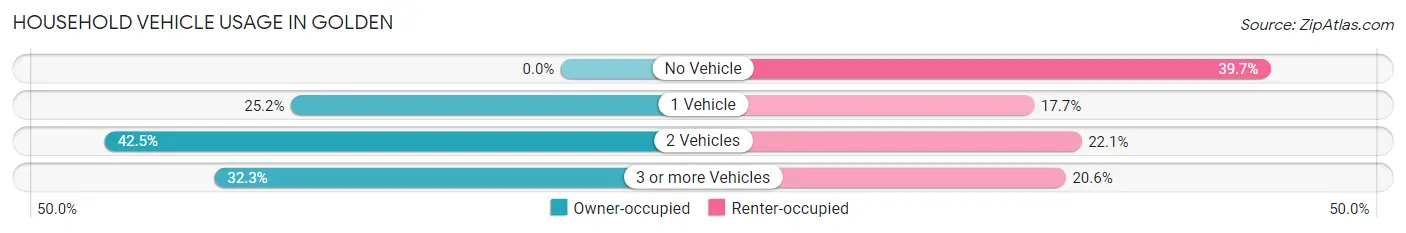
| Vehicles per Household | Owner-occupied | Renter-occupied |
| No Vehicle | 0 (0.0%) | 27 (39.7%) |
| 1 Vehicle | 64 (25.2%) | 12 (17.6%) |
| 2 Vehicles | 108 (42.5%) | 15 (22.1%) |
| 3 or more Vehicles | 82 (32.3%) | 14 (20.6%) |
| Total | 254 (100.0%) | 68 (100.0%) |
Real Estate & Mortgages in Golden
Real Estate and Mortgage Overview in Golden
| Characteristic | Without Mortgage | With Mortgage |
| Housing Units | 166 | 88 |
| Median Property Value | $121,000 | $95,600 |
| Median Household Income | $54,500 | $5 |
| Monthly Housing Costs | $431 | $0 |
| Real Estate Taxes | $1,407 | $0 |
Property Value by Mortgage Status in Golden
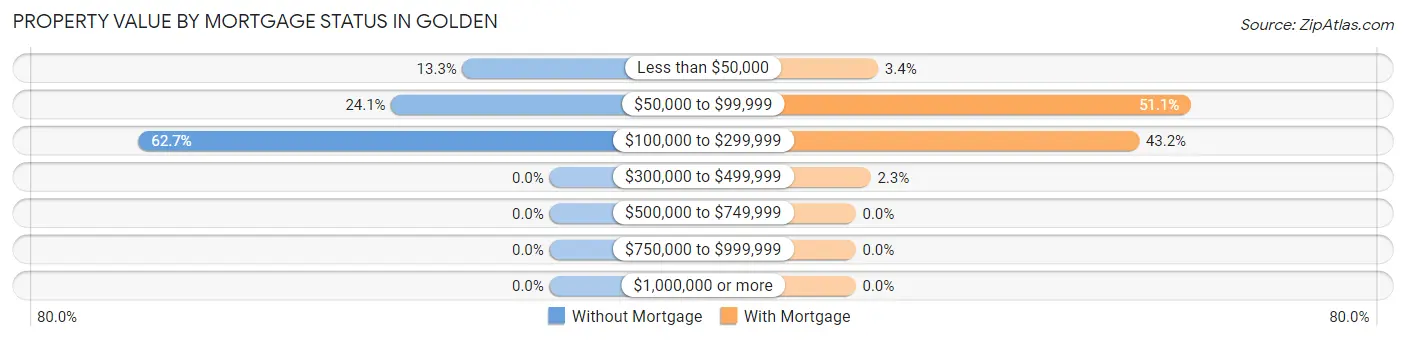
| Property Value | Without Mortgage | With Mortgage |
| Less than $50,000 | 22 (13.3%) | 3 (3.4%) |
| $50,000 to $99,999 | 40 (24.1%) | 45 (51.1%) |
| $100,000 to $299,999 | 104 (62.6%) | 38 (43.2%) |
| $300,000 to $499,999 | 0 (0.0%) | 2 (2.3%) |
| $500,000 to $749,999 | 0 (0.0%) | 0 (0.0%) |
| $750,000 to $999,999 | 0 (0.0%) | 0 (0.0%) |
| $1,000,000 or more | 0 (0.0%) | 0 (0.0%) |
| Total | 166 (100.0%) | 88 (100.0%) |
Household Income by Mortgage Status in Golden
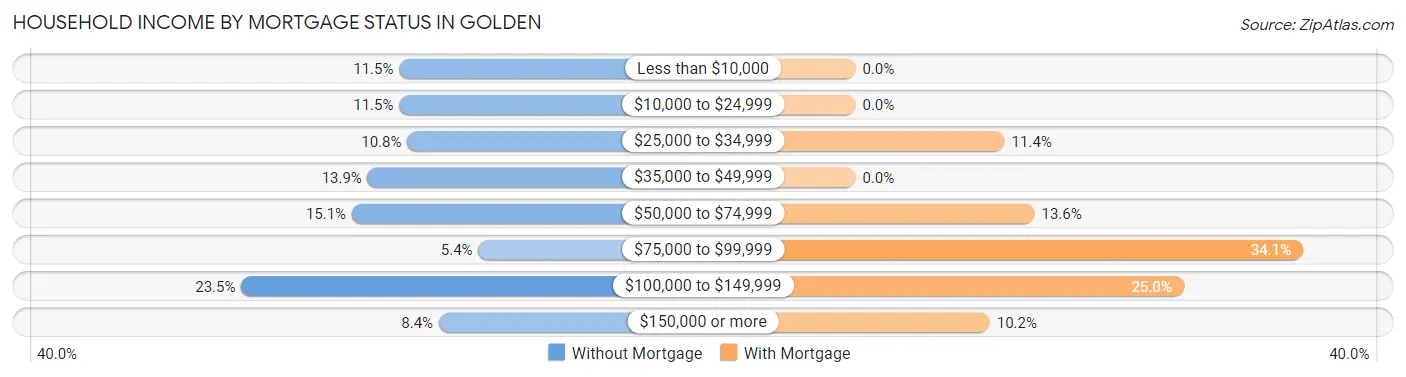
| Household Income | Without Mortgage | With Mortgage |
| Less than $10,000 | 19 (11.5%) | 0 (0.0%) |
| $10,000 to $24,999 | 19 (11.5%) | 0 (0.0%) |
| $25,000 to $34,999 | 18 (10.8%) | 10 (11.4%) |
| $35,000 to $49,999 | 23 (13.9%) | 0 (0.0%) |
| $50,000 to $74,999 | 25 (15.1%) | 12 (13.6%) |
| $75,000 to $99,999 | 9 (5.4%) | 30 (34.1%) |
| $100,000 to $149,999 | 39 (23.5%) | 22 (25.0%) |
| $150,000 or more | 14 (8.4%) | 9 (10.2%) |
| Total | 166 (100.0%) | 88 (100.0%) |
Property Value to Household Income Ratio in Golden
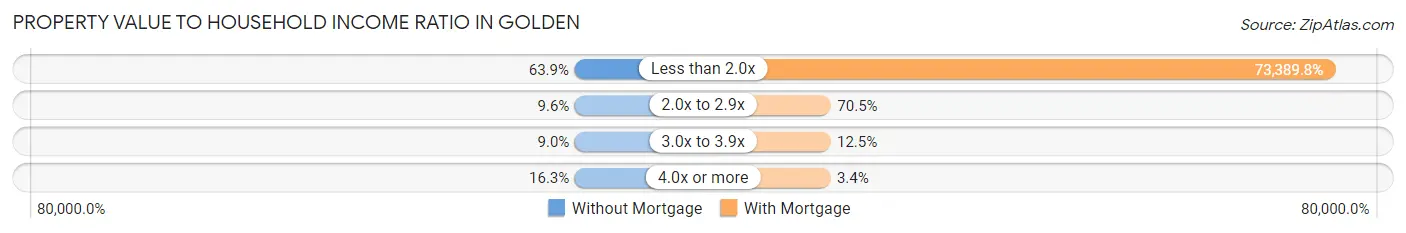
| Value-to-Income Ratio | Without Mortgage | With Mortgage |
| Less than 2.0x | 106 (63.9%) | 64,583 (73,389.8%) |
| 2.0x to 2.9x | 16 (9.6%) | 62 (70.5%) |
| 3.0x to 3.9x | 15 (9.0%) | 11 (12.5%) |
| 4.0x or more | 27 (16.3%) | 3 (3.4%) |
| Total | 166 (100.0%) | 88 (100.0%) |
Real Estate Taxes by Mortgage Status in Golden
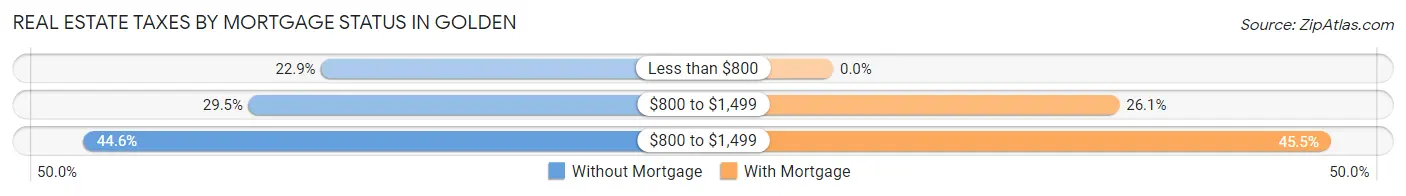
| Property Taxes | Without Mortgage | With Mortgage |
| Less than $800 | 38 (22.9%) | 0 (0.0%) |
| $800 to $1,499 | 49 (29.5%) | 23 (26.1%) |
| $800 to $1,499 | 74 (44.6%) | 40 (45.5%) |
| Total | 166 (100.0%) | 88 (100.0%) |
Health & Disability in Golden
Health Insurance Coverage by Age in Golden
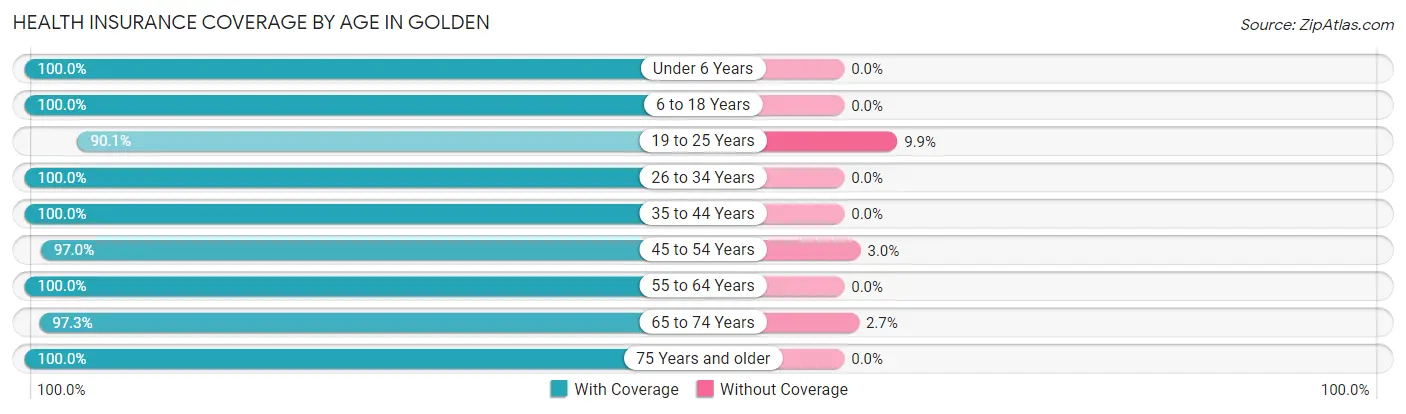
| Age Bracket | With Coverage | Without Coverage |
| Under 6 Years | 87 (100.0%) | 0 (0.0%) |
| 6 to 18 Years | 103 (100.0%) | 0 (0.0%) |
| 19 to 25 Years | 73 (90.1%) | 8 (9.9%) |
| 26 to 34 Years | 126 (100.0%) | 0 (0.0%) |
| 35 to 44 Years | 51 (100.0%) | 0 (0.0%) |
| 45 to 54 Years | 64 (97.0%) | 2 (3.0%) |
| 55 to 64 Years | 72 (100.0%) | 0 (0.0%) |
| 65 to 74 Years | 71 (97.3%) | 2 (2.7%) |
| 75 Years and older | 89 (100.0%) | 0 (0.0%) |
| Total | 736 (98.4%) | 12 (1.6%) |
Health Insurance Coverage by Citizenship Status in Golden
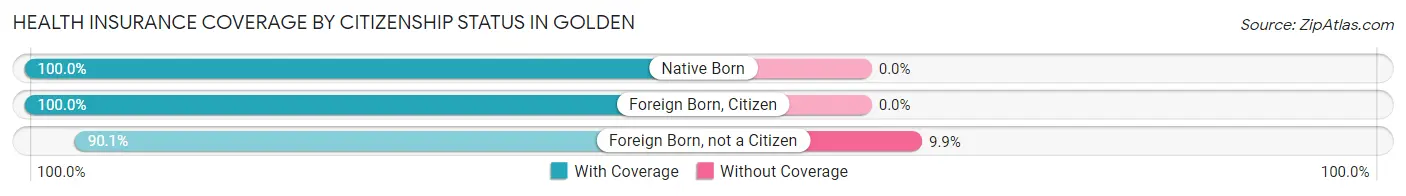
| Citizenship Status | With Coverage | Without Coverage |
| Native Born | 87 (100.0%) | 0 (0.0%) |
| Foreign Born, Citizen | 103 (100.0%) | 0 (0.0%) |
| Foreign Born, not a Citizen | 73 (90.1%) | 8 (9.9%) |
Health Insurance Coverage by Household Income in Golden
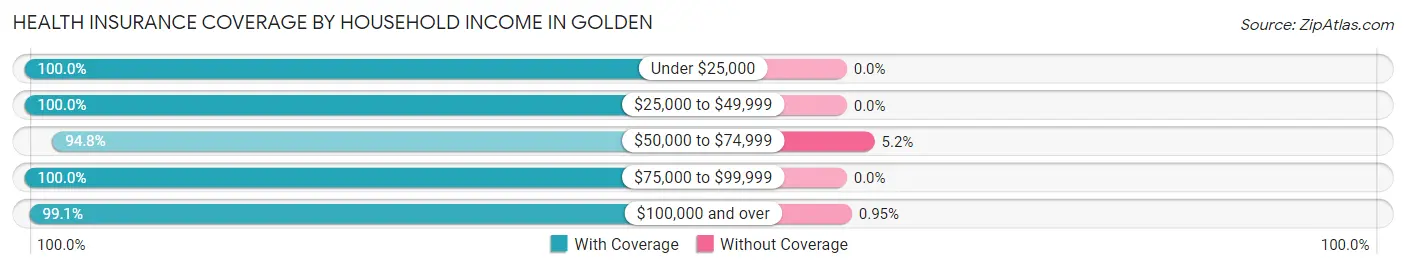
| Household Income | With Coverage | Without Coverage |
| Under $25,000 | 84 (100.0%) | 0 (0.0%) |
| $25,000 to $49,999 | 111 (100.0%) | 0 (0.0%) |
| $50,000 to $74,999 | 182 (94.8%) | 10 (5.2%) |
| $75,000 to $99,999 | 151 (100.0%) | 0 (0.0%) |
| $100,000 and over | 208 (99.1%) | 2 (0.9%) |
Public vs Private Health Insurance Coverage by Age in Golden
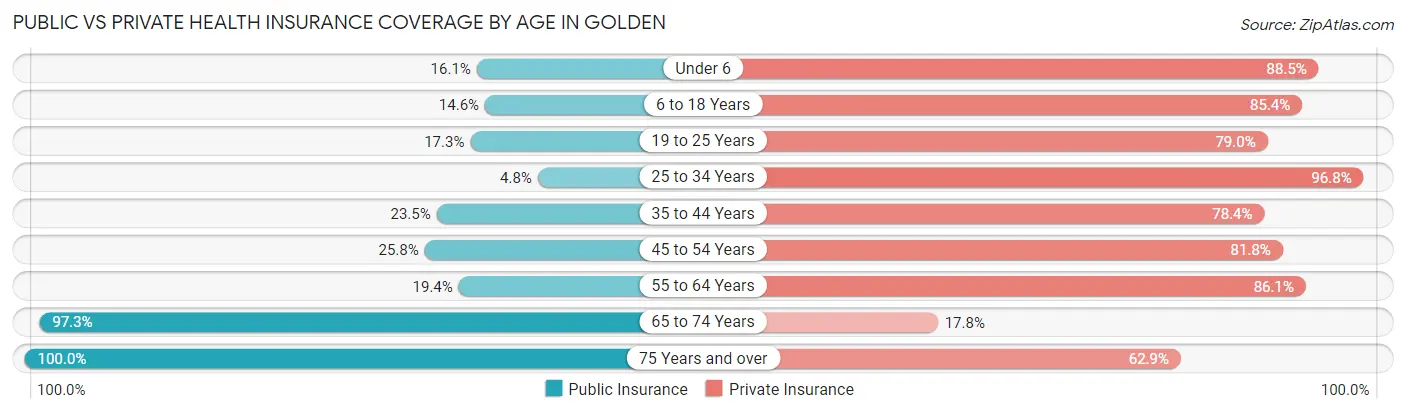
| Age Bracket | Public Insurance | Private Insurance |
| Under 6 | 14 (16.1%) | 77 (88.5%) |
| 6 to 18 Years | 15 (14.6%) | 88 (85.4%) |
| 19 to 25 Years | 14 (17.3%) | 64 (79.0%) |
| 25 to 34 Years | 6 (4.8%) | 122 (96.8%) |
| 35 to 44 Years | 12 (23.5%) | 40 (78.4%) |
| 45 to 54 Years | 17 (25.8%) | 54 (81.8%) |
| 55 to 64 Years | 14 (19.4%) | 62 (86.1%) |
| 65 to 74 Years | 71 (97.3%) | 13 (17.8%) |
| 75 Years and over | 89 (100.0%) | 56 (62.9%) |
| Total | 252 (33.7%) | 576 (77.0%) |
Disability Status by Sex by Age in Golden
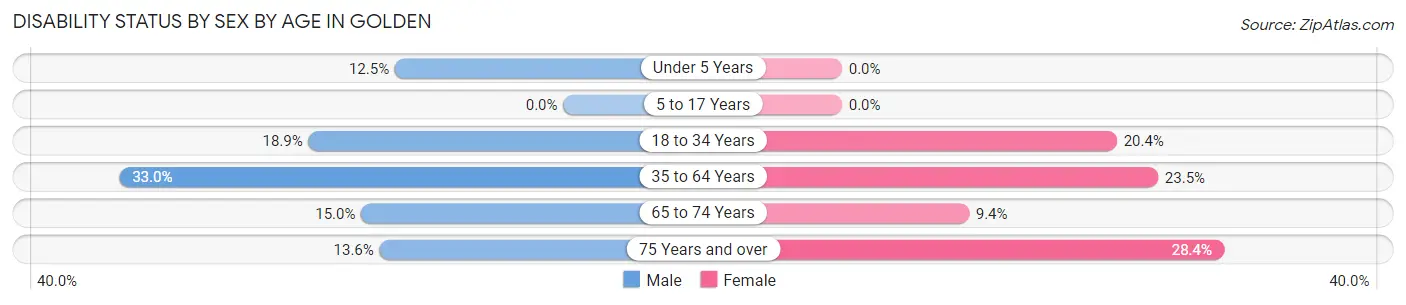
| Age Bracket | Male | Female |
| Under 5 Years | 7 (12.5%) | 0 (0.0%) |
| 5 to 17 Years | 0 (0.0%) | 0 (0.0%) |
| 18 to 34 Years | 21 (18.9%) | 20 (20.4%) |
| 35 to 64 Years | 30 (33.0%) | 23 (23.5%) |
| 65 to 74 Years | 3 (15.0%) | 5 (9.4%) |
| 75 Years and over | 3 (13.6%) | 19 (28.4%) |
Disability Class by Sex by Age in Golden
Disability Class: Hearing Difficulty
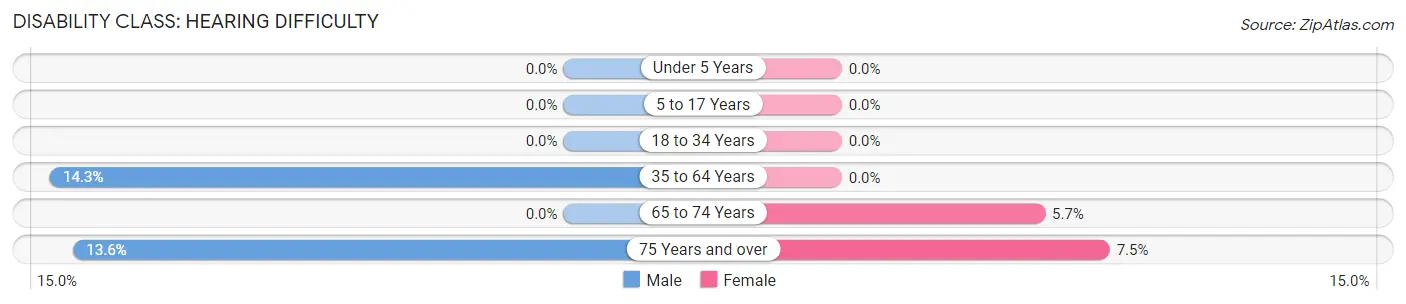
| Age Bracket | Male | Female |
| Under 5 Years | 0 (0.0%) | 0 (0.0%) |
| 5 to 17 Years | 0 (0.0%) | 0 (0.0%) |
| 18 to 34 Years | 0 (0.0%) | 0 (0.0%) |
| 35 to 64 Years | 13 (14.3%) | 0 (0.0%) |
| 65 to 74 Years | 0 (0.0%) | 3 (5.7%) |
| 75 Years and over | 3 (13.6%) | 5 (7.5%) |
Disability Class: Vision Difficulty
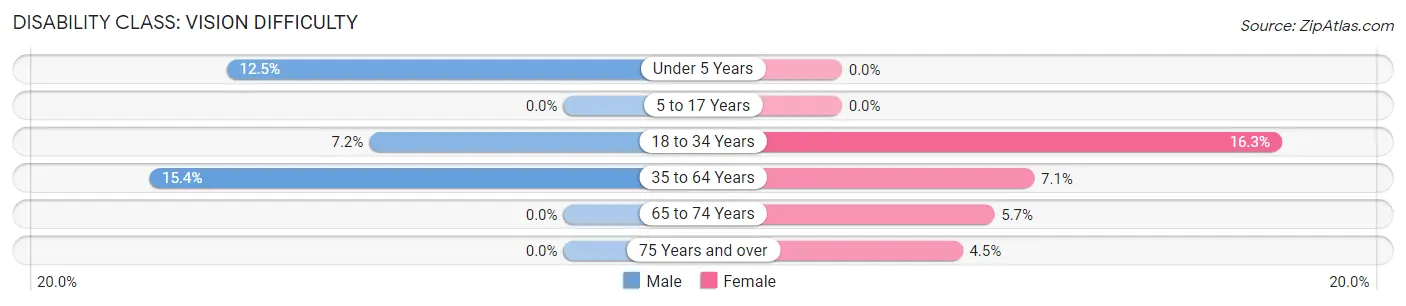
| Age Bracket | Male | Female |
| Under 5 Years | 7 (12.5%) | 0 (0.0%) |
| 5 to 17 Years | 0 (0.0%) | 0 (0.0%) |
| 18 to 34 Years | 8 (7.2%) | 16 (16.3%) |
| 35 to 64 Years | 14 (15.4%) | 7 (7.1%) |
| 65 to 74 Years | 0 (0.0%) | 3 (5.7%) |
| 75 Years and over | 0 (0.0%) | 3 (4.5%) |
Disability Class: Cognitive Difficulty
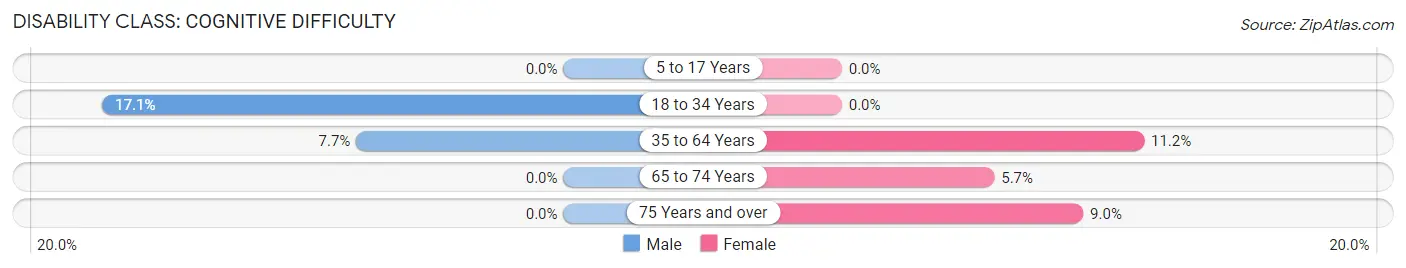
| Age Bracket | Male | Female |
| 5 to 17 Years | 0 (0.0%) | 0 (0.0%) |
| 18 to 34 Years | 19 (17.1%) | 0 (0.0%) |
| 35 to 64 Years | 7 (7.7%) | 11 (11.2%) |
| 65 to 74 Years | 0 (0.0%) | 3 (5.7%) |
| 75 Years and over | 0 (0.0%) | 6 (9.0%) |
Disability Class: Ambulatory Difficulty
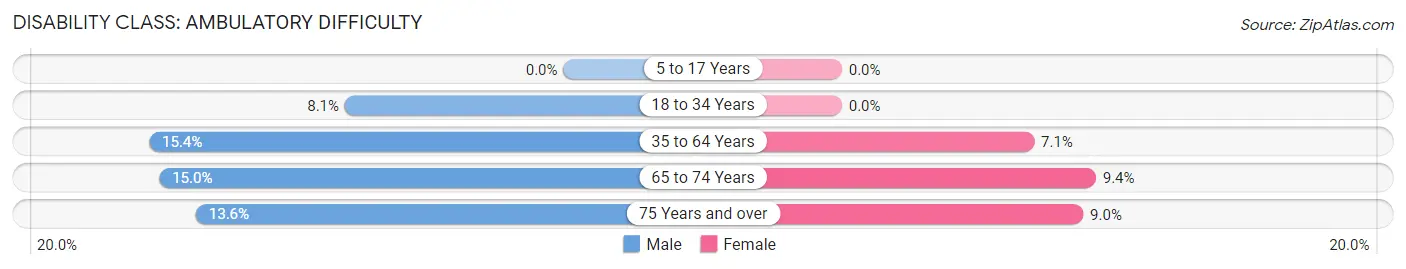
| Age Bracket | Male | Female |
| 5 to 17 Years | 0 (0.0%) | 0 (0.0%) |
| 18 to 34 Years | 9 (8.1%) | 0 (0.0%) |
| 35 to 64 Years | 14 (15.4%) | 7 (7.1%) |
| 65 to 74 Years | 3 (15.0%) | 5 (9.4%) |
| 75 Years and over | 3 (13.6%) | 6 (9.0%) |
Disability Class: Self-Care Difficulty
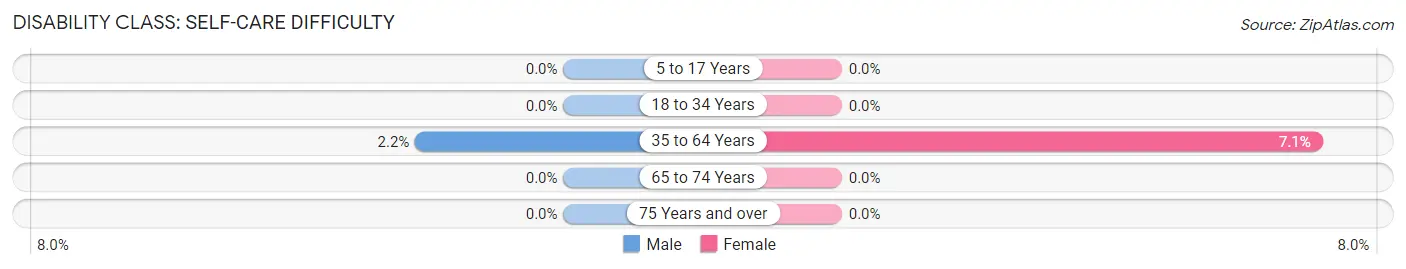
| Age Bracket | Male | Female |
| 5 to 17 Years | 0 (0.0%) | 0 (0.0%) |
| 18 to 34 Years | 0 (0.0%) | 0 (0.0%) |
| 35 to 64 Years | 2 (2.2%) | 7 (7.1%) |
| 65 to 74 Years | 0 (0.0%) | 0 (0.0%) |
| 75 Years and over | 0 (0.0%) | 0 (0.0%) |
Technology Access in Golden
Computing Device Access in Golden
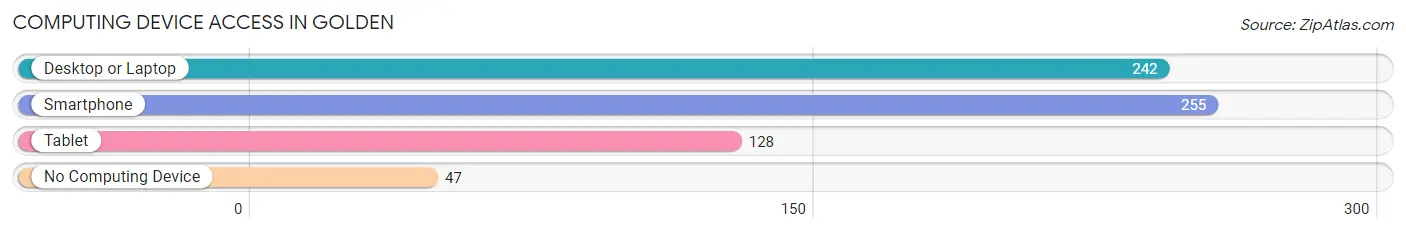
| Device Type | # Households | % Households |
| Desktop or Laptop | 242 | 75.2% |
| Smartphone | 255 | 79.2% |
| Tablet | 128 | 39.8% |
| No Computing Device | 47 | 14.6% |
| Total | 322 | 100.0% |
Internet Access in Golden
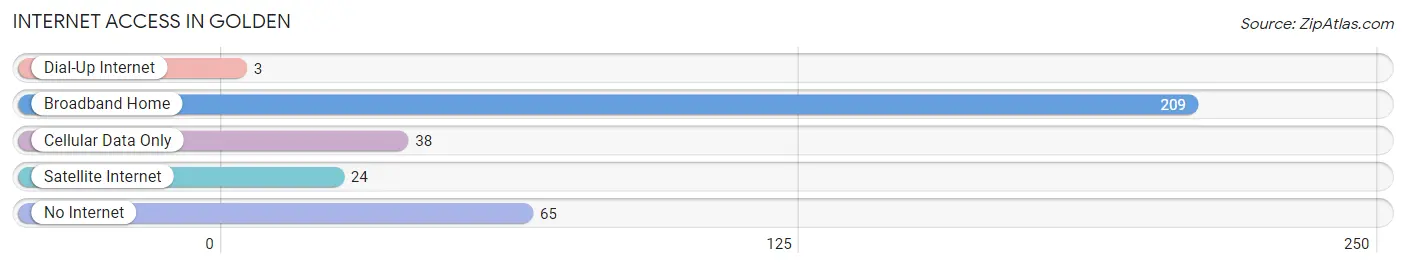
| Internet Type | # Households | % Households |
| Dial-Up Internet | 3 | 0.9% |
| Broadband Home | 209 | 64.9% |
| Cellular Data Only | 38 | 11.8% |
| Satellite Internet | 24 | 7.4% |
| No Internet | 65 | 20.2% |
| Total | 322 | 100.0% |
Golden Summary
Golden, Illinois is a small village located in Adams County, Illinois. It is situated on the banks of the Mississippi River, just south of Quincy. The village has a population of just over 500 people, and is part of the Quincy, IL–MO Micropolitan Statistical Area.
History
The area that is now Golden, Illinois was first settled in the early 1800s by a group of German immigrants. The village was originally known as “Goldschmidt”, after the family that founded it. In 1837, the name was changed to “Golden”, after the nearby Golden Eagle Ferry. The village was officially incorporated in 1854.
In the late 1800s, Golden was a thriving agricultural community. The village was home to several grain elevators, a flour mill, and a sawmill. The village also had a blacksmith shop, a general store, and a post office.
Geography
Golden is located in the western part of Adams County, Illinois. It is situated on the banks of the Mississippi River, just south of Quincy. The village is located at an elevation of 645 feet above sea level.
The village is surrounded by rolling hills and farmland. The nearest major city is Quincy, which is located about 10 miles to the north. The nearest interstate highway is Interstate 172, which is located about 15 miles to the east.
Economy
The economy of Golden is largely based on agriculture. The village is home to several grain elevators, a flour mill, and a sawmill. The village also has a few small businesses, including a general store and a post office.
The village is also home to a few small manufacturing companies, including a furniture factory and a plastics factory. The village also has a few small restaurants and bars.
Demographics
As of the 2010 census, the population of Golden was 514. The racial makeup of the village was 97.3% White, 0.6% African American, 0.2% Native American, 0.2% Asian, 0.4% from other races, and 1.3% from two or more races. Hispanic or Latino of any race were 1.2% of the population.
The median household income in Golden was $45,000, and the median family income was $50,000. The per capita income for the village was $20,000. About 8.3% of families and 10.2% of the population were below the poverty line, including 14.3% of those under age 18 and none of those age 65 or over.
Common Questions
What is Per Capita Income in Golden?
Per Capita income in Golden is $28,572.
What is the Median Family Income in Golden?
Median Family Income in Golden is $84,643.
What is the Median Household income in Golden?
Median Household Income in Golden is $58,500.
What is Income or Wage Gap in Golden?
Income or Wage Gap in Golden is 30.4%.
Women in Golden earn 69.6 cents for every dollar earned by a man.
What is Inequality or Gini Index in Golden?
Inequality or Gini Index in Golden is 0.40.
What is the Total Population of Golden?
Total Population of Golden is 771.
What is the Total Male Population of Golden?
Total Male Population of Golden is 371.
What is the Total Female Population of Golden?
Total Female Population of Golden is 400.
What is the Ratio of Males per 100 Females in Golden?
There are 92.75 Males per 100 Females in Golden.
What is the Ratio of Females per 100 Males in Golden?
There are 107.82 Females per 100 Males in Golden.
What is the Median Population Age in Golden?
Median Population Age in Golden is 34.2 Years.
What is the Average Family Size in Golden
Average Family Size in Golden is 3.0 People.
What is the Average Household Size in Golden
Average Household Size in Golden is 2.3 People.
How Large is the Labor Force in Golden?
There are 374 People in the Labor Forcein in Golden.
What is the Percentage of People in the Labor Force in Golden?
61.2% of People are in the Labor Force in Golden.
What is the Unemployment Rate in Golden?
Unemployment Rate in Golden is 2.7%.