Girard, IL Map & Demographics
Girard Map
Girard Overview
$22,143
PER CAPITA INCOME
$45,250
AVG FAMILY INCOME
$43,750
AVG HOUSEHOLD INCOME
29.4%
WAGE / INCOME GAP [ % ]
70.6¢/ $1
WAGE / INCOME GAP [ $ ]
0.42
INEQUALITY / GINI INDEX
1,492
TOTAL POPULATION
694
MALE POPULATION
798
FEMALE POPULATION
86.97
MALES / 100 FEMALES
114.99
FEMALES / 100 MALES
39.8
MEDIAN AGE
3.0
AVG FAMILY SIZE
2.7
AVG HOUSEHOLD SIZE
667
LABOR FORCE [ PEOPLE ]
54.0%
PERCENT IN LABOR FORCE
10.8%
UNEMPLOYMENT RATE
Girard Zip Codes
Girard Area Codes
Income in Girard
Income Overview in Girard
Per Capita Income in Girard is $22,143, while median incomes of families and households are $45,250 and $43,750 respectively.
| Characteristic | Number | Measure |
| Per Capita Income | 1,492 | $22,143 |
| Median Family Income | 355 | $45,250 |
| Mean Family Income | 355 | $53,758 |
| Median Household Income | 558 | $43,750 |
| Mean Household Income | 558 | $55,269 |
| Income Deficit | 355 | $0 |
| Wage / Income Gap (%) | 1,492 | 29.41% |
| Wage / Income Gap ($) | 1,492 | 70.59¢ per $1 |
| Gini / Inequality Index | 1,492 | 0.42 |
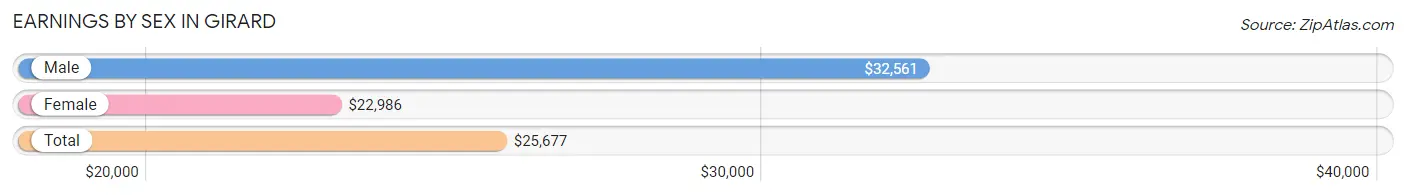
Earnings by Sex in Girard
Average Earnings in Girard are $25,677, $32,561 for men and $22,986 for women, a difference of 29.4%.
| Sex | Number | Average Earnings |
| Male | 344 (53.8%) | $32,561 |
| Female | 295 (46.2%) | $22,986 |
| Total | 639 (100.0%) | $25,677 |
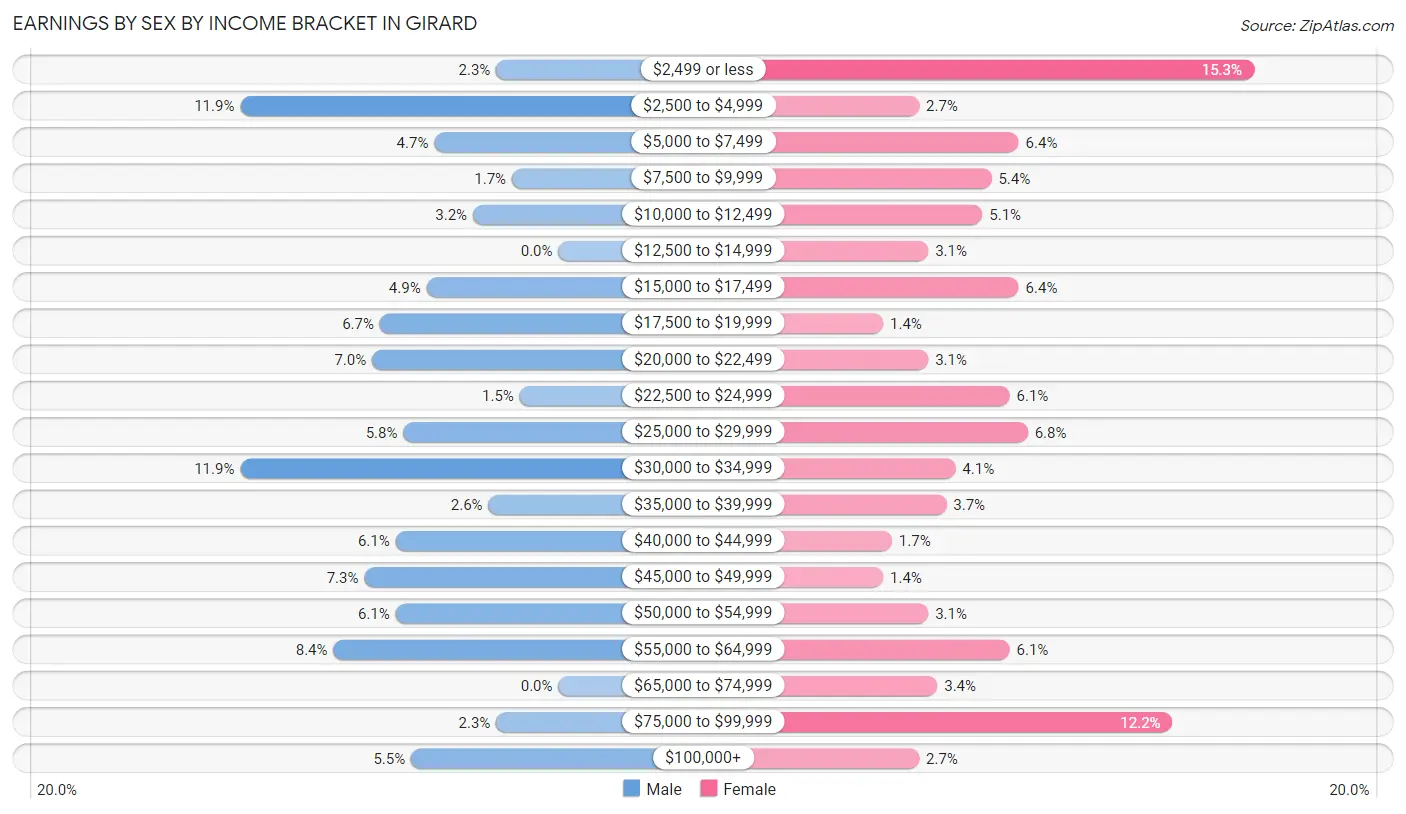
Earnings by Sex by Income Bracket in Girard
The most common earnings brackets in Girard are $2,500 to $4,999 for men (41 | 11.9%) and $2,499 or less for women (45 | 15.2%).
| Income | Male | Female |
| $2,499 or less | 8 (2.3%) | 45 (15.2%) |
| $2,500 to $4,999 | 41 (11.9%) | 8 (2.7%) |
| $5,000 to $7,499 | 16 (4.6%) | 19 (6.4%) |
| $7,500 to $9,999 | 6 (1.7%) | 16 (5.4%) |
| $10,000 to $12,499 | 11 (3.2%) | 15 (5.1%) |
| $12,500 to $14,999 | 0 (0.0%) | 9 (3.0%) |
| $15,000 to $17,499 | 17 (4.9%) | 19 (6.4%) |
| $17,500 to $19,999 | 23 (6.7%) | 4 (1.4%) |
| $20,000 to $22,499 | 24 (7.0%) | 9 (3.0%) |
| $22,500 to $24,999 | 5 (1.5%) | 18 (6.1%) |
| $25,000 to $29,999 | 20 (5.8%) | 20 (6.8%) |
| $30,000 to $34,999 | 41 (11.9%) | 12 (4.1%) |
| $35,000 to $39,999 | 9 (2.6%) | 11 (3.7%) |
| $40,000 to $44,999 | 21 (6.1%) | 5 (1.7%) |
| $45,000 to $49,999 | 25 (7.3%) | 4 (1.4%) |
| $50,000 to $54,999 | 21 (6.1%) | 9 (3.0%) |
| $55,000 to $64,999 | 29 (8.4%) | 18 (6.1%) |
| $65,000 to $74,999 | 0 (0.0%) | 10 (3.4%) |
| $75,000 to $99,999 | 8 (2.3%) | 36 (12.2%) |
| $100,000+ | 19 (5.5%) | 8 (2.7%) |
| Total | 344 (100.0%) | 295 (100.0%) |
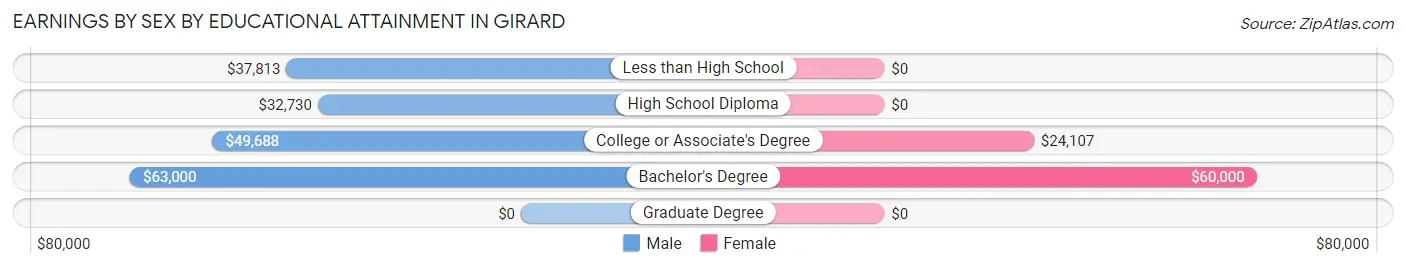
Earnings by Sex by Educational Attainment in Girard
Average earnings in Girard are $33,872 for men and $27,125 for women, a difference of 19.9%. Men with an educational attainment of bachelor's degree enjoy the highest average annual earnings of $63,000, while those with high school diploma education earn the least with $32,730. Women with an educational attainment of bachelor's degree earn the most with the average annual earnings of $60,000, while those with college or associate's degree education have the smallest earnings of $24,107.
| Educational Attainment | Male Income | Female Income |
| Less than High School | $37,813 | $0 |
| High School Diploma | $32,730 | $0 |
| College or Associate's Degree | $49,688 | $24,107 |
| Bachelor's Degree | $63,000 | $60,000 |
| Graduate Degree | - | - |
| Total | $33,872 | $27,125 |
Family Income in Girard
Family Income Brackets in Girard
According to the Girard family income data, there are 69 families falling into the $25,000 to $34,999 income range, which is the most common income bracket and makes up 19.4% of all families. Conversely, the $150,000 to $199,999 income bracket is the least frequent group with only 10 families (2.8%) belonging to this category.
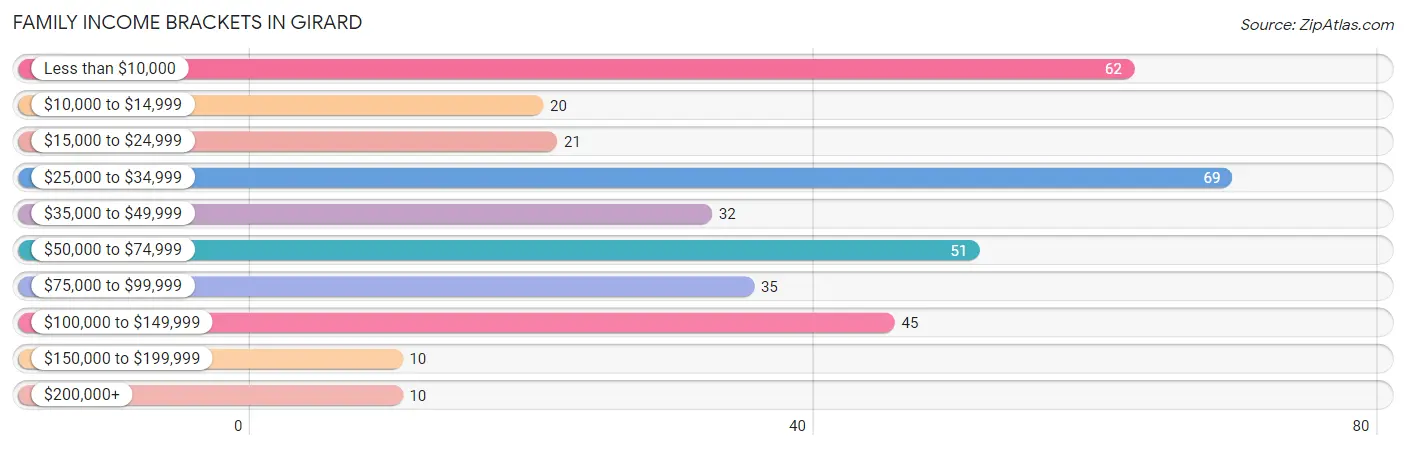
| Income Bracket | # Families | % Families |
| Less than $10,000 | 62 | 17.5% |
| $10,000 to $14,999 | 20 | 5.6% |
| $15,000 to $24,999 | 21 | 5.9% |
| $25,000 to $34,999 | 69 | 19.4% |
| $35,000 to $49,999 | 32 | 9.0% |
| $50,000 to $74,999 | 51 | 14.4% |
| $75,000 to $99,999 | 35 | 9.9% |
| $100,000 to $149,999 | 45 | 12.7% |
| $150,000 to $199,999 | 10 | 2.8% |
| $200,000+ | 10 | 2.8% |
Family Income by Famaliy Size in Girard
2-person families (237 | 66.8%) account for the highest median family income in Girard with $34,125 per family, while 2-person families (237 | 66.8%) have the highest median income of $17,062 per family member.
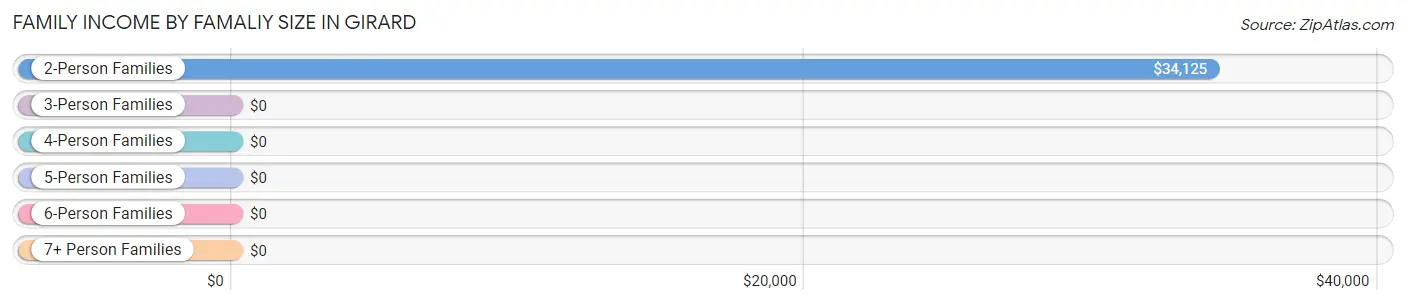
| Income Bracket | # Families | Median Income |
| 2-Person Families | 237 (66.8%) | $34,125 |
| 3-Person Families | 59 (16.6%) | $0 |
| 4-Person Families | 35 (9.9%) | $0 |
| 5-Person Families | 10 (2.8%) | $0 |
| 6-Person Families | 4 (1.1%) | $0 |
| 7+ Person Families | 10 (2.8%) | $0 |
| Total | 355 (100.0%) | $45,250 |
Family Income by Number of Earners in Girard
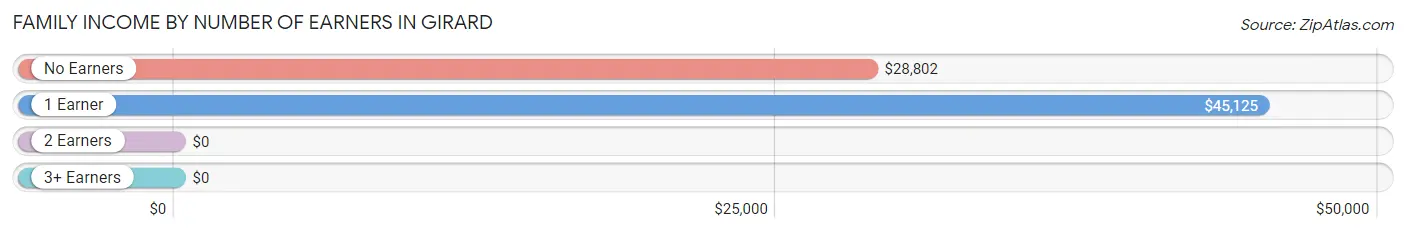
| Number of Earners | # Families | Median Income |
| No Earners | 93 (26.2%) | $28,802 |
| 1 Earner | 161 (45.4%) | $45,125 |
| 2 Earners | 89 (25.1%) | $0 |
| 3+ Earners | 12 (3.4%) | $0 |
| Total | 355 (100.0%) | $45,250 |
Household Income in Girard
Household Income Brackets in Girard
With 98 households falling in the category, the $25,000 to $34,999 income range is the most frequent in Girard, accounting for 17.6% of all households. In contrast, only 10 households (1.8%) fall into the $200,000+ income bracket, making it the least populous group.
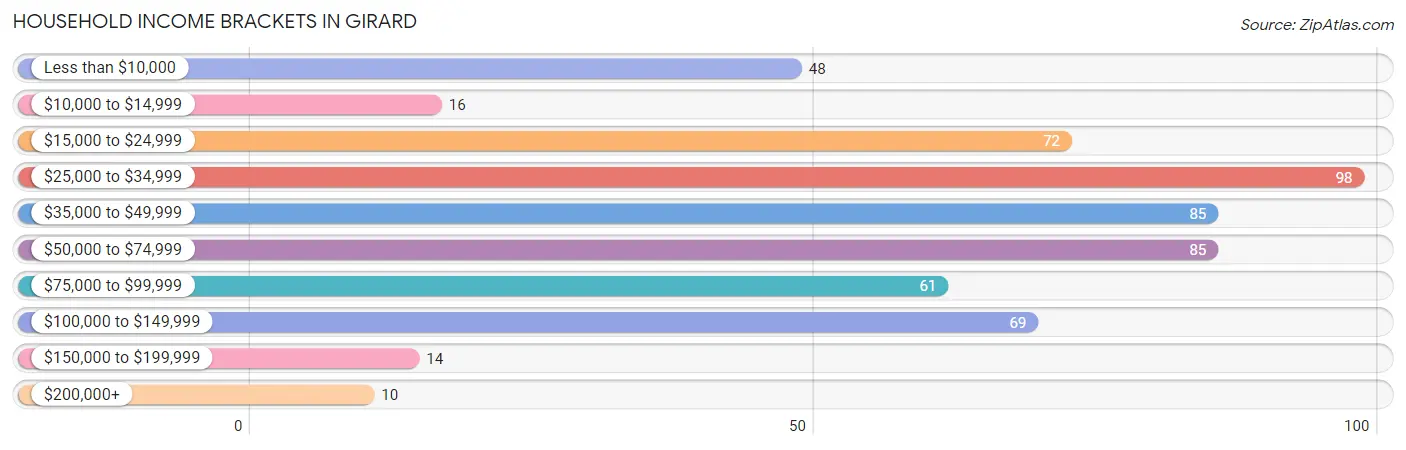
| Income Bracket | # Households | % Households |
| Less than $10,000 | 48 | 8.6% |
| $10,000 to $14,999 | 16 | 2.9% |
| $15,000 to $24,999 | 72 | 12.9% |
| $25,000 to $34,999 | 98 | 17.6% |
| $35,000 to $49,999 | 85 | 15.2% |
| $50,000 to $74,999 | 85 | 15.2% |
| $75,000 to $99,999 | 61 | 10.9% |
| $100,000 to $149,999 | 69 | 12.4% |
| $150,000 to $199,999 | 14 | 2.5% |
| $200,000+ | 10 | 1.8% |
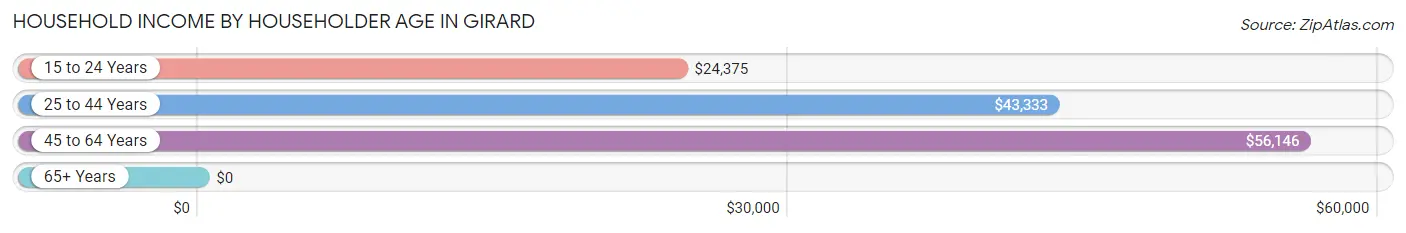
Household Income by Householder Age in Girard
The median household income in Girard is $43,750, with the highest median household income of $56,146 found in the 45 to 64 years age bracket for the primary householder. A total of 185 households (33.2%) fall into this category. Meanwhile, the 65+ years age bracket for the primary householder has the lowest median household income of $0, with 199 households (35.7%) in this group.
| Income Bracket | # Households | Median Income |
| 15 to 24 Years | 34 (6.1%) | $24,375 |
| 25 to 44 Years | 140 (25.1%) | $43,333 |
| 45 to 64 Years | 185 (33.2%) | $56,146 |
| 65+ Years | 199 (35.7%) | $0 |
| Total | 558 (100.0%) | $43,750 |
Poverty in Girard
Income Below Poverty by Sex and Age in Girard
With 25.9% poverty level for males and 27.3% for females among the residents of Girard, 16 and 17 year old males and 55 to 64 year old females are the most vulnerable to poverty, with 4 males (100.0%) and 84 females (64.6%) in their respective age groups living below the poverty level.
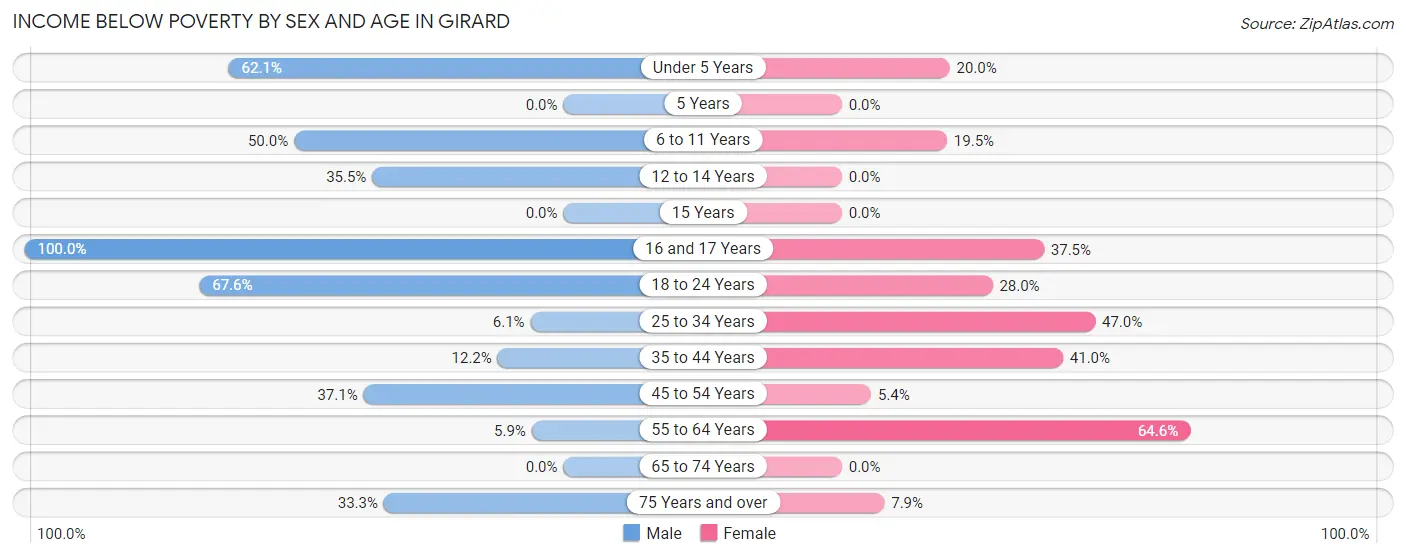
| Age Bracket | Male | Female |
| Under 5 Years | 41 (62.1%) | 11 (20.0%) |
| 5 Years | 0 (0.0%) | 0 (0.0%) |
| 6 to 11 Years | 9 (50.0%) | 8 (19.5%) |
| 12 to 14 Years | 11 (35.5%) | 0 (0.0%) |
| 15 Years | 0 (0.0%) | 0 (0.0%) |
| 16 and 17 Years | 4 (100.0%) | 6 (37.5%) |
| 18 to 24 Years | 50 (67.6%) | 26 (28.0%) |
| 25 to 34 Years | 8 (6.1%) | 55 (47.0%) |
| 35 to 44 Years | 10 (12.2%) | 16 (41.0%) |
| 45 to 54 Years | 23 (37.1%) | 5 (5.4%) |
| 55 to 64 Years | 5 (5.9%) | 84 (64.6%) |
| 65 to 74 Years | 0 (0.0%) | 0 (0.0%) |
| 75 Years and over | 13 (33.3%) | 6 (7.9%) |
| Total | 174 (25.9%) | 217 (27.3%) |
Income Above Poverty by Sex and Age in Girard
According to the poverty statistics in Girard, males aged 5 years and females aged 12 to 14 years are the age groups that are most secure financially, with 100.0% of males and 100.0% of females in these age groups living above the poverty line.
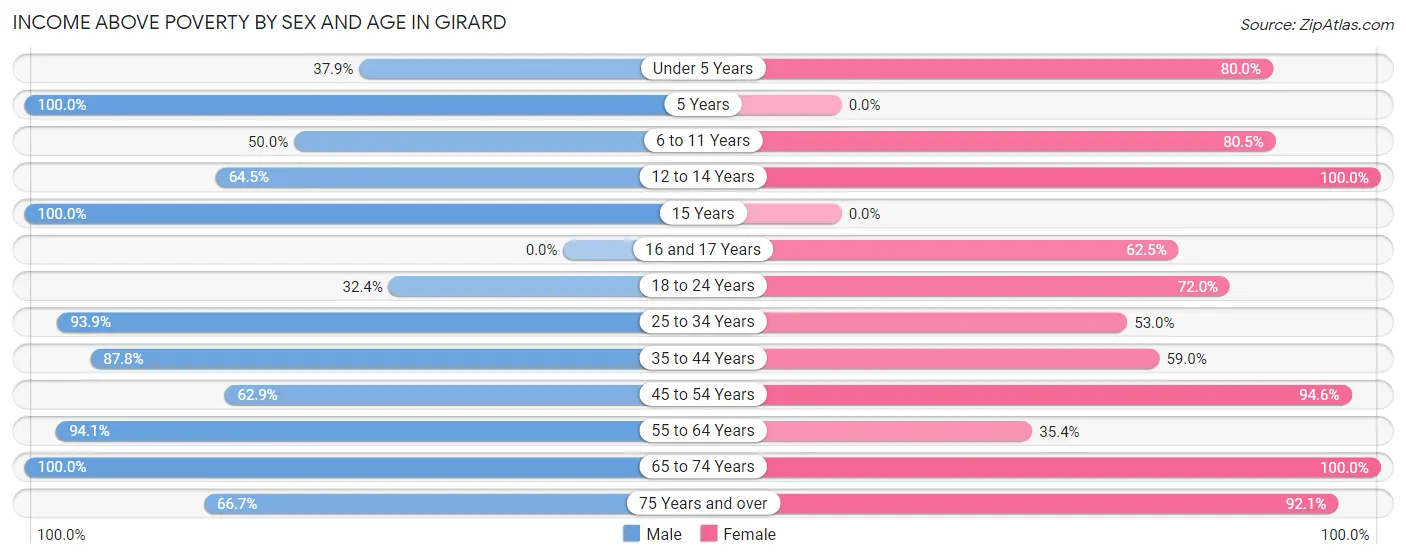
| Age Bracket | Male | Female |
| Under 5 Years | 25 (37.9%) | 44 (80.0%) |
| 5 Years | 5 (100.0%) | 0 (0.0%) |
| 6 to 11 Years | 9 (50.0%) | 33 (80.5%) |
| 12 to 14 Years | 20 (64.5%) | 16 (100.0%) |
| 15 Years | 4 (100.0%) | 0 (0.0%) |
| 16 and 17 Years | 0 (0.0%) | 10 (62.5%) |
| 18 to 24 Years | 24 (32.4%) | 67 (72.0%) |
| 25 to 34 Years | 123 (93.9%) | 62 (53.0%) |
| 35 to 44 Years | 72 (87.8%) | 23 (59.0%) |
| 45 to 54 Years | 39 (62.9%) | 87 (94.6%) |
| 55 to 64 Years | 80 (94.1%) | 46 (35.4%) |
| 65 to 74 Years | 71 (100.0%) | 119 (100.0%) |
| 75 Years and over | 26 (66.7%) | 70 (92.1%) |
| Total | 498 (74.1%) | 577 (72.7%) |
Income Below Poverty Among Married-Couple Families in Girard
The poverty statistics for married-couple families in Girard show that 6.0% or 11 of the total 182 families live below the poverty line. Families with 1 or 2 children have the highest poverty rate of 15.4%, comprising of 6 families. On the other hand, families with 3 or 4 children have the lowest poverty rate of 0.0%, which includes 0 families.
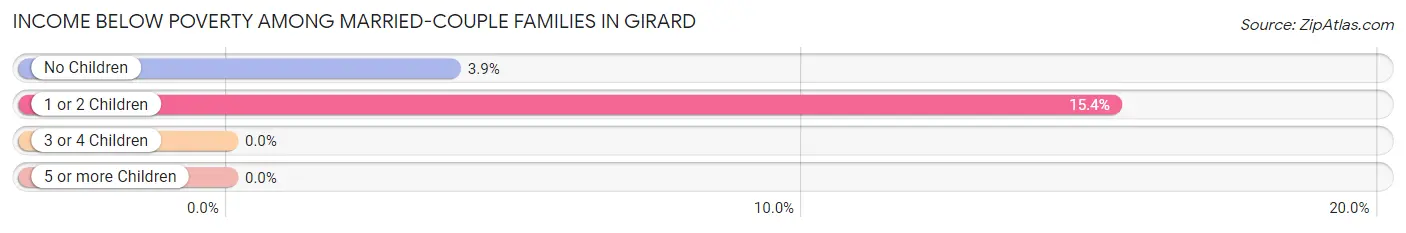
| Children | Above Poverty | Below Poverty |
| No Children | 124 (96.1%) | 5 (3.9%) |
| 1 or 2 Children | 33 (84.6%) | 6 (15.4%) |
| 3 or 4 Children | 4 (100.0%) | 0 (0.0%) |
| 5 or more Children | 10 (100.0%) | 0 (0.0%) |
| Total | 171 (94.0%) | 11 (6.0%) |
Income Below Poverty Among Single-Parent Households in Girard
According to the poverty data in Girard, 29.8% or 14 single-father households and 58.7% or 74 single-mother households are living below the poverty line. Among single-father households, those with 1 or 2 children have the highest poverty rate, with 8 households (33.3%) experiencing poverty. Likewise, among single-mother households, those with 1 or 2 children have the highest poverty rate, with 50 households (75.8%) falling below the poverty line.
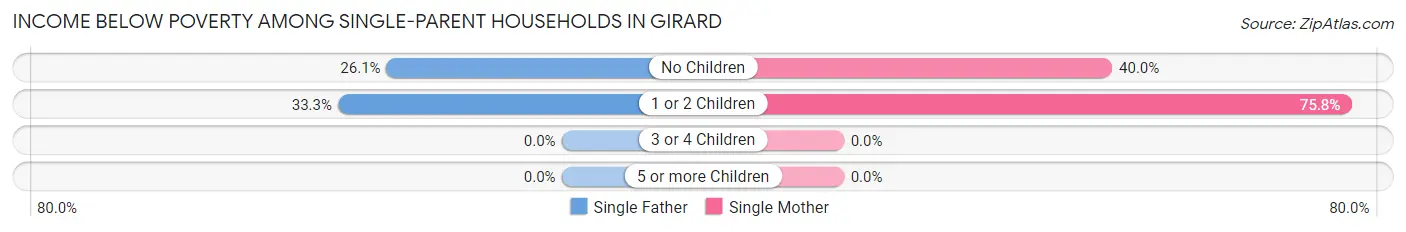
| Children | Single Father | Single Mother |
| No Children | 6 (26.1%) | 24 (40.0%) |
| 1 or 2 Children | 8 (33.3%) | 50 (75.8%) |
| 3 or 4 Children | 0 (0.0%) | 0 (0.0%) |
| 5 or more Children | 0 (0.0%) | 0 (0.0%) |
| Total | 14 (29.8%) | 74 (58.7%) |
Income Below Poverty Among Married-Couple vs Single-Parent Households in Girard
The poverty data for Girard shows that 11 of the married-couple family households (6.0%) and 88 of the single-parent households (50.9%) are living below the poverty level. Within the married-couple family households, those with 1 or 2 children have the highest poverty rate, with 6 households (15.4%) falling below the poverty line. Among the single-parent households, those with 1 or 2 children have the highest poverty rate, with 58 household (64.4%) living below poverty.
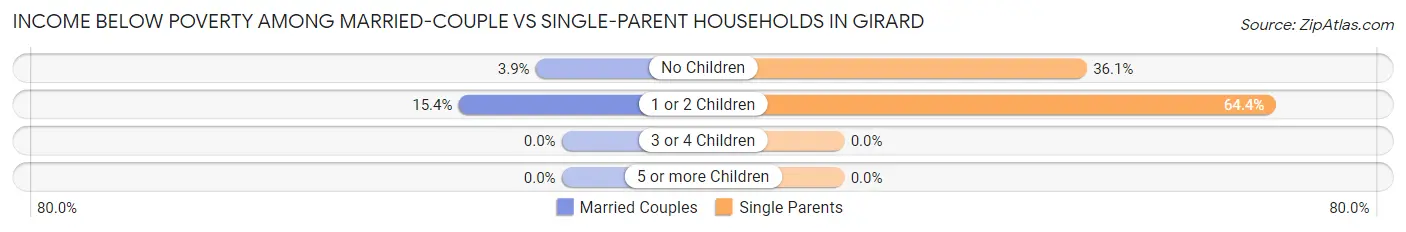
| Children | Married-Couple Families | Single-Parent Households |
| No Children | 5 (3.9%) | 30 (36.1%) |
| 1 or 2 Children | 6 (15.4%) | 58 (64.4%) |
| 3 or 4 Children | 0 (0.0%) | 0 (0.0%) |
| 5 or more Children | 0 (0.0%) | 0 (0.0%) |
| Total | 11 (6.0%) | 88 (50.9%) |
Race in Girard
The most populous races in Girard are White / Caucasian (1,430 | 95.8%), Two or more Races (52 | 3.5%), and Hispanic or Latino (31 | 2.1%).
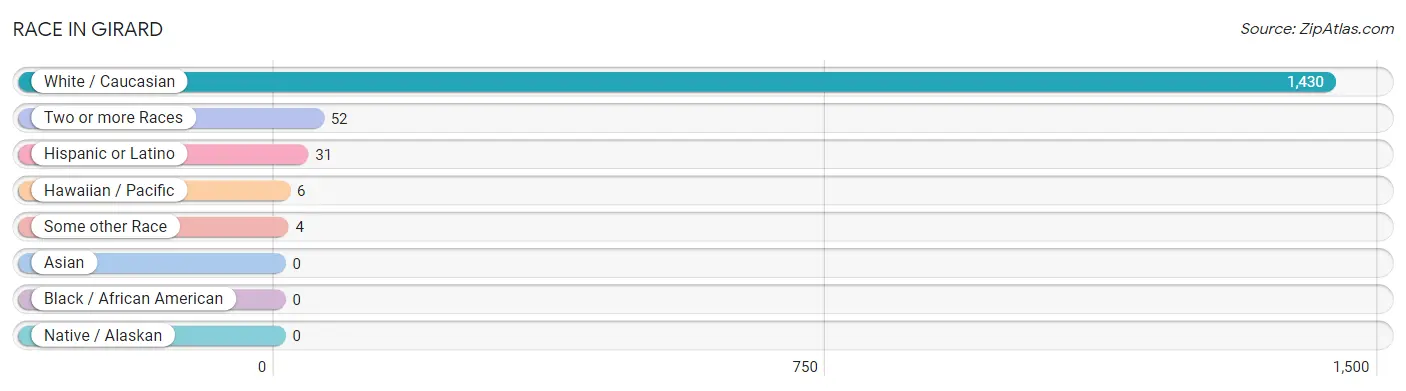
| Race | # Population | % Population |
| Asian | 0 | 0.0% |
| Black / African American | 0 | 0.0% |
| Hawaiian / Pacific | 6 | 0.4% |
| Hispanic or Latino | 31 | 2.1% |
| Native / Alaskan | 0 | 0.0% |
| White / Caucasian | 1,430 | 95.8% |
| Two or more Races | 52 | 3.5% |
| Some other Race | 4 | 0.3% |
| Total | 1,492 | 100.0% |
Ancestry in Girard
The most populous ancestries reported in Girard are German (265 | 17.8%), English (237 | 15.9%), Irish (129 | 8.6%), American (86 | 5.8%), and Italian (45 | 3.0%), together accounting for 51.1% of all Girard residents.
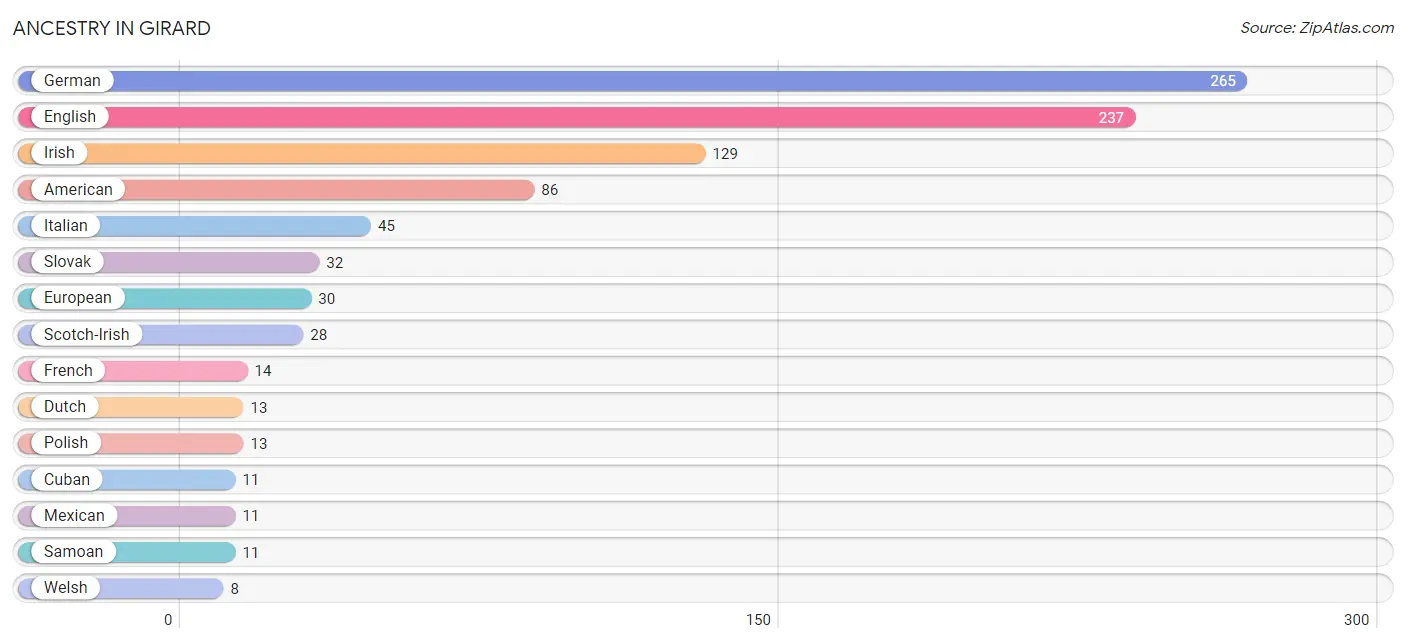
| Ancestry | # Population | % Population |
| American | 86 | 5.8% |
| British | 7 | 0.5% |
| Cuban | 11 | 0.7% |
| Dutch | 13 | 0.9% |
| Eastern European | 6 | 0.4% |
| English | 237 | 15.9% |
| European | 30 | 2.0% |
| French | 14 | 0.9% |
| French Canadian | 3 | 0.2% |
| German | 265 | 17.8% |
| Hungarian | 7 | 0.5% |
| Irish | 129 | 8.6% |
| Italian | 45 | 3.0% |
| Mexican | 11 | 0.7% |
| Polish | 13 | 0.9% |
| Portuguese | 3 | 0.2% |
| Puerto Rican | 4 | 0.3% |
| Samoan | 11 | 0.7% |
| Scotch-Irish | 28 | 1.9% |
| Scottish | 4 | 0.3% |
| Slovak | 32 | 2.1% |
| Spanish | 5 | 0.3% |
| Welsh | 8 | 0.5% | View All 23 Rows |
Immigrants in Girard
The most numerous immigrant groups reported in Girard came from Central America (4 | 0.3%), Latin America (4 | 0.3%), and Mexico (4 | 0.3%), together accounting for 0.8% of all Girard residents.
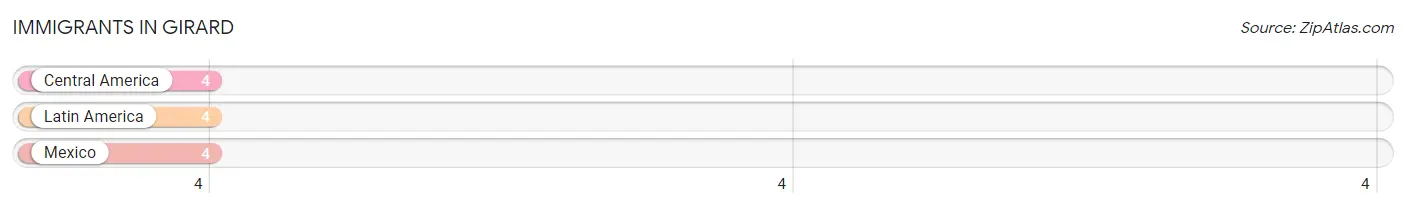
| Immigration Origin | # Population | % Population |
| Central America | 4 | 0.3% |
| Latin America | 4 | 0.3% |
| Mexico | 4 | 0.3% | View All 3 Rows |
Sex and Age in Girard
Sex and Age in Girard
The most populous age groups in Girard are 25 to 29 Years (88 | 12.7%) for men and 65 to 69 Years (100 | 12.5%) for women.
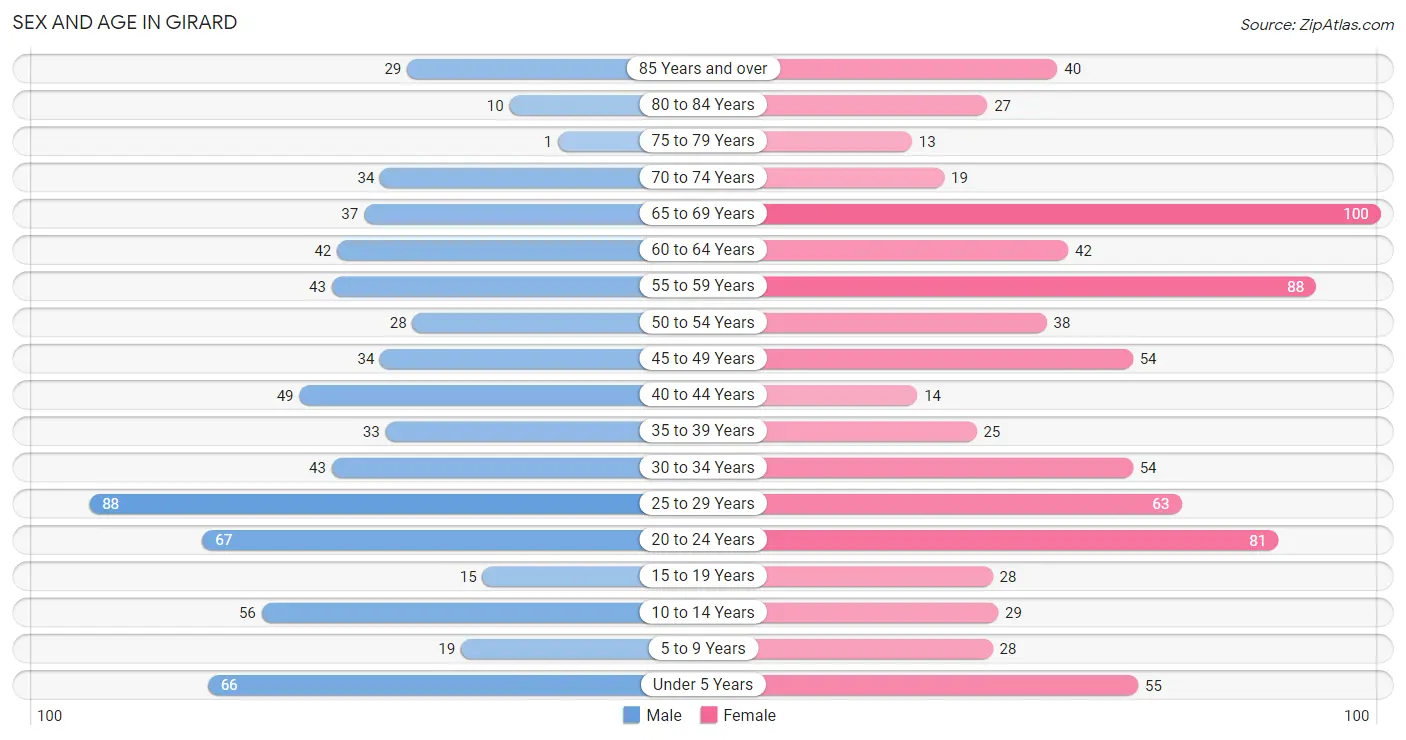
| Age Bracket | Male | Female |
| Under 5 Years | 66 (9.5%) | 55 (6.9%) |
| 5 to 9 Years | 19 (2.7%) | 28 (3.5%) |
| 10 to 14 Years | 56 (8.1%) | 29 (3.6%) |
| 15 to 19 Years | 15 (2.2%) | 28 (3.5%) |
| 20 to 24 Years | 67 (9.7%) | 81 (10.2%) |
| 25 to 29 Years | 88 (12.7%) | 63 (7.9%) |
| 30 to 34 Years | 43 (6.2%) | 54 (6.8%) |
| 35 to 39 Years | 33 (4.8%) | 25 (3.1%) |
| 40 to 44 Years | 49 (7.1%) | 14 (1.8%) |
| 45 to 49 Years | 34 (4.9%) | 54 (6.8%) |
| 50 to 54 Years | 28 (4.0%) | 38 (4.8%) |
| 55 to 59 Years | 43 (6.2%) | 88 (11.0%) |
| 60 to 64 Years | 42 (6.0%) | 42 (5.3%) |
| 65 to 69 Years | 37 (5.3%) | 100 (12.5%) |
| 70 to 74 Years | 34 (4.9%) | 19 (2.4%) |
| 75 to 79 Years | 1 (0.1%) | 13 (1.6%) |
| 80 to 84 Years | 10 (1.4%) | 27 (3.4%) |
| 85 Years and over | 29 (4.2%) | 40 (5.0%) |
| Total | 694 (100.0%) | 798 (100.0%) |
Families and Households in Girard
Median Family Size in Girard
The median family size in Girard is 2.97 persons per family, with married-couple families (182 | 51.3%) accounting for the largest median family size of 3.2 persons per family. On the other hand, single male/father families (47 | 13.2%) represent the smallest median family size with 2.57 persons per family.
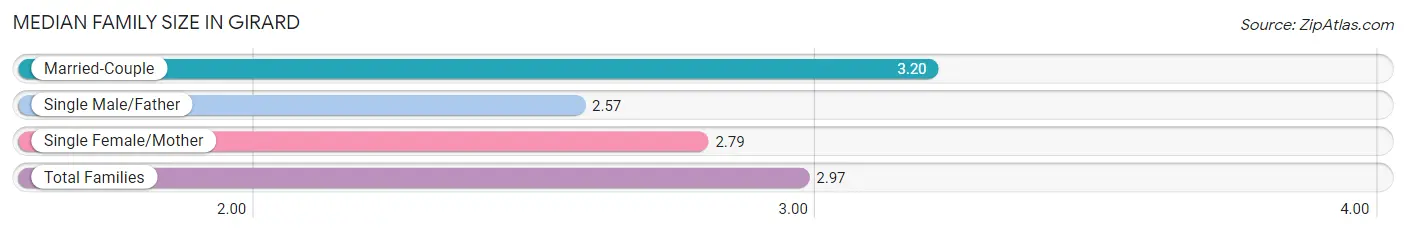
| Family Type | # Families | Family Size |
| Married-Couple | 182 (51.3%) | 3.20 |
| Single Male/Father | 47 (13.2%) | 2.57 |
| Single Female/Mother | 126 (35.5%) | 2.79 |
| Total Families | 355 (100.0%) | 2.97 |
Median Household Size in Girard
The median household size in Girard is 2.66 persons per household, with single male/father households (47 | 8.4%) accounting for the largest median household size of 3.57 persons per household. non-family households (203 | 36.4%) represent the smallest median household size with 1.50 persons per household.
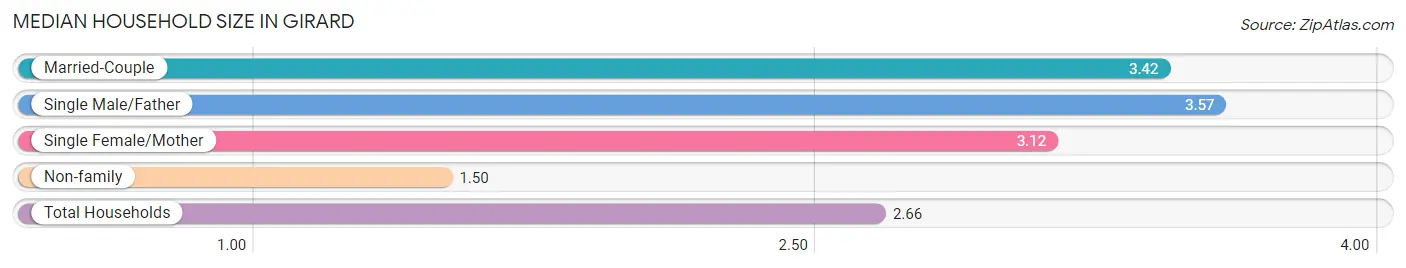
| Household Type | # Households | Household Size |
| Married-Couple | 182 (32.6%) | 3.42 |
| Single Male/Father | 47 (8.4%) | 3.57 |
| Single Female/Mother | 126 (22.6%) | 3.12 |
| Non-family | 203 (36.4%) | 1.50 |
| Total Households | 558 (100.0%) | 2.66 |
Household Size by Marriage Status in Girard
Out of a total of 558 households in Girard, 355 (63.6%) are family households, while 203 (36.4%) are nonfamily households. The most numerous type of family households are 2-person households, comprising 184, and the most common type of nonfamily households are 1-person households, comprising 158.
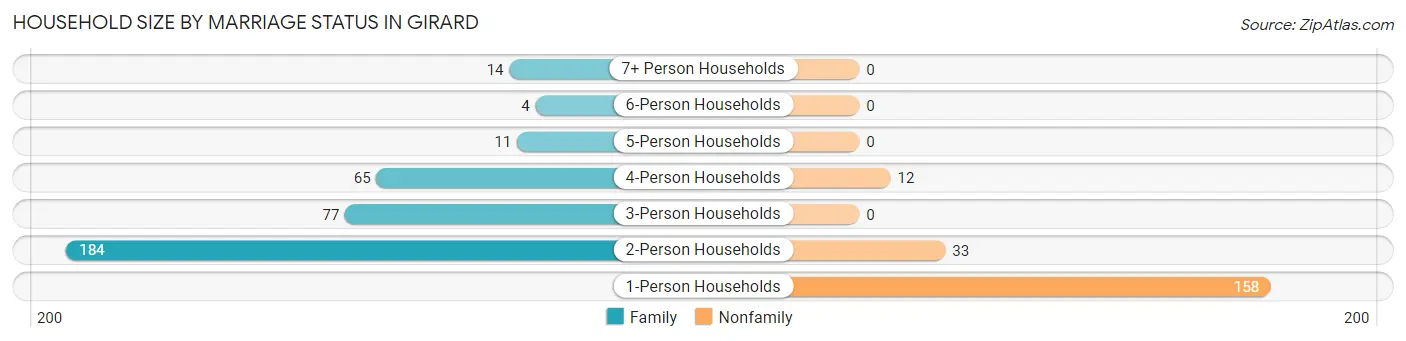
| Household Size | Family Households | Nonfamily Households |
| 1-Person Households | - | 158 (28.3%) |
| 2-Person Households | 184 (33.0%) | 33 (5.9%) |
| 3-Person Households | 77 (13.8%) | 0 (0.0%) |
| 4-Person Households | 65 (11.7%) | 12 (2.1%) |
| 5-Person Households | 11 (2.0%) | 0 (0.0%) |
| 6-Person Households | 4 (0.7%) | 0 (0.0%) |
| 7+ Person Households | 14 (2.5%) | 0 (0.0%) |
| Total | 355 (63.6%) | 203 (36.4%) |
Female Fertility in Girard
Fertility by Age in Girard
Average fertility rate in Girard is 153.0 births per 1,000 women. Women in the age bracket of 20 to 34 years have the highest fertility rate with 232.0 births per 1,000 women. Women in the age bracket of 20 to 34 years acount for 92.0% of all women with births.
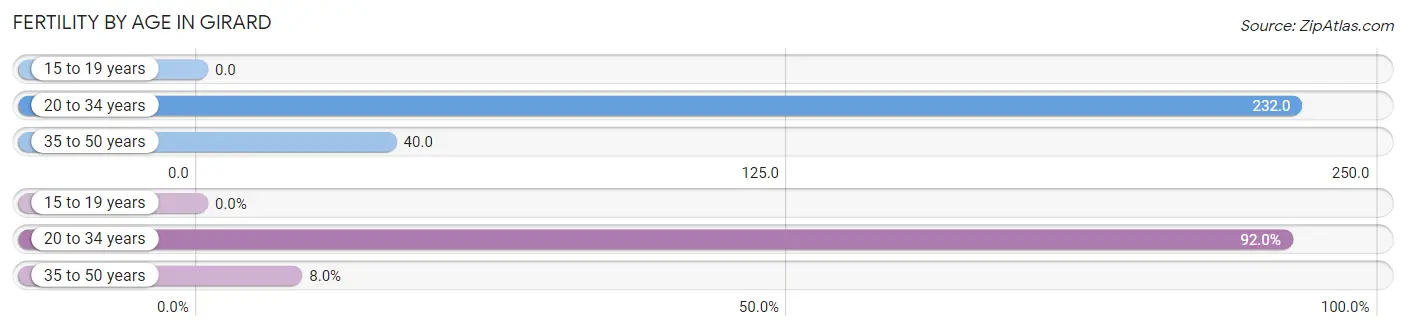
| Age Bracket | Women with Births | Births / 1,000 Women |
| 15 to 19 years | 0 (0.0%) | 0.0 |
| 20 to 34 years | 46 (92.0%) | 232.0 |
| 35 to 50 years | 4 (8.0%) | 40.0 |
| Total | 50 (100.0%) | 153.0 |
Fertility by Age by Marriage Status in Girard
32.0% of women with births (50) in Girard are married. The highest percentage of unmarried women with births falls into 20 to 34 years age bracket with 73.9% of them unmarried at the time of birth, while the lowest percentage of unmarried women with births belong to 35 to 50 years age bracket with 0.0% of them unmarried.
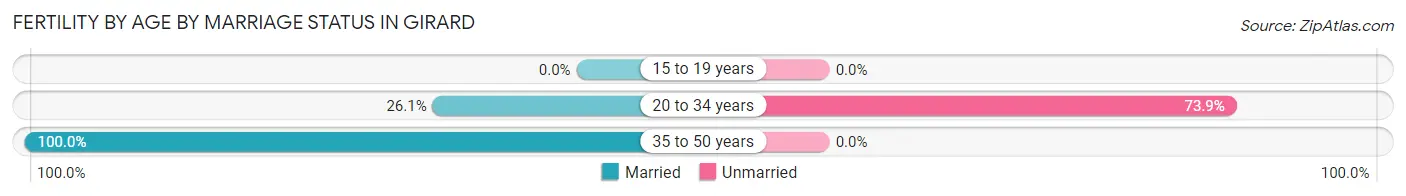
| Age Bracket | Married | Unmarried |
| 15 to 19 years | 0 (0.0%) | 0 (0.0%) |
| 20 to 34 years | 12 (26.1%) | 34 (73.9%) |
| 35 to 50 years | 4 (100.0%) | 0 (0.0%) |
| Total | 16 (32.0%) | 34 (68.0%) |
Fertility by Education in Girard
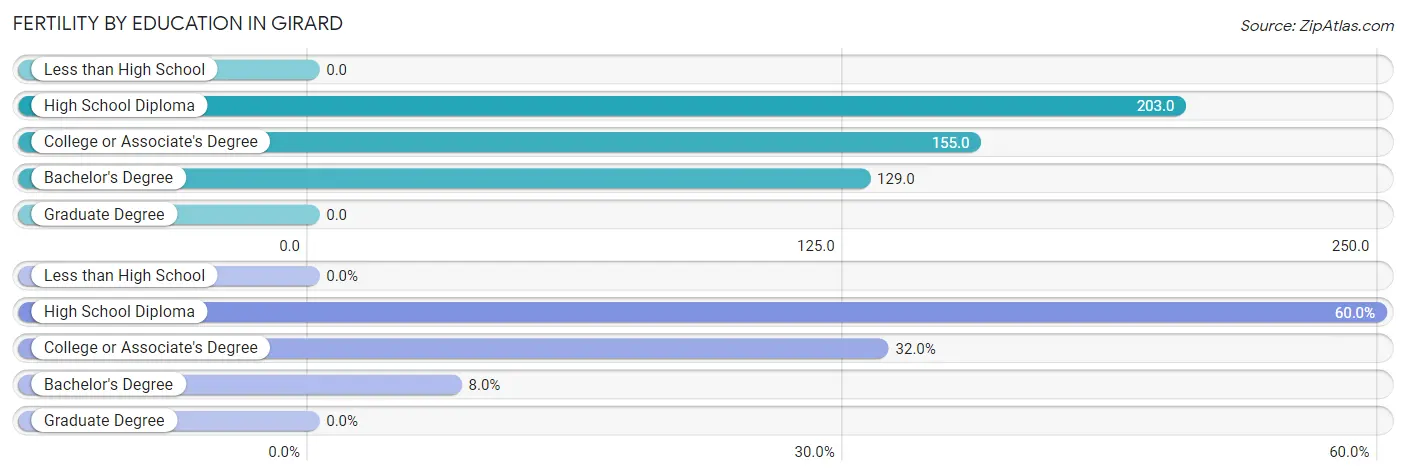
| Educational Attainment | Women with Births | Births / 1,000 Women |
| Less than High School | 0 (0.0%) | 0.0 |
| High School Diploma | 30 (60.0%) | 203.0 |
| College or Associate's Degree | 16 (32.0%) | 155.0 |
| Bachelor's Degree | 4 (8.0%) | 129.0 |
| Graduate Degree | 0 (0.0%) | 0.0 |
| Total | 50 (100.0%) | 153.0 |
Fertility by Education by Marriage Status in Girard
68.0% of women with births in Girard are unmarried. Women with the educational attainment of bachelor's degree are most likely to be married with 100.0% of them married at childbirth, while women with the educational attainment of high school diploma are least likely to be married with 100.0% of them unmarried at childbirth.
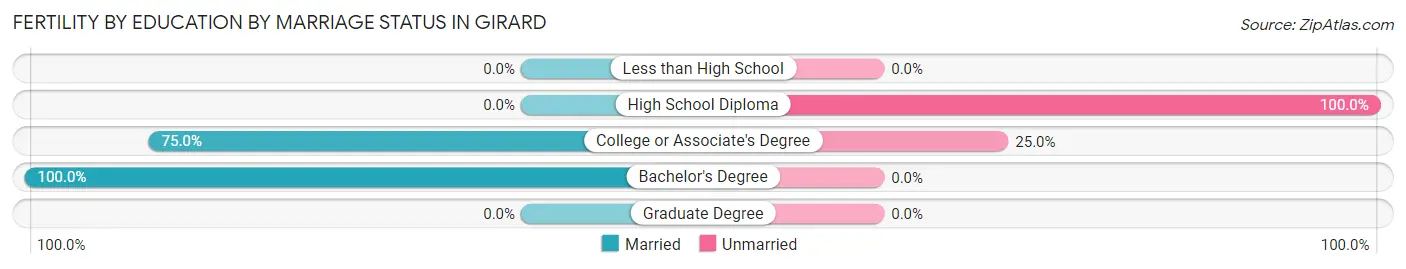
| Educational Attainment | Married | Unmarried |
| Less than High School | 0 (0.0%) | 0 (0.0%) |
| High School Diploma | 0 (0.0%) | 30 (100.0%) |
| College or Associate's Degree | 12 (75.0%) | 4 (25.0%) |
| Bachelor's Degree | 4 (100.0%) | 0 (0.0%) |
| Graduate Degree | 0 (0.0%) | 0 (0.0%) |
| Total | 16 (32.0%) | 34 (68.0%) |
Employment Characteristics in Girard
Employment by Class of Employer in Girard
Among the 591 employed individuals in Girard, private company employees (409 | 69.2%), not-for-profit organizations (55 | 9.3%), and state government employees (39 | 6.6%) make up the most common classes of employment.
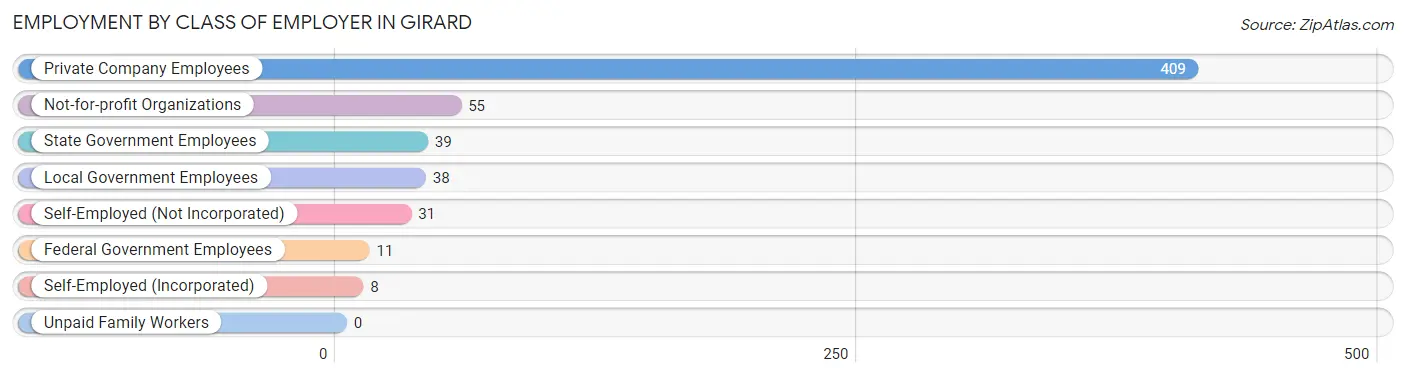
| Employer Class | # Employees | % Employees |
| Private Company Employees | 409 | 69.2% |
| Self-Employed (Incorporated) | 8 | 1.3% |
| Self-Employed (Not Incorporated) | 31 | 5.2% |
| Not-for-profit Organizations | 55 | 9.3% |
| Local Government Employees | 38 | 6.4% |
| State Government Employees | 39 | 6.6% |
| Federal Government Employees | 11 | 1.9% |
| Unpaid Family Workers | 0 | 0.0% |
| Total | 591 | 100.0% |
Employment Status by Age in Girard
According to the labor force statistics for Girard, out of the total population over 16 years of age (1,235), 54.0% or 667 individuals are in the labor force, with 10.8% or 72 of them unemployed. The age group with the highest labor force participation rate is 25 to 29 years, with 90.7% or 137 individuals in the labor force. Within the labor force, the 16 to 19 years age range has the highest percentage of unemployed individuals, with 56.7% or 17 of them being unemployed.
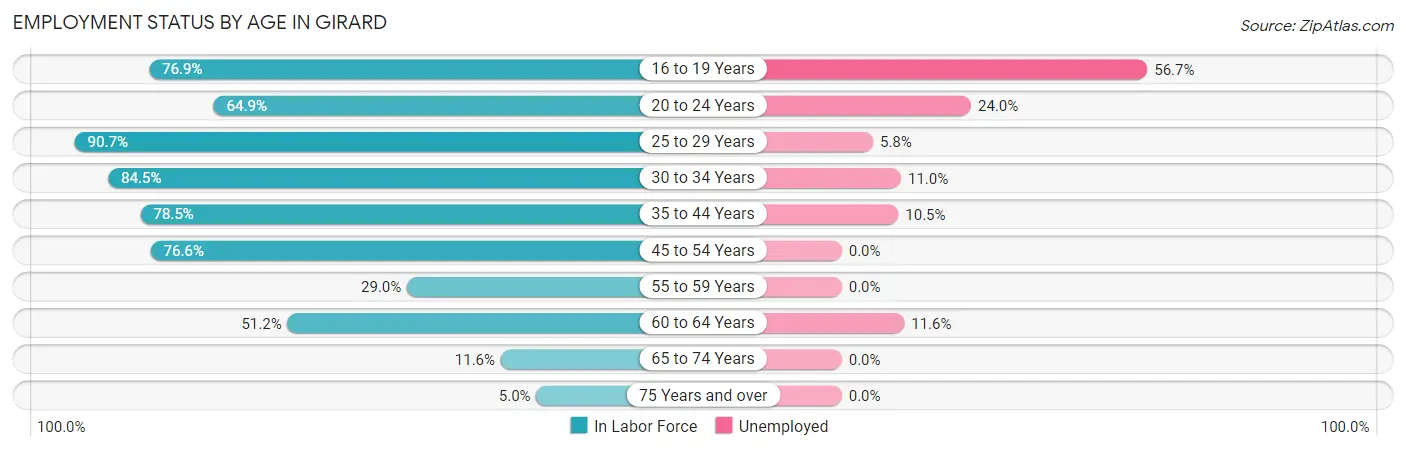
| Age Bracket | In Labor Force | Unemployed |
| 16 to 19 Years | 30 (76.9%) | 17 (56.7%) |
| 20 to 24 Years | 96 (64.9%) | 23 (24.0%) |
| 25 to 29 Years | 137 (90.7%) | 8 (5.8%) |
| 30 to 34 Years | 82 (84.5%) | 9 (11.0%) |
| 35 to 44 Years | 95 (78.5%) | 10 (10.5%) |
| 45 to 54 Years | 118 (76.6%) | 0 (0.0%) |
| 55 to 59 Years | 38 (29.0%) | 0 (0.0%) |
| 60 to 64 Years | 43 (51.2%) | 5 (11.6%) |
| 65 to 74 Years | 22 (11.6%) | 0 (0.0%) |
| 75 Years and over | 6 (5.0%) | 0 (0.0%) |
| Total | 667 (54.0%) | 72 (10.8%) |
Employment Status by Educational Attainment in Girard
According to labor force statistics for Girard, 69.5% of individuals (513) out of the total population between 25 and 64 years of age (738) are in the labor force, with 6.2% or 32 of them being unemployed. The group with the highest labor force participation rate are those with the educational attainment of bachelor's degree or higher, with 100.0% or 77 individuals in the labor force. Within the labor force, individuals with high school diploma education have the highest percentage of unemployment, with 9.5% or 28 of them being unemployed.
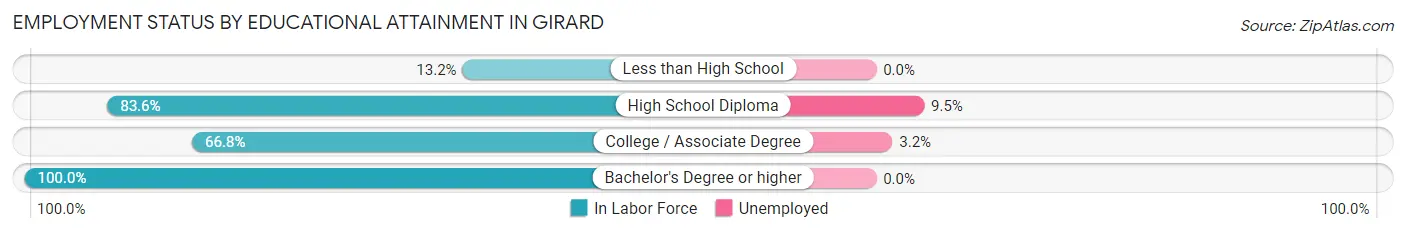
| Educational Attainment | In Labor Force | Unemployed |
| Less than High School | 16 (13.2%) | 0 (0.0%) |
| High School Diploma | 295 (83.6%) | 34 (9.5%) |
| College / Associate Degree | 125 (66.8%) | 6 (3.2%) |
| Bachelor's Degree or higher | 77 (100.0%) | 0 (0.0%) |
| Total | 513 (69.5%) | 46 (6.2%) |
Employment Occupations by Sex in Girard
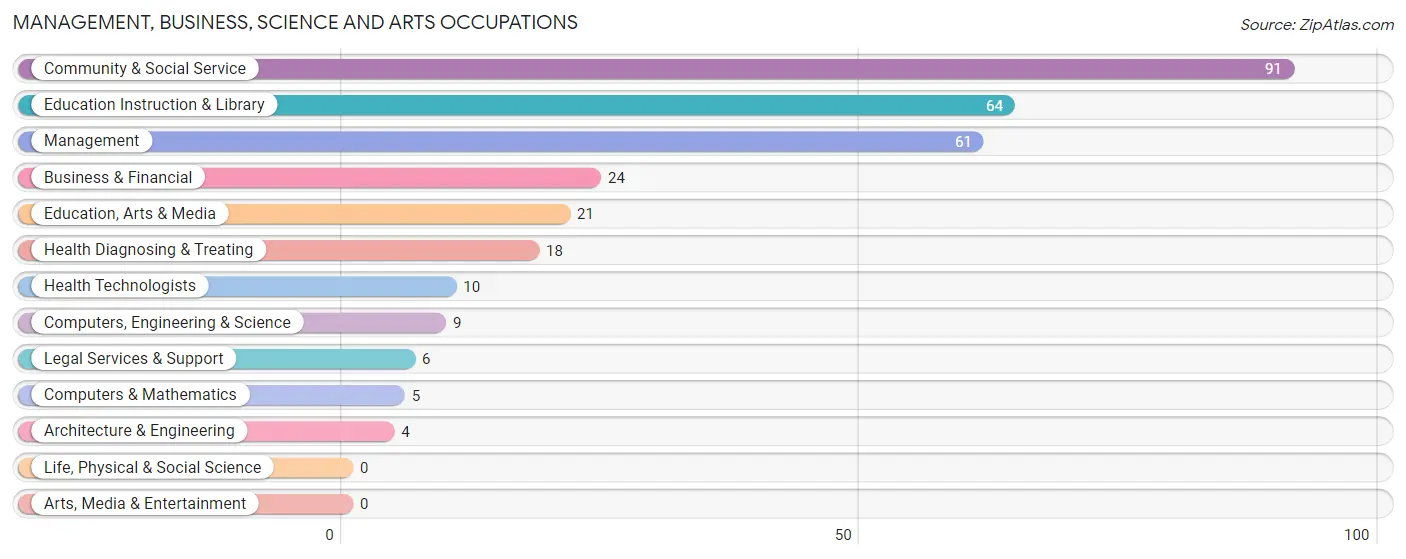
Management, Business, Science and Arts Occupations
The most common Management, Business, Science and Arts occupations in Girard are Community & Social Service (91 | 15.3%), Education Instruction & Library (64 | 10.8%), Management (61 | 10.2%), Business & Financial (24 | 4.0%), and Education, Arts & Media (21 | 3.5%).
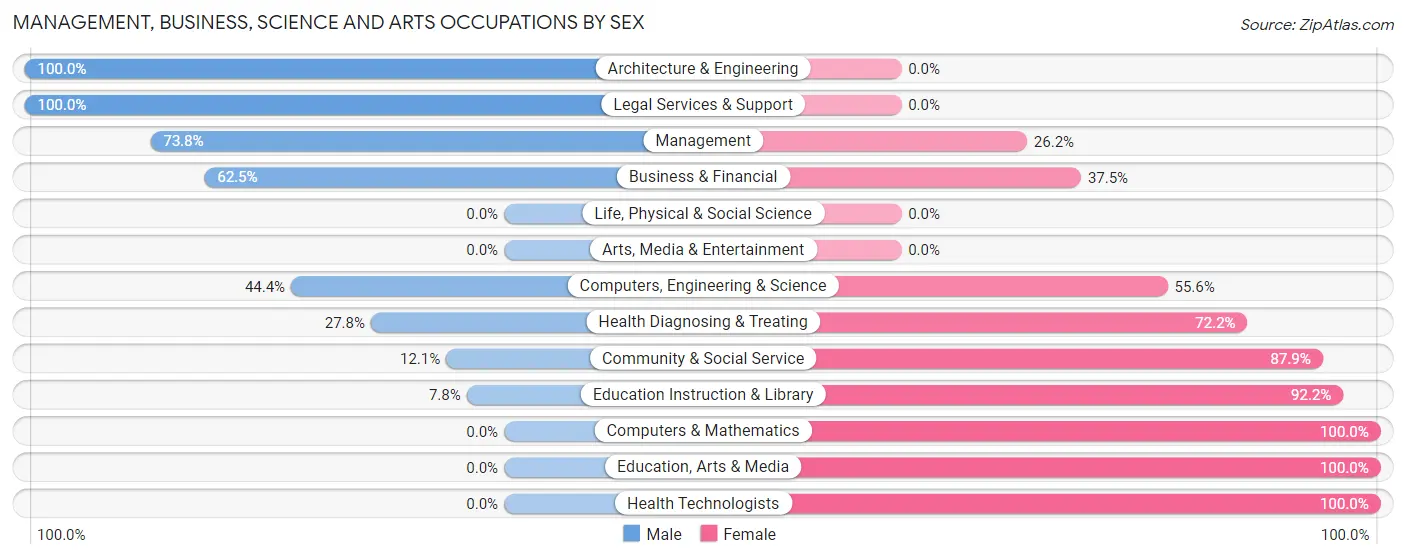
Management, Business, Science and Arts Occupations by Sex
Within the Management, Business, Science and Arts occupations in Girard, the most male-oriented occupations are Architecture & Engineering (100.0%), Legal Services & Support (100.0%), and Management (73.8%), while the most female-oriented occupations are Computers & Mathematics (100.0%), Education, Arts & Media (100.0%), and Health Technologists (100.0%).
| Occupation | Male | Female |
| Management | 45 (73.8%) | 16 (26.2%) |
| Business & Financial | 15 (62.5%) | 9 (37.5%) |
| Computers, Engineering & Science | 4 (44.4%) | 5 (55.6%) |
| Computers & Mathematics | 0 (0.0%) | 5 (100.0%) |
| Architecture & Engineering | 4 (100.0%) | 0 (0.0%) |
| Life, Physical & Social Science | 0 (0.0%) | 0 (0.0%) |
| Community & Social Service | 11 (12.1%) | 80 (87.9%) |
| Education, Arts & Media | 0 (0.0%) | 21 (100.0%) |
| Legal Services & Support | 6 (100.0%) | 0 (0.0%) |
| Education Instruction & Library | 5 (7.8%) | 59 (92.2%) |
| Arts, Media & Entertainment | 0 (0.0%) | 0 (0.0%) |
| Health Diagnosing & Treating | 5 (27.8%) | 13 (72.2%) |
| Health Technologists | 0 (0.0%) | 10 (100.0%) |
| Total (Category) | 80 (39.4%) | 123 (60.6%) |
| Total (Overall) | 317 (53.3%) | 278 (46.7%) |
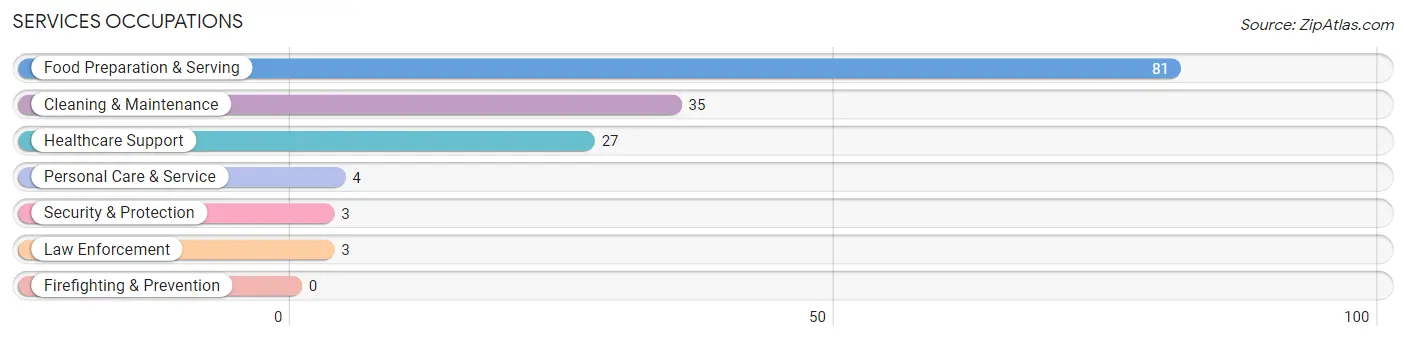
Services Occupations
The most common Services occupations in Girard are Food Preparation & Serving (81 | 13.6%), Cleaning & Maintenance (35 | 5.9%), Healthcare Support (27 | 4.5%), Personal Care & Service (4 | 0.7%), and Security & Protection (3 | 0.5%).
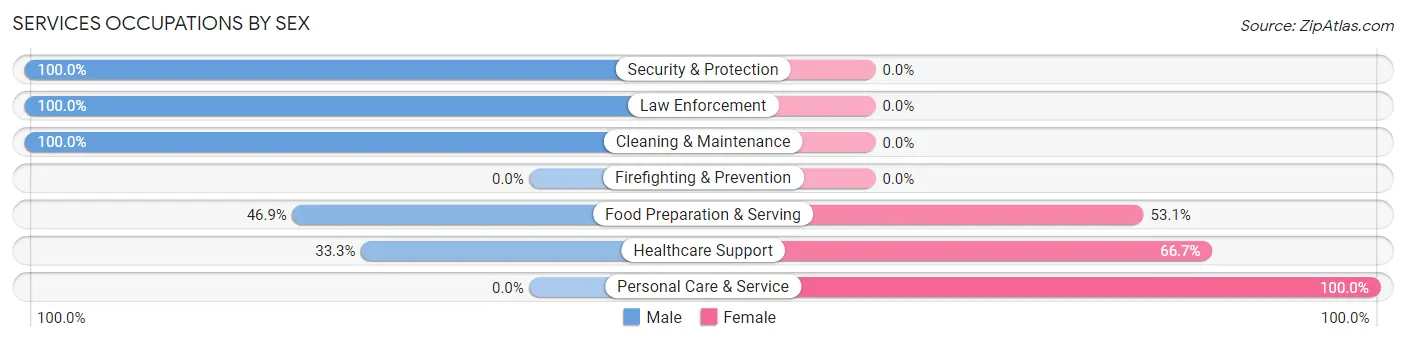
Services Occupations by Sex
Within the Services occupations in Girard, the most male-oriented occupations are Security & Protection (100.0%), Law Enforcement (100.0%), and Cleaning & Maintenance (100.0%), while the most female-oriented occupations are Personal Care & Service (100.0%), Healthcare Support (66.7%), and Food Preparation & Serving (53.1%).
| Occupation | Male | Female |
| Healthcare Support | 9 (33.3%) | 18 (66.7%) |
| Security & Protection | 3 (100.0%) | 0 (0.0%) |
| Firefighting & Prevention | 0 (0.0%) | 0 (0.0%) |
| Law Enforcement | 3 (100.0%) | 0 (0.0%) |
| Food Preparation & Serving | 38 (46.9%) | 43 (53.1%) |
| Cleaning & Maintenance | 35 (100.0%) | 0 (0.0%) |
| Personal Care & Service | 0 (0.0%) | 4 (100.0%) |
| Total (Category) | 85 (56.7%) | 65 (43.3%) |
| Total (Overall) | 317 (53.3%) | 278 (46.7%) |
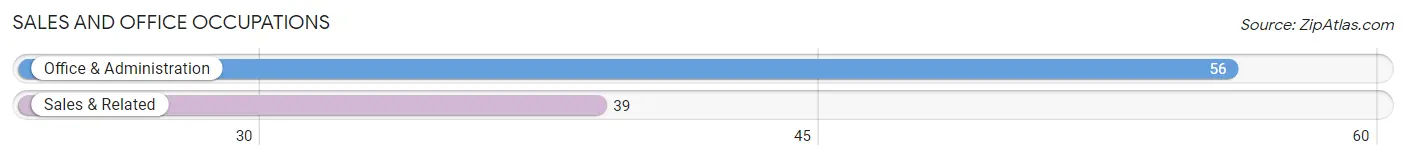
Sales and Office Occupations
The most common Sales and Office occupations in Girard are Office & Administration (56 | 9.4%), and Sales & Related (39 | 6.6%).
Sales and Office Occupations by Sex
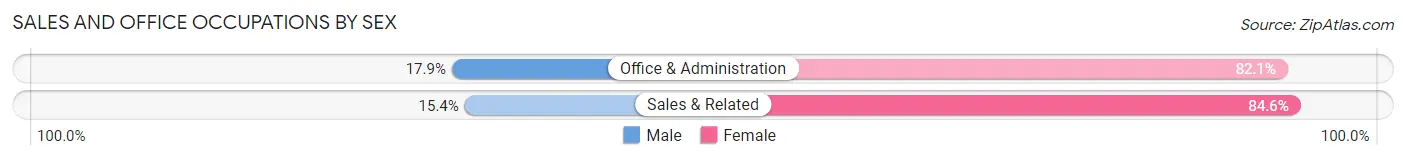
| Occupation | Male | Female |
| Sales & Related | 6 (15.4%) | 33 (84.6%) |
| Office & Administration | 10 (17.9%) | 46 (82.1%) |
| Total (Category) | 16 (16.8%) | 79 (83.2%) |
| Total (Overall) | 317 (53.3%) | 278 (46.7%) |
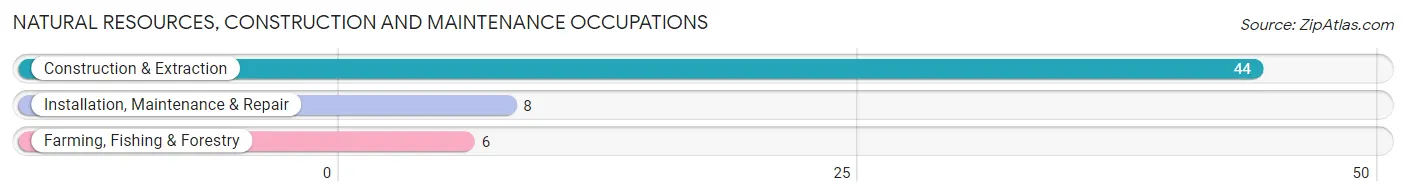
Natural Resources, Construction and Maintenance Occupations
The most common Natural Resources, Construction and Maintenance occupations in Girard are Construction & Extraction (44 | 7.4%), Installation, Maintenance & Repair (8 | 1.3%), and Farming, Fishing & Forestry (6 | 1.0%).
Natural Resources, Construction and Maintenance Occupations by Sex
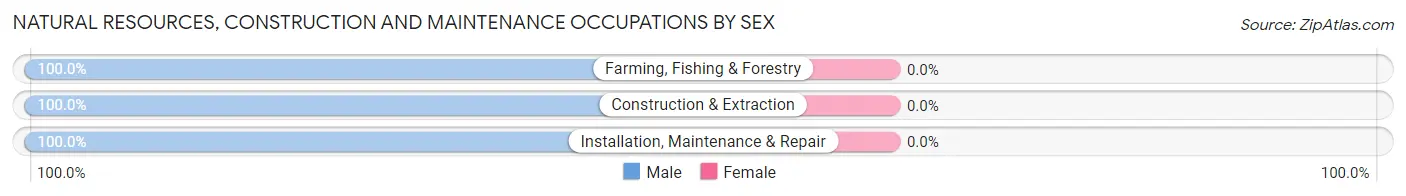
| Occupation | Male | Female |
| Farming, Fishing & Forestry | 6 (100.0%) | 0 (0.0%) |
| Construction & Extraction | 44 (100.0%) | 0 (0.0%) |
| Installation, Maintenance & Repair | 8 (100.0%) | 0 (0.0%) |
| Total (Category) | 58 (100.0%) | 0 (0.0%) |
| Total (Overall) | 317 (53.3%) | 278 (46.7%) |
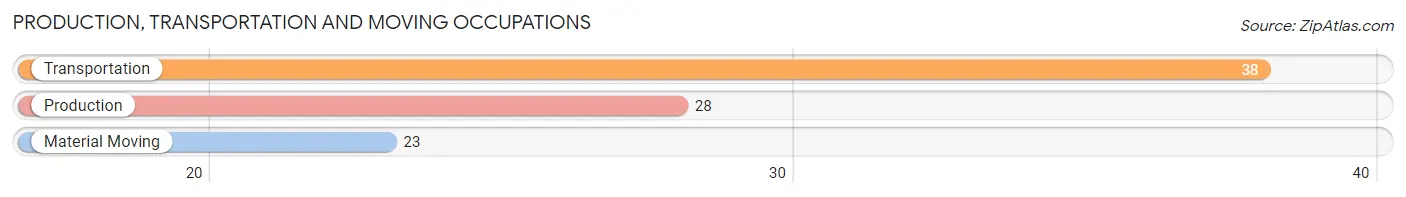
Production, Transportation and Moving Occupations
The most common Production, Transportation and Moving occupations in Girard are Transportation (38 | 6.4%), Production (28 | 4.7%), and Material Moving (23 | 3.9%).
Production, Transportation and Moving Occupations by Sex
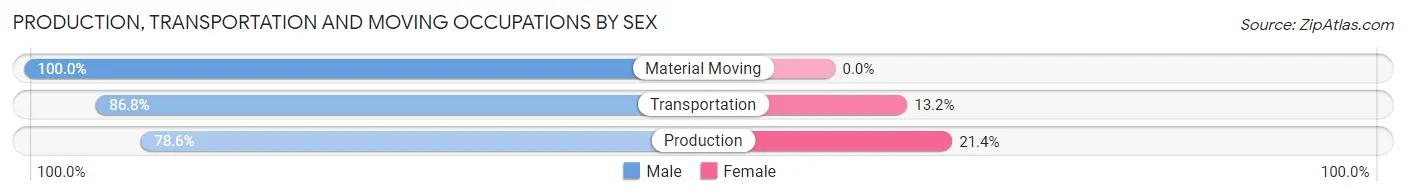
| Occupation | Male | Female |
| Production | 22 (78.6%) | 6 (21.4%) |
| Transportation | 33 (86.8%) | 5 (13.2%) |
| Material Moving | 23 (100.0%) | 0 (0.0%) |
| Total (Category) | 78 (87.6%) | 11 (12.4%) |
| Total (Overall) | 317 (53.3%) | 278 (46.7%) |
Employment Industries by Sex in Girard
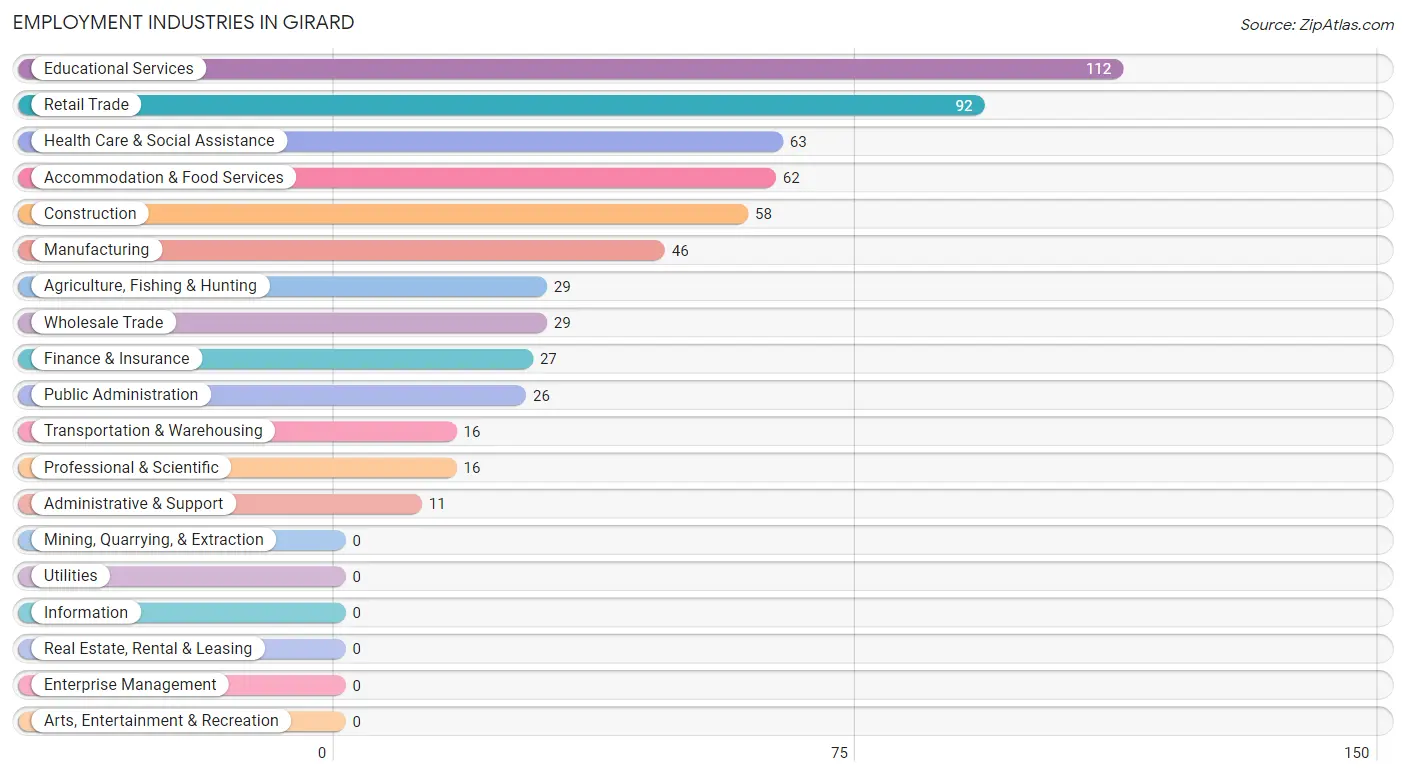
Employment Industries in Girard
The major employment industries in Girard include Educational Services (112 | 18.8%), Retail Trade (92 | 15.5%), Health Care & Social Assistance (63 | 10.6%), Accommodation & Food Services (62 | 10.4%), and Construction (58 | 9.8%).
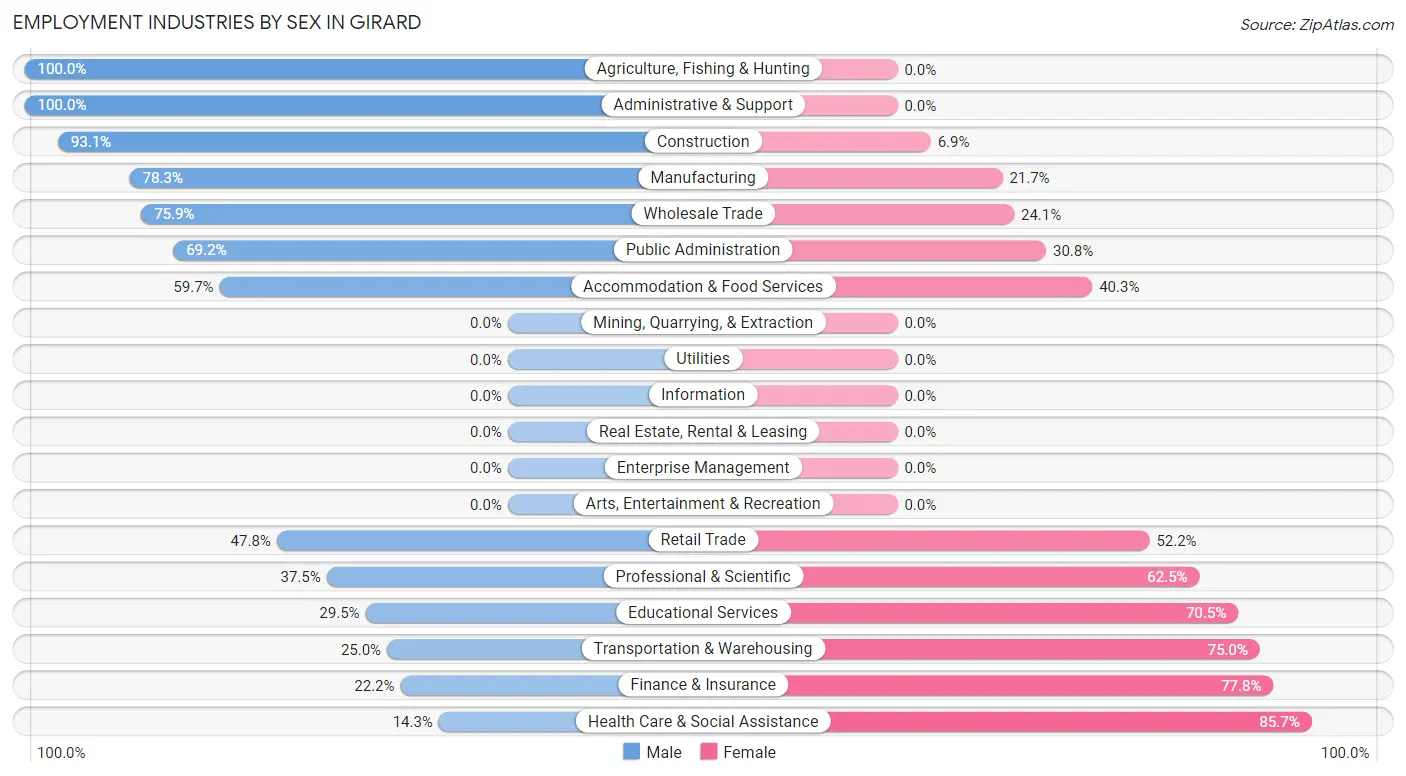
Employment Industries by Sex in Girard
The Girard industries that see more men than women are Agriculture, Fishing & Hunting (100.0%), Administrative & Support (100.0%), and Construction (93.1%), whereas the industries that tend to have a higher number of women are Health Care & Social Assistance (85.7%), Finance & Insurance (77.8%), and Transportation & Warehousing (75.0%).
| Industry | Male | Female |
| Agriculture, Fishing & Hunting | 29 (100.0%) | 0 (0.0%) |
| Mining, Quarrying, & Extraction | 0 (0.0%) | 0 (0.0%) |
| Construction | 54 (93.1%) | 4 (6.9%) |
| Manufacturing | 36 (78.3%) | 10 (21.7%) |
| Wholesale Trade | 22 (75.9%) | 7 (24.1%) |
| Retail Trade | 44 (47.8%) | 48 (52.2%) |
| Transportation & Warehousing | 4 (25.0%) | 12 (75.0%) |
| Utilities | 0 (0.0%) | 0 (0.0%) |
| Information | 0 (0.0%) | 0 (0.0%) |
| Finance & Insurance | 6 (22.2%) | 21 (77.8%) |
| Real Estate, Rental & Leasing | 0 (0.0%) | 0 (0.0%) |
| Professional & Scientific | 6 (37.5%) | 10 (62.5%) |
| Enterprise Management | 0 (0.0%) | 0 (0.0%) |
| Administrative & Support | 11 (100.0%) | 0 (0.0%) |
| Educational Services | 33 (29.5%) | 79 (70.5%) |
| Health Care & Social Assistance | 9 (14.3%) | 54 (85.7%) |
| Arts, Entertainment & Recreation | 0 (0.0%) | 0 (0.0%) |
| Accommodation & Food Services | 37 (59.7%) | 25 (40.3%) |
| Public Administration | 18 (69.2%) | 8 (30.8%) |
| Total | 317 (53.3%) | 278 (46.7%) |
Education in Girard
School Enrollment in Girard
The most common levels of schooling among the 288 students in Girard are college / undergraduate (82 | 28.5%), elementary school (63 | 21.9%), and middle school (58 | 20.1%).
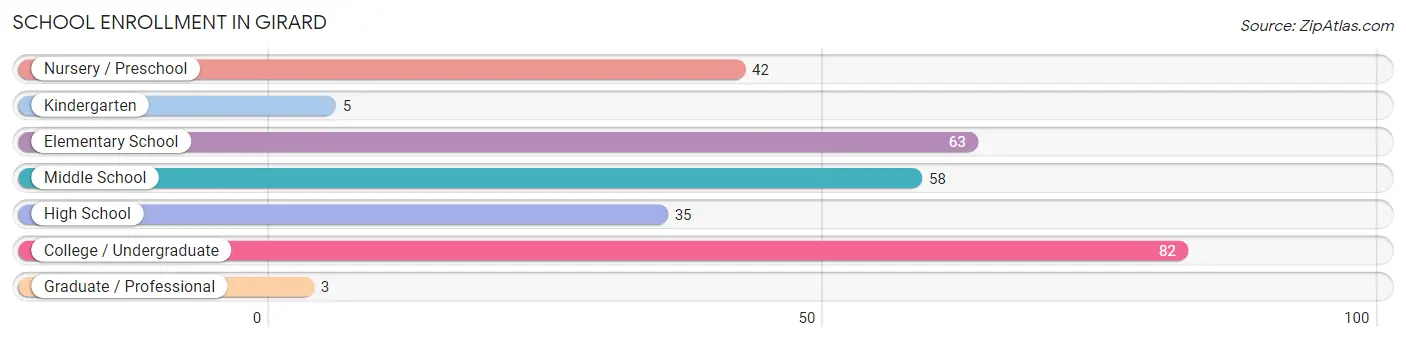
| School Level | # Students | % Students |
| Nursery / Preschool | 42 | 14.6% |
| Kindergarten | 5 | 1.7% |
| Elementary School | 63 | 21.9% |
| Middle School | 58 | 20.1% |
| High School | 35 | 12.1% |
| College / Undergraduate | 82 | 28.5% |
| Graduate / Professional | 3 | 1.0% |
| Total | 288 | 100.0% |
School Enrollment by Age by Funding Source in Girard
Out of a total of 288 students who are enrolled in schools in Girard, 102 (35.4%) attend a private institution, while the remaining 186 (64.6%) are enrolled in public schools. The age group of 20 to 24 year olds has the highest likelihood of being enrolled in private schools, with 34 (79.1% in the age bracket) enrolled. Conversely, the age group of 18 to 19 year olds has the lowest likelihood of being enrolled in a private school, with 12 (100.0% in the age bracket) attending a public institution.
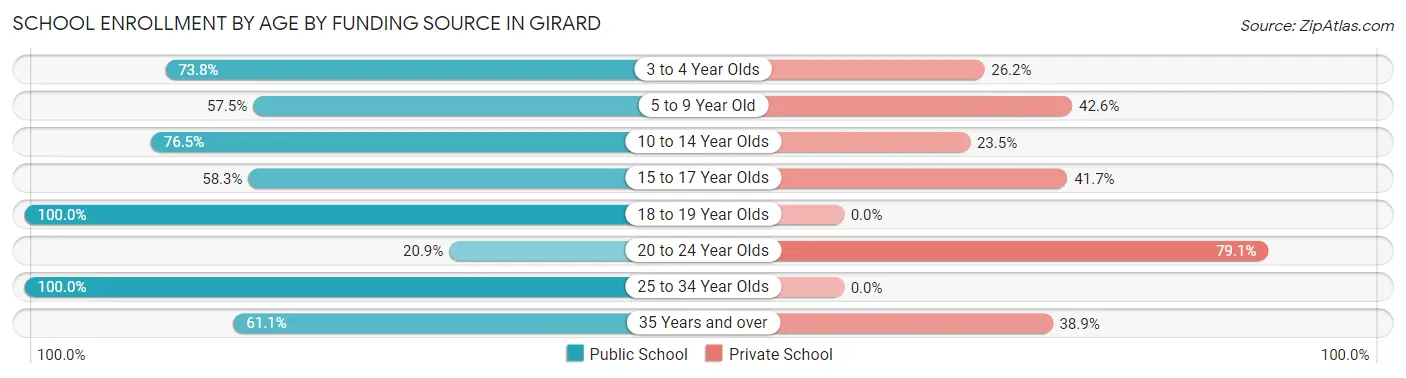
| Age Bracket | Public School | Private School |
| 3 to 4 Year Olds | 31 (73.8%) | 11 (26.2%) |
| 5 to 9 Year Old | 27 (57.5%) | 20 (42.5%) |
| 10 to 14 Year Olds | 65 (76.5%) | 20 (23.5%) |
| 15 to 17 Year Olds | 14 (58.3%) | 10 (41.7%) |
| 18 to 19 Year Olds | 12 (100.0%) | 0 (0.0%) |
| 20 to 24 Year Olds | 9 (20.9%) | 34 (79.1%) |
| 25 to 34 Year Olds | 17 (100.0%) | 0 (0.0%) |
| 35 Years and over | 11 (61.1%) | 7 (38.9%) |
| Total | 186 (64.6%) | 102 (35.4%) |
Educational Attainment by Field of Study in Girard
Business (28 | 25.7%), education (16 | 14.7%), literature & languages (12 | 11.0%), bio, nature & agricultural (10 | 9.2%), and science & technology (8 | 7.3%) are the most common fields of study among 109 individuals in Girard who have obtained a bachelor's degree or higher.
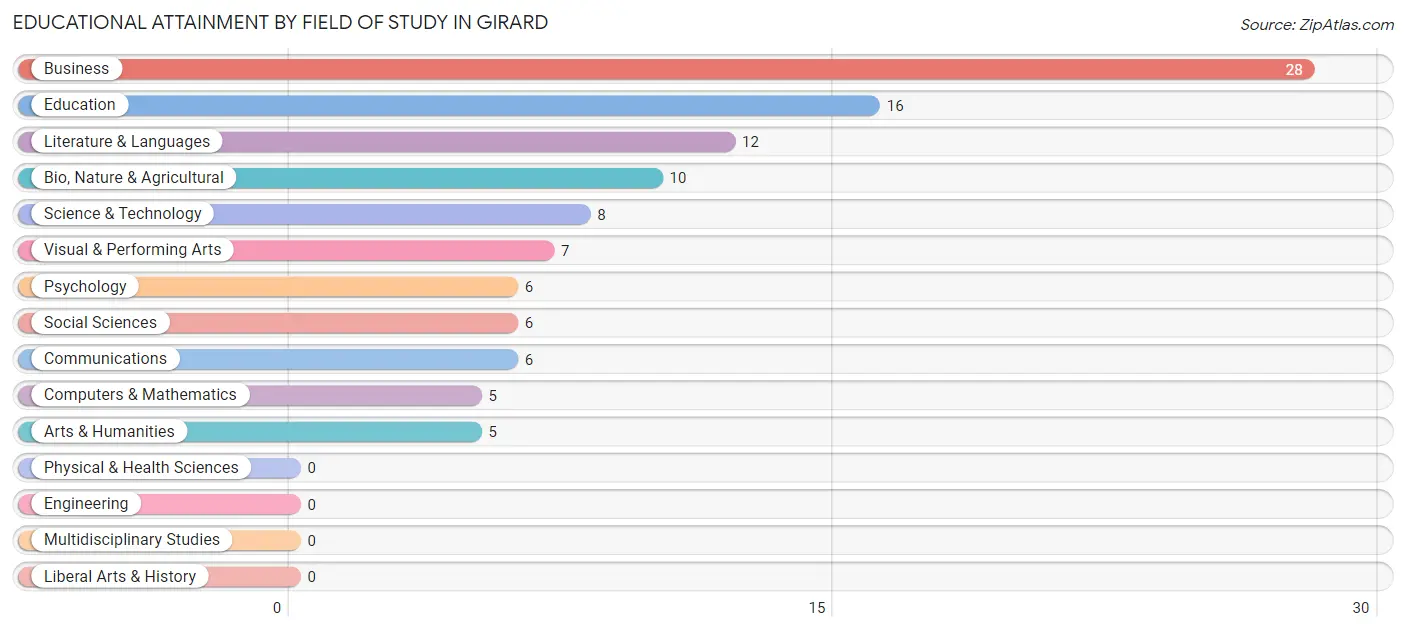
| Field of Study | # Graduates | % Graduates |
| Computers & Mathematics | 5 | 4.6% |
| Bio, Nature & Agricultural | 10 | 9.2% |
| Physical & Health Sciences | 0 | 0.0% |
| Psychology | 6 | 5.5% |
| Social Sciences | 6 | 5.5% |
| Engineering | 0 | 0.0% |
| Multidisciplinary Studies | 0 | 0.0% |
| Science & Technology | 8 | 7.3% |
| Business | 28 | 25.7% |
| Education | 16 | 14.7% |
| Literature & Languages | 12 | 11.0% |
| Liberal Arts & History | 0 | 0.0% |
| Visual & Performing Arts | 7 | 6.4% |
| Communications | 6 | 5.5% |
| Arts & Humanities | 5 | 4.6% |
| Total | 109 | 100.0% |
Transportation & Commute in Girard
Vehicle Availability by Sex in Girard
The most prevalent vehicle ownership categories in Girard are males with 2 vehicles (172, accounting for 54.3%) and females with 2 vehicles (172, making up 62.8%).
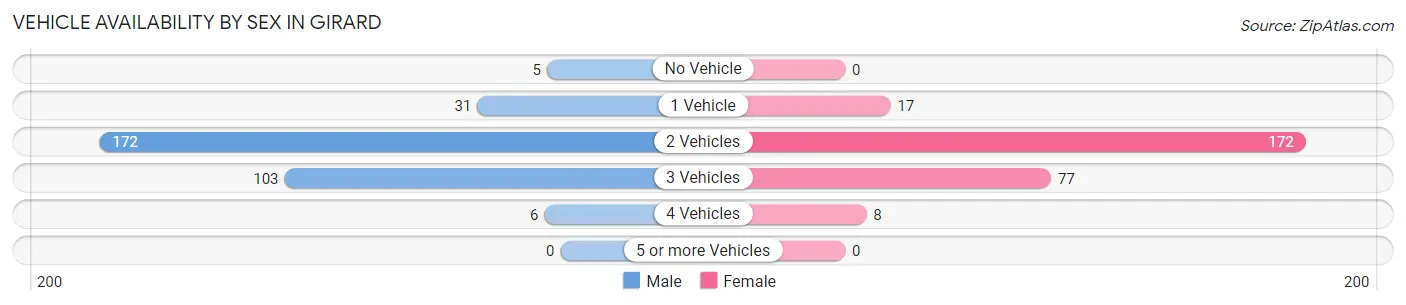
| Vehicles Available | Male | Female |
| No Vehicle | 5 (1.6%) | 0 (0.0%) |
| 1 Vehicle | 31 (9.8%) | 17 (6.2%) |
| 2 Vehicles | 172 (54.3%) | 172 (62.8%) |
| 3 Vehicles | 103 (32.5%) | 77 (28.1%) |
| 4 Vehicles | 6 (1.9%) | 8 (2.9%) |
| 5 or more Vehicles | 0 (0.0%) | 0 (0.0%) |
| Total | 317 (100.0%) | 274 (100.0%) |
Commute Time in Girard
The most frequently occuring commute durations in Girard are 45 to 59 minutes (181 commuters, 32.7%), 5 to 9 minutes (74 commuters, 13.4%), and 15 to 19 minutes (54 commuters, 9.8%).
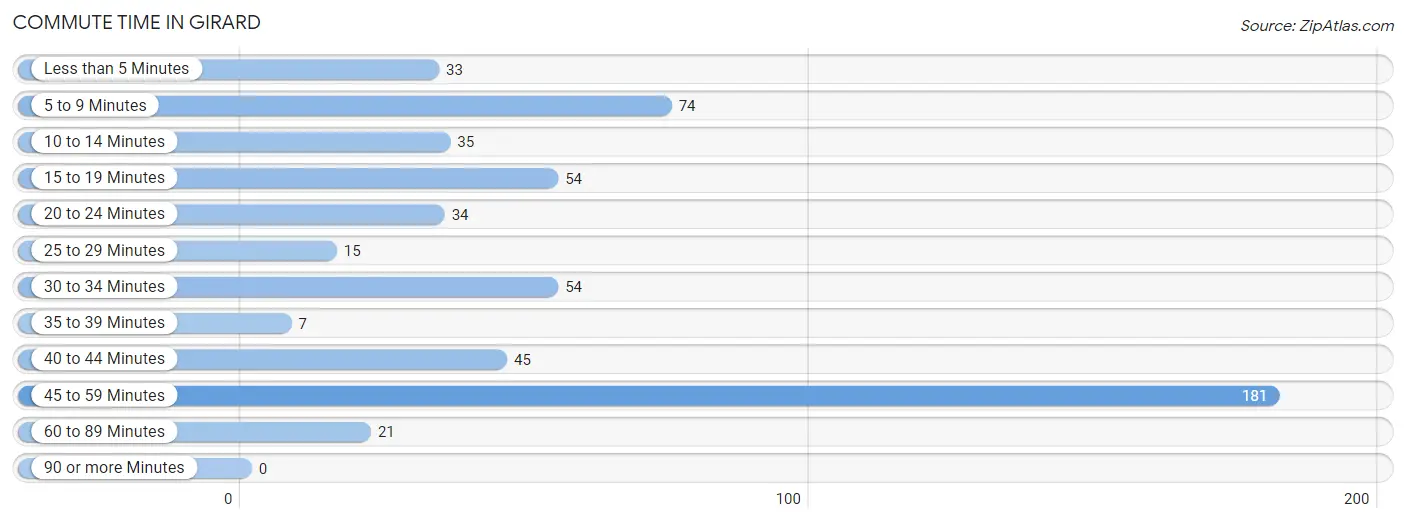
| Commute Time | # Commuters | % Commuters |
| Less than 5 Minutes | 33 | 6.0% |
| 5 to 9 Minutes | 74 | 13.4% |
| 10 to 14 Minutes | 35 | 6.3% |
| 15 to 19 Minutes | 54 | 9.8% |
| 20 to 24 Minutes | 34 | 6.1% |
| 25 to 29 Minutes | 15 | 2.7% |
| 30 to 34 Minutes | 54 | 9.8% |
| 35 to 39 Minutes | 7 | 1.3% |
| 40 to 44 Minutes | 45 | 8.1% |
| 45 to 59 Minutes | 181 | 32.7% |
| 60 to 89 Minutes | 21 | 3.8% |
| 90 or more Minutes | 0 | 0.0% |
Commute Time by Sex in Girard
The most common commute times in Girard are 45 to 59 minutes (63 commuters, 20.7%) for males and 45 to 59 minutes (118 commuters, 47.4%) for females.
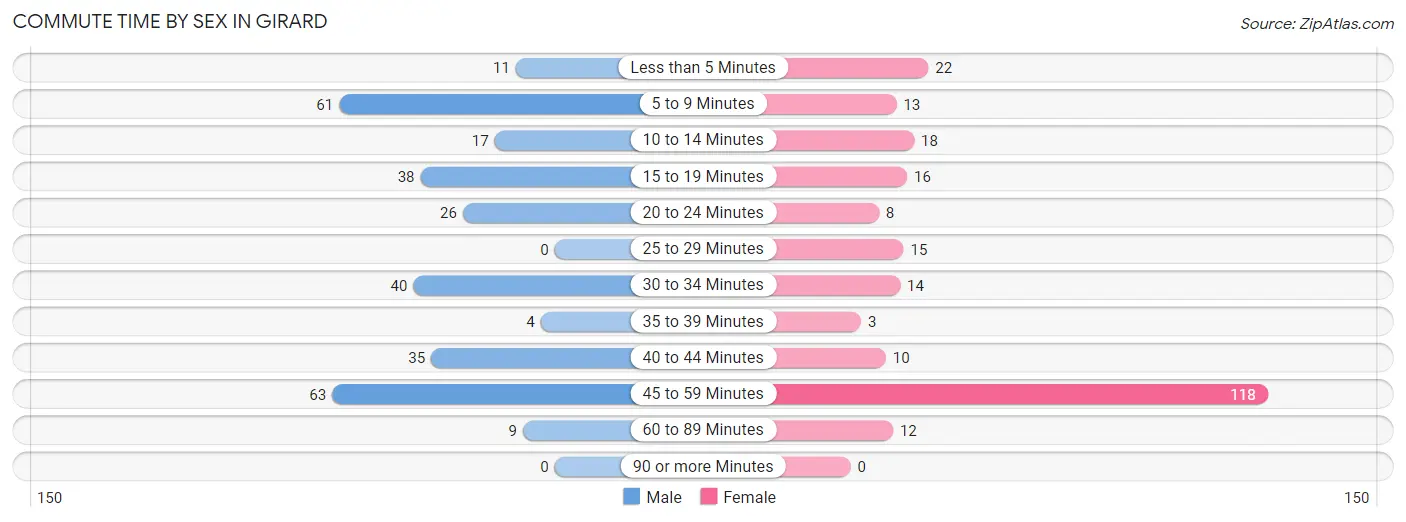
| Commute Time | Male | Female |
| Less than 5 Minutes | 11 (3.6%) | 22 (8.8%) |
| 5 to 9 Minutes | 61 (20.1%) | 13 (5.2%) |
| 10 to 14 Minutes | 17 (5.6%) | 18 (7.2%) |
| 15 to 19 Minutes | 38 (12.5%) | 16 (6.4%) |
| 20 to 24 Minutes | 26 (8.6%) | 8 (3.2%) |
| 25 to 29 Minutes | 0 (0.0%) | 15 (6.0%) |
| 30 to 34 Minutes | 40 (13.2%) | 14 (5.6%) |
| 35 to 39 Minutes | 4 (1.3%) | 3 (1.2%) |
| 40 to 44 Minutes | 35 (11.5%) | 10 (4.0%) |
| 45 to 59 Minutes | 63 (20.7%) | 118 (47.4%) |
| 60 to 89 Minutes | 9 (3.0%) | 12 (4.8%) |
| 90 or more Minutes | 0 (0.0%) | 0 (0.0%) |
Time of Departure to Work by Sex in Girard
The most frequent times of departure to work in Girard are 12:00 AM to 4:59 AM (47, 15.5%) for males and 7:30 AM to 7:59 AM (88, 35.3%) for females.
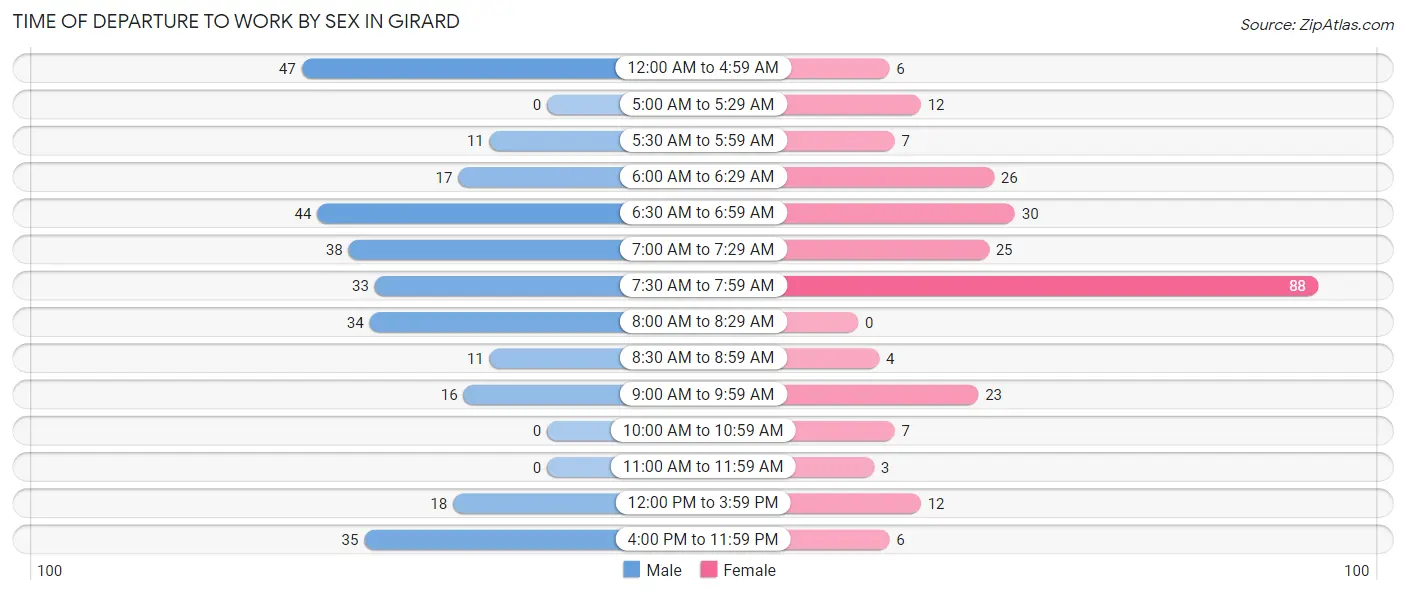
| Time of Departure | Male | Female |
| 12:00 AM to 4:59 AM | 47 (15.5%) | 6 (2.4%) |
| 5:00 AM to 5:29 AM | 0 (0.0%) | 12 (4.8%) |
| 5:30 AM to 5:59 AM | 11 (3.6%) | 7 (2.8%) |
| 6:00 AM to 6:29 AM | 17 (5.6%) | 26 (10.4%) |
| 6:30 AM to 6:59 AM | 44 (14.5%) | 30 (12.0%) |
| 7:00 AM to 7:29 AM | 38 (12.5%) | 25 (10.0%) |
| 7:30 AM to 7:59 AM | 33 (10.9%) | 88 (35.3%) |
| 8:00 AM to 8:29 AM | 34 (11.2%) | 0 (0.0%) |
| 8:30 AM to 8:59 AM | 11 (3.6%) | 4 (1.6%) |
| 9:00 AM to 9:59 AM | 16 (5.3%) | 23 (9.2%) |
| 10:00 AM to 10:59 AM | 0 (0.0%) | 7 (2.8%) |
| 11:00 AM to 11:59 AM | 0 (0.0%) | 3 (1.2%) |
| 12:00 PM to 3:59 PM | 18 (5.9%) | 12 (4.8%) |
| 4:00 PM to 11:59 PM | 35 (11.5%) | 6 (2.4%) |
| Total | 304 (100.0%) | 249 (100.0%) |
Housing Occupancy in Girard
Occupancy by Ownership in Girard
Of the total 558 dwellings in Girard, owner-occupied units account for 336 (60.2%), while renter-occupied units make up 222 (39.8%).
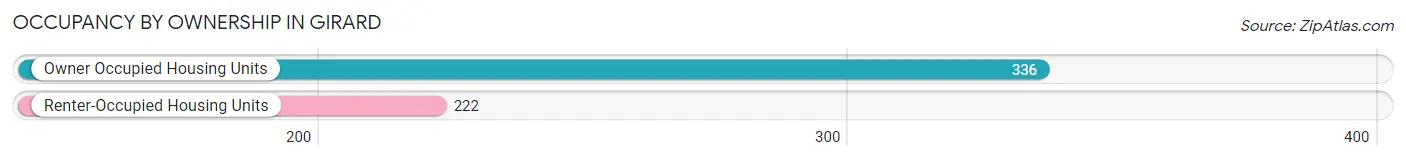
| Occupancy | # Housing Units | % Housing Units |
| Owner Occupied Housing Units | 336 | 60.2% |
| Renter-Occupied Housing Units | 222 | 39.8% |
| Total Occupied Housing Units | 558 | 100.0% |
Occupancy by Household Size in Girard
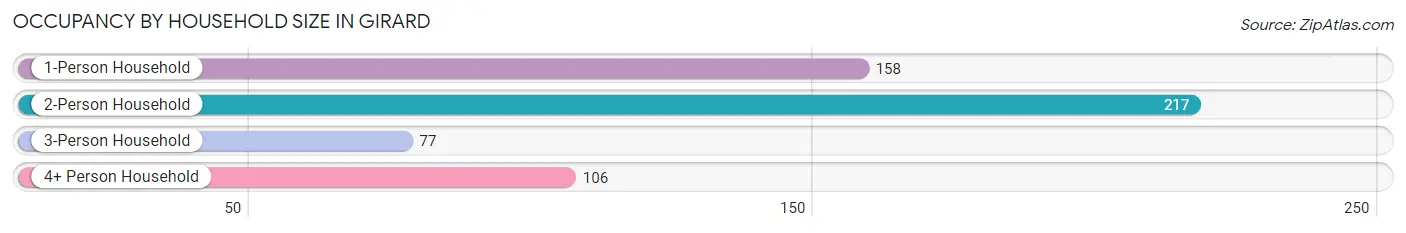
| Household Size | # Housing Units | % Housing Units |
| 1-Person Household | 158 | 28.3% |
| 2-Person Household | 217 | 38.9% |
| 3-Person Household | 77 | 13.8% |
| 4+ Person Household | 106 | 19.0% |
| Total Housing Units | 558 | 100.0% |
Occupancy by Ownership by Household Size in Girard
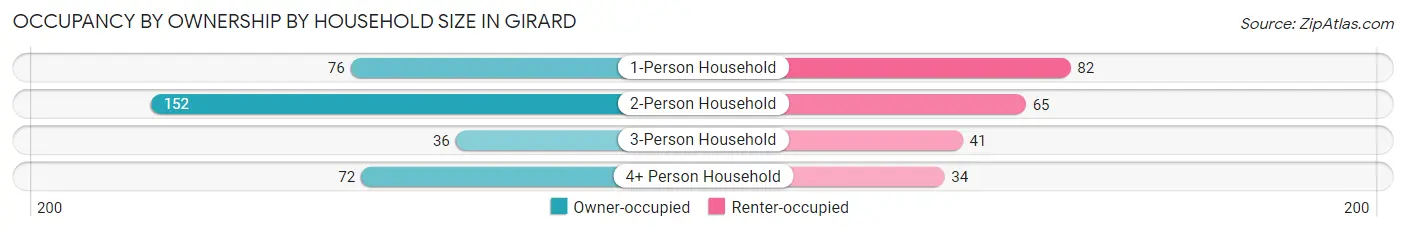
| Household Size | Owner-occupied | Renter-occupied |
| 1-Person Household | 76 (48.1%) | 82 (51.9%) |
| 2-Person Household | 152 (70.1%) | 65 (29.9%) |
| 3-Person Household | 36 (46.8%) | 41 (53.2%) |
| 4+ Person Household | 72 (67.9%) | 34 (32.1%) |
| Total Housing Units | 336 (60.2%) | 222 (39.8%) |
Occupancy by Educational Attainment in Girard
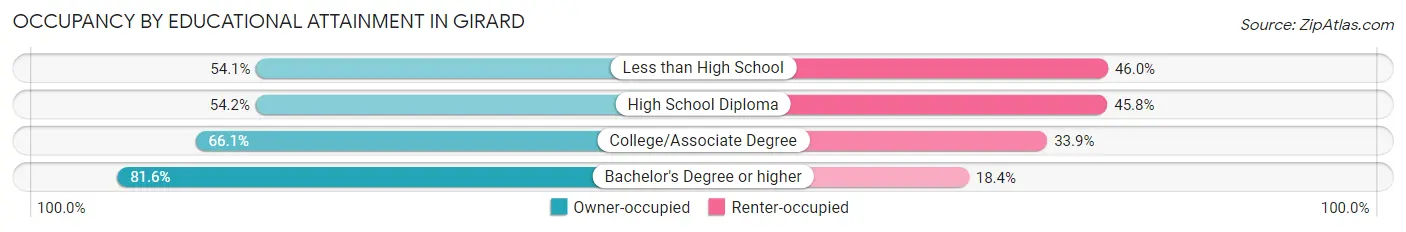
| Household Size | Owner-occupied | Renter-occupied |
| Less than High School | 40 (54.0%) | 34 (46.0%) |
| High School Diploma | 143 (54.2%) | 121 (45.8%) |
| College/Associate Degree | 113 (66.1%) | 58 (33.9%) |
| Bachelor's Degree or higher | 40 (81.6%) | 9 (18.4%) |
Occupancy by Age of Householder in Girard
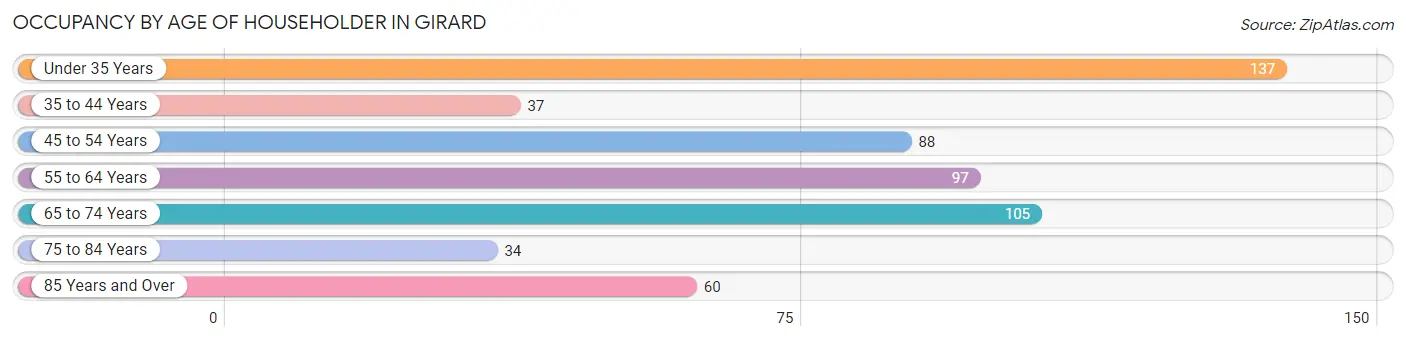
| Age Bracket | # Households | % Households |
| Under 35 Years | 137 | 24.5% |
| 35 to 44 Years | 37 | 6.6% |
| 45 to 54 Years | 88 | 15.8% |
| 55 to 64 Years | 97 | 17.4% |
| 65 to 74 Years | 105 | 18.8% |
| 75 to 84 Years | 34 | 6.1% |
| 85 Years and Over | 60 | 10.7% |
| Total | 558 | 100.0% |
Housing Finances in Girard
Median Income by Occupancy in Girard
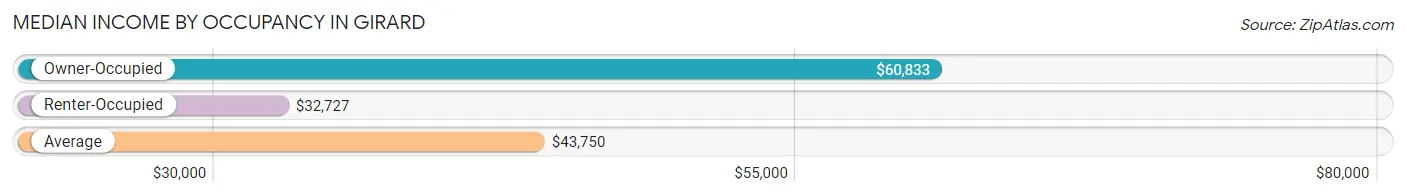
| Occupancy Type | # Households | Median Income |
| Owner-Occupied | 336 (60.2%) | $60,833 |
| Renter-Occupied | 222 (39.8%) | $32,727 |
| Average | 558 (100.0%) | $43,750 |
Occupancy by Householder Income Bracket in Girard
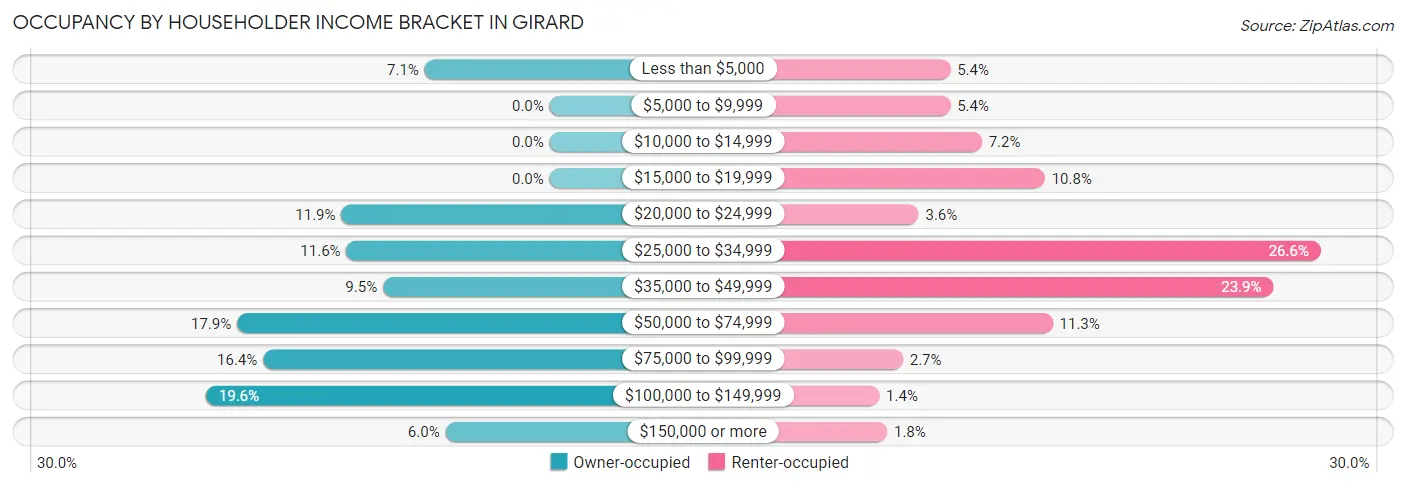
| Income Bracket | Owner-occupied | Renter-occupied |
| Less than $5,000 | 24 (7.1%) | 12 (5.4%) |
| $5,000 to $9,999 | 0 (0.0%) | 12 (5.4%) |
| $10,000 to $14,999 | 0 (0.0%) | 16 (7.2%) |
| $15,000 to $19,999 | 0 (0.0%) | 24 (10.8%) |
| $20,000 to $24,999 | 40 (11.9%) | 8 (3.6%) |
| $25,000 to $34,999 | 39 (11.6%) | 59 (26.6%) |
| $35,000 to $49,999 | 32 (9.5%) | 53 (23.9%) |
| $50,000 to $74,999 | 60 (17.9%) | 25 (11.3%) |
| $75,000 to $99,999 | 55 (16.4%) | 6 (2.7%) |
| $100,000 to $149,999 | 66 (19.6%) | 3 (1.3%) |
| $150,000 or more | 20 (5.9%) | 4 (1.8%) |
| Total | 336 (100.0%) | 222 (100.0%) |
Monthly Housing Cost Tiers in Girard
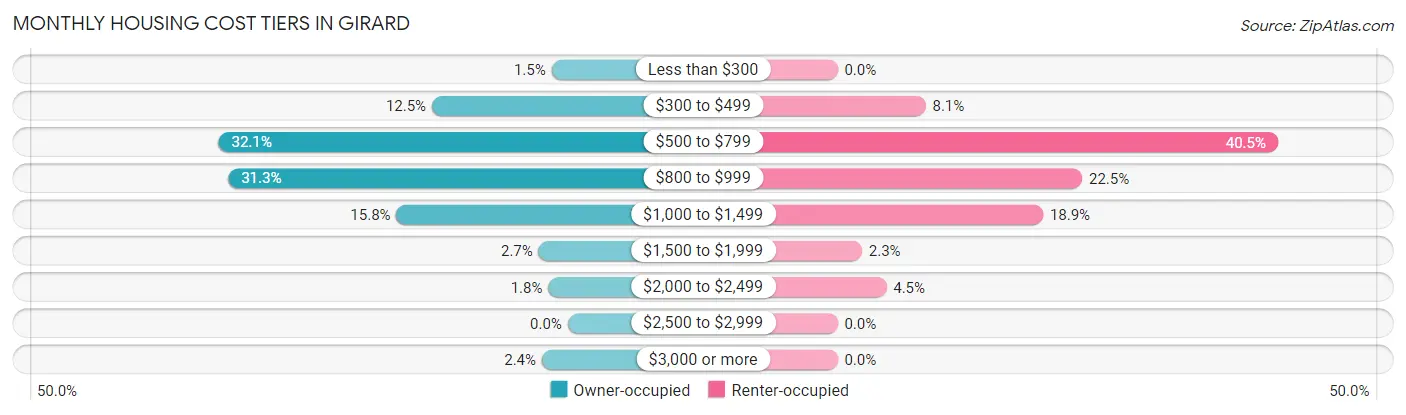
| Monthly Cost | Owner-occupied | Renter-occupied |
| Less than $300 | 5 (1.5%) | 0 (0.0%) |
| $300 to $499 | 42 (12.5%) | 18 (8.1%) |
| $500 to $799 | 108 (32.1%) | 90 (40.5%) |
| $800 to $999 | 105 (31.2%) | 50 (22.5%) |
| $1,000 to $1,499 | 53 (15.8%) | 42 (18.9%) |
| $1,500 to $1,999 | 9 (2.7%) | 5 (2.2%) |
| $2,000 to $2,499 | 6 (1.8%) | 10 (4.5%) |
| $2,500 to $2,999 | 0 (0.0%) | 0 (0.0%) |
| $3,000 or more | 8 (2.4%) | 0 (0.0%) |
| Total | 336 (100.0%) | 222 (100.0%) |
Physical Housing Characteristics in Girard
Housing Structures in Girard
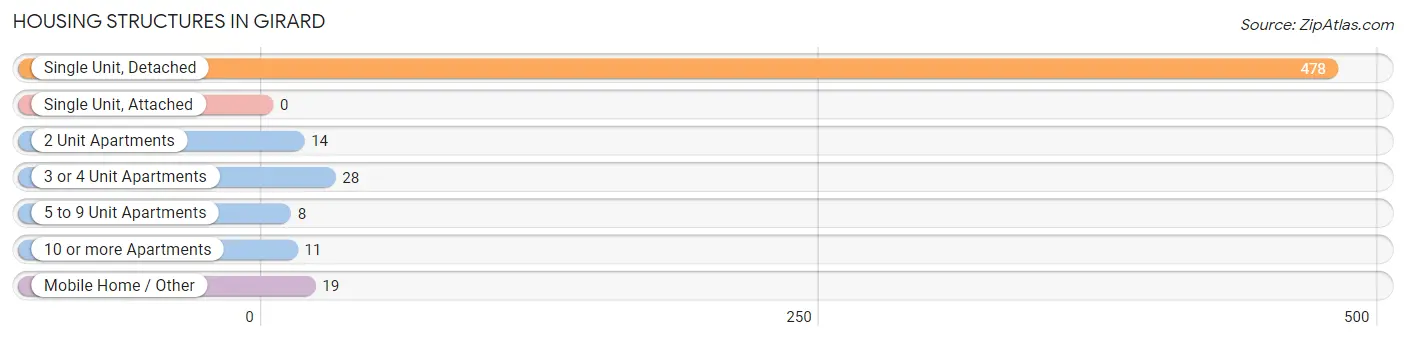
| Structure Type | # Housing Units | % Housing Units |
| Single Unit, Detached | 478 | 85.7% |
| Single Unit, Attached | 0 | 0.0% |
| 2 Unit Apartments | 14 | 2.5% |
| 3 or 4 Unit Apartments | 28 | 5.0% |
| 5 to 9 Unit Apartments | 8 | 1.4% |
| 10 or more Apartments | 11 | 2.0% |
| Mobile Home / Other | 19 | 3.4% |
| Total | 558 | 100.0% |
Housing Structures by Occupancy in Girard
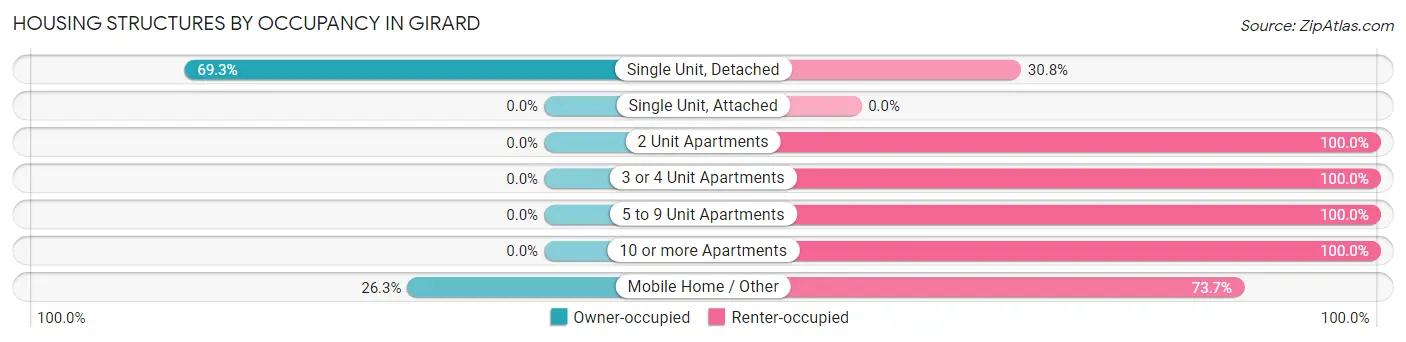
| Structure Type | Owner-occupied | Renter-occupied |
| Single Unit, Detached | 331 (69.3%) | 147 (30.7%) |
| Single Unit, Attached | 0 (0.0%) | 0 (0.0%) |
| 2 Unit Apartments | 0 (0.0%) | 14 (100.0%) |
| 3 or 4 Unit Apartments | 0 (0.0%) | 28 (100.0%) |
| 5 to 9 Unit Apartments | 0 (0.0%) | 8 (100.0%) |
| 10 or more Apartments | 0 (0.0%) | 11 (100.0%) |
| Mobile Home / Other | 5 (26.3%) | 14 (73.7%) |
| Total | 336 (60.2%) | 222 (39.8%) |
Housing Structures by Number of Rooms in Girard
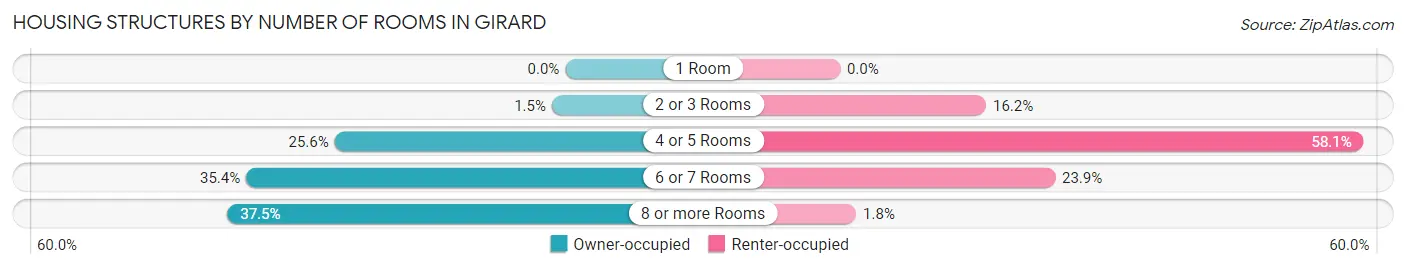
| Number of Rooms | Owner-occupied | Renter-occupied |
| 1 Room | 0 (0.0%) | 0 (0.0%) |
| 2 or 3 Rooms | 5 (1.5%) | 36 (16.2%) |
| 4 or 5 Rooms | 86 (25.6%) | 129 (58.1%) |
| 6 or 7 Rooms | 119 (35.4%) | 53 (23.9%) |
| 8 or more Rooms | 126 (37.5%) | 4 (1.8%) |
| Total | 336 (100.0%) | 222 (100.0%) |
Housing Structure by Heating Type in Girard
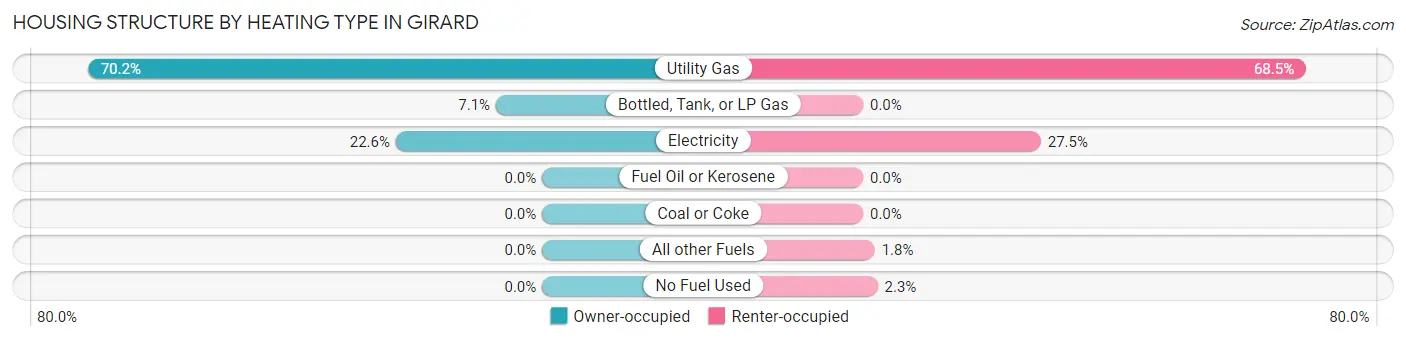
| Heating Type | Owner-occupied | Renter-occupied |
| Utility Gas | 236 (70.2%) | 152 (68.5%) |
| Bottled, Tank, or LP Gas | 24 (7.1%) | 0 (0.0%) |
| Electricity | 76 (22.6%) | 61 (27.5%) |
| Fuel Oil or Kerosene | 0 (0.0%) | 0 (0.0%) |
| Coal or Coke | 0 (0.0%) | 0 (0.0%) |
| All other Fuels | 0 (0.0%) | 4 (1.8%) |
| No Fuel Used | 0 (0.0%) | 5 (2.2%) |
| Total | 336 (100.0%) | 222 (100.0%) |
Household Vehicle Usage in Girard
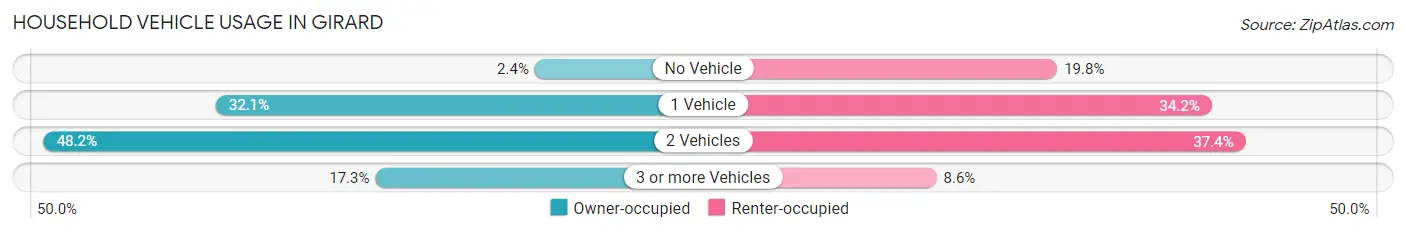
| Vehicles per Household | Owner-occupied | Renter-occupied |
| No Vehicle | 8 (2.4%) | 44 (19.8%) |
| 1 Vehicle | 108 (32.1%) | 76 (34.2%) |
| 2 Vehicles | 162 (48.2%) | 83 (37.4%) |
| 3 or more Vehicles | 58 (17.3%) | 19 (8.6%) |
| Total | 336 (100.0%) | 222 (100.0%) |
Real Estate & Mortgages in Girard
Real Estate and Mortgage Overview in Girard
| Characteristic | Without Mortgage | With Mortgage |
| Housing Units | 137 | 199 |
| Median Property Value | $125,300 | $85,200 |
| Median Household Income | $56,750 | $0 |
| Monthly Housing Costs | $584 | $8 |
| Real Estate Taxes | $2,028 | $0 |
Property Value by Mortgage Status in Girard
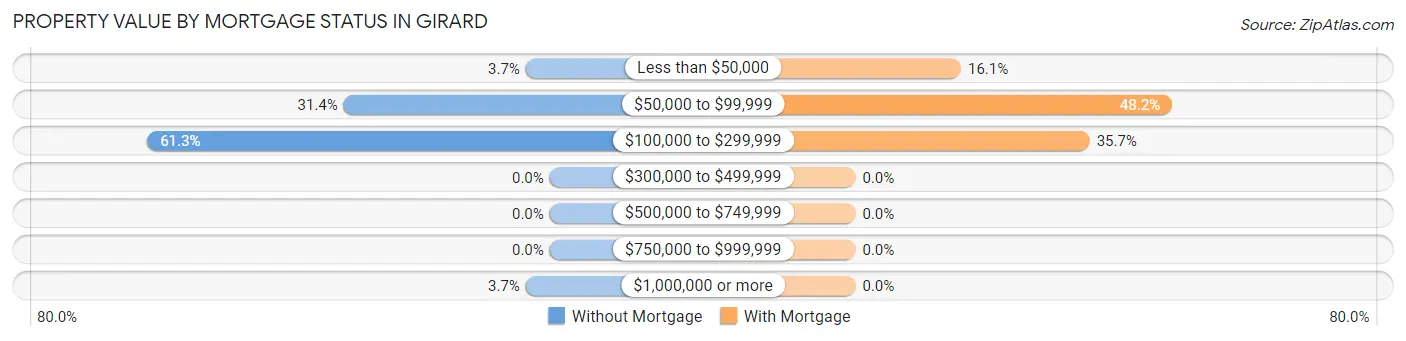
| Property Value | Without Mortgage | With Mortgage |
| Less than $50,000 | 5 (3.6%) | 32 (16.1%) |
| $50,000 to $99,999 | 43 (31.4%) | 96 (48.2%) |
| $100,000 to $299,999 | 84 (61.3%) | 71 (35.7%) |
| $300,000 to $499,999 | 0 (0.0%) | 0 (0.0%) |
| $500,000 to $749,999 | 0 (0.0%) | 0 (0.0%) |
| $750,000 to $999,999 | 0 (0.0%) | 0 (0.0%) |
| $1,000,000 or more | 5 (3.6%) | 0 (0.0%) |
| Total | 137 (100.0%) | 199 (100.0%) |
Household Income by Mortgage Status in Girard
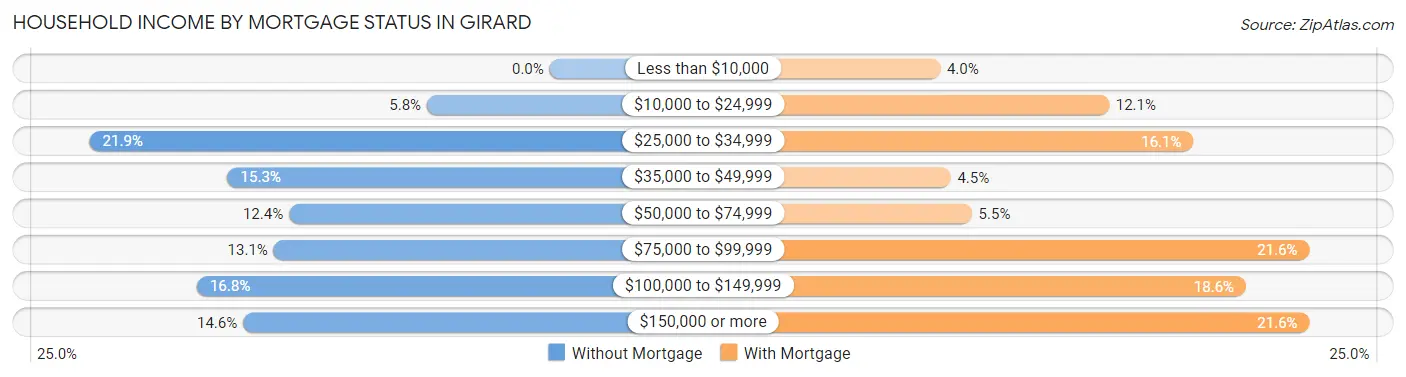
| Household Income | Without Mortgage | With Mortgage |
| Less than $10,000 | 0 (0.0%) | 8 (4.0%) |
| $10,000 to $24,999 | 8 (5.8%) | 24 (12.1%) |
| $25,000 to $34,999 | 30 (21.9%) | 32 (16.1%) |
| $35,000 to $49,999 | 21 (15.3%) | 9 (4.5%) |
| $50,000 to $74,999 | 17 (12.4%) | 11 (5.5%) |
| $75,000 to $99,999 | 18 (13.1%) | 43 (21.6%) |
| $100,000 to $149,999 | 23 (16.8%) | 37 (18.6%) |
| $150,000 or more | 20 (14.6%) | 43 (21.6%) |
| Total | 137 (100.0%) | 199 (100.0%) |
Property Value to Household Income Ratio in Girard
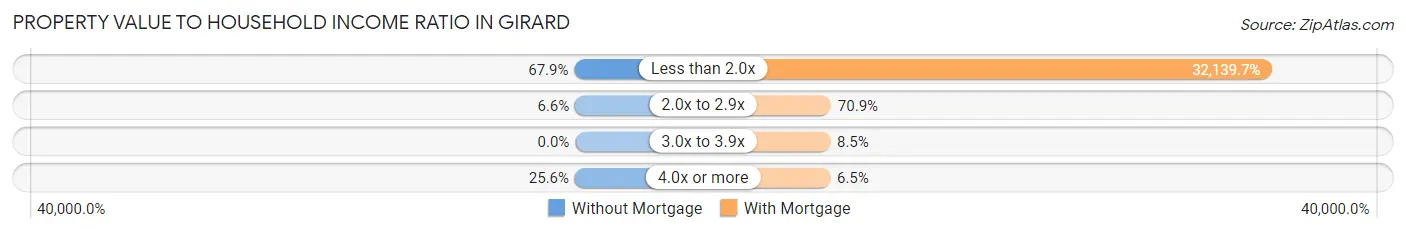
| Value-to-Income Ratio | Without Mortgage | With Mortgage |
| Less than 2.0x | 93 (67.9%) | 63,958 (32,139.7%) |
| 2.0x to 2.9x | 9 (6.6%) | 141 (70.9%) |
| 3.0x to 3.9x | 0 (0.0%) | 17 (8.5%) |
| 4.0x or more | 35 (25.6%) | 13 (6.5%) |
| Total | 137 (100.0%) | 199 (100.0%) |
Real Estate Taxes by Mortgage Status in Girard
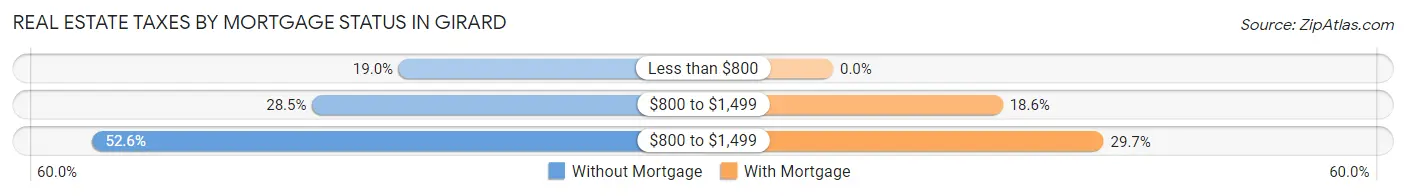
| Property Taxes | Without Mortgage | With Mortgage |
| Less than $800 | 26 (19.0%) | 0 (0.0%) |
| $800 to $1,499 | 39 (28.5%) | 37 (18.6%) |
| $800 to $1,499 | 72 (52.5%) | 59 (29.6%) |
| Total | 137 (100.0%) | 199 (100.0%) |
Health & Disability in Girard
Health Insurance Coverage by Age in Girard
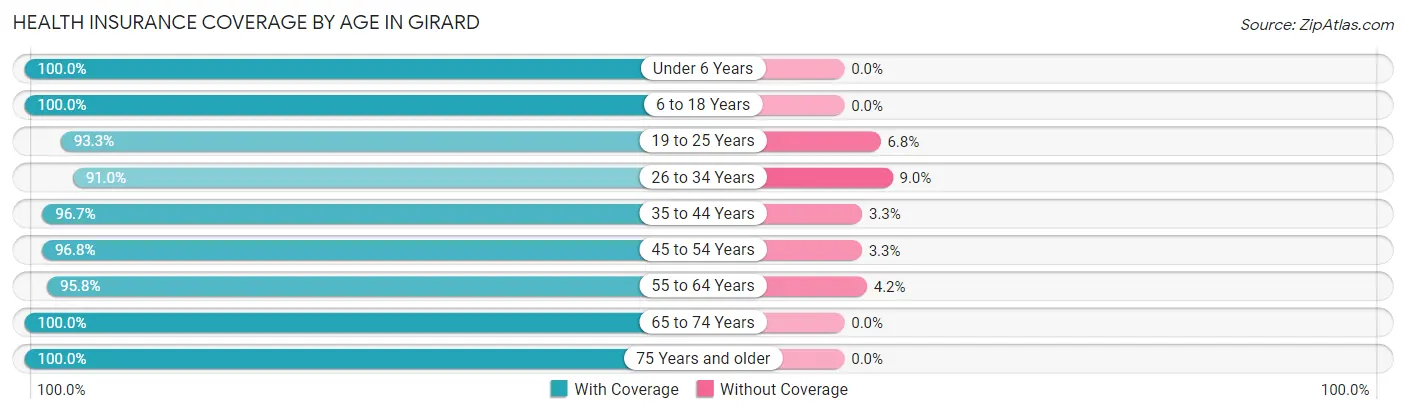
| Age Bracket | With Coverage | Without Coverage |
| Under 6 Years | 126 (100.0%) | 0 (0.0%) |
| 6 to 18 Years | 151 (100.0%) | 0 (0.0%) |
| 19 to 25 Years | 221 (93.2%) | 16 (6.8%) |
| 26 to 34 Years | 162 (91.0%) | 16 (9.0%) |
| 35 to 44 Years | 117 (96.7%) | 4 (3.3%) |
| 45 to 54 Years | 149 (96.8%) | 5 (3.3%) |
| 55 to 64 Years | 206 (95.8%) | 9 (4.2%) |
| 65 to 74 Years | 190 (100.0%) | 0 (0.0%) |
| 75 Years and older | 115 (100.0%) | 0 (0.0%) |
| Total | 1,437 (96.6%) | 50 (3.4%) |
Health Insurance Coverage by Citizenship Status in Girard
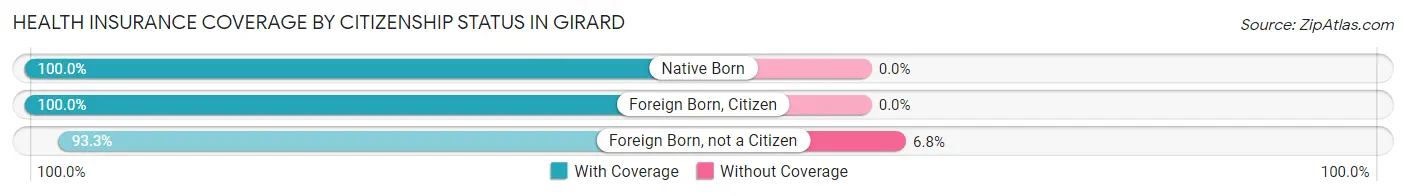
| Citizenship Status | With Coverage | Without Coverage |
| Native Born | 126 (100.0%) | 0 (0.0%) |
| Foreign Born, Citizen | 151 (100.0%) | 0 (0.0%) |
| Foreign Born, not a Citizen | 221 (93.2%) | 16 (6.8%) |
Health Insurance Coverage by Household Income in Girard
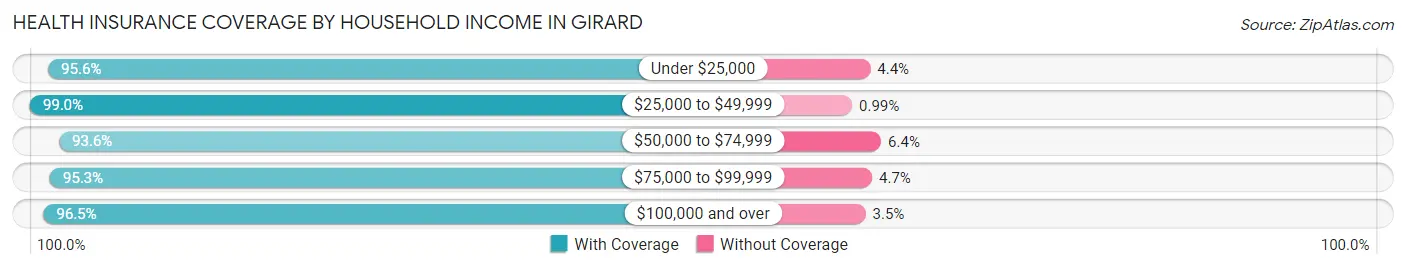
| Household Income | With Coverage | Without Coverage |
| Under $25,000 | 238 (95.6%) | 11 (4.4%) |
| $25,000 to $49,999 | 500 (99.0%) | 5 (1.0%) |
| $50,000 to $74,999 | 189 (93.6%) | 13 (6.4%) |
| $75,000 to $99,999 | 181 (95.3%) | 9 (4.7%) |
| $100,000 and over | 329 (96.5%) | 12 (3.5%) |
Public vs Private Health Insurance Coverage by Age in Girard
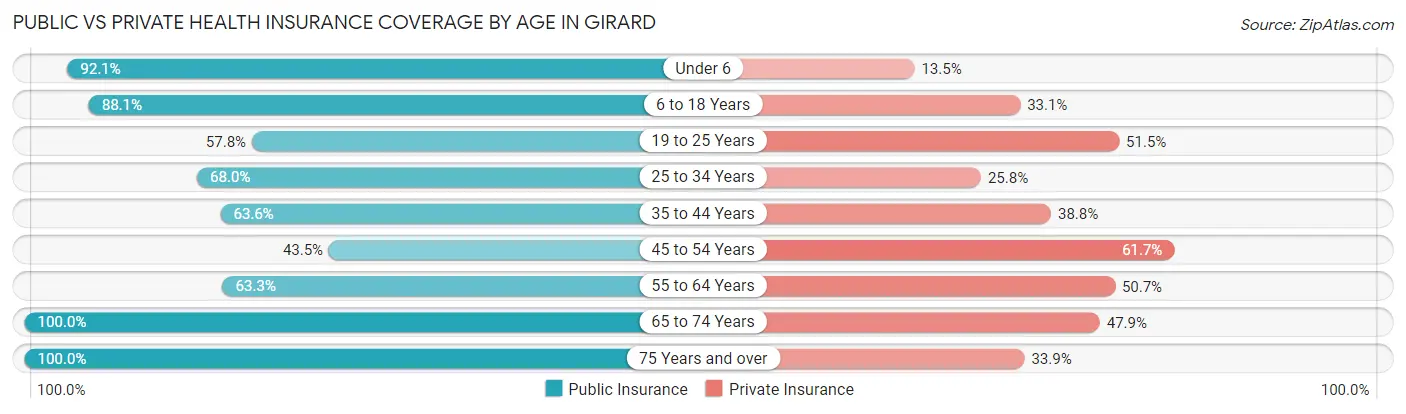
| Age Bracket | Public Insurance | Private Insurance |
| Under 6 | 116 (92.1%) | 17 (13.5%) |
| 6 to 18 Years | 133 (88.1%) | 50 (33.1%) |
| 19 to 25 Years | 137 (57.8%) | 122 (51.5%) |
| 25 to 34 Years | 121 (68.0%) | 46 (25.8%) |
| 35 to 44 Years | 77 (63.6%) | 47 (38.8%) |
| 45 to 54 Years | 67 (43.5%) | 95 (61.7%) |
| 55 to 64 Years | 136 (63.3%) | 109 (50.7%) |
| 65 to 74 Years | 190 (100.0%) | 91 (47.9%) |
| 75 Years and over | 115 (100.0%) | 39 (33.9%) |
| Total | 1,092 (73.4%) | 616 (41.4%) |
Disability Status by Sex by Age in Girard
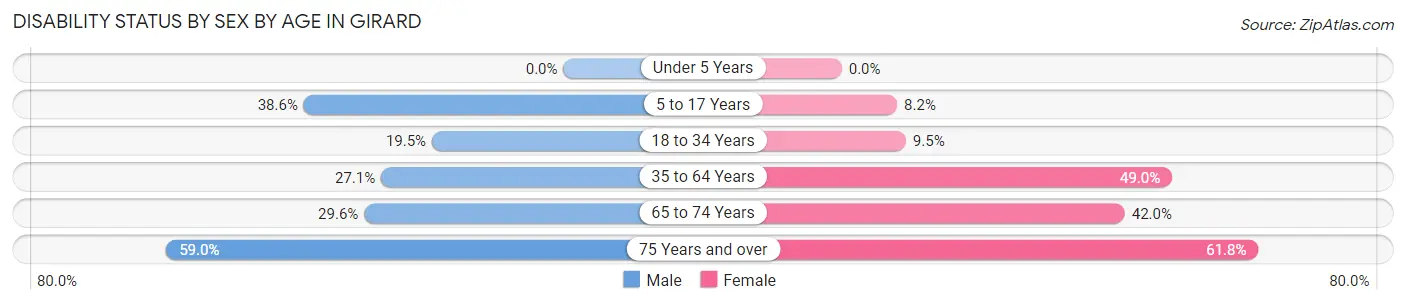
| Age Bracket | Male | Female |
| Under 5 Years | 0 (0.0%) | 0 (0.0%) |
| 5 to 17 Years | 32 (38.6%) | 6 (8.2%) |
| 18 to 34 Years | 40 (19.5%) | 20 (9.5%) |
| 35 to 64 Years | 62 (27.1%) | 128 (49.0%) |
| 65 to 74 Years | 21 (29.6%) | 50 (42.0%) |
| 75 Years and over | 23 (59.0%) | 47 (61.8%) |
Disability Class by Sex by Age in Girard
Disability Class: Hearing Difficulty
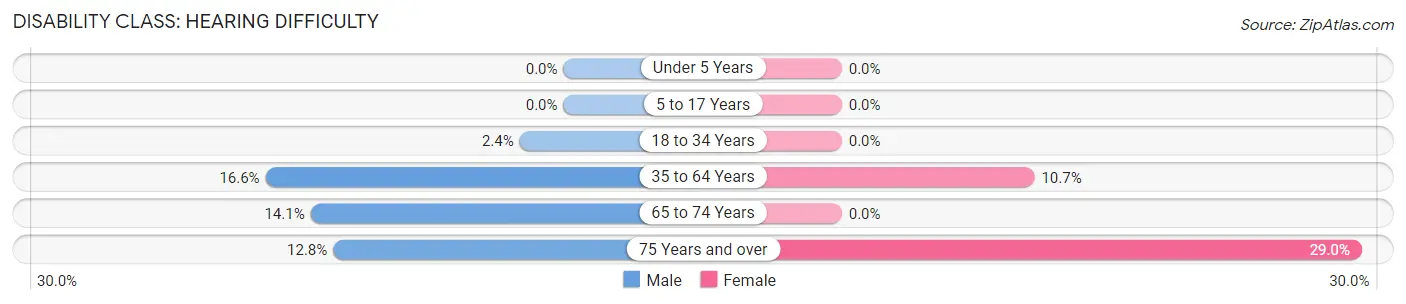
| Age Bracket | Male | Female |
| Under 5 Years | 0 (0.0%) | 0 (0.0%) |
| 5 to 17 Years | 0 (0.0%) | 0 (0.0%) |
| 18 to 34 Years | 5 (2.4%) | 0 (0.0%) |
| 35 to 64 Years | 38 (16.6%) | 28 (10.7%) |
| 65 to 74 Years | 10 (14.1%) | 0 (0.0%) |
| 75 Years and over | 5 (12.8%) | 22 (28.9%) |
Disability Class: Vision Difficulty
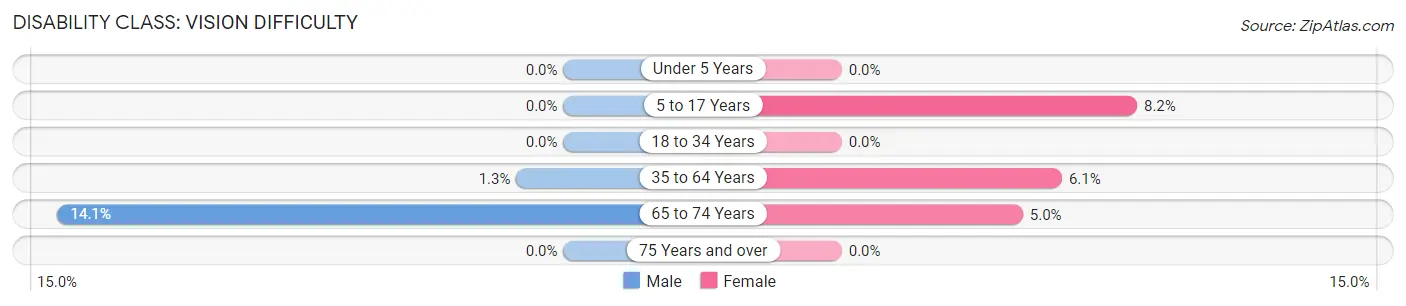
| Age Bracket | Male | Female |
| Under 5 Years | 0 (0.0%) | 0 (0.0%) |
| 5 to 17 Years | 0 (0.0%) | 6 (8.2%) |
| 18 to 34 Years | 0 (0.0%) | 0 (0.0%) |
| 35 to 64 Years | 3 (1.3%) | 16 (6.1%) |
| 65 to 74 Years | 10 (14.1%) | 6 (5.0%) |
| 75 Years and over | 0 (0.0%) | 0 (0.0%) |
Disability Class: Cognitive Difficulty
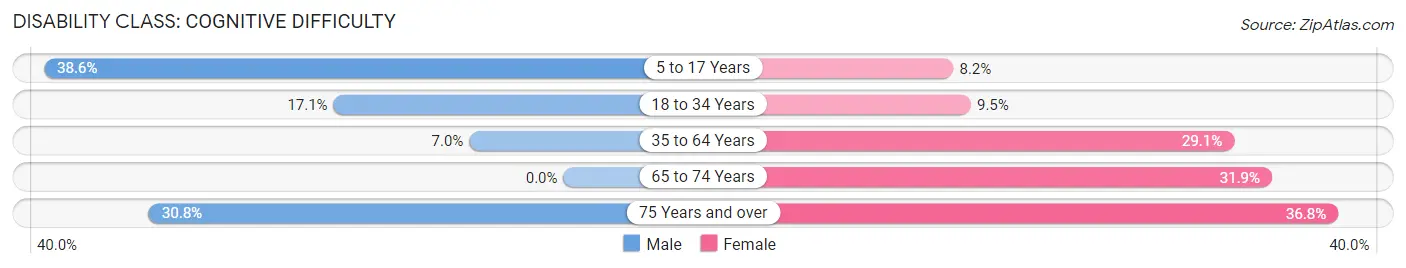
| Age Bracket | Male | Female |
| 5 to 17 Years | 32 (38.6%) | 6 (8.2%) |
| 18 to 34 Years | 35 (17.1%) | 20 (9.5%) |
| 35 to 64 Years | 16 (7.0%) | 76 (29.1%) |
| 65 to 74 Years | 0 (0.0%) | 38 (31.9%) |
| 75 Years and over | 12 (30.8%) | 28 (36.8%) |
Disability Class: Ambulatory Difficulty
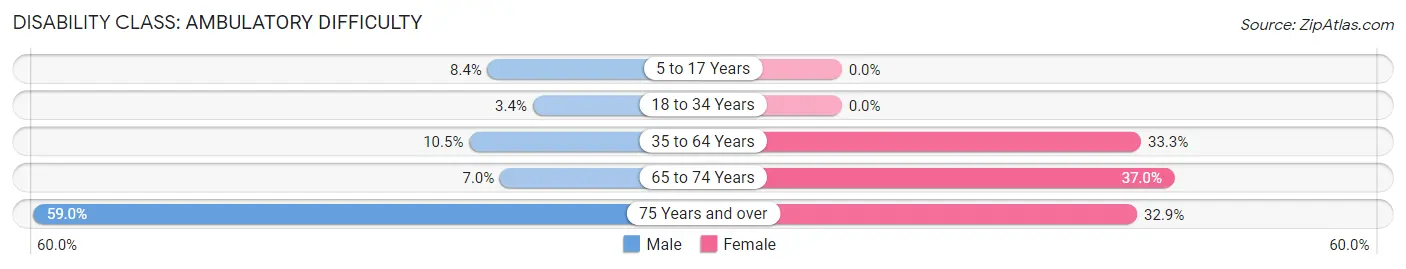
| Age Bracket | Male | Female |
| 5 to 17 Years | 7 (8.4%) | 0 (0.0%) |
| 18 to 34 Years | 7 (3.4%) | 0 (0.0%) |
| 35 to 64 Years | 24 (10.5%) | 87 (33.3%) |
| 65 to 74 Years | 5 (7.0%) | 44 (37.0%) |
| 75 Years and over | 23 (59.0%) | 25 (32.9%) |
Disability Class: Self-Care Difficulty
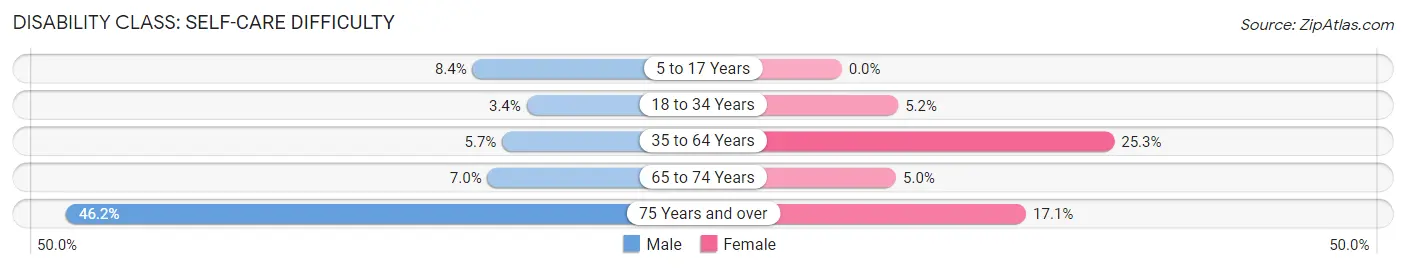
| Age Bracket | Male | Female |
| 5 to 17 Years | 7 (8.4%) | 0 (0.0%) |
| 18 to 34 Years | 7 (3.4%) | 11 (5.2%) |
| 35 to 64 Years | 13 (5.7%) | 66 (25.3%) |
| 65 to 74 Years | 5 (7.0%) | 6 (5.0%) |
| 75 Years and over | 18 (46.2%) | 13 (17.1%) |
Technology Access in Girard
Computing Device Access in Girard
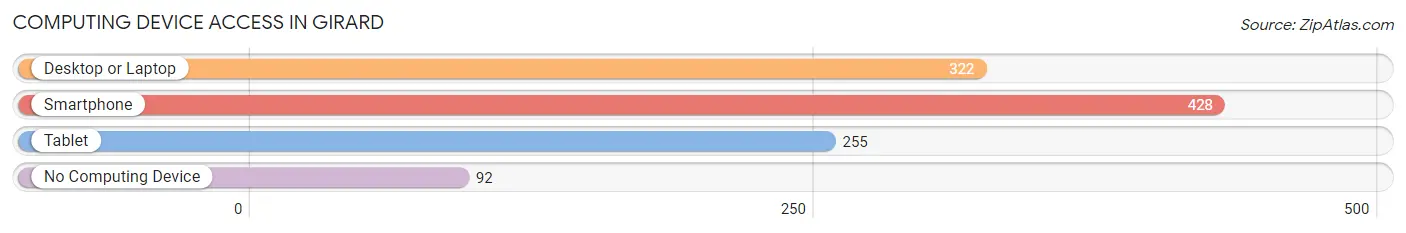
| Device Type | # Households | % Households |
| Desktop or Laptop | 322 | 57.7% |
| Smartphone | 428 | 76.7% |
| Tablet | 255 | 45.7% |
| No Computing Device | 92 | 16.5% |
| Total | 558 | 100.0% |
Internet Access in Girard
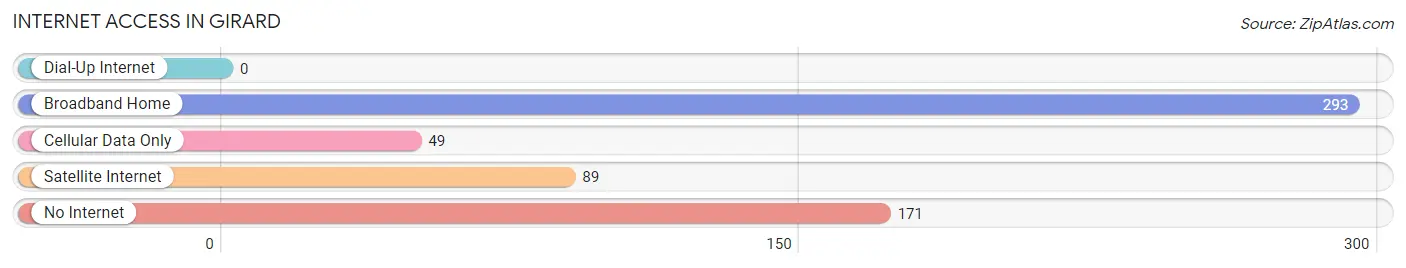
| Internet Type | # Households | % Households |
| Dial-Up Internet | 0 | 0.0% |
| Broadband Home | 293 | 52.5% |
| Cellular Data Only | 49 | 8.8% |
| Satellite Internet | 89 | 16.0% |
| No Internet | 171 | 30.6% |
| Total | 558 | 100.0% |
Girard Summary
Girard is a small city located in Macoupin County, Illinois. It is situated in the central part of the state, about 30 miles northeast of Springfield. The city has a population of approximately 2,500 people and covers an area of 1.3 square miles.
History
Girard was founded in 1854 by a group of settlers from Ohio. The city was named after Stephen Girard, a French-born philanthropist who had donated money to the city of Philadelphia. The city was incorporated in 1859 and was the first city in Macoupin County to be incorporated.
The city was an important stop on the Chicago and Alton Railroad, which ran through the city from 1854 to 1971. The railroad was a major factor in the growth of the city, as it allowed for the transportation of goods and people to and from the city.
Geography
Girard is located in the central part of Illinois, about 30 miles northeast of Springfield. The city is situated in the Macoupin County, which is part of the Central Illinois region. The city is located on the banks of the Macoupin Creek, which flows through the city.
The city has a total area of 1.3 square miles, all of which is land. The city is located in a flat, open area, with no major hills or mountains. The climate in the city is humid continental, with hot summers and cold winters.
Economy
Girard’s economy is largely based on agriculture and manufacturing. The city is home to several large agricultural businesses, including a grain elevator, a feed mill, and a dairy farm. The city also has several manufacturing businesses, including a plastics factory and a metal fabrication plant.
The city also has a small retail sector, with several small stores and restaurants. The city also has a few small businesses, such as a barber shop and a beauty salon.
Demographics
Girard has a population of approximately 2,500 people. The city has a median age of 38.7 years, with a gender ratio of 50.3% male and 49.7% female. The city has a median household income of $41,944, and a poverty rate of 16.3%.
The city is predominantly white, with a population that is 94.2% white, 2.2% African American, 1.2% Hispanic, and 2.4% other. The city also has a small Asian population, with a population that is 0.8% Asian.
The city is served by the Girard School District, which consists of two elementary schools, one middle school, and one high school. The city also has a public library, a post office, and several churches.
Common Questions
What is Per Capita Income in Girard?
Per Capita income in Girard is $22,143.
What is the Median Family Income in Girard?
Median Family Income in Girard is $45,250.
What is the Median Household income in Girard?
Median Household Income in Girard is $43,750.
What is Income or Wage Gap in Girard?
Income or Wage Gap in Girard is 29.4%.
Women in Girard earn 70.6 cents for every dollar earned by a man.
What is Inequality or Gini Index in Girard?
Inequality or Gini Index in Girard is 0.42.
What is the Total Population of Girard?
Total Population of Girard is 1,492.
What is the Total Male Population of Girard?
Total Male Population of Girard is 694.
What is the Total Female Population of Girard?
Total Female Population of Girard is 798.
What is the Ratio of Males per 100 Females in Girard?
There are 86.97 Males per 100 Females in Girard.
What is the Ratio of Females per 100 Males in Girard?
There are 114.99 Females per 100 Males in Girard.
What is the Median Population Age in Girard?
Median Population Age in Girard is 39.8 Years.
What is the Average Family Size in Girard
Average Family Size in Girard is 3.0 People.
What is the Average Household Size in Girard
Average Household Size in Girard is 2.7 People.
How Large is the Labor Force in Girard?
There are 667 People in the Labor Forcein in Girard.
What is the Percentage of People in the Labor Force in Girard?
54.0% of People are in the Labor Force in Girard.
What is the Unemployment Rate in Girard?
Unemployment Rate in Girard is 10.8%.