Forreston, IL Map & Demographics
Forreston Map
Forreston Overview
$31,949
PER CAPITA INCOME
$82,250
AVG FAMILY INCOME
$65,179
AVG HOUSEHOLD INCOME
47.6%
WAGE / INCOME GAP [ % ]
52.4¢/ $1
WAGE / INCOME GAP [ $ ]
0.33
INEQUALITY / GINI INDEX
1,140
TOTAL POPULATION
605
MALE POPULATION
535
FEMALE POPULATION
113.08
MALES / 100 FEMALES
88.43
FEMALES / 100 MALES
41.9
MEDIAN AGE
3.1
AVG FAMILY SIZE
2.2
AVG HOUSEHOLD SIZE
523
LABOR FORCE [ PEOPLE ]
58.4%
PERCENT IN LABOR FORCE
2.9%
UNEMPLOYMENT RATE
Forreston Zip Codes
Forreston Area Codes
Income in Forreston
Income Overview in Forreston
Per Capita Income in Forreston is $31,949, while median incomes of families and households are $82,250 and $65,179 respectively.
| Characteristic | Number | Measure |
| Per Capita Income | 1,140 | $31,949 |
| Median Family Income | 275 | $82,250 |
| Mean Family Income | 275 | $87,864 |
| Median Household Income | 510 | $65,179 |
| Mean Household Income | 510 | $72,625 |
| Income Deficit | 275 | $0 |
| Wage / Income Gap (%) | 1,140 | 47.65% |
| Wage / Income Gap ($) | 1,140 | 52.35¢ per $1 |
| Gini / Inequality Index | 1,140 | 0.33 |
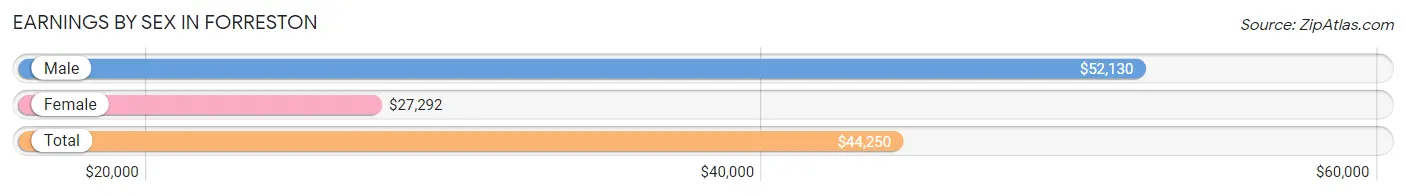
Earnings by Sex in Forreston
Average Earnings in Forreston are $44,250, $52,130 for men and $27,292 for women, a difference of 47.6%.
| Sex | Number | Average Earnings |
| Male | 320 (57.8%) | $52,130 |
| Female | 234 (42.2%) | $27,292 |
| Total | 554 (100.0%) | $44,250 |
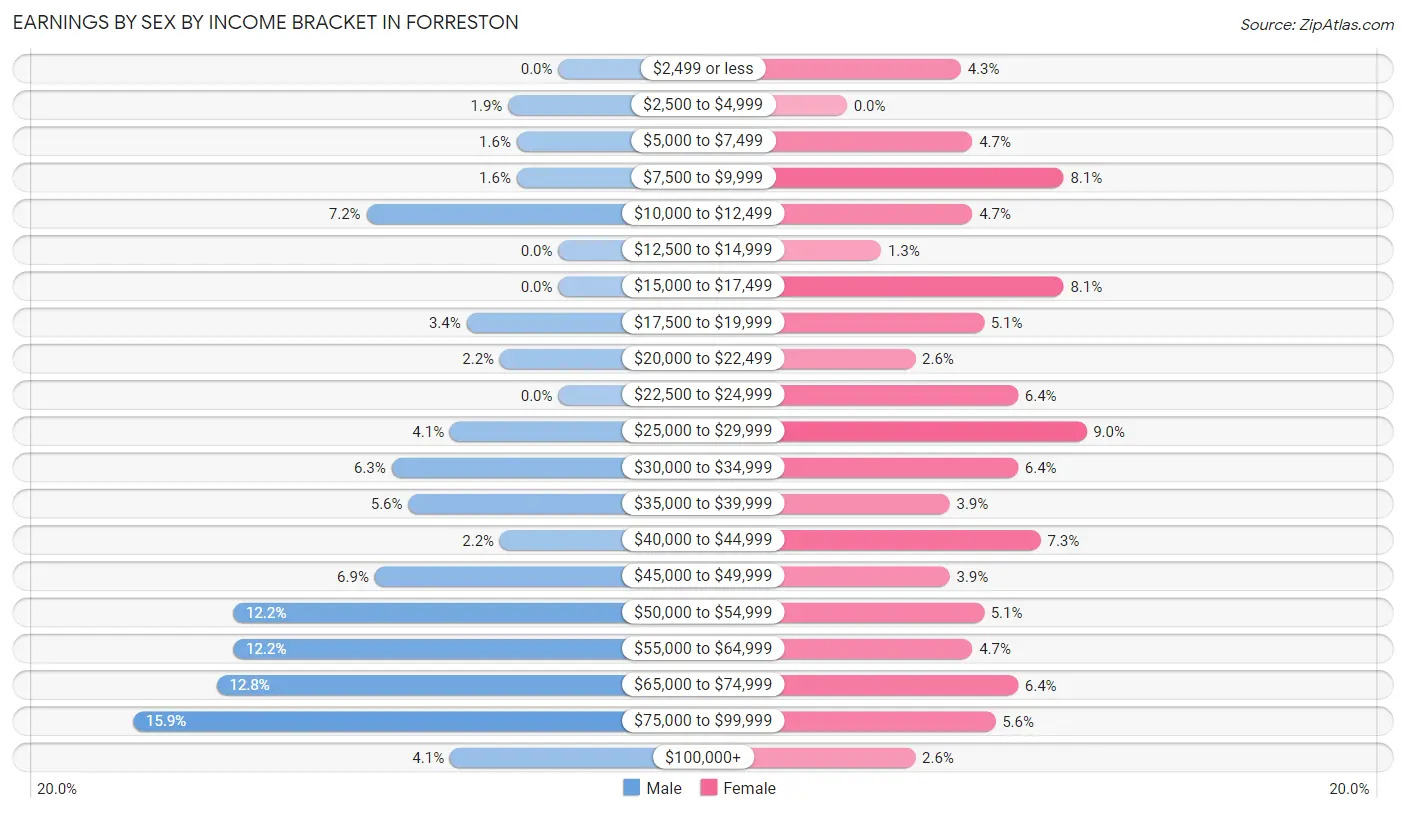
Earnings by Sex by Income Bracket in Forreston
The most common earnings brackets in Forreston are $75,000 to $99,999 for men (51 | 15.9%) and $25,000 to $29,999 for women (21 | 9.0%).
| Income | Male | Female |
| $2,499 or less | 0 (0.0%) | 10 (4.3%) |
| $2,500 to $4,999 | 6 (1.9%) | 0 (0.0%) |
| $5,000 to $7,499 | 5 (1.6%) | 11 (4.7%) |
| $7,500 to $9,999 | 5 (1.6%) | 19 (8.1%) |
| $10,000 to $12,499 | 23 (7.2%) | 11 (4.7%) |
| $12,500 to $14,999 | 0 (0.0%) | 3 (1.3%) |
| $15,000 to $17,499 | 0 (0.0%) | 19 (8.1%) |
| $17,500 to $19,999 | 11 (3.4%) | 12 (5.1%) |
| $20,000 to $22,499 | 7 (2.2%) | 6 (2.6%) |
| $22,500 to $24,999 | 0 (0.0%) | 15 (6.4%) |
| $25,000 to $29,999 | 13 (4.1%) | 21 (9.0%) |
| $30,000 to $34,999 | 20 (6.2%) | 15 (6.4%) |
| $35,000 to $39,999 | 18 (5.6%) | 9 (3.8%) |
| $40,000 to $44,999 | 7 (2.2%) | 17 (7.3%) |
| $45,000 to $49,999 | 22 (6.9%) | 9 (3.8%) |
| $50,000 to $54,999 | 39 (12.2%) | 12 (5.1%) |
| $55,000 to $64,999 | 39 (12.2%) | 11 (4.7%) |
| $65,000 to $74,999 | 41 (12.8%) | 15 (6.4%) |
| $75,000 to $99,999 | 51 (15.9%) | 13 (5.6%) |
| $100,000+ | 13 (4.1%) | 6 (2.6%) |
| Total | 320 (100.0%) | 234 (100.0%) |
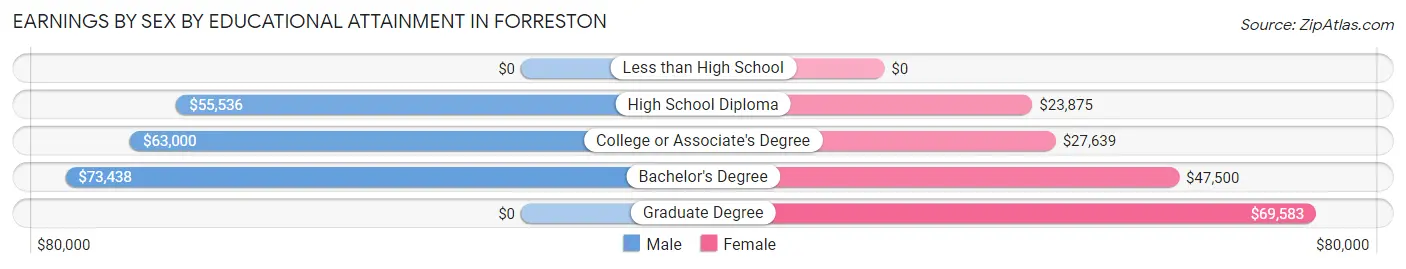
Earnings by Sex by Educational Attainment in Forreston
Average earnings in Forreston are $55,962 for men and $30,278 for women, a difference of 45.9%. Men with an educational attainment of bachelor's degree enjoy the highest average annual earnings of $73,438, while those with high school diploma education earn the least with $55,536. Women with an educational attainment of graduate degree earn the most with the average annual earnings of $69,583, while those with high school diploma education have the smallest earnings of $23,875.
| Educational Attainment | Male Income | Female Income |
| Less than High School | - | - |
| High School Diploma | $55,536 | $23,875 |
| College or Associate's Degree | $63,000 | $27,639 |
| Bachelor's Degree | $73,438 | $47,500 |
| Graduate Degree | - | - |
| Total | $55,962 | $30,278 |
Family Income in Forreston
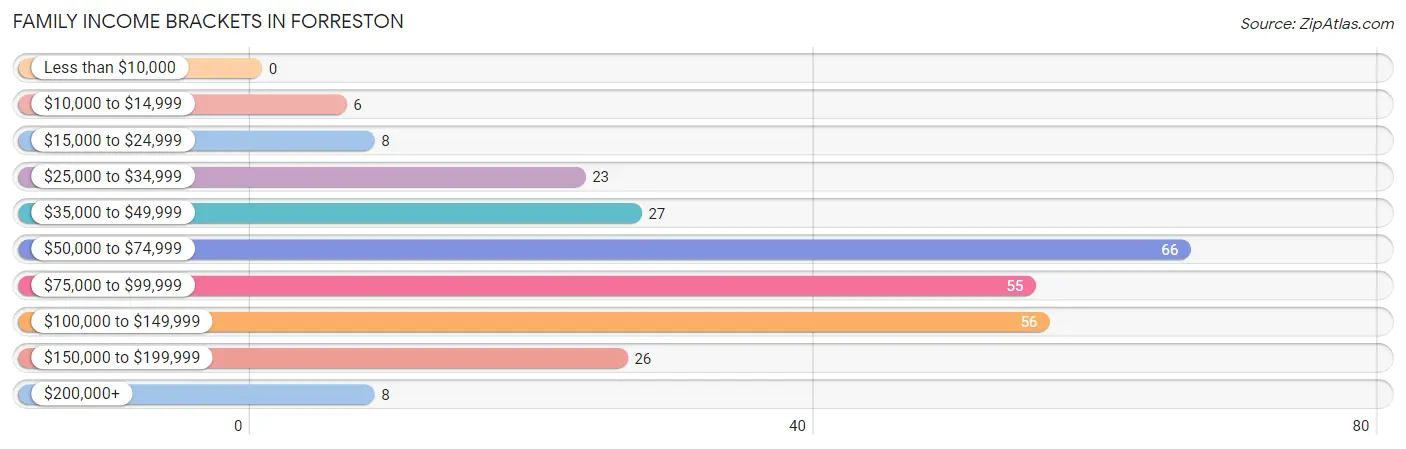
Family Income Brackets in Forreston
According to the Forreston family income data, there are 66 families falling into the $50,000 to $74,999 income range, which is the most common income bracket and makes up 24.0% of all families.
| Income Bracket | # Families | % Families |
| Less than $10,000 | 0 | 0.0% |
| $10,000 to $14,999 | 6 | 2.2% |
| $15,000 to $24,999 | 8 | 2.9% |
| $25,000 to $34,999 | 23 | 8.4% |
| $35,000 to $49,999 | 27 | 9.8% |
| $50,000 to $74,999 | 66 | 24.0% |
| $75,000 to $99,999 | 55 | 20.0% |
| $100,000 to $149,999 | 56 | 20.4% |
| $150,000 to $199,999 | 26 | 9.5% |
| $200,000+ | 8 | 2.9% |
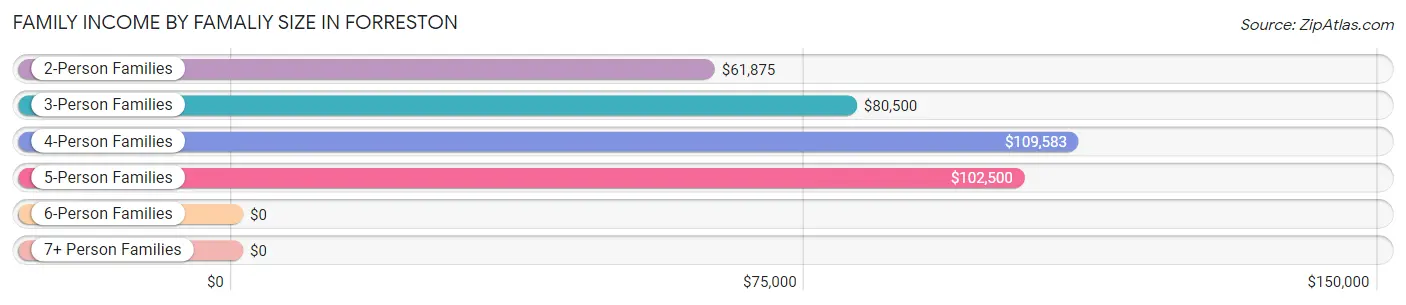
Family Income by Famaliy Size in Forreston
4-person families (33 | 12.0%) account for the highest median family income in Forreston with $109,583 per family, while 2-person families (151 | 54.9%) have the highest median income of $30,938 per family member.
| Income Bracket | # Families | Median Income |
| 2-Person Families | 151 (54.9%) | $61,875 |
| 3-Person Families | 60 (21.8%) | $80,500 |
| 4-Person Families | 33 (12.0%) | $109,583 |
| 5-Person Families | 14 (5.1%) | $102,500 |
| 6-Person Families | 9 (3.3%) | $0 |
| 7+ Person Families | 8 (2.9%) | $0 |
| Total | 275 (100.0%) | $82,250 |
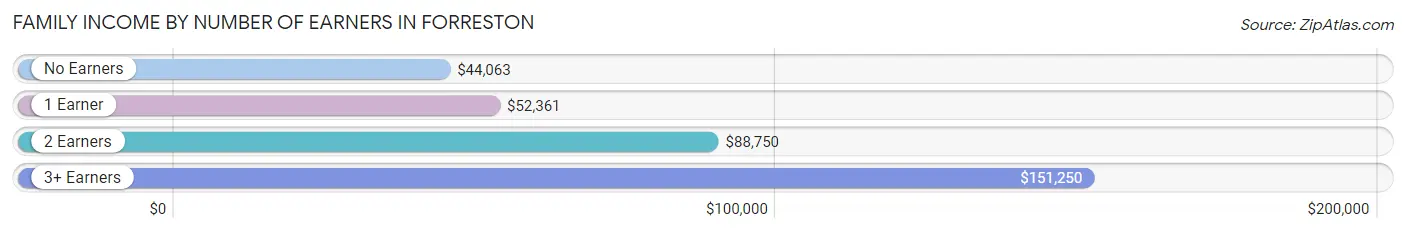
Family Income by Number of Earners in Forreston
The median family income in Forreston is $82,250, with families comprising 3+ earners (22) having the highest median family income of $151,250, while families with no earners (60) have the lowest median family income of $44,063, accounting for 8.0% and 21.8% of families, respectively.
| Number of Earners | # Families | Median Income |
| No Earners | 60 (21.8%) | $44,063 |
| 1 Earner | 75 (27.3%) | $52,361 |
| 2 Earners | 118 (42.9%) | $88,750 |
| 3+ Earners | 22 (8.0%) | $151,250 |
| Total | 275 (100.0%) | $82,250 |
Household Income in Forreston
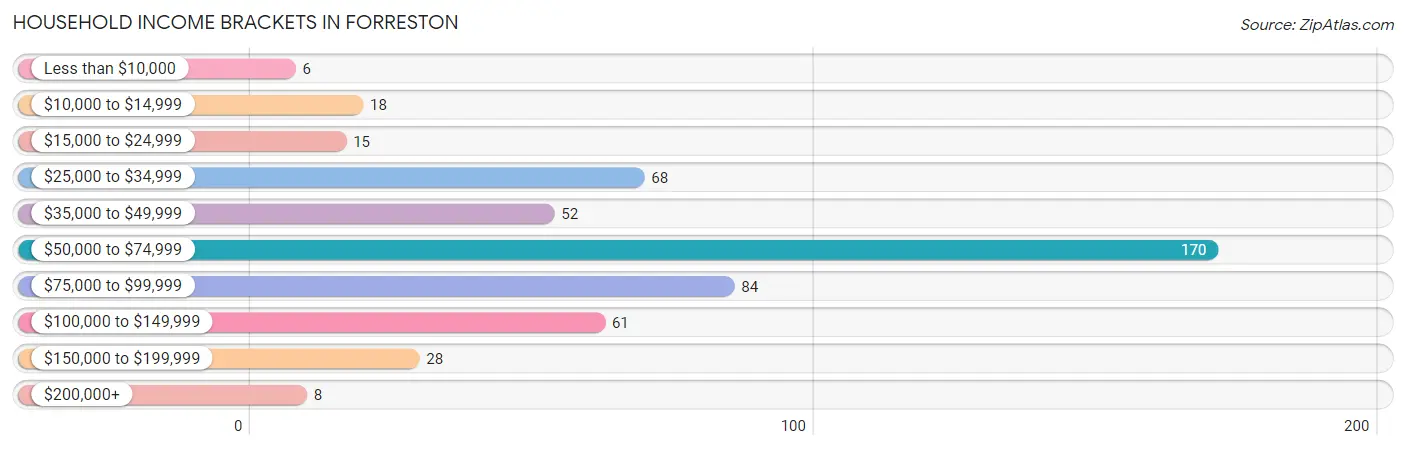
Household Income Brackets in Forreston
With 170 households falling in the category, the $50,000 to $74,999 income range is the most frequent in Forreston, accounting for 33.3% of all households. In contrast, only 6 households (1.2%) fall into the less than $10,000 income bracket, making it the least populous group.
| Income Bracket | # Households | % Households |
| Less than $10,000 | 6 | 1.2% |
| $10,000 to $14,999 | 18 | 3.5% |
| $15,000 to $24,999 | 15 | 2.9% |
| $25,000 to $34,999 | 68 | 13.3% |
| $35,000 to $49,999 | 52 | 10.2% |
| $50,000 to $74,999 | 170 | 33.3% |
| $75,000 to $99,999 | 84 | 16.5% |
| $100,000 to $149,999 | 61 | 12.0% |
| $150,000 to $199,999 | 28 | 5.5% |
| $200,000+ | 8 | 1.6% |
Household Income by Householder Age in Forreston
The median household income in Forreston is $65,179, with the highest median household income of $73,456 found in the 45 to 64 years age bracket for the primary householder. A total of 197 households (38.6%) fall into this category. Meanwhile, the 15 to 24 years age bracket for the primary householder has the lowest median household income of $0, with 12 households (2.4%) in this group.
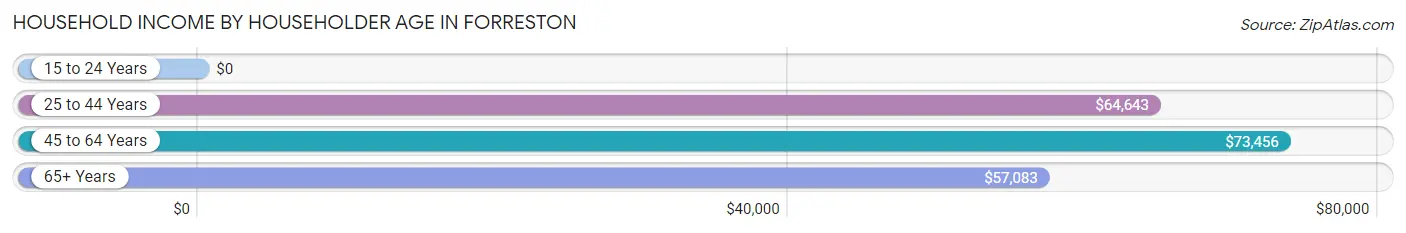
| Income Bracket | # Households | Median Income |
| 15 to 24 Years | 12 (2.4%) | $0 |
| 25 to 44 Years | 152 (29.8%) | $64,643 |
| 45 to 64 Years | 197 (38.6%) | $73,456 |
| 65+ Years | 149 (29.2%) | $57,083 |
| Total | 510 (100.0%) | $65,179 |
Poverty in Forreston
Income Below Poverty by Sex and Age in Forreston
With 5.2% poverty level for males and 5.8% for females among the residents of Forreston, 5 year old males and 75 year old and over females are the most vulnerable to poverty, with 3 males (23.1%) and 13 females (22.8%) in their respective age groups living below the poverty level.
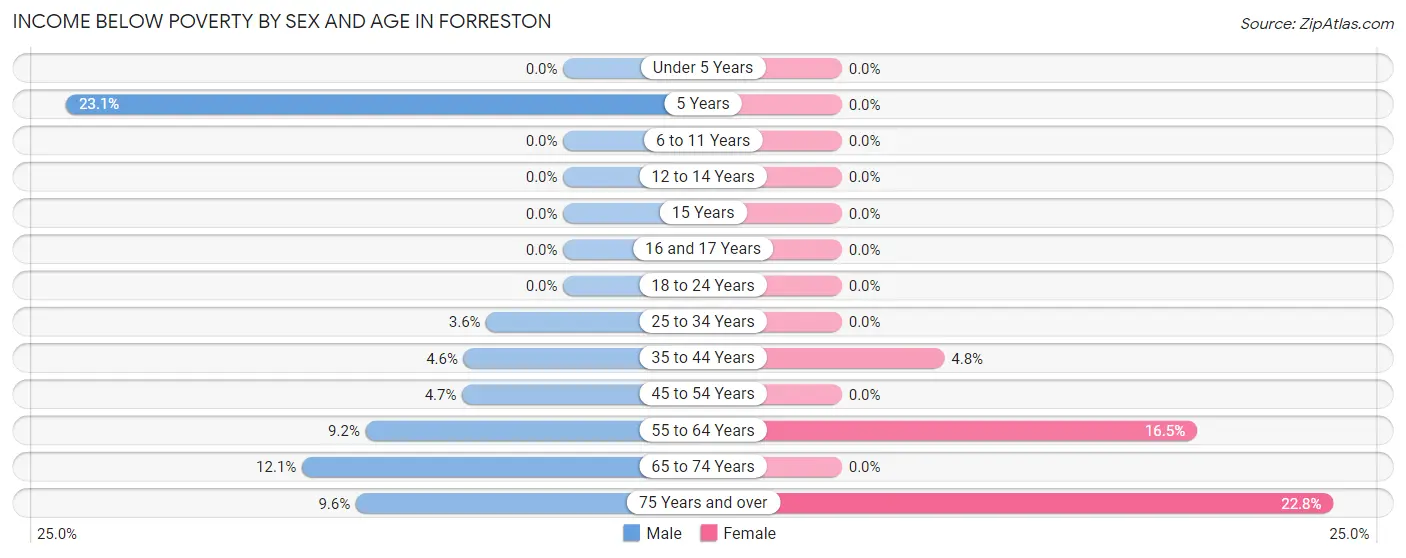
| Age Bracket | Male | Female |
| Under 5 Years | 0 (0.0%) | 0 (0.0%) |
| 5 Years | 3 (23.1%) | 0 (0.0%) |
| 6 to 11 Years | 0 (0.0%) | 0 (0.0%) |
| 12 to 14 Years | 0 (0.0%) | 0 (0.0%) |
| 15 Years | 0 (0.0%) | 0 (0.0%) |
| 16 and 17 Years | 0 (0.0%) | 0 (0.0%) |
| 18 to 24 Years | 0 (0.0%) | 0 (0.0%) |
| 25 to 34 Years | 3 (3.6%) | 0 (0.0%) |
| 35 to 44 Years | 3 (4.6%) | 3 (4.8%) |
| 45 to 54 Years | 3 (4.7%) | 0 (0.0%) |
| 55 to 64 Years | 10 (9.2%) | 15 (16.5%) |
| 65 to 74 Years | 4 (12.1%) | 0 (0.0%) |
| 75 Years and over | 5 (9.6%) | 13 (22.8%) |
| Total | 31 (5.2%) | 31 (5.8%) |
Income Above Poverty by Sex and Age in Forreston
According to the poverty statistics in Forreston, males aged under 5 years and females aged under 5 years are the age groups that are most secure financially, with 100.0% of males and 100.0% of females in these age groups living above the poverty line.
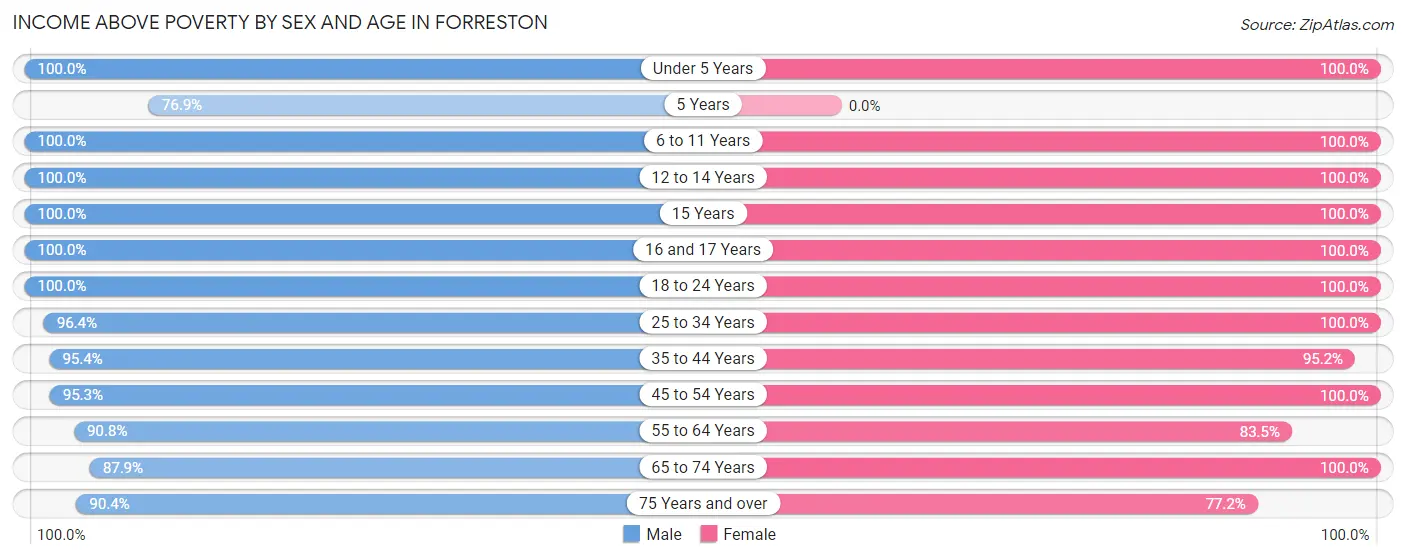
| Age Bracket | Male | Female |
| Under 5 Years | 15 (100.0%) | 12 (100.0%) |
| 5 Years | 10 (76.9%) | 0 (0.0%) |
| 6 to 11 Years | 63 (100.0%) | 56 (100.0%) |
| 12 to 14 Years | 39 (100.0%) | 13 (100.0%) |
| 15 Years | 14 (100.0%) | 15 (100.0%) |
| 16 and 17 Years | 21 (100.0%) | 25 (100.0%) |
| 18 to 24 Years | 29 (100.0%) | 15 (100.0%) |
| 25 to 34 Years | 81 (96.4%) | 55 (100.0%) |
| 35 to 44 Years | 62 (95.4%) | 60 (95.2%) |
| 45 to 54 Years | 61 (95.3%) | 43 (100.0%) |
| 55 to 64 Years | 99 (90.8%) | 76 (83.5%) |
| 65 to 74 Years | 29 (87.9%) | 90 (100.0%) |
| 75 Years and over | 47 (90.4%) | 44 (77.2%) |
| Total | 570 (94.8%) | 504 (94.2%) |
Income Below Poverty Among Married-Couple Families in Forreston
The poverty statistics for married-couple families in Forreston show that 3.5% or 8 of the total 230 families live below the poverty line. Families with no children have the highest poverty rate of 5.3%, comprising of 8 families. On the other hand, families with 1 or 2 children have the lowest poverty rate of 0.0%, which includes 0 families.
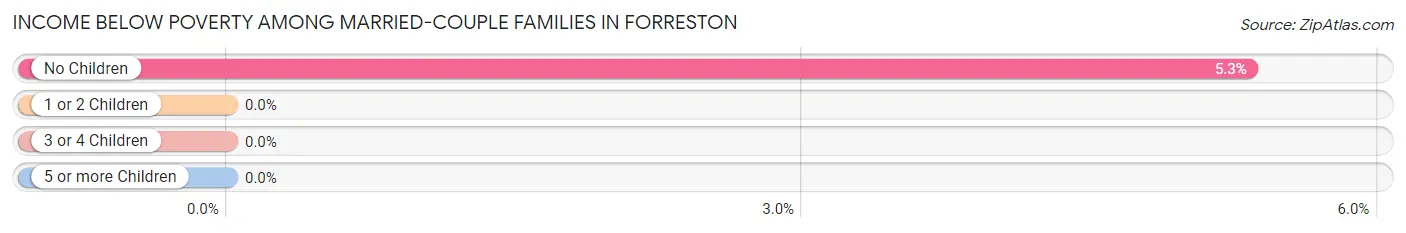
| Children | Above Poverty | Below Poverty |
| No Children | 142 (94.7%) | 8 (5.3%) |
| 1 or 2 Children | 52 (100.0%) | 0 (0.0%) |
| 3 or 4 Children | 20 (100.0%) | 0 (0.0%) |
| 5 or more Children | 8 (100.0%) | 0 (0.0%) |
| Total | 222 (96.5%) | 8 (3.5%) |
Income Below Poverty Among Single-Parent Households in Forreston
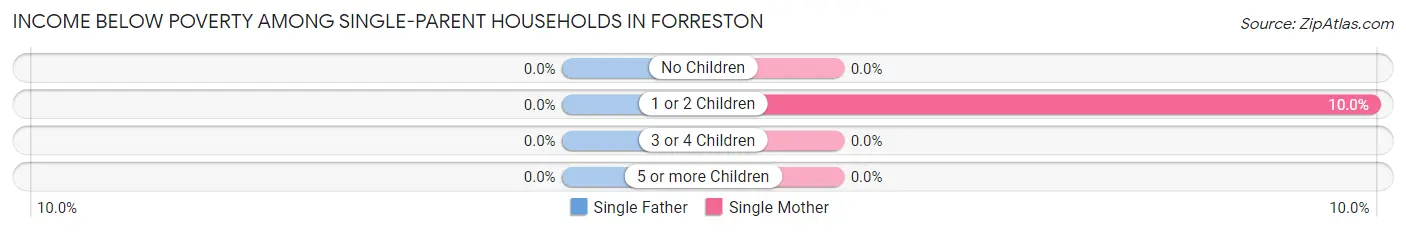
| Children | Single Father | Single Mother |
| No Children | 0 (0.0%) | 0 (0.0%) |
| 1 or 2 Children | 0 (0.0%) | 3 (10.0%) |
| 3 or 4 Children | 0 (0.0%) | 0 (0.0%) |
| 5 or more Children | 0 (0.0%) | 0 (0.0%) |
| Total | 0 (0.0%) | 3 (8.6%) |
Income Below Poverty Among Married-Couple vs Single-Parent Households in Forreston
The poverty data for Forreston shows that 8 of the married-couple family households (3.5%) and 3 of the single-parent households (6.7%) are living below the poverty level. Within the married-couple family households, those with no children have the highest poverty rate, with 8 households (5.3%) falling below the poverty line. Among the single-parent households, those with 1 or 2 children have the highest poverty rate, with 3 household (7.9%) living below poverty.
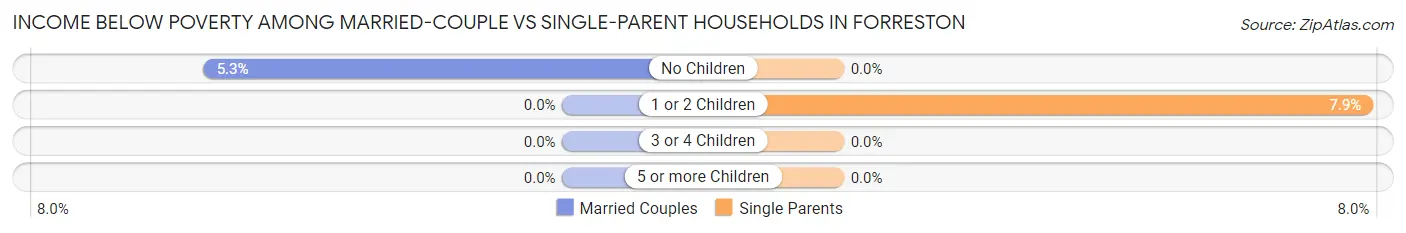
| Children | Married-Couple Families | Single-Parent Households |
| No Children | 8 (5.3%) | 0 (0.0%) |
| 1 or 2 Children | 0 (0.0%) | 3 (7.9%) |
| 3 or 4 Children | 0 (0.0%) | 0 (0.0%) |
| 5 or more Children | 0 (0.0%) | 0 (0.0%) |
| Total | 8 (3.5%) | 3 (6.7%) |
Race in Forreston
The most populous races in Forreston are White / Caucasian (1,039 | 91.1%), Hispanic or Latino (54 | 4.7%), and Two or more Races (43 | 3.8%).
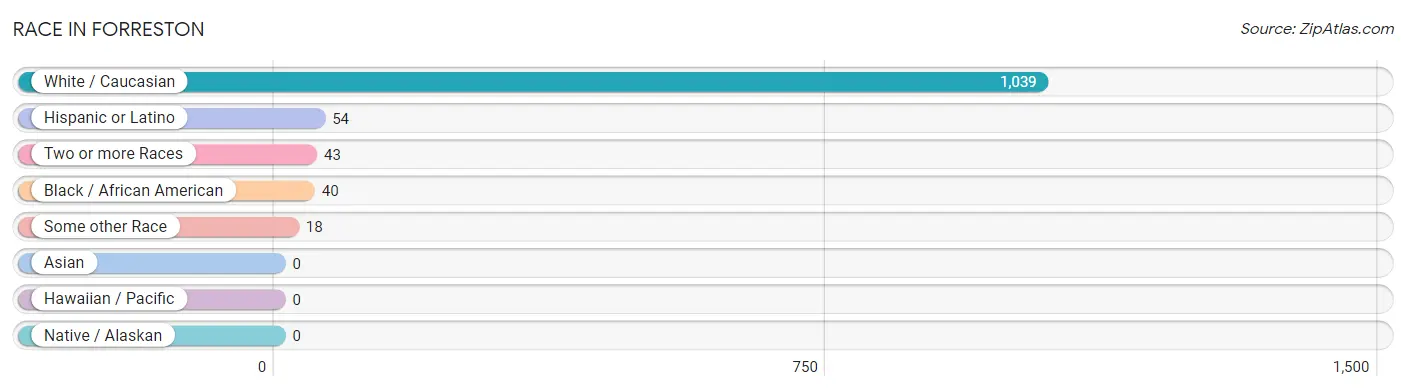
| Race | # Population | % Population |
| Asian | 0 | 0.0% |
| Black / African American | 40 | 3.5% |
| Hawaiian / Pacific | 0 | 0.0% |
| Hispanic or Latino | 54 | 4.7% |
| Native / Alaskan | 0 | 0.0% |
| White / Caucasian | 1,039 | 91.1% |
| Two or more Races | 43 | 3.8% |
| Some other Race | 18 | 1.6% |
| Total | 1,140 | 100.0% |
Ancestry in Forreston
The most populous ancestries reported in Forreston are German (510 | 44.7%), Irish (132 | 11.6%), English (73 | 6.4%), Dutch (59 | 5.2%), and European (54 | 4.7%), together accounting for 72.6% of all Forreston residents.
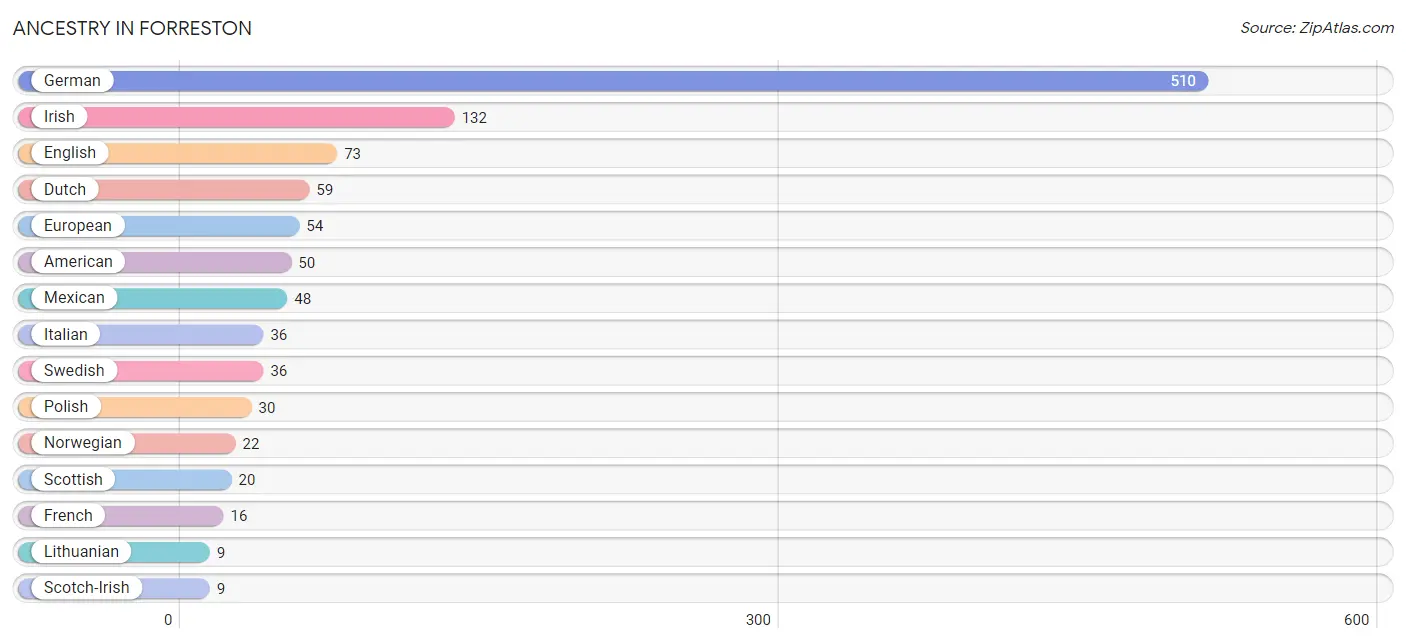
| Ancestry | # Population | % Population |
| American | 50 | 4.4% |
| Belgian | 3 | 0.3% |
| British | 3 | 0.3% |
| Burmese | 3 | 0.3% |
| Canadian | 2 | 0.2% |
| Cherokee | 7 | 0.6% |
| Croatian | 2 | 0.2% |
| Danish | 4 | 0.4% |
| Dutch | 59 | 5.2% |
| English | 73 | 6.4% |
| European | 54 | 4.7% |
| French | 16 | 1.4% |
| German | 510 | 44.7% |
| Irish | 132 | 11.6% |
| Italian | 36 | 3.2% |
| Lithuanian | 9 | 0.8% |
| Mexican | 48 | 4.2% |
| Northern European | 3 | 0.3% |
| Norwegian | 22 | 1.9% |
| Peruvian | 6 | 0.5% |
| Polish | 30 | 2.6% |
| Scotch-Irish | 9 | 0.8% |
| Scottish | 20 | 1.8% |
| Sioux | 1 | 0.1% |
| South American | 6 | 0.5% |
| Swedish | 36 | 3.2% |
| Welsh | 3 | 0.3% | View All 27 Rows |
Immigrants in Forreston
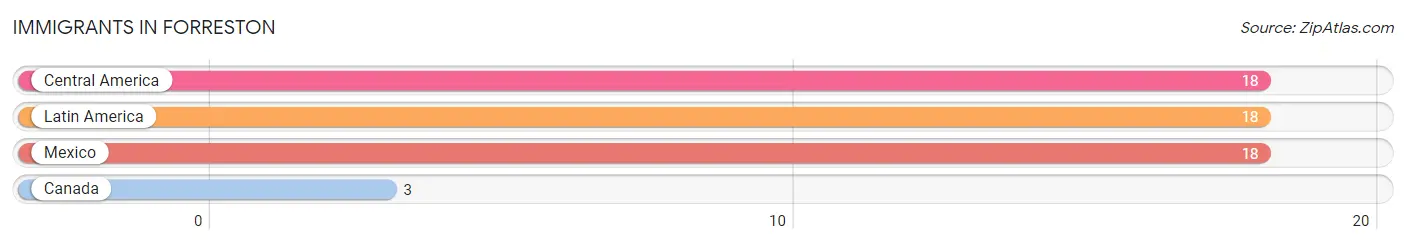
The most numerous immigrant groups reported in Forreston came from Central America (18 | 1.6%), Latin America (18 | 1.6%), Mexico (18 | 1.6%), and Canada (3 | 0.3%), together accounting for 5.0% of all Forreston residents.
| Immigration Origin | # Population | % Population |
| Canada | 3 | 0.3% |
| Central America | 18 | 1.6% |
| Latin America | 18 | 1.6% |
| Mexico | 18 | 1.6% | View All 4 Rows |
Sex and Age in Forreston
Sex and Age in Forreston
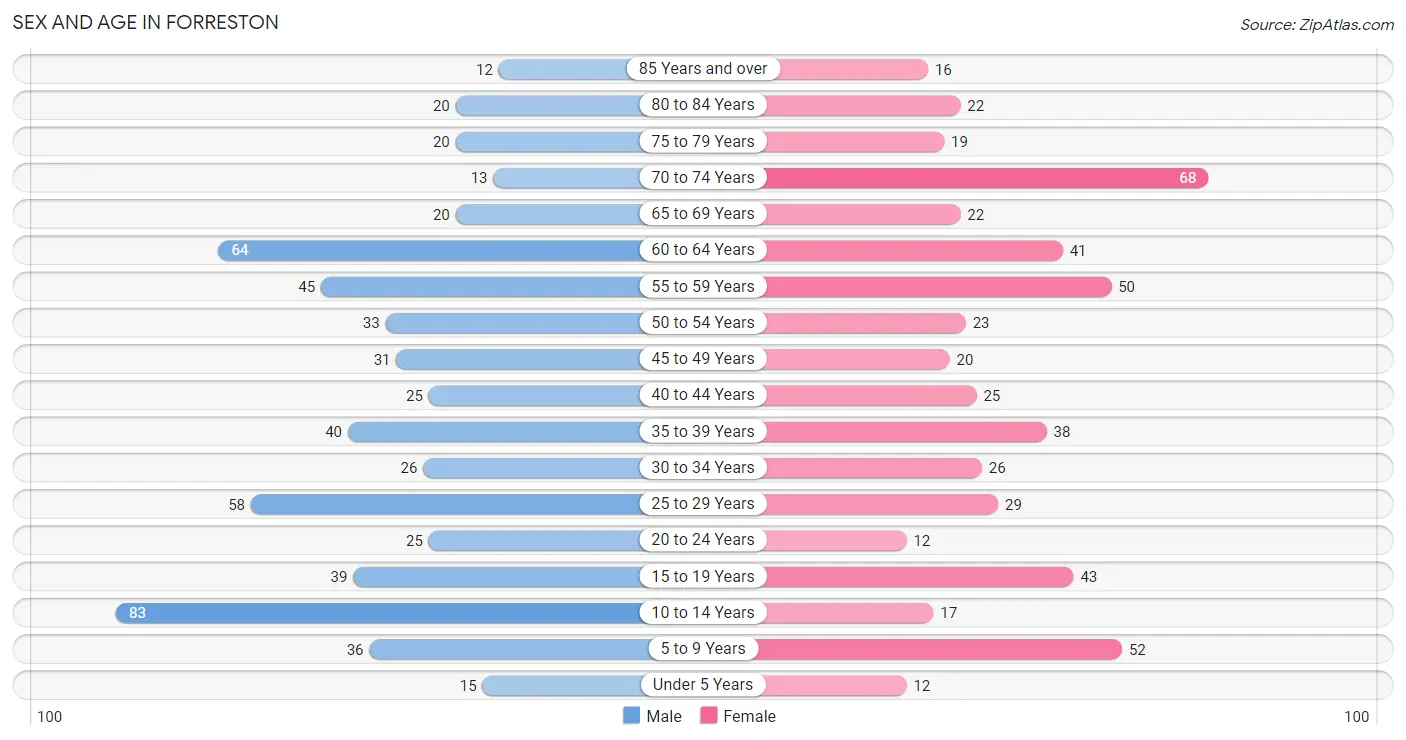
The most populous age groups in Forreston are 10 to 14 Years (83 | 13.7%) for men and 70 to 74 Years (68 | 12.7%) for women.
| Age Bracket | Male | Female |
| Under 5 Years | 15 (2.5%) | 12 (2.2%) |
| 5 to 9 Years | 36 (5.9%) | 52 (9.7%) |
| 10 to 14 Years | 83 (13.7%) | 17 (3.2%) |
| 15 to 19 Years | 39 (6.5%) | 43 (8.0%) |
| 20 to 24 Years | 25 (4.1%) | 12 (2.2%) |
| 25 to 29 Years | 58 (9.6%) | 29 (5.4%) |
| 30 to 34 Years | 26 (4.3%) | 26 (4.9%) |
| 35 to 39 Years | 40 (6.6%) | 38 (7.1%) |
| 40 to 44 Years | 25 (4.1%) | 25 (4.7%) |
| 45 to 49 Years | 31 (5.1%) | 20 (3.7%) |
| 50 to 54 Years | 33 (5.4%) | 23 (4.3%) |
| 55 to 59 Years | 45 (7.4%) | 50 (9.3%) |
| 60 to 64 Years | 64 (10.6%) | 41 (7.7%) |
| 65 to 69 Years | 20 (3.3%) | 22 (4.1%) |
| 70 to 74 Years | 13 (2.1%) | 68 (12.7%) |
| 75 to 79 Years | 20 (3.3%) | 19 (3.5%) |
| 80 to 84 Years | 20 (3.3%) | 22 (4.1%) |
| 85 Years and over | 12 (2.0%) | 16 (3.0%) |
| Total | 605 (100.0%) | 535 (100.0%) |
Families and Households in Forreston
Median Family Size in Forreston
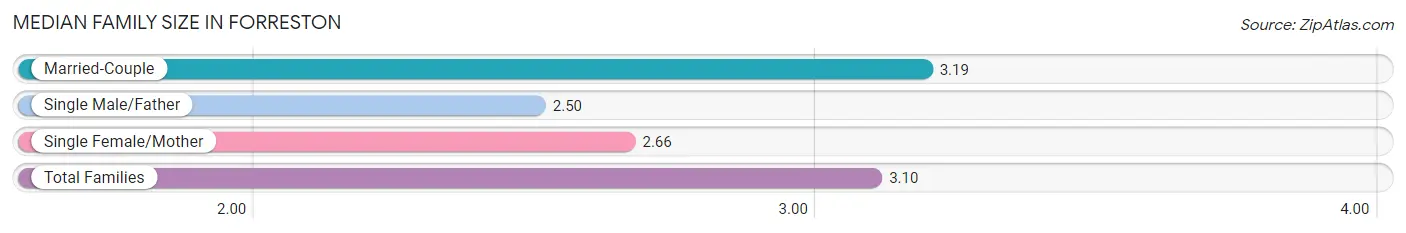
The median family size in Forreston is 3.10 persons per family, with married-couple families (230 | 83.6%) accounting for the largest median family size of 3.19 persons per family. On the other hand, single male/father families (10 | 3.6%) represent the smallest median family size with 2.50 persons per family.
| Family Type | # Families | Family Size |
| Married-Couple | 230 (83.6%) | 3.19 |
| Single Male/Father | 10 (3.6%) | 2.50 |
| Single Female/Mother | 35 (12.7%) | 2.66 |
| Total Families | 275 (100.0%) | 3.10 |
Median Household Size in Forreston
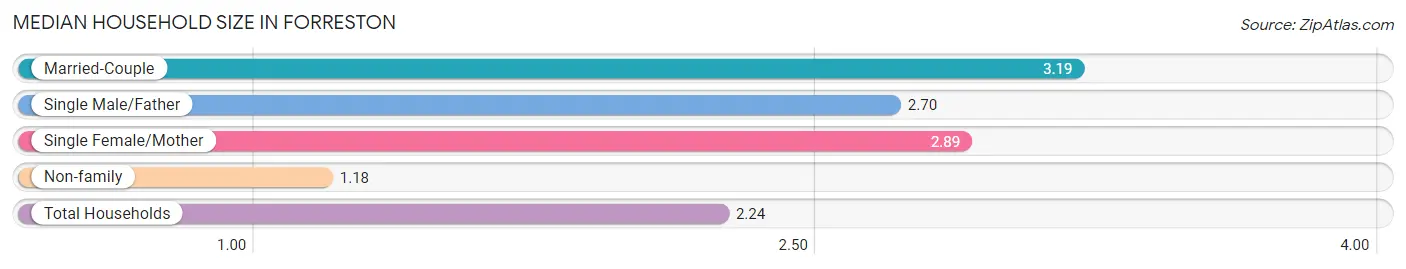
The median household size in Forreston is 2.24 persons per household, with married-couple households (230 | 45.1%) accounting for the largest median household size of 3.19 persons per household. non-family households (235 | 46.1%) represent the smallest median household size with 1.18 persons per household.
| Household Type | # Households | Household Size |
| Married-Couple | 230 (45.1%) | 3.19 |
| Single Male/Father | 10 (2.0%) | 2.70 |
| Single Female/Mother | 35 (6.9%) | 2.89 |
| Non-family | 235 (46.1%) | 1.18 |
| Total Households | 510 (100.0%) | 2.24 |
Household Size by Marriage Status in Forreston
Out of a total of 510 households in Forreston, 275 (53.9%) are family households, while 235 (46.1%) are nonfamily households. The most numerous type of family households are 2-person households, comprising 141, and the most common type of nonfamily households are 1-person households, comprising 192.
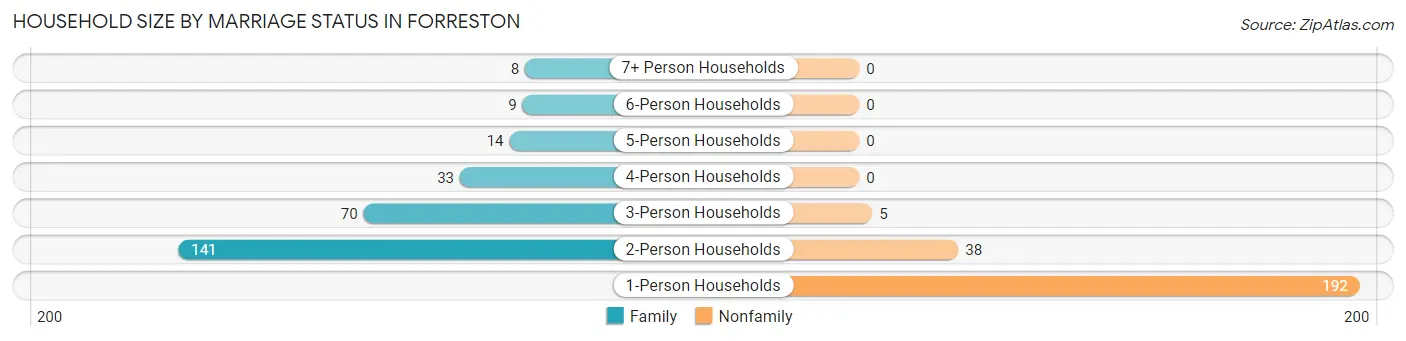
| Household Size | Family Households | Nonfamily Households |
| 1-Person Households | - | 192 (37.7%) |
| 2-Person Households | 141 (27.7%) | 38 (7.4%) |
| 3-Person Households | 70 (13.7%) | 5 (1.0%) |
| 4-Person Households | 33 (6.5%) | 0 (0.0%) |
| 5-Person Households | 14 (2.8%) | 0 (0.0%) |
| 6-Person Households | 9 (1.8%) | 0 (0.0%) |
| 7+ Person Households | 8 (1.6%) | 0 (0.0%) |
| Total | 275 (53.9%) | 235 (46.1%) |
Female Fertility in Forreston
Fertility by Age in Forreston
Average fertility rate in Forreston is 30.0 births per 1,000 women. Women in the age bracket of 20 to 34 years have the highest fertility rate with 90.0 births per 1,000 women. Women in the age bracket of 20 to 34 years acount for 100.0% of all women with births.
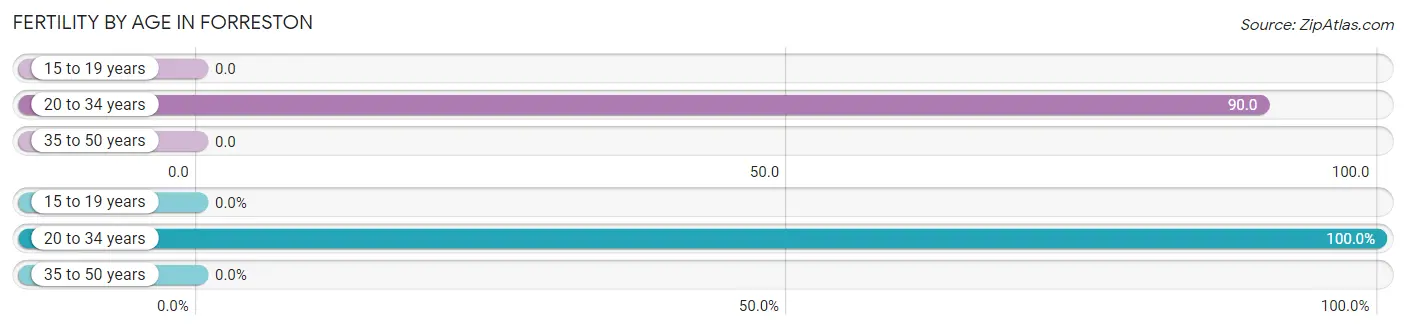
| Age Bracket | Women with Births | Births / 1,000 Women |
| 15 to 19 years | 0 (0.0%) | 0.0 |
| 20 to 34 years | 6 (100.0%) | 90.0 |
| 35 to 50 years | 0 (0.0%) | 0.0 |
| Total | 6 (100.0%) | 30.0 |
Fertility by Age by Marriage Status in Forreston
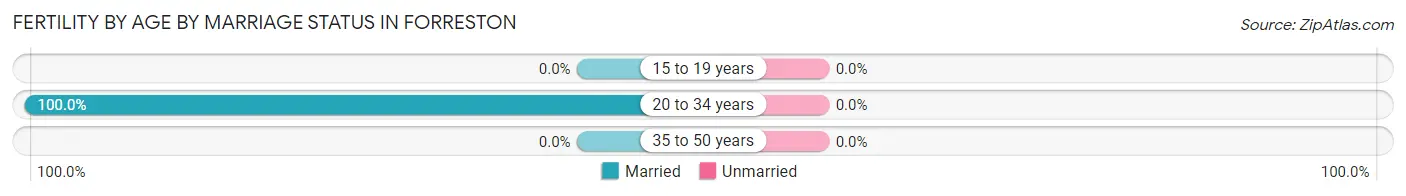
| Age Bracket | Married | Unmarried |
| 15 to 19 years | 0 (0.0%) | 0 (0.0%) |
| 20 to 34 years | 6 (100.0%) | 0 (0.0%) |
| 35 to 50 years | 0 (0.0%) | 0 (0.0%) |
| Total | 6 (100.0%) | 0 (0.0%) |
Fertility by Education in Forreston
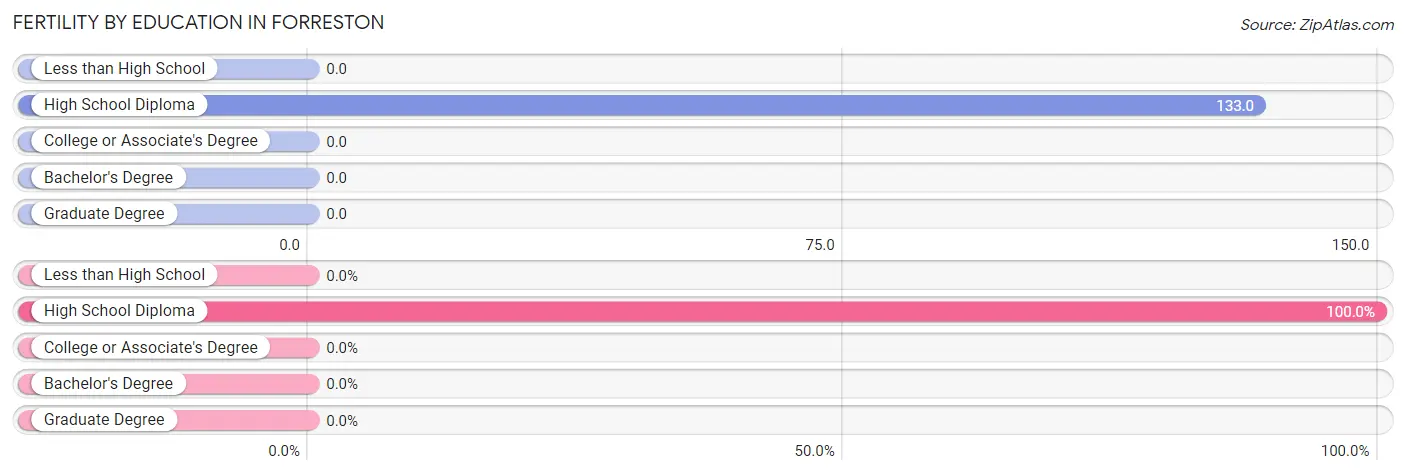
| Educational Attainment | Women with Births | Births / 1,000 Women |
| Less than High School | 0 (0.0%) | 0.0 |
| High School Diploma | 6 (100.0%) | 133.0 |
| College or Associate's Degree | 0 (0.0%) | 0.0 |
| Bachelor's Degree | 0 (0.0%) | 0.0 |
| Graduate Degree | 0 (0.0%) | 0.0 |
| Total | 6 (100.0%) | 30.0 |
Fertility by Education by Marriage Status in Forreston
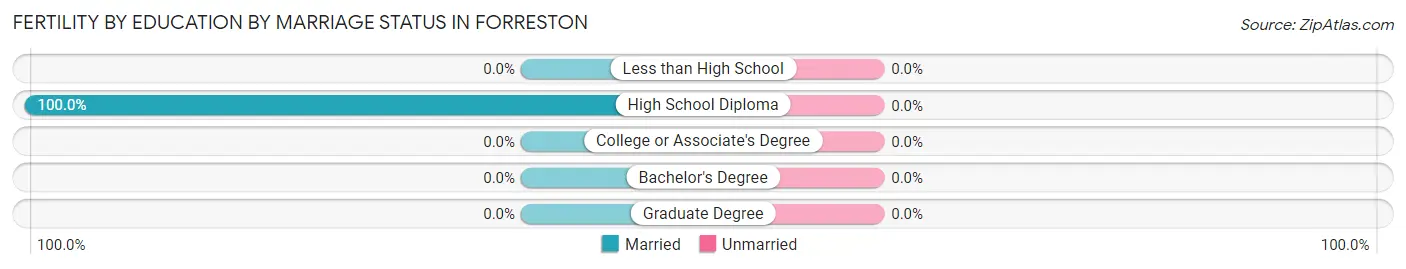
| Educational Attainment | Married | Unmarried |
| Less than High School | 0 (0.0%) | 0 (0.0%) |
| High School Diploma | 6 (100.0%) | 0 (0.0%) |
| College or Associate's Degree | 0 (0.0%) | 0 (0.0%) |
| Bachelor's Degree | 0 (0.0%) | 0 (0.0%) |
| Graduate Degree | 0 (0.0%) | 0 (0.0%) |
| Total | 6 (100.0%) | 0 (0.0%) |
Employment Characteristics in Forreston
Employment by Class of Employer in Forreston
Among the 505 employed individuals in Forreston, private company employees (361 | 71.5%), not-for-profit organizations (43 | 8.5%), and self-employed (not incorporated) (34 | 6.7%) make up the most common classes of employment.
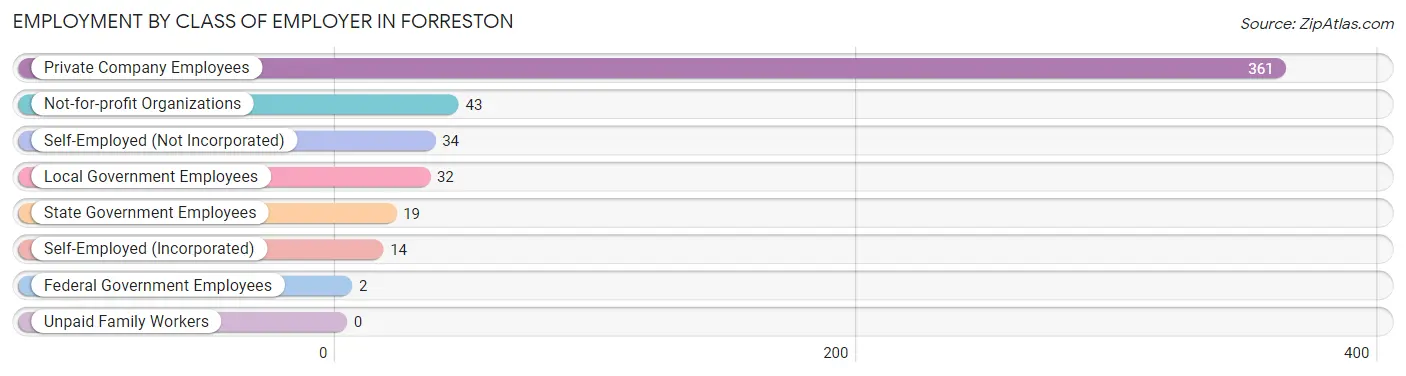
| Employer Class | # Employees | % Employees |
| Private Company Employees | 361 | 71.5% |
| Self-Employed (Incorporated) | 14 | 2.8% |
| Self-Employed (Not Incorporated) | 34 | 6.7% |
| Not-for-profit Organizations | 43 | 8.5% |
| Local Government Employees | 32 | 6.3% |
| State Government Employees | 19 | 3.8% |
| Federal Government Employees | 2 | 0.4% |
| Unpaid Family Workers | 0 | 0.0% |
| Total | 505 | 100.0% |
Employment Status by Age in Forreston
According to the labor force statistics for Forreston, out of the total population over 16 years of age (896), 58.4% or 523 individuals are in the labor force, with 2.9% or 15 of them unemployed. The age group with the highest labor force participation rate is 45 to 54 years, with 92.5% or 99 individuals in the labor force. Within the labor force, the 25 to 29 years age range has the highest percentage of unemployed individuals, with 15.4% or 12 of them being unemployed.
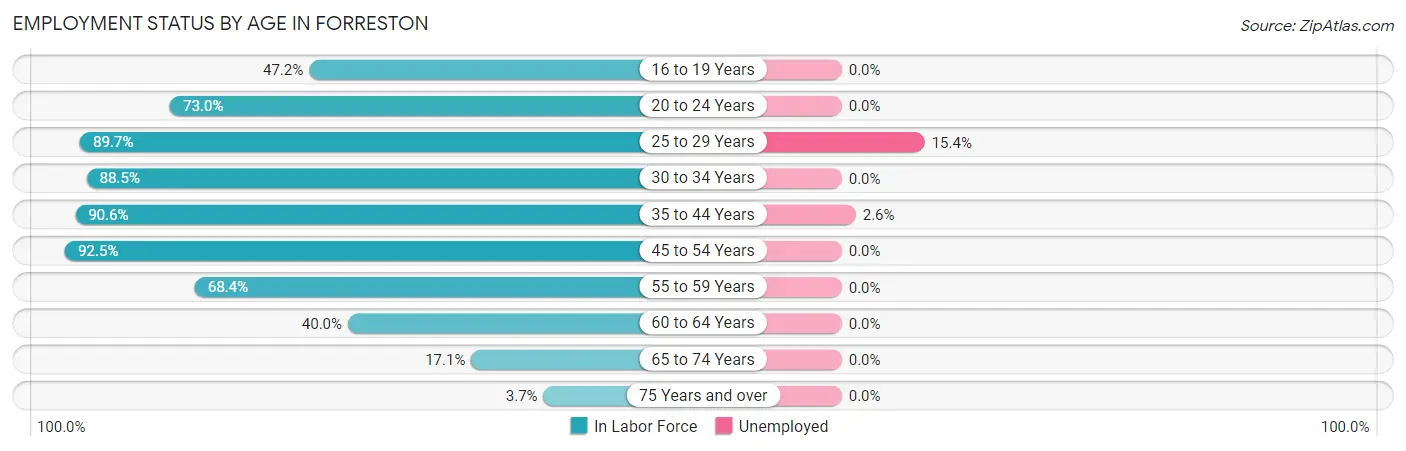
| Age Bracket | In Labor Force | Unemployed |
| 16 to 19 Years | 25 (47.2%) | 0 (0.0%) |
| 20 to 24 Years | 27 (73.0%) | 0 (0.0%) |
| 25 to 29 Years | 78 (89.7%) | 12 (15.4%) |
| 30 to 34 Years | 46 (88.5%) | 0 (0.0%) |
| 35 to 44 Years | 116 (90.6%) | 3 (2.6%) |
| 45 to 54 Years | 99 (92.5%) | 0 (0.0%) |
| 55 to 59 Years | 65 (68.4%) | 0 (0.0%) |
| 60 to 64 Years | 42 (40.0%) | 0 (0.0%) |
| 65 to 74 Years | 21 (17.1%) | 0 (0.0%) |
| 75 Years and over | 4 (3.7%) | 0 (0.0%) |
| Total | 523 (58.4%) | 15 (2.9%) |
Employment Status by Educational Attainment in Forreston
According to labor force statistics for Forreston, 77.7% of individuals (446) out of the total population between 25 and 64 years of age (574) are in the labor force, with 3.4% or 15 of them being unemployed. The group with the highest labor force participation rate are those with the educational attainment of bachelor's degree or higher, with 88.3% or 83 individuals in the labor force. Within the labor force, individuals with college / associate degree education have the highest percentage of unemployment, with 5.5% or 8 of them being unemployed.
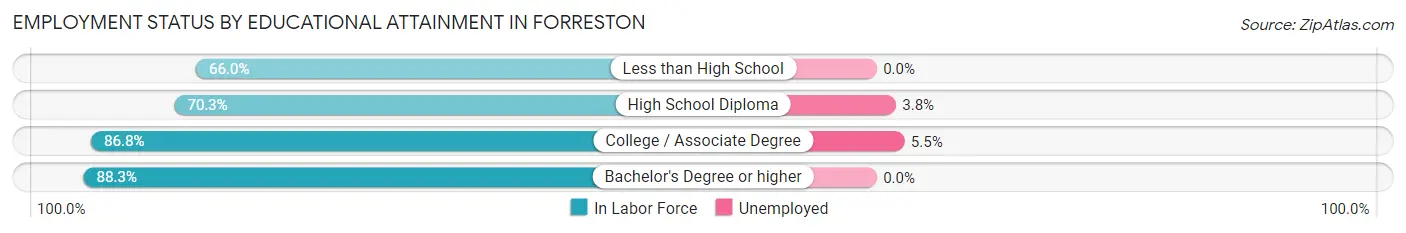
| Educational Attainment | In Labor Force | Unemployed |
| Less than High School | 33 (66.0%) | 0 (0.0%) |
| High School Diploma | 185 (70.3%) | 10 (3.8%) |
| College / Associate Degree | 145 (86.8%) | 9 (5.5%) |
| Bachelor's Degree or higher | 83 (88.3%) | 0 (0.0%) |
| Total | 446 (77.7%) | 20 (3.4%) |
Employment Occupations by Sex in Forreston
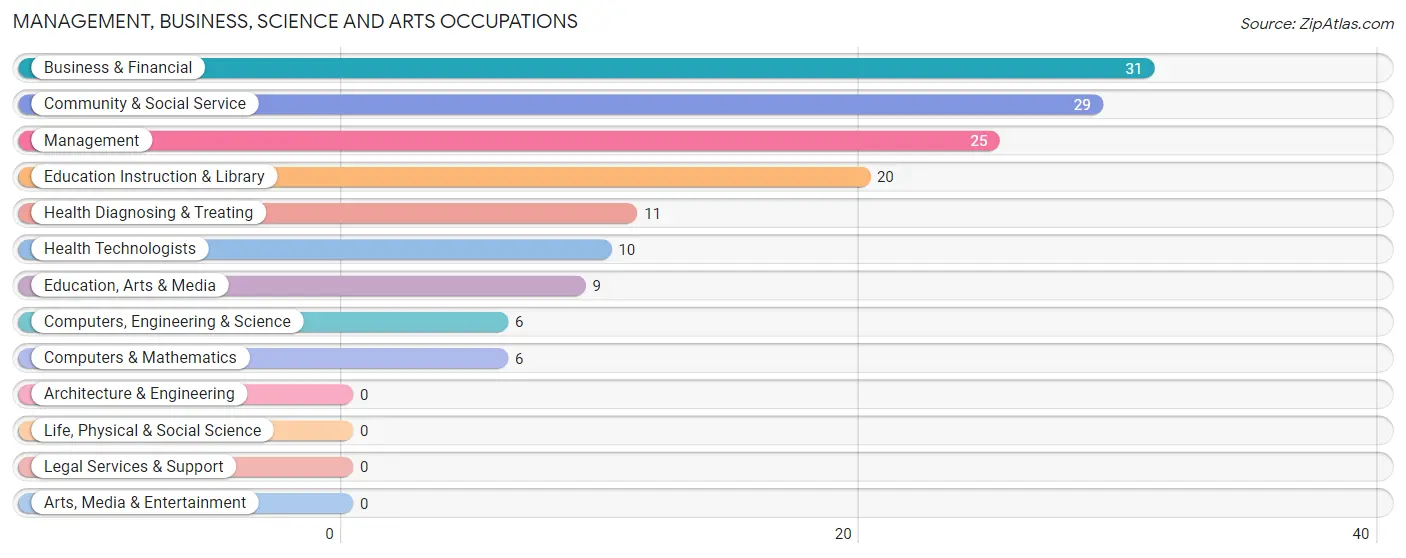
Management, Business, Science and Arts Occupations
The most common Management, Business, Science and Arts occupations in Forreston are Business & Financial (31 | 6.1%), Community & Social Service (29 | 5.7%), Management (25 | 4.9%), Education Instruction & Library (20 | 3.9%), and Health Diagnosing & Treating (11 | 2.2%).
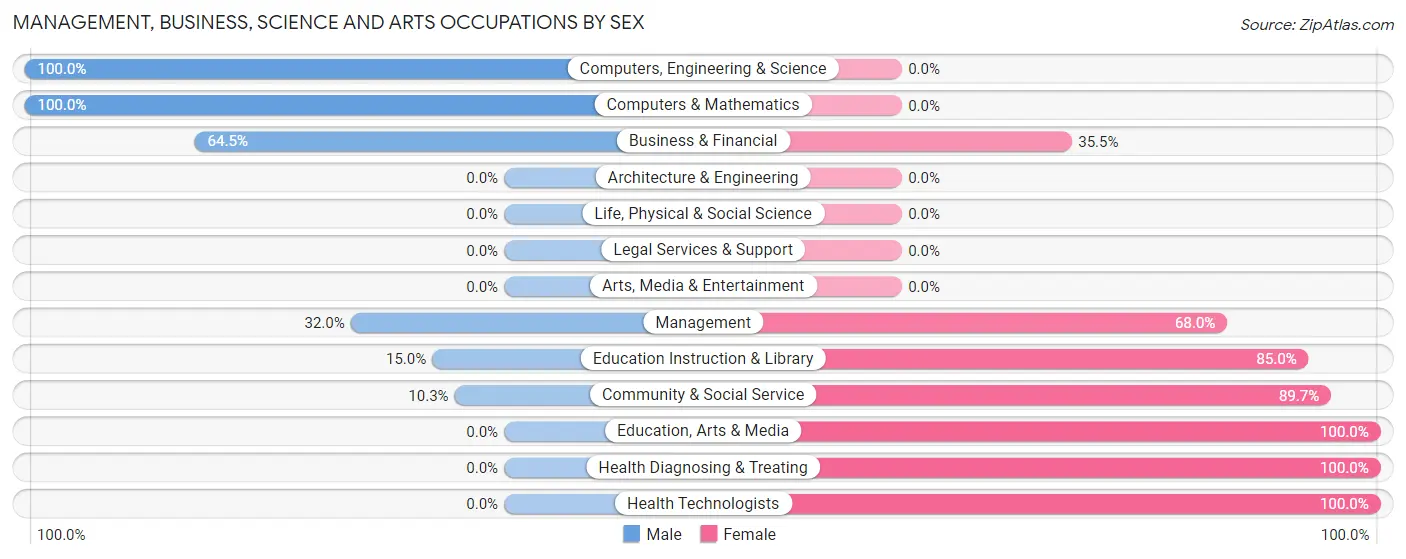
Management, Business, Science and Arts Occupations by Sex
Within the Management, Business, Science and Arts occupations in Forreston, the most male-oriented occupations are Computers, Engineering & Science (100.0%), Computers & Mathematics (100.0%), and Business & Financial (64.5%), while the most female-oriented occupations are Education, Arts & Media (100.0%), Health Diagnosing & Treating (100.0%), and Health Technologists (100.0%).
| Occupation | Male | Female |
| Management | 8 (32.0%) | 17 (68.0%) |
| Business & Financial | 20 (64.5%) | 11 (35.5%) |
| Computers, Engineering & Science | 6 (100.0%) | 0 (0.0%) |
| Computers & Mathematics | 6 (100.0%) | 0 (0.0%) |
| Architecture & Engineering | 0 (0.0%) | 0 (0.0%) |
| Life, Physical & Social Science | 0 (0.0%) | 0 (0.0%) |
| Community & Social Service | 3 (10.3%) | 26 (89.7%) |
| Education, Arts & Media | 0 (0.0%) | 9 (100.0%) |
| Legal Services & Support | 0 (0.0%) | 0 (0.0%) |
| Education Instruction & Library | 3 (15.0%) | 17 (85.0%) |
| Arts, Media & Entertainment | 0 (0.0%) | 0 (0.0%) |
| Health Diagnosing & Treating | 0 (0.0%) | 11 (100.0%) |
| Health Technologists | 0 (0.0%) | 10 (100.0%) |
| Total (Category) | 37 (36.3%) | 65 (63.7%) |
| Total (Overall) | 297 (58.5%) | 211 (41.5%) |
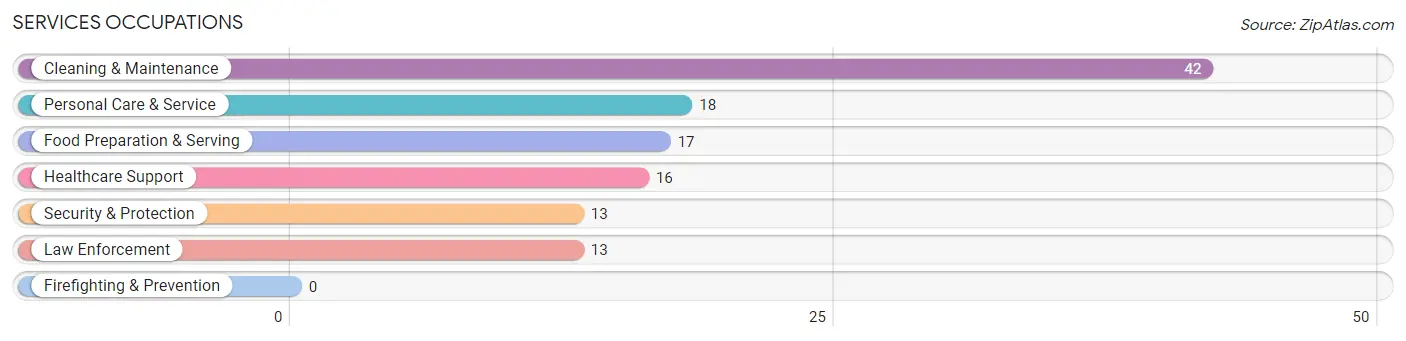
Services Occupations
The most common Services occupations in Forreston are Cleaning & Maintenance (42 | 8.3%), Personal Care & Service (18 | 3.5%), Food Preparation & Serving (17 | 3.4%), Healthcare Support (16 | 3.2%), and Security & Protection (13 | 2.6%).
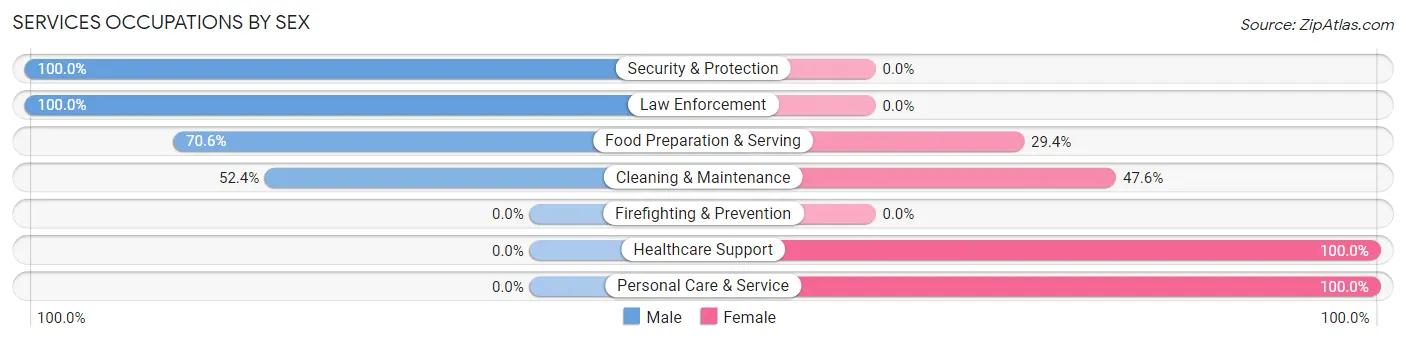
Services Occupations by Sex
Within the Services occupations in Forreston, the most male-oriented occupations are Security & Protection (100.0%), Law Enforcement (100.0%), and Food Preparation & Serving (70.6%), while the most female-oriented occupations are Healthcare Support (100.0%), Personal Care & Service (100.0%), and Cleaning & Maintenance (47.6%).
| Occupation | Male | Female |
| Healthcare Support | 0 (0.0%) | 16 (100.0%) |
| Security & Protection | 13 (100.0%) | 0 (0.0%) |
| Firefighting & Prevention | 0 (0.0%) | 0 (0.0%) |
| Law Enforcement | 13 (100.0%) | 0 (0.0%) |
| Food Preparation & Serving | 12 (70.6%) | 5 (29.4%) |
| Cleaning & Maintenance | 22 (52.4%) | 20 (47.6%) |
| Personal Care & Service | 0 (0.0%) | 18 (100.0%) |
| Total (Category) | 47 (44.3%) | 59 (55.7%) |
| Total (Overall) | 297 (58.5%) | 211 (41.5%) |
Sales and Office Occupations
The most common Sales and Office occupations in Forreston are Office & Administration (43 | 8.5%), and Sales & Related (42 | 8.3%).
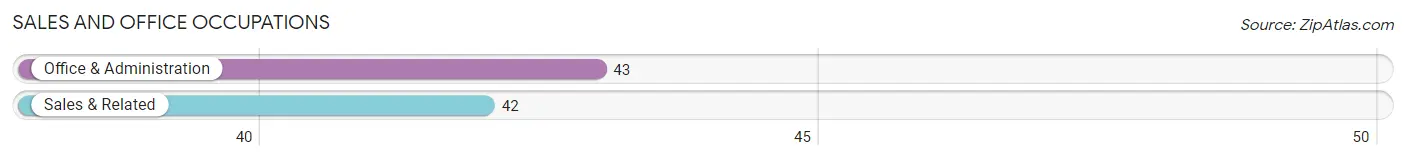
Sales and Office Occupations by Sex
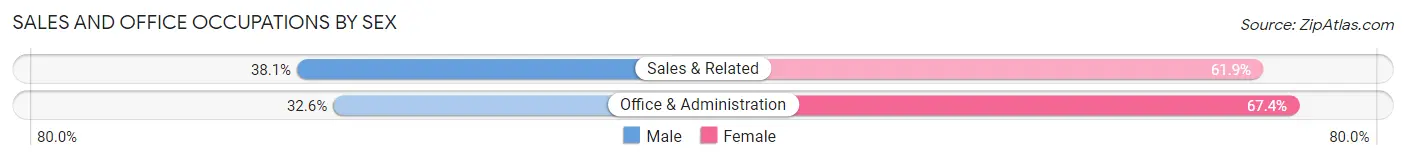
| Occupation | Male | Female |
| Sales & Related | 16 (38.1%) | 26 (61.9%) |
| Office & Administration | 14 (32.6%) | 29 (67.4%) |
| Total (Category) | 30 (35.3%) | 55 (64.7%) |
| Total (Overall) | 297 (58.5%) | 211 (41.5%) |
Natural Resources, Construction and Maintenance Occupations
The most common Natural Resources, Construction and Maintenance occupations in Forreston are Installation, Maintenance & Repair (28 | 5.5%), Construction & Extraction (15 | 2.9%), and Farming, Fishing & Forestry (9 | 1.8%).
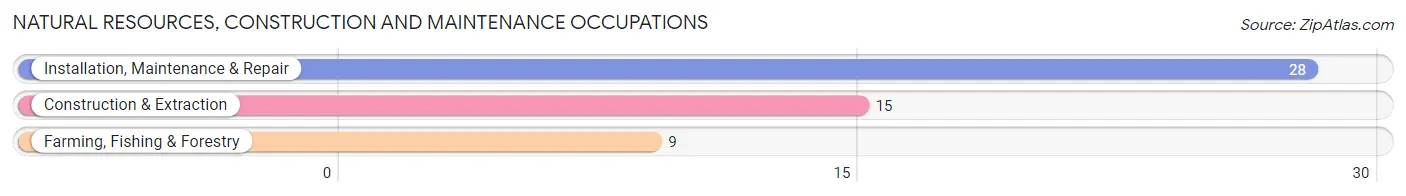
Natural Resources, Construction and Maintenance Occupations by Sex
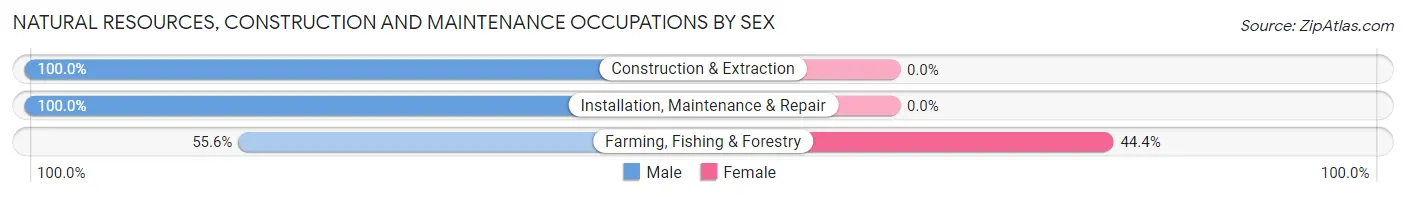
| Occupation | Male | Female |
| Farming, Fishing & Forestry | 5 (55.6%) | 4 (44.4%) |
| Construction & Extraction | 15 (100.0%) | 0 (0.0%) |
| Installation, Maintenance & Repair | 28 (100.0%) | 0 (0.0%) |
| Total (Category) | 48 (92.3%) | 4 (7.7%) |
| Total (Overall) | 297 (58.5%) | 211 (41.5%) |
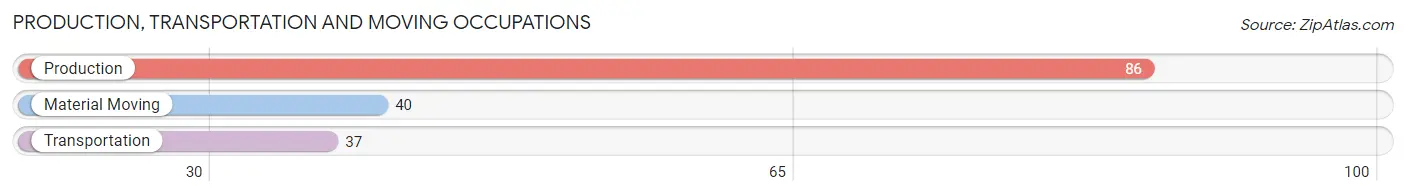
Production, Transportation and Moving Occupations
The most common Production, Transportation and Moving occupations in Forreston are Production (86 | 16.9%), Material Moving (40 | 7.9%), and Transportation (37 | 7.3%).
Production, Transportation and Moving Occupations by Sex
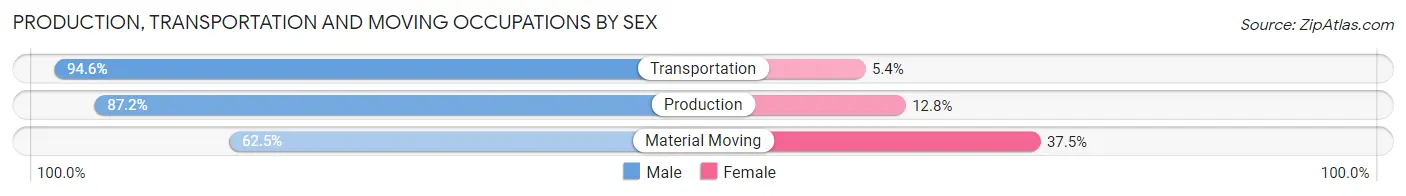
| Occupation | Male | Female |
| Production | 75 (87.2%) | 11 (12.8%) |
| Transportation | 35 (94.6%) | 2 (5.4%) |
| Material Moving | 25 (62.5%) | 15 (37.5%) |
| Total (Category) | 135 (82.8%) | 28 (17.2%) |
| Total (Overall) | 297 (58.5%) | 211 (41.5%) |
Employment Industries by Sex in Forreston
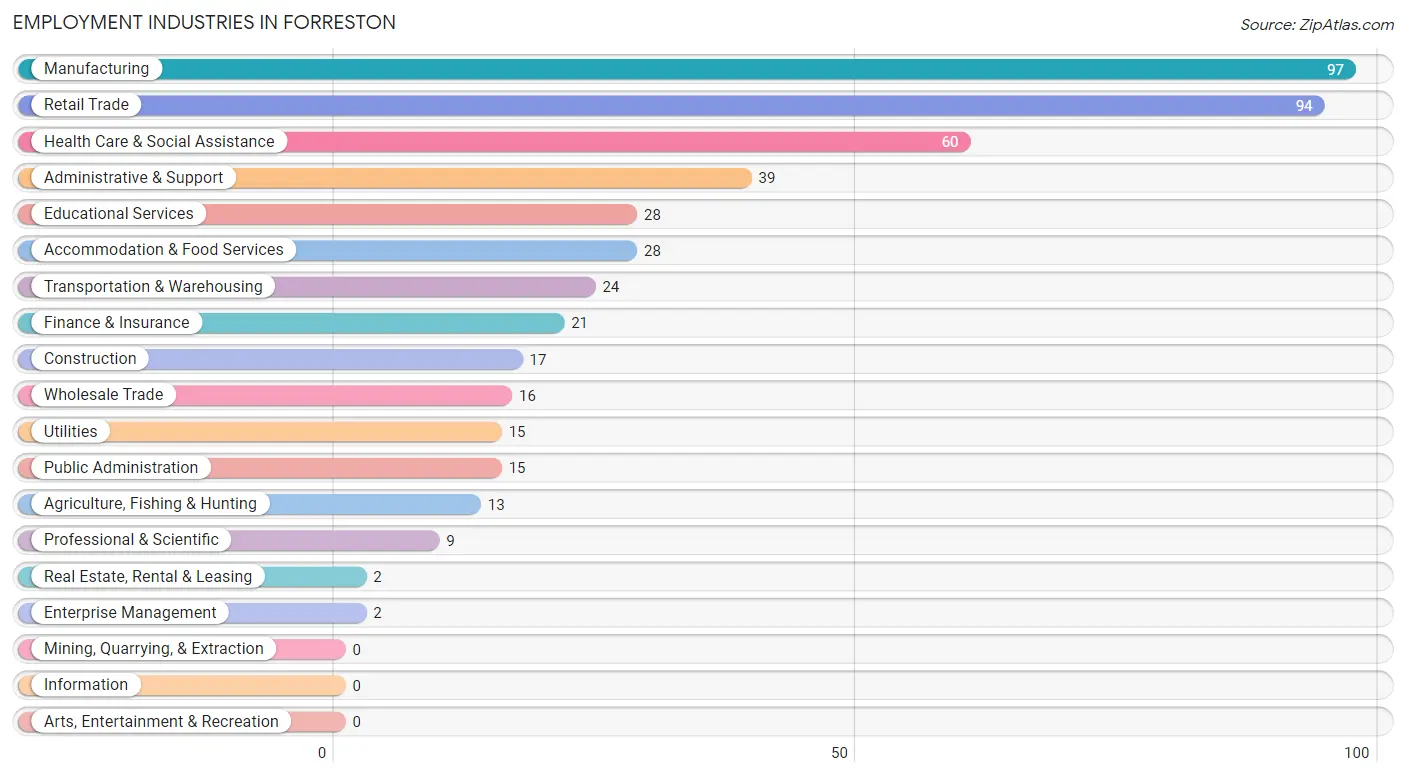
Employment Industries in Forreston
The major employment industries in Forreston include Manufacturing (97 | 19.1%), Retail Trade (94 | 18.5%), Health Care & Social Assistance (60 | 11.8%), Administrative & Support (39 | 7.7%), and Educational Services (28 | 5.5%).
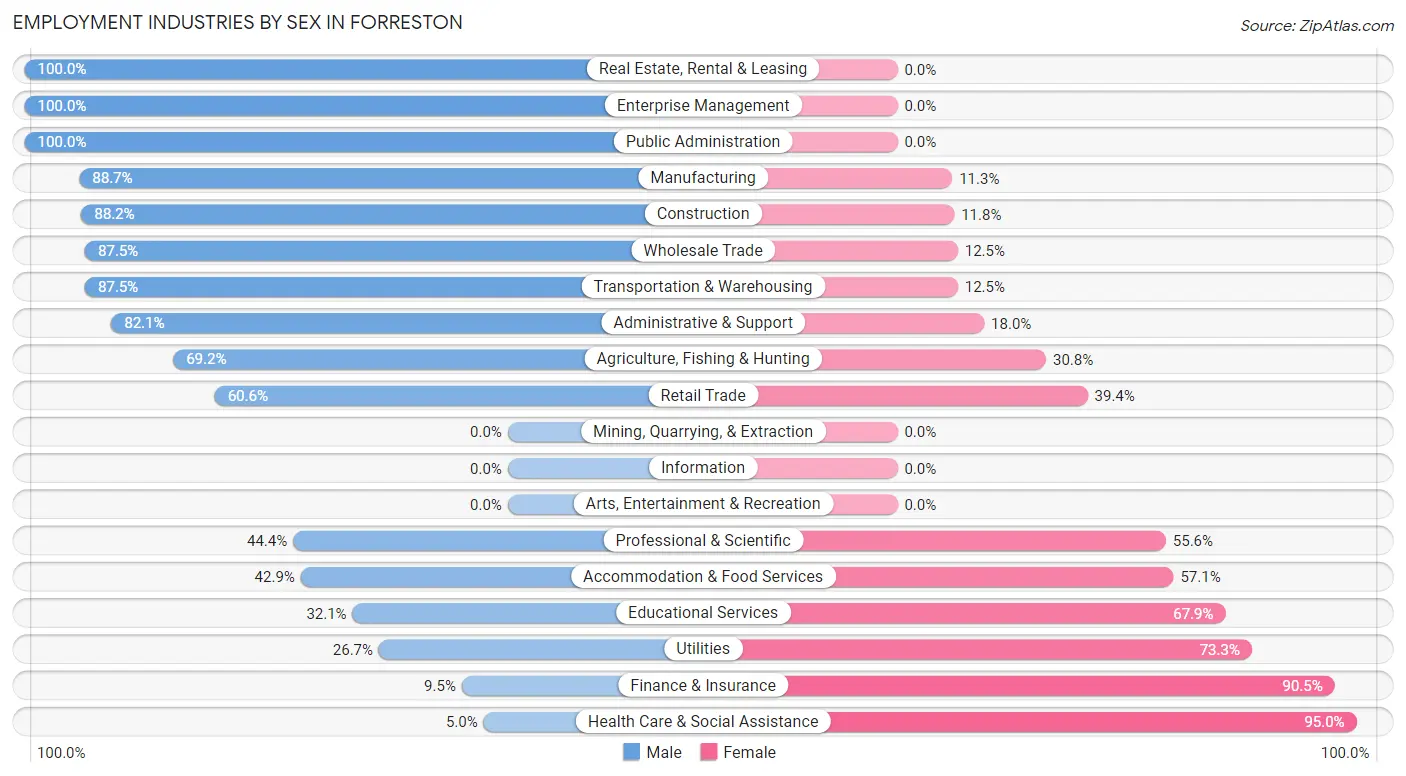
Employment Industries by Sex in Forreston
The Forreston industries that see more men than women are Real Estate, Rental & Leasing (100.0%), Enterprise Management (100.0%), and Public Administration (100.0%), whereas the industries that tend to have a higher number of women are Health Care & Social Assistance (95.0%), Finance & Insurance (90.5%), and Utilities (73.3%).
| Industry | Male | Female |
| Agriculture, Fishing & Hunting | 9 (69.2%) | 4 (30.8%) |
| Mining, Quarrying, & Extraction | 0 (0.0%) | 0 (0.0%) |
| Construction | 15 (88.2%) | 2 (11.8%) |
| Manufacturing | 86 (88.7%) | 11 (11.3%) |
| Wholesale Trade | 14 (87.5%) | 2 (12.5%) |
| Retail Trade | 57 (60.6%) | 37 (39.4%) |
| Transportation & Warehousing | 21 (87.5%) | 3 (12.5%) |
| Utilities | 4 (26.7%) | 11 (73.3%) |
| Information | 0 (0.0%) | 0 (0.0%) |
| Finance & Insurance | 2 (9.5%) | 19 (90.5%) |
| Real Estate, Rental & Leasing | 2 (100.0%) | 0 (0.0%) |
| Professional & Scientific | 4 (44.4%) | 5 (55.6%) |
| Enterprise Management | 2 (100.0%) | 0 (0.0%) |
| Administrative & Support | 32 (82.1%) | 7 (17.9%) |
| Educational Services | 9 (32.1%) | 19 (67.9%) |
| Health Care & Social Assistance | 3 (5.0%) | 57 (95.0%) |
| Arts, Entertainment & Recreation | 0 (0.0%) | 0 (0.0%) |
| Accommodation & Food Services | 12 (42.9%) | 16 (57.1%) |
| Public Administration | 15 (100.0%) | 0 (0.0%) |
| Total | 297 (58.5%) | 211 (41.5%) |
Education in Forreston
School Enrollment in Forreston
The most common levels of schooling among the 285 students in Forreston are middle school (88 | 30.9%), high school (82 | 28.8%), and elementary school (74 | 26.0%).
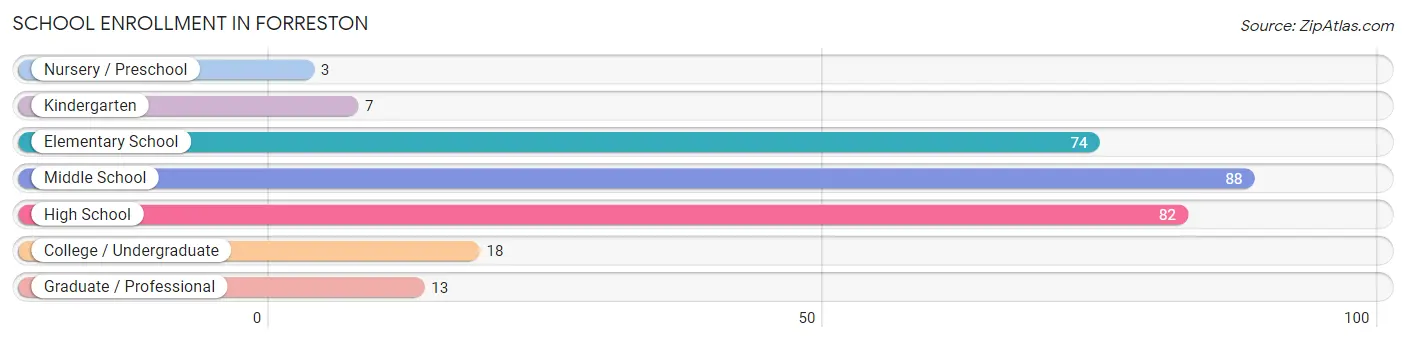
| School Level | # Students | % Students |
| Nursery / Preschool | 3 | 1.1% |
| Kindergarten | 7 | 2.5% |
| Elementary School | 74 | 26.0% |
| Middle School | 88 | 30.9% |
| High School | 82 | 28.8% |
| College / Undergraduate | 18 | 6.3% |
| Graduate / Professional | 13 | 4.6% |
| Total | 285 | 100.0% |
School Enrollment by Age by Funding Source in Forreston
Out of a total of 285 students who are enrolled in schools in Forreston, 31 (10.9%) attend a private institution, while the remaining 254 (89.1%) are enrolled in public schools. The age group of 25 to 34 year olds has the highest likelihood of being enrolled in private schools, with 3 (100.0% in the age bracket) enrolled. Conversely, the age group of 5 to 9 year old has the lowest likelihood of being enrolled in a private school, with 81 (100.0% in the age bracket) attending a public institution.
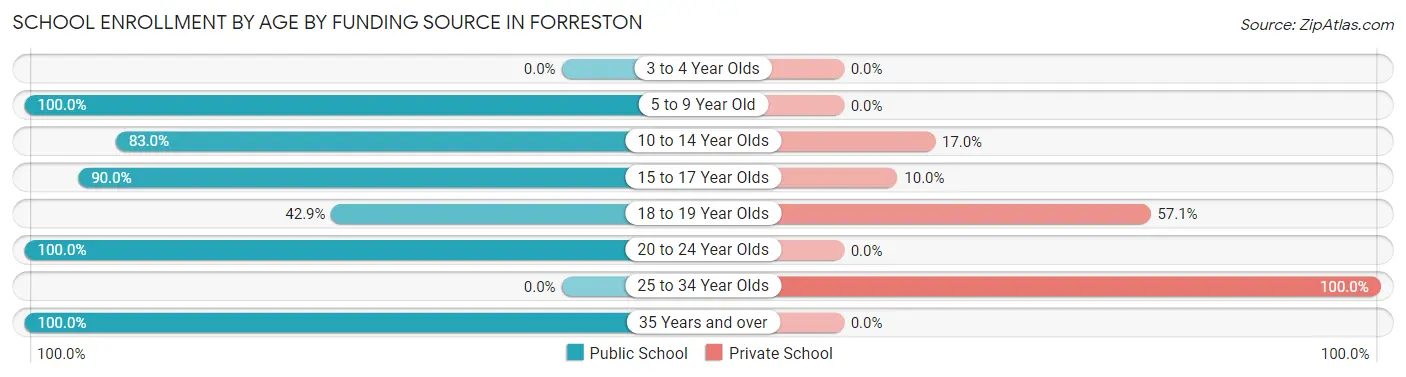
| Age Bracket | Public School | Private School |
| 3 to 4 Year Olds | 0 (0.0%) | 0 (0.0%) |
| 5 to 9 Year Old | 81 (100.0%) | 0 (0.0%) |
| 10 to 14 Year Olds | 83 (83.0%) | 17 (17.0%) |
| 15 to 17 Year Olds | 63 (90.0%) | 7 (10.0%) |
| 18 to 19 Year Olds | 3 (42.9%) | 4 (57.1%) |
| 20 to 24 Year Olds | 12 (100.0%) | 0 (0.0%) |
| 25 to 34 Year Olds | 0 (0.0%) | 3 (100.0%) |
| 35 Years and over | 12 (100.0%) | 0 (0.0%) |
| Total | 254 (89.1%) | 31 (10.9%) |
Educational Attainment by Field of Study in Forreston
Education (32 | 25.6%), business (17 | 13.6%), arts & humanities (17 | 13.6%), science & technology (14 | 11.2%), and literature & languages (9 | 7.2%) are the most common fields of study among 125 individuals in Forreston who have obtained a bachelor's degree or higher.
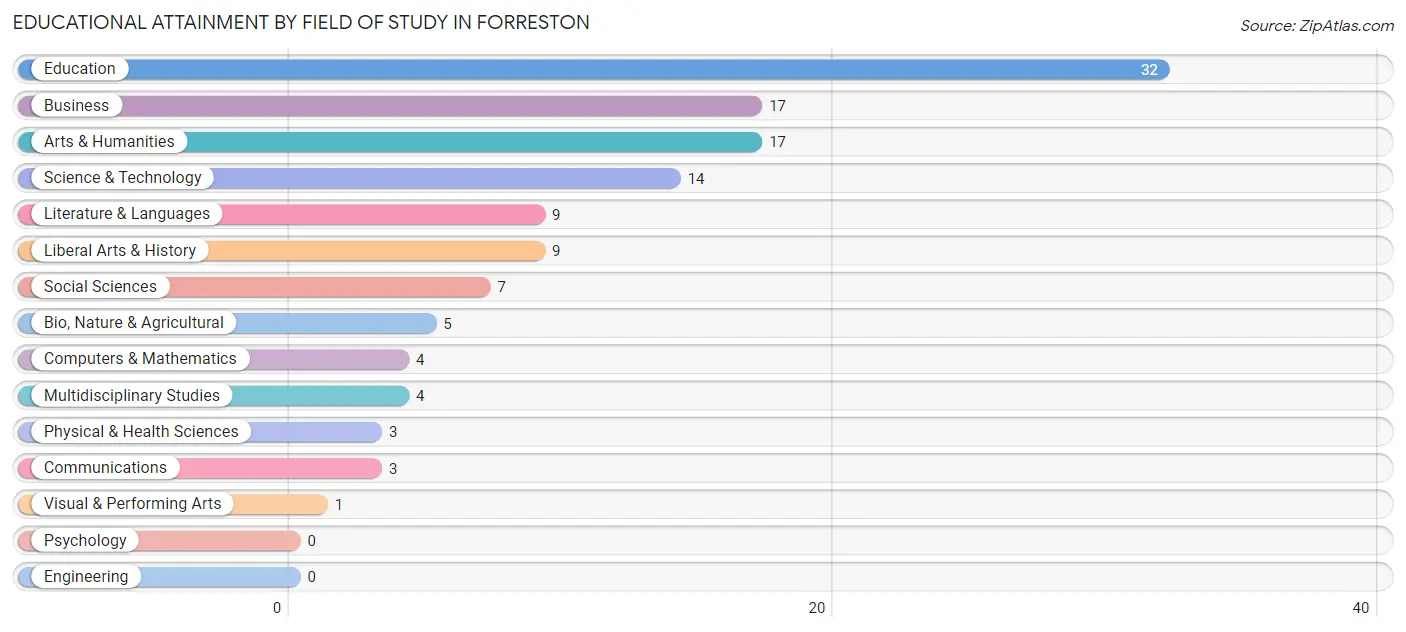
| Field of Study | # Graduates | % Graduates |
| Computers & Mathematics | 4 | 3.2% |
| Bio, Nature & Agricultural | 5 | 4.0% |
| Physical & Health Sciences | 3 | 2.4% |
| Psychology | 0 | 0.0% |
| Social Sciences | 7 | 5.6% |
| Engineering | 0 | 0.0% |
| Multidisciplinary Studies | 4 | 3.2% |
| Science & Technology | 14 | 11.2% |
| Business | 17 | 13.6% |
| Education | 32 | 25.6% |
| Literature & Languages | 9 | 7.2% |
| Liberal Arts & History | 9 | 7.2% |
| Visual & Performing Arts | 1 | 0.8% |
| Communications | 3 | 2.4% |
| Arts & Humanities | 17 | 13.6% |
| Total | 125 | 100.0% |
Transportation & Commute in Forreston
Vehicle Availability by Sex in Forreston
The most prevalent vehicle ownership categories in Forreston are males with 2 vehicles (117, accounting for 39.4%) and females with 2 vehicles (90, making up 56.2%).
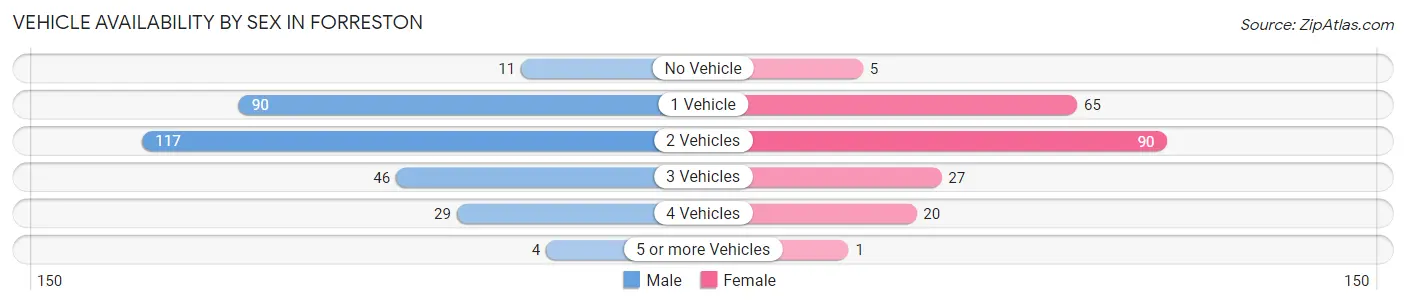
| Vehicles Available | Male | Female |
| No Vehicle | 11 (3.7%) | 5 (2.4%) |
| 1 Vehicle | 90 (30.3%) | 65 (31.2%) |
| 2 Vehicles | 117 (39.4%) | 90 (43.3%) |
| 3 Vehicles | 46 (15.5%) | 27 (13.0%) |
| 4 Vehicles | 29 (9.8%) | 20 (9.6%) |
| 5 or more Vehicles | 4 (1.3%) | 1 (0.5%) |
| Total | 297 (100.0%) | 208 (100.0%) |
Commute Time in Forreston
The most frequently occuring commute durations in Forreston are 20 to 24 minutes (90 commuters, 18.7%), 25 to 29 minutes (83 commuters, 17.3%), and 15 to 19 minutes (63 commuters, 13.1%).
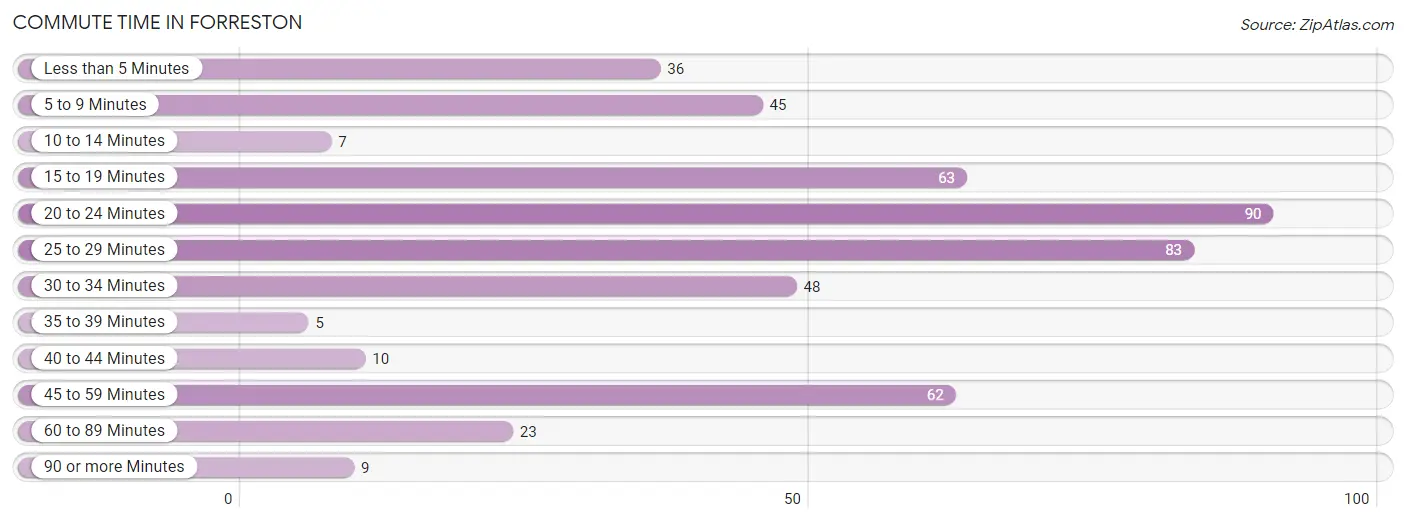
| Commute Time | # Commuters | % Commuters |
| Less than 5 Minutes | 36 | 7.5% |
| 5 to 9 Minutes | 45 | 9.4% |
| 10 to 14 Minutes | 7 | 1.5% |
| 15 to 19 Minutes | 63 | 13.1% |
| 20 to 24 Minutes | 90 | 18.7% |
| 25 to 29 Minutes | 83 | 17.3% |
| 30 to 34 Minutes | 48 | 10.0% |
| 35 to 39 Minutes | 5 | 1.0% |
| 40 to 44 Minutes | 10 | 2.1% |
| 45 to 59 Minutes | 62 | 12.9% |
| 60 to 89 Minutes | 23 | 4.8% |
| 90 or more Minutes | 9 | 1.9% |
Commute Time by Sex in Forreston
The most common commute times in Forreston are 20 to 24 minutes (72 commuters, 24.8%) for males and 25 to 29 minutes (59 commuters, 30.9%) for females.
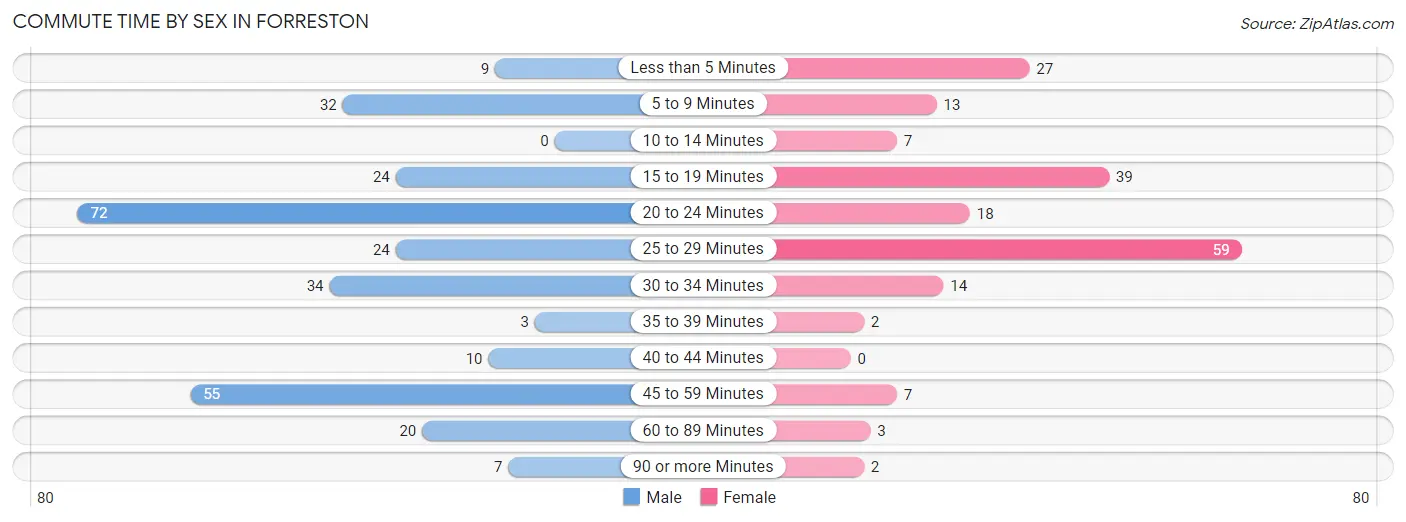
| Commute Time | Male | Female |
| Less than 5 Minutes | 9 (3.1%) | 27 (14.1%) |
| 5 to 9 Minutes | 32 (11.0%) | 13 (6.8%) |
| 10 to 14 Minutes | 0 (0.0%) | 7 (3.7%) |
| 15 to 19 Minutes | 24 (8.3%) | 39 (20.4%) |
| 20 to 24 Minutes | 72 (24.8%) | 18 (9.4%) |
| 25 to 29 Minutes | 24 (8.3%) | 59 (30.9%) |
| 30 to 34 Minutes | 34 (11.7%) | 14 (7.3%) |
| 35 to 39 Minutes | 3 (1.0%) | 2 (1.1%) |
| 40 to 44 Minutes | 10 (3.5%) | 0 (0.0%) |
| 45 to 59 Minutes | 55 (19.0%) | 7 (3.7%) |
| 60 to 89 Minutes | 20 (6.9%) | 3 (1.6%) |
| 90 or more Minutes | 7 (2.4%) | 2 (1.1%) |
Time of Departure to Work by Sex in Forreston
The most frequent times of departure to work in Forreston are 12:00 PM to 3:59 PM (47, 16.2%) for males and 12:00 PM to 3:59 PM (39, 20.4%) for females.
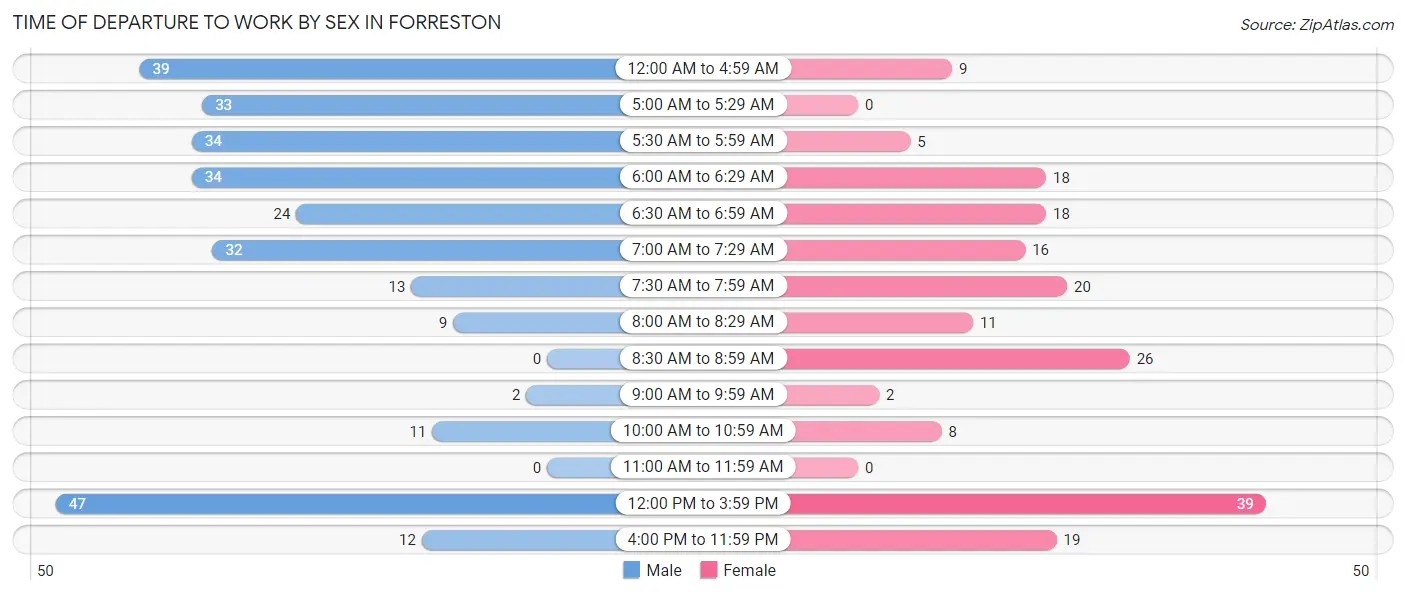
| Time of Departure | Male | Female |
| 12:00 AM to 4:59 AM | 39 (13.5%) | 9 (4.7%) |
| 5:00 AM to 5:29 AM | 33 (11.4%) | 0 (0.0%) |
| 5:30 AM to 5:59 AM | 34 (11.7%) | 5 (2.6%) |
| 6:00 AM to 6:29 AM | 34 (11.7%) | 18 (9.4%) |
| 6:30 AM to 6:59 AM | 24 (8.3%) | 18 (9.4%) |
| 7:00 AM to 7:29 AM | 32 (11.0%) | 16 (8.4%) |
| 7:30 AM to 7:59 AM | 13 (4.5%) | 20 (10.5%) |
| 8:00 AM to 8:29 AM | 9 (3.1%) | 11 (5.8%) |
| 8:30 AM to 8:59 AM | 0 (0.0%) | 26 (13.6%) |
| 9:00 AM to 9:59 AM | 2 (0.7%) | 2 (1.1%) |
| 10:00 AM to 10:59 AM | 11 (3.8%) | 8 (4.2%) |
| 11:00 AM to 11:59 AM | 0 (0.0%) | 0 (0.0%) |
| 12:00 PM to 3:59 PM | 47 (16.2%) | 39 (20.4%) |
| 4:00 PM to 11:59 PM | 12 (4.1%) | 19 (10.0%) |
| Total | 290 (100.0%) | 191 (100.0%) |
Housing Occupancy in Forreston
Occupancy by Ownership in Forreston
Of the total 510 dwellings in Forreston, owner-occupied units account for 434 (85.1%), while renter-occupied units make up 76 (14.9%).
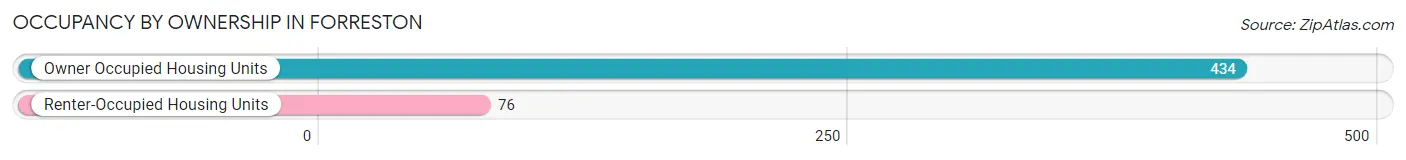
| Occupancy | # Housing Units | % Housing Units |
| Owner Occupied Housing Units | 434 | 85.1% |
| Renter-Occupied Housing Units | 76 | 14.9% |
| Total Occupied Housing Units | 510 | 100.0% |
Occupancy by Household Size in Forreston
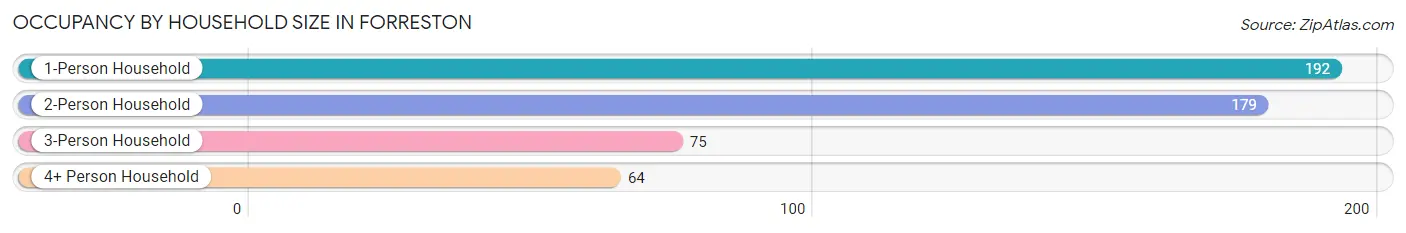
| Household Size | # Housing Units | % Housing Units |
| 1-Person Household | 192 | 37.7% |
| 2-Person Household | 179 | 35.1% |
| 3-Person Household | 75 | 14.7% |
| 4+ Person Household | 64 | 12.6% |
| Total Housing Units | 510 | 100.0% |
Occupancy by Ownership by Household Size in Forreston
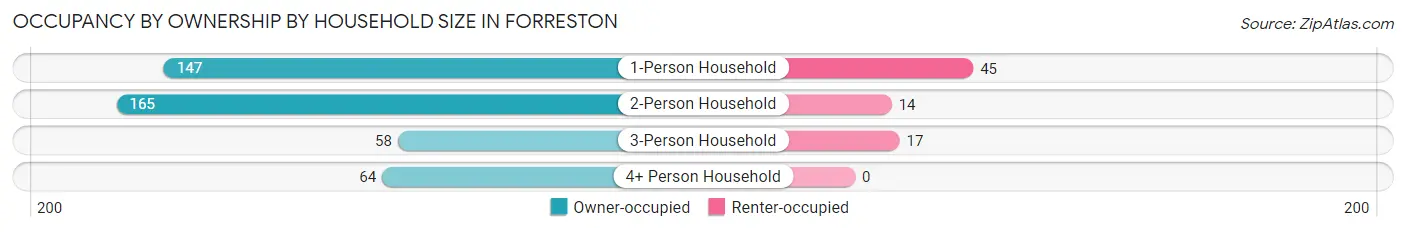
| Household Size | Owner-occupied | Renter-occupied |
| 1-Person Household | 147 (76.6%) | 45 (23.4%) |
| 2-Person Household | 165 (92.2%) | 14 (7.8%) |
| 3-Person Household | 58 (77.3%) | 17 (22.7%) |
| 4+ Person Household | 64 (100.0%) | 0 (0.0%) |
| Total Housing Units | 434 (85.1%) | 76 (14.9%) |
Occupancy by Educational Attainment in Forreston
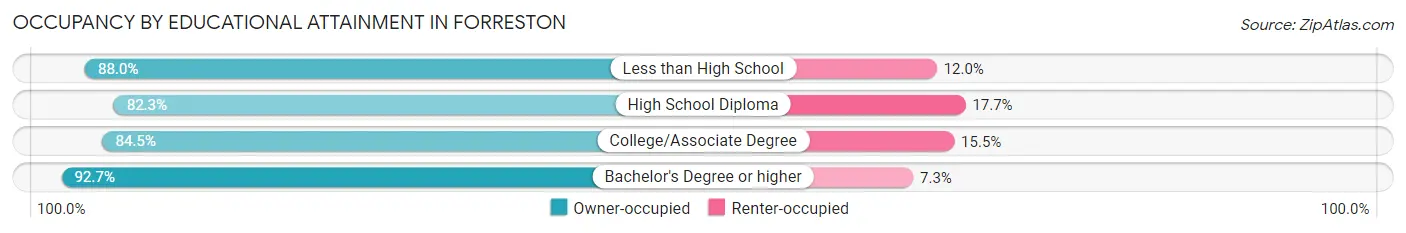
| Household Size | Owner-occupied | Renter-occupied |
| Less than High School | 22 (88.0%) | 3 (12.0%) |
| High School Diploma | 172 (82.3%) | 37 (17.7%) |
| College/Associate Degree | 164 (84.5%) | 30 (15.5%) |
| Bachelor's Degree or higher | 76 (92.7%) | 6 (7.3%) |
Occupancy by Age of Householder in Forreston
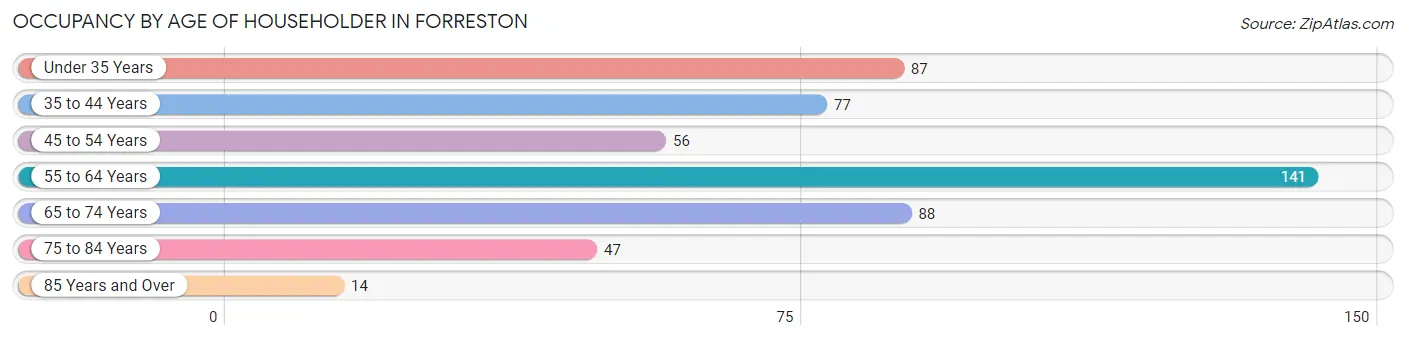
| Age Bracket | # Households | % Households |
| Under 35 Years | 87 | 17.1% |
| 35 to 44 Years | 77 | 15.1% |
| 45 to 54 Years | 56 | 11.0% |
| 55 to 64 Years | 141 | 27.7% |
| 65 to 74 Years | 88 | 17.2% |
| 75 to 84 Years | 47 | 9.2% |
| 85 Years and Over | 14 | 2.8% |
| Total | 510 | 100.0% |
Housing Finances in Forreston
Median Income by Occupancy in Forreston
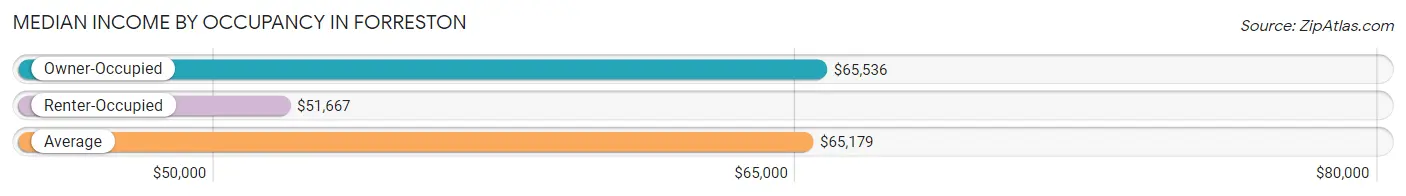
| Occupancy Type | # Households | Median Income |
| Owner-Occupied | 434 (85.1%) | $65,536 |
| Renter-Occupied | 76 (14.9%) | $51,667 |
| Average | 510 (100.0%) | $65,179 |
Occupancy by Householder Income Bracket in Forreston
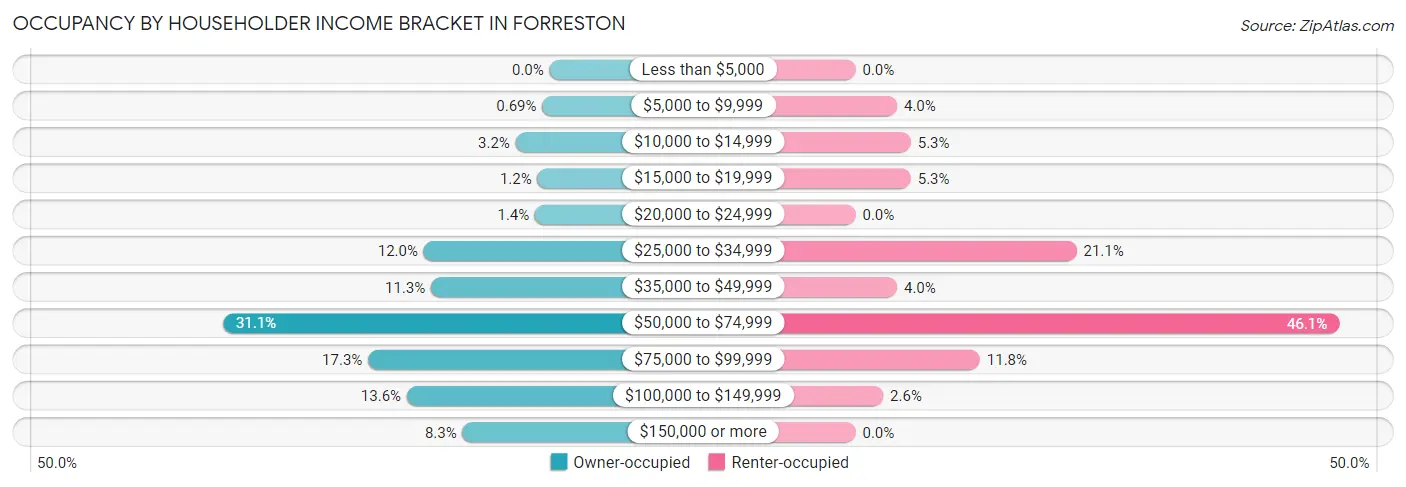
| Income Bracket | Owner-occupied | Renter-occupied |
| Less than $5,000 | 0 (0.0%) | 0 (0.0%) |
| $5,000 to $9,999 | 3 (0.7%) | 3 (4.0%) |
| $10,000 to $14,999 | 14 (3.2%) | 4 (5.3%) |
| $15,000 to $19,999 | 5 (1.1%) | 4 (5.3%) |
| $20,000 to $24,999 | 6 (1.4%) | 0 (0.0%) |
| $25,000 to $34,999 | 52 (12.0%) | 16 (21.0%) |
| $35,000 to $49,999 | 49 (11.3%) | 3 (4.0%) |
| $50,000 to $74,999 | 135 (31.1%) | 35 (46.1%) |
| $75,000 to $99,999 | 75 (17.3%) | 9 (11.8%) |
| $100,000 to $149,999 | 59 (13.6%) | 2 (2.6%) |
| $150,000 or more | 36 (8.3%) | 0 (0.0%) |
| Total | 434 (100.0%) | 76 (100.0%) |
Monthly Housing Cost Tiers in Forreston
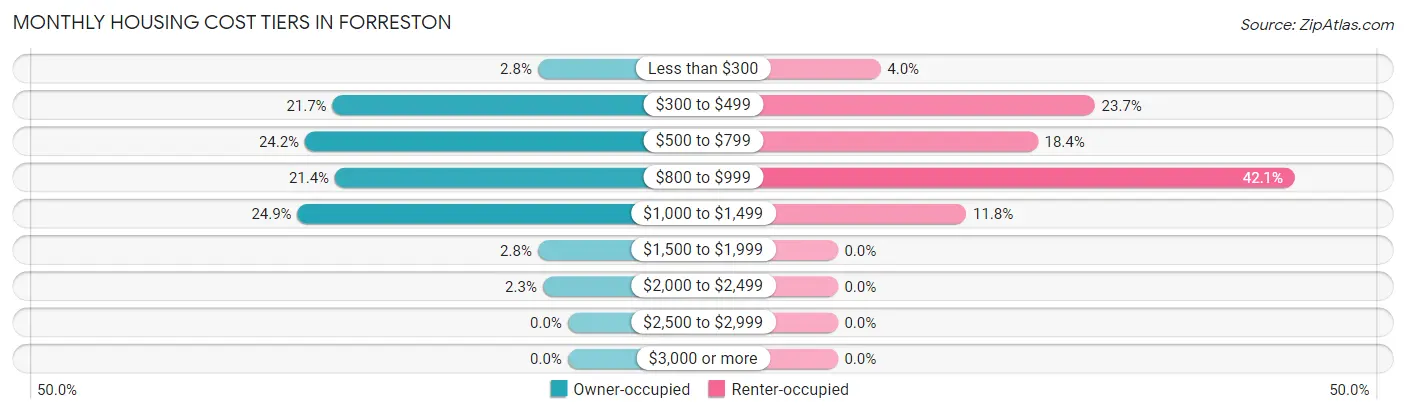
| Monthly Cost | Owner-occupied | Renter-occupied |
| Less than $300 | 12 (2.8%) | 3 (4.0%) |
| $300 to $499 | 94 (21.7%) | 18 (23.7%) |
| $500 to $799 | 105 (24.2%) | 14 (18.4%) |
| $800 to $999 | 93 (21.4%) | 32 (42.1%) |
| $1,000 to $1,499 | 108 (24.9%) | 9 (11.8%) |
| $1,500 to $1,999 | 12 (2.8%) | 0 (0.0%) |
| $2,000 to $2,499 | 10 (2.3%) | 0 (0.0%) |
| $2,500 to $2,999 | 0 (0.0%) | 0 (0.0%) |
| $3,000 or more | 0 (0.0%) | 0 (0.0%) |
| Total | 434 (100.0%) | 76 (100.0%) |
Physical Housing Characteristics in Forreston
Housing Structures in Forreston
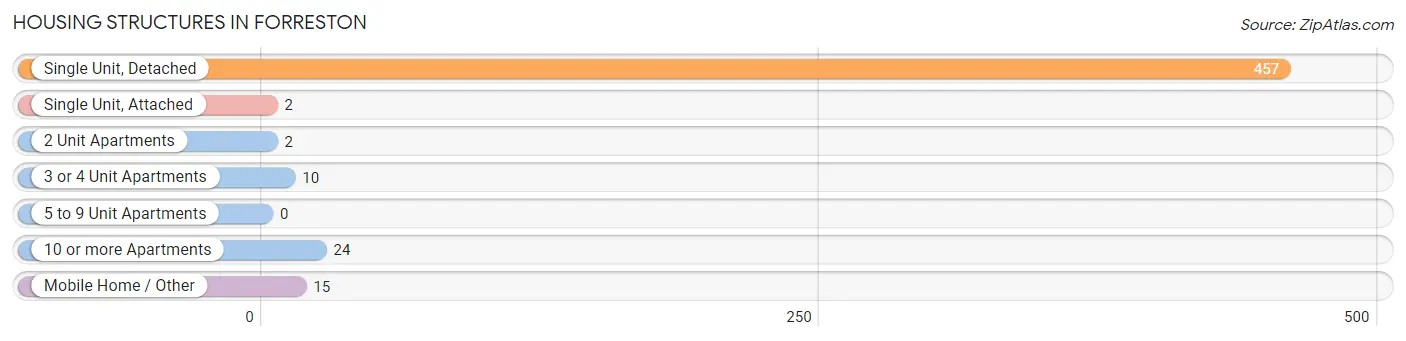
| Structure Type | # Housing Units | % Housing Units |
| Single Unit, Detached | 457 | 89.6% |
| Single Unit, Attached | 2 | 0.4% |
| 2 Unit Apartments | 2 | 0.4% |
| 3 or 4 Unit Apartments | 10 | 2.0% |
| 5 to 9 Unit Apartments | 0 | 0.0% |
| 10 or more Apartments | 24 | 4.7% |
| Mobile Home / Other | 15 | 2.9% |
| Total | 510 | 100.0% |
Housing Structures by Occupancy in Forreston
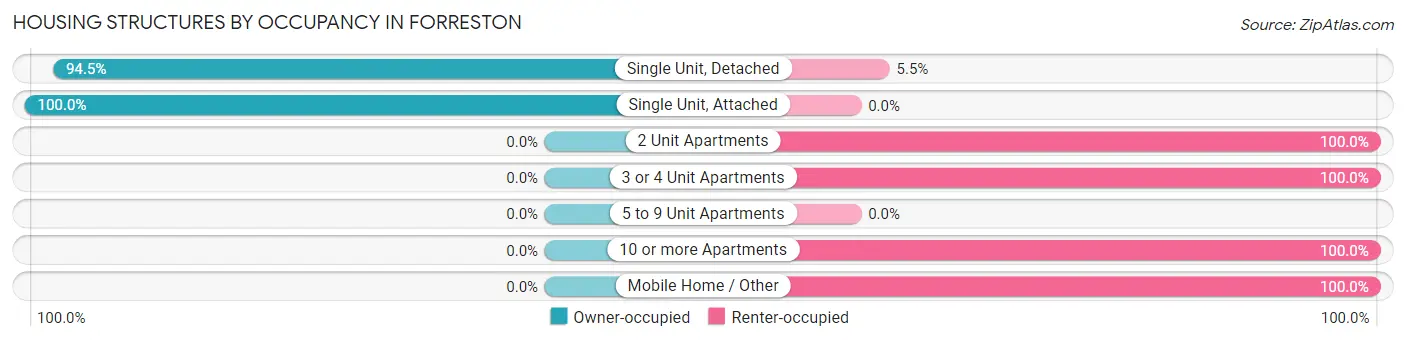
| Structure Type | Owner-occupied | Renter-occupied |
| Single Unit, Detached | 432 (94.5%) | 25 (5.5%) |
| Single Unit, Attached | 2 (100.0%) | 0 (0.0%) |
| 2 Unit Apartments | 0 (0.0%) | 2 (100.0%) |
| 3 or 4 Unit Apartments | 0 (0.0%) | 10 (100.0%) |
| 5 to 9 Unit Apartments | 0 (0.0%) | 0 (0.0%) |
| 10 or more Apartments | 0 (0.0%) | 24 (100.0%) |
| Mobile Home / Other | 0 (0.0%) | 15 (100.0%) |
| Total | 434 (85.1%) | 76 (14.9%) |
Housing Structures by Number of Rooms in Forreston
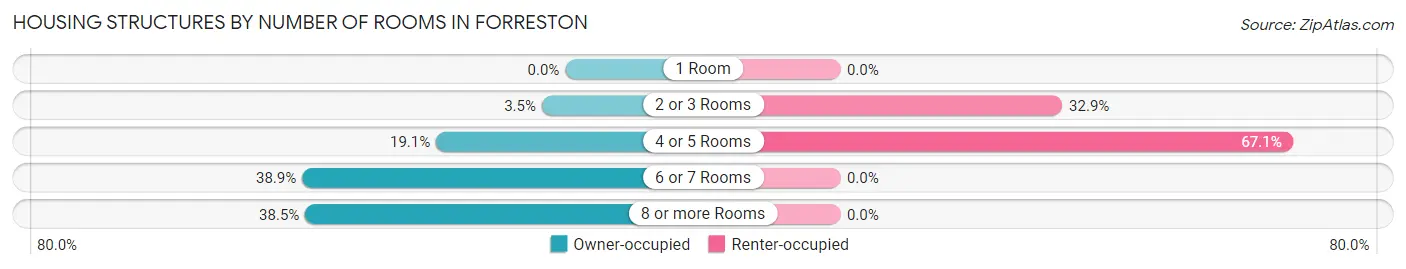
| Number of Rooms | Owner-occupied | Renter-occupied |
| 1 Room | 0 (0.0%) | 0 (0.0%) |
| 2 or 3 Rooms | 15 (3.5%) | 25 (32.9%) |
| 4 or 5 Rooms | 83 (19.1%) | 51 (67.1%) |
| 6 or 7 Rooms | 169 (38.9%) | 0 (0.0%) |
| 8 or more Rooms | 167 (38.5%) | 0 (0.0%) |
| Total | 434 (100.0%) | 76 (100.0%) |
Housing Structure by Heating Type in Forreston
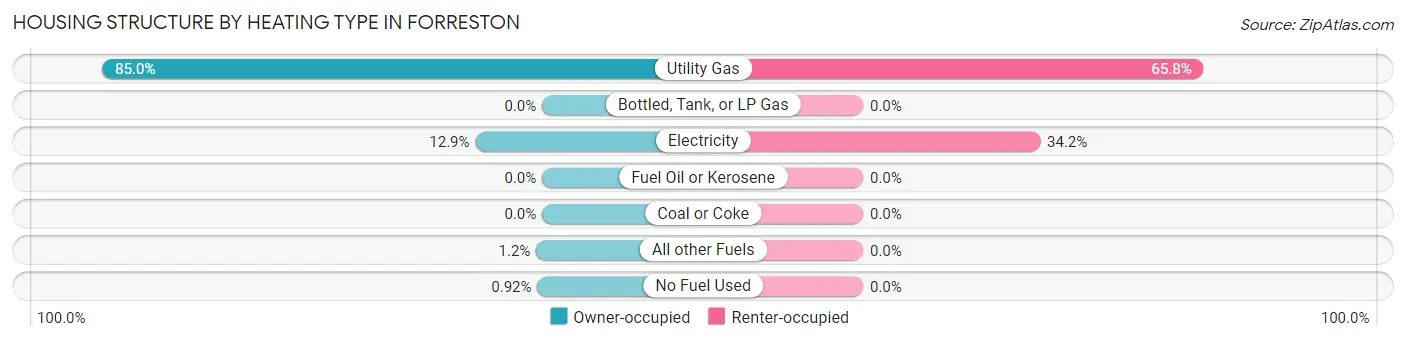
| Heating Type | Owner-occupied | Renter-occupied |
| Utility Gas | 369 (85.0%) | 50 (65.8%) |
| Bottled, Tank, or LP Gas | 0 (0.0%) | 0 (0.0%) |
| Electricity | 56 (12.9%) | 26 (34.2%) |
| Fuel Oil or Kerosene | 0 (0.0%) | 0 (0.0%) |
| Coal or Coke | 0 (0.0%) | 0 (0.0%) |
| All other Fuels | 5 (1.1%) | 0 (0.0%) |
| No Fuel Used | 4 (0.9%) | 0 (0.0%) |
| Total | 434 (100.0%) | 76 (100.0%) |
Household Vehicle Usage in Forreston
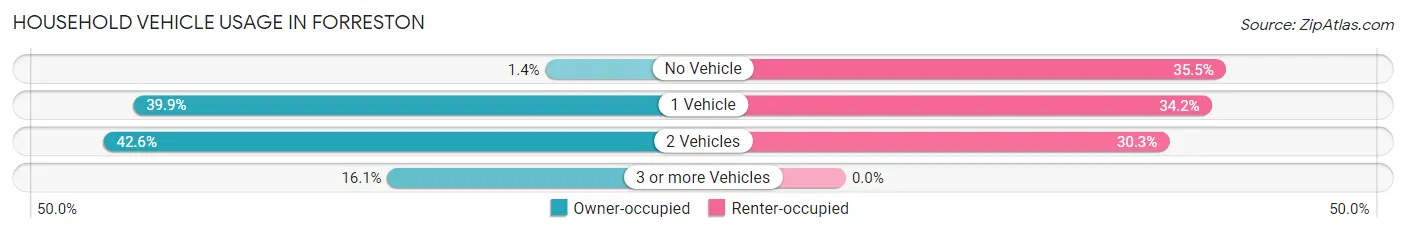
| Vehicles per Household | Owner-occupied | Renter-occupied |
| No Vehicle | 6 (1.4%) | 27 (35.5%) |
| 1 Vehicle | 173 (39.9%) | 26 (34.2%) |
| 2 Vehicles | 185 (42.6%) | 23 (30.3%) |
| 3 or more Vehicles | 70 (16.1%) | 0 (0.0%) |
| Total | 434 (100.0%) | 76 (100.0%) |
Real Estate & Mortgages in Forreston
Real Estate and Mortgage Overview in Forreston
| Characteristic | Without Mortgage | With Mortgage |
| Housing Units | 165 | 269 |
| Median Property Value | $128,200 | $105,600 |
| Median Household Income | $65,402 | $28 |
| Monthly Housing Costs | $487 | $0 |
| Real Estate Taxes | $2,773 | $3 |
Property Value by Mortgage Status in Forreston
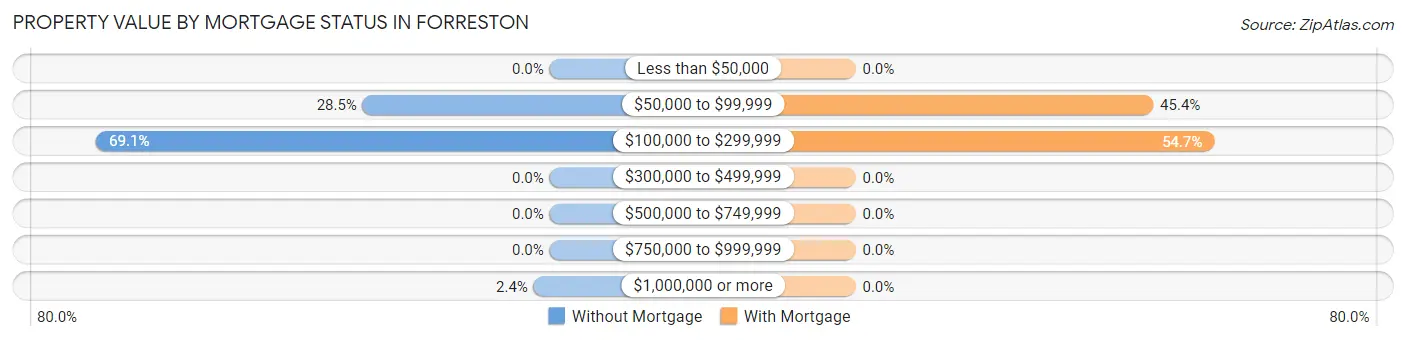
| Property Value | Without Mortgage | With Mortgage |
| Less than $50,000 | 0 (0.0%) | 0 (0.0%) |
| $50,000 to $99,999 | 47 (28.5%) | 122 (45.4%) |
| $100,000 to $299,999 | 114 (69.1%) | 147 (54.6%) |
| $300,000 to $499,999 | 0 (0.0%) | 0 (0.0%) |
| $500,000 to $749,999 | 0 (0.0%) | 0 (0.0%) |
| $750,000 to $999,999 | 0 (0.0%) | 0 (0.0%) |
| $1,000,000 or more | 4 (2.4%) | 0 (0.0%) |
| Total | 165 (100.0%) | 269 (100.0%) |
Household Income by Mortgage Status in Forreston
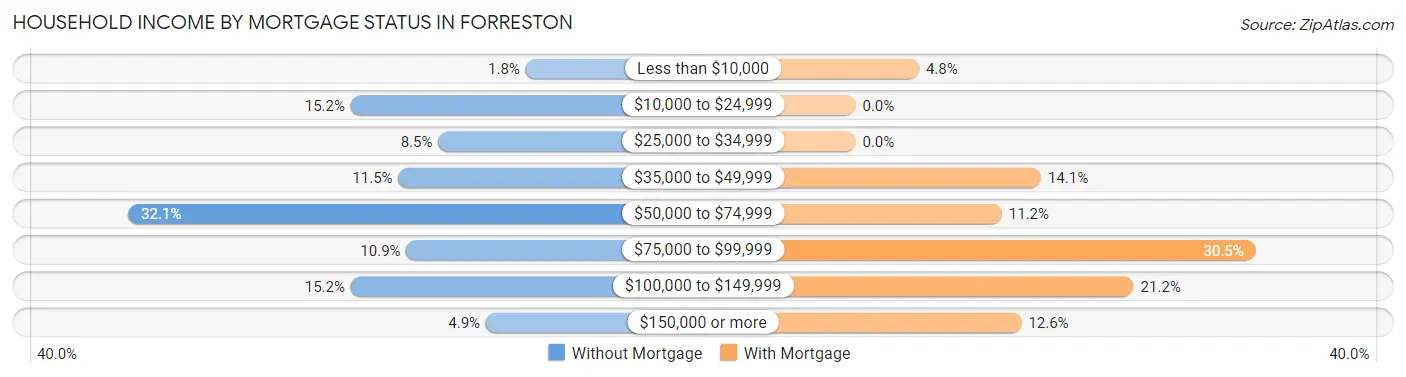
| Household Income | Without Mortgage | With Mortgage |
| Less than $10,000 | 3 (1.8%) | 13 (4.8%) |
| $10,000 to $24,999 | 25 (15.1%) | 0 (0.0%) |
| $25,000 to $34,999 | 14 (8.5%) | 0 (0.0%) |
| $35,000 to $49,999 | 19 (11.5%) | 38 (14.1%) |
| $50,000 to $74,999 | 53 (32.1%) | 30 (11.2%) |
| $75,000 to $99,999 | 18 (10.9%) | 82 (30.5%) |
| $100,000 to $149,999 | 25 (15.1%) | 57 (21.2%) |
| $150,000 or more | 8 (4.9%) | 34 (12.6%) |
| Total | 165 (100.0%) | 269 (100.0%) |
Property Value to Household Income Ratio in Forreston
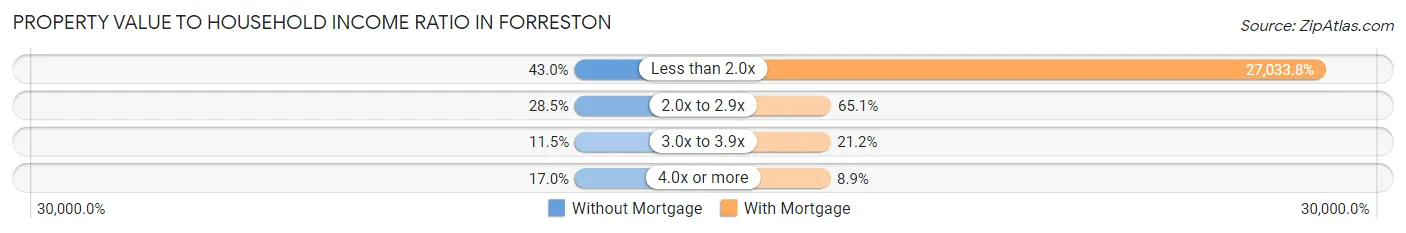
| Value-to-Income Ratio | Without Mortgage | With Mortgage |
| Less than 2.0x | 71 (43.0%) | 72,721 (27,033.8%) |
| 2.0x to 2.9x | 47 (28.5%) | 175 (65.1%) |
| 3.0x to 3.9x | 19 (11.5%) | 57 (21.2%) |
| 4.0x or more | 28 (17.0%) | 24 (8.9%) |
| Total | 165 (100.0%) | 269 (100.0%) |
Real Estate Taxes by Mortgage Status in Forreston
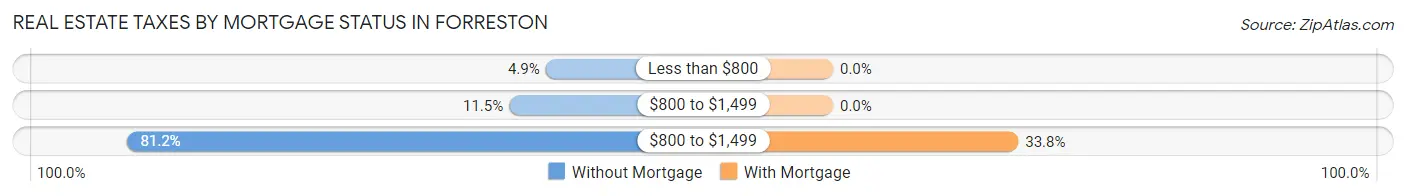
| Property Taxes | Without Mortgage | With Mortgage |
| Less than $800 | 8 (4.9%) | 0 (0.0%) |
| $800 to $1,499 | 19 (11.5%) | 0 (0.0%) |
| $800 to $1,499 | 134 (81.2%) | 91 (33.8%) |
| Total | 165 (100.0%) | 269 (100.0%) |
Health & Disability in Forreston
Health Insurance Coverage by Age in Forreston
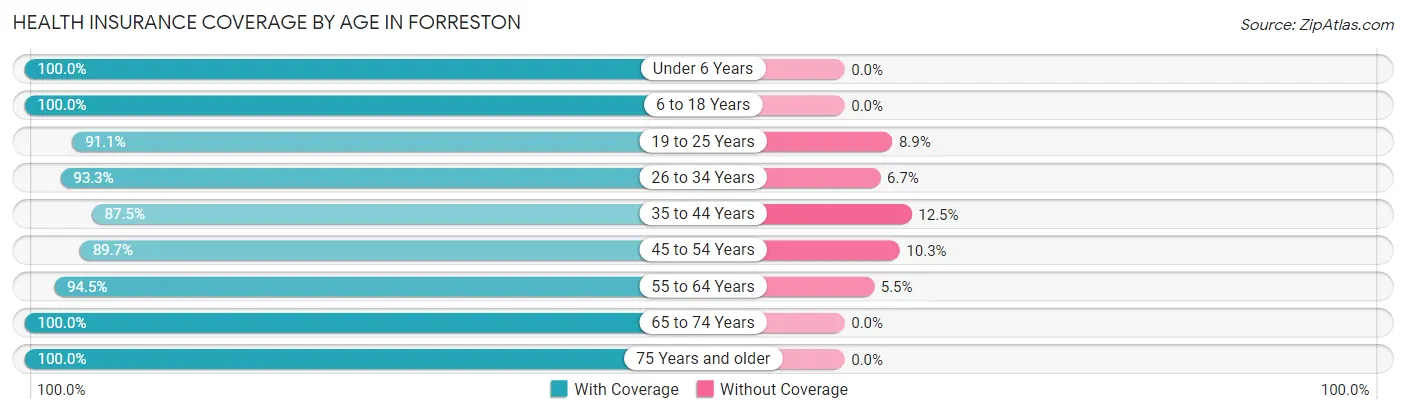
| Age Bracket | With Coverage | Without Coverage |
| Under 6 Years | 40 (100.0%) | 0 (0.0%) |
| 6 to 18 Years | 253 (100.0%) | 0 (0.0%) |
| 19 to 25 Years | 41 (91.1%) | 4 (8.9%) |
| 26 to 34 Years | 126 (93.3%) | 9 (6.7%) |
| 35 to 44 Years | 112 (87.5%) | 16 (12.5%) |
| 45 to 54 Years | 96 (89.7%) | 11 (10.3%) |
| 55 to 64 Years | 189 (94.5%) | 11 (5.5%) |
| 65 to 74 Years | 123 (100.0%) | 0 (0.0%) |
| 75 Years and older | 109 (100.0%) | 0 (0.0%) |
| Total | 1,089 (95.5%) | 51 (4.5%) |
Health Insurance Coverage by Citizenship Status in Forreston
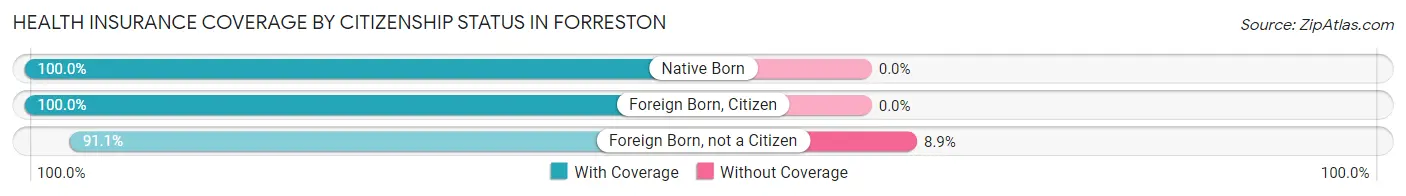
| Citizenship Status | With Coverage | Without Coverage |
| Native Born | 40 (100.0%) | 0 (0.0%) |
| Foreign Born, Citizen | 253 (100.0%) | 0 (0.0%) |
| Foreign Born, not a Citizen | 41 (91.1%) | 4 (8.9%) |
Health Insurance Coverage by Household Income in Forreston
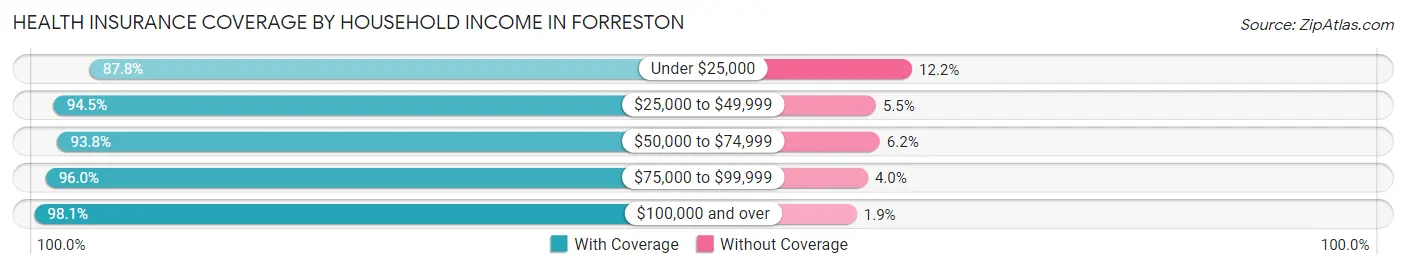
| Household Income | With Coverage | Without Coverage |
| Under $25,000 | 43 (87.8%) | 6 (12.2%) |
| $25,000 to $49,999 | 207 (94.5%) | 12 (5.5%) |
| $50,000 to $74,999 | 257 (93.8%) | 17 (6.2%) |
| $75,000 to $99,999 | 218 (96.0%) | 9 (4.0%) |
| $100,000 and over | 364 (98.1%) | 7 (1.9%) |
Public vs Private Health Insurance Coverage by Age in Forreston
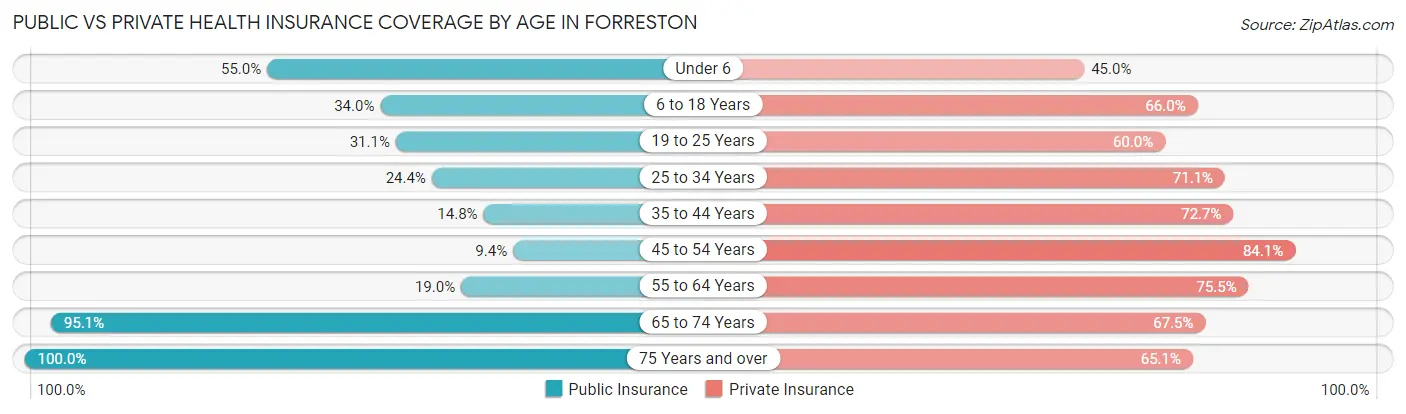
| Age Bracket | Public Insurance | Private Insurance |
| Under 6 | 22 (55.0%) | 18 (45.0%) |
| 6 to 18 Years | 86 (34.0%) | 167 (66.0%) |
| 19 to 25 Years | 14 (31.1%) | 27 (60.0%) |
| 25 to 34 Years | 33 (24.4%) | 96 (71.1%) |
| 35 to 44 Years | 19 (14.8%) | 93 (72.7%) |
| 45 to 54 Years | 10 (9.3%) | 90 (84.1%) |
| 55 to 64 Years | 38 (19.0%) | 151 (75.5%) |
| 65 to 74 Years | 117 (95.1%) | 83 (67.5%) |
| 75 Years and over | 109 (100.0%) | 71 (65.1%) |
| Total | 448 (39.3%) | 796 (69.8%) |
Disability Status by Sex by Age in Forreston
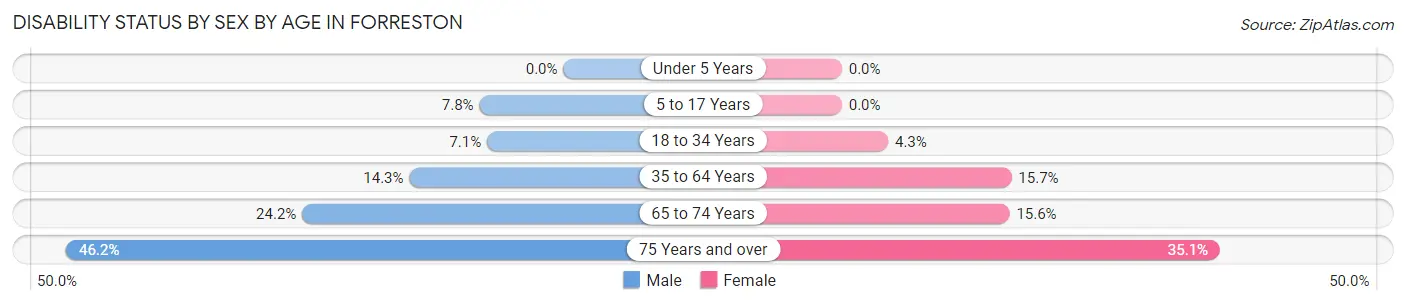
| Age Bracket | Male | Female |
| Under 5 Years | 0 (0.0%) | 0 (0.0%) |
| 5 to 17 Years | 12 (7.8%) | 0 (0.0%) |
| 18 to 34 Years | 8 (7.1%) | 3 (4.3%) |
| 35 to 64 Years | 34 (14.3%) | 31 (15.7%) |
| 65 to 74 Years | 8 (24.2%) | 14 (15.6%) |
| 75 Years and over | 24 (46.2%) | 20 (35.1%) |
Disability Class by Sex by Age in Forreston
Disability Class: Hearing Difficulty
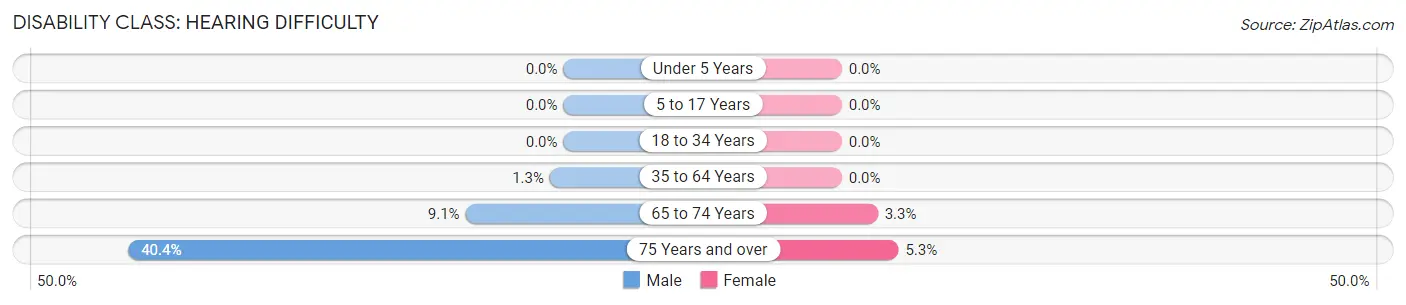
| Age Bracket | Male | Female |
| Under 5 Years | 0 (0.0%) | 0 (0.0%) |
| 5 to 17 Years | 0 (0.0%) | 0 (0.0%) |
| 18 to 34 Years | 0 (0.0%) | 0 (0.0%) |
| 35 to 64 Years | 3 (1.3%) | 0 (0.0%) |
| 65 to 74 Years | 3 (9.1%) | 3 (3.3%) |
| 75 Years and over | 21 (40.4%) | 3 (5.3%) |
Disability Class: Vision Difficulty
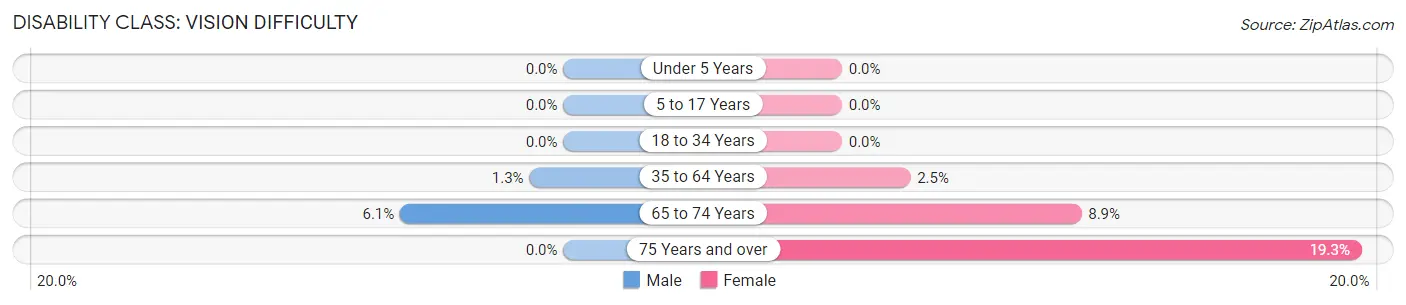
| Age Bracket | Male | Female |
| Under 5 Years | 0 (0.0%) | 0 (0.0%) |
| 5 to 17 Years | 0 (0.0%) | 0 (0.0%) |
| 18 to 34 Years | 0 (0.0%) | 0 (0.0%) |
| 35 to 64 Years | 3 (1.3%) | 5 (2.5%) |
| 65 to 74 Years | 2 (6.1%) | 8 (8.9%) |
| 75 Years and over | 0 (0.0%) | 11 (19.3%) |
Disability Class: Cognitive Difficulty
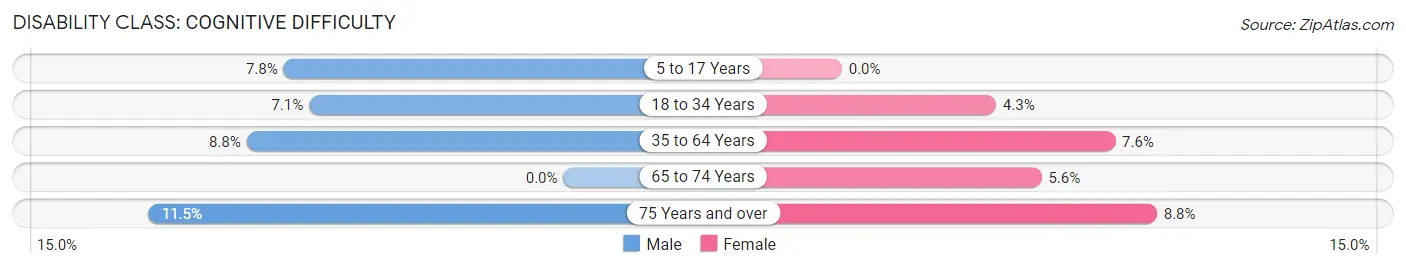
| Age Bracket | Male | Female |
| 5 to 17 Years | 12 (7.8%) | 0 (0.0%) |
| 18 to 34 Years | 8 (7.1%) | 3 (4.3%) |
| 35 to 64 Years | 21 (8.8%) | 15 (7.6%) |
| 65 to 74 Years | 0 (0.0%) | 5 (5.6%) |
| 75 Years and over | 6 (11.5%) | 5 (8.8%) |
Disability Class: Ambulatory Difficulty
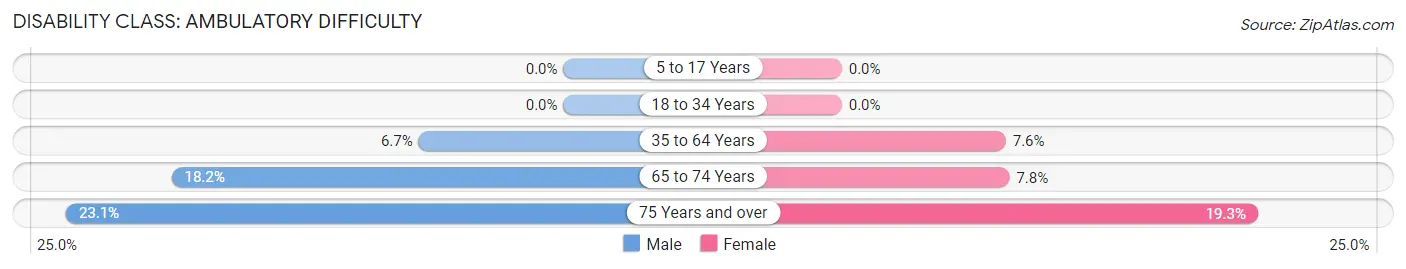
| Age Bracket | Male | Female |
| 5 to 17 Years | 0 (0.0%) | 0 (0.0%) |
| 18 to 34 Years | 0 (0.0%) | 0 (0.0%) |
| 35 to 64 Years | 16 (6.7%) | 15 (7.6%) |
| 65 to 74 Years | 6 (18.2%) | 7 (7.8%) |
| 75 Years and over | 12 (23.1%) | 11 (19.3%) |
Disability Class: Self-Care Difficulty
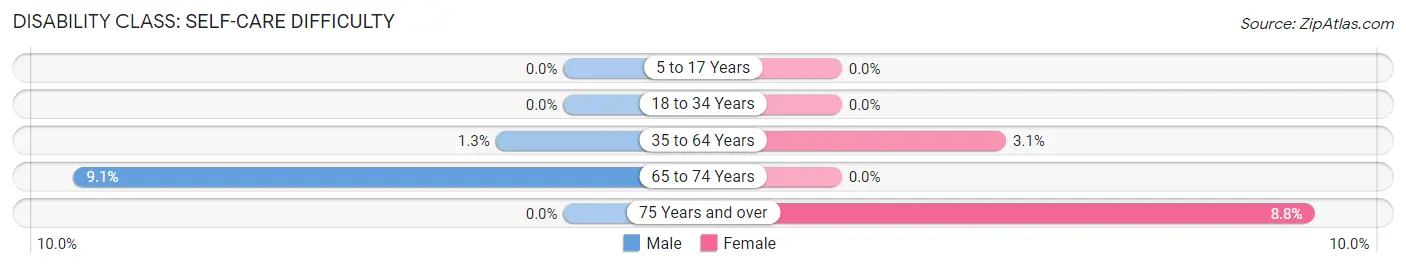
| Age Bracket | Male | Female |
| 5 to 17 Years | 0 (0.0%) | 0 (0.0%) |
| 18 to 34 Years | 0 (0.0%) | 0 (0.0%) |
| 35 to 64 Years | 3 (1.3%) | 6 (3.0%) |
| 65 to 74 Years | 3 (9.1%) | 0 (0.0%) |
| 75 Years and over | 0 (0.0%) | 5 (8.8%) |
Technology Access in Forreston
Computing Device Access in Forreston
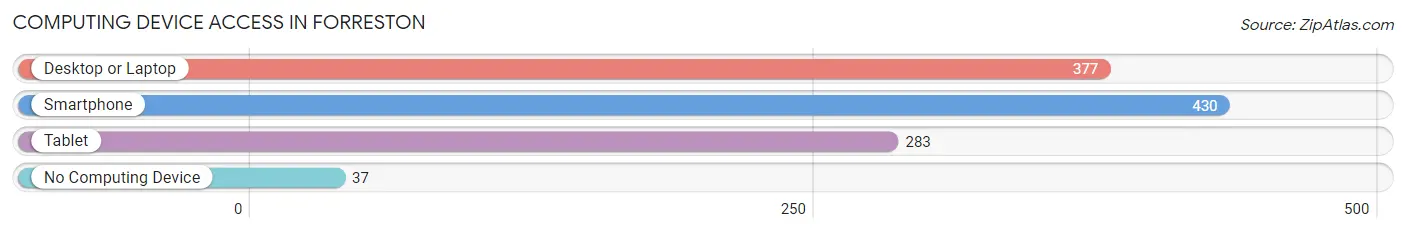
| Device Type | # Households | % Households |
| Desktop or Laptop | 377 | 73.9% |
| Smartphone | 430 | 84.3% |
| Tablet | 283 | 55.5% |
| No Computing Device | 37 | 7.2% |
| Total | 510 | 100.0% |
Internet Access in Forreston
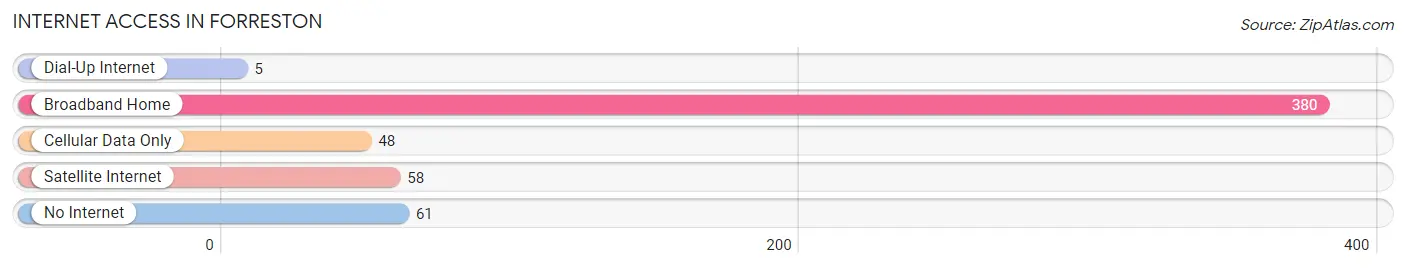
| Internet Type | # Households | % Households |
| Dial-Up Internet | 5 | 1.0% |
| Broadband Home | 380 | 74.5% |
| Cellular Data Only | 48 | 9.4% |
| Satellite Internet | 58 | 11.4% |
| No Internet | 61 | 12.0% |
| Total | 510 | 100.0% |
Forreston Summary
Forreston, Illinois is a small village located in Ogle County, Illinois. It is situated in the northwest corner of the state, approximately 80 miles west of Chicago. The village has a population of 1,072 people, according to the 2010 census.
History
Forreston was founded in 1854 by William Forrest, a settler from Ohio. He purchased the land from the government and began to build a small village. The village was named after him and was incorporated in 1858.
In the late 19th century, Forreston was a thriving agricultural community. It was home to several grain elevators, a creamery, a cheese factory, and a flour mill. The village also had a railroad station, which connected it to the larger cities of Chicago and Rockford.
In the early 20th century, the village began to decline. The railroad station closed in the 1920s and the grain elevators and other businesses followed suit. The population of the village began to decline as well, and by the 1950s, the population had dropped to just over 500 people.
Geography
Forreston is located in the northwest corner of Ogle County, Illinois. It is situated on the banks of the Pecatonica River, which flows through the village. The village is surrounded by rolling hills and farmland.
The village is located approximately 80 miles west of Chicago and is accessible by car via Interstate 39. The nearest major airport is Chicago O'Hare International Airport, which is located approximately 90 miles away.
Economy
Forreston's economy is largely based on agriculture. The village is home to several farms, which produce corn, soybeans, and other crops. The village also has a few small businesses, including a grocery store, a hardware store, and a few restaurants.
The village is also home to a few manufacturing companies, including a plastics manufacturer and a metal fabrication company. These companies provide employment for many of the village's residents.
Demographics
According to the 2010 census, the population of Forreston is 1,072 people. The village is predominantly white, with 95.3% of the population identifying as white. The remaining 4.7% of the population is made up of African Americans, Hispanics, and other ethnicities.
The median household income in Forreston is $50,000, which is slightly lower than the national average. The median age of the village's residents is 43.7 years, which is slightly higher than the national average.
Conclusion
Forreston, Illinois is a small village located in Ogle County, Illinois. It is situated in the northwest corner of the state, approximately 80 miles west of Chicago. The village has a population of 1,072 people, according to the 2010 census. The village's economy is largely based on agriculture, with several farms producing corn, soybeans, and other crops. The village also has a few small businesses, including a grocery store, a hardware store, and a few restaurants. The median household income in Forreston is $50,000, which is slightly lower than the national average. The median age of the village's residents is 43.7 years, which is slightly higher than the national average.
Common Questions
What is Per Capita Income in Forreston?
Per Capita income in Forreston is $31,949.
What is the Median Family Income in Forreston?
Median Family Income in Forreston is $82,250.
What is the Median Household income in Forreston?
Median Household Income in Forreston is $65,179.
What is Income or Wage Gap in Forreston?
Income or Wage Gap in Forreston is 47.6%.
Women in Forreston earn 52.4 cents for every dollar earned by a man.
What is Inequality or Gini Index in Forreston?
Inequality or Gini Index in Forreston is 0.33.
What is the Total Population of Forreston?
Total Population of Forreston is 1,140.
What is the Total Male Population of Forreston?
Total Male Population of Forreston is 605.
What is the Total Female Population of Forreston?
Total Female Population of Forreston is 535.
What is the Ratio of Males per 100 Females in Forreston?
There are 113.08 Males per 100 Females in Forreston.
What is the Ratio of Females per 100 Males in Forreston?
There are 88.43 Females per 100 Males in Forreston.
What is the Median Population Age in Forreston?
Median Population Age in Forreston is 41.9 Years.
What is the Average Family Size in Forreston
Average Family Size in Forreston is 3.1 People.
What is the Average Household Size in Forreston
Average Household Size in Forreston is 2.2 People.
How Large is the Labor Force in Forreston?
There are 523 People in the Labor Forcein in Forreston.
What is the Percentage of People in the Labor Force in Forreston?
58.4% of People are in the Labor Force in Forreston.
What is the Unemployment Rate in Forreston?
Unemployment Rate in Forreston is 2.9%.