Findlay, IL Map & Demographics
Findlay Map
Findlay Overview
$28,253
PER CAPITA INCOME
$59,479
AVG FAMILY INCOME
$54,205
AVG HOUSEHOLD INCOME
56.3%
WAGE / INCOME GAP [ % ]
43.7¢/ $1
WAGE / INCOME GAP [ $ ]
0.41
INEQUALITY / GINI INDEX
697
TOTAL POPULATION
337
MALE POPULATION
360
FEMALE POPULATION
93.61
MALES / 100 FEMALES
106.82
FEMALES / 100 MALES
38.9
MEDIAN AGE
2.8
AVG FAMILY SIZE
2.4
AVG HOUSEHOLD SIZE
371
LABOR FORCE [ PEOPLE ]
65.3%
PERCENT IN LABOR FORCE
5.1%
UNEMPLOYMENT RATE
Findlay Zip Codes
Findlay Area Codes
Income in Findlay
Income Overview in Findlay
Per Capita Income in Findlay is $28,253, while median incomes of families and households are $59,479 and $54,205 respectively.
| Characteristic | Number | Measure |
| Per Capita Income | 697 | $28,253 |
| Median Family Income | 183 | $59,479 |
| Mean Family Income | 183 | $77,926 |
| Median Household Income | 295 | $54,205 |
| Mean Household Income | 295 | $65,422 |
| Income Deficit | 183 | $0 |
| Wage / Income Gap (%) | 697 | 56.26% |
| Wage / Income Gap ($) | 697 | 43.74¢ per $1 |
| Gini / Inequality Index | 697 | 0.41 |
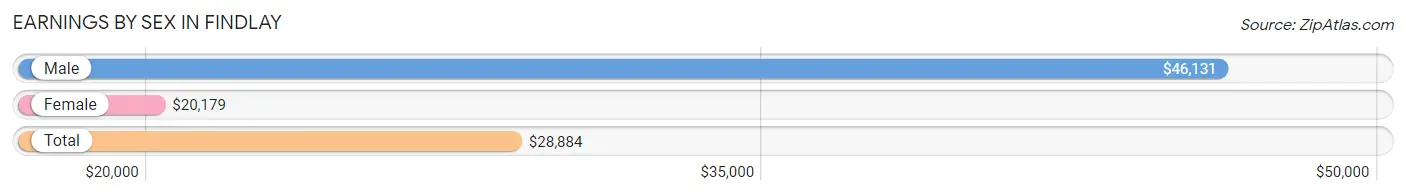
Earnings by Sex in Findlay
Average Earnings in Findlay are $28,884, $46,131 for men and $20,179 for women, a difference of 56.3%.
| Sex | Number | Average Earnings |
| Male | 193 (50.9%) | $46,131 |
| Female | 186 (49.1%) | $20,179 |
| Total | 379 (100.0%) | $28,884 |
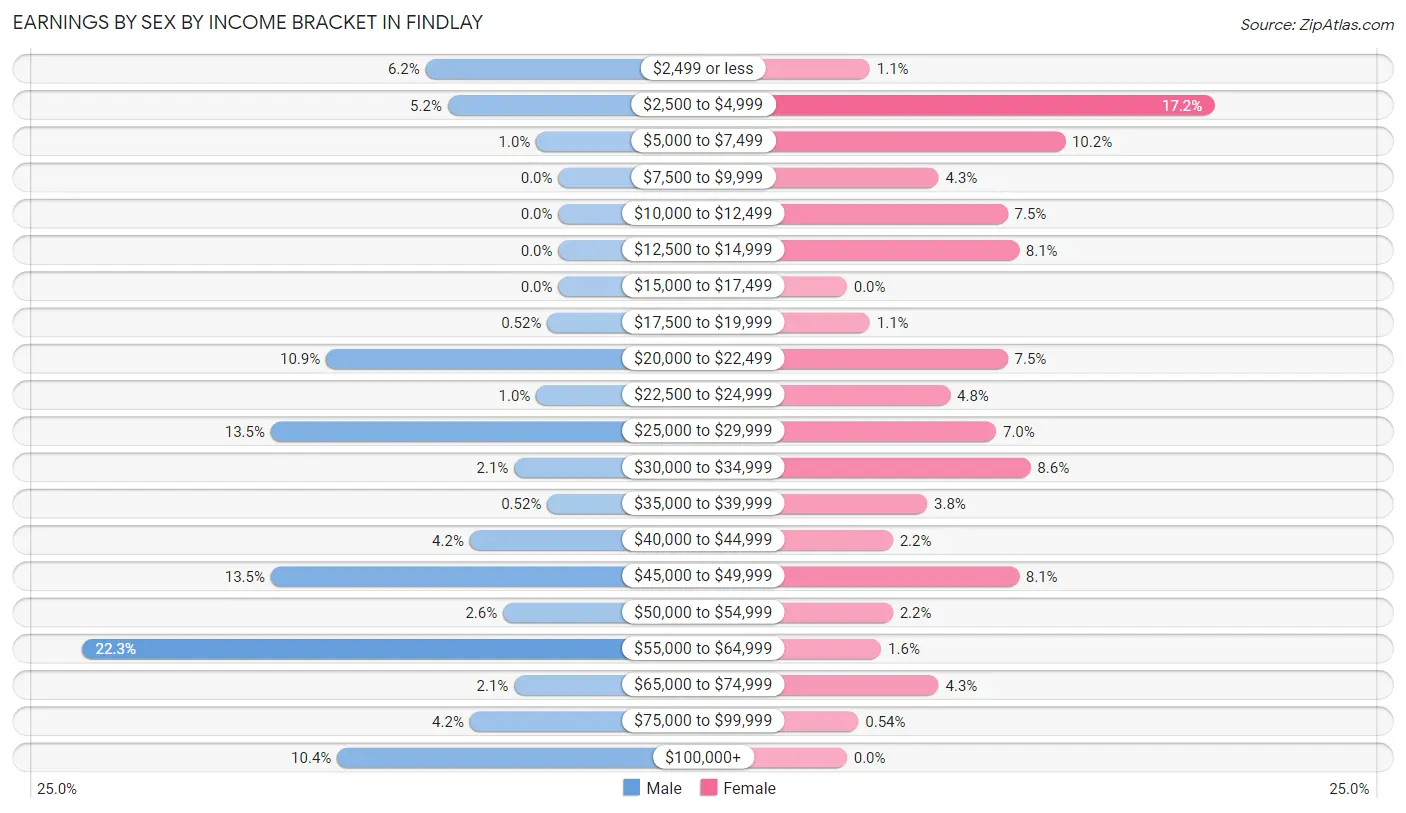
Earnings by Sex by Income Bracket in Findlay
The most common earnings brackets in Findlay are $55,000 to $64,999 for men (43 | 22.3%) and $2,500 to $4,999 for women (32 | 17.2%).
| Income | Male | Female |
| $2,499 or less | 12 (6.2%) | 2 (1.1%) |
| $2,500 to $4,999 | 10 (5.2%) | 32 (17.2%) |
| $5,000 to $7,499 | 2 (1.0%) | 19 (10.2%) |
| $7,500 to $9,999 | 0 (0.0%) | 8 (4.3%) |
| $10,000 to $12,499 | 0 (0.0%) | 14 (7.5%) |
| $12,500 to $14,999 | 0 (0.0%) | 15 (8.1%) |
| $15,000 to $17,499 | 0 (0.0%) | 0 (0.0%) |
| $17,500 to $19,999 | 1 (0.5%) | 2 (1.1%) |
| $20,000 to $22,499 | 21 (10.9%) | 14 (7.5%) |
| $22,500 to $24,999 | 2 (1.0%) | 9 (4.8%) |
| $25,000 to $29,999 | 26 (13.5%) | 13 (7.0%) |
| $30,000 to $34,999 | 4 (2.1%) | 16 (8.6%) |
| $35,000 to $39,999 | 1 (0.5%) | 7 (3.8%) |
| $40,000 to $44,999 | 8 (4.2%) | 4 (2.1%) |
| $45,000 to $49,999 | 26 (13.5%) | 15 (8.1%) |
| $50,000 to $54,999 | 5 (2.6%) | 4 (2.1%) |
| $55,000 to $64,999 | 43 (22.3%) | 3 (1.6%) |
| $65,000 to $74,999 | 4 (2.1%) | 8 (4.3%) |
| $75,000 to $99,999 | 8 (4.2%) | 1 (0.5%) |
| $100,000+ | 20 (10.4%) | 0 (0.0%) |
| Total | 193 (100.0%) | 186 (100.0%) |
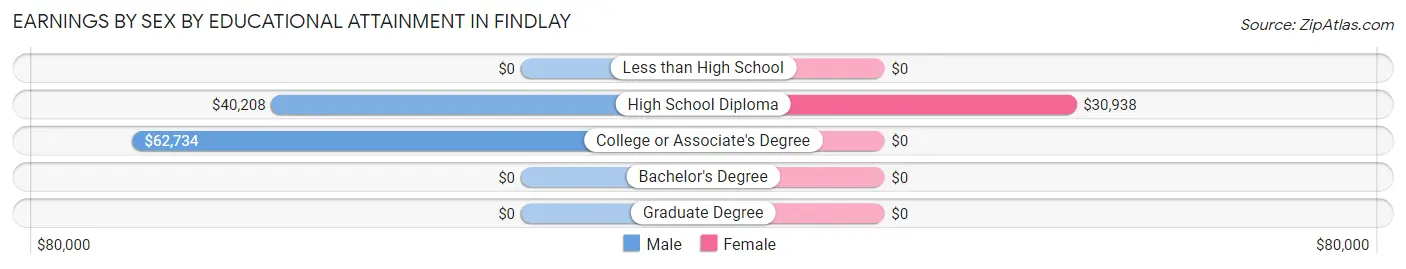
Earnings by Sex by Educational Attainment in Findlay
Average earnings in Findlay are $48,500 for men and $22,232 for women, a difference of 54.2%. Men with an educational attainment of college or associate's degree enjoy the highest average annual earnings of $62,734, while those with high school diploma education earn the least with $40,208. Women with an educational attainment of high school diploma earn the most with the average annual earnings of $30,938, while those with high school diploma education have the smallest earnings of $30,938.
| Educational Attainment | Male Income | Female Income |
| Less than High School | - | - |
| High School Diploma | $40,208 | $30,938 |
| College or Associate's Degree | $62,734 | $0 |
| Bachelor's Degree | - | - |
| Graduate Degree | - | - |
| Total | $48,500 | $22,232 |
Family Income in Findlay
Family Income Brackets in Findlay
According to the Findlay family income data, there are 61 families falling into the $50,000 to $74,999 income range, which is the most common income bracket and makes up 33.3% of all families.
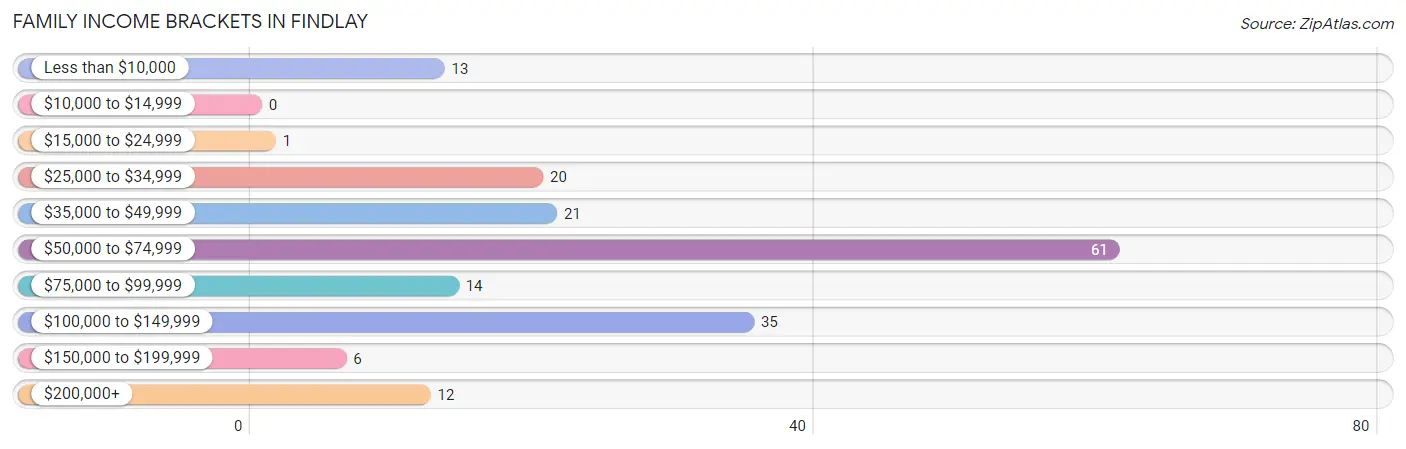
| Income Bracket | # Families | % Families |
| Less than $10,000 | 13 | 7.1% |
| $10,000 to $14,999 | 0 | 0.0% |
| $15,000 to $24,999 | 1 | 0.5% |
| $25,000 to $34,999 | 20 | 10.9% |
| $35,000 to $49,999 | 21 | 11.5% |
| $50,000 to $74,999 | 61 | 33.3% |
| $75,000 to $99,999 | 14 | 7.7% |
| $100,000 to $149,999 | 35 | 19.1% |
| $150,000 to $199,999 | 6 | 3.3% |
| $200,000+ | 12 | 6.6% |
Family Income by Famaliy Size in Findlay
2-person families (110 | 60.1%) account for the highest median family income in Findlay with $58,542 per family, while 2-person families (110 | 60.1%) have the highest median income of $29,271 per family member.
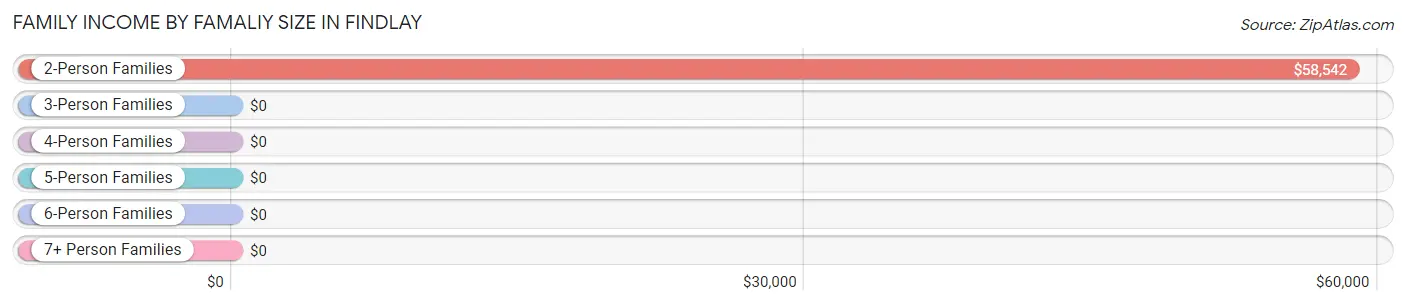
| Income Bracket | # Families | Median Income |
| 2-Person Families | 110 (60.1%) | $58,542 |
| 3-Person Families | 22 (12.0%) | $0 |
| 4-Person Families | 43 (23.5%) | $0 |
| 5-Person Families | 3 (1.6%) | $0 |
| 6-Person Families | 5 (2.7%) | $0 |
| 7+ Person Families | 0 (0.0%) | $0 |
| Total | 183 (100.0%) | $59,479 |
Family Income by Number of Earners in Findlay
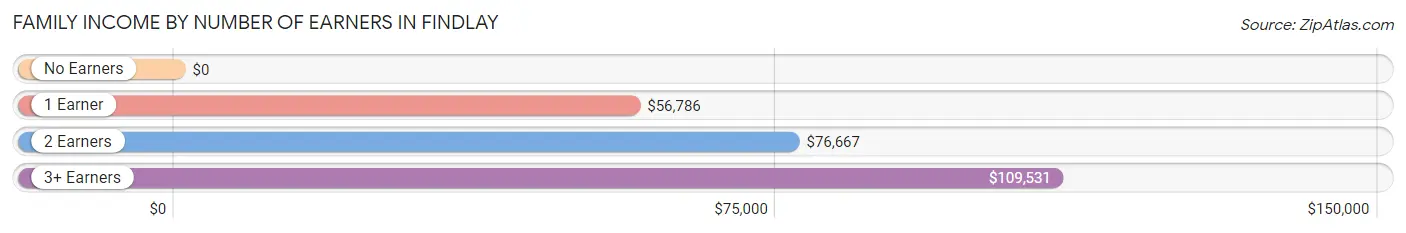
| Number of Earners | # Families | Median Income |
| No Earners | 32 (17.5%) | $0 |
| 1 Earner | 70 (38.3%) | $56,786 |
| 2 Earners | 54 (29.5%) | $76,667 |
| 3+ Earners | 27 (14.7%) | $109,531 |
| Total | 183 (100.0%) | $59,479 |
Household Income in Findlay
Household Income Brackets in Findlay
With 62 households falling in the category, the $50,000 to $74,999 income range is the most frequent in Findlay, accounting for 21.0% of all households. In contrast, only 6 households (2.0%) fall into the $150,000 to $199,999 income bracket, making it the least populous group.
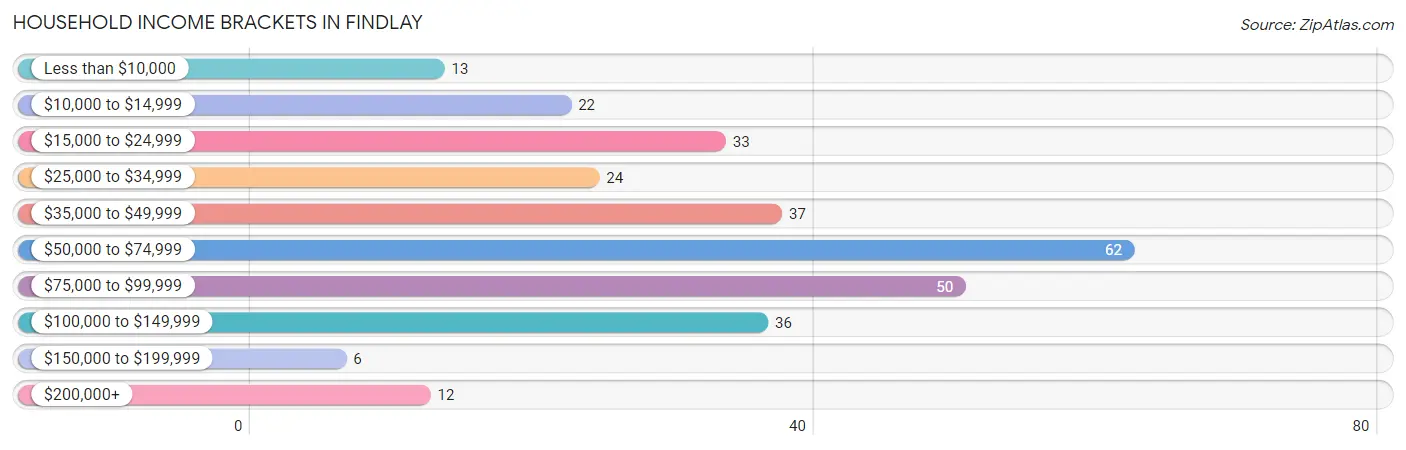
| Income Bracket | # Households | % Households |
| Less than $10,000 | 13 | 4.4% |
| $10,000 to $14,999 | 22 | 7.5% |
| $15,000 to $24,999 | 33 | 11.2% |
| $25,000 to $34,999 | 24 | 8.1% |
| $35,000 to $49,999 | 37 | 12.5% |
| $50,000 to $74,999 | 62 | 21.0% |
| $75,000 to $99,999 | 50 | 16.9% |
| $100,000 to $149,999 | 36 | 12.2% |
| $150,000 to $199,999 | 6 | 2.0% |
| $200,000+ | 12 | 4.1% |
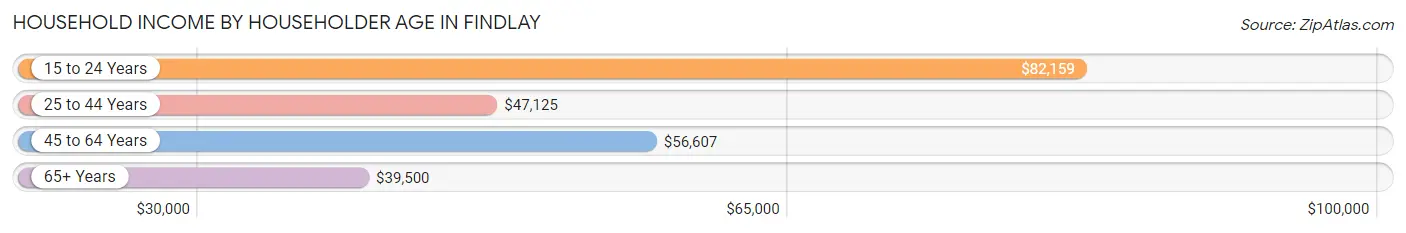
Household Income by Householder Age in Findlay
The median household income in Findlay is $54,205, with the highest median household income of $82,159 found in the 15 to 24 years age bracket for the primary householder. A total of 27 households (9.1%) fall into this category. Meanwhile, the 65+ years age bracket for the primary householder has the lowest median household income of $39,500, with 96 households (32.5%) in this group.
| Income Bracket | # Households | Median Income |
| 15 to 24 Years | 27 (9.1%) | $82,159 |
| 25 to 44 Years | 61 (20.7%) | $47,125 |
| 45 to 64 Years | 111 (37.6%) | $56,607 |
| 65+ Years | 96 (32.5%) | $39,500 |
| Total | 295 (100.0%) | $54,205 |
Poverty in Findlay
Income Below Poverty by Sex and Age in Findlay
With 19.0% poverty level for males and 24.6% for females among the residents of Findlay, 6 to 11 year old males and under 5 year old females are the most vulnerable to poverty, with 12 males (100.0%) and 22 females (68.8%) in their respective age groups living below the poverty level.
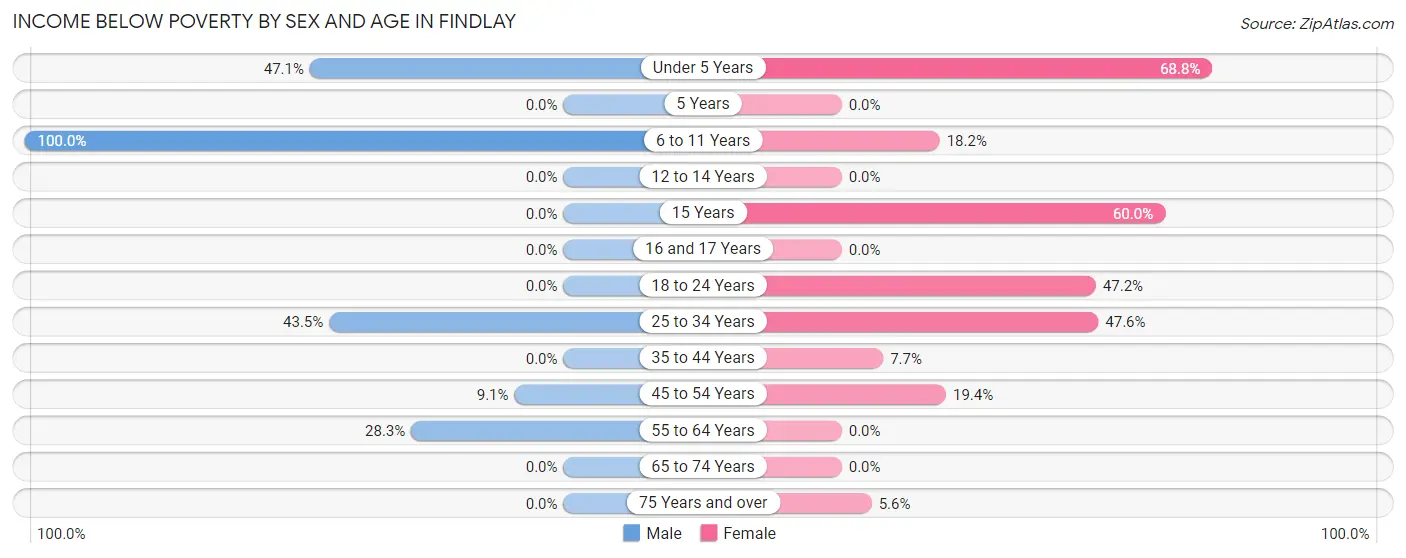
| Age Bracket | Male | Female |
| Under 5 Years | 16 (47.1%) | 22 (68.8%) |
| 5 Years | 0 (0.0%) | 0 (0.0%) |
| 6 to 11 Years | 12 (100.0%) | 2 (18.2%) |
| 12 to 14 Years | 0 (0.0%) | 0 (0.0%) |
| 15 Years | 0 (0.0%) | 3 (60.0%) |
| 16 and 17 Years | 0 (0.0%) | 0 (0.0%) |
| 18 to 24 Years | 0 (0.0%) | 25 (47.2%) |
| 25 to 34 Years | 20 (43.5%) | 20 (47.6%) |
| 35 to 44 Years | 0 (0.0%) | 2 (7.7%) |
| 45 to 54 Years | 3 (9.1%) | 12 (19.4%) |
| 55 to 64 Years | 13 (28.3%) | 0 (0.0%) |
| 65 to 74 Years | 0 (0.0%) | 0 (0.0%) |
| 75 Years and over | 0 (0.0%) | 2 (5.6%) |
| Total | 64 (19.0%) | 88 (24.6%) |
Income Above Poverty by Sex and Age in Findlay
According to the poverty statistics in Findlay, males aged 12 to 14 years and females aged 5 years are the age groups that are most secure financially, with 100.0% of males and 100.0% of females in these age groups living above the poverty line.
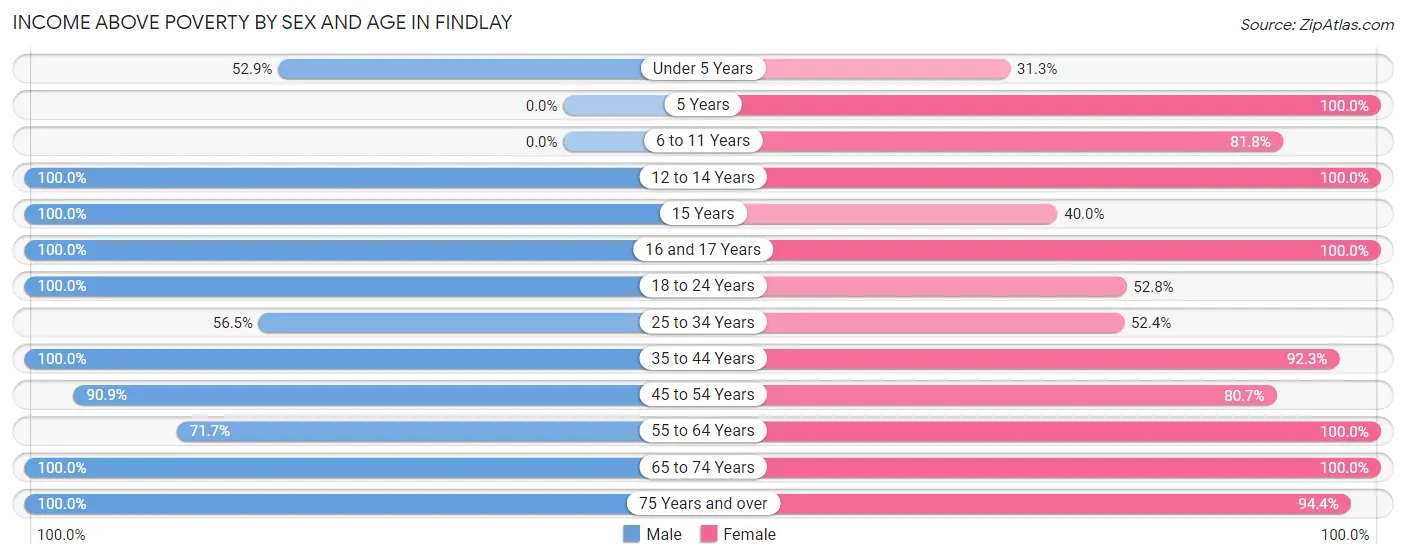
| Age Bracket | Male | Female |
| Under 5 Years | 18 (52.9%) | 10 (31.2%) |
| 5 Years | 0 (0.0%) | 7 (100.0%) |
| 6 to 11 Years | 0 (0.0%) | 9 (81.8%) |
| 12 to 14 Years | 10 (100.0%) | 12 (100.0%) |
| 15 Years | 3 (100.0%) | 2 (40.0%) |
| 16 and 17 Years | 8 (100.0%) | 9 (100.0%) |
| 18 to 24 Years | 47 (100.0%) | 28 (52.8%) |
| 25 to 34 Years | 26 (56.5%) | 22 (52.4%) |
| 35 to 44 Years | 18 (100.0%) | 24 (92.3%) |
| 45 to 54 Years | 30 (90.9%) | 50 (80.6%) |
| 55 to 64 Years | 33 (71.7%) | 36 (100.0%) |
| 65 to 74 Years | 56 (100.0%) | 26 (100.0%) |
| 75 Years and over | 24 (100.0%) | 34 (94.4%) |
| Total | 273 (81.0%) | 269 (75.3%) |
Income Below Poverty Among Married-Couple Families in Findlay
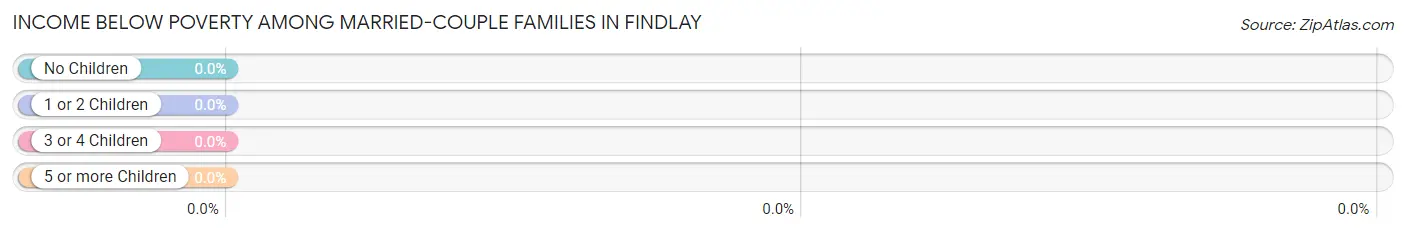
| Children | Above Poverty | Below Poverty |
| No Children | 87 (100.0%) | 0 (0.0%) |
| 1 or 2 Children | 27 (100.0%) | 0 (0.0%) |
| 3 or 4 Children | 6 (100.0%) | 0 (0.0%) |
| 5 or more Children | 0 (0.0%) | 0 (0.0%) |
| Total | 120 (100.0%) | 0 (0.0%) |
Income Below Poverty Among Single-Parent Households in Findlay
According to the poverty data in Findlay, 60.6% or 20 single-father households and 33.3% or 10 single-mother households are living below the poverty line. Among single-father households, those with 3 or 4 children have the highest poverty rate, with 17 households (100.0%) experiencing poverty. Likewise, among single-mother households, those with no children have the highest poverty rate, with 8 households (53.3%) falling below the poverty line.
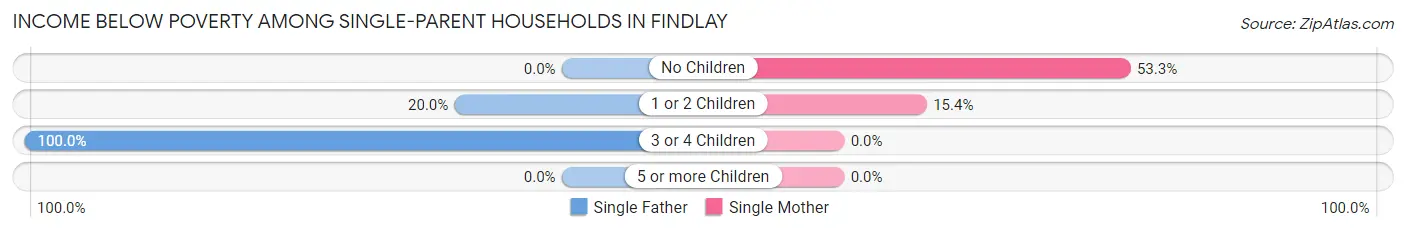
| Children | Single Father | Single Mother |
| No Children | 0 (0.0%) | 8 (53.3%) |
| 1 or 2 Children | 3 (20.0%) | 2 (15.4%) |
| 3 or 4 Children | 17 (100.0%) | 0 (0.0%) |
| 5 or more Children | 0 (0.0%) | 0 (0.0%) |
| Total | 20 (60.6%) | 10 (33.3%) |
Income Below Poverty Among Married-Couple vs Single-Parent Households in Findlay
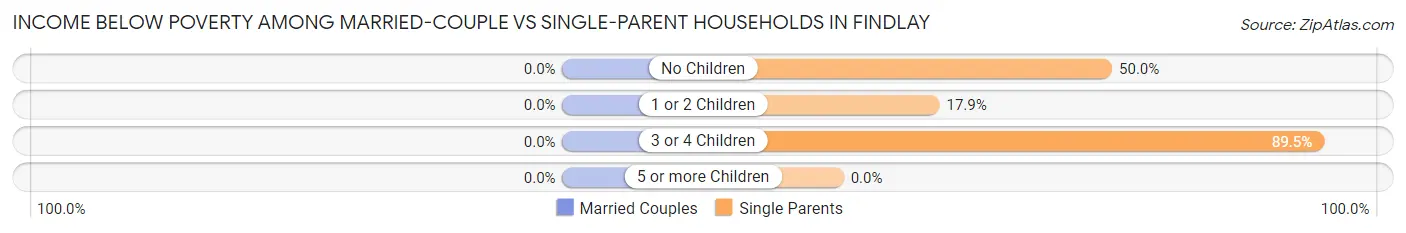
| Children | Married-Couple Families | Single-Parent Households |
| No Children | 0 (0.0%) | 8 (50.0%) |
| 1 or 2 Children | 0 (0.0%) | 5 (17.9%) |
| 3 or 4 Children | 0 (0.0%) | 17 (89.5%) |
| 5 or more Children | 0 (0.0%) | 0 (0.0%) |
| Total | 0 (0.0%) | 30 (47.6%) |
Race in Findlay
The most populous races in Findlay are White / Caucasian (671 | 96.3%), Hispanic or Latino (15 | 2.1%), and Asian (11 | 1.6%).
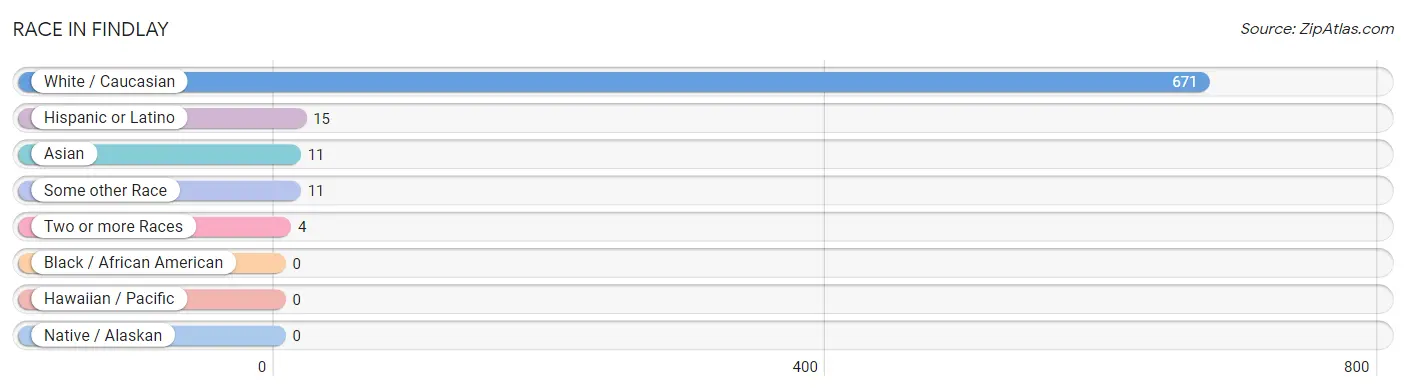
| Race | # Population | % Population |
| Asian | 11 | 1.6% |
| Black / African American | 0 | 0.0% |
| Hawaiian / Pacific | 0 | 0.0% |
| Hispanic or Latino | 15 | 2.1% |
| Native / Alaskan | 0 | 0.0% |
| White / Caucasian | 671 | 96.3% |
| Two or more Races | 4 | 0.6% |
| Some other Race | 11 | 1.6% |
| Total | 697 | 100.0% |
Ancestry in Findlay
The most populous ancestries reported in Findlay are German (151 | 21.7%), English (102 | 14.6%), American (75 | 10.8%), Irish (71 | 10.2%), and French (33 | 4.7%), together accounting for 62.0% of all Findlay residents.
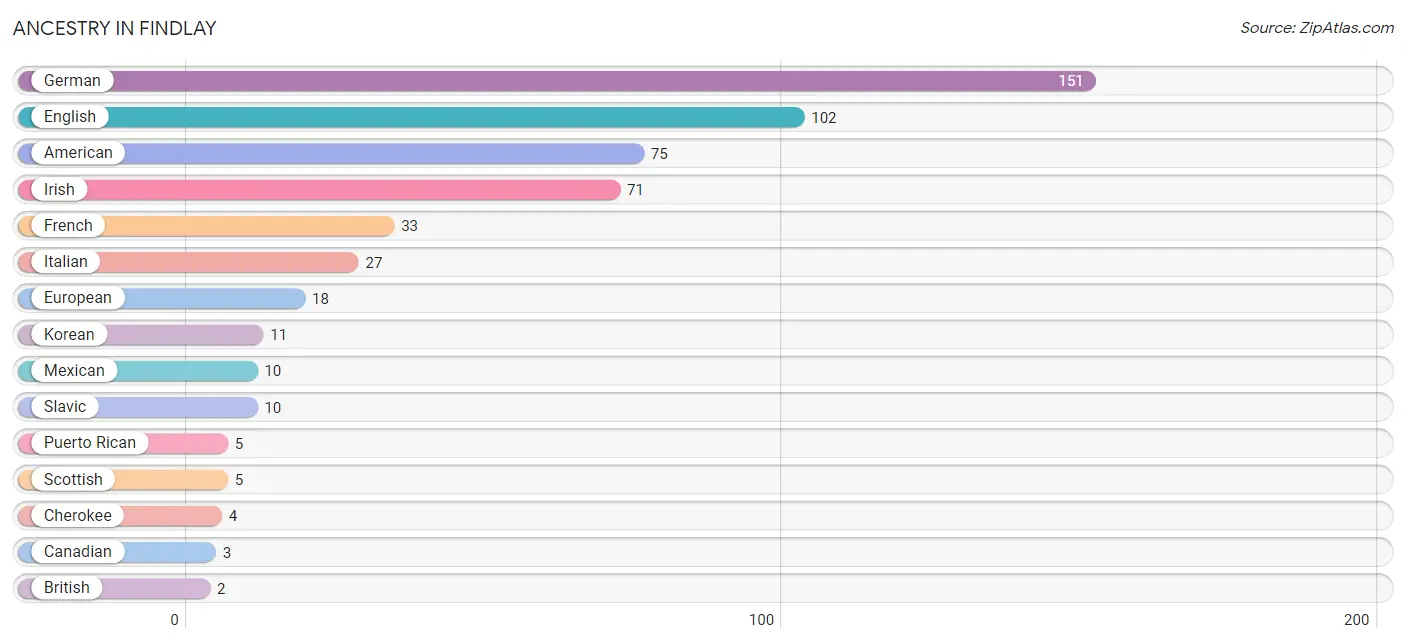
| Ancestry | # Population | % Population |
| American | 75 | 10.8% |
| British | 2 | 0.3% |
| Canadian | 3 | 0.4% |
| Cherokee | 4 | 0.6% |
| Dutch | 1 | 0.1% |
| English | 102 | 14.6% |
| European | 18 | 2.6% |
| French | 33 | 4.7% |
| German | 151 | 21.7% |
| Irish | 71 | 10.2% |
| Italian | 27 | 3.9% |
| Korean | 11 | 1.6% |
| Mexican | 10 | 1.4% |
| Norwegian | 2 | 0.3% |
| Puerto Rican | 5 | 0.7% |
| Scotch-Irish | 2 | 0.3% |
| Scottish | 5 | 0.7% |
| Slavic | 10 | 1.4% |
| Swedish | 2 | 0.3% | View All 19 Rows |
Immigrants in Findlay
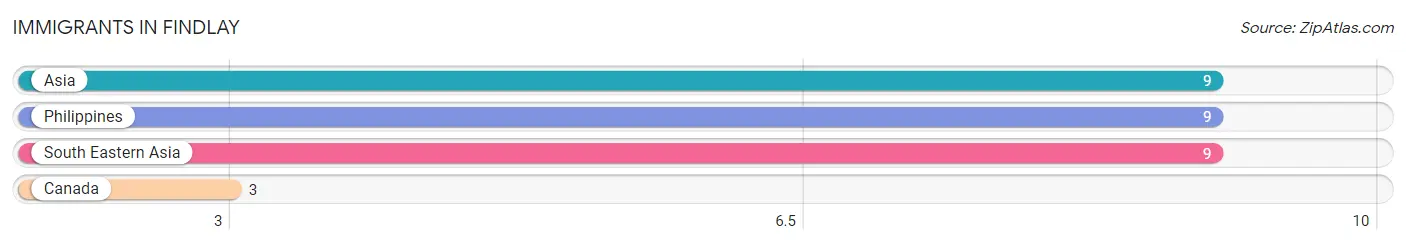
The most numerous immigrant groups reported in Findlay came from Asia (9 | 1.3%), Philippines (9 | 1.3%), South Eastern Asia (9 | 1.3%), and Canada (3 | 0.4%), together accounting for 4.3% of all Findlay residents.
| Immigration Origin | # Population | % Population |
| Asia | 9 | 1.3% |
| Canada | 3 | 0.4% |
| Philippines | 9 | 1.3% |
| South Eastern Asia | 9 | 1.3% | View All 4 Rows |
Sex and Age in Findlay
Sex and Age in Findlay
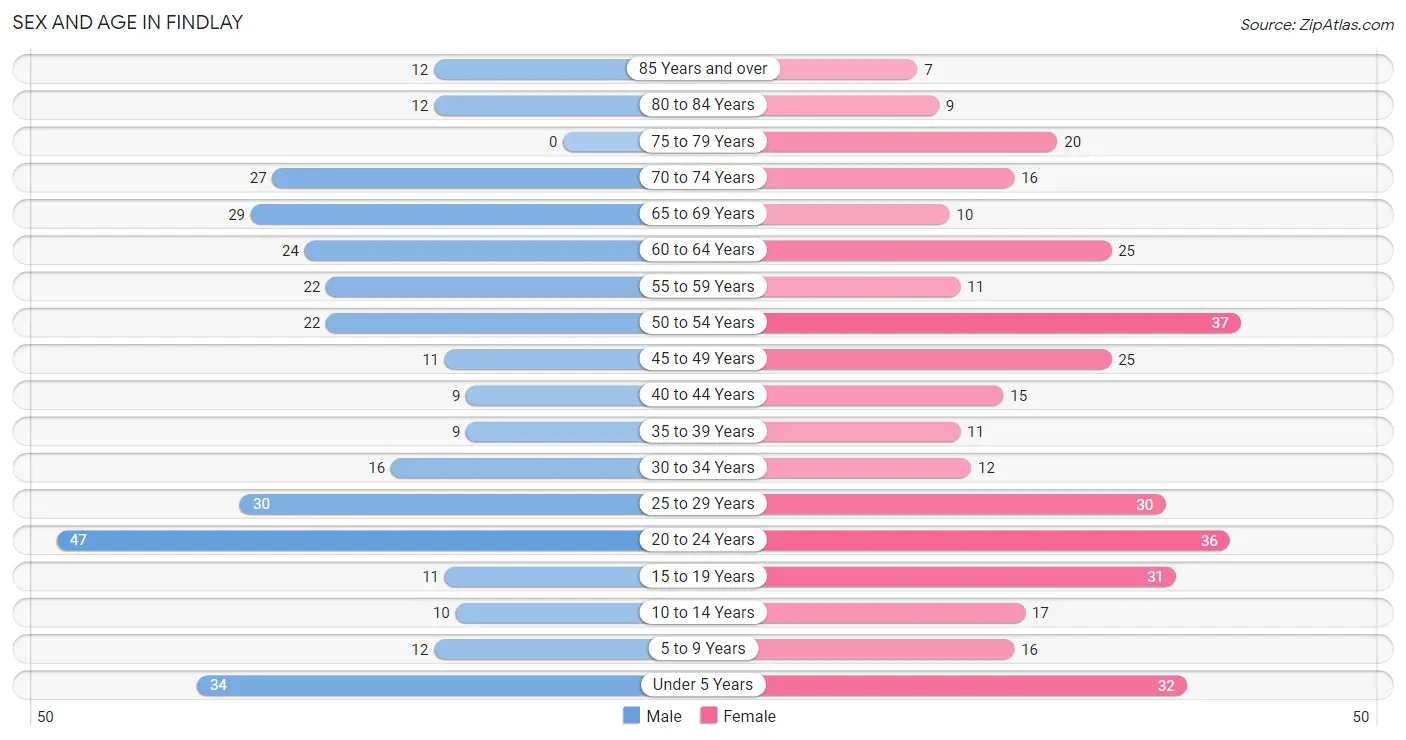
The most populous age groups in Findlay are 20 to 24 Years (47 | 14.0%) for men and 50 to 54 Years (37 | 10.3%) for women.
| Age Bracket | Male | Female |
| Under 5 Years | 34 (10.1%) | 32 (8.9%) |
| 5 to 9 Years | 12 (3.6%) | 16 (4.4%) |
| 10 to 14 Years | 10 (3.0%) | 17 (4.7%) |
| 15 to 19 Years | 11 (3.3%) | 31 (8.6%) |
| 20 to 24 Years | 47 (14.0%) | 36 (10.0%) |
| 25 to 29 Years | 30 (8.9%) | 30 (8.3%) |
| 30 to 34 Years | 16 (4.8%) | 12 (3.3%) |
| 35 to 39 Years | 9 (2.7%) | 11 (3.1%) |
| 40 to 44 Years | 9 (2.7%) | 15 (4.2%) |
| 45 to 49 Years | 11 (3.3%) | 25 (6.9%) |
| 50 to 54 Years | 22 (6.5%) | 37 (10.3%) |
| 55 to 59 Years | 22 (6.5%) | 11 (3.1%) |
| 60 to 64 Years | 24 (7.1%) | 25 (6.9%) |
| 65 to 69 Years | 29 (8.6%) | 10 (2.8%) |
| 70 to 74 Years | 27 (8.0%) | 16 (4.4%) |
| 75 to 79 Years | 0 (0.0%) | 20 (5.6%) |
| 80 to 84 Years | 12 (3.6%) | 9 (2.5%) |
| 85 Years and over | 12 (3.6%) | 7 (1.9%) |
| Total | 337 (100.0%) | 360 (100.0%) |
Families and Households in Findlay
Median Family Size in Findlay
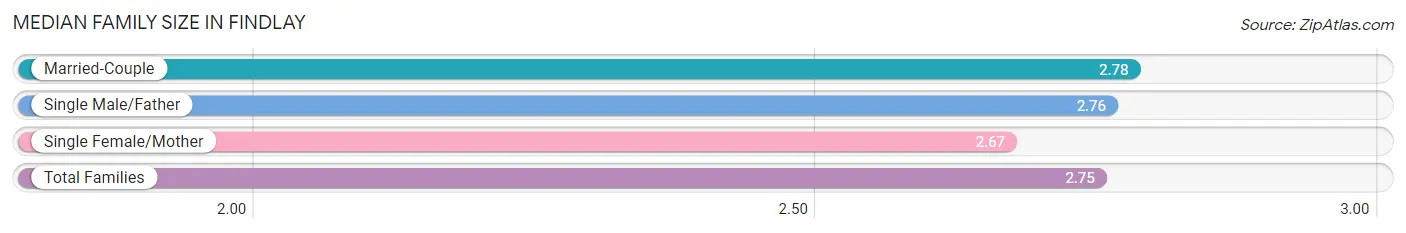
The median family size in Findlay is 2.75 persons per family, with married-couple families (120 | 65.6%) accounting for the largest median family size of 2.78 persons per family. On the other hand, single female/mother families (30 | 16.4%) represent the smallest median family size with 2.67 persons per family.
| Family Type | # Families | Family Size |
| Married-Couple | 120 (65.6%) | 2.78 |
| Single Male/Father | 33 (18.0%) | 2.76 |
| Single Female/Mother | 30 (16.4%) | 2.67 |
| Total Families | 183 (100.0%) | 2.75 |
Median Household Size in Findlay
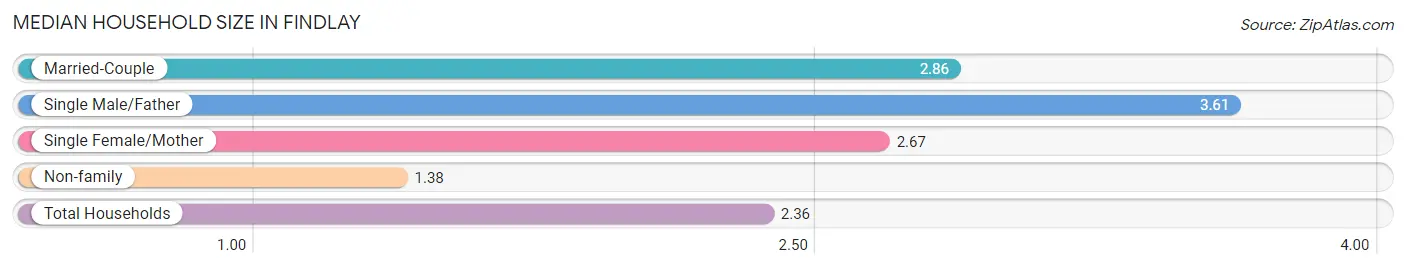
The median household size in Findlay is 2.36 persons per household, with single male/father households (33 | 11.2%) accounting for the largest median household size of 3.61 persons per household. non-family households (112 | 38.0%) represent the smallest median household size with 1.38 persons per household.
| Household Type | # Households | Household Size |
| Married-Couple | 120 (40.7%) | 2.86 |
| Single Male/Father | 33 (11.2%) | 3.61 |
| Single Female/Mother | 30 (10.2%) | 2.67 |
| Non-family | 112 (38.0%) | 1.38 |
| Total Households | 295 (100.0%) | 2.36 |
Household Size by Marriage Status in Findlay
Out of a total of 295 households in Findlay, 183 (62.0%) are family households, while 112 (38.0%) are nonfamily households. The most numerous type of family households are 2-person households, comprising 98, and the most common type of nonfamily households are 1-person households, comprising 89.
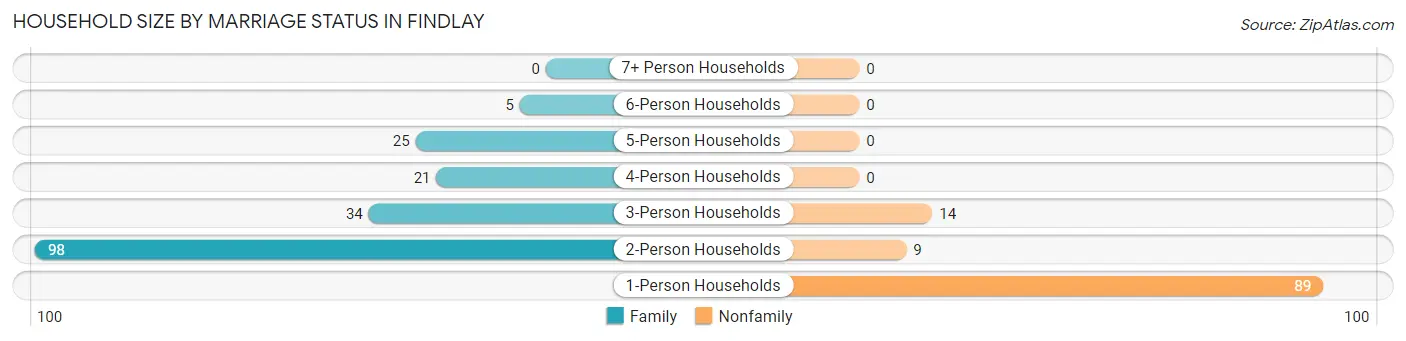
| Household Size | Family Households | Nonfamily Households |
| 1-Person Households | - | 89 (30.2%) |
| 2-Person Households | 98 (33.2%) | 9 (3.0%) |
| 3-Person Households | 34 (11.5%) | 14 (4.8%) |
| 4-Person Households | 21 (7.1%) | 0 (0.0%) |
| 5-Person Households | 25 (8.5%) | 0 (0.0%) |
| 6-Person Households | 5 (1.7%) | 0 (0.0%) |
| 7+ Person Households | 0 (0.0%) | 0 (0.0%) |
| Total | 183 (62.0%) | 112 (38.0%) |
Female Fertility in Findlay
Fertility by Age in Findlay
Average fertility rate in Findlay is 19.0 births per 1,000 women. Women in the age bracket of 20 to 34 years have the highest fertility rate with 38.0 births per 1,000 women. Women in the age bracket of 20 to 34 years acount for 100.0% of all women with births.
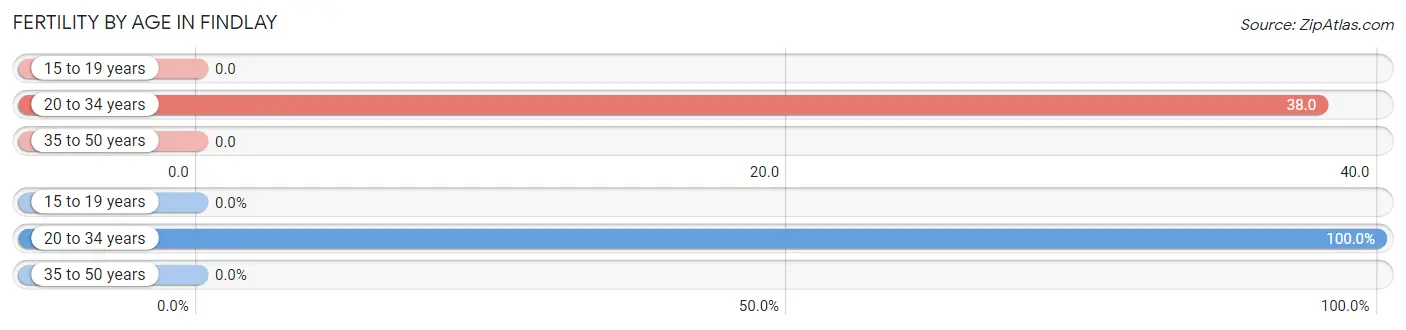
| Age Bracket | Women with Births | Births / 1,000 Women |
| 15 to 19 years | 0 (0.0%) | 0.0 |
| 20 to 34 years | 3 (100.0%) | 38.0 |
| 35 to 50 years | 0 (0.0%) | 0.0 |
| Total | 3 (100.0%) | 19.0 |
Fertility by Age by Marriage Status in Findlay
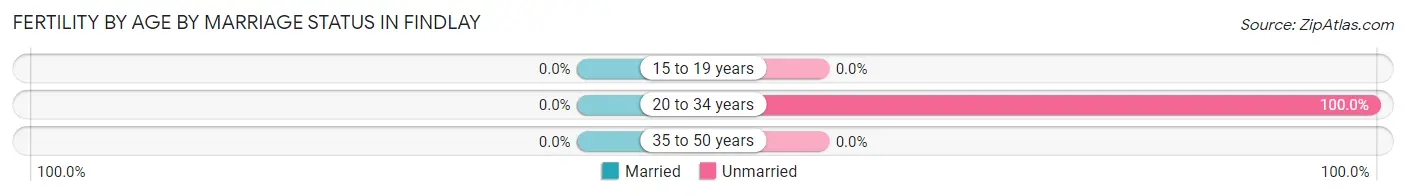
| Age Bracket | Married | Unmarried |
| 15 to 19 years | 0 (0.0%) | 0 (0.0%) |
| 20 to 34 years | 0 (0.0%) | 3 (100.0%) |
| 35 to 50 years | 0 (0.0%) | 0 (0.0%) |
| Total | 0 (0.0%) | 3 (100.0%) |
Fertility by Education in Findlay
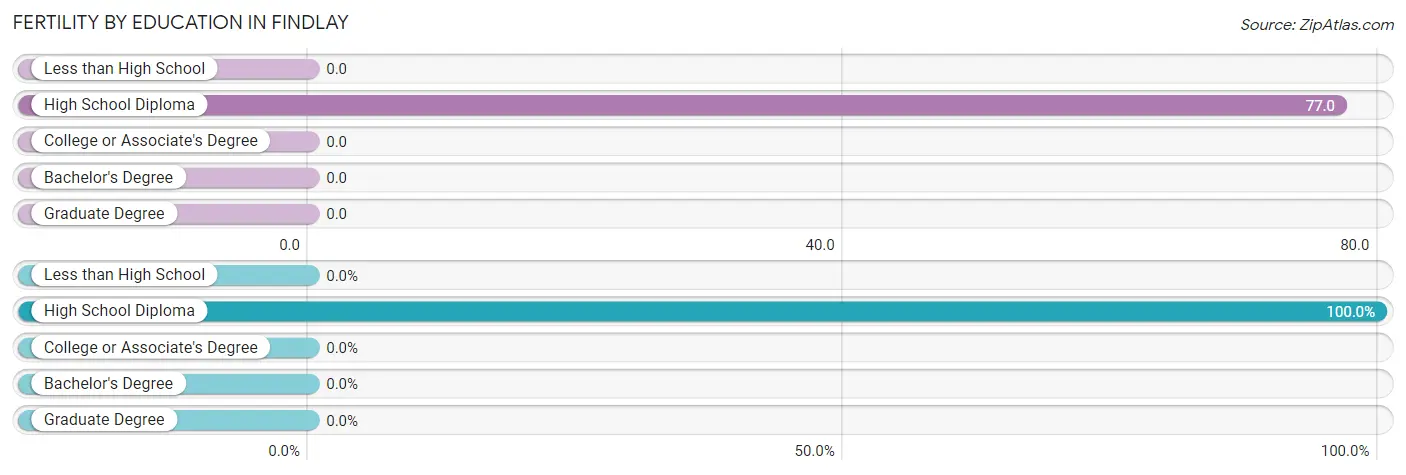
| Educational Attainment | Women with Births | Births / 1,000 Women |
| Less than High School | 0 (0.0%) | 0.0 |
| High School Diploma | 3 (100.0%) | 77.0 |
| College or Associate's Degree | 0 (0.0%) | 0.0 |
| Bachelor's Degree | 0 (0.0%) | 0.0 |
| Graduate Degree | 0 (0.0%) | 0.0 |
| Total | 3 (100.0%) | 19.0 |
Fertility by Education by Marriage Status in Findlay
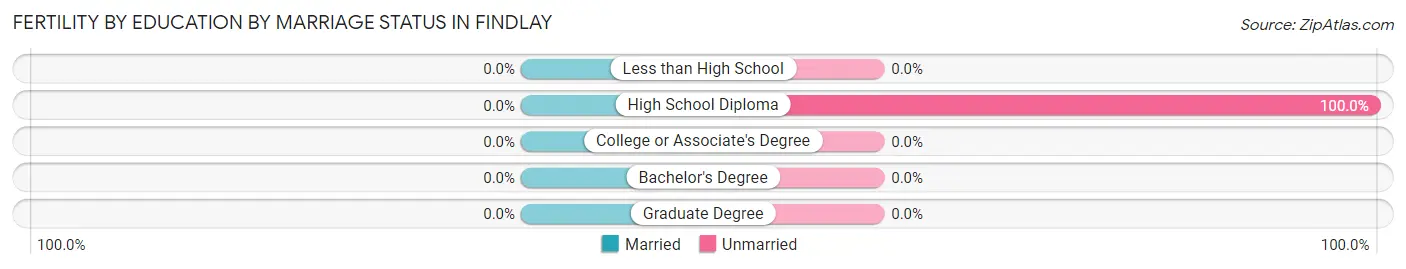
| Educational Attainment | Married | Unmarried |
| Less than High School | 0 (0.0%) | 0 (0.0%) |
| High School Diploma | 0 (0.0%) | 3 (100.0%) |
| College or Associate's Degree | 0 (0.0%) | 0 (0.0%) |
| Bachelor's Degree | 0 (0.0%) | 0 (0.0%) |
| Graduate Degree | 0 (0.0%) | 0 (0.0%) |
| Total | 0 (0.0%) | 3 (100.0%) |
Employment Characteristics in Findlay
Employment by Class of Employer in Findlay
Among the 335 employed individuals in Findlay, private company employees (238 | 71.0%), self-employed (incorporated) (28 | 8.4%), and self-employed (not incorporated) (19 | 5.7%) make up the most common classes of employment.
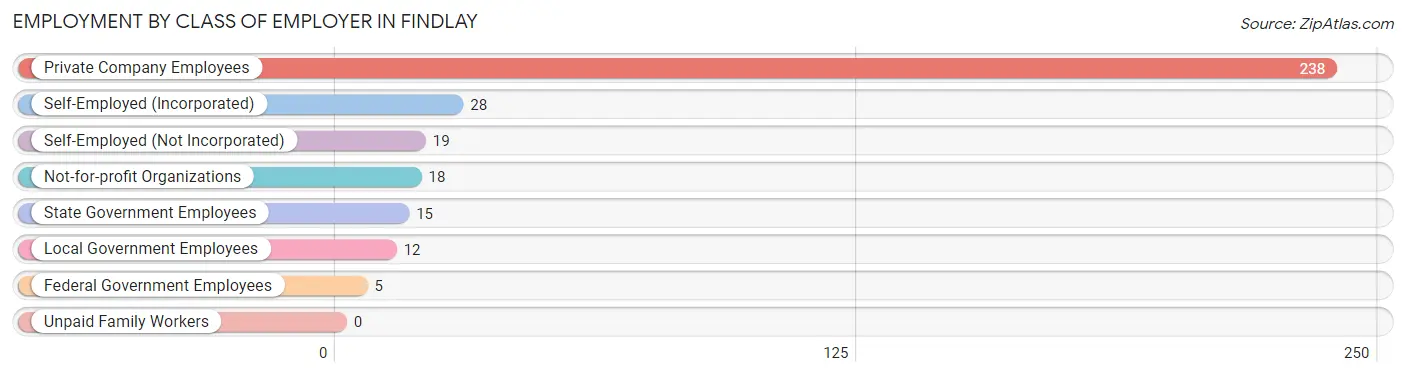
| Employer Class | # Employees | % Employees |
| Private Company Employees | 238 | 71.0% |
| Self-Employed (Incorporated) | 28 | 8.4% |
| Self-Employed (Not Incorporated) | 19 | 5.7% |
| Not-for-profit Organizations | 18 | 5.4% |
| Local Government Employees | 12 | 3.6% |
| State Government Employees | 15 | 4.5% |
| Federal Government Employees | 5 | 1.5% |
| Unpaid Family Workers | 0 | 0.0% |
| Total | 335 | 100.0% |
Employment Status by Age in Findlay
According to the labor force statistics for Findlay, out of the total population over 16 years of age (568), 65.3% or 371 individuals are in the labor force, with 5.1% or 19 of them unemployed. The age group with the highest labor force participation rate is 25 to 29 years, with 95.0% or 57 individuals in the labor force. Within the labor force, the 16 to 19 years age range has the highest percentage of unemployed individuals, with 30.4% or 7 of them being unemployed.
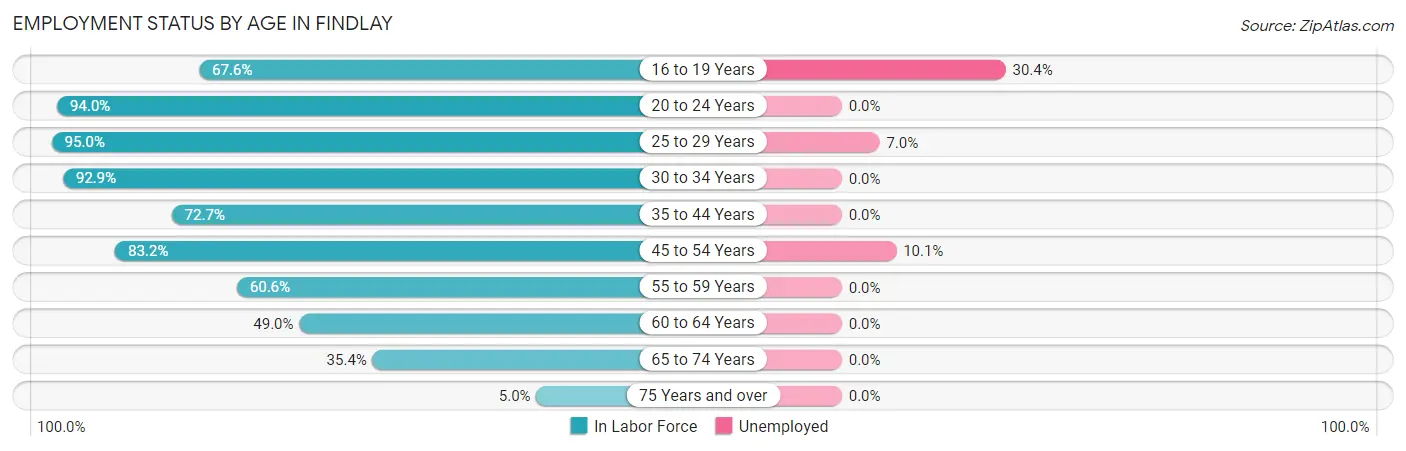
| Age Bracket | In Labor Force | Unemployed |
| 16 to 19 Years | 23 (67.6%) | 7 (30.4%) |
| 20 to 24 Years | 78 (94.0%) | 0 (0.0%) |
| 25 to 29 Years | 57 (95.0%) | 4 (7.0%) |
| 30 to 34 Years | 26 (92.9%) | 0 (0.0%) |
| 35 to 44 Years | 32 (72.7%) | 0 (0.0%) |
| 45 to 54 Years | 79 (83.2%) | 8 (10.1%) |
| 55 to 59 Years | 20 (60.6%) | 0 (0.0%) |
| 60 to 64 Years | 24 (49.0%) | 0 (0.0%) |
| 65 to 74 Years | 29 (35.4%) | 0 (0.0%) |
| 75 Years and over | 3 (5.0%) | 0 (0.0%) |
| Total | 371 (65.3%) | 19 (5.1%) |
Employment Status by Educational Attainment in Findlay
According to labor force statistics for Findlay, 77.0% of individuals (238) out of the total population between 25 and 64 years of age (309) are in the labor force, with 5.0% or 12 of them being unemployed. The group with the highest labor force participation rate are those with the educational attainment of high school diploma, with 81.7% or 98 individuals in the labor force. Within the labor force, individuals with less than high school education have the highest percentage of unemployment, with 75.0% or 3 of them being unemployed.
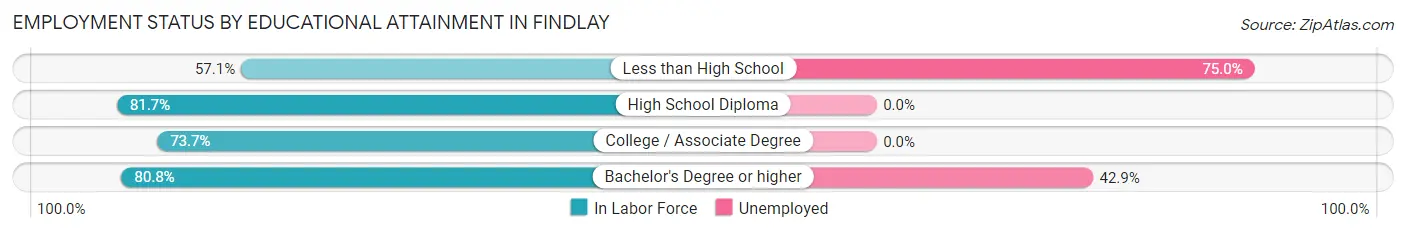
| Educational Attainment | In Labor Force | Unemployed |
| Less than High School | 4 (57.1%) | 5 (75.0%) |
| High School Diploma | 98 (81.7%) | 0 (0.0%) |
| College / Associate Degree | 115 (73.7%) | 0 (0.0%) |
| Bachelor's Degree or higher | 21 (80.8%) | 11 (42.9%) |
| Total | 238 (77.0%) | 15 (5.0%) |
Employment Occupations by Sex in Findlay
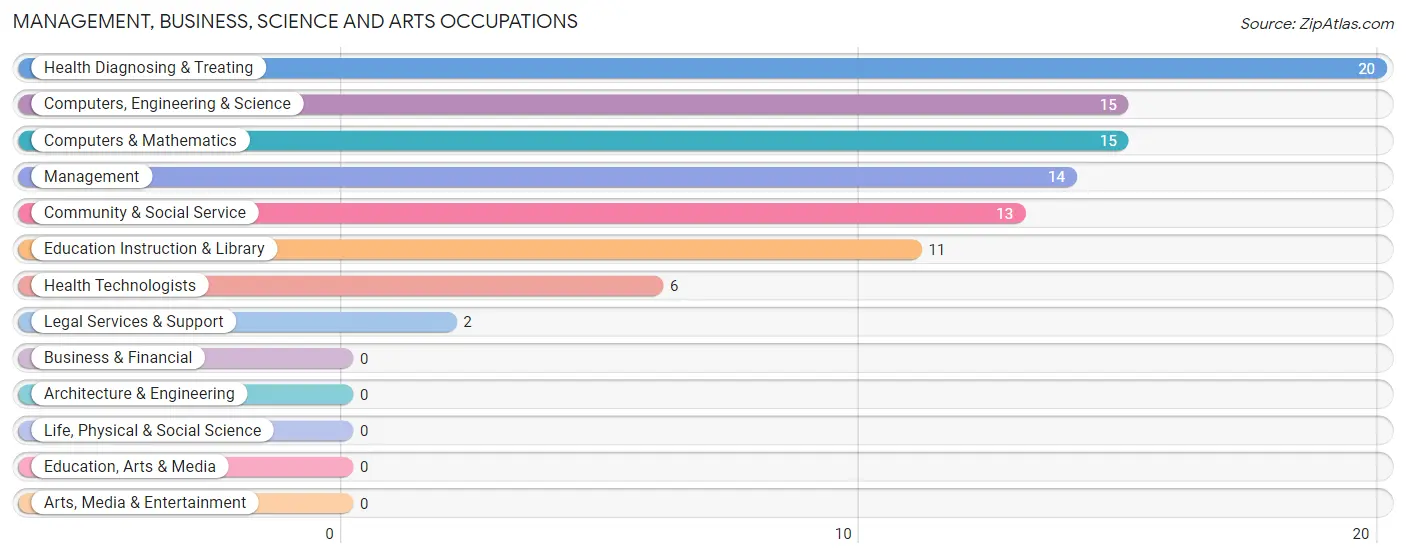
Management, Business, Science and Arts Occupations
The most common Management, Business, Science and Arts occupations in Findlay are Health Diagnosing & Treating (20 | 5.7%), Computers, Engineering & Science (15 | 4.3%), Computers & Mathematics (15 | 4.3%), Management (14 | 4.0%), and Community & Social Service (13 | 3.7%).
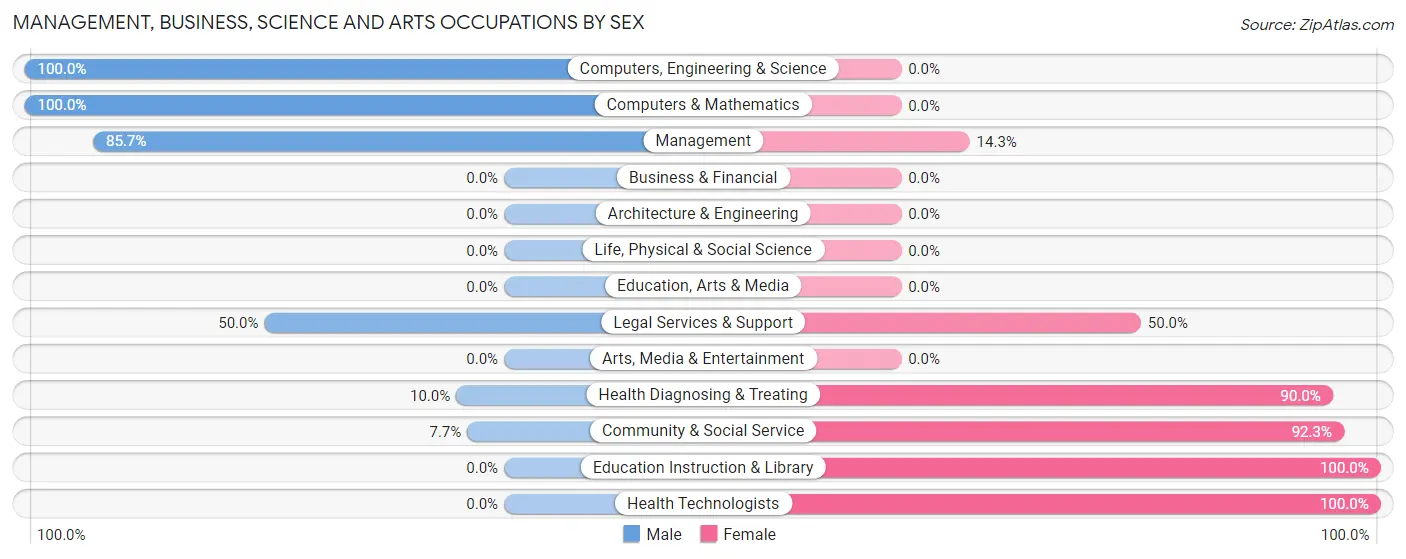
Management, Business, Science and Arts Occupations by Sex
Within the Management, Business, Science and Arts occupations in Findlay, the most male-oriented occupations are Computers, Engineering & Science (100.0%), Computers & Mathematics (100.0%), and Management (85.7%), while the most female-oriented occupations are Education Instruction & Library (100.0%), Health Technologists (100.0%), and Community & Social Service (92.3%).
| Occupation | Male | Female |
| Management | 12 (85.7%) | 2 (14.3%) |
| Business & Financial | 0 (0.0%) | 0 (0.0%) |
| Computers, Engineering & Science | 15 (100.0%) | 0 (0.0%) |
| Computers & Mathematics | 15 (100.0%) | 0 (0.0%) |
| Architecture & Engineering | 0 (0.0%) | 0 (0.0%) |
| Life, Physical & Social Science | 0 (0.0%) | 0 (0.0%) |
| Community & Social Service | 1 (7.7%) | 12 (92.3%) |
| Education, Arts & Media | 0 (0.0%) | 0 (0.0%) |
| Legal Services & Support | 1 (50.0%) | 1 (50.0%) |
| Education Instruction & Library | 0 (0.0%) | 11 (100.0%) |
| Arts, Media & Entertainment | 0 (0.0%) | 0 (0.0%) |
| Health Diagnosing & Treating | 2 (10.0%) | 18 (90.0%) |
| Health Technologists | 0 (0.0%) | 6 (100.0%) |
| Total (Category) | 30 (48.4%) | 32 (51.6%) |
| Total (Overall) | 174 (49.4%) | 178 (50.6%) |
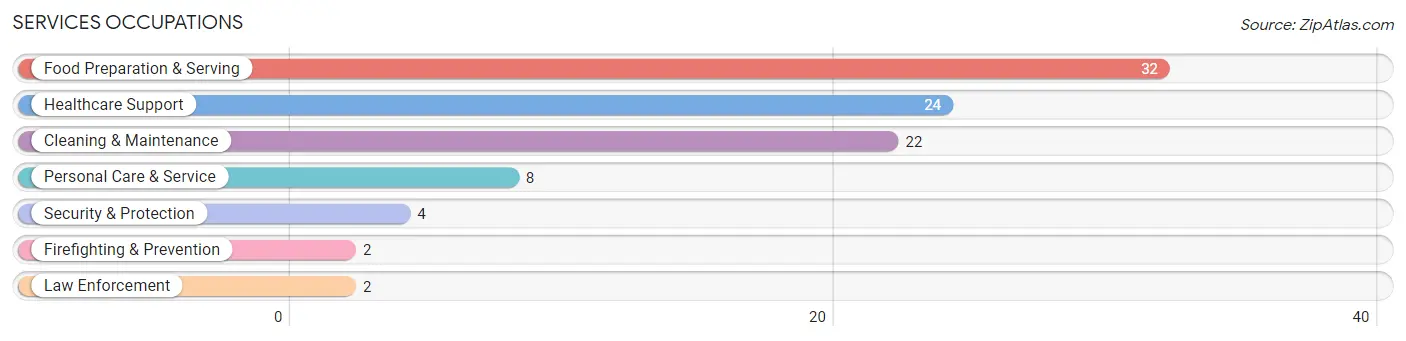
Services Occupations
The most common Services occupations in Findlay are Food Preparation & Serving (32 | 9.1%), Healthcare Support (24 | 6.8%), Cleaning & Maintenance (22 | 6.2%), Personal Care & Service (8 | 2.3%), and Security & Protection (4 | 1.1%).
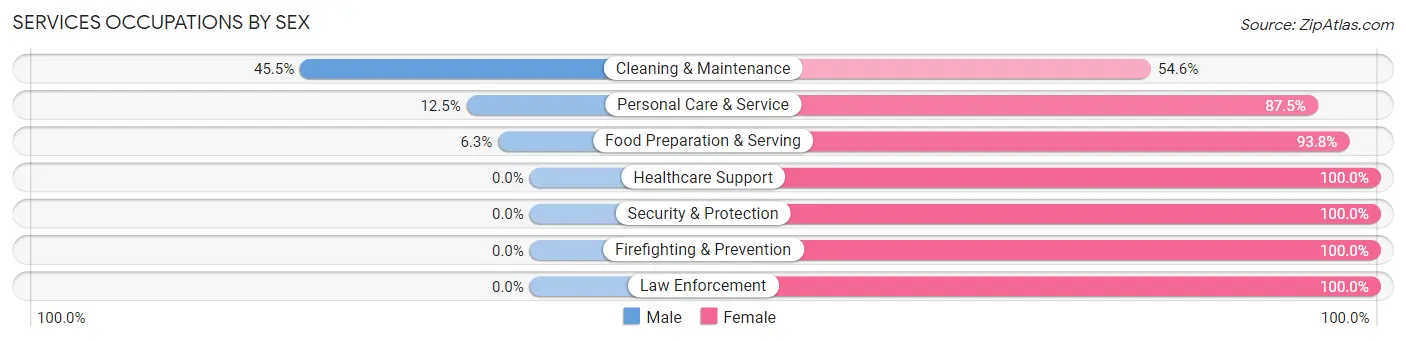
Services Occupations by Sex
Within the Services occupations in Findlay, the most male-oriented occupations are Cleaning & Maintenance (45.5%), Personal Care & Service (12.5%), and Food Preparation & Serving (6.2%), while the most female-oriented occupations are Healthcare Support (100.0%), Security & Protection (100.0%), and Firefighting & Prevention (100.0%).
| Occupation | Male | Female |
| Healthcare Support | 0 (0.0%) | 24 (100.0%) |
| Security & Protection | 0 (0.0%) | 4 (100.0%) |
| Firefighting & Prevention | 0 (0.0%) | 2 (100.0%) |
| Law Enforcement | 0 (0.0%) | 2 (100.0%) |
| Food Preparation & Serving | 2 (6.2%) | 30 (93.8%) |
| Cleaning & Maintenance | 10 (45.5%) | 12 (54.5%) |
| Personal Care & Service | 1 (12.5%) | 7 (87.5%) |
| Total (Category) | 13 (14.4%) | 77 (85.6%) |
| Total (Overall) | 174 (49.4%) | 178 (50.6%) |
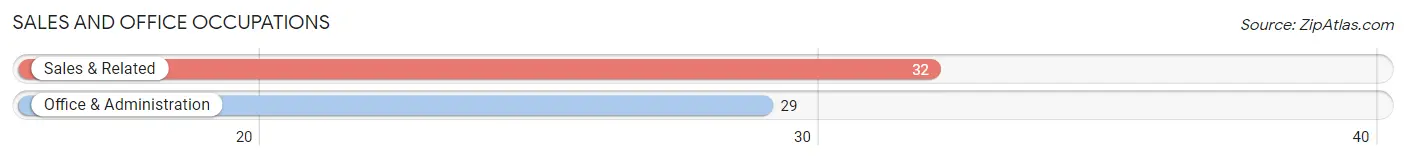
Sales and Office Occupations
The most common Sales and Office occupations in Findlay are Sales & Related (32 | 9.1%), and Office & Administration (29 | 8.2%).
Sales and Office Occupations by Sex
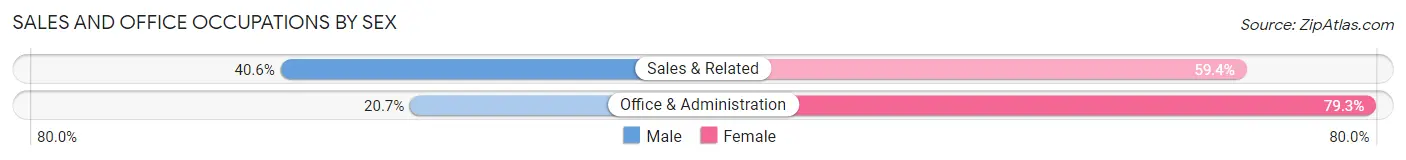
| Occupation | Male | Female |
| Sales & Related | 13 (40.6%) | 19 (59.4%) |
| Office & Administration | 6 (20.7%) | 23 (79.3%) |
| Total (Category) | 19 (31.1%) | 42 (68.9%) |
| Total (Overall) | 174 (49.4%) | 178 (50.6%) |
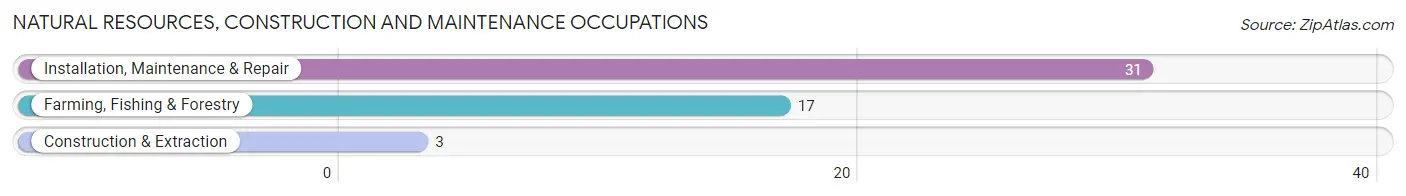
Natural Resources, Construction and Maintenance Occupations
The most common Natural Resources, Construction and Maintenance occupations in Findlay are Installation, Maintenance & Repair (31 | 8.8%), Farming, Fishing & Forestry (17 | 4.8%), and Construction & Extraction (3 | 0.9%).
Natural Resources, Construction and Maintenance Occupations by Sex
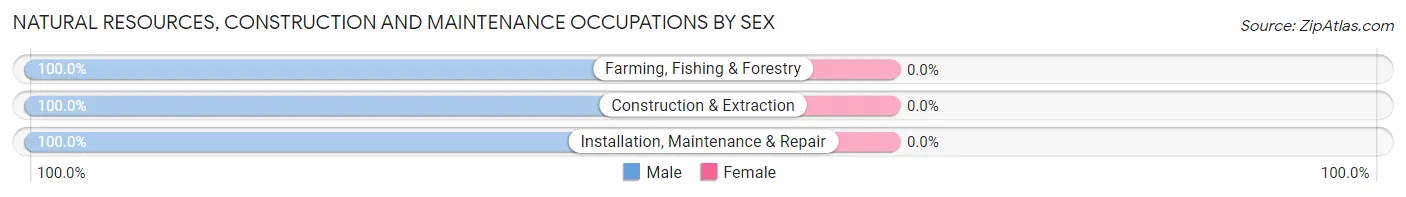
| Occupation | Male | Female |
| Farming, Fishing & Forestry | 17 (100.0%) | 0 (0.0%) |
| Construction & Extraction | 3 (100.0%) | 0 (0.0%) |
| Installation, Maintenance & Repair | 31 (100.0%) | 0 (0.0%) |
| Total (Category) | 51 (100.0%) | 0 (0.0%) |
| Total (Overall) | 174 (49.4%) | 178 (50.6%) |
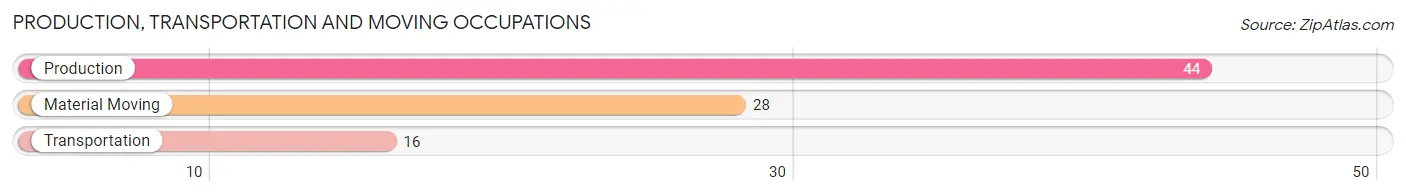
Production, Transportation and Moving Occupations
The most common Production, Transportation and Moving occupations in Findlay are Production (44 | 12.5%), Material Moving (28 | 8.0%), and Transportation (16 | 4.5%).
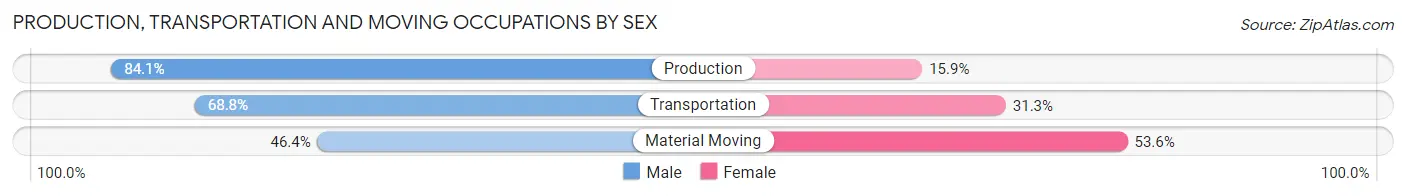
Production, Transportation and Moving Occupations by Sex
| Occupation | Male | Female |
| Production | 37 (84.1%) | 7 (15.9%) |
| Transportation | 11 (68.8%) | 5 (31.2%) |
| Material Moving | 13 (46.4%) | 15 (53.6%) |
| Total (Category) | 61 (69.3%) | 27 (30.7%) |
| Total (Overall) | 174 (49.4%) | 178 (50.6%) |
Employment Industries by Sex in Findlay
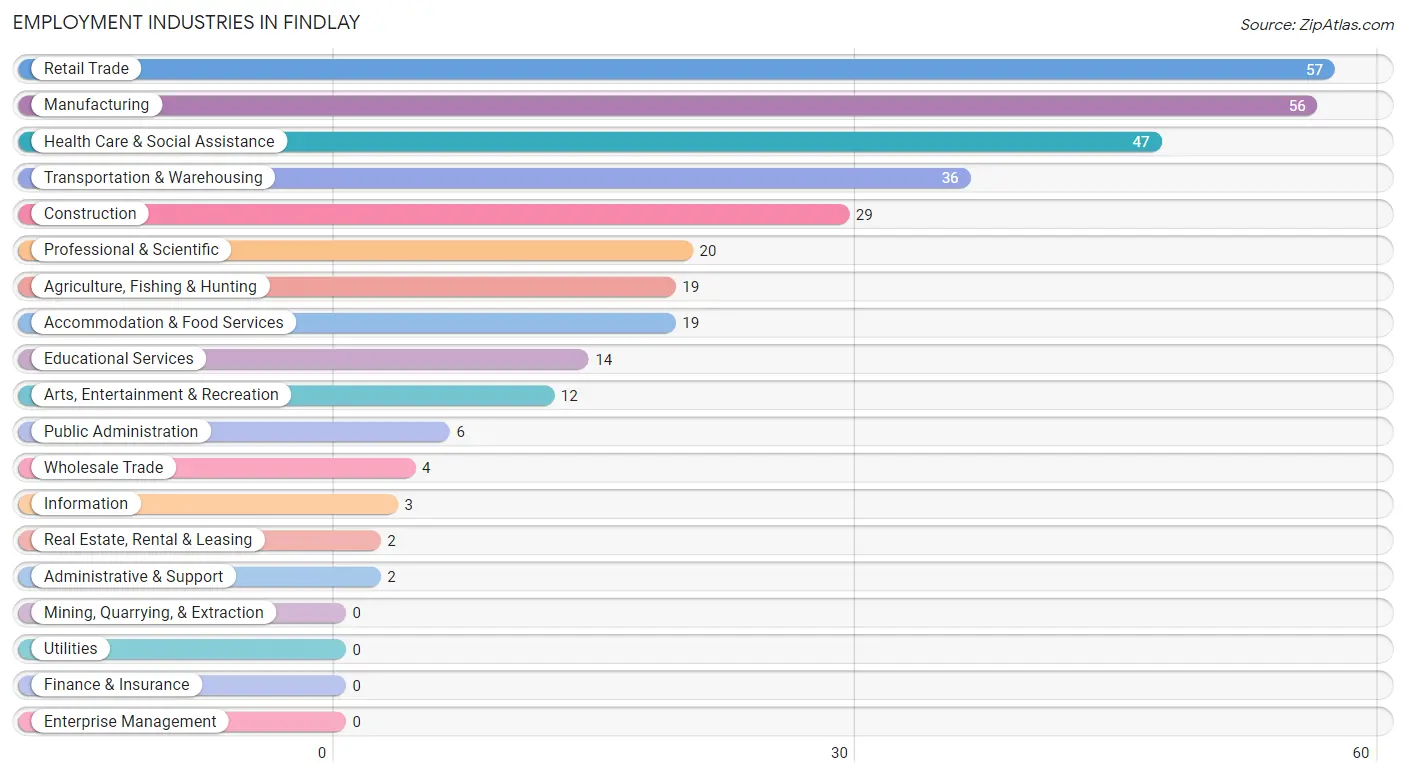
Employment Industries in Findlay
The major employment industries in Findlay include Retail Trade (57 | 16.2%), Manufacturing (56 | 15.9%), Health Care & Social Assistance (47 | 13.4%), Transportation & Warehousing (36 | 10.2%), and Construction (29 | 8.2%).
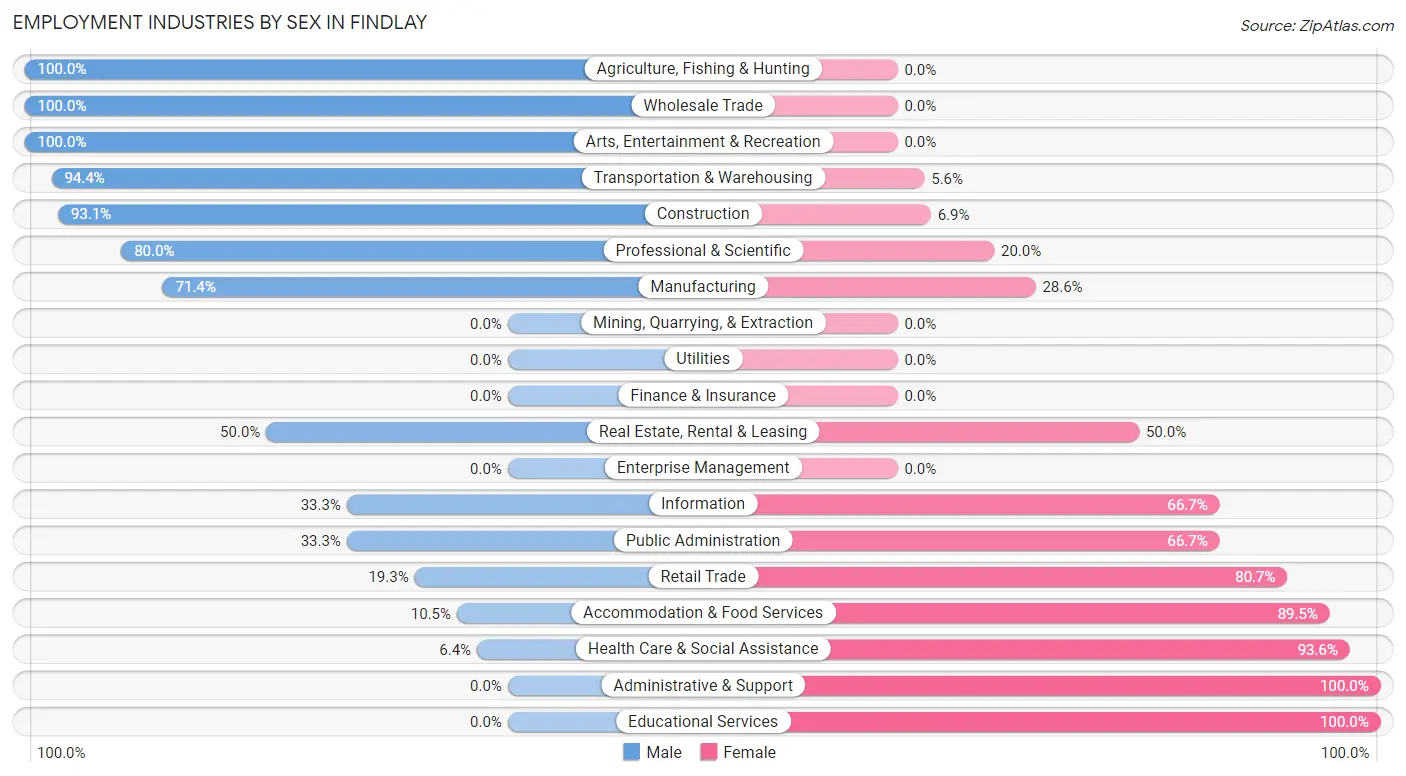
Employment Industries by Sex in Findlay
The Findlay industries that see more men than women are Agriculture, Fishing & Hunting (100.0%), Wholesale Trade (100.0%), and Arts, Entertainment & Recreation (100.0%), whereas the industries that tend to have a higher number of women are Administrative & Support (100.0%), Educational Services (100.0%), and Health Care & Social Assistance (93.6%).
| Industry | Male | Female |
| Agriculture, Fishing & Hunting | 19 (100.0%) | 0 (0.0%) |
| Mining, Quarrying, & Extraction | 0 (0.0%) | 0 (0.0%) |
| Construction | 27 (93.1%) | 2 (6.9%) |
| Manufacturing | 40 (71.4%) | 16 (28.6%) |
| Wholesale Trade | 4 (100.0%) | 0 (0.0%) |
| Retail Trade | 11 (19.3%) | 46 (80.7%) |
| Transportation & Warehousing | 34 (94.4%) | 2 (5.6%) |
| Utilities | 0 (0.0%) | 0 (0.0%) |
| Information | 1 (33.3%) | 2 (66.7%) |
| Finance & Insurance | 0 (0.0%) | 0 (0.0%) |
| Real Estate, Rental & Leasing | 1 (50.0%) | 1 (50.0%) |
| Professional & Scientific | 16 (80.0%) | 4 (20.0%) |
| Enterprise Management | 0 (0.0%) | 0 (0.0%) |
| Administrative & Support | 0 (0.0%) | 2 (100.0%) |
| Educational Services | 0 (0.0%) | 14 (100.0%) |
| Health Care & Social Assistance | 3 (6.4%) | 44 (93.6%) |
| Arts, Entertainment & Recreation | 12 (100.0%) | 0 (0.0%) |
| Accommodation & Food Services | 2 (10.5%) | 17 (89.5%) |
| Public Administration | 2 (33.3%) | 4 (66.7%) |
| Total | 174 (49.4%) | 178 (50.6%) |
Education in Findlay
School Enrollment in Findlay
The most common levels of schooling among the 114 students in Findlay are high school (30 | 26.3%), middle school (20 | 17.5%), and kindergarten (19 | 16.7%).
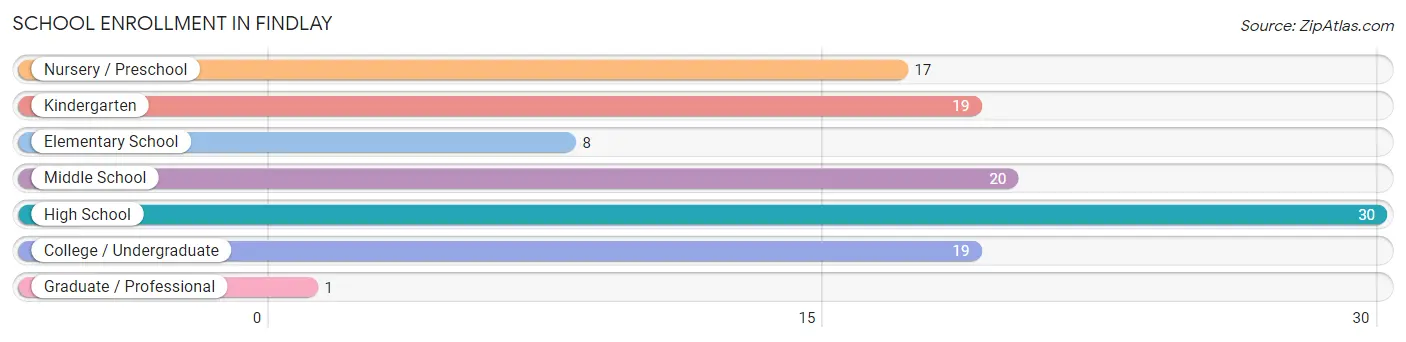
| School Level | # Students | % Students |
| Nursery / Preschool | 17 | 14.9% |
| Kindergarten | 19 | 16.7% |
| Elementary School | 8 | 7.0% |
| Middle School | 20 | 17.5% |
| High School | 30 | 26.3% |
| College / Undergraduate | 19 | 16.7% |
| Graduate / Professional | 1 | 0.9% |
| Total | 114 | 100.0% |
School Enrollment by Age by Funding Source in Findlay
Out of a total of 114 students who are enrolled in schools in Findlay, 11 (9.6%) attend a private institution, while the remaining 103 (90.4%) are enrolled in public schools. The age group of 5 to 9 year old has the highest likelihood of being enrolled in private schools, with 7 (29.2% in the age bracket) enrolled. Conversely, the age group of 3 to 4 year olds has the lowest likelihood of being enrolled in a private school, with 17 (100.0% in the age bracket) attending a public institution.
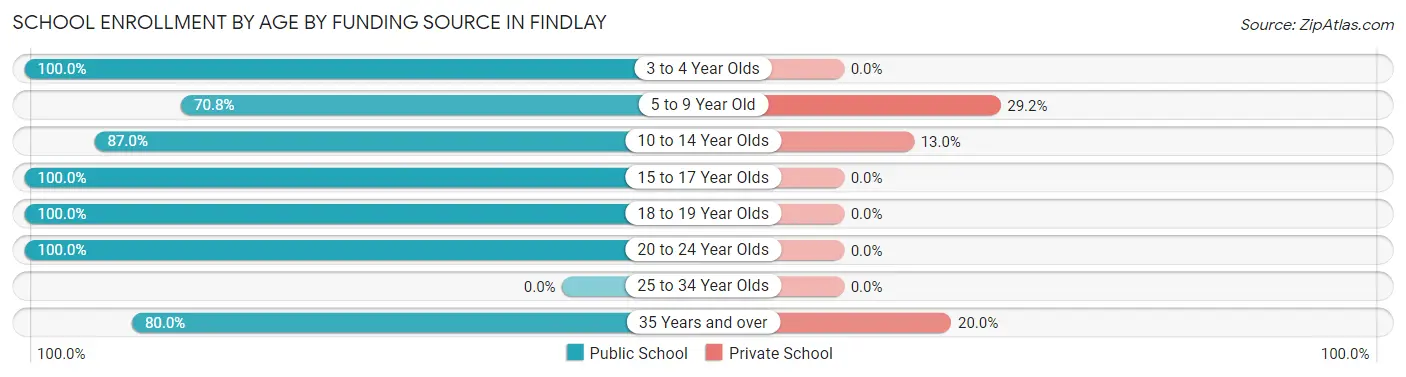
| Age Bracket | Public School | Private School |
| 3 to 4 Year Olds | 17 (100.0%) | 0 (0.0%) |
| 5 to 9 Year Old | 17 (70.8%) | 7 (29.2%) |
| 10 to 14 Year Olds | 20 (87.0%) | 3 (13.0%) |
| 15 to 17 Year Olds | 25 (100.0%) | 0 (0.0%) |
| 18 to 19 Year Olds | 17 (100.0%) | 0 (0.0%) |
| 20 to 24 Year Olds | 3 (100.0%) | 0 (0.0%) |
| 25 to 34 Year Olds | 0 (0.0%) | 0 (0.0%) |
| 35 Years and over | 4 (80.0%) | 1 (20.0%) |
| Total | 103 (90.4%) | 11 (9.6%) |
Educational Attainment by Field of Study in Findlay
Science & technology (11 | 21.6%), arts & humanities (10 | 19.6%), visual & performing arts (8 | 15.7%), computers & mathematics (7 | 13.7%), and bio, nature & agricultural (3 | 5.9%) are the most common fields of study among 51 individuals in Findlay who have obtained a bachelor's degree or higher.
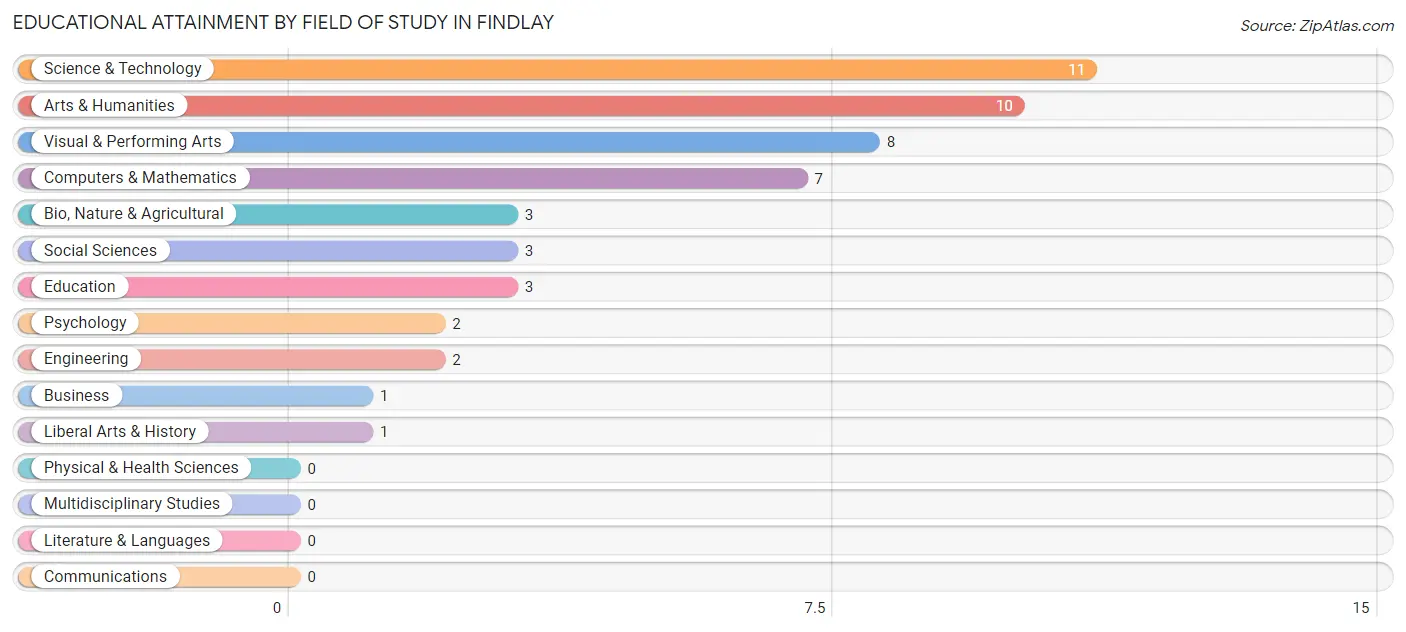
| Field of Study | # Graduates | % Graduates |
| Computers & Mathematics | 7 | 13.7% |
| Bio, Nature & Agricultural | 3 | 5.9% |
| Physical & Health Sciences | 0 | 0.0% |
| Psychology | 2 | 3.9% |
| Social Sciences | 3 | 5.9% |
| Engineering | 2 | 3.9% |
| Multidisciplinary Studies | 0 | 0.0% |
| Science & Technology | 11 | 21.6% |
| Business | 1 | 2.0% |
| Education | 3 | 5.9% |
| Literature & Languages | 0 | 0.0% |
| Liberal Arts & History | 1 | 2.0% |
| Visual & Performing Arts | 8 | 15.7% |
| Communications | 0 | 0.0% |
| Arts & Humanities | 10 | 19.6% |
| Total | 51 | 100.0% |
Transportation & Commute in Findlay
Vehicle Availability by Sex in Findlay
The most prevalent vehicle ownership categories in Findlay are males with 3 vehicles (75, accounting for 43.1%) and females with 3 vehicles (79, making up 46.6%).
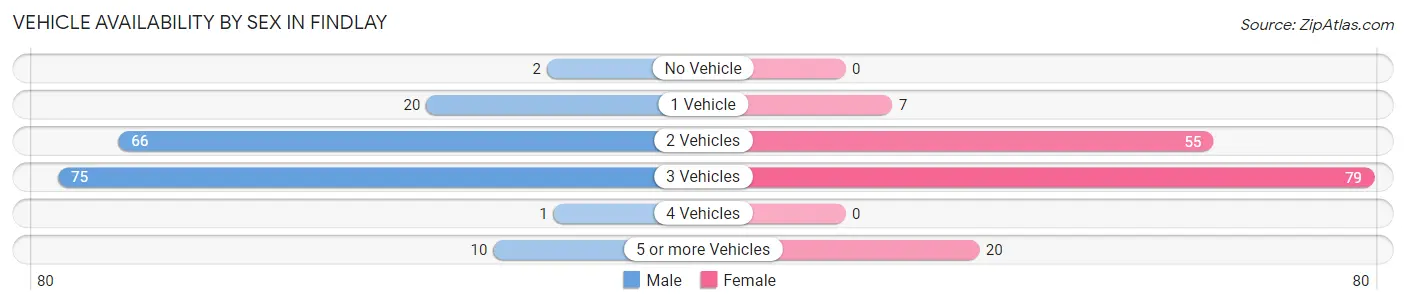
| Vehicles Available | Male | Female |
| No Vehicle | 2 (1.1%) | 0 (0.0%) |
| 1 Vehicle | 20 (11.5%) | 7 (4.3%) |
| 2 Vehicles | 66 (37.9%) | 55 (34.2%) |
| 3 Vehicles | 75 (43.1%) | 79 (49.1%) |
| 4 Vehicles | 1 (0.6%) | 0 (0.0%) |
| 5 or more Vehicles | 10 (5.8%) | 20 (12.4%) |
| Total | 174 (100.0%) | 161 (100.0%) |
Commute Time in Findlay
The most frequently occuring commute durations in Findlay are 15 to 19 minutes (100 commuters, 31.6%), 45 to 59 minutes (37 commuters, 11.7%), and 30 to 34 minutes (34 commuters, 10.7%).
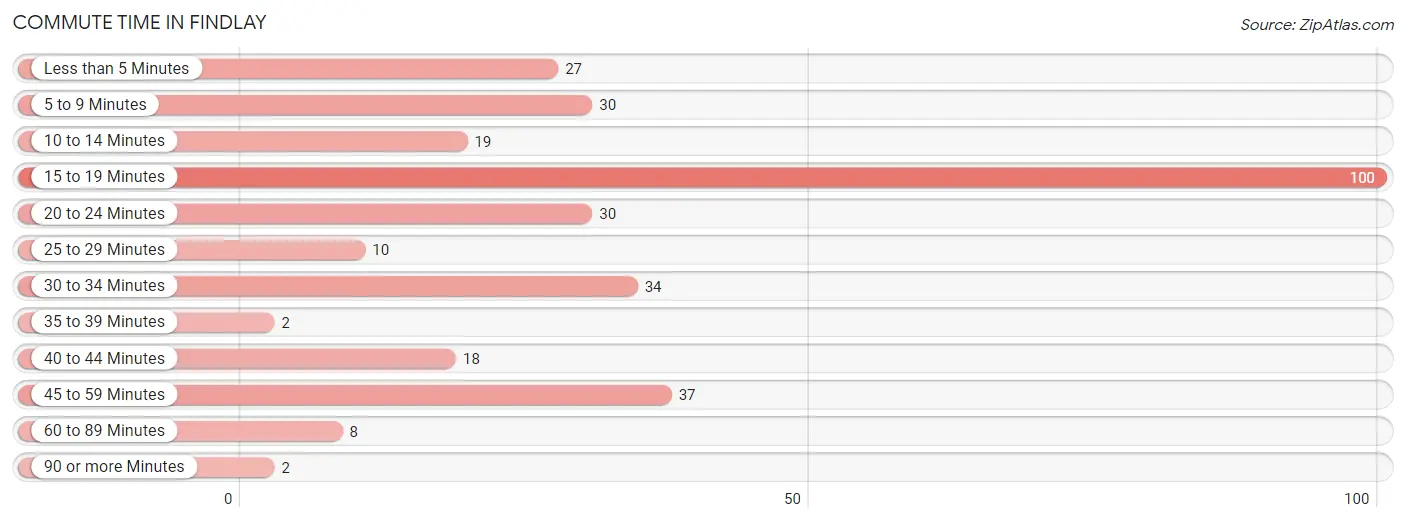
| Commute Time | # Commuters | % Commuters |
| Less than 5 Minutes | 27 | 8.5% |
| 5 to 9 Minutes | 30 | 9.5% |
| 10 to 14 Minutes | 19 | 6.0% |
| 15 to 19 Minutes | 100 | 31.6% |
| 20 to 24 Minutes | 30 | 9.5% |
| 25 to 29 Minutes | 10 | 3.2% |
| 30 to 34 Minutes | 34 | 10.7% |
| 35 to 39 Minutes | 2 | 0.6% |
| 40 to 44 Minutes | 18 | 5.7% |
| 45 to 59 Minutes | 37 | 11.7% |
| 60 to 89 Minutes | 8 | 2.5% |
| 90 or more Minutes | 2 | 0.6% |
Commute Time by Sex in Findlay
The most common commute times in Findlay are 15 to 19 minutes (59 commuters, 35.1%) for males and 15 to 19 minutes (41 commuters, 27.5%) for females.
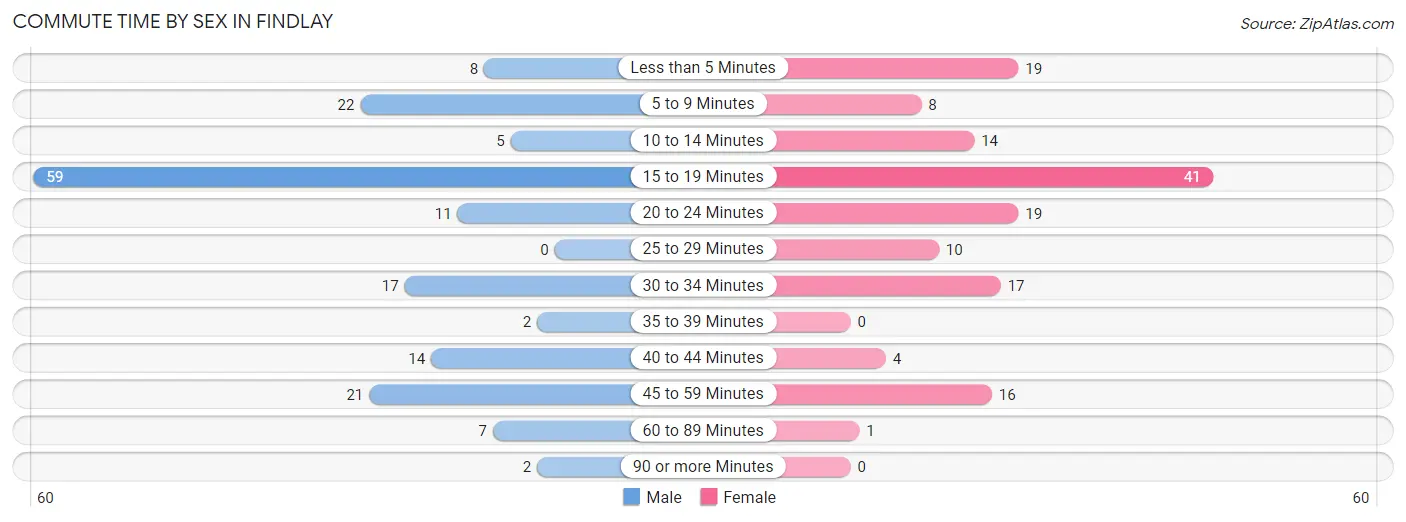
| Commute Time | Male | Female |
| Less than 5 Minutes | 8 (4.8%) | 19 (12.8%) |
| 5 to 9 Minutes | 22 (13.1%) | 8 (5.4%) |
| 10 to 14 Minutes | 5 (3.0%) | 14 (9.4%) |
| 15 to 19 Minutes | 59 (35.1%) | 41 (27.5%) |
| 20 to 24 Minutes | 11 (6.6%) | 19 (12.8%) |
| 25 to 29 Minutes | 0 (0.0%) | 10 (6.7%) |
| 30 to 34 Minutes | 17 (10.1%) | 17 (11.4%) |
| 35 to 39 Minutes | 2 (1.2%) | 0 (0.0%) |
| 40 to 44 Minutes | 14 (8.3%) | 4 (2.7%) |
| 45 to 59 Minutes | 21 (12.5%) | 16 (10.7%) |
| 60 to 89 Minutes | 7 (4.2%) | 1 (0.7%) |
| 90 or more Minutes | 2 (1.2%) | 0 (0.0%) |
Time of Departure to Work by Sex in Findlay
The most frequent times of departure to work in Findlay are 6:30 AM to 6:59 AM (49, 29.2%) for males and 4:00 PM to 11:59 PM (26, 17.4%) for females.
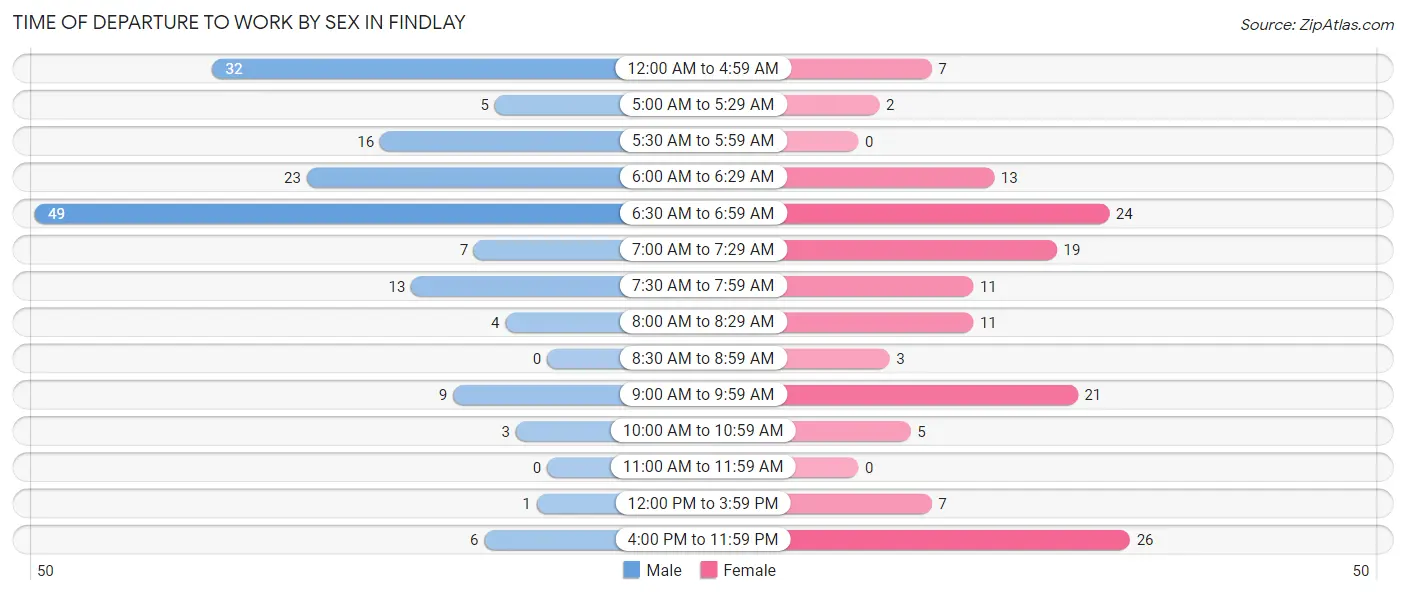
| Time of Departure | Male | Female |
| 12:00 AM to 4:59 AM | 32 (19.1%) | 7 (4.7%) |
| 5:00 AM to 5:29 AM | 5 (3.0%) | 2 (1.3%) |
| 5:30 AM to 5:59 AM | 16 (9.5%) | 0 (0.0%) |
| 6:00 AM to 6:29 AM | 23 (13.7%) | 13 (8.7%) |
| 6:30 AM to 6:59 AM | 49 (29.2%) | 24 (16.1%) |
| 7:00 AM to 7:29 AM | 7 (4.2%) | 19 (12.8%) |
| 7:30 AM to 7:59 AM | 13 (7.7%) | 11 (7.4%) |
| 8:00 AM to 8:29 AM | 4 (2.4%) | 11 (7.4%) |
| 8:30 AM to 8:59 AM | 0 (0.0%) | 3 (2.0%) |
| 9:00 AM to 9:59 AM | 9 (5.4%) | 21 (14.1%) |
| 10:00 AM to 10:59 AM | 3 (1.8%) | 5 (3.4%) |
| 11:00 AM to 11:59 AM | 0 (0.0%) | 0 (0.0%) |
| 12:00 PM to 3:59 PM | 1 (0.6%) | 7 (4.7%) |
| 4:00 PM to 11:59 PM | 6 (3.6%) | 26 (17.4%) |
| Total | 168 (100.0%) | 149 (100.0%) |
Housing Occupancy in Findlay
Occupancy by Ownership in Findlay
Of the total 295 dwellings in Findlay, owner-occupied units account for 229 (77.6%), while renter-occupied units make up 66 (22.4%).
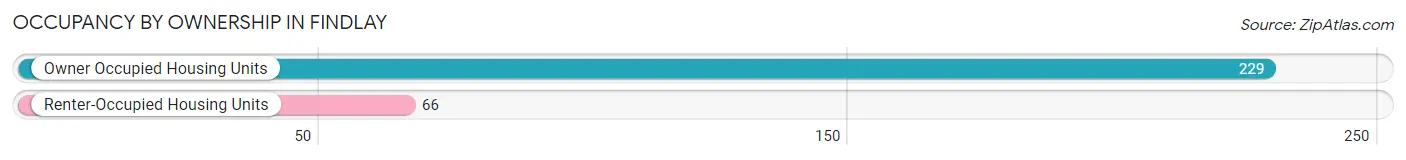
| Occupancy | # Housing Units | % Housing Units |
| Owner Occupied Housing Units | 229 | 77.6% |
| Renter-Occupied Housing Units | 66 | 22.4% |
| Total Occupied Housing Units | 295 | 100.0% |
Occupancy by Household Size in Findlay
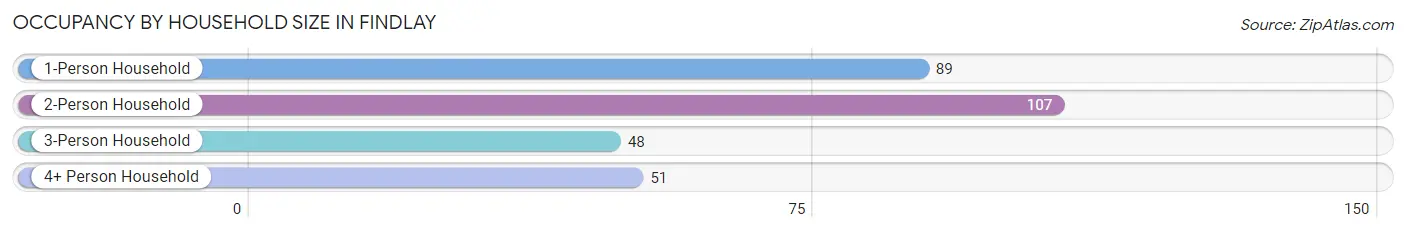
| Household Size | # Housing Units | % Housing Units |
| 1-Person Household | 89 | 30.2% |
| 2-Person Household | 107 | 36.3% |
| 3-Person Household | 48 | 16.3% |
| 4+ Person Household | 51 | 17.3% |
| Total Housing Units | 295 | 100.0% |
Occupancy by Ownership by Household Size in Findlay
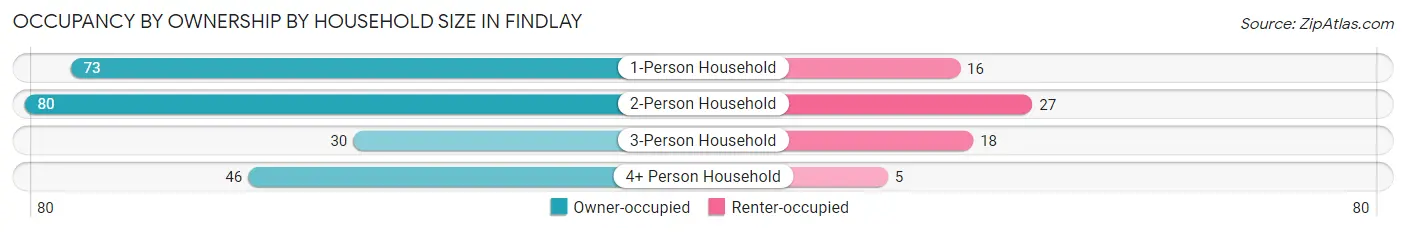
| Household Size | Owner-occupied | Renter-occupied |
| 1-Person Household | 73 (82.0%) | 16 (18.0%) |
| 2-Person Household | 80 (74.8%) | 27 (25.2%) |
| 3-Person Household | 30 (62.5%) | 18 (37.5%) |
| 4+ Person Household | 46 (90.2%) | 5 (9.8%) |
| Total Housing Units | 229 (77.6%) | 66 (22.4%) |
Occupancy by Educational Attainment in Findlay
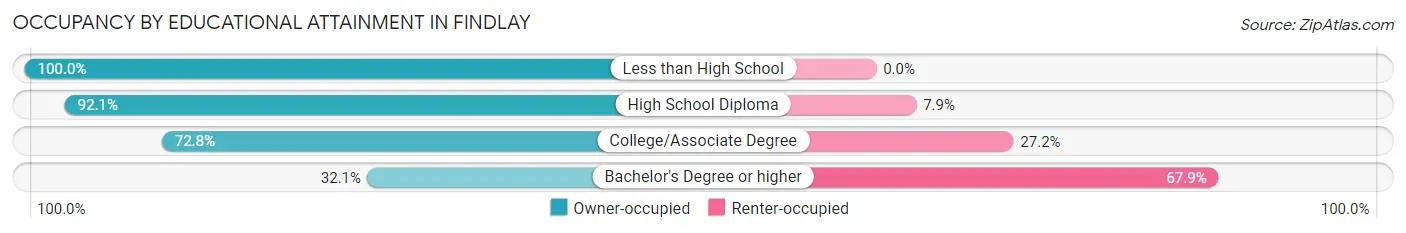
| Household Size | Owner-occupied | Renter-occupied |
| Less than High School | 5 (100.0%) | 0 (0.0%) |
| High School Diploma | 116 (92.1%) | 10 (7.9%) |
| College/Associate Degree | 99 (72.8%) | 37 (27.2%) |
| Bachelor's Degree or higher | 9 (32.1%) | 19 (67.9%) |
Occupancy by Age of Householder in Findlay
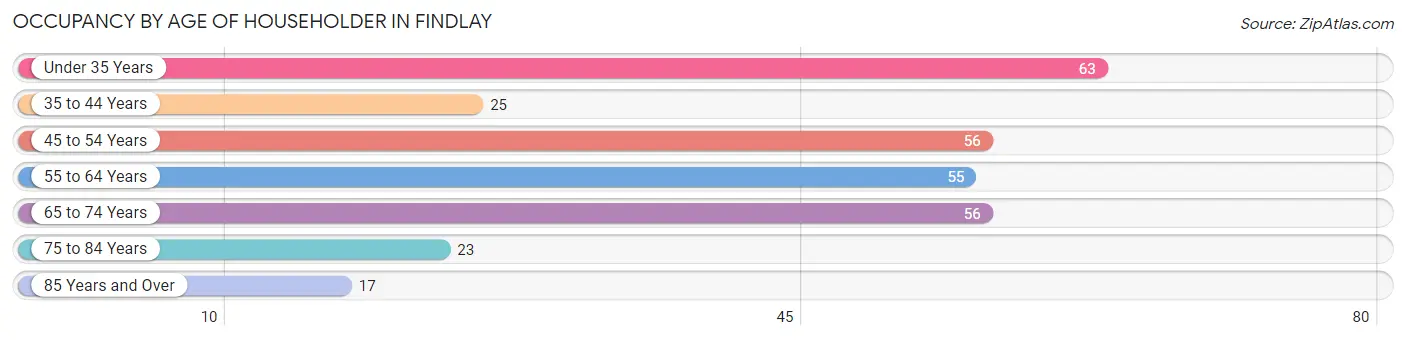
| Age Bracket | # Households | % Households |
| Under 35 Years | 63 | 21.4% |
| 35 to 44 Years | 25 | 8.5% |
| 45 to 54 Years | 56 | 19.0% |
| 55 to 64 Years | 55 | 18.6% |
| 65 to 74 Years | 56 | 19.0% |
| 75 to 84 Years | 23 | 7.8% |
| 85 Years and Over | 17 | 5.8% |
| Total | 295 | 100.0% |
Housing Finances in Findlay
Median Income by Occupancy in Findlay
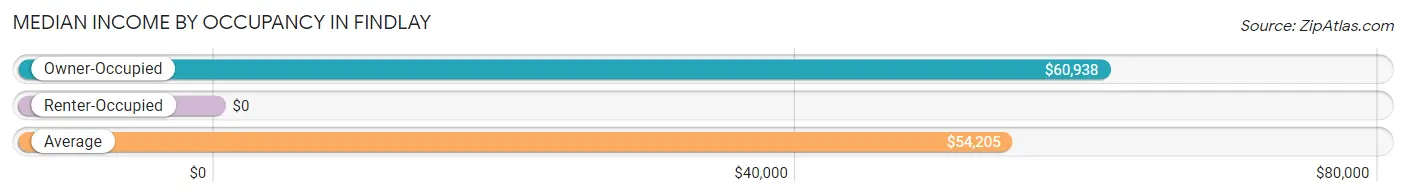
| Occupancy Type | # Households | Median Income |
| Owner-Occupied | 229 (77.6%) | $60,938 |
| Renter-Occupied | 66 (22.4%) | $0 |
| Average | 295 (100.0%) | $54,205 |
Occupancy by Householder Income Bracket in Findlay
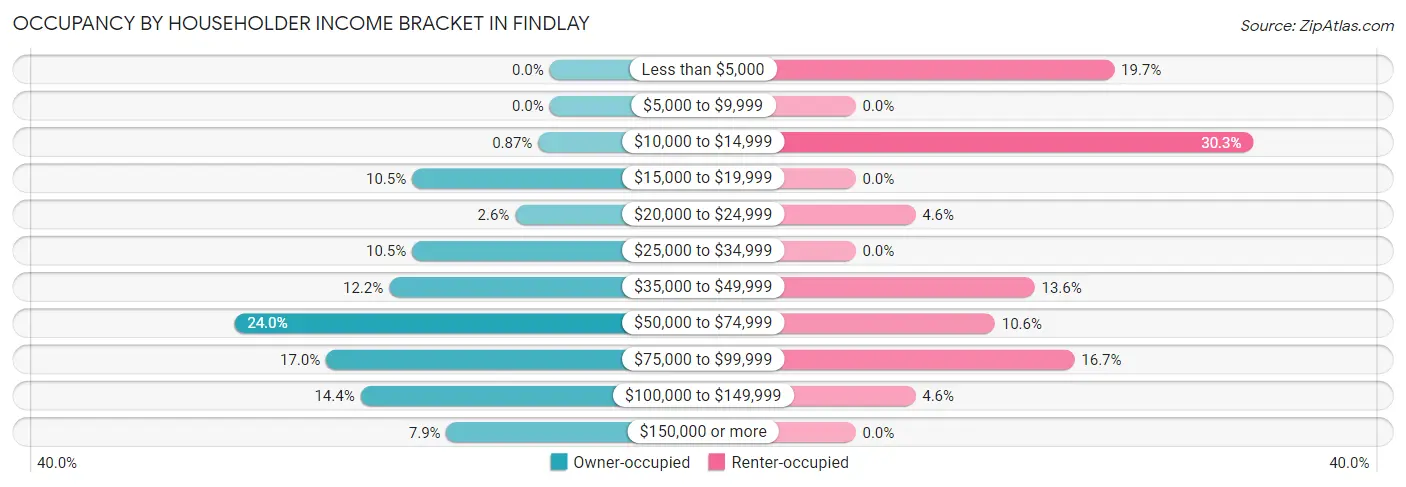
| Income Bracket | Owner-occupied | Renter-occupied |
| Less than $5,000 | 0 (0.0%) | 13 (19.7%) |
| $5,000 to $9,999 | 0 (0.0%) | 0 (0.0%) |
| $10,000 to $14,999 | 2 (0.9%) | 20 (30.3%) |
| $15,000 to $19,999 | 24 (10.5%) | 0 (0.0%) |
| $20,000 to $24,999 | 6 (2.6%) | 3 (4.5%) |
| $25,000 to $34,999 | 24 (10.5%) | 0 (0.0%) |
| $35,000 to $49,999 | 28 (12.2%) | 9 (13.6%) |
| $50,000 to $74,999 | 55 (24.0%) | 7 (10.6%) |
| $75,000 to $99,999 | 39 (17.0%) | 11 (16.7%) |
| $100,000 to $149,999 | 33 (14.4%) | 3 (4.5%) |
| $150,000 or more | 18 (7.9%) | 0 (0.0%) |
| Total | 229 (100.0%) | 66 (100.0%) |
Monthly Housing Cost Tiers in Findlay
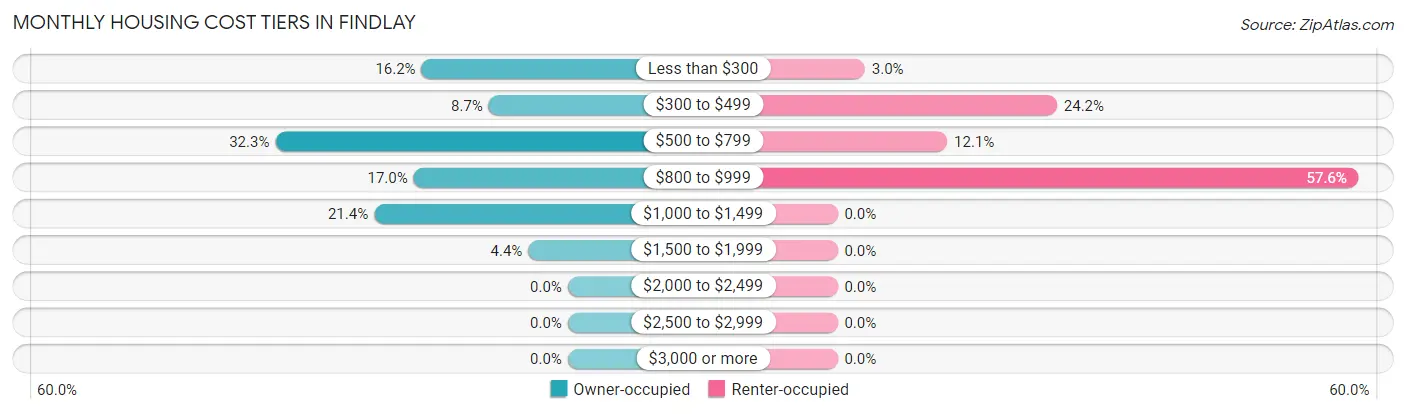
| Monthly Cost | Owner-occupied | Renter-occupied |
| Less than $300 | 37 (16.2%) | 2 (3.0%) |
| $300 to $499 | 20 (8.7%) | 16 (24.2%) |
| $500 to $799 | 74 (32.3%) | 8 (12.1%) |
| $800 to $999 | 39 (17.0%) | 38 (57.6%) |
| $1,000 to $1,499 | 49 (21.4%) | 0 (0.0%) |
| $1,500 to $1,999 | 10 (4.4%) | 0 (0.0%) |
| $2,000 to $2,499 | 0 (0.0%) | 0 (0.0%) |
| $2,500 to $2,999 | 0 (0.0%) | 0 (0.0%) |
| $3,000 or more | 0 (0.0%) | 0 (0.0%) |
| Total | 229 (100.0%) | 66 (100.0%) |
Physical Housing Characteristics in Findlay
Housing Structures in Findlay
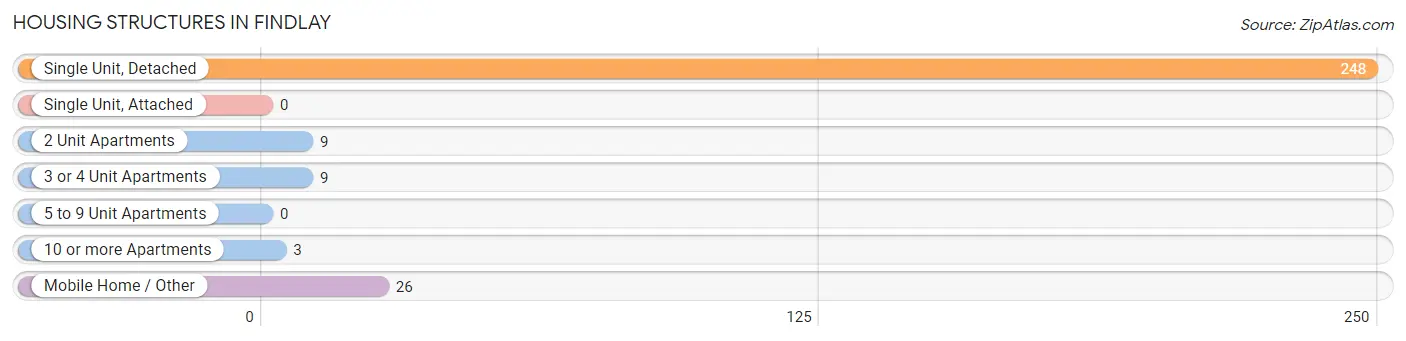
| Structure Type | # Housing Units | % Housing Units |
| Single Unit, Detached | 248 | 84.1% |
| Single Unit, Attached | 0 | 0.0% |
| 2 Unit Apartments | 9 | 3.0% |
| 3 or 4 Unit Apartments | 9 | 3.0% |
| 5 to 9 Unit Apartments | 0 | 0.0% |
| 10 or more Apartments | 3 | 1.0% |
| Mobile Home / Other | 26 | 8.8% |
| Total | 295 | 100.0% |
Housing Structures by Occupancy in Findlay
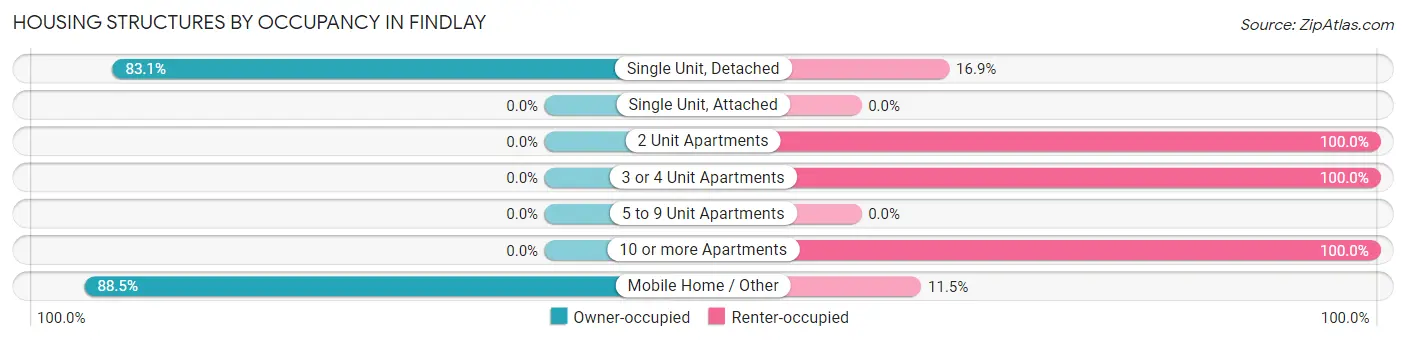
| Structure Type | Owner-occupied | Renter-occupied |
| Single Unit, Detached | 206 (83.1%) | 42 (16.9%) |
| Single Unit, Attached | 0 (0.0%) | 0 (0.0%) |
| 2 Unit Apartments | 0 (0.0%) | 9 (100.0%) |
| 3 or 4 Unit Apartments | 0 (0.0%) | 9 (100.0%) |
| 5 to 9 Unit Apartments | 0 (0.0%) | 0 (0.0%) |
| 10 or more Apartments | 0 (0.0%) | 3 (100.0%) |
| Mobile Home / Other | 23 (88.5%) | 3 (11.5%) |
| Total | 229 (77.6%) | 66 (22.4%) |
Housing Structures by Number of Rooms in Findlay
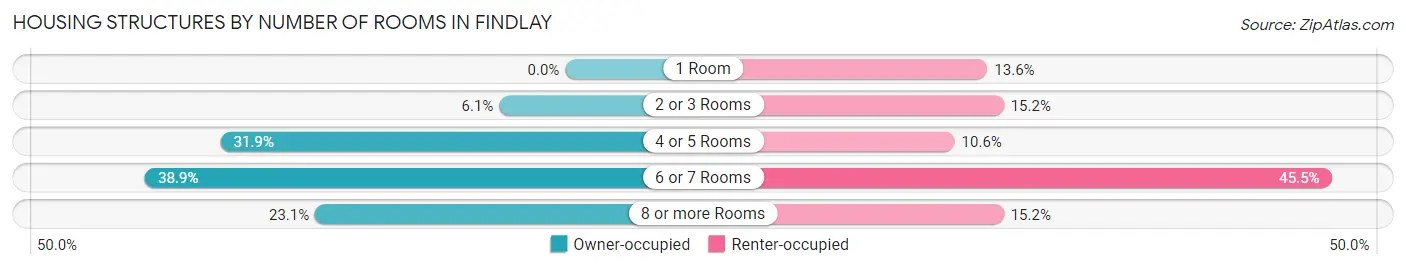
| Number of Rooms | Owner-occupied | Renter-occupied |
| 1 Room | 0 (0.0%) | 9 (13.6%) |
| 2 or 3 Rooms | 14 (6.1%) | 10 (15.1%) |
| 4 or 5 Rooms | 73 (31.9%) | 7 (10.6%) |
| 6 or 7 Rooms | 89 (38.9%) | 30 (45.5%) |
| 8 or more Rooms | 53 (23.1%) | 10 (15.1%) |
| Total | 229 (100.0%) | 66 (100.0%) |
Housing Structure by Heating Type in Findlay
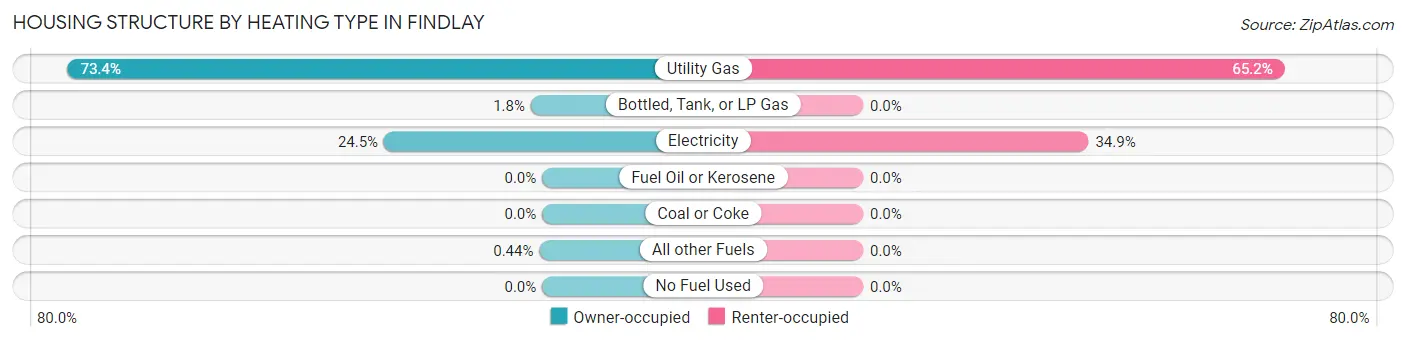
| Heating Type | Owner-occupied | Renter-occupied |
| Utility Gas | 168 (73.4%) | 43 (65.1%) |
| Bottled, Tank, or LP Gas | 4 (1.8%) | 0 (0.0%) |
| Electricity | 56 (24.4%) | 23 (34.8%) |
| Fuel Oil or Kerosene | 0 (0.0%) | 0 (0.0%) |
| Coal or Coke | 0 (0.0%) | 0 (0.0%) |
| All other Fuels | 1 (0.4%) | 0 (0.0%) |
| No Fuel Used | 0 (0.0%) | 0 (0.0%) |
| Total | 229 (100.0%) | 66 (100.0%) |
Household Vehicle Usage in Findlay
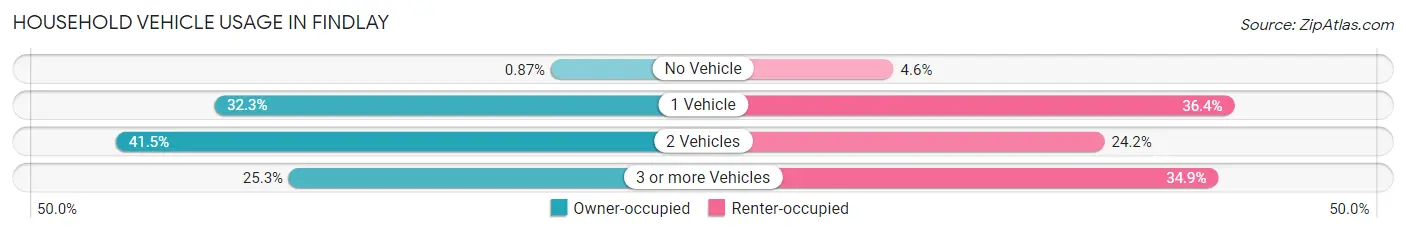
| Vehicles per Household | Owner-occupied | Renter-occupied |
| No Vehicle | 2 (0.9%) | 3 (4.5%) |
| 1 Vehicle | 74 (32.3%) | 24 (36.4%) |
| 2 Vehicles | 95 (41.5%) | 16 (24.2%) |
| 3 or more Vehicles | 58 (25.3%) | 23 (34.8%) |
| Total | 229 (100.0%) | 66 (100.0%) |
Real Estate & Mortgages in Findlay
Real Estate and Mortgage Overview in Findlay
| Characteristic | Without Mortgage | With Mortgage |
| Housing Units | 103 | 126 |
| Median Property Value | $82,900 | $82,900 |
| Median Household Income | $50,781 | $17 |
| Monthly Housing Costs | $469 | $0 |
| Real Estate Taxes | $1,972 | $3 |
Property Value by Mortgage Status in Findlay
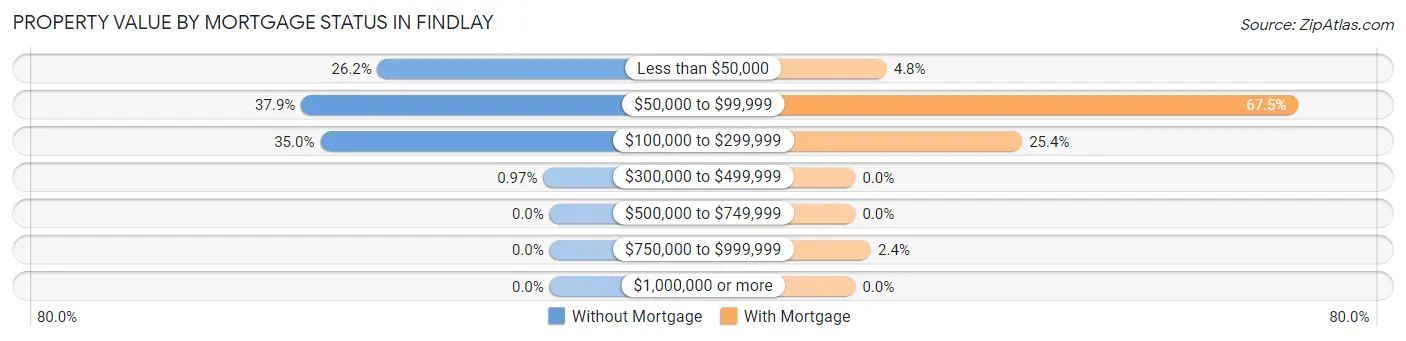
| Property Value | Without Mortgage | With Mortgage |
| Less than $50,000 | 27 (26.2%) | 6 (4.8%) |
| $50,000 to $99,999 | 39 (37.9%) | 85 (67.5%) |
| $100,000 to $299,999 | 36 (34.9%) | 32 (25.4%) |
| $300,000 to $499,999 | 1 (1.0%) | 0 (0.0%) |
| $500,000 to $749,999 | 0 (0.0%) | 0 (0.0%) |
| $750,000 to $999,999 | 0 (0.0%) | 3 (2.4%) |
| $1,000,000 or more | 0 (0.0%) | 0 (0.0%) |
| Total | 103 (100.0%) | 126 (100.0%) |
Household Income by Mortgage Status in Findlay
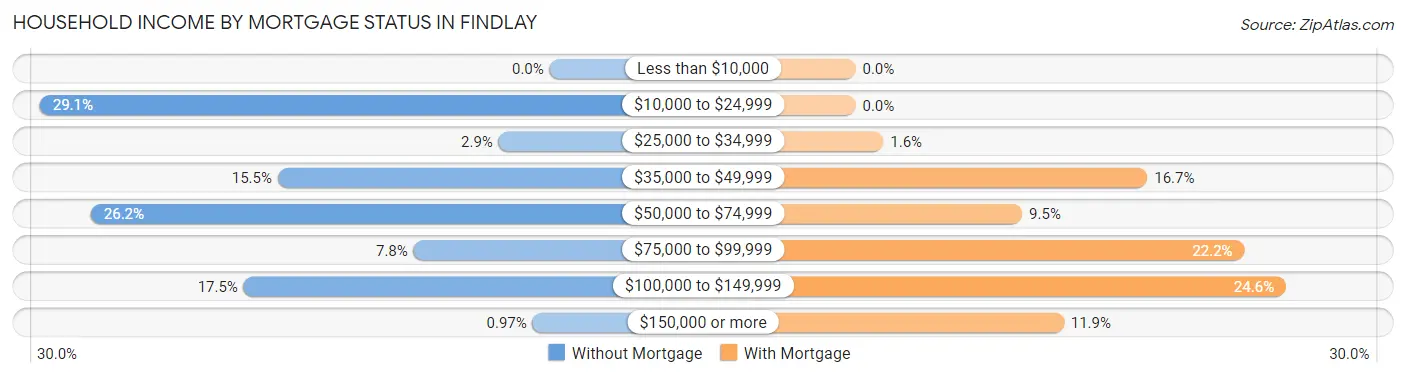
| Household Income | Without Mortgage | With Mortgage |
| Less than $10,000 | 0 (0.0%) | 0 (0.0%) |
| $10,000 to $24,999 | 30 (29.1%) | 0 (0.0%) |
| $25,000 to $34,999 | 3 (2.9%) | 2 (1.6%) |
| $35,000 to $49,999 | 16 (15.5%) | 21 (16.7%) |
| $50,000 to $74,999 | 27 (26.2%) | 12 (9.5%) |
| $75,000 to $99,999 | 8 (7.8%) | 28 (22.2%) |
| $100,000 to $149,999 | 18 (17.5%) | 31 (24.6%) |
| $150,000 or more | 1 (1.0%) | 15 (11.9%) |
| Total | 103 (100.0%) | 126 (100.0%) |
Property Value to Household Income Ratio in Findlay
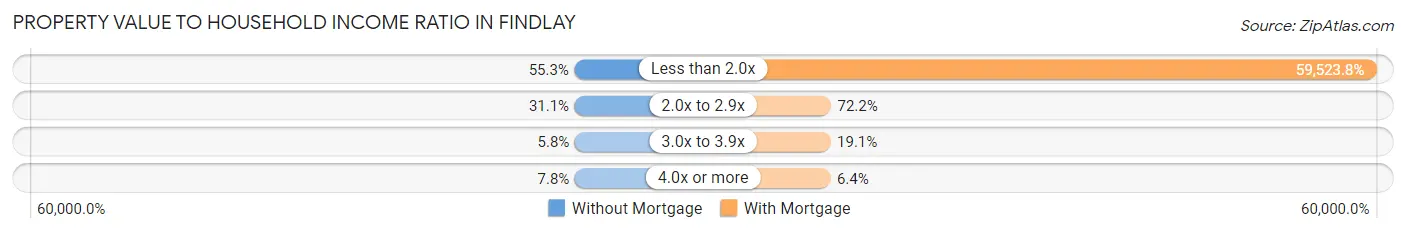
| Value-to-Income Ratio | Without Mortgage | With Mortgage |
| Less than 2.0x | 57 (55.3%) | 75,000 (59,523.8%) |
| 2.0x to 2.9x | 32 (31.1%) | 91 (72.2%) |
| 3.0x to 3.9x | 6 (5.8%) | 24 (19.1%) |
| 4.0x or more | 8 (7.8%) | 8 (6.4%) |
| Total | 103 (100.0%) | 126 (100.0%) |
Real Estate Taxes by Mortgage Status in Findlay
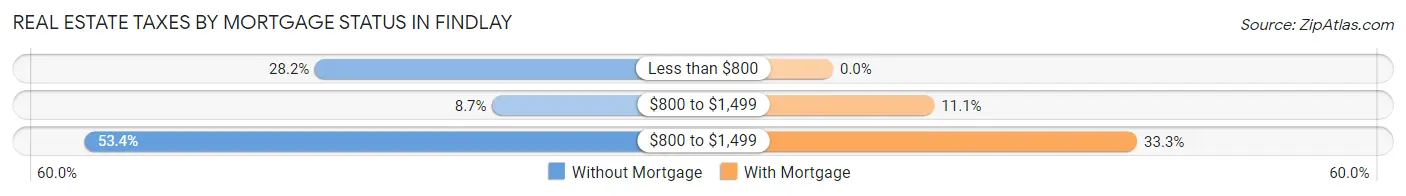
| Property Taxes | Without Mortgage | With Mortgage |
| Less than $800 | 29 (28.2%) | 0 (0.0%) |
| $800 to $1,499 | 9 (8.7%) | 14 (11.1%) |
| $800 to $1,499 | 55 (53.4%) | 42 (33.3%) |
| Total | 103 (100.0%) | 126 (100.0%) |
Health & Disability in Findlay
Health Insurance Coverage by Age in Findlay
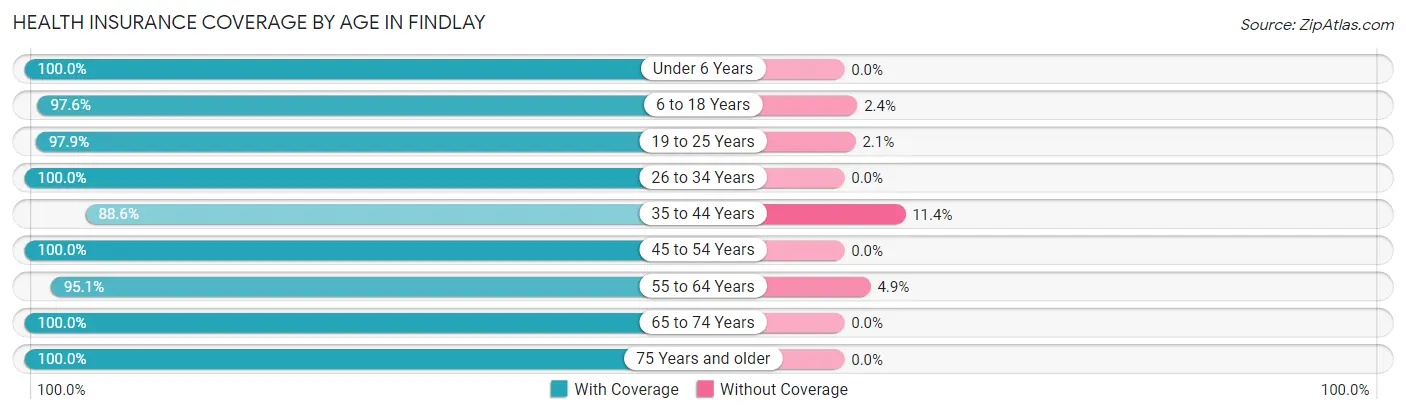
| Age Bracket | With Coverage | Without Coverage |
| Under 6 Years | 73 (100.0%) | 0 (0.0%) |
| 6 to 18 Years | 81 (97.6%) | 2 (2.4%) |
| 19 to 25 Years | 94 (97.9%) | 2 (2.1%) |
| 26 to 34 Years | 82 (100.0%) | 0 (0.0%) |
| 35 to 44 Years | 39 (88.6%) | 5 (11.4%) |
| 45 to 54 Years | 95 (100.0%) | 0 (0.0%) |
| 55 to 64 Years | 78 (95.1%) | 4 (4.9%) |
| 65 to 74 Years | 82 (100.0%) | 0 (0.0%) |
| 75 Years and older | 60 (100.0%) | 0 (0.0%) |
| Total | 684 (98.1%) | 13 (1.9%) |
Health Insurance Coverage by Citizenship Status in Findlay
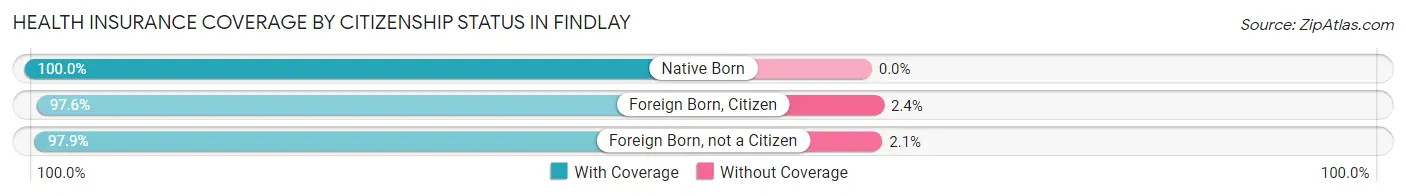
| Citizenship Status | With Coverage | Without Coverage |
| Native Born | 73 (100.0%) | 0 (0.0%) |
| Foreign Born, Citizen | 81 (97.6%) | 2 (2.4%) |
| Foreign Born, not a Citizen | 94 (97.9%) | 2 (2.1%) |
Health Insurance Coverage by Household Income in Findlay
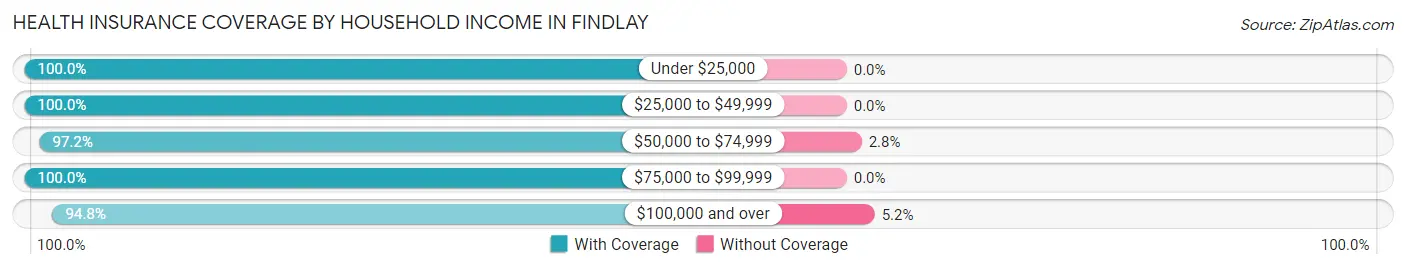
| Household Income | With Coverage | Without Coverage |
| Under $25,000 | 97 (100.0%) | 0 (0.0%) |
| $25,000 to $49,999 | 154 (100.0%) | 0 (0.0%) |
| $50,000 to $74,999 | 139 (97.2%) | 4 (2.8%) |
| $75,000 to $99,999 | 131 (100.0%) | 0 (0.0%) |
| $100,000 and over | 163 (94.8%) | 9 (5.2%) |
Public vs Private Health Insurance Coverage by Age in Findlay
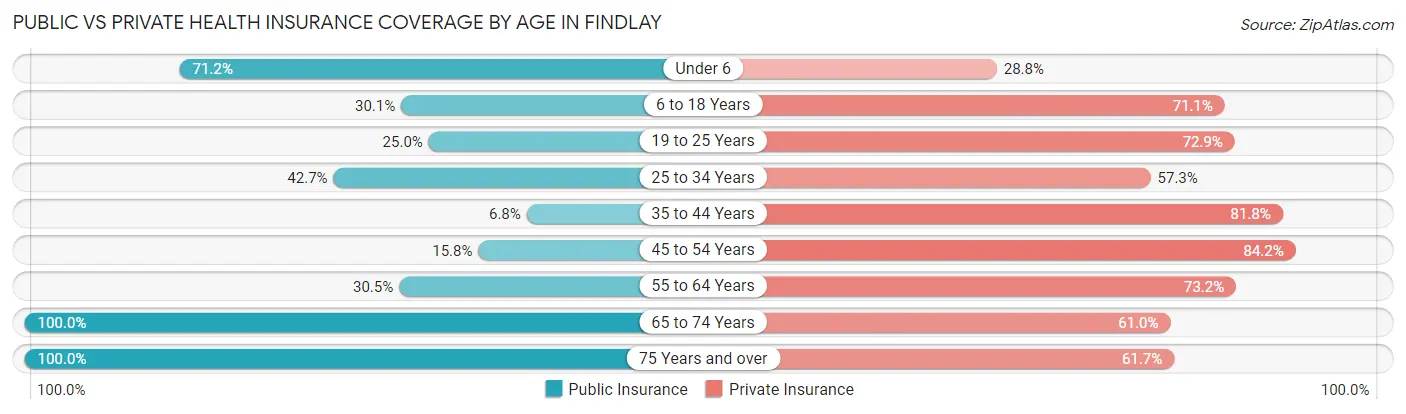
| Age Bracket | Public Insurance | Private Insurance |
| Under 6 | 52 (71.2%) | 21 (28.8%) |
| 6 to 18 Years | 25 (30.1%) | 59 (71.1%) |
| 19 to 25 Years | 24 (25.0%) | 70 (72.9%) |
| 25 to 34 Years | 35 (42.7%) | 47 (57.3%) |
| 35 to 44 Years | 3 (6.8%) | 36 (81.8%) |
| 45 to 54 Years | 15 (15.8%) | 80 (84.2%) |
| 55 to 64 Years | 25 (30.5%) | 60 (73.2%) |
| 65 to 74 Years | 82 (100.0%) | 50 (61.0%) |
| 75 Years and over | 60 (100.0%) | 37 (61.7%) |
| Total | 321 (46.1%) | 460 (66.0%) |
Disability Status by Sex by Age in Findlay
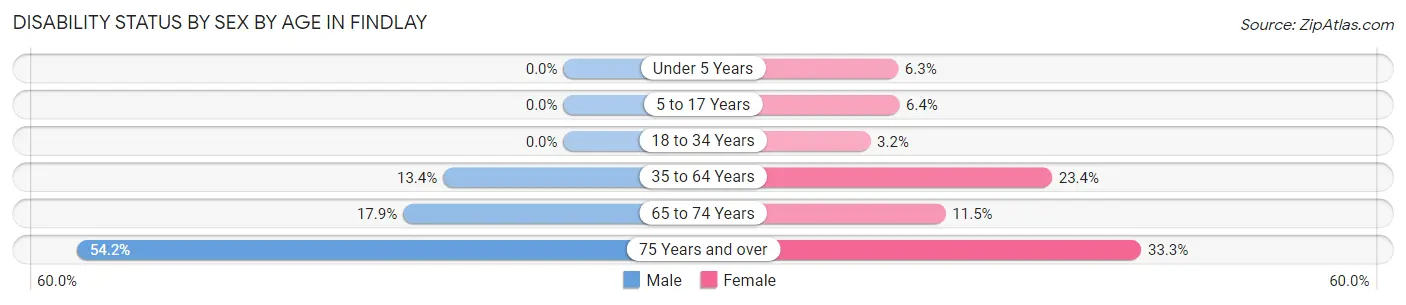
| Age Bracket | Male | Female |
| Under 5 Years | 0 (0.0%) | 2 (6.2%) |
| 5 to 17 Years | 0 (0.0%) | 3 (6.4%) |
| 18 to 34 Years | 0 (0.0%) | 3 (3.2%) |
| 35 to 64 Years | 13 (13.4%) | 29 (23.4%) |
| 65 to 74 Years | 10 (17.9%) | 3 (11.5%) |
| 75 Years and over | 13 (54.2%) | 12 (33.3%) |
Disability Class by Sex by Age in Findlay
Disability Class: Hearing Difficulty
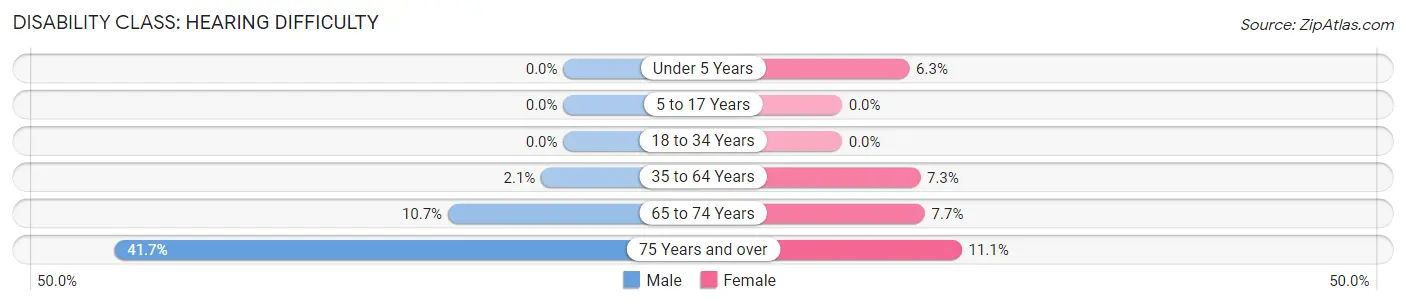
| Age Bracket | Male | Female |
| Under 5 Years | 0 (0.0%) | 2 (6.2%) |
| 5 to 17 Years | 0 (0.0%) | 0 (0.0%) |
| 18 to 34 Years | 0 (0.0%) | 0 (0.0%) |
| 35 to 64 Years | 2 (2.1%) | 9 (7.3%) |
| 65 to 74 Years | 6 (10.7%) | 2 (7.7%) |
| 75 Years and over | 10 (41.7%) | 4 (11.1%) |
Disability Class: Vision Difficulty
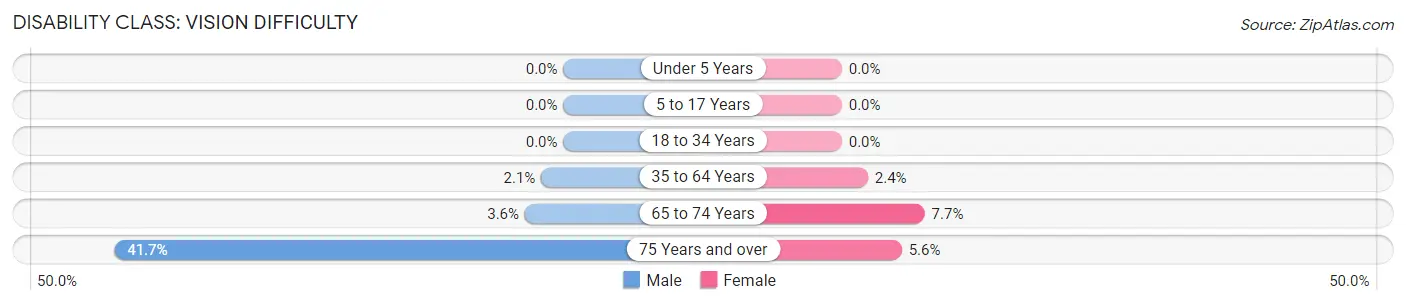
| Age Bracket | Male | Female |
| Under 5 Years | 0 (0.0%) | 0 (0.0%) |
| 5 to 17 Years | 0 (0.0%) | 0 (0.0%) |
| 18 to 34 Years | 0 (0.0%) | 0 (0.0%) |
| 35 to 64 Years | 2 (2.1%) | 3 (2.4%) |
| 65 to 74 Years | 2 (3.6%) | 2 (7.7%) |
| 75 Years and over | 10 (41.7%) | 2 (5.6%) |
Disability Class: Cognitive Difficulty
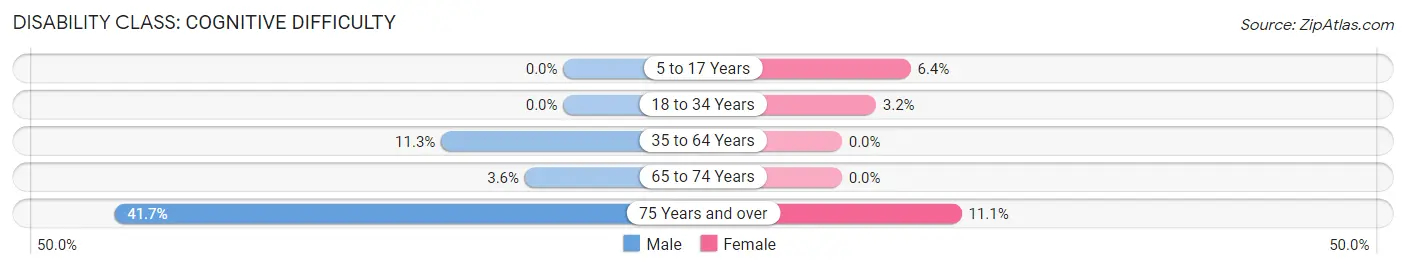
| Age Bracket | Male | Female |
| 5 to 17 Years | 0 (0.0%) | 3 (6.4%) |
| 18 to 34 Years | 0 (0.0%) | 3 (3.2%) |
| 35 to 64 Years | 11 (11.3%) | 0 (0.0%) |
| 65 to 74 Years | 2 (3.6%) | 0 (0.0%) |
| 75 Years and over | 10 (41.7%) | 4 (11.1%) |
Disability Class: Ambulatory Difficulty
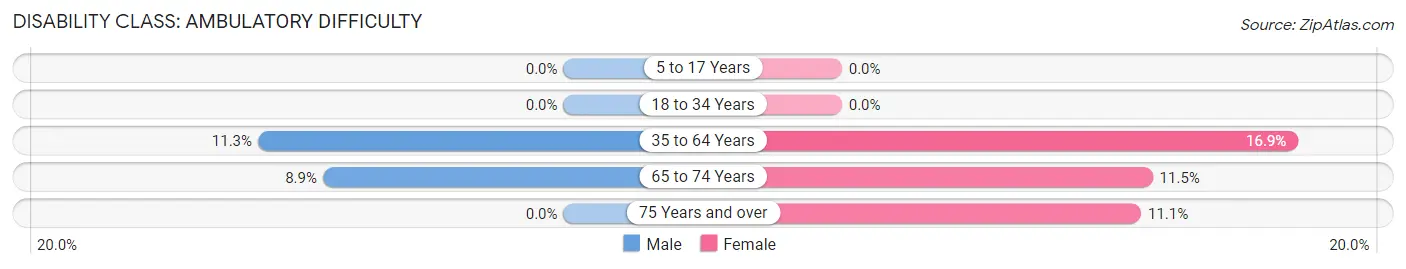
| Age Bracket | Male | Female |
| 5 to 17 Years | 0 (0.0%) | 0 (0.0%) |
| 18 to 34 Years | 0 (0.0%) | 0 (0.0%) |
| 35 to 64 Years | 11 (11.3%) | 21 (16.9%) |
| 65 to 74 Years | 5 (8.9%) | 3 (11.5%) |
| 75 Years and over | 0 (0.0%) | 4 (11.1%) |
Disability Class: Self-Care Difficulty
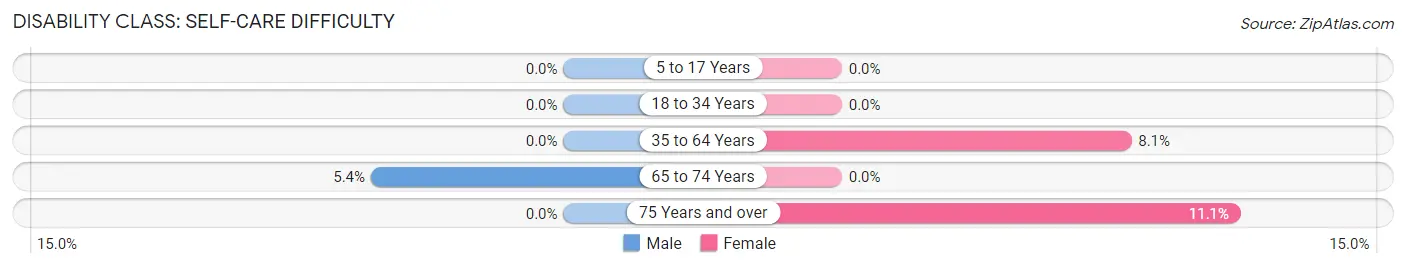
| Age Bracket | Male | Female |
| 5 to 17 Years | 0 (0.0%) | 0 (0.0%) |
| 18 to 34 Years | 0 (0.0%) | 0 (0.0%) |
| 35 to 64 Years | 0 (0.0%) | 10 (8.1%) |
| 65 to 74 Years | 3 (5.4%) | 0 (0.0%) |
| 75 Years and over | 0 (0.0%) | 4 (11.1%) |
Technology Access in Findlay
Computing Device Access in Findlay
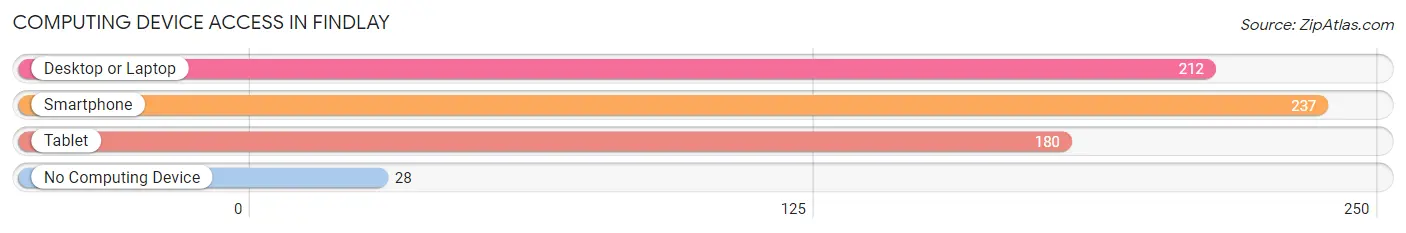
| Device Type | # Households | % Households |
| Desktop or Laptop | 212 | 71.9% |
| Smartphone | 237 | 80.3% |
| Tablet | 180 | 61.0% |
| No Computing Device | 28 | 9.5% |
| Total | 295 | 100.0% |
Internet Access in Findlay
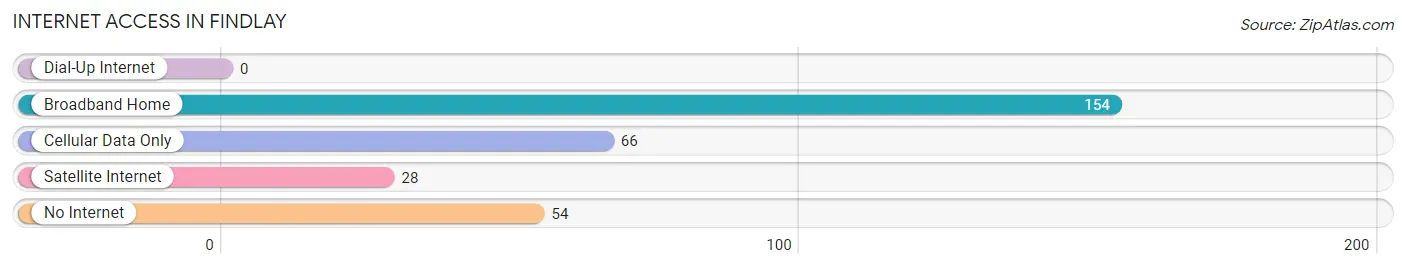
| Internet Type | # Households | % Households |
| Dial-Up Internet | 0 | 0.0% |
| Broadband Home | 154 | 52.2% |
| Cellular Data Only | 66 | 22.4% |
| Satellite Internet | 28 | 9.5% |
| No Internet | 54 | 18.3% |
| Total | 295 | 100.0% |
Findlay Summary
History
Findlay, Illinois is a small village located in Hancock County, Illinois. It is situated on the banks of the Mississippi River, approximately 25 miles south of Quincy. The village was founded in 1837 by a group of settlers from Ohio, led by William Findlay. The settlers were attracted to the area due to its fertile soil and abundant natural resources.
The village was originally known as Findlay’s Landing, and was a popular stop for steamboats traveling up and down the Mississippi River. The village was officially incorporated in 1854, and the name was changed to Findlay.
The village grew slowly over the years, and by the turn of the 20th century, it had a population of just over 500 people. The village was primarily an agricultural community, with most of the residents working in the fields or in the local sawmill.
In the early 1900s, the village began to experience a period of growth and prosperity. The population increased to over 1,000 people, and new businesses began to open up. The village also became a popular tourist destination, as people from all over the country came to visit the nearby Mississippi River.
In the 1950s, the village experienced a period of decline. Many of the businesses closed, and the population began to decline. However, in the late 1980s, the village began to experience a resurgence. New businesses opened up, and the population began to increase.
Today, Findlay is a small village with a population of just over 1,000 people. It is still primarily an agricultural community, but it has also become a popular tourist destination.
Geography
Findlay is located in Hancock County, Illinois, on the banks of the Mississippi River. The village is situated approximately 25 miles south of Quincy. The village is surrounded by rolling hills and farmland, and is located in the heart of the Midwest.
The village is located in a temperate climate, with hot summers and cold winters. The average temperature in the summer is around 80 degrees Fahrenheit, and the average temperature in the winter is around 30 degrees Fahrenheit.
The village is located in a rural area, and is surrounded by small towns and villages. The nearest major city is Quincy, which is located approximately 25 miles to the north.
Economy
Findlay is a small village with a population of just over 1,000 people. The village is primarily an agricultural community, with most of the residents working in the fields or in the local sawmill.
The village also has a few small businesses, including a grocery store, a hardware store, and a few restaurants. The village also has a few tourist attractions, including a museum and a historic district.
The village is also home to a few small manufacturing companies, which produce a variety of products, including furniture, clothing, and electronics.
Demographics
As of the 2010 census, Findlay had a population of 1,072 people. The racial makeup of the village was 97.3% White, 0.7% African American, 0.2% Native American, 0.2% Asian, 0.2% from other races, and 1.6% from two or more races. Hispanic or Latino of any race were 0.7% of the population.
The median income for a household in the village was $41,250, and the median income for a family was $50,000. The per capita income for the village was $19,945. About 8.3% of families and 10.2% of the population were below the poverty line, including 14.3% of those under age 18 and 6.3% of those age 65 or over.
Common Questions
What is Per Capita Income in Findlay?
Per Capita income in Findlay is $28,253.
What is the Median Family Income in Findlay?
Median Family Income in Findlay is $59,479.
What is the Median Household income in Findlay?
Median Household Income in Findlay is $54,205.
What is Income or Wage Gap in Findlay?
Income or Wage Gap in Findlay is 56.3%.
Women in Findlay earn 43.7 cents for every dollar earned by a man.
What is Inequality or Gini Index in Findlay?
Inequality or Gini Index in Findlay is 0.41.
What is the Total Population of Findlay?
Total Population of Findlay is 697.
What is the Total Male Population of Findlay?
Total Male Population of Findlay is 337.
What is the Total Female Population of Findlay?
Total Female Population of Findlay is 360.
What is the Ratio of Males per 100 Females in Findlay?
There are 93.61 Males per 100 Females in Findlay.
What is the Ratio of Females per 100 Males in Findlay?
There are 106.82 Females per 100 Males in Findlay.
What is the Median Population Age in Findlay?
Median Population Age in Findlay is 38.9 Years.
What is the Average Family Size in Findlay
Average Family Size in Findlay is 2.8 People.
What is the Average Household Size in Findlay
Average Household Size in Findlay is 2.4 People.
How Large is the Labor Force in Findlay?
There are 371 People in the Labor Forcein in Findlay.
What is the Percentage of People in the Labor Force in Findlay?
65.3% of People are in the Labor Force in Findlay.
What is the Unemployment Rate in Findlay?
Unemployment Rate in Findlay is 5.1%.