Fairbury, IL Map & Demographics
Fairbury Map
Fairbury Overview
$35,020
PER CAPITA INCOME
$86,319
AVG FAMILY INCOME
$64,150
AVG HOUSEHOLD INCOME
36.2%
WAGE / INCOME GAP [ % ]
63.8¢/ $1
WAGE / INCOME GAP [ $ ]
0.37
INEQUALITY / GINI INDEX
3,731
TOTAL POPULATION
1,685
MALE POPULATION
2,046
FEMALE POPULATION
82.36
MALES / 100 FEMALES
121.42
FEMALES / 100 MALES
44.3
MEDIAN AGE
2.7
AVG FAMILY SIZE
2.3
AVG HOUSEHOLD SIZE
1,727
LABOR FORCE [ PEOPLE ]
57.9%
PERCENT IN LABOR FORCE
3.6%
UNEMPLOYMENT RATE
Fairbury Zip Codes
Fairbury Area Codes
Income in Fairbury
Income Overview in Fairbury
Per Capita Income in Fairbury is $35,020, while median incomes of families and households are $86,319 and $64,150 respectively.
| Characteristic | Number | Measure |
| Per Capita Income | 3,731 | $35,020 |
| Median Family Income | 1,143 | $86,319 |
| Mean Family Income | 1,143 | $94,500 |
| Median Household Income | 1,596 | $64,150 |
| Mean Household Income | 1,596 | $82,063 |
| Income Deficit | 1,143 | $0 |
| Wage / Income Gap (%) | 3,731 | 36.21% |
| Wage / Income Gap ($) | 3,731 | 63.79¢ per $1 |
| Gini / Inequality Index | 3,731 | 0.37 |
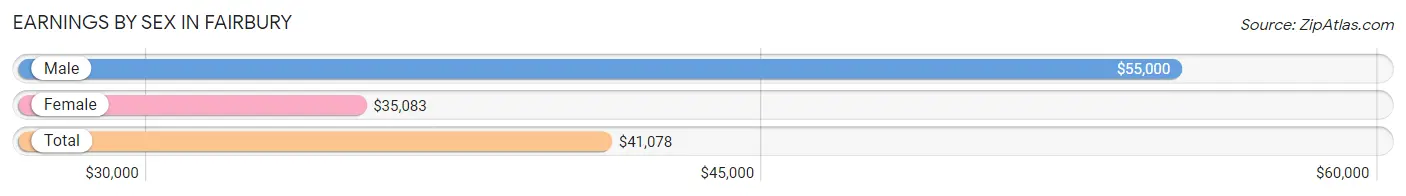
Earnings by Sex in Fairbury
Average Earnings in Fairbury are $41,078, $55,000 for men and $35,083 for women, a difference of 36.2%.
| Sex | Number | Average Earnings |
| Male | 920 (50.0%) | $55,000 |
| Female | 921 (50.0%) | $35,083 |
| Total | 1,841 (100.0%) | $41,078 |
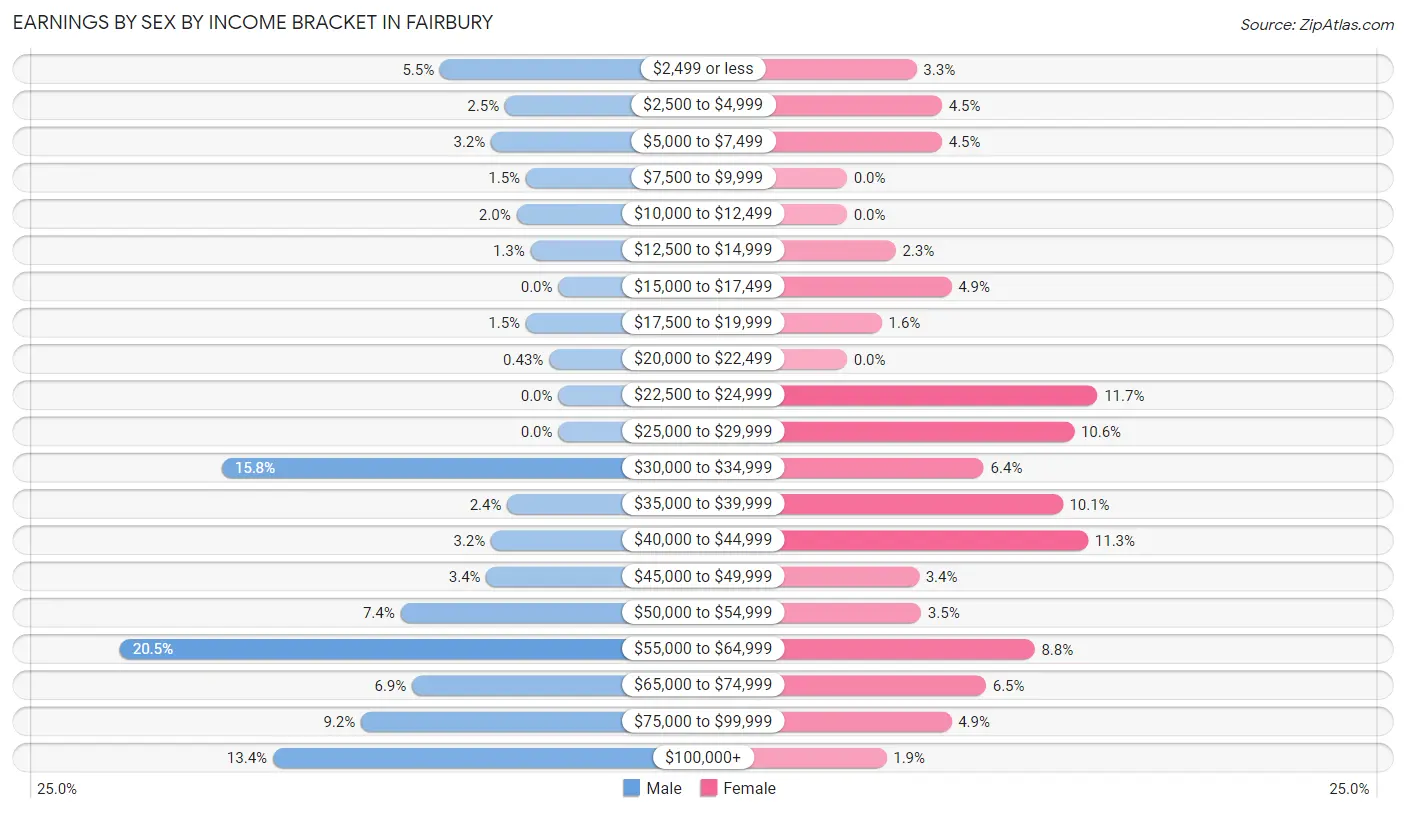
Earnings by Sex by Income Bracket in Fairbury
The most common earnings brackets in Fairbury are $55,000 to $64,999 for men (189 | 20.5%) and $22,500 to $24,999 for women (108 | 11.7%).
| Income | Male | Female |
| $2,499 or less | 51 (5.5%) | 30 (3.3%) |
| $2,500 to $4,999 | 23 (2.5%) | 41 (4.4%) |
| $5,000 to $7,499 | 29 (3.2%) | 41 (4.4%) |
| $7,500 to $9,999 | 14 (1.5%) | 0 (0.0%) |
| $10,000 to $12,499 | 18 (2.0%) | 0 (0.0%) |
| $12,500 to $14,999 | 12 (1.3%) | 21 (2.3%) |
| $15,000 to $17,499 | 0 (0.0%) | 45 (4.9%) |
| $17,500 to $19,999 | 14 (1.5%) | 15 (1.6%) |
| $20,000 to $22,499 | 4 (0.4%) | 0 (0.0%) |
| $22,500 to $24,999 | 0 (0.0%) | 108 (11.7%) |
| $25,000 to $29,999 | 0 (0.0%) | 98 (10.6%) |
| $30,000 to $34,999 | 145 (15.8%) | 59 (6.4%) |
| $35,000 to $39,999 | 22 (2.4%) | 93 (10.1%) |
| $40,000 to $44,999 | 29 (3.2%) | 104 (11.3%) |
| $45,000 to $49,999 | 31 (3.4%) | 31 (3.4%) |
| $50,000 to $54,999 | 68 (7.4%) | 32 (3.5%) |
| $55,000 to $64,999 | 189 (20.5%) | 81 (8.8%) |
| $65,000 to $74,999 | 63 (6.9%) | 60 (6.5%) |
| $75,000 to $99,999 | 85 (9.2%) | 45 (4.9%) |
| $100,000+ | 123 (13.4%) | 17 (1.8%) |
| Total | 920 (100.0%) | 921 (100.0%) |
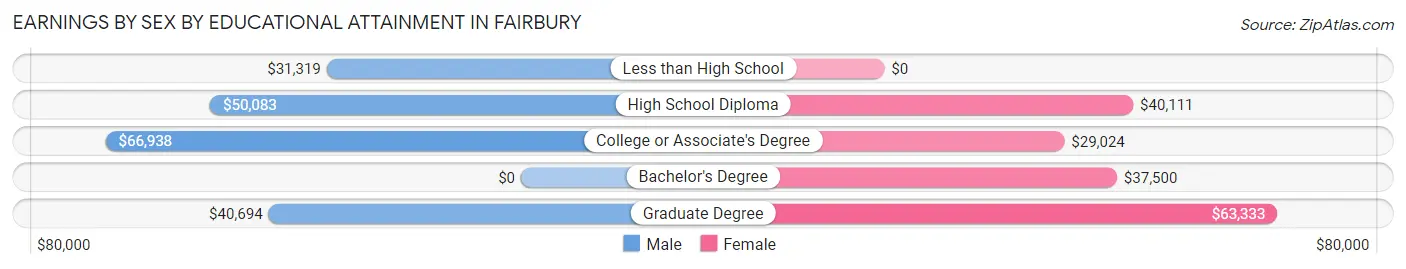
Earnings by Sex by Educational Attainment in Fairbury
Average earnings in Fairbury are $55,372 for men and $36,467 for women, a difference of 34.1%. Men with an educational attainment of college or associate's degree enjoy the highest average annual earnings of $66,938, while those with less than high school education earn the least with $31,319. Women with an educational attainment of graduate degree earn the most with the average annual earnings of $63,333, while those with college or associate's degree education have the smallest earnings of $29,024.
| Educational Attainment | Male Income | Female Income |
| Less than High School | $31,319 | $0 |
| High School Diploma | $50,083 | $40,111 |
| College or Associate's Degree | $66,938 | $29,024 |
| Bachelor's Degree | - | - |
| Graduate Degree | $40,694 | $63,333 |
| Total | $55,372 | $36,467 |
Family Income in Fairbury
Family Income Brackets in Fairbury
According to the Fairbury family income data, there are 251 families falling into the $100,000 to $149,999 income range, which is the most common income bracket and makes up 22.0% of all families.
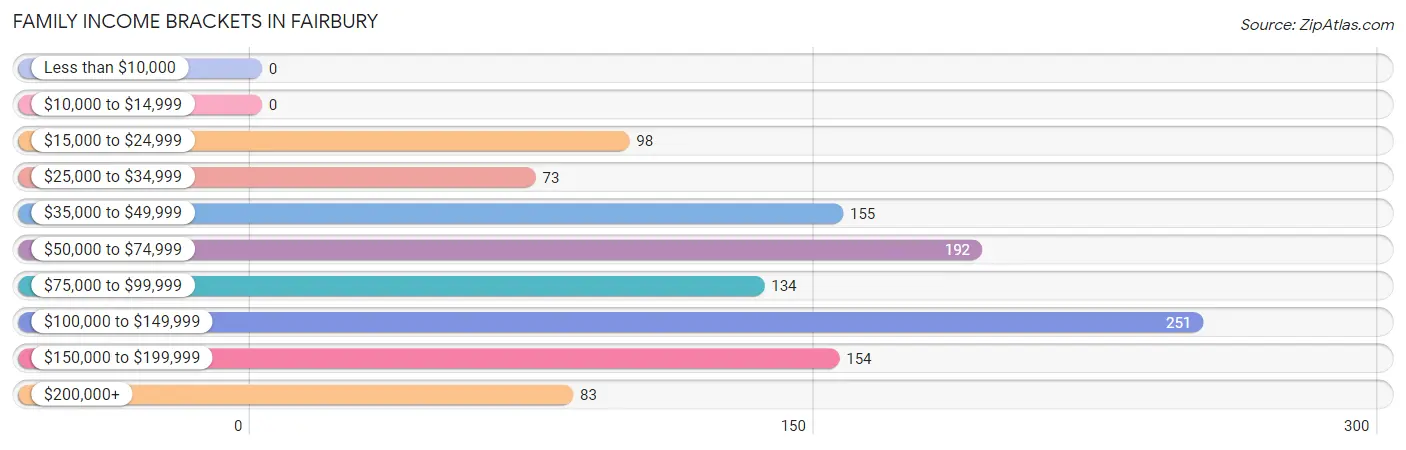
| Income Bracket | # Families | % Families |
| Less than $10,000 | 0 | 0.0% |
| $10,000 to $14,999 | 0 | 0.0% |
| $15,000 to $24,999 | 98 | 8.6% |
| $25,000 to $34,999 | 73 | 6.4% |
| $35,000 to $49,999 | 155 | 13.6% |
| $50,000 to $74,999 | 192 | 16.8% |
| $75,000 to $99,999 | 134 | 11.7% |
| $100,000 to $149,999 | 251 | 22.0% |
| $150,000 to $199,999 | 154 | 13.5% |
| $200,000+ | 83 | 7.3% |
Family Income by Famaliy Size in Fairbury
3-person families (435 | 38.1%) account for the highest median family income in Fairbury with $101,890 per family, while 2-person families (445 | 38.9%) have the highest median income of $39,976 per family member.
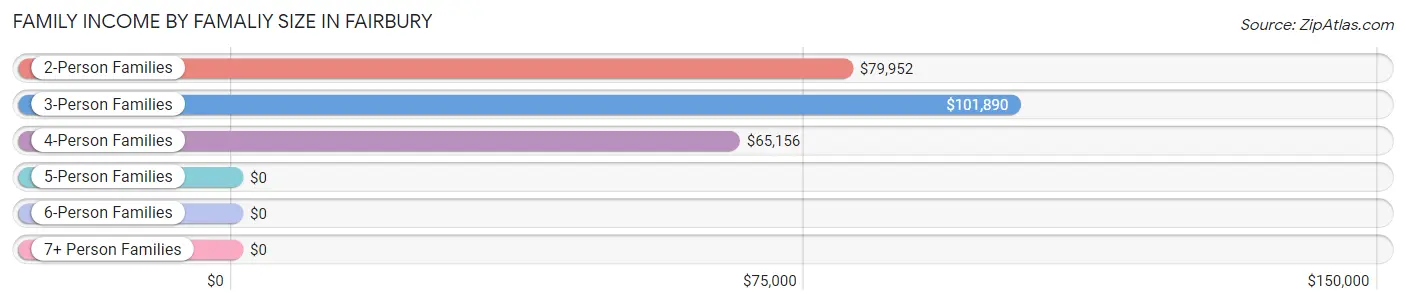
| Income Bracket | # Families | Median Income |
| 2-Person Families | 445 (38.9%) | $79,952 |
| 3-Person Families | 435 (38.1%) | $101,890 |
| 4-Person Families | 157 (13.7%) | $65,156 |
| 5-Person Families | 82 (7.2%) | $0 |
| 6-Person Families | 24 (2.1%) | $0 |
| 7+ Person Families | 0 (0.0%) | $0 |
| Total | 1,143 (100.0%) | $86,319 |
Family Income by Number of Earners in Fairbury

| Number of Earners | # Families | Median Income |
| No Earners | 122 (10.7%) | $0 |
| 1 Earner | 560 (49.0%) | $55,563 |
| 2 Earners | 326 (28.5%) | $116,750 |
| 3+ Earners | 135 (11.8%) | $161,417 |
| Total | 1,143 (100.0%) | $86,319 |
Household Income in Fairbury
Household Income Brackets in Fairbury
With 322 households falling in the category, the $50,000 to $74,999 income range is the most frequent in Fairbury, accounting for 20.2% of all households.
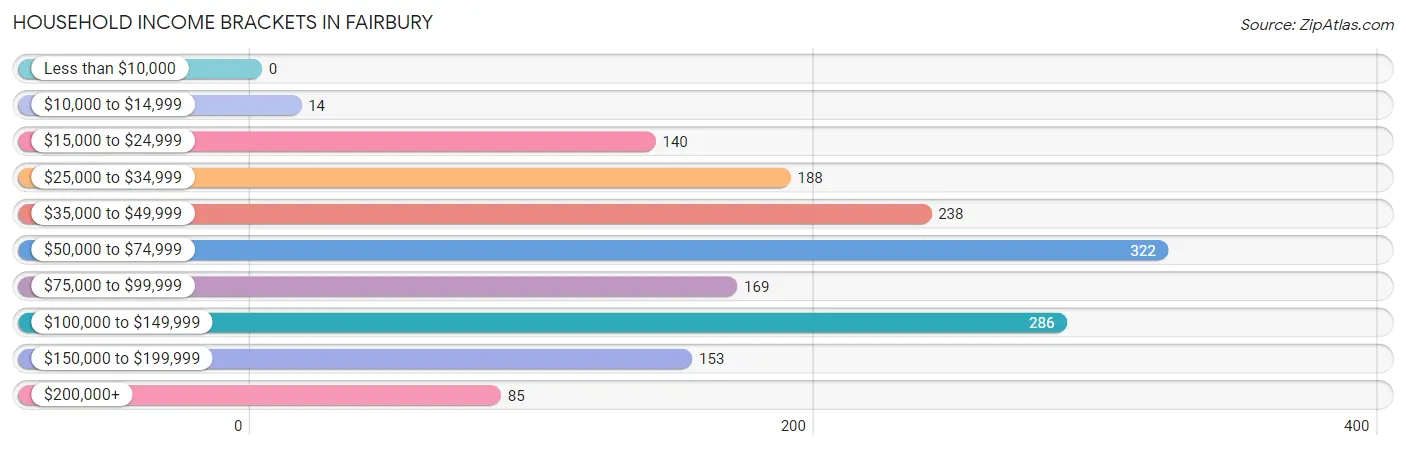
| Income Bracket | # Households | % Households |
| Less than $10,000 | 0 | 0.0% |
| $10,000 to $14,999 | 14 | 0.9% |
| $15,000 to $24,999 | 140 | 8.8% |
| $25,000 to $34,999 | 188 | 11.8% |
| $35,000 to $49,999 | 238 | 14.9% |
| $50,000 to $74,999 | 322 | 20.2% |
| $75,000 to $99,999 | 169 | 10.6% |
| $100,000 to $149,999 | 286 | 17.9% |
| $150,000 to $199,999 | 153 | 9.6% |
| $200,000+ | 85 | 5.3% |
Household Income by Householder Age in Fairbury
The median household income in Fairbury is $64,150, with the highest median household income of $76,397 found in the 45 to 64 years age bracket for the primary householder. A total of 507 households (31.8%) fall into this category. Meanwhile, the 15 to 24 years age bracket for the primary householder has the lowest median household income of $0, with 64 households (4.0%) in this group.
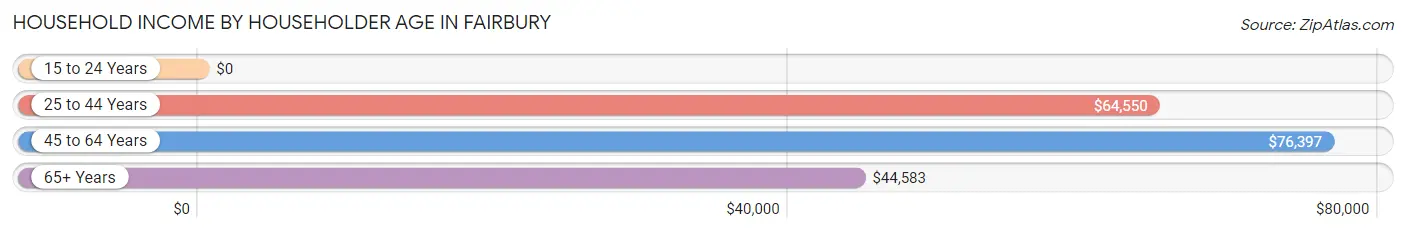
| Income Bracket | # Households | Median Income |
| 15 to 24 Years | 64 (4.0%) | $0 |
| 25 to 44 Years | 452 (28.3%) | $64,550 |
| 45 to 64 Years | 507 (31.8%) | $76,397 |
| 65+ Years | 573 (35.9%) | $44,583 |
| Total | 1,596 (100.0%) | $64,150 |
Poverty in Fairbury
Income Below Poverty by Sex and Age in Fairbury
With 0.5% poverty level for males and 3.4% for females among the residents of Fairbury, 16 and 17 year old males and 75 year old and over females are the most vulnerable to poverty, with 8 males (5.8%) and 31 females (13.6%) in their respective age groups living below the poverty level.
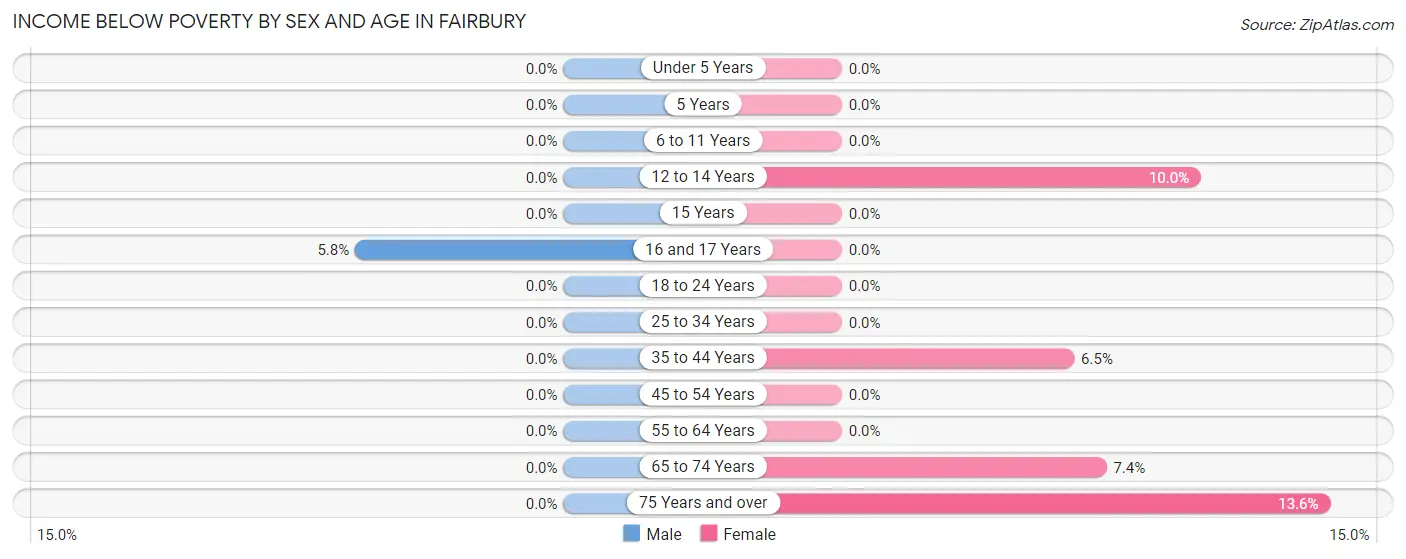
| Age Bracket | Male | Female |
| Under 5 Years | 0 (0.0%) | 0 (0.0%) |
| 5 Years | 0 (0.0%) | 0 (0.0%) |
| 6 to 11 Years | 0 (0.0%) | 0 (0.0%) |
| 12 to 14 Years | 0 (0.0%) | 8 (10.0%) |
| 15 Years | 0 (0.0%) | 0 (0.0%) |
| 16 and 17 Years | 8 (5.8%) | 0 (0.0%) |
| 18 to 24 Years | 0 (0.0%) | 0 (0.0%) |
| 25 to 34 Years | 0 (0.0%) | 0 (0.0%) |
| 35 to 44 Years | 0 (0.0%) | 15 (6.5%) |
| 45 to 54 Years | 0 (0.0%) | 0 (0.0%) |
| 55 to 64 Years | 0 (0.0%) | 0 (0.0%) |
| 65 to 74 Years | 0 (0.0%) | 14 (7.4%) |
| 75 Years and over | 0 (0.0%) | 31 (13.6%) |
| Total | 8 (0.5%) | 68 (3.4%) |
Income Above Poverty by Sex and Age in Fairbury
According to the poverty statistics in Fairbury, males aged under 5 years and females aged under 5 years are the age groups that are most secure financially, with 100.0% of males and 100.0% of females in these age groups living above the poverty line.
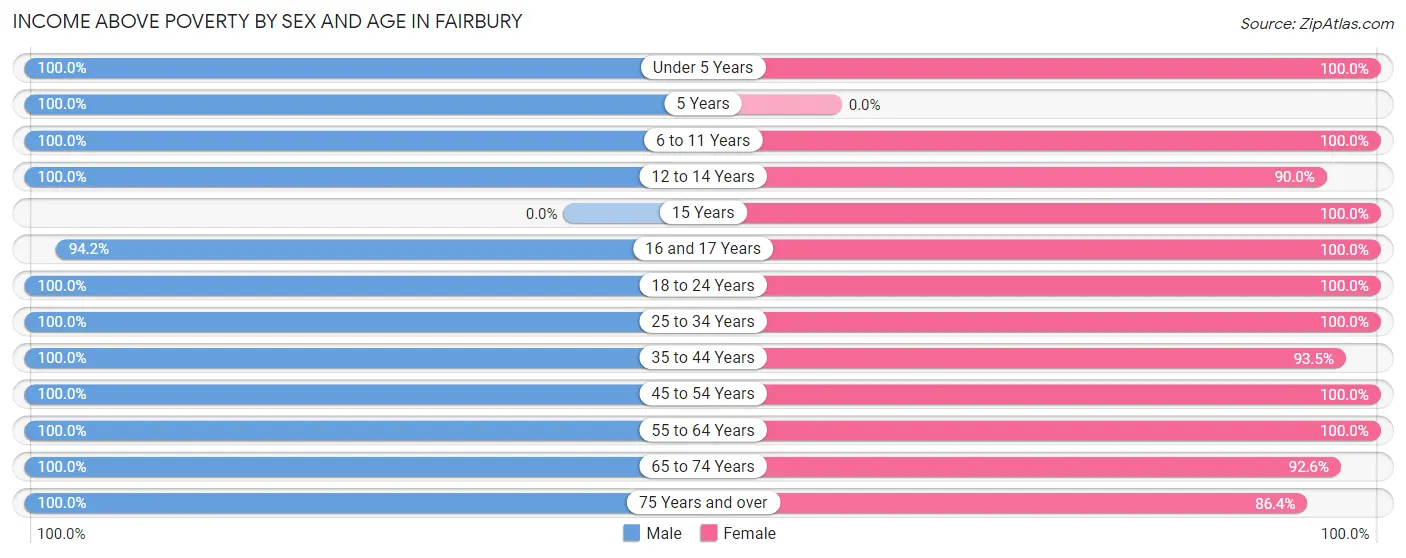
| Age Bracket | Male | Female |
| Under 5 Years | 66 (100.0%) | 177 (100.0%) |
| 5 Years | 76 (100.0%) | 0 (0.0%) |
| 6 to 11 Years | 37 (100.0%) | 203 (100.0%) |
| 12 to 14 Years | 97 (100.0%) | 72 (90.0%) |
| 15 Years | 0 (0.0%) | 13 (100.0%) |
| 16 and 17 Years | 130 (94.2%) | 54 (100.0%) |
| 18 to 24 Years | 115 (100.0%) | 98 (100.0%) |
| 25 to 34 Years | 177 (100.0%) | 192 (100.0%) |
| 35 to 44 Years | 159 (100.0%) | 217 (93.5%) |
| 45 to 54 Years | 198 (100.0%) | 184 (100.0%) |
| 55 to 64 Years | 178 (100.0%) | 353 (100.0%) |
| 65 to 74 Years | 243 (100.0%) | 176 (92.6%) |
| 75 Years and over | 176 (100.0%) | 197 (86.4%) |
| Total | 1,652 (99.5%) | 1,936 (96.6%) |
Income Below Poverty Among Married-Couple Families in Fairbury
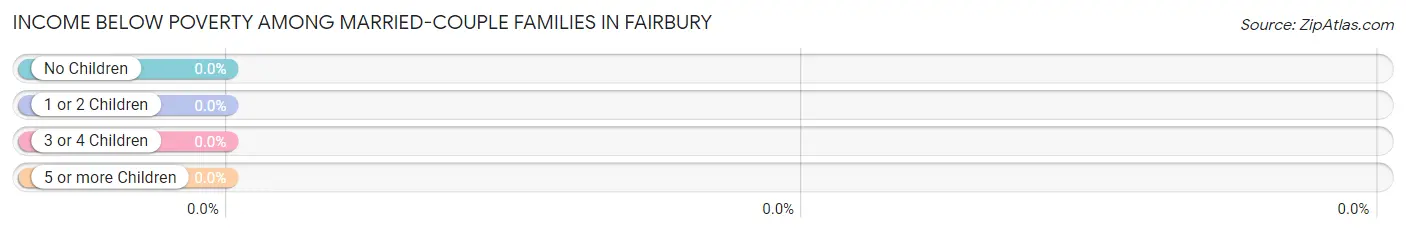
| Children | Above Poverty | Below Poverty |
| No Children | 470 (100.0%) | 0 (0.0%) |
| 1 or 2 Children | 304 (100.0%) | 0 (0.0%) |
| 3 or 4 Children | 0 (0.0%) | 0 (0.0%) |
| 5 or more Children | 0 (0.0%) | 0 (0.0%) |
| Total | 774 (100.0%) | 0 (0.0%) |
Income Below Poverty Among Single-Parent Households in Fairbury
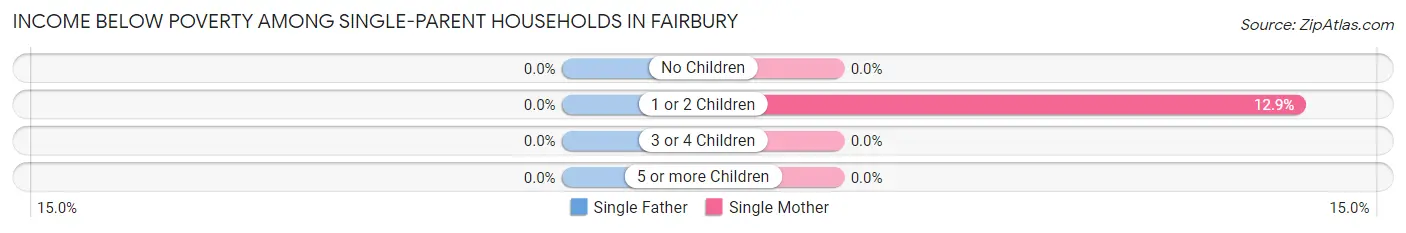
| Children | Single Father | Single Mother |
| No Children | 0 (0.0%) | 0 (0.0%) |
| 1 or 2 Children | 0 (0.0%) | 31 (12.9%) |
| 3 or 4 Children | 0 (0.0%) | 0 (0.0%) |
| 5 or more Children | 0 (0.0%) | 0 (0.0%) |
| Total | 0 (0.0%) | 31 (9.6%) |
Income Below Poverty Among Married-Couple vs Single-Parent Households in Fairbury
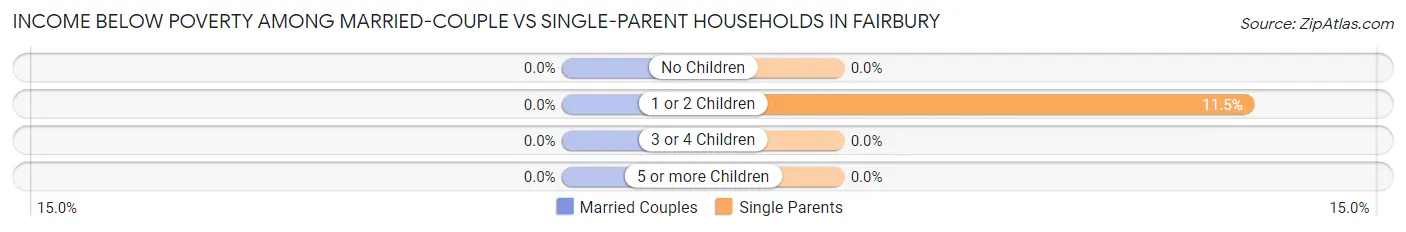
| Children | Married-Couple Families | Single-Parent Households |
| No Children | 0 (0.0%) | 0 (0.0%) |
| 1 or 2 Children | 0 (0.0%) | 31 (11.5%) |
| 3 or 4 Children | 0 (0.0%) | 0 (0.0%) |
| 5 or more Children | 0 (0.0%) | 0 (0.0%) |
| Total | 0 (0.0%) | 31 (8.4%) |
Race in Fairbury
The most populous races in Fairbury are White / Caucasian (3,587 | 96.1%), Hispanic or Latino (196 | 5.2%), and Two or more Races (86 | 2.3%).
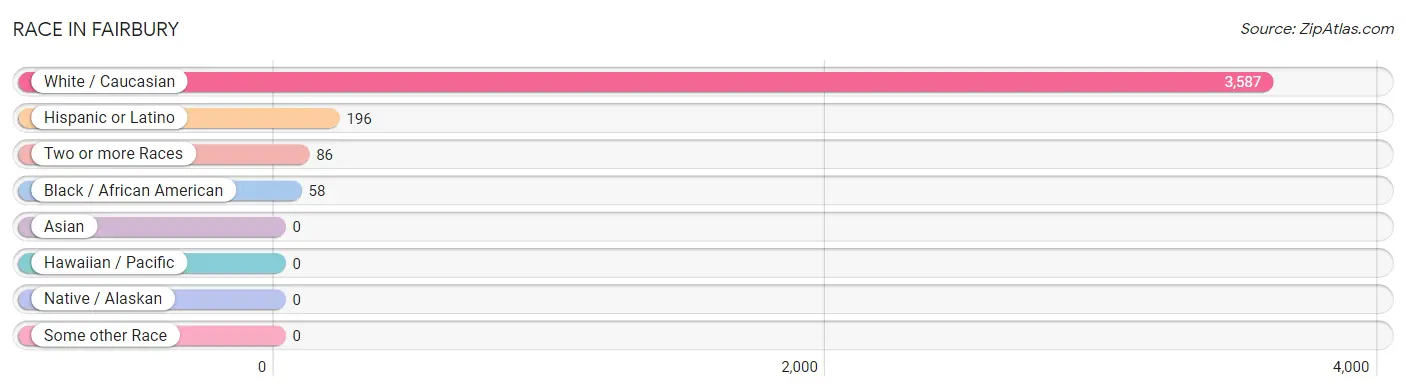
| Race | # Population | % Population |
| Asian | 0 | 0.0% |
| Black / African American | 58 | 1.5% |
| Hawaiian / Pacific | 0 | 0.0% |
| Hispanic or Latino | 196 | 5.2% |
| Native / Alaskan | 0 | 0.0% |
| White / Caucasian | 3,587 | 96.1% |
| Two or more Races | 86 | 2.3% |
| Some other Race | 0 | 0.0% |
| Total | 3,731 | 100.0% |
Ancestry in Fairbury
The most populous ancestries reported in Fairbury are German (1,221 | 32.7%), Irish (769 | 20.6%), English (437 | 11.7%), American (291 | 7.8%), and Mexican (138 | 3.7%), together accounting for 76.5% of all Fairbury residents.
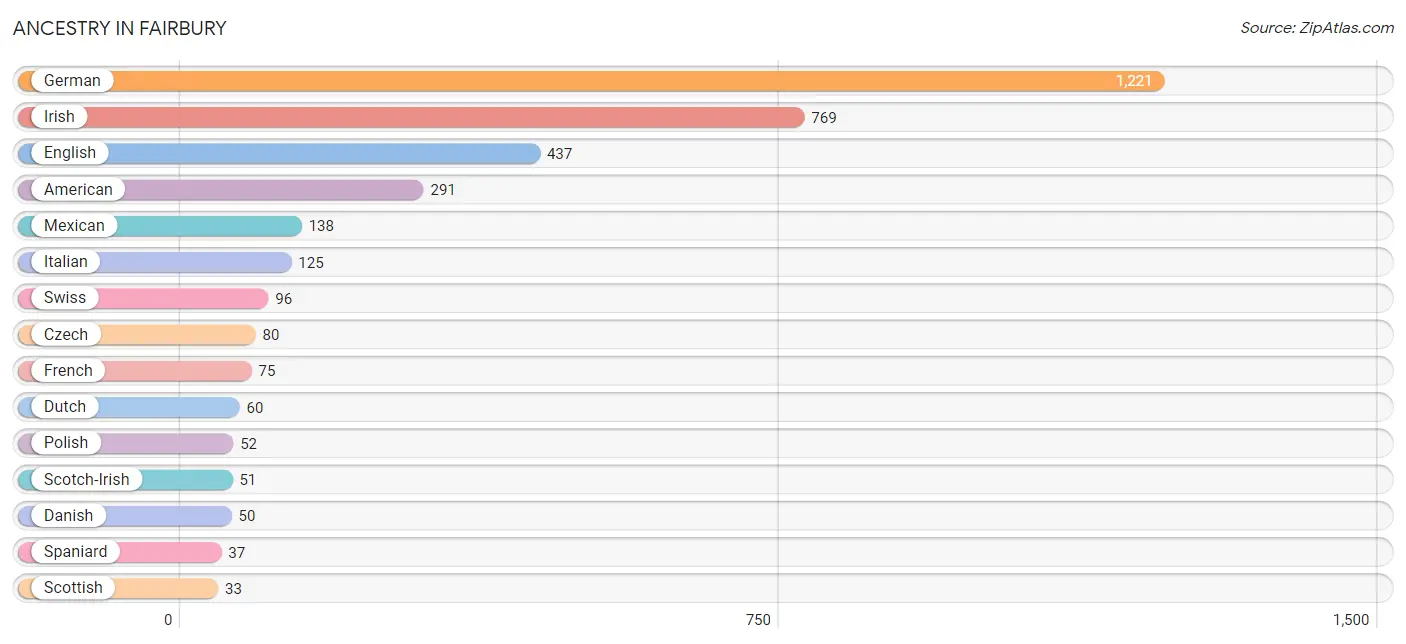
| Ancestry | # Population | % Population |
| American | 291 | 7.8% |
| Czech | 80 | 2.1% |
| Danish | 50 | 1.3% |
| Dutch | 60 | 1.6% |
| English | 437 | 11.7% |
| European | 18 | 0.5% |
| French | 75 | 2.0% |
| German | 1,221 | 32.7% |
| Hungarian | 14 | 0.4% |
| Irish | 769 | 20.6% |
| Italian | 125 | 3.4% |
| Lithuanian | 31 | 0.8% |
| Mexican | 138 | 3.7% |
| Norwegian | 13 | 0.4% |
| Polish | 52 | 1.4% |
| Scotch-Irish | 51 | 1.4% |
| Scottish | 33 | 0.9% |
| Spaniard | 37 | 1.0% |
| Swedish | 14 | 0.4% |
| Swiss | 96 | 2.6% | View All 20 Rows |
Immigrants in Fairbury

| Immigration Origin | # Population | % Population | View All 0 Rows |
Sex and Age in Fairbury
Sex and Age in Fairbury
The most populous age groups in Fairbury are 25 to 29 Years (177 | 10.5%) for men and 60 to 64 Years (180 | 8.8%) for women.
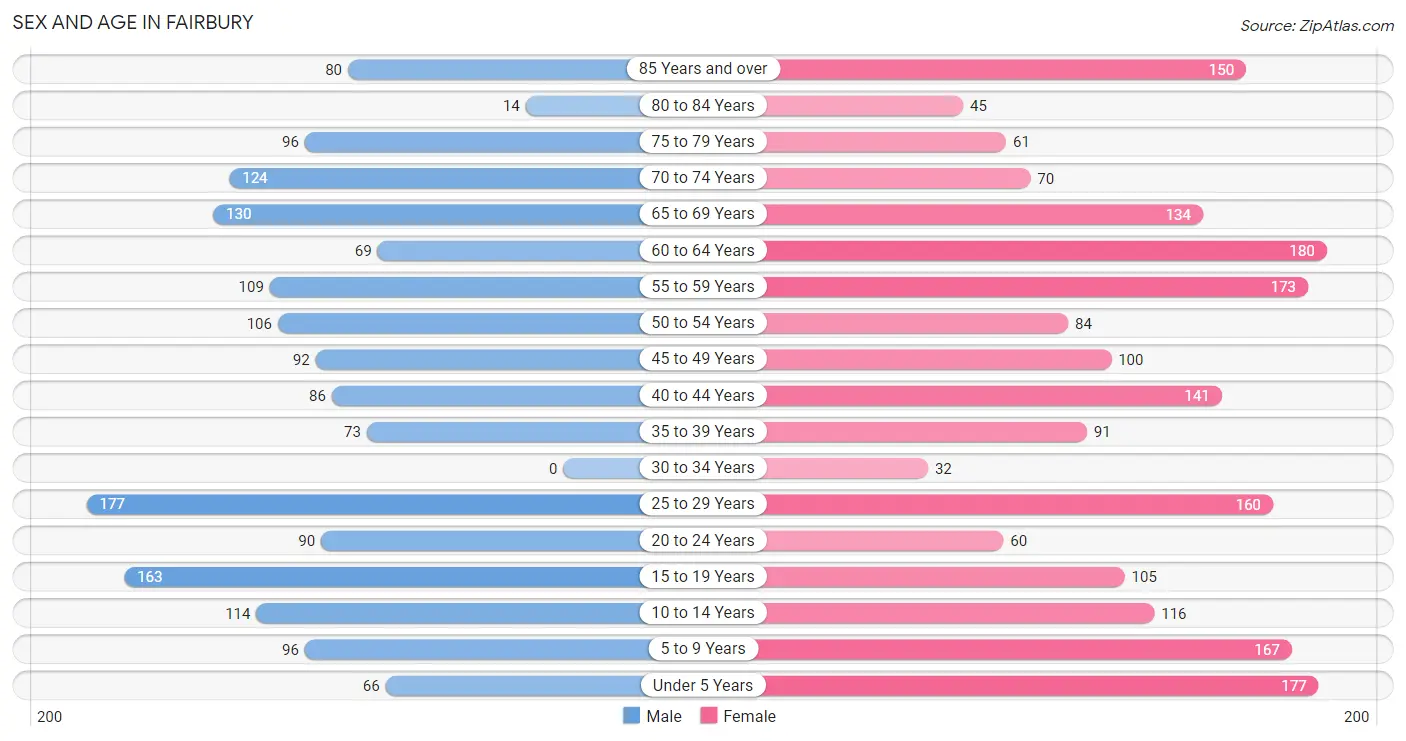
| Age Bracket | Male | Female |
| Under 5 Years | 66 (3.9%) | 177 (8.6%) |
| 5 to 9 Years | 96 (5.7%) | 167 (8.2%) |
| 10 to 14 Years | 114 (6.8%) | 116 (5.7%) |
| 15 to 19 Years | 163 (9.7%) | 105 (5.1%) |
| 20 to 24 Years | 90 (5.3%) | 60 (2.9%) |
| 25 to 29 Years | 177 (10.5%) | 160 (7.8%) |
| 30 to 34 Years | 0 (0.0%) | 32 (1.6%) |
| 35 to 39 Years | 73 (4.3%) | 91 (4.4%) |
| 40 to 44 Years | 86 (5.1%) | 141 (6.9%) |
| 45 to 49 Years | 92 (5.5%) | 100 (4.9%) |
| 50 to 54 Years | 106 (6.3%) | 84 (4.1%) |
| 55 to 59 Years | 109 (6.5%) | 173 (8.5%) |
| 60 to 64 Years | 69 (4.1%) | 180 (8.8%) |
| 65 to 69 Years | 130 (7.7%) | 134 (6.6%) |
| 70 to 74 Years | 124 (7.4%) | 70 (3.4%) |
| 75 to 79 Years | 96 (5.7%) | 61 (3.0%) |
| 80 to 84 Years | 14 (0.8%) | 45 (2.2%) |
| 85 Years and over | 80 (4.8%) | 150 (7.3%) |
| Total | 1,685 (100.0%) | 2,046 (100.0%) |
Families and Households in Fairbury
Median Family Size in Fairbury
The median family size in Fairbury is 2.72 persons per family, with single male/father families (46 | 4.0%) accounting for the largest median family size of 3.61 persons per family. On the other hand, married-couple families (774 | 67.7%) represent the smallest median family size with 2.66 persons per family.
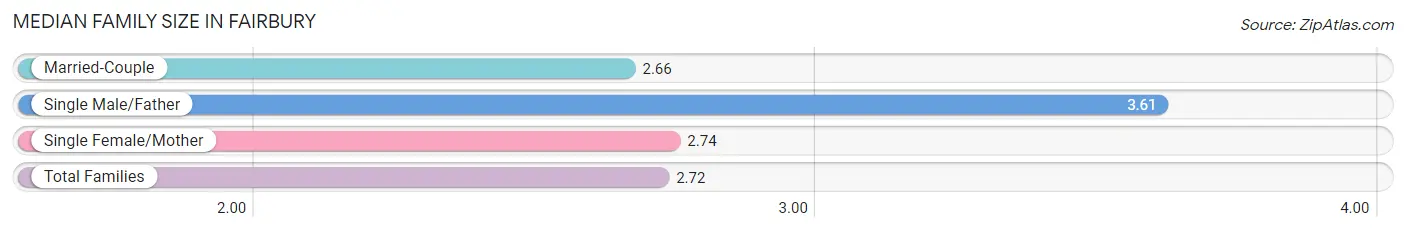
| Family Type | # Families | Family Size |
| Married-Couple | 774 (67.7%) | 2.66 |
| Single Male/Father | 46 (4.0%) | 3.61 |
| Single Female/Mother | 323 (28.3%) | 2.74 |
| Total Families | 1,143 (100.0%) | 2.72 |
Median Household Size in Fairbury
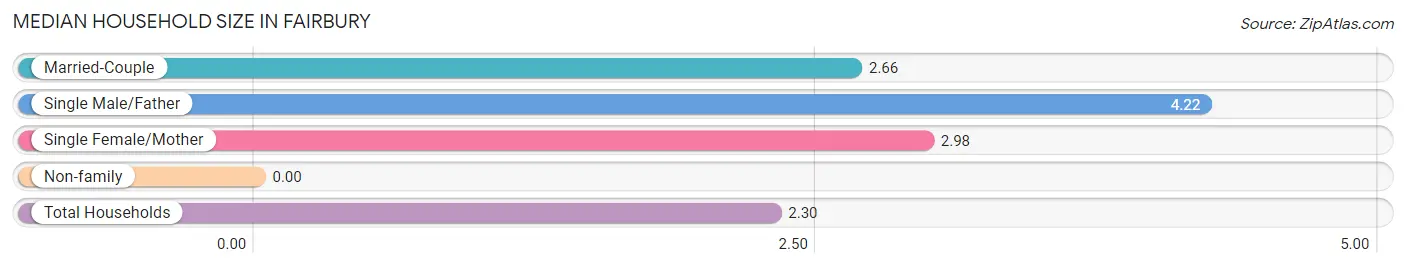
| Household Type | # Households | Household Size |
| Married-Couple | 774 (48.5%) | 2.66 |
| Single Male/Father | 46 (2.9%) | 4.22 |
| Single Female/Mother | 323 (20.2%) | 2.98 |
| Non-family | 453 (28.4%) | - |
| Total Households | 1,596 (100.0%) | 2.30 |
Household Size by Marriage Status in Fairbury
Out of a total of 1,596 households in Fairbury, 1,143 (71.6%) are family households, while 453 (28.4%) are nonfamily households. The most numerous type of family households are 3-person households, comprising 454, and the most common type of nonfamily households are 1-person households, comprising 453.
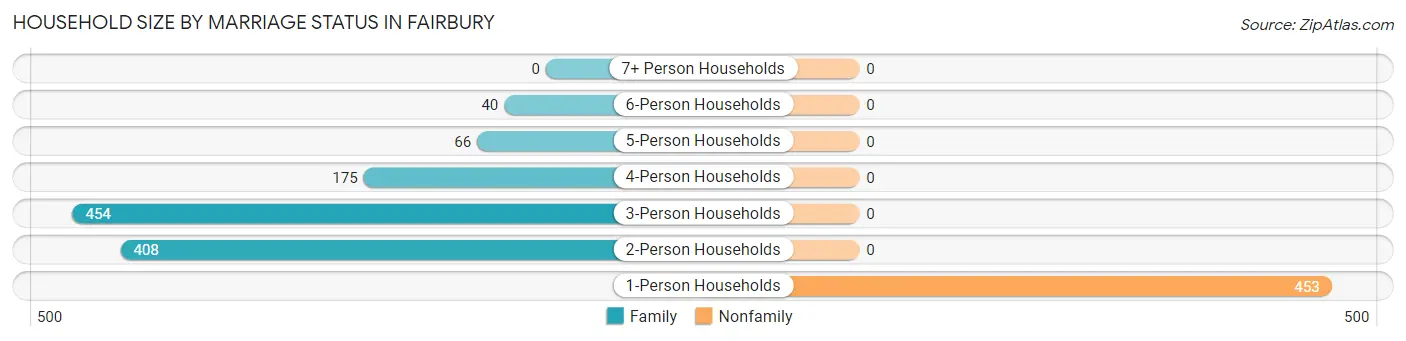
| Household Size | Family Households | Nonfamily Households |
| 1-Person Households | - | 453 (28.4%) |
| 2-Person Households | 408 (25.6%) | 0 (0.0%) |
| 3-Person Households | 454 (28.4%) | 0 (0.0%) |
| 4-Person Households | 175 (11.0%) | 0 (0.0%) |
| 5-Person Households | 66 (4.1%) | 0 (0.0%) |
| 6-Person Households | 40 (2.5%) | 0 (0.0%) |
| 7+ Person Households | 0 (0.0%) | 0 (0.0%) |
| Total | 1,143 (71.6%) | 453 (28.4%) |
Female Fertility in Fairbury
Fertility by Age in Fairbury
Average fertility rate in Fairbury is 84.0 births per 1,000 women. Women in the age bracket of 20 to 34 years have the highest fertility rate with 242.0 births per 1,000 women. Women in the age bracket of 20 to 34 years acount for 100.0% of all women with births.
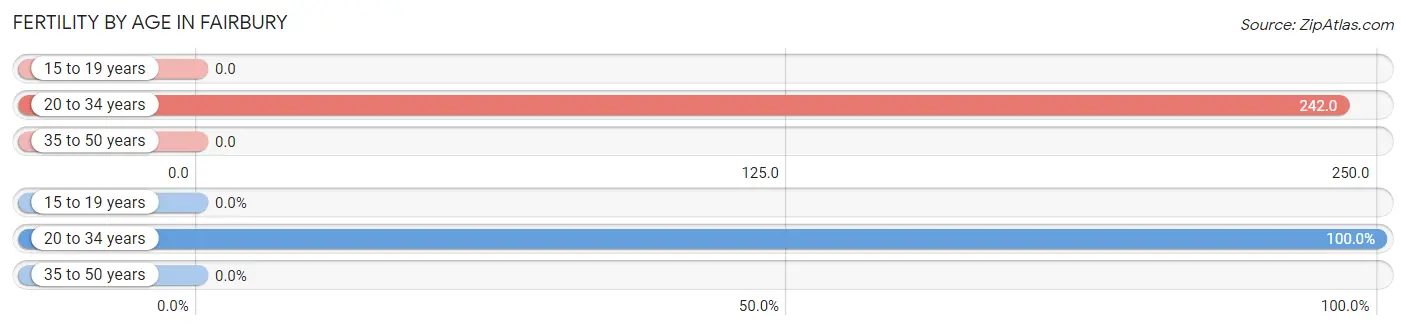
| Age Bracket | Women with Births | Births / 1,000 Women |
| 15 to 19 years | 0 (0.0%) | 0.0 |
| 20 to 34 years | 61 (100.0%) | 242.0 |
| 35 to 50 years | 0 (0.0%) | 0.0 |
| Total | 61 (100.0%) | 84.0 |
Fertility by Age by Marriage Status in Fairbury
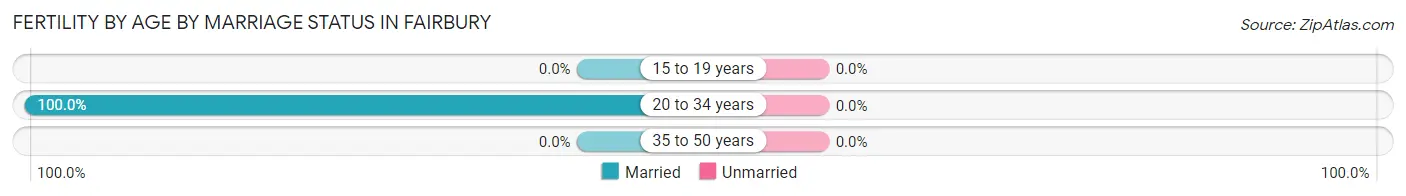
| Age Bracket | Married | Unmarried |
| 15 to 19 years | 0 (0.0%) | 0 (0.0%) |
| 20 to 34 years | 61 (100.0%) | 0 (0.0%) |
| 35 to 50 years | 0 (0.0%) | 0 (0.0%) |
| Total | 61 (100.0%) | 0 (0.0%) |
Fertility by Education in Fairbury
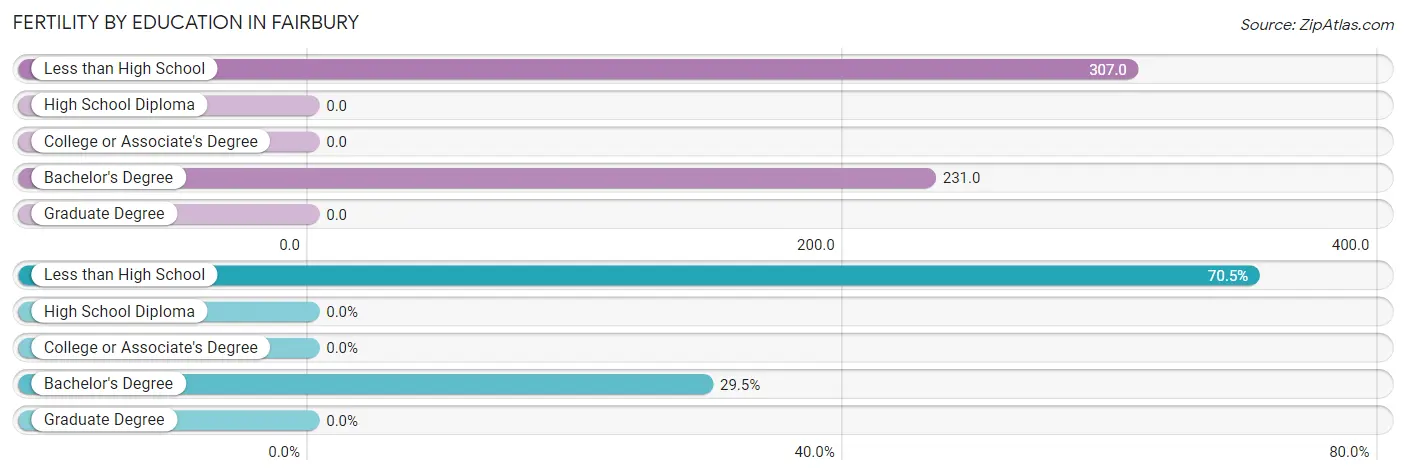
| Educational Attainment | Women with Births | Births / 1,000 Women |
| Less than High School | 43 (70.5%) | 307.0 |
| High School Diploma | 0 (0.0%) | 0.0 |
| College or Associate's Degree | 0 (0.0%) | 0.0 |
| Bachelor's Degree | 18 (29.5%) | 231.0 |
| Graduate Degree | 0 (0.0%) | 0.0 |
| Total | 61 (100.0%) | 84.0 |
Fertility by Education by Marriage Status in Fairbury
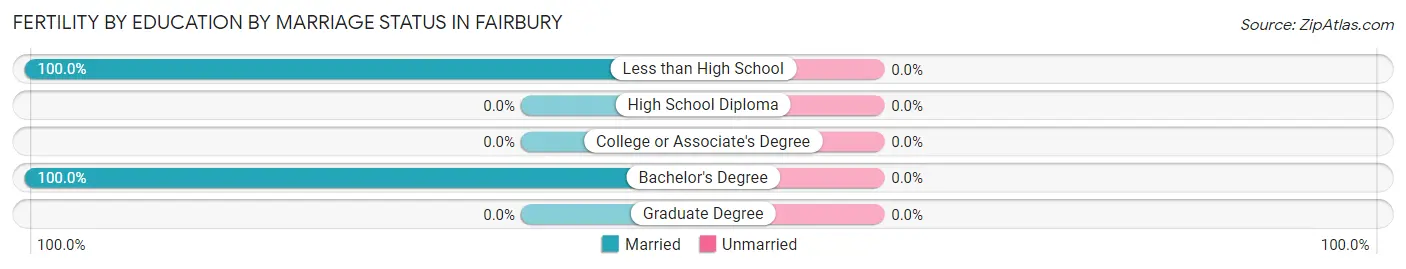
| Educational Attainment | Married | Unmarried |
| Less than High School | 43 (100.0%) | 0 (0.0%) |
| High School Diploma | 0 (0.0%) | 0 (0.0%) |
| College or Associate's Degree | 0 (0.0%) | 0 (0.0%) |
| Bachelor's Degree | 18 (100.0%) | 0 (0.0%) |
| Graduate Degree | 0 (0.0%) | 0 (0.0%) |
| Total | 61 (100.0%) | 0 (0.0%) |
Employment Characteristics in Fairbury
Employment by Class of Employer in Fairbury
Among the 1,633 employed individuals in Fairbury, private company employees (926 | 56.7%), local government employees (273 | 16.7%), and not-for-profit organizations (233 | 14.3%) make up the most common classes of employment.
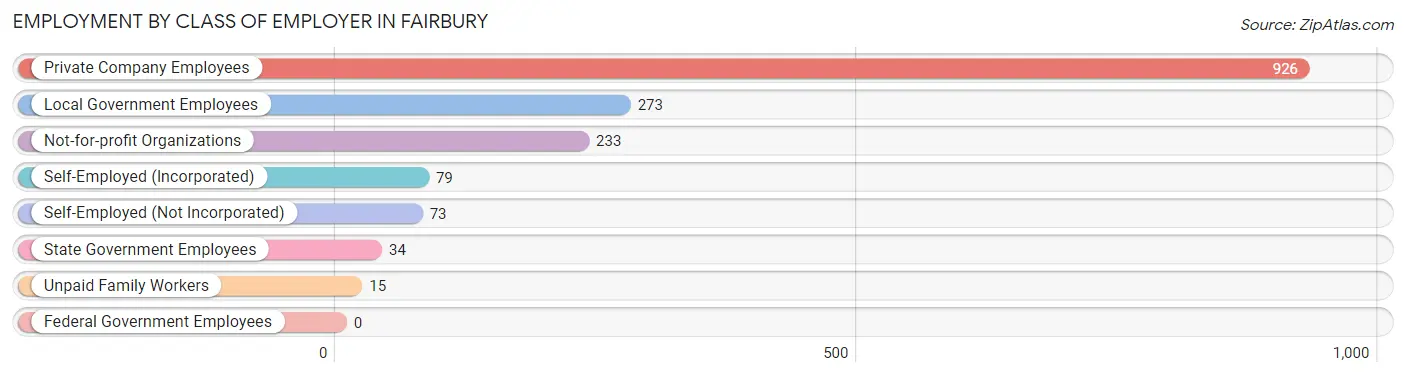
| Employer Class | # Employees | % Employees |
| Private Company Employees | 926 | 56.7% |
| Self-Employed (Incorporated) | 79 | 4.8% |
| Self-Employed (Not Incorporated) | 73 | 4.5% |
| Not-for-profit Organizations | 233 | 14.3% |
| Local Government Employees | 273 | 16.7% |
| State Government Employees | 34 | 2.1% |
| Federal Government Employees | 0 | 0.0% |
| Unpaid Family Workers | 15 | 0.9% |
| Total | 1,633 | 100.0% |
Employment Status by Age in Fairbury
According to the labor force statistics for Fairbury, out of the total population over 16 years of age (2,982), 57.9% or 1,727 individuals are in the labor force, with 3.6% or 62 of them unemployed. The age group with the highest labor force participation rate is 30 to 34 years, with 100.0% or 32 individuals in the labor force. Within the labor force, the 35 to 44 years age range has the highest percentage of unemployed individuals, with 12.8% or 44 of them being unemployed.
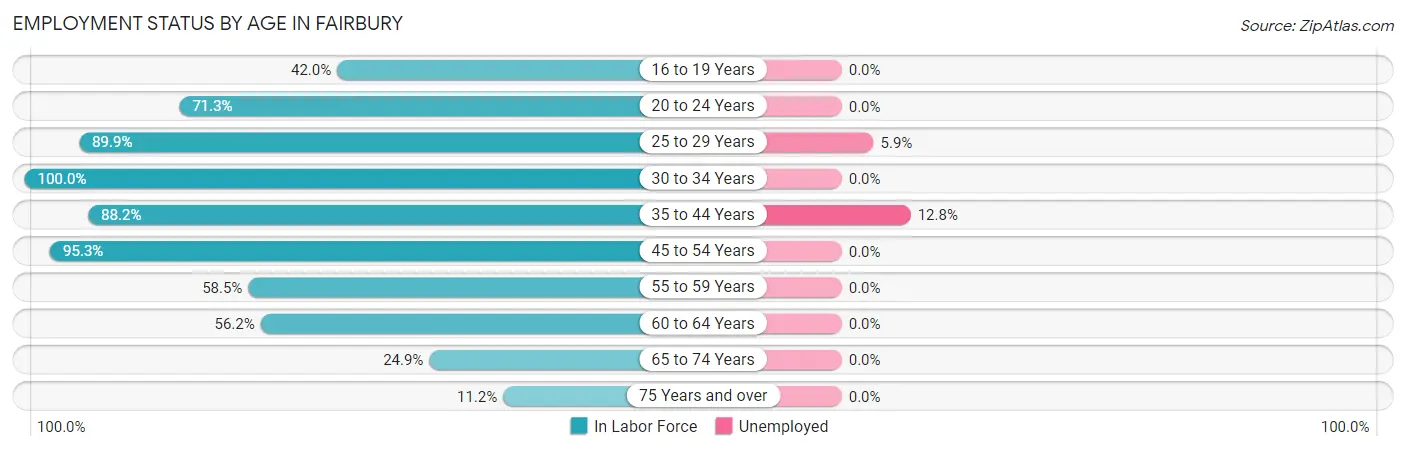
| Age Bracket | In Labor Force | Unemployed |
| 16 to 19 Years | 107 (42.0%) | 0 (0.0%) |
| 20 to 24 Years | 107 (71.3%) | 0 (0.0%) |
| 25 to 29 Years | 303 (89.9%) | 18 (5.9%) |
| 30 to 34 Years | 32 (100.0%) | 0 (0.0%) |
| 35 to 44 Years | 345 (88.2%) | 44 (12.8%) |
| 45 to 54 Years | 364 (95.3%) | 0 (0.0%) |
| 55 to 59 Years | 165 (58.5%) | 0 (0.0%) |
| 60 to 64 Years | 140 (56.2%) | 0 (0.0%) |
| 65 to 74 Years | 114 (24.9%) | 0 (0.0%) |
| 75 Years and over | 50 (11.2%) | 0 (0.0%) |
| Total | 1,727 (57.9%) | 62 (3.6%) |
Employment Status by Educational Attainment in Fairbury
According to labor force statistics for Fairbury, 80.6% of individuals (1,348) out of the total population between 25 and 64 years of age (1,673) are in the labor force, with 4.6% or 62 of them being unemployed. The group with the highest labor force participation rate are those with the educational attainment of high school diploma, with 86.5% or 473 individuals in the labor force. Within the labor force, individuals with less than high school education have the highest percentage of unemployment, with 22.6% or 14 of them being unemployed.
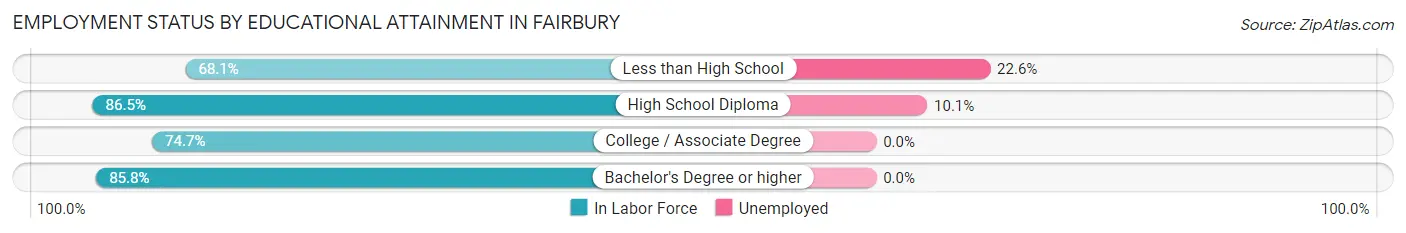
| Educational Attainment | In Labor Force | Unemployed |
| Less than High School | 62 (68.1%) | 21 (22.6%) |
| High School Diploma | 473 (86.5%) | 55 (10.1%) |
| College / Associate Degree | 495 (74.7%) | 0 (0.0%) |
| Bachelor's Degree or higher | 319 (85.8%) | 0 (0.0%) |
| Total | 1,348 (80.6%) | 77 (4.6%) |
Employment Occupations by Sex in Fairbury
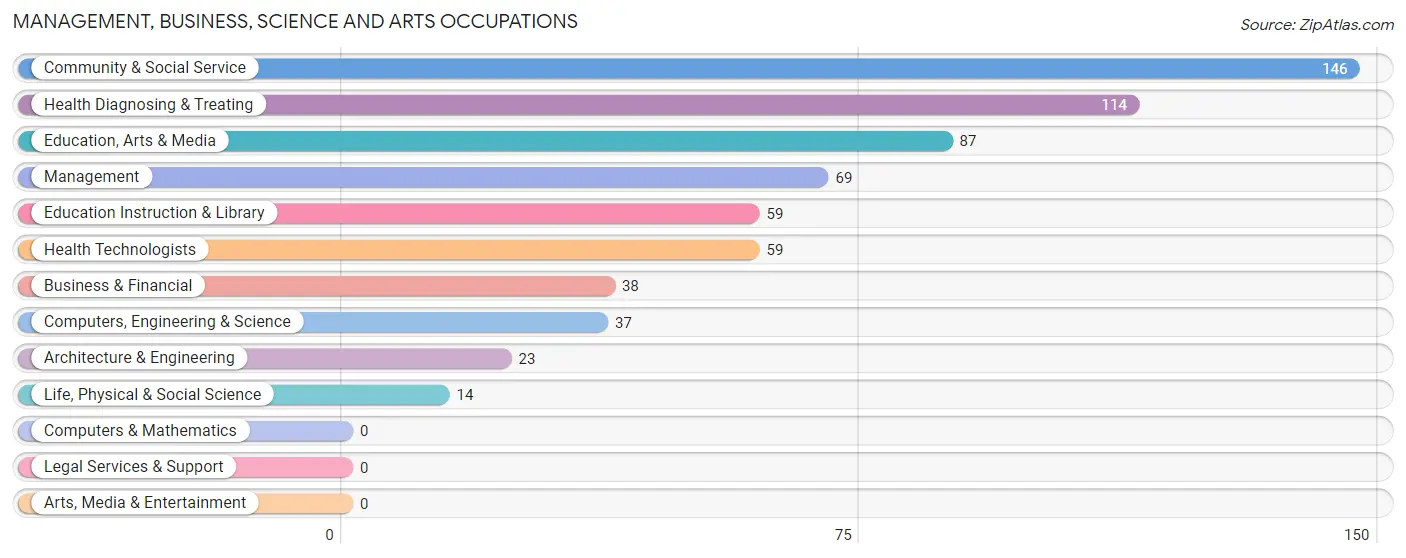
Management, Business, Science and Arts Occupations
The most common Management, Business, Science and Arts occupations in Fairbury are Community & Social Service (146 | 8.8%), Health Diagnosing & Treating (114 | 6.9%), Education, Arts & Media (87 | 5.2%), Management (69 | 4.1%), and Education Instruction & Library (59 | 3.5%).
Management, Business, Science and Arts Occupations by Sex
Within the Management, Business, Science and Arts occupations in Fairbury, the most male-oriented occupations are Architecture & Engineering (100.0%), Computers, Engineering & Science (62.2%), and Management (52.2%), while the most female-oriented occupations are Life, Physical & Social Science (100.0%), Health Diagnosing & Treating (100.0%), and Health Technologists (100.0%).
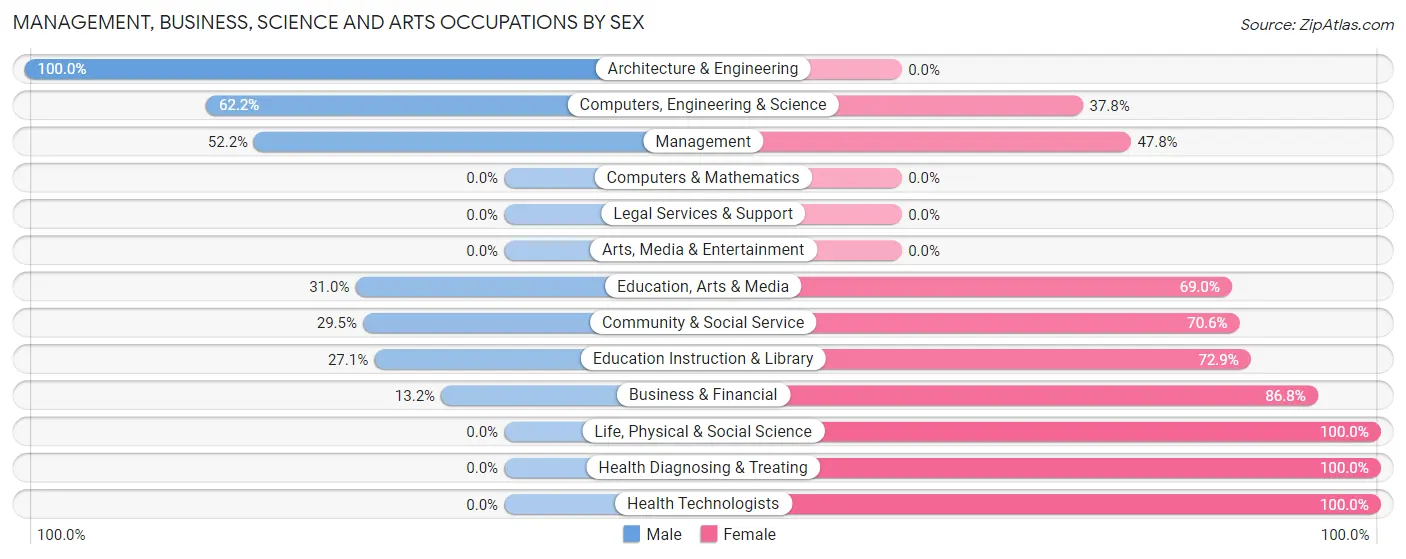
| Occupation | Male | Female |
| Management | 36 (52.2%) | 33 (47.8%) |
| Business & Financial | 5 (13.2%) | 33 (86.8%) |
| Computers, Engineering & Science | 23 (62.2%) | 14 (37.8%) |
| Computers & Mathematics | 0 (0.0%) | 0 (0.0%) |
| Architecture & Engineering | 23 (100.0%) | 0 (0.0%) |
| Life, Physical & Social Science | 0 (0.0%) | 14 (100.0%) |
| Community & Social Service | 43 (29.4%) | 103 (70.6%) |
| Education, Arts & Media | 27 (31.0%) | 60 (69.0%) |
| Legal Services & Support | 0 (0.0%) | 0 (0.0%) |
| Education Instruction & Library | 16 (27.1%) | 43 (72.9%) |
| Arts, Media & Entertainment | 0 (0.0%) | 0 (0.0%) |
| Health Diagnosing & Treating | 0 (0.0%) | 114 (100.0%) |
| Health Technologists | 0 (0.0%) | 59 (100.0%) |
| Total (Category) | 107 (26.5%) | 297 (73.5%) |
| Total (Overall) | 829 (49.8%) | 836 (50.2%) |
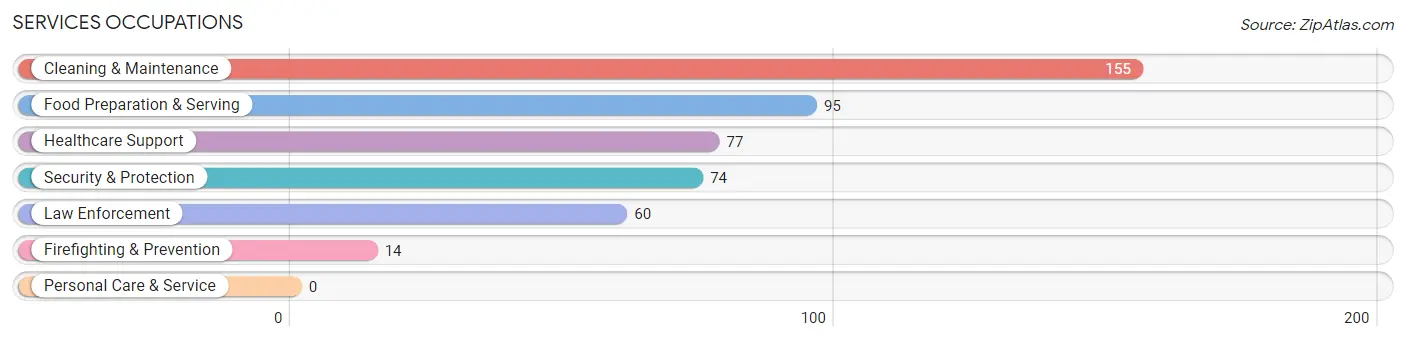
Services Occupations
The most common Services occupations in Fairbury are Cleaning & Maintenance (155 | 9.3%), Food Preparation & Serving (95 | 5.7%), Healthcare Support (77 | 4.6%), Security & Protection (74 | 4.4%), and Law Enforcement (60 | 3.6%).
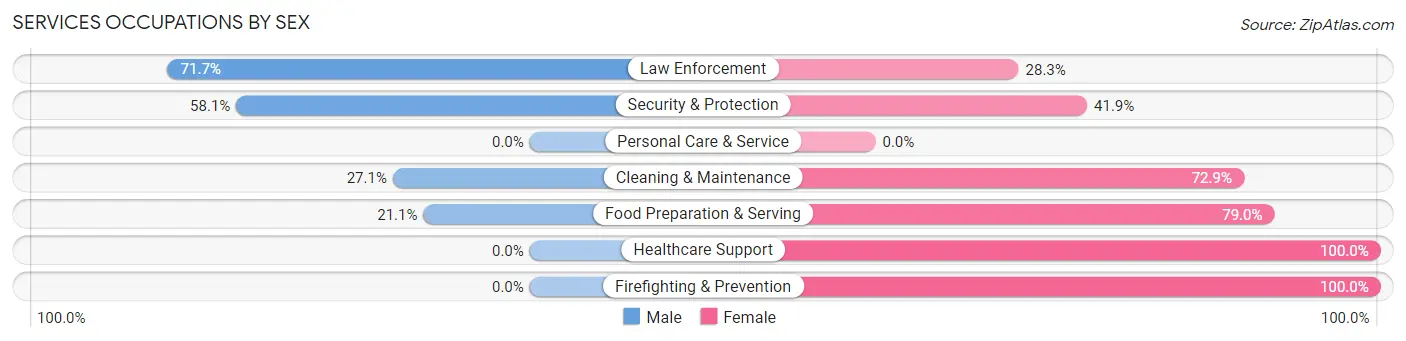
Services Occupations by Sex
Within the Services occupations in Fairbury, the most male-oriented occupations are Law Enforcement (71.7%), Security & Protection (58.1%), and Cleaning & Maintenance (27.1%), while the most female-oriented occupations are Healthcare Support (100.0%), Firefighting & Prevention (100.0%), and Food Preparation & Serving (78.9%).
| Occupation | Male | Female |
| Healthcare Support | 0 (0.0%) | 77 (100.0%) |
| Security & Protection | 43 (58.1%) | 31 (41.9%) |
| Firefighting & Prevention | 0 (0.0%) | 14 (100.0%) |
| Law Enforcement | 43 (71.7%) | 17 (28.3%) |
| Food Preparation & Serving | 20 (21.0%) | 75 (78.9%) |
| Cleaning & Maintenance | 42 (27.1%) | 113 (72.9%) |
| Personal Care & Service | 0 (0.0%) | 0 (0.0%) |
| Total (Category) | 105 (26.2%) | 296 (73.8%) |
| Total (Overall) | 829 (49.8%) | 836 (50.2%) |
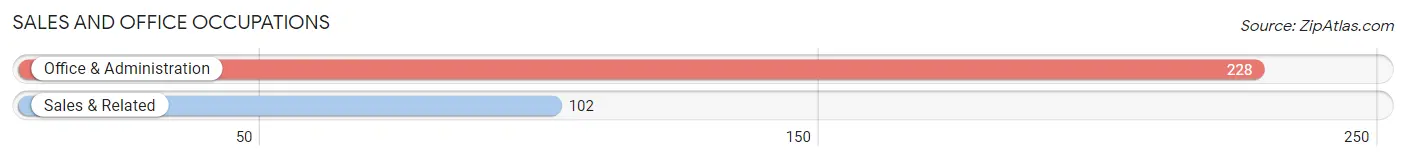
Sales and Office Occupations
The most common Sales and Office occupations in Fairbury are Office & Administration (228 | 13.7%), and Sales & Related (102 | 6.1%).
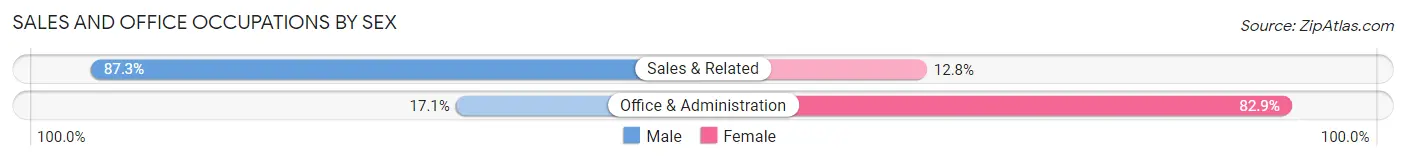
Sales and Office Occupations by Sex
| Occupation | Male | Female |
| Sales & Related | 89 (87.3%) | 13 (12.8%) |
| Office & Administration | 39 (17.1%) | 189 (82.9%) |
| Total (Category) | 128 (38.8%) | 202 (61.2%) |
| Total (Overall) | 829 (49.8%) | 836 (50.2%) |
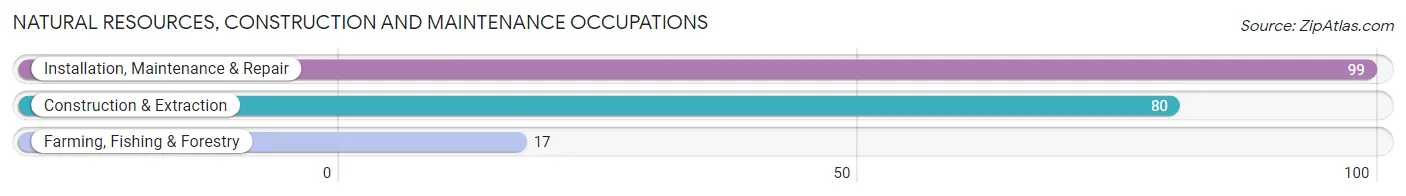
Natural Resources, Construction and Maintenance Occupations
The most common Natural Resources, Construction and Maintenance occupations in Fairbury are Installation, Maintenance & Repair (99 | 5.9%), Construction & Extraction (80 | 4.8%), and Farming, Fishing & Forestry (17 | 1.0%).
Natural Resources, Construction and Maintenance Occupations by Sex
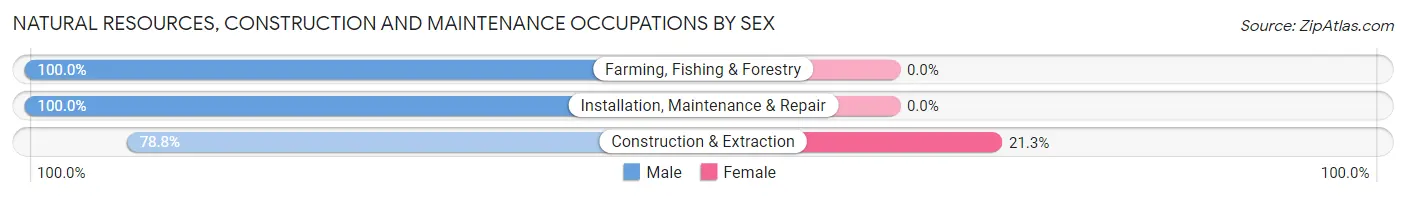
| Occupation | Male | Female |
| Farming, Fishing & Forestry | 17 (100.0%) | 0 (0.0%) |
| Construction & Extraction | 63 (78.7%) | 17 (21.2%) |
| Installation, Maintenance & Repair | 99 (100.0%) | 0 (0.0%) |
| Total (Category) | 179 (91.3%) | 17 (8.7%) |
| Total (Overall) | 829 (49.8%) | 836 (50.2%) |
Production, Transportation and Moving Occupations
The most common Production, Transportation and Moving occupations in Fairbury are Transportation (118 | 7.1%), Production (113 | 6.8%), and Material Moving (103 | 6.2%).

Production, Transportation and Moving Occupations by Sex
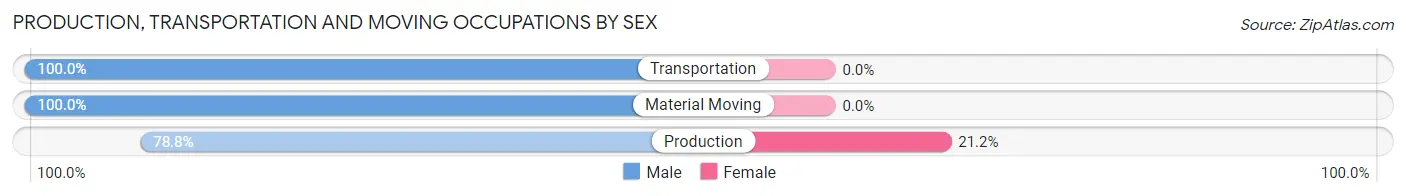
| Occupation | Male | Female |
| Production | 89 (78.8%) | 24 (21.2%) |
| Transportation | 118 (100.0%) | 0 (0.0%) |
| Material Moving | 103 (100.0%) | 0 (0.0%) |
| Total (Category) | 310 (92.8%) | 24 (7.2%) |
| Total (Overall) | 829 (49.8%) | 836 (50.2%) |
Employment Industries by Sex in Fairbury
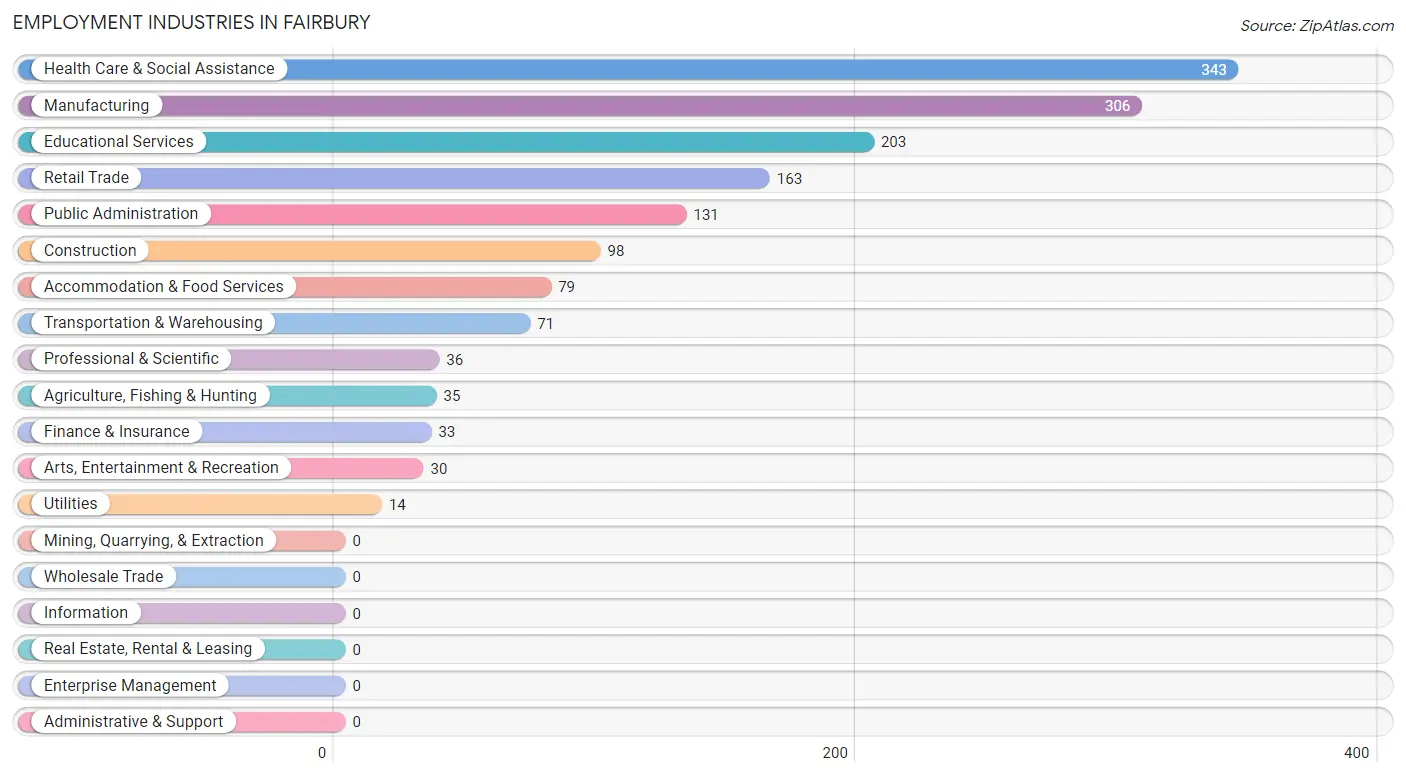
Employment Industries in Fairbury
The major employment industries in Fairbury include Health Care & Social Assistance (343 | 20.6%), Manufacturing (306 | 18.4%), Educational Services (203 | 12.2%), Retail Trade (163 | 9.8%), and Public Administration (131 | 7.9%).
Employment Industries by Sex in Fairbury
The Fairbury industries that see more men than women are Agriculture, Fishing & Hunting (100.0%), Transportation & Warehousing (100.0%), and Utilities (100.0%), whereas the industries that tend to have a higher number of women are Health Care & Social Assistance (96.2%), Educational Services (92.1%), and Accommodation & Food Services (74.7%).
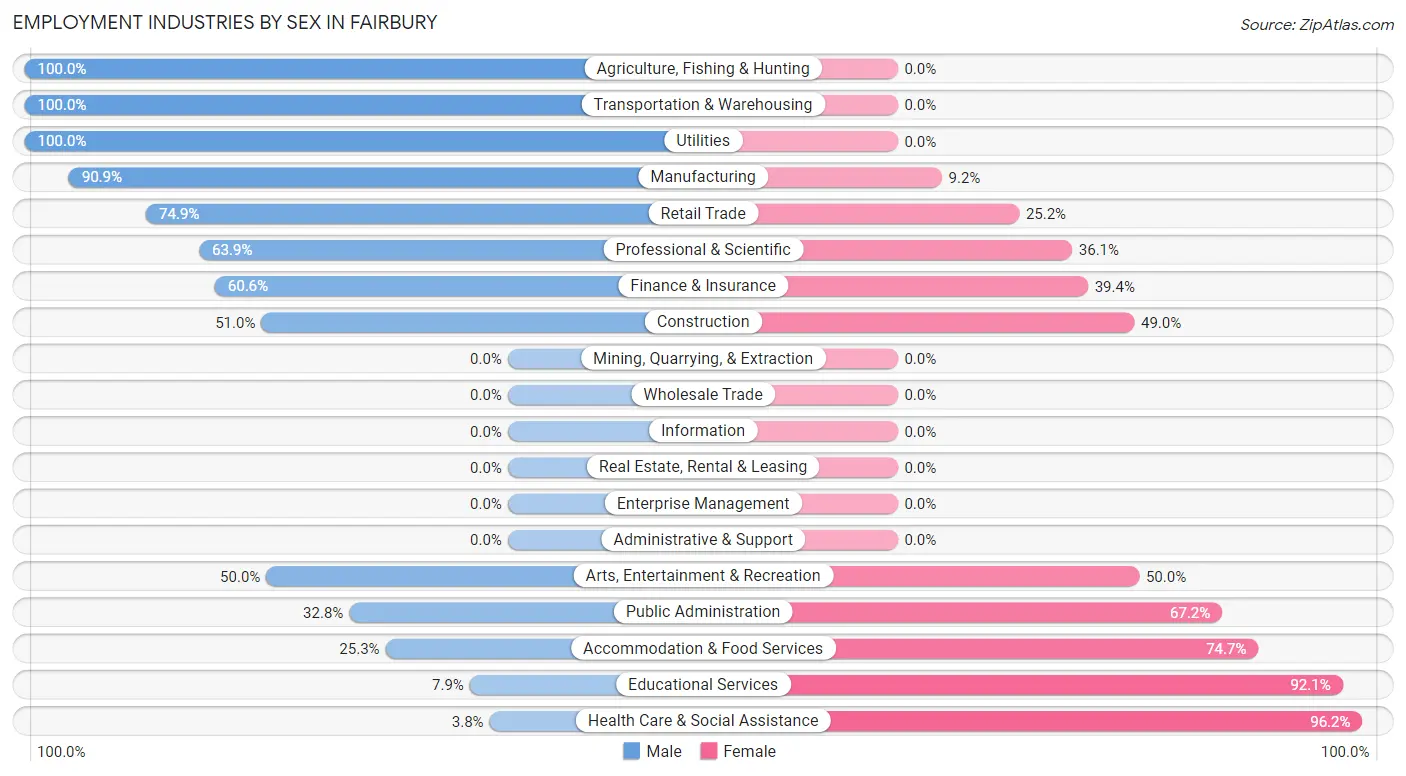
| Industry | Male | Female |
| Agriculture, Fishing & Hunting | 35 (100.0%) | 0 (0.0%) |
| Mining, Quarrying, & Extraction | 0 (0.0%) | 0 (0.0%) |
| Construction | 50 (51.0%) | 48 (49.0%) |
| Manufacturing | 278 (90.8%) | 28 (9.1%) |
| Wholesale Trade | 0 (0.0%) | 0 (0.0%) |
| Retail Trade | 122 (74.9%) | 41 (25.2%) |
| Transportation & Warehousing | 71 (100.0%) | 0 (0.0%) |
| Utilities | 14 (100.0%) | 0 (0.0%) |
| Information | 0 (0.0%) | 0 (0.0%) |
| Finance & Insurance | 20 (60.6%) | 13 (39.4%) |
| Real Estate, Rental & Leasing | 0 (0.0%) | 0 (0.0%) |
| Professional & Scientific | 23 (63.9%) | 13 (36.1%) |
| Enterprise Management | 0 (0.0%) | 0 (0.0%) |
| Administrative & Support | 0 (0.0%) | 0 (0.0%) |
| Educational Services | 16 (7.9%) | 187 (92.1%) |
| Health Care & Social Assistance | 13 (3.8%) | 330 (96.2%) |
| Arts, Entertainment & Recreation | 15 (50.0%) | 15 (50.0%) |
| Accommodation & Food Services | 20 (25.3%) | 59 (74.7%) |
| Public Administration | 43 (32.8%) | 88 (67.2%) |
| Total | 829 (49.8%) | 836 (50.2%) |
Education in Fairbury
School Enrollment in Fairbury
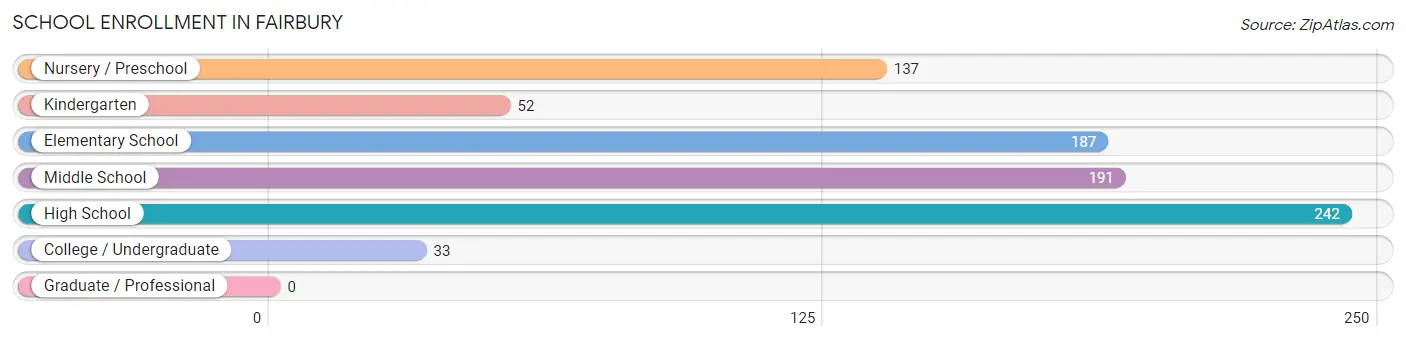
The most common levels of schooling among the 842 students in Fairbury are high school (242 | 28.7%), middle school (191 | 22.7%), and elementary school (187 | 22.2%).
| School Level | # Students | % Students |
| Nursery / Preschool | 137 | 16.3% |
| Kindergarten | 52 | 6.2% |
| Elementary School | 187 | 22.2% |
| Middle School | 191 | 22.7% |
| High School | 242 | 28.7% |
| College / Undergraduate | 33 | 3.9% |
| Graduate / Professional | 0 | 0.0% |
| Total | 842 | 100.0% |
School Enrollment by Age by Funding Source in Fairbury
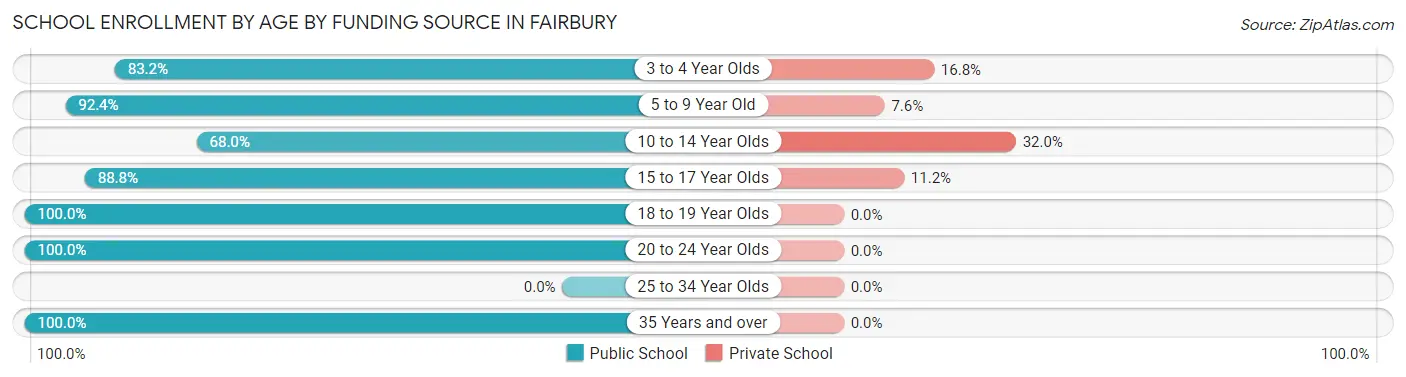
Out of a total of 842 students who are enrolled in schools in Fairbury, 128 (15.2%) attend a private institution, while the remaining 714 (84.8%) are enrolled in public schools. The age group of 10 to 14 year olds has the highest likelihood of being enrolled in private schools, with 66 (32.0% in the age bracket) enrolled. Conversely, the age group of 18 to 19 year olds has the lowest likelihood of being enrolled in a private school, with 22 (100.0% in the age bracket) attending a public institution.
| Age Bracket | Public School | Private School |
| 3 to 4 Year Olds | 94 (83.2%) | 19 (16.8%) |
| 5 to 9 Year Old | 243 (92.4%) | 20 (7.6%) |
| 10 to 14 Year Olds | 140 (68.0%) | 66 (32.0%) |
| 15 to 17 Year Olds | 182 (88.8%) | 23 (11.2%) |
| 18 to 19 Year Olds | 22 (100.0%) | 0 (0.0%) |
| 20 to 24 Year Olds | 14 (100.0%) | 0 (0.0%) |
| 25 to 34 Year Olds | 0 (0.0%) | 0 (0.0%) |
| 35 Years and over | 19 (100.0%) | 0 (0.0%) |
| Total | 714 (84.8%) | 128 (15.2%) |
Educational Attainment by Field of Study in Fairbury
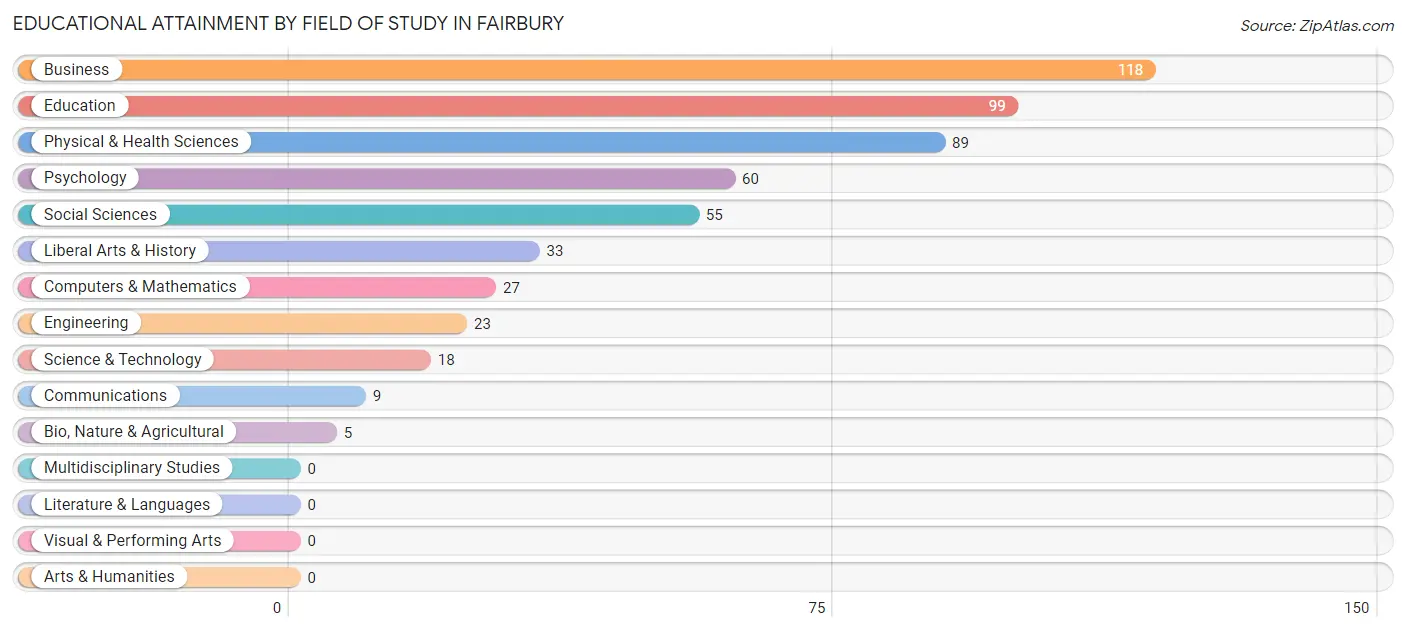
Business (118 | 22.0%), education (99 | 18.5%), physical & health sciences (89 | 16.6%), psychology (60 | 11.2%), and social sciences (55 | 10.3%) are the most common fields of study among 536 individuals in Fairbury who have obtained a bachelor's degree or higher.
| Field of Study | # Graduates | % Graduates |
| Computers & Mathematics | 27 | 5.0% |
| Bio, Nature & Agricultural | 5 | 0.9% |
| Physical & Health Sciences | 89 | 16.6% |
| Psychology | 60 | 11.2% |
| Social Sciences | 55 | 10.3% |
| Engineering | 23 | 4.3% |
| Multidisciplinary Studies | 0 | 0.0% |
| Science & Technology | 18 | 3.4% |
| Business | 118 | 22.0% |
| Education | 99 | 18.5% |
| Literature & Languages | 0 | 0.0% |
| Liberal Arts & History | 33 | 6.2% |
| Visual & Performing Arts | 0 | 0.0% |
| Communications | 9 | 1.7% |
| Arts & Humanities | 0 | 0.0% |
| Total | 536 | 100.0% |
Transportation & Commute in Fairbury
Vehicle Availability by Sex in Fairbury
The most prevalent vehicle ownership categories in Fairbury are males with 2 vehicles (320, accounting for 39.5%) and females with 2 vehicles (194, making up 38.9%).
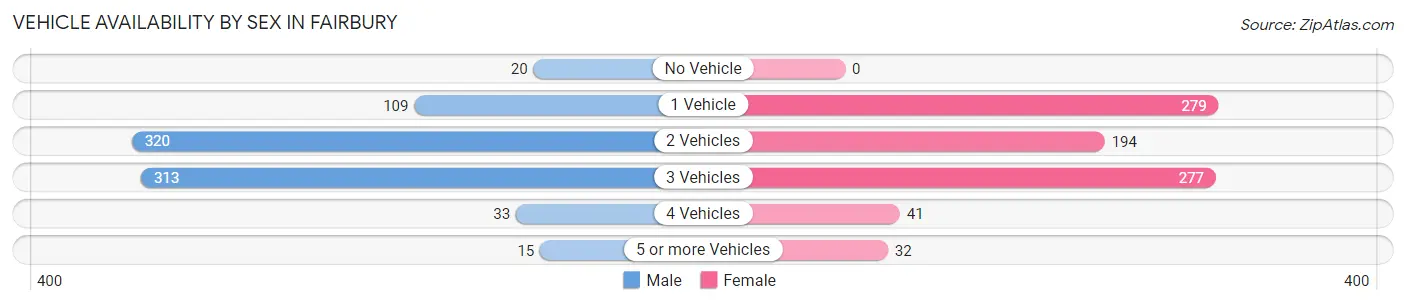
| Vehicles Available | Male | Female |
| No Vehicle | 20 (2.5%) | 0 (0.0%) |
| 1 Vehicle | 109 (13.5%) | 279 (33.9%) |
| 2 Vehicles | 320 (39.5%) | 194 (23.6%) |
| 3 Vehicles | 313 (38.6%) | 277 (33.7%) |
| 4 Vehicles | 33 (4.1%) | 41 (5.0%) |
| 5 or more Vehicles | 15 (1.8%) | 32 (3.9%) |
| Total | 810 (100.0%) | 823 (100.0%) |
Commute Time in Fairbury
The most frequently occuring commute durations in Fairbury are 5 to 9 minutes (486 commuters, 33.3%), 15 to 19 minutes (188 commuters, 12.9%), and less than 5 minutes (164 commuters, 11.2%).
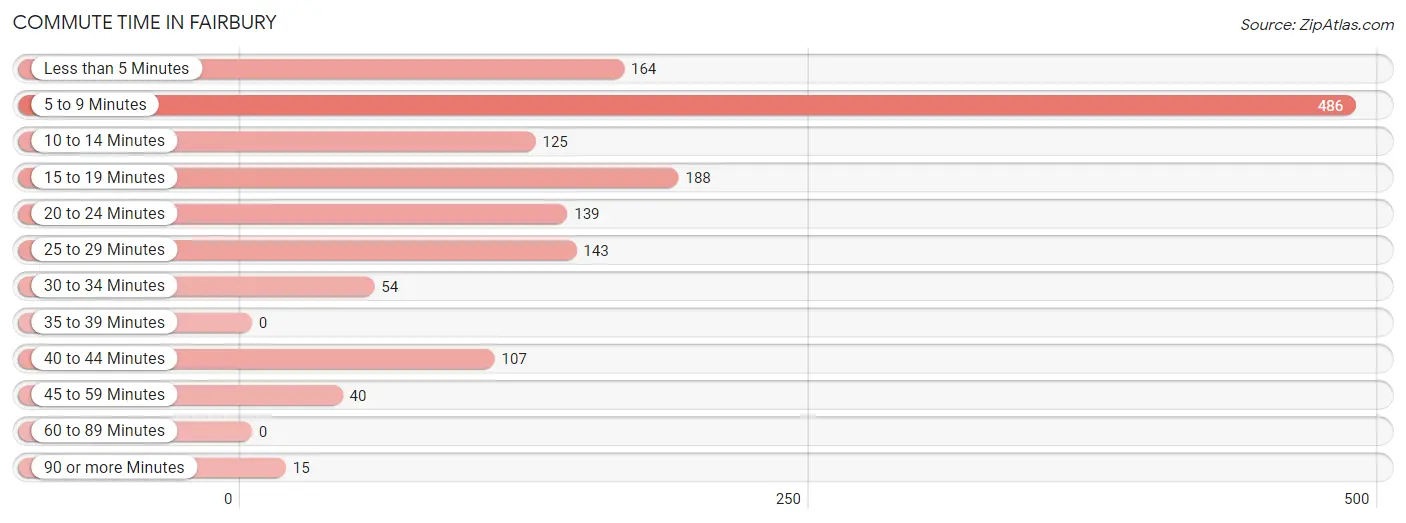
| Commute Time | # Commuters | % Commuters |
| Less than 5 Minutes | 164 | 11.2% |
| 5 to 9 Minutes | 486 | 33.3% |
| 10 to 14 Minutes | 125 | 8.6% |
| 15 to 19 Minutes | 188 | 12.9% |
| 20 to 24 Minutes | 139 | 9.5% |
| 25 to 29 Minutes | 143 | 9.8% |
| 30 to 34 Minutes | 54 | 3.7% |
| 35 to 39 Minutes | 0 | 0.0% |
| 40 to 44 Minutes | 107 | 7.3% |
| 45 to 59 Minutes | 40 | 2.7% |
| 60 to 89 Minutes | 0 | 0.0% |
| 90 or more Minutes | 15 | 1.0% |
Commute Time by Sex in Fairbury
The most common commute times in Fairbury are 5 to 9 minutes (225 commuters, 30.7%) for males and 5 to 9 minutes (261 commuters, 35.8%) for females.
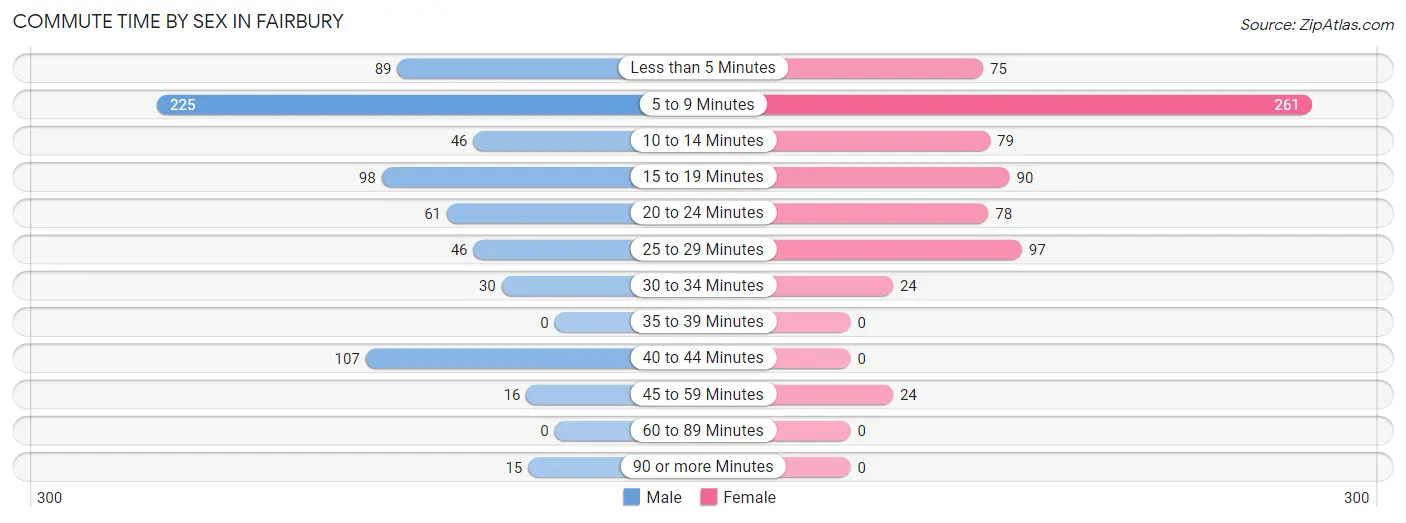
| Commute Time | Male | Female |
| Less than 5 Minutes | 89 (12.1%) | 75 (10.3%) |
| 5 to 9 Minutes | 225 (30.7%) | 261 (35.8%) |
| 10 to 14 Minutes | 46 (6.3%) | 79 (10.8%) |
| 15 to 19 Minutes | 98 (13.4%) | 90 (12.4%) |
| 20 to 24 Minutes | 61 (8.3%) | 78 (10.7%) |
| 25 to 29 Minutes | 46 (6.3%) | 97 (13.3%) |
| 30 to 34 Minutes | 30 (4.1%) | 24 (3.3%) |
| 35 to 39 Minutes | 0 (0.0%) | 0 (0.0%) |
| 40 to 44 Minutes | 107 (14.6%) | 0 (0.0%) |
| 45 to 59 Minutes | 16 (2.2%) | 24 (3.3%) |
| 60 to 89 Minutes | 0 (0.0%) | 0 (0.0%) |
| 90 or more Minutes | 15 (2.1%) | 0 (0.0%) |
Time of Departure to Work by Sex in Fairbury
The most frequent times of departure to work in Fairbury are 4:00 PM to 11:59 PM (163, 22.2%) for males and 7:00 AM to 7:29 AM (220, 30.2%) for females.
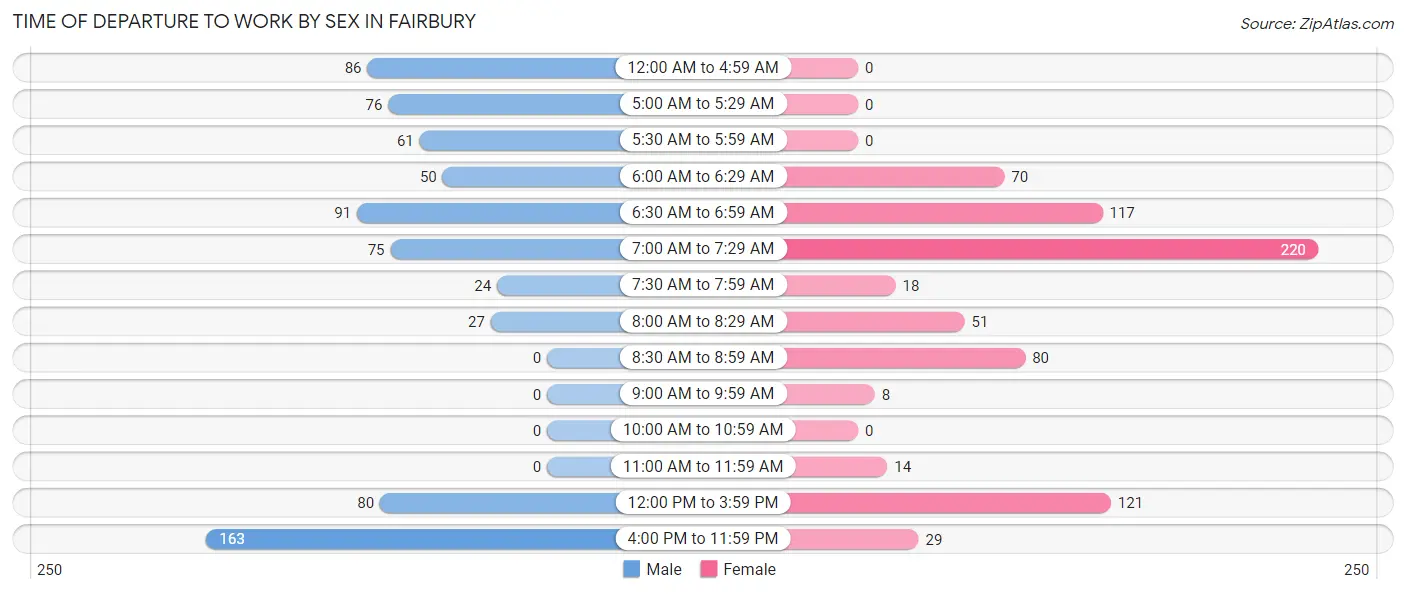
| Time of Departure | Male | Female |
| 12:00 AM to 4:59 AM | 86 (11.7%) | 0 (0.0%) |
| 5:00 AM to 5:29 AM | 76 (10.4%) | 0 (0.0%) |
| 5:30 AM to 5:59 AM | 61 (8.3%) | 0 (0.0%) |
| 6:00 AM to 6:29 AM | 50 (6.8%) | 70 (9.6%) |
| 6:30 AM to 6:59 AM | 91 (12.4%) | 117 (16.1%) |
| 7:00 AM to 7:29 AM | 75 (10.2%) | 220 (30.2%) |
| 7:30 AM to 7:59 AM | 24 (3.3%) | 18 (2.5%) |
| 8:00 AM to 8:29 AM | 27 (3.7%) | 51 (7.0%) |
| 8:30 AM to 8:59 AM | 0 (0.0%) | 80 (11.0%) |
| 9:00 AM to 9:59 AM | 0 (0.0%) | 8 (1.1%) |
| 10:00 AM to 10:59 AM | 0 (0.0%) | 0 (0.0%) |
| 11:00 AM to 11:59 AM | 0 (0.0%) | 14 (1.9%) |
| 12:00 PM to 3:59 PM | 80 (10.9%) | 121 (16.6%) |
| 4:00 PM to 11:59 PM | 163 (22.2%) | 29 (4.0%) |
| Total | 733 (100.0%) | 728 (100.0%) |
Housing Occupancy in Fairbury
Occupancy by Ownership in Fairbury
Of the total 1,596 dwellings in Fairbury, owner-occupied units account for 1,051 (65.8%), while renter-occupied units make up 545 (34.2%).
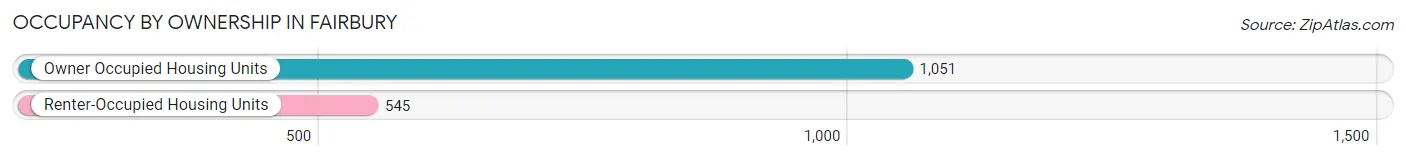
| Occupancy | # Housing Units | % Housing Units |
| Owner Occupied Housing Units | 1,051 | 65.8% |
| Renter-Occupied Housing Units | 545 | 34.2% |
| Total Occupied Housing Units | 1,596 | 100.0% |
Occupancy by Household Size in Fairbury
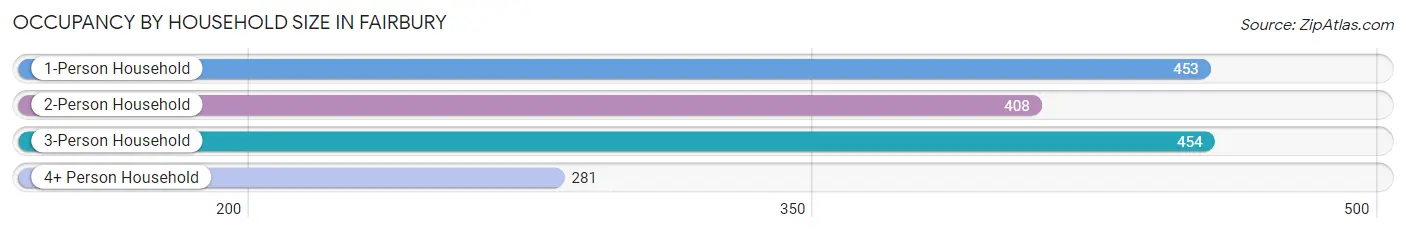
| Household Size | # Housing Units | % Housing Units |
| 1-Person Household | 453 | 28.4% |
| 2-Person Household | 408 | 25.6% |
| 3-Person Household | 454 | 28.4% |
| 4+ Person Household | 281 | 17.6% |
| Total Housing Units | 1,596 | 100.0% |
Occupancy by Ownership by Household Size in Fairbury
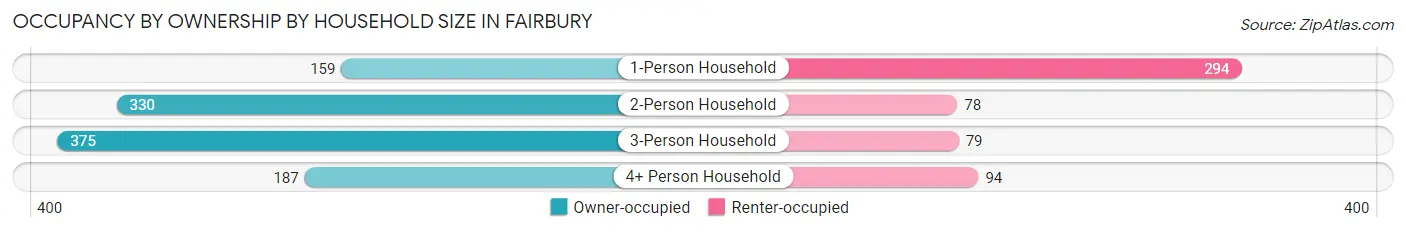
| Household Size | Owner-occupied | Renter-occupied |
| 1-Person Household | 159 (35.1%) | 294 (64.9%) |
| 2-Person Household | 330 (80.9%) | 78 (19.1%) |
| 3-Person Household | 375 (82.6%) | 79 (17.4%) |
| 4+ Person Household | 187 (66.5%) | 94 (33.5%) |
| Total Housing Units | 1,051 (65.8%) | 545 (34.2%) |
Occupancy by Educational Attainment in Fairbury
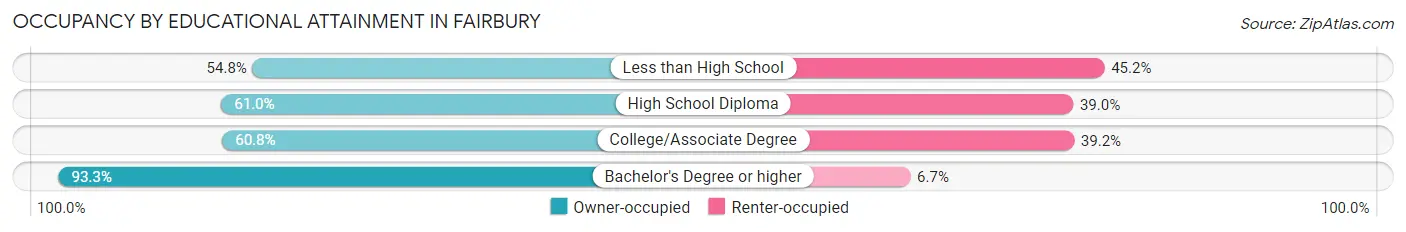
| Household Size | Owner-occupied | Renter-occupied |
| Less than High School | 63 (54.8%) | 52 (45.2%) |
| High School Diploma | 300 (61.0%) | 192 (39.0%) |
| College/Associate Degree | 439 (60.8%) | 283 (39.2%) |
| Bachelor's Degree or higher | 249 (93.3%) | 18 (6.7%) |
Occupancy by Age of Householder in Fairbury
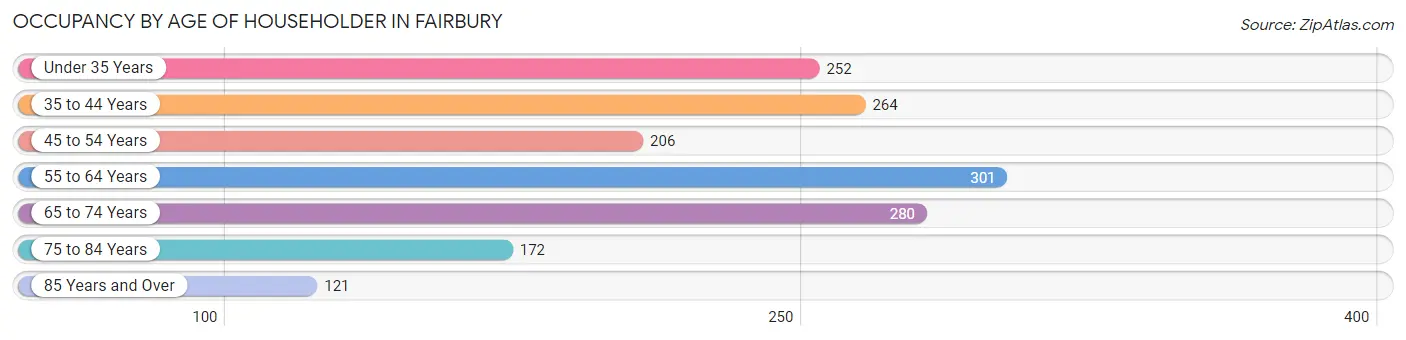
| Age Bracket | # Households | % Households |
| Under 35 Years | 252 | 15.8% |
| 35 to 44 Years | 264 | 16.5% |
| 45 to 54 Years | 206 | 12.9% |
| 55 to 64 Years | 301 | 18.9% |
| 65 to 74 Years | 280 | 17.5% |
| 75 to 84 Years | 172 | 10.8% |
| 85 Years and Over | 121 | 7.6% |
| Total | 1,596 | 100.0% |
Housing Finances in Fairbury
Median Income by Occupancy in Fairbury
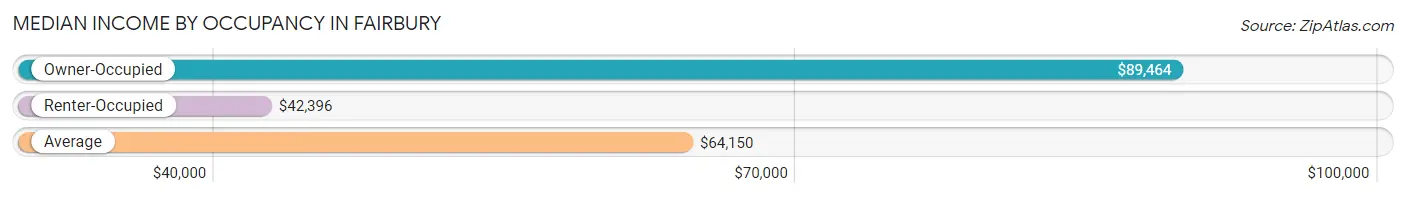
| Occupancy Type | # Households | Median Income |
| Owner-Occupied | 1,051 (65.8%) | $89,464 |
| Renter-Occupied | 545 (34.2%) | $42,396 |
| Average | 1,596 (100.0%) | $64,150 |
Occupancy by Householder Income Bracket in Fairbury
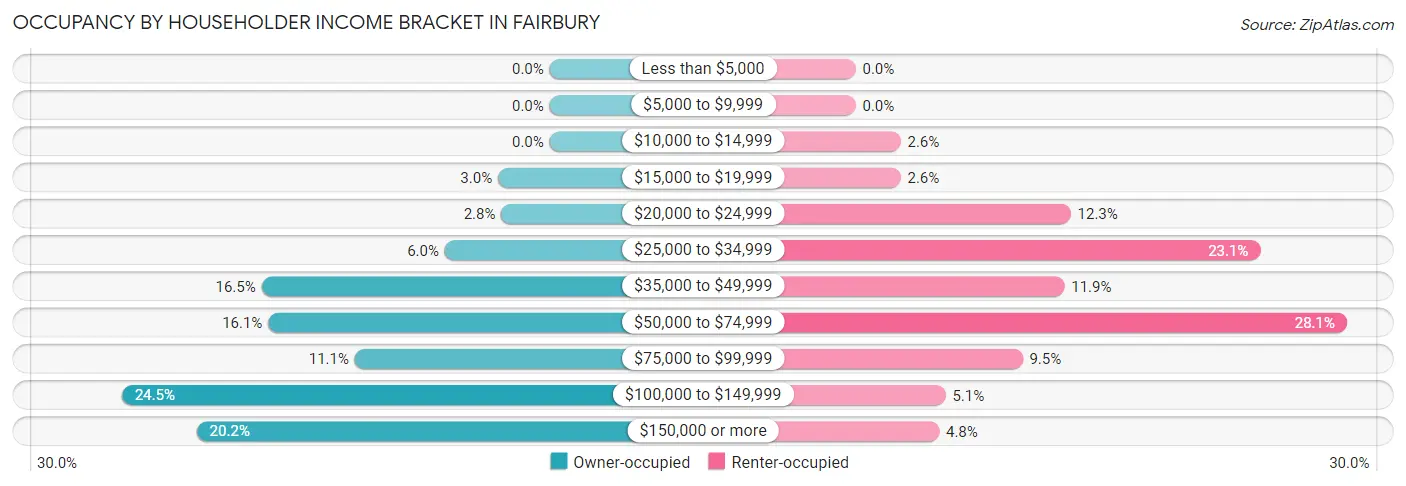
| Income Bracket | Owner-occupied | Renter-occupied |
| Less than $5,000 | 0 (0.0%) | 0 (0.0%) |
| $5,000 to $9,999 | 0 (0.0%) | 0 (0.0%) |
| $10,000 to $14,999 | 0 (0.0%) | 14 (2.6%) |
| $15,000 to $19,999 | 31 (2.9%) | 14 (2.6%) |
| $20,000 to $24,999 | 29 (2.8%) | 67 (12.3%) |
| $25,000 to $34,999 | 63 (6.0%) | 126 (23.1%) |
| $35,000 to $49,999 | 173 (16.5%) | 65 (11.9%) |
| $50,000 to $74,999 | 169 (16.1%) | 153 (28.1%) |
| $75,000 to $99,999 | 117 (11.1%) | 52 (9.5%) |
| $100,000 to $149,999 | 257 (24.4%) | 28 (5.1%) |
| $150,000 or more | 212 (20.2%) | 26 (4.8%) |
| Total | 1,051 (100.0%) | 545 (100.0%) |
Monthly Housing Cost Tiers in Fairbury
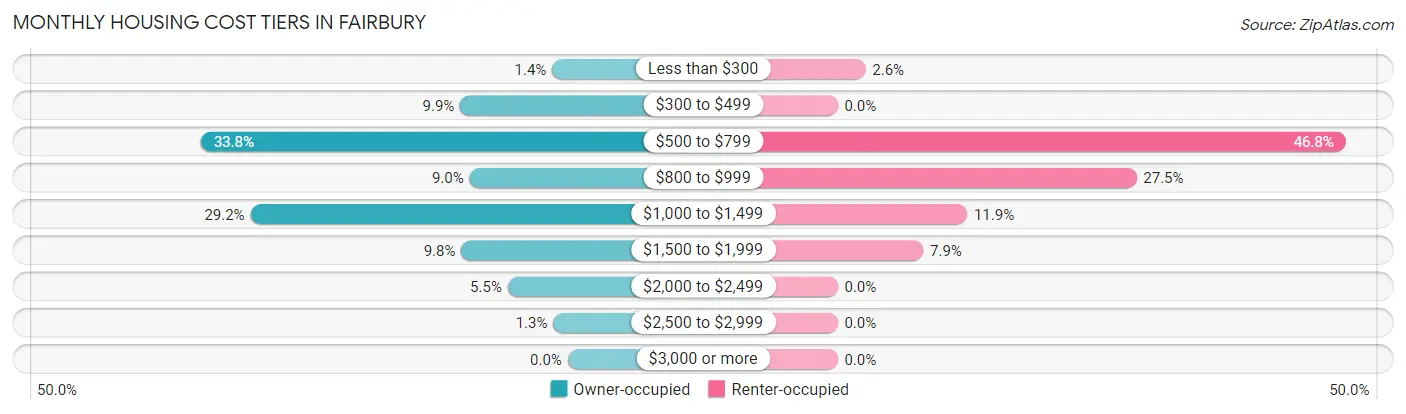
| Monthly Cost | Owner-occupied | Renter-occupied |
| Less than $300 | 15 (1.4%) | 14 (2.6%) |
| $300 to $499 | 104 (9.9%) | 0 (0.0%) |
| $500 to $799 | 355 (33.8%) | 255 (46.8%) |
| $800 to $999 | 95 (9.0%) | 150 (27.5%) |
| $1,000 to $1,499 | 307 (29.2%) | 65 (11.9%) |
| $1,500 to $1,999 | 103 (9.8%) | 43 (7.9%) |
| $2,000 to $2,499 | 58 (5.5%) | 0 (0.0%) |
| $2,500 to $2,999 | 14 (1.3%) | 0 (0.0%) |
| $3,000 or more | 0 (0.0%) | 0 (0.0%) |
| Total | 1,051 (100.0%) | 545 (100.0%) |
Physical Housing Characteristics in Fairbury
Housing Structures in Fairbury
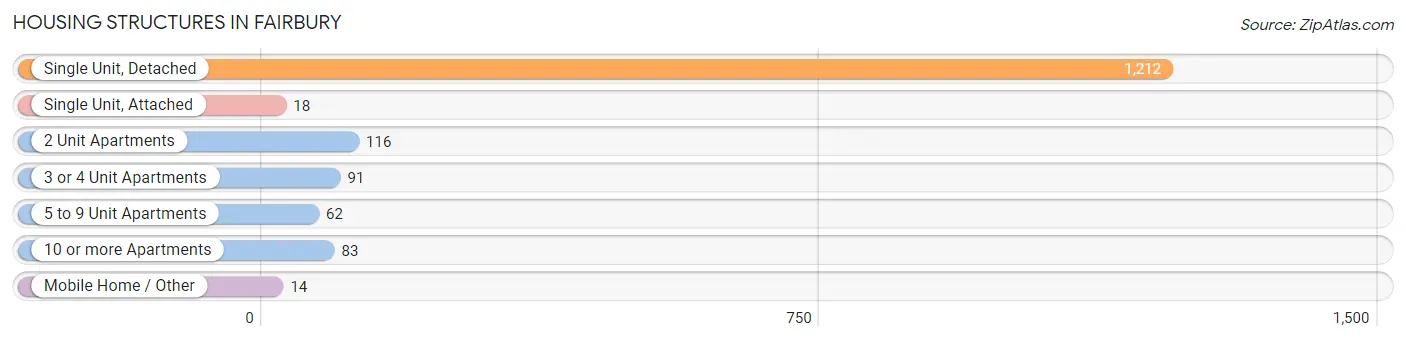
| Structure Type | # Housing Units | % Housing Units |
| Single Unit, Detached | 1,212 | 75.9% |
| Single Unit, Attached | 18 | 1.1% |
| 2 Unit Apartments | 116 | 7.3% |
| 3 or 4 Unit Apartments | 91 | 5.7% |
| 5 to 9 Unit Apartments | 62 | 3.9% |
| 10 or more Apartments | 83 | 5.2% |
| Mobile Home / Other | 14 | 0.9% |
| Total | 1,596 | 100.0% |
Housing Structures by Occupancy in Fairbury
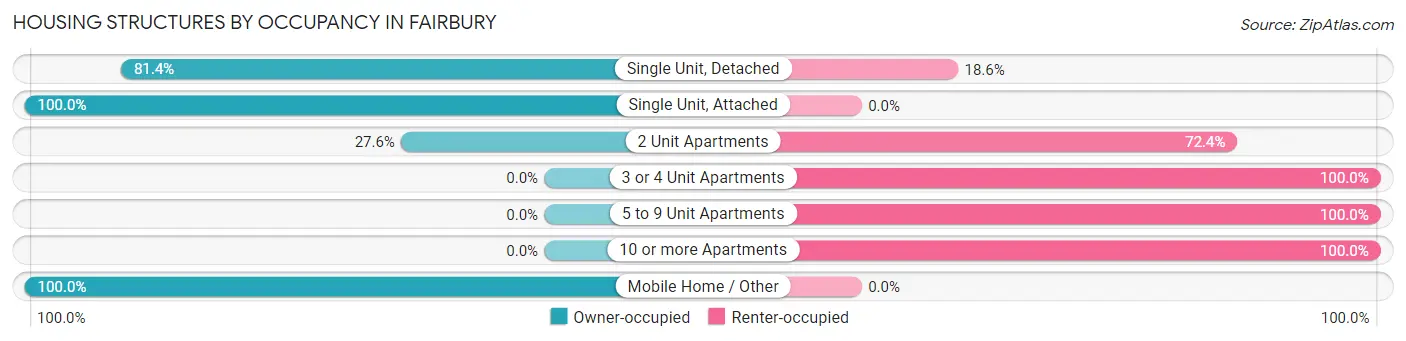
| Structure Type | Owner-occupied | Renter-occupied |
| Single Unit, Detached | 987 (81.4%) | 225 (18.6%) |
| Single Unit, Attached | 18 (100.0%) | 0 (0.0%) |
| 2 Unit Apartments | 32 (27.6%) | 84 (72.4%) |
| 3 or 4 Unit Apartments | 0 (0.0%) | 91 (100.0%) |
| 5 to 9 Unit Apartments | 0 (0.0%) | 62 (100.0%) |
| 10 or more Apartments | 0 (0.0%) | 83 (100.0%) |
| Mobile Home / Other | 14 (100.0%) | 0 (0.0%) |
| Total | 1,051 (65.8%) | 545 (34.2%) |
Housing Structures by Number of Rooms in Fairbury
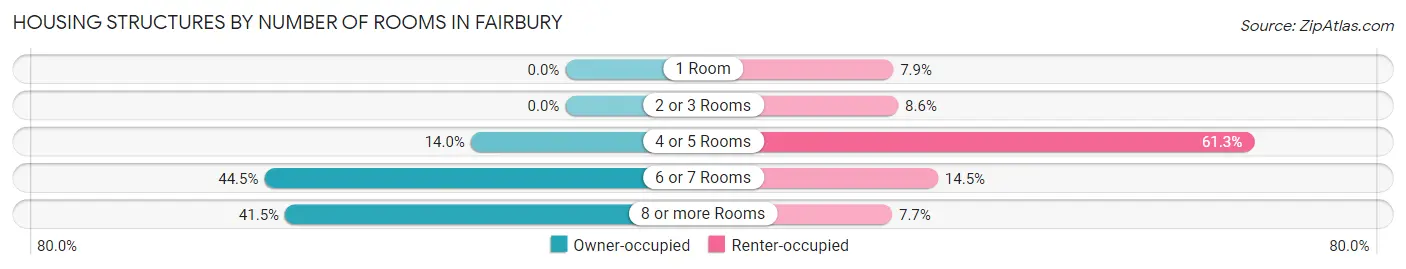
| Number of Rooms | Owner-occupied | Renter-occupied |
| 1 Room | 0 (0.0%) | 43 (7.9%) |
| 2 or 3 Rooms | 0 (0.0%) | 47 (8.6%) |
| 4 or 5 Rooms | 147 (14.0%) | 334 (61.3%) |
| 6 or 7 Rooms | 468 (44.5%) | 79 (14.5%) |
| 8 or more Rooms | 436 (41.5%) | 42 (7.7%) |
| Total | 1,051 (100.0%) | 545 (100.0%) |
Housing Structure by Heating Type in Fairbury
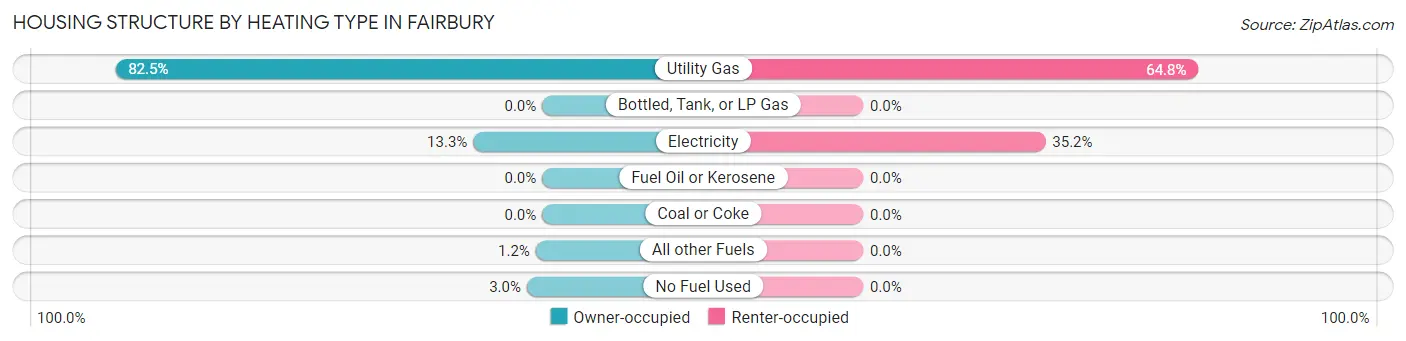
| Heating Type | Owner-occupied | Renter-occupied |
| Utility Gas | 867 (82.5%) | 353 (64.8%) |
| Bottled, Tank, or LP Gas | 0 (0.0%) | 0 (0.0%) |
| Electricity | 140 (13.3%) | 192 (35.2%) |
| Fuel Oil or Kerosene | 0 (0.0%) | 0 (0.0%) |
| Coal or Coke | 0 (0.0%) | 0 (0.0%) |
| All other Fuels | 13 (1.2%) | 0 (0.0%) |
| No Fuel Used | 31 (2.9%) | 0 (0.0%) |
| Total | 1,051 (100.0%) | 545 (100.0%) |
Household Vehicle Usage in Fairbury
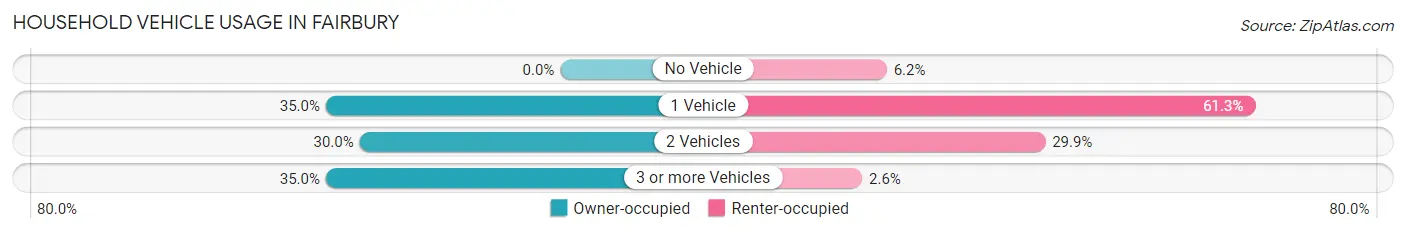
| Vehicles per Household | Owner-occupied | Renter-occupied |
| No Vehicle | 0 (0.0%) | 34 (6.2%) |
| 1 Vehicle | 368 (35.0%) | 334 (61.3%) |
| 2 Vehicles | 315 (30.0%) | 163 (29.9%) |
| 3 or more Vehicles | 368 (35.0%) | 14 (2.6%) |
| Total | 1,051 (100.0%) | 545 (100.0%) |
Real Estate & Mortgages in Fairbury
Real Estate and Mortgage Overview in Fairbury
| Characteristic | Without Mortgage | With Mortgage |
| Housing Units | 462 | 589 |
| Median Property Value | $159,000 | $135,100 |
| Median Household Income | $100,254 | $124 |
| Monthly Housing Costs | $649 | $0 |
| Real Estate Taxes | $3,523 | $0 |
Property Value by Mortgage Status in Fairbury
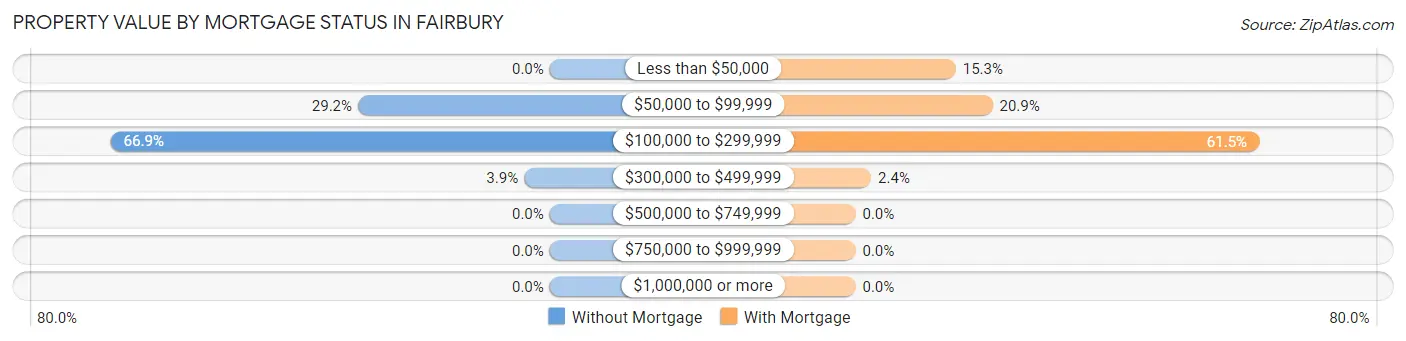
| Property Value | Without Mortgage | With Mortgage |
| Less than $50,000 | 0 (0.0%) | 90 (15.3%) |
| $50,000 to $99,999 | 135 (29.2%) | 123 (20.9%) |
| $100,000 to $299,999 | 309 (66.9%) | 362 (61.5%) |
| $300,000 to $499,999 | 18 (3.9%) | 14 (2.4%) |
| $500,000 to $749,999 | 0 (0.0%) | 0 (0.0%) |
| $750,000 to $999,999 | 0 (0.0%) | 0 (0.0%) |
| $1,000,000 or more | 0 (0.0%) | 0 (0.0%) |
| Total | 462 (100.0%) | 589 (100.0%) |
Household Income by Mortgage Status in Fairbury
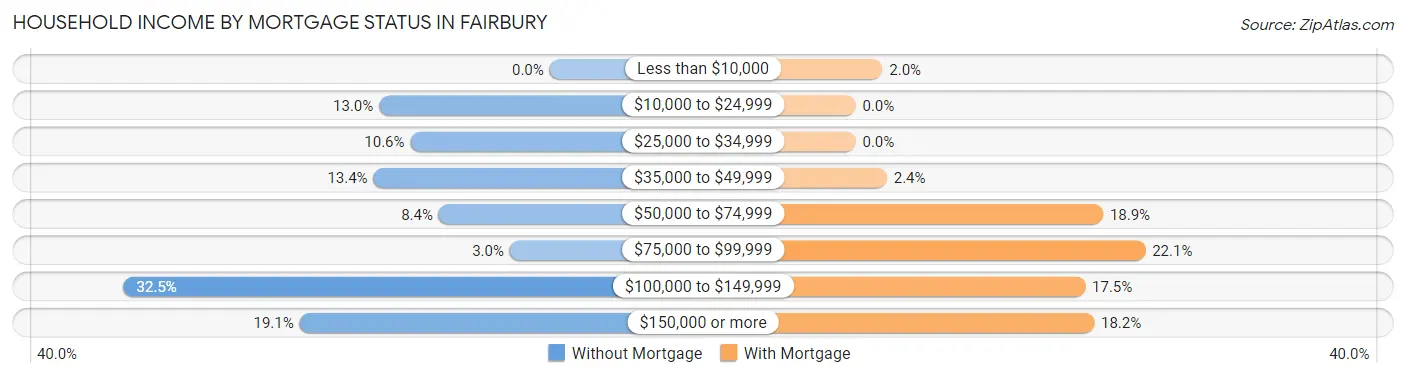
| Household Income | Without Mortgage | With Mortgage |
| Less than $10,000 | 0 (0.0%) | 12 (2.0%) |
| $10,000 to $24,999 | 60 (13.0%) | 0 (0.0%) |
| $25,000 to $34,999 | 49 (10.6%) | 0 (0.0%) |
| $35,000 to $49,999 | 62 (13.4%) | 14 (2.4%) |
| $50,000 to $74,999 | 39 (8.4%) | 111 (18.9%) |
| $75,000 to $99,999 | 14 (3.0%) | 130 (22.1%) |
| $100,000 to $149,999 | 150 (32.5%) | 103 (17.5%) |
| $150,000 or more | 88 (19.1%) | 107 (18.2%) |
| Total | 462 (100.0%) | 589 (100.0%) |
Property Value to Household Income Ratio in Fairbury
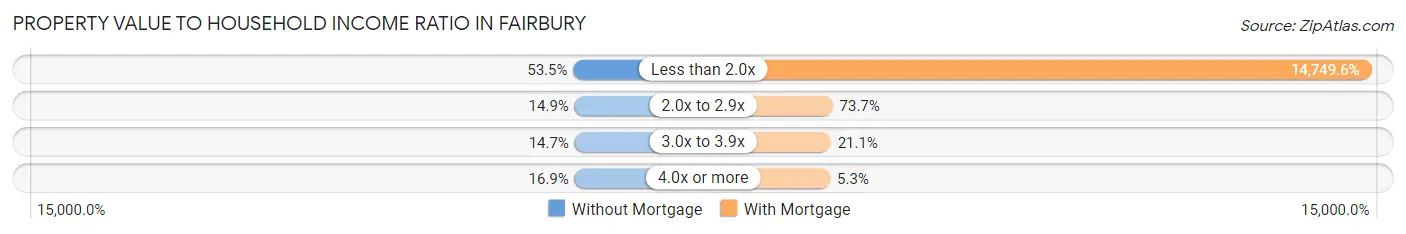
| Value-to-Income Ratio | Without Mortgage | With Mortgage |
| Less than 2.0x | 247 (53.5%) | 86,875 (14,749.6%) |
| 2.0x to 2.9x | 69 (14.9%) | 434 (73.7%) |
| 3.0x to 3.9x | 68 (14.7%) | 124 (21.0%) |
| 4.0x or more | 78 (16.9%) | 31 (5.3%) |
| Total | 462 (100.0%) | 589 (100.0%) |
Real Estate Taxes by Mortgage Status in Fairbury
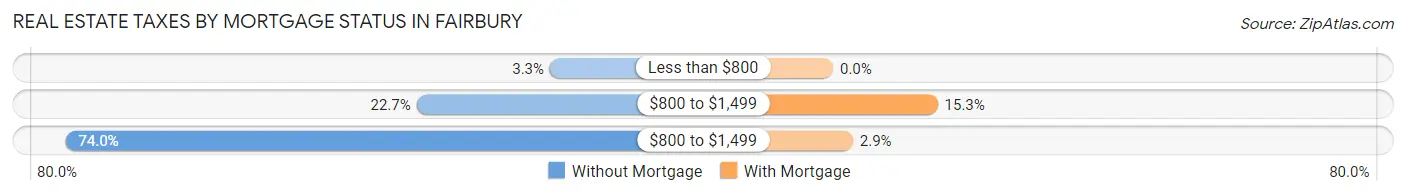
| Property Taxes | Without Mortgage | With Mortgage |
| Less than $800 | 15 (3.3%) | 0 (0.0%) |
| $800 to $1,499 | 105 (22.7%) | 90 (15.3%) |
| $800 to $1,499 | 342 (74.0%) | 17 (2.9%) |
| Total | 462 (100.0%) | 589 (100.0%) |
Health & Disability in Fairbury
Health Insurance Coverage by Age in Fairbury
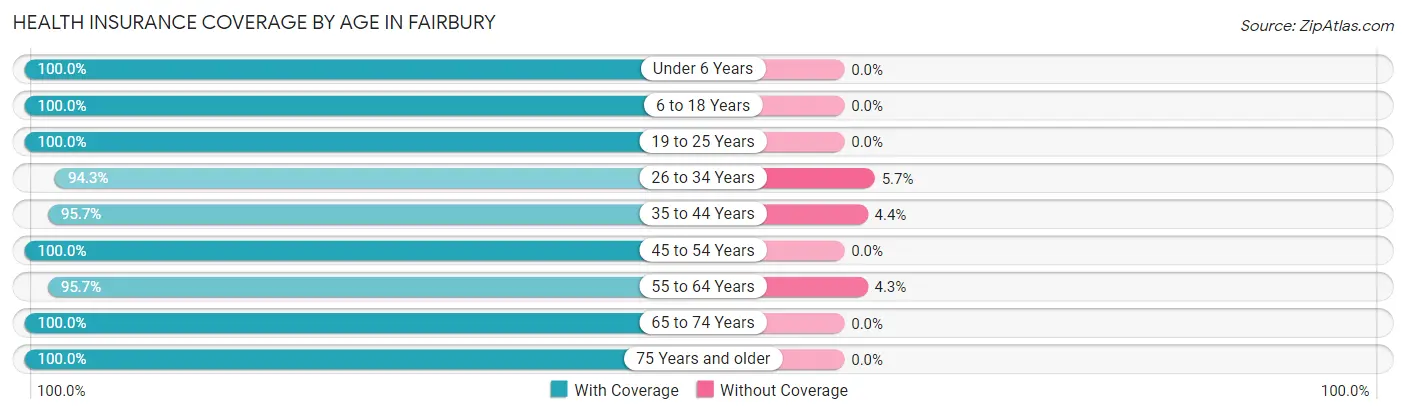
| Age Bracket | With Coverage | Without Coverage |
| Under 6 Years | 319 (100.0%) | 0 (0.0%) |
| 6 to 18 Years | 662 (100.0%) | 0 (0.0%) |
| 19 to 25 Years | 225 (100.0%) | 0 (0.0%) |
| 26 to 34 Years | 299 (94.3%) | 18 (5.7%) |
| 35 to 44 Years | 374 (95.7%) | 17 (4.3%) |
| 45 to 54 Years | 382 (100.0%) | 0 (0.0%) |
| 55 to 64 Years | 508 (95.7%) | 23 (4.3%) |
| 65 to 74 Years | 433 (100.0%) | 0 (0.0%) |
| 75 Years and older | 404 (100.0%) | 0 (0.0%) |
| Total | 3,606 (98.4%) | 58 (1.6%) |
Health Insurance Coverage by Citizenship Status in Fairbury
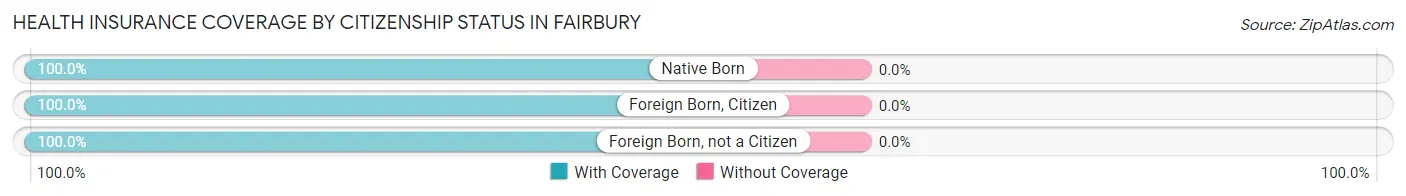
| Citizenship Status | With Coverage | Without Coverage |
| Native Born | 319 (100.0%) | 0 (0.0%) |
| Foreign Born, Citizen | 662 (100.0%) | 0 (0.0%) |
| Foreign Born, not a Citizen | 225 (100.0%) | 0 (0.0%) |
Health Insurance Coverage by Household Income in Fairbury
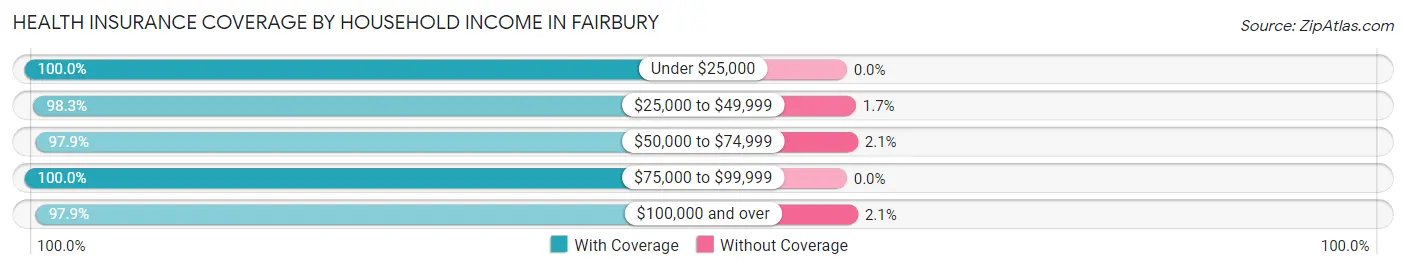
| Household Income | With Coverage | Without Coverage |
| Under $25,000 | 267 (100.0%) | 0 (0.0%) |
| $25,000 to $49,999 | 751 (98.3%) | 13 (1.7%) |
| $50,000 to $74,999 | 803 (97.9%) | 17 (2.1%) |
| $75,000 to $99,999 | 476 (100.0%) | 0 (0.0%) |
| $100,000 and over | 1,309 (97.9%) | 28 (2.1%) |
Public vs Private Health Insurance Coverage by Age in Fairbury
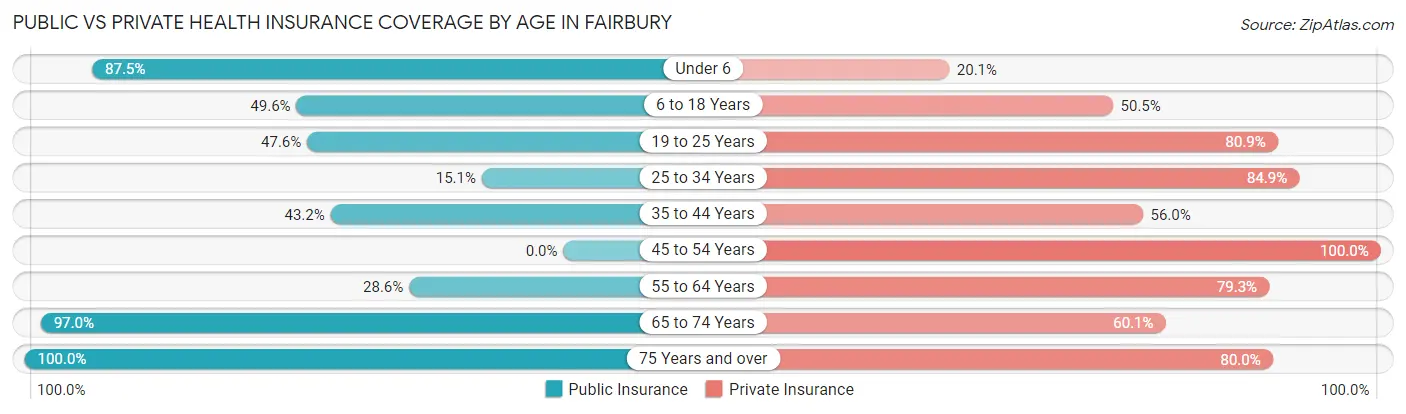
| Age Bracket | Public Insurance | Private Insurance |
| Under 6 | 279 (87.5%) | 64 (20.1%) |
| 6 to 18 Years | 328 (49.5%) | 334 (50.4%) |
| 19 to 25 Years | 107 (47.6%) | 182 (80.9%) |
| 25 to 34 Years | 48 (15.1%) | 269 (84.9%) |
| 35 to 44 Years | 169 (43.2%) | 219 (56.0%) |
| 45 to 54 Years | 0 (0.0%) | 382 (100.0%) |
| 55 to 64 Years | 152 (28.6%) | 421 (79.3%) |
| 65 to 74 Years | 420 (97.0%) | 260 (60.1%) |
| 75 Years and over | 404 (100.0%) | 323 (79.9%) |
| Total | 1,907 (52.0%) | 2,454 (67.0%) |
Disability Status by Sex by Age in Fairbury
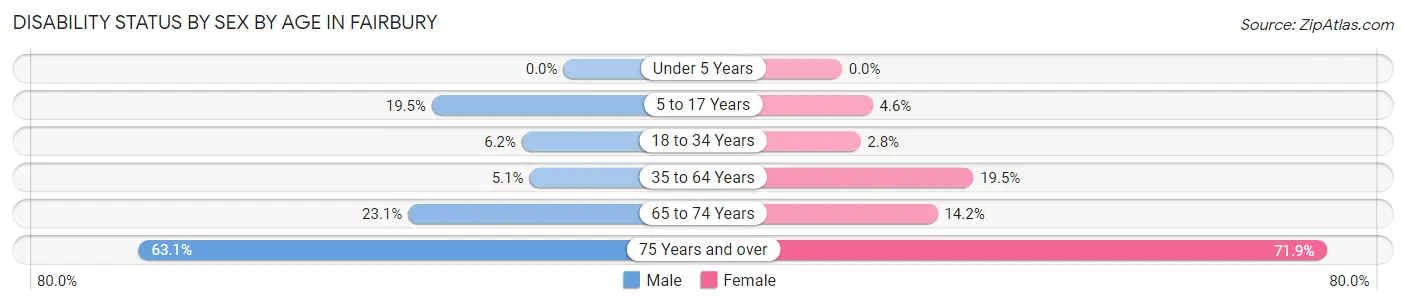
| Age Bracket | Male | Female |
| Under 5 Years | 0 (0.0%) | 0 (0.0%) |
| 5 to 17 Years | 68 (19.5%) | 16 (4.6%) |
| 18 to 34 Years | 18 (6.2%) | 8 (2.8%) |
| 35 to 64 Years | 27 (5.1%) | 150 (19.5%) |
| 65 to 74 Years | 56 (23.1%) | 27 (14.2%) |
| 75 Years and over | 111 (63.1%) | 164 (71.9%) |
Disability Class by Sex by Age in Fairbury
Disability Class: Hearing Difficulty
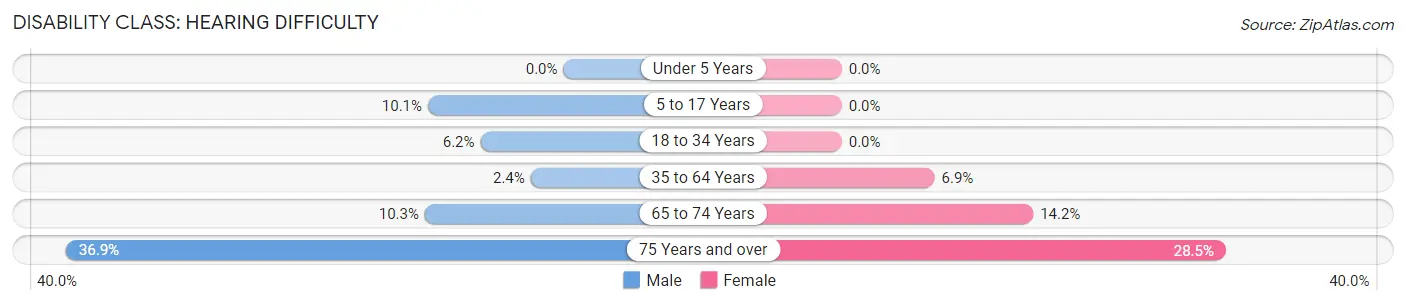
| Age Bracket | Male | Female |
| Under 5 Years | 0 (0.0%) | 0 (0.0%) |
| 5 to 17 Years | 35 (10.1%) | 0 (0.0%) |
| 18 to 34 Years | 18 (6.2%) | 0 (0.0%) |
| 35 to 64 Years | 13 (2.4%) | 53 (6.9%) |
| 65 to 74 Years | 25 (10.3%) | 27 (14.2%) |
| 75 Years and over | 65 (36.9%) | 65 (28.5%) |
Disability Class: Vision Difficulty
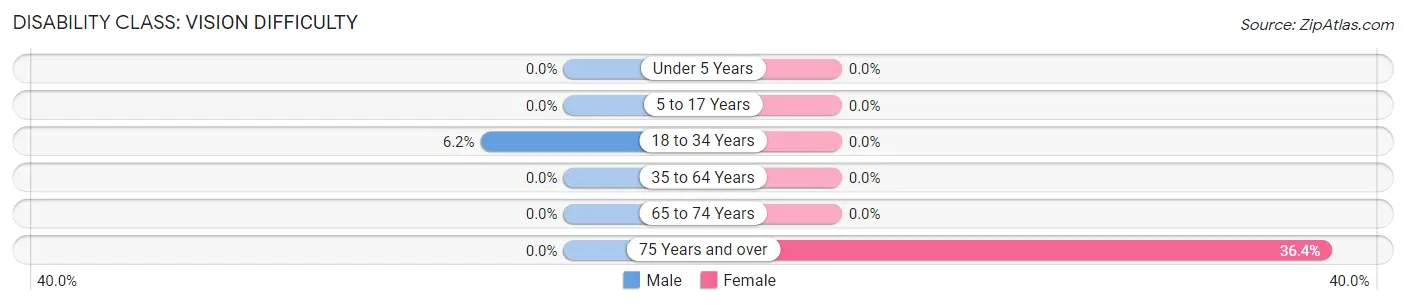
| Age Bracket | Male | Female |
| Under 5 Years | 0 (0.0%) | 0 (0.0%) |
| 5 to 17 Years | 0 (0.0%) | 0 (0.0%) |
| 18 to 34 Years | 18 (6.2%) | 0 (0.0%) |
| 35 to 64 Years | 0 (0.0%) | 0 (0.0%) |
| 65 to 74 Years | 0 (0.0%) | 0 (0.0%) |
| 75 Years and over | 0 (0.0%) | 83 (36.4%) |
Disability Class: Cognitive Difficulty
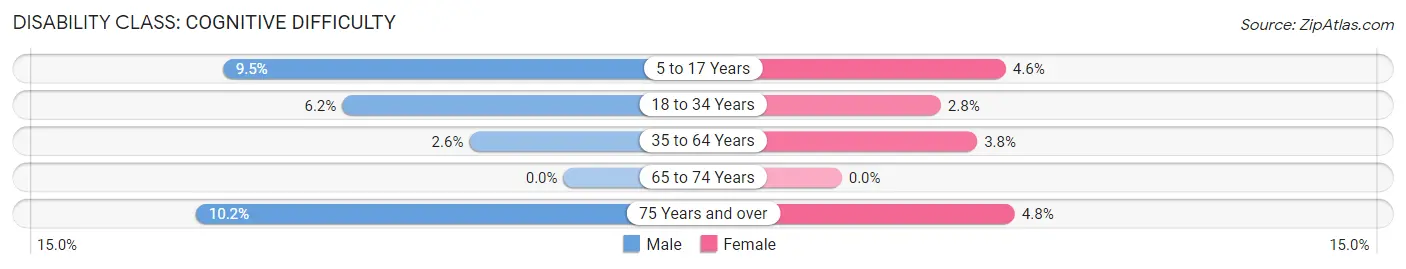
| Age Bracket | Male | Female |
| 5 to 17 Years | 33 (9.5%) | 16 (4.6%) |
| 18 to 34 Years | 18 (6.2%) | 8 (2.8%) |
| 35 to 64 Years | 14 (2.6%) | 29 (3.8%) |
| 65 to 74 Years | 0 (0.0%) | 0 (0.0%) |
| 75 Years and over | 18 (10.2%) | 11 (4.8%) |
Disability Class: Ambulatory Difficulty
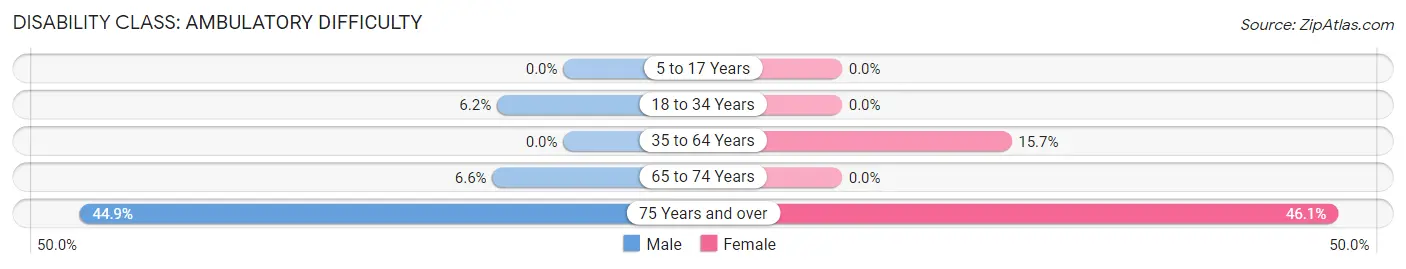
| Age Bracket | Male | Female |
| 5 to 17 Years | 0 (0.0%) | 0 (0.0%) |
| 18 to 34 Years | 18 (6.2%) | 0 (0.0%) |
| 35 to 64 Years | 0 (0.0%) | 121 (15.7%) |
| 65 to 74 Years | 16 (6.6%) | 0 (0.0%) |
| 75 Years and over | 79 (44.9%) | 105 (46.1%) |
Disability Class: Self-Care Difficulty
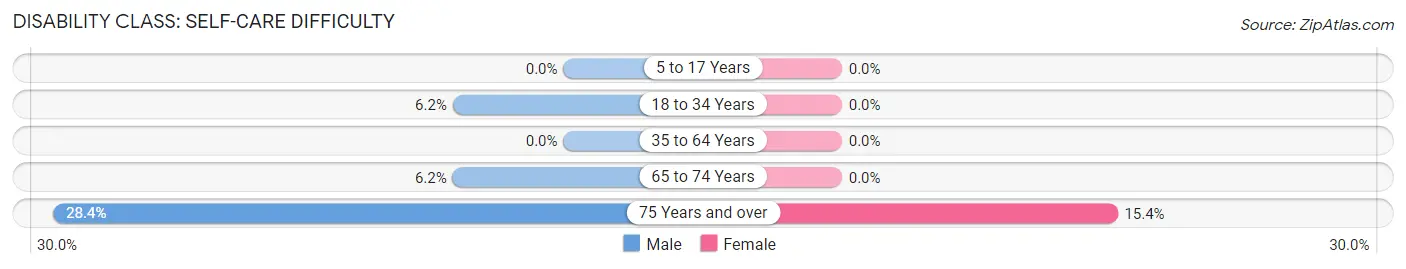
| Age Bracket | Male | Female |
| 5 to 17 Years | 0 (0.0%) | 0 (0.0%) |
| 18 to 34 Years | 18 (6.2%) | 0 (0.0%) |
| 35 to 64 Years | 0 (0.0%) | 0 (0.0%) |
| 65 to 74 Years | 15 (6.2%) | 0 (0.0%) |
| 75 Years and over | 50 (28.4%) | 35 (15.3%) |
Technology Access in Fairbury
Computing Device Access in Fairbury
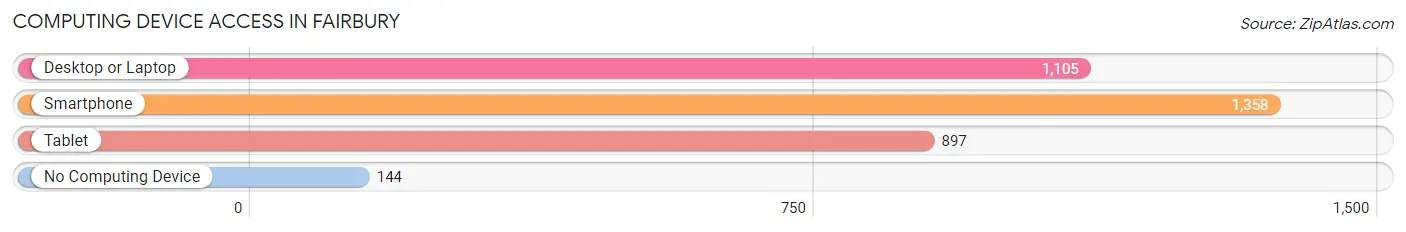
| Device Type | # Households | % Households |
| Desktop or Laptop | 1,105 | 69.2% |
| Smartphone | 1,358 | 85.1% |
| Tablet | 897 | 56.2% |
| No Computing Device | 144 | 9.0% |
| Total | 1,596 | 100.0% |
Internet Access in Fairbury
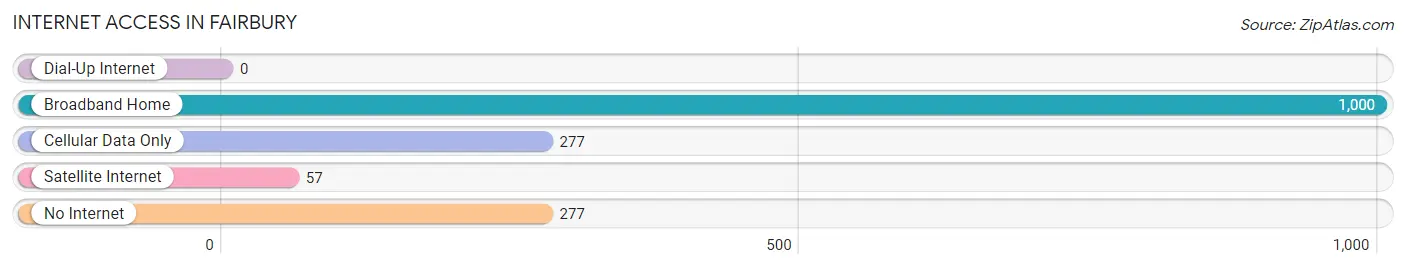
| Internet Type | # Households | % Households |
| Dial-Up Internet | 0 | 0.0% |
| Broadband Home | 1,000 | 62.7% |
| Cellular Data Only | 277 | 17.4% |
| Satellite Internet | 57 | 3.6% |
| No Internet | 277 | 17.4% |
| Total | 1,596 | 100.0% |
Fairbury Summary
Fairbury, Illinois is a small city located in Livingston County, Illinois. It is situated in the central part of the state, about 60 miles south of Chicago. The city has a population of approximately 3,500 people and is the county seat of Livingston County.
History
Fairbury was founded in 1836 by a group of settlers from New York. The city was named after Fairbury, New York, the hometown of the settlers. The city was incorporated in 1867 and has since grown to become the county seat of Livingston County.
The city was an important stop on the Chicago and Alton Railroad, which ran through the city from 1853 to 1971. The railroad was a major factor in the growth of the city, as it allowed for the transportation of goods and people to and from the city.
Geography
Fairbury is located in the central part of Illinois, about 60 miles south of Chicago. The city is situated in the Vermilion River Valley, which is part of the Grand Prairie region of Illinois. The city is surrounded by farmland and is located near the cities of Pontiac, Dwight, and Chenoa.
The climate in Fairbury is typical of the Midwest, with hot summers and cold winters. The average temperature in the summer is around 80 degrees Fahrenheit, while the average temperature in the winter is around 20 degrees Fahrenheit.
Economy
Fairbury’s economy is largely based on agriculture and manufacturing. The city is home to several large agricultural companies, including Fairbury Grain and Feed, Fairbury Farms, and Fairbury Foods. The city is also home to several manufacturing companies, including Fairbury Manufacturing, Fairbury Machine Works, and Fairbury Plastics.
The city is also home to several small businesses, including restaurants, retail stores, and service providers. The city is also home to several educational institutions, including Fairbury Community College and Fairbury High School.
Demographics
As of the 2010 census, the population of Fairbury was 3,521. The racial makeup of the city was 97.2% White, 0.7% African American, 0.3% Native American, 0.3% Asian, 0.1% Pacific Islander, 0.4% from other races, and 1.0% from two or more races. Hispanic or Latino of any race were 1.7% of the population.
The median income for a household in the city was $41,944, and the median income for a family was $50,917. The per capita income for the city was $20,845. About 8.2% of families and 10.3% of the population were below the poverty line, including 14.2% of those under age 18 and 6.2% of those age 65 or over.
Fairbury is a small city with a rich history and a diverse economy. The city is home to several large agricultural and manufacturing companies, as well as small businesses and educational institutions. The city has a population of approximately 3,500 people and is the county seat of Livingston County.
Common Questions
What is Per Capita Income in Fairbury?
Per Capita income in Fairbury is $35,020.
What is the Median Family Income in Fairbury?
Median Family Income in Fairbury is $86,319.
What is the Median Household income in Fairbury?
Median Household Income in Fairbury is $64,150.
What is Income or Wage Gap in Fairbury?
Income or Wage Gap in Fairbury is 36.2%.
Women in Fairbury earn 63.8 cents for every dollar earned by a man.
What is Inequality or Gini Index in Fairbury?
Inequality or Gini Index in Fairbury is 0.37.
What is the Total Population of Fairbury?
Total Population of Fairbury is 3,731.
What is the Total Male Population of Fairbury?
Total Male Population of Fairbury is 1,685.
What is the Total Female Population of Fairbury?
Total Female Population of Fairbury is 2,046.
What is the Ratio of Males per 100 Females in Fairbury?
There are 82.36 Males per 100 Females in Fairbury.
What is the Ratio of Females per 100 Males in Fairbury?
There are 121.42 Females per 100 Males in Fairbury.
What is the Median Population Age in Fairbury?
Median Population Age in Fairbury is 44.3 Years.
What is the Average Family Size in Fairbury
Average Family Size in Fairbury is 2.7 People.
What is the Average Household Size in Fairbury
Average Household Size in Fairbury is 2.3 People.
How Large is the Labor Force in Fairbury?
There are 1,727 People in the Labor Forcein in Fairbury.
What is the Percentage of People in the Labor Force in Fairbury?
57.9% of People are in the Labor Force in Fairbury.
What is the Unemployment Rate in Fairbury?
Unemployment Rate in Fairbury is 3.6%.