East Dubuque, IL Map & Demographics
East Dubuque Map
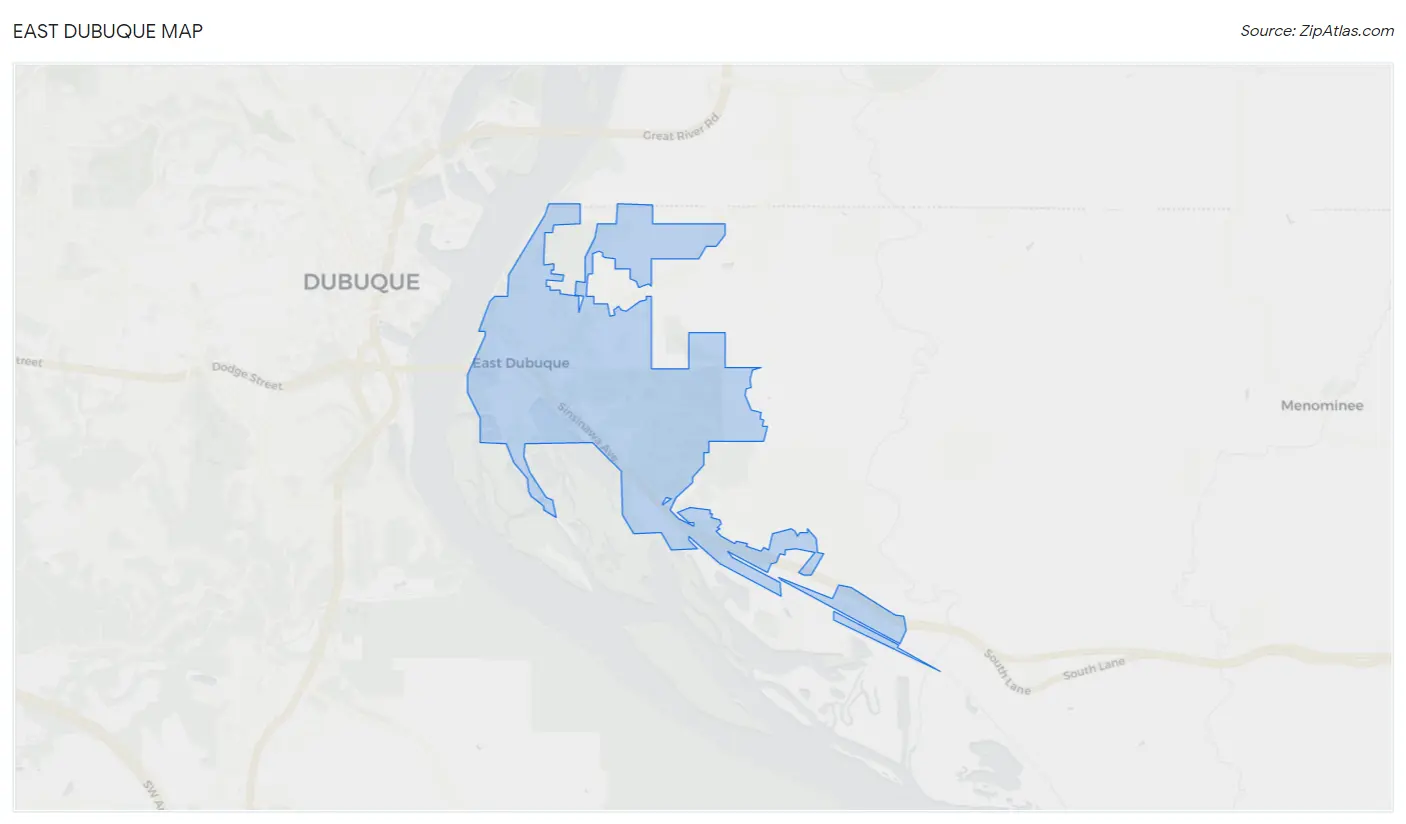
East Dubuque Overview
$33,465
PER CAPITA INCOME
$72,368
AVG FAMILY INCOME
$62,440
AVG HOUSEHOLD INCOME
24.1%
WAGE / INCOME GAP [ % ]
75.9¢/ $1
WAGE / INCOME GAP [ $ ]
0.38
INEQUALITY / GINI INDEX
1,634
TOTAL POPULATION
860
MALE POPULATION
774
FEMALE POPULATION
111.11
MALES / 100 FEMALES
90.00
FEMALES / 100 MALES
39.9
MEDIAN AGE
2.8
AVG FAMILY SIZE
2.2
AVG HOUSEHOLD SIZE
935
LABOR FORCE [ PEOPLE ]
73.7%
PERCENT IN LABOR FORCE
4.2%
UNEMPLOYMENT RATE
East Dubuque Zip Codes
East Dubuque Area Codes
Income in East Dubuque
Income Overview in East Dubuque
Per Capita Income in East Dubuque is $33,465, while median incomes of families and households are $72,368 and $62,440 respectively.
| Characteristic | Number | Measure |
| Per Capita Income | 1,634 | $33,465 |
| Median Family Income | 440 | $72,368 |
| Mean Family Income | 440 | $91,380 |
| Median Household Income | 739 | $62,440 |
| Mean Household Income | 739 | $74,551 |
| Income Deficit | 440 | $0 |
| Wage / Income Gap (%) | 1,634 | 24.13% |
| Wage / Income Gap ($) | 1,634 | 75.87¢ per $1 |
| Gini / Inequality Index | 1,634 | 0.38 |
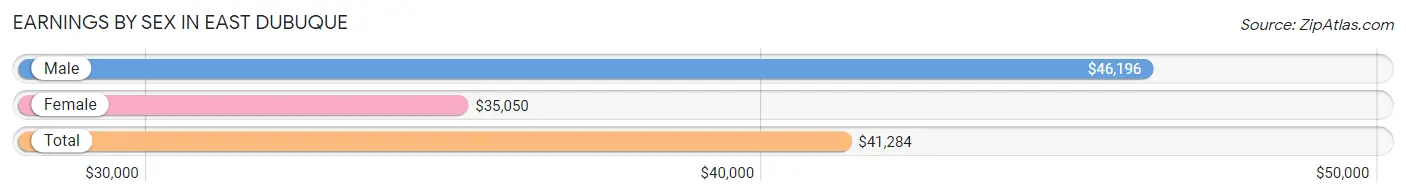
Earnings by Sex in East Dubuque
Average Earnings in East Dubuque are $41,284, $46,196 for men and $35,050 for women, a difference of 24.1%.
| Sex | Number | Average Earnings |
| Male | 490 (50.9%) | $46,196 |
| Female | 473 (49.1%) | $35,050 |
| Total | 963 (100.0%) | $41,284 |
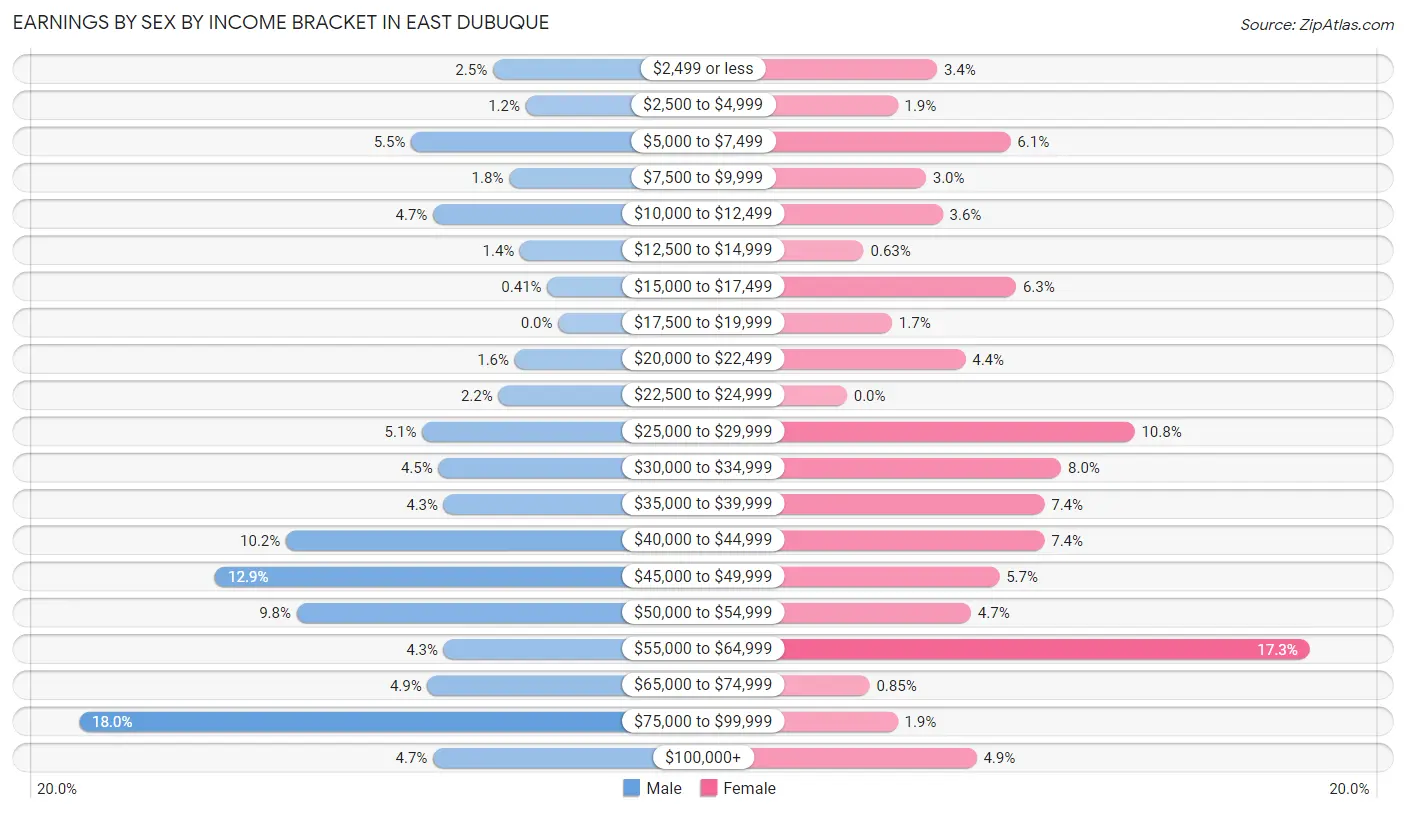
Earnings by Sex by Income Bracket in East Dubuque
The most common earnings brackets in East Dubuque are $75,000 to $99,999 for men (88 | 18.0%) and $55,000 to $64,999 for women (82 | 17.3%).
| Income | Male | Female |
| $2,499 or less | 12 (2.5%) | 16 (3.4%) |
| $2,500 to $4,999 | 6 (1.2%) | 9 (1.9%) |
| $5,000 to $7,499 | 27 (5.5%) | 29 (6.1%) |
| $7,500 to $9,999 | 9 (1.8%) | 14 (3.0%) |
| $10,000 to $12,499 | 23 (4.7%) | 17 (3.6%) |
| $12,500 to $14,999 | 7 (1.4%) | 3 (0.6%) |
| $15,000 to $17,499 | 2 (0.4%) | 30 (6.3%) |
| $17,500 to $19,999 | 0 (0.0%) | 8 (1.7%) |
| $20,000 to $22,499 | 8 (1.6%) | 21 (4.4%) |
| $22,500 to $24,999 | 11 (2.2%) | 0 (0.0%) |
| $25,000 to $29,999 | 25 (5.1%) | 51 (10.8%) |
| $30,000 to $34,999 | 22 (4.5%) | 38 (8.0%) |
| $35,000 to $39,999 | 21 (4.3%) | 35 (7.4%) |
| $40,000 to $44,999 | 50 (10.2%) | 35 (7.4%) |
| $45,000 to $49,999 | 63 (12.9%) | 27 (5.7%) |
| $50,000 to $54,999 | 48 (9.8%) | 22 (4.6%) |
| $55,000 to $64,999 | 21 (4.3%) | 82 (17.3%) |
| $65,000 to $74,999 | 24 (4.9%) | 4 (0.9%) |
| $75,000 to $99,999 | 88 (18.0%) | 9 (1.9%) |
| $100,000+ | 23 (4.7%) | 23 (4.9%) |
| Total | 490 (100.0%) | 473 (100.0%) |
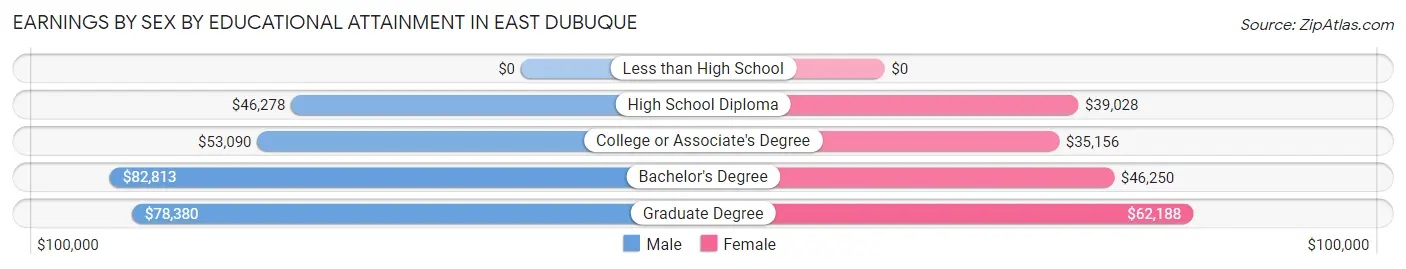
Earnings by Sex by Educational Attainment in East Dubuque
Average earnings in East Dubuque are $49,559 for men and $38,889 for women, a difference of 21.5%. Men with an educational attainment of bachelor's degree enjoy the highest average annual earnings of $82,813, while those with high school diploma education earn the least with $46,278. Women with an educational attainment of graduate degree earn the most with the average annual earnings of $62,188, while those with college or associate's degree education have the smallest earnings of $35,156.
| Educational Attainment | Male Income | Female Income |
| Less than High School | - | - |
| High School Diploma | $46,278 | $39,028 |
| College or Associate's Degree | $53,090 | $35,156 |
| Bachelor's Degree | $82,813 | $46,250 |
| Graduate Degree | $78,380 | $62,188 |
| Total | $49,559 | $38,889 |
Family Income in East Dubuque
Family Income Brackets in East Dubuque
According to the East Dubuque family income data, there are 144 families falling into the $50,000 to $74,999 income range, which is the most common income bracket and makes up 32.7% of all families.
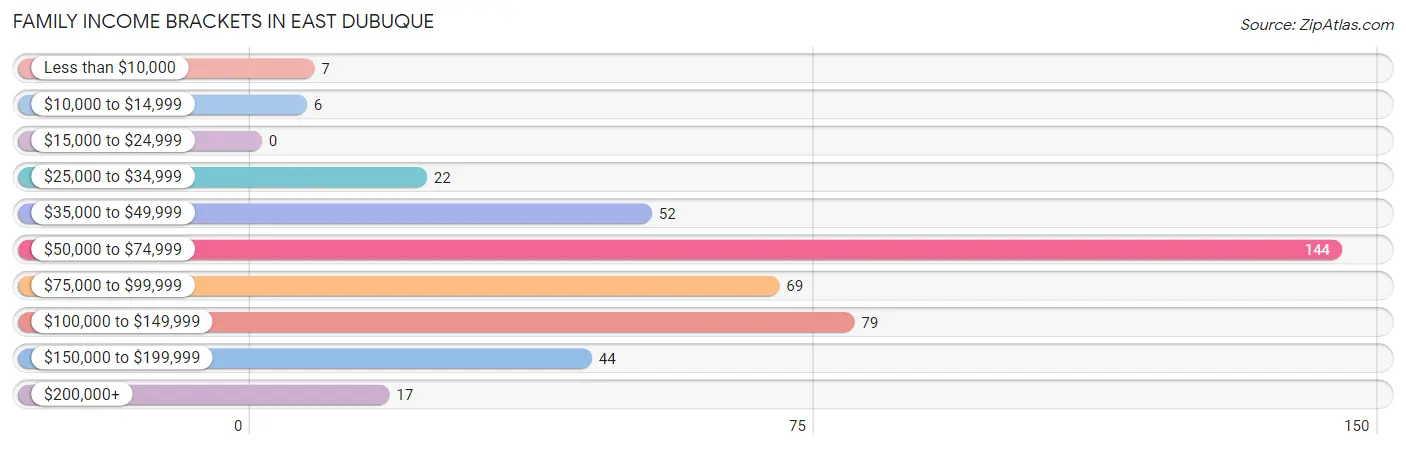
| Income Bracket | # Families | % Families |
| Less than $10,000 | 7 | 1.6% |
| $10,000 to $14,999 | 6 | 1.4% |
| $15,000 to $24,999 | 0 | 0.0% |
| $25,000 to $34,999 | 22 | 5.0% |
| $35,000 to $49,999 | 52 | 11.8% |
| $50,000 to $74,999 | 144 | 32.7% |
| $75,000 to $99,999 | 69 | 15.7% |
| $100,000 to $149,999 | 79 | 18.0% |
| $150,000 to $199,999 | 44 | 10.0% |
| $200,000+ | 17 | 3.9% |
Family Income by Famaliy Size in East Dubuque
5-person families (33 | 7.5%) account for the highest median family income in East Dubuque with $125,673 per family, while 2-person families (207 | 47.0%) have the highest median income of $32,562 per family member.
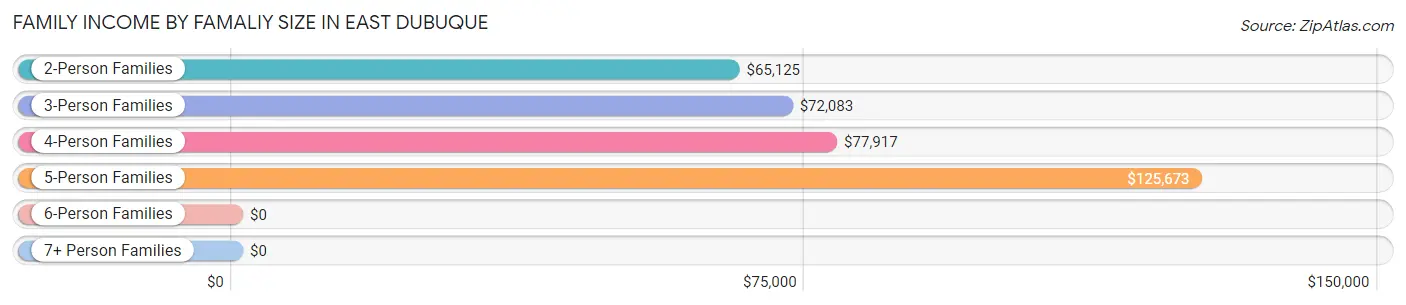
| Income Bracket | # Families | Median Income |
| 2-Person Families | 207 (47.0%) | $65,125 |
| 3-Person Families | 89 (20.2%) | $72,083 |
| 4-Person Families | 78 (17.7%) | $77,917 |
| 5-Person Families | 33 (7.5%) | $125,673 |
| 6-Person Families | 27 (6.1%) | $0 |
| 7+ Person Families | 6 (1.4%) | $0 |
| Total | 440 (100.0%) | $72,368 |
Family Income by Number of Earners in East Dubuque
The median family income in East Dubuque is $72,368, with families comprising 3+ earners (76) having the highest median family income of $188,056, while families with no earners (41) have the lowest median family income of $40,208, accounting for 17.3% and 9.3% of families, respectively.
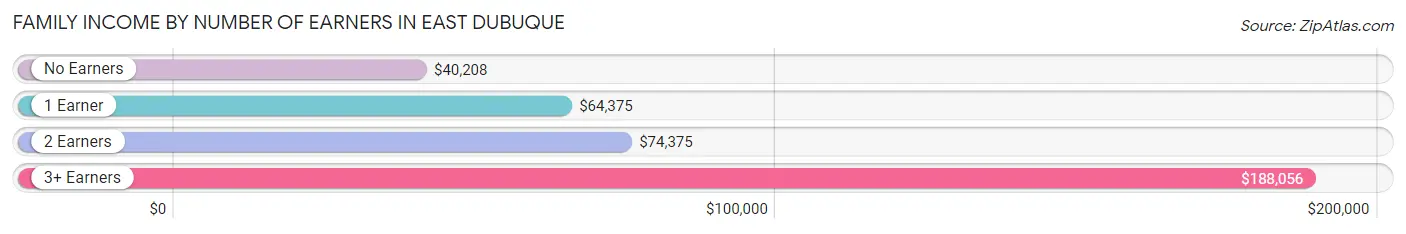
| Number of Earners | # Families | Median Income |
| No Earners | 41 (9.3%) | $40,208 |
| 1 Earner | 147 (33.4%) | $64,375 |
| 2 Earners | 176 (40.0%) | $74,375 |
| 3+ Earners | 76 (17.3%) | $188,056 |
| Total | 440 (100.0%) | $72,368 |
Household Income in East Dubuque
Household Income Brackets in East Dubuque
With 164 households falling in the category, the $50,000 to $74,999 income range is the most frequent in East Dubuque, accounting for 22.2% of all households. In contrast, only 19 households (2.6%) fall into the $200,000+ income bracket, making it the least populous group.
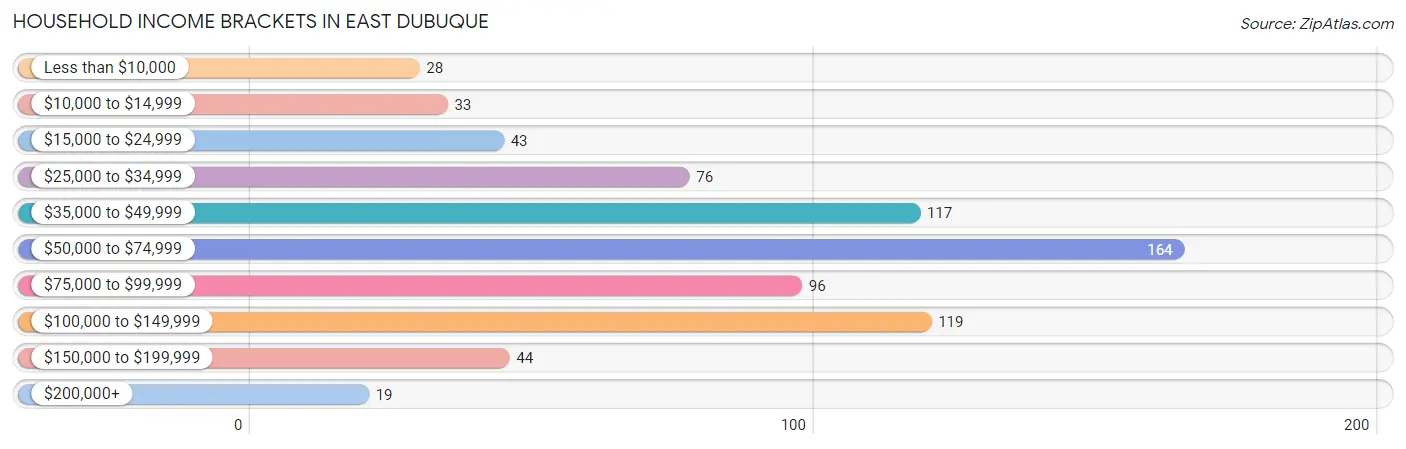
| Income Bracket | # Households | % Households |
| Less than $10,000 | 28 | 3.8% |
| $10,000 to $14,999 | 33 | 4.5% |
| $15,000 to $24,999 | 43 | 5.8% |
| $25,000 to $34,999 | 76 | 10.3% |
| $35,000 to $49,999 | 117 | 15.8% |
| $50,000 to $74,999 | 164 | 22.2% |
| $75,000 to $99,999 | 96 | 13.0% |
| $100,000 to $149,999 | 119 | 16.1% |
| $150,000 to $199,999 | 44 | 6.0% |
| $200,000+ | 19 | 2.6% |
Household Income by Householder Age in East Dubuque
The median household income in East Dubuque is $62,440, with the highest median household income of $71,042 found in the 25 to 44 years age bracket for the primary householder. A total of 191 households (25.9%) fall into this category. Meanwhile, the 15 to 24 years age bracket for the primary householder has the lowest median household income of $0, with 40 households (5.4%) in this group.
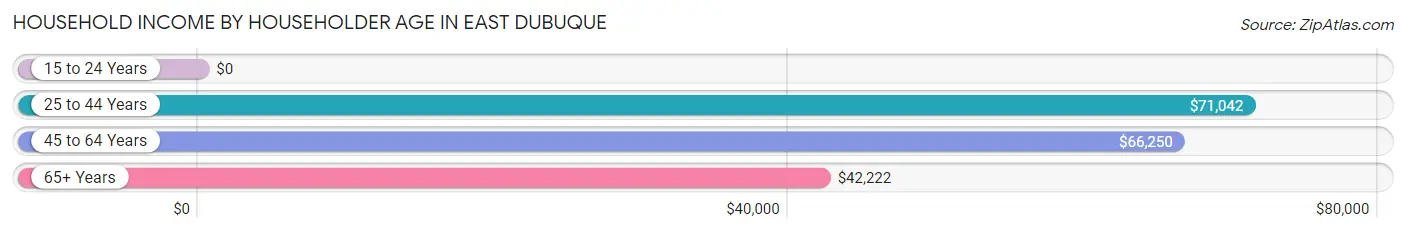
| Income Bracket | # Households | Median Income |
| 15 to 24 Years | 40 (5.4%) | $0 |
| 25 to 44 Years | 191 (25.9%) | $71,042 |
| 45 to 64 Years | 292 (39.5%) | $66,250 |
| 65+ Years | 216 (29.2%) | $42,222 |
| Total | 739 (100.0%) | $62,440 |
Poverty in East Dubuque
Income Below Poverty by Sex and Age in East Dubuque
With 5.8% poverty level for males and 7.3% for females among the residents of East Dubuque, 18 to 24 year old males and 18 to 24 year old females are the most vulnerable to poverty, with 22 males (26.8%) and 27 females (46.6%) in their respective age groups living below the poverty level.
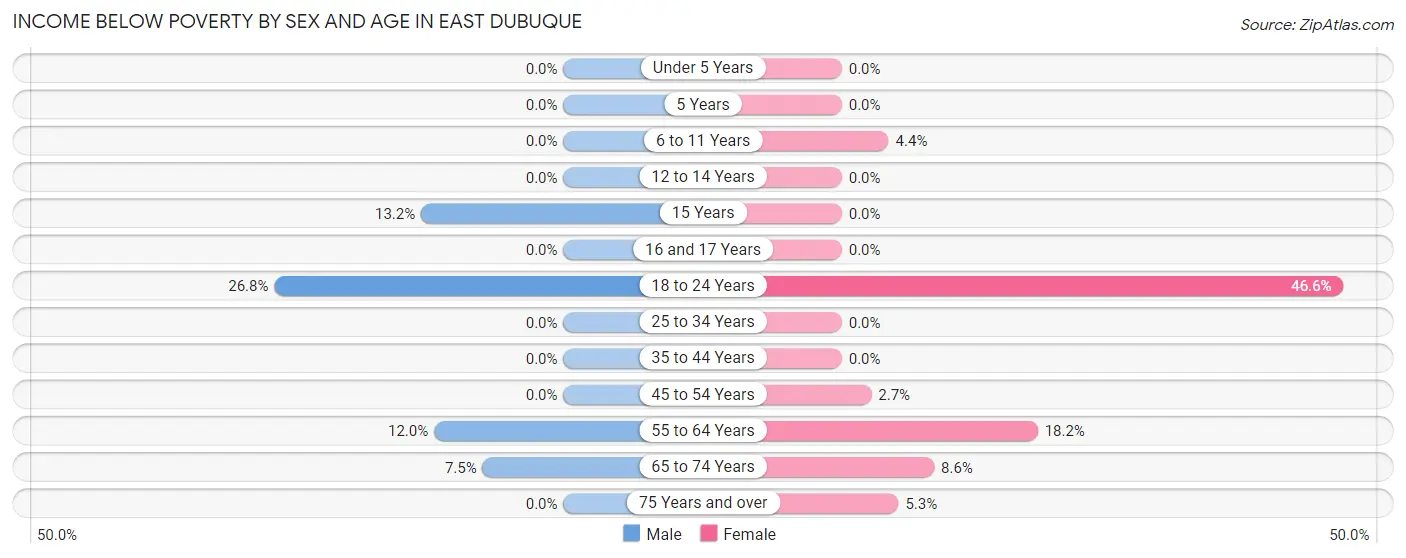
| Age Bracket | Male | Female |
| Under 5 Years | 0 (0.0%) | 0 (0.0%) |
| 5 Years | 0 (0.0%) | 0 (0.0%) |
| 6 to 11 Years | 0 (0.0%) | 2 (4.3%) |
| 12 to 14 Years | 0 (0.0%) | 0 (0.0%) |
| 15 Years | 7 (13.2%) | 0 (0.0%) |
| 16 and 17 Years | 0 (0.0%) | 0 (0.0%) |
| 18 to 24 Years | 22 (26.8%) | 27 (46.6%) |
| 25 to 34 Years | 0 (0.0%) | 0 (0.0%) |
| 35 to 44 Years | 0 (0.0%) | 0 (0.0%) |
| 45 to 54 Years | 0 (0.0%) | 4 (2.7%) |
| 55 to 64 Years | 15 (12.0%) | 12 (18.2%) |
| 65 to 74 Years | 6 (7.5%) | 6 (8.6%) |
| 75 Years and over | 0 (0.0%) | 5 (5.3%) |
| Total | 50 (5.8%) | 56 (7.3%) |
Income Above Poverty by Sex and Age in East Dubuque
According to the poverty statistics in East Dubuque, males aged under 5 years and females aged under 5 years are the age groups that are most secure financially, with 100.0% of males and 100.0% of females in these age groups living above the poverty line.
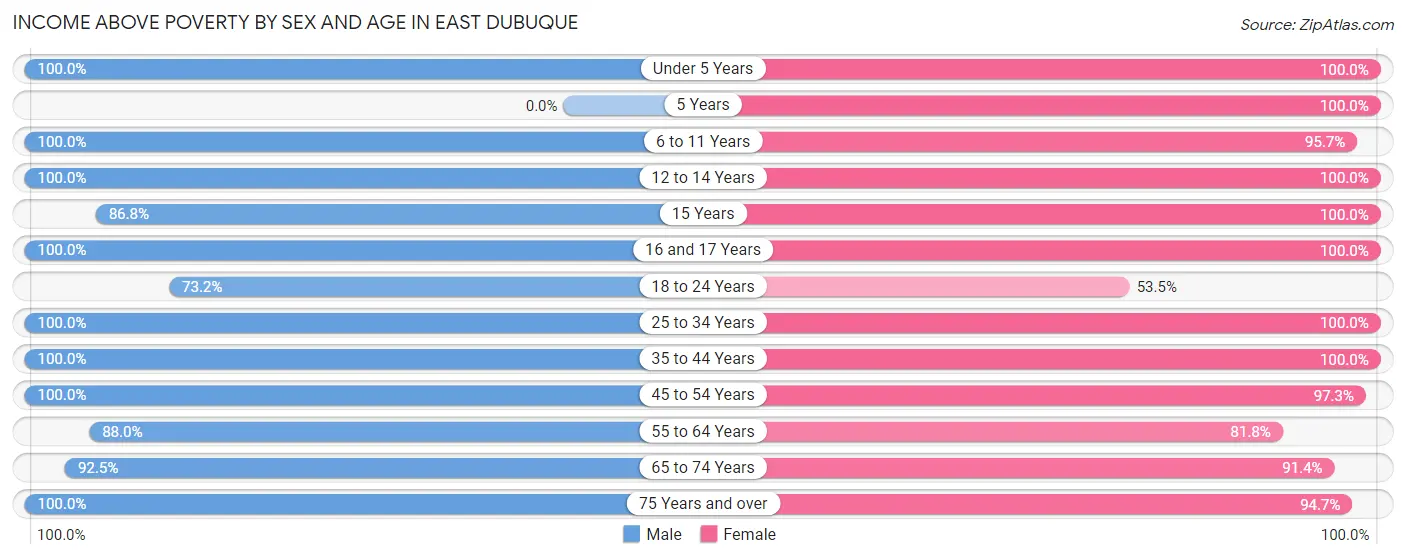
| Age Bracket | Male | Female |
| Under 5 Years | 75 (100.0%) | 50 (100.0%) |
| 5 Years | 0 (0.0%) | 19 (100.0%) |
| 6 to 11 Years | 45 (100.0%) | 44 (95.7%) |
| 12 to 14 Years | 72 (100.0%) | 2 (100.0%) |
| 15 Years | 46 (86.8%) | 3 (100.0%) |
| 16 and 17 Years | 9 (100.0%) | 32 (100.0%) |
| 18 to 24 Years | 60 (73.2%) | 31 (53.4%) |
| 25 to 34 Years | 69 (100.0%) | 120 (100.0%) |
| 35 to 44 Years | 82 (100.0%) | 57 (100.0%) |
| 45 to 54 Years | 114 (100.0%) | 142 (97.3%) |
| 55 to 64 Years | 110 (88.0%) | 54 (81.8%) |
| 65 to 74 Years | 74 (92.5%) | 64 (91.4%) |
| 75 Years and over | 51 (100.0%) | 90 (94.7%) |
| Total | 807 (94.2%) | 708 (92.7%) |
Income Below Poverty Among Married-Couple Families in East Dubuque
The poverty statistics for married-couple families in East Dubuque show that 2.0% or 6 of the total 294 families live below the poverty line. Families with no children have the highest poverty rate of 4.4%, comprising of 6 families. On the other hand, families with 1 or 2 children have the lowest poverty rate of 0.0%, which includes 0 families.
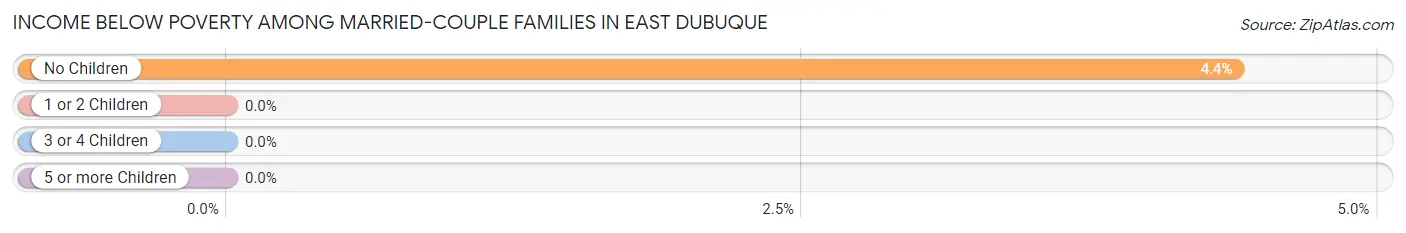
| Children | Above Poverty | Below Poverty |
| No Children | 131 (95.6%) | 6 (4.4%) |
| 1 or 2 Children | 111 (100.0%) | 0 (0.0%) |
| 3 or 4 Children | 46 (100.0%) | 0 (0.0%) |
| 5 or more Children | 0 (0.0%) | 0 (0.0%) |
| Total | 288 (98.0%) | 6 (2.0%) |
Income Below Poverty Among Single-Parent Households in East Dubuque
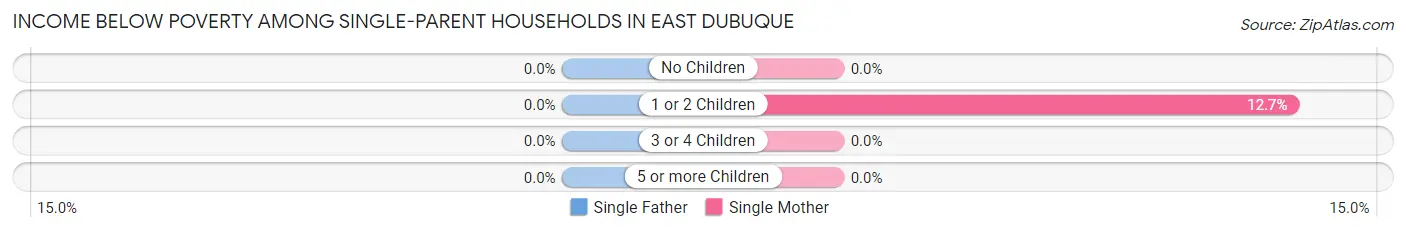
| Children | Single Father | Single Mother |
| No Children | 0 (0.0%) | 0 (0.0%) |
| 1 or 2 Children | 0 (0.0%) | 7 (12.7%) |
| 3 or 4 Children | 0 (0.0%) | 0 (0.0%) |
| 5 or more Children | 0 (0.0%) | 0 (0.0%) |
| Total | 0 (0.0%) | 7 (5.9%) |
Income Below Poverty Among Married-Couple vs Single-Parent Households in East Dubuque
The poverty data for East Dubuque shows that 6 of the married-couple family households (2.0%) and 7 of the single-parent households (4.8%) are living below the poverty level. Within the married-couple family households, those with no children have the highest poverty rate, with 6 households (4.4%) falling below the poverty line. Among the single-parent households, those with 1 or 2 children have the highest poverty rate, with 7 household (10.0%) living below poverty.
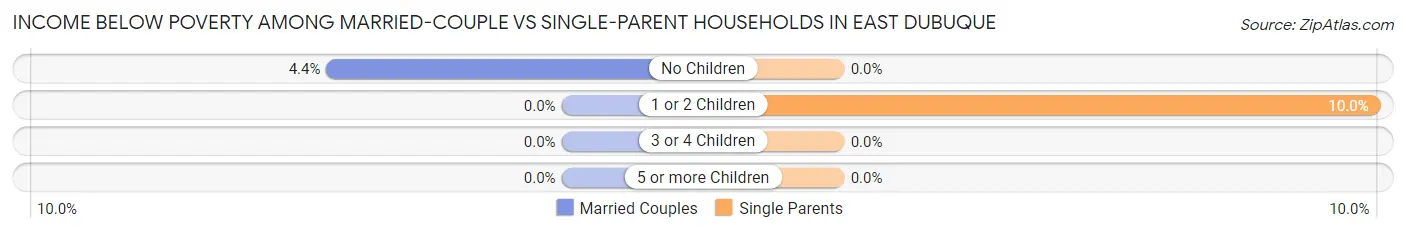
| Children | Married-Couple Families | Single-Parent Households |
| No Children | 6 (4.4%) | 0 (0.0%) |
| 1 or 2 Children | 0 (0.0%) | 7 (10.0%) |
| 3 or 4 Children | 0 (0.0%) | 0 (0.0%) |
| 5 or more Children | 0 (0.0%) | 0 (0.0%) |
| Total | 6 (2.0%) | 7 (4.8%) |
Race in East Dubuque
The most populous races in East Dubuque are White / Caucasian (1,424 | 87.2%), Two or more Races (85 | 5.2%), and Hispanic or Latino (76 | 4.6%).
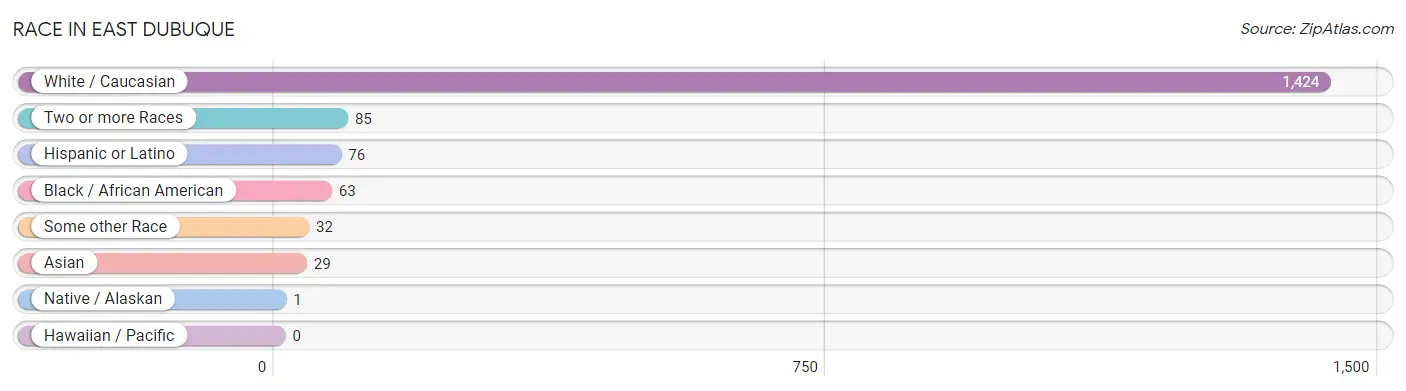
| Race | # Population | % Population |
| Asian | 29 | 1.8% |
| Black / African American | 63 | 3.9% |
| Hawaiian / Pacific | 0 | 0.0% |
| Hispanic or Latino | 76 | 4.6% |
| Native / Alaskan | 1 | 0.1% |
| White / Caucasian | 1,424 | 87.2% |
| Two or more Races | 85 | 5.2% |
| Some other Race | 32 | 2.0% |
| Total | 1,634 | 100.0% |
Ancestry in East Dubuque
The most populous ancestries reported in East Dubuque are German (734 | 44.9%), Irish (295 | 18.0%), English (144 | 8.8%), British (114 | 7.0%), and American (74 | 4.5%), together accounting for 83.3% of all East Dubuque residents.
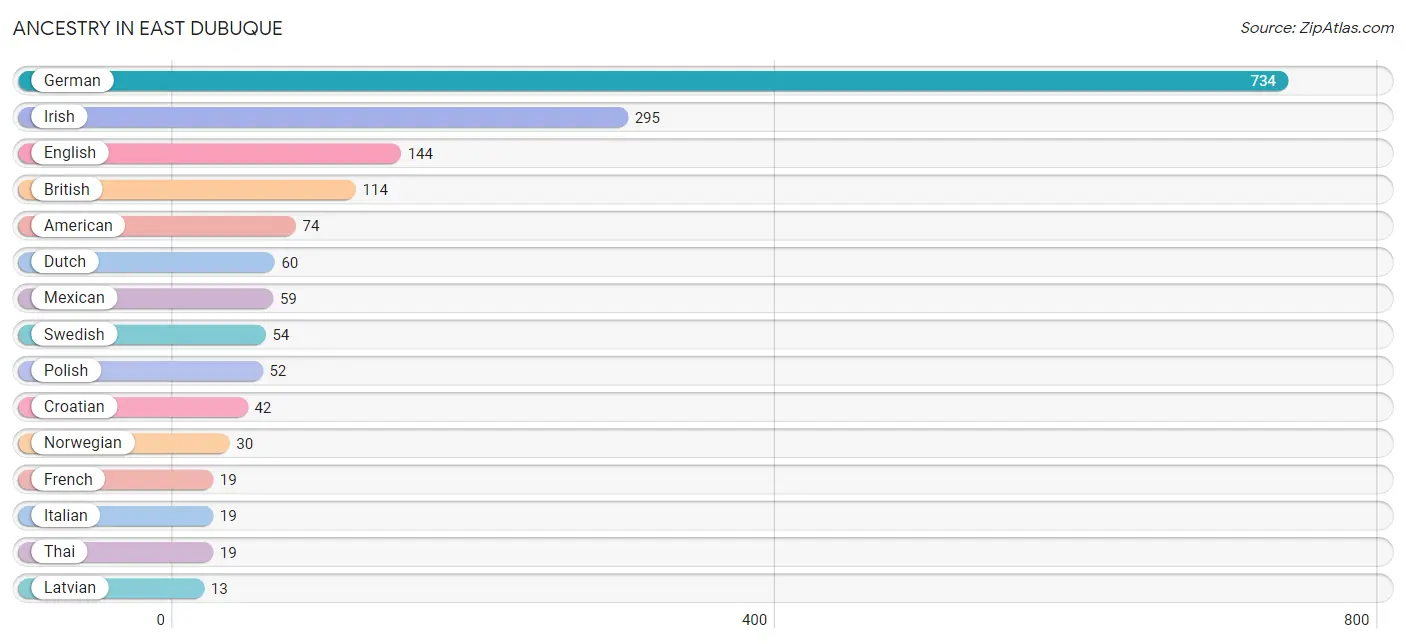
| Ancestry | # Population | % Population |
| American | 74 | 4.5% |
| British | 114 | 7.0% |
| Cherokee | 1 | 0.1% |
| Colombian | 7 | 0.4% |
| Croatian | 42 | 2.6% |
| Czech | 5 | 0.3% |
| Dutch | 60 | 3.7% |
| Eastern European | 8 | 0.5% |
| English | 144 | 8.8% |
| European | 6 | 0.4% |
| French | 19 | 1.2% |
| German | 734 | 44.9% |
| Hungarian | 6 | 0.4% |
| Indian (Asian) | 1 | 0.1% |
| Irish | 295 | 18.0% |
| Italian | 19 | 1.2% |
| Korean | 11 | 0.7% |
| Latvian | 13 | 0.8% |
| Luxembourger | 13 | 0.8% |
| Mexican | 59 | 3.6% |
| Norwegian | 30 | 1.8% |
| Polish | 52 | 3.2% |
| Puerto Rican | 8 | 0.5% |
| Russian | 8 | 0.5% |
| Slovak | 2 | 0.1% |
| South American | 7 | 0.4% |
| Swedish | 54 | 3.3% |
| Swiss | 3 | 0.2% |
| Thai | 19 | 1.2% | View All 29 Rows |
Immigrants in East Dubuque
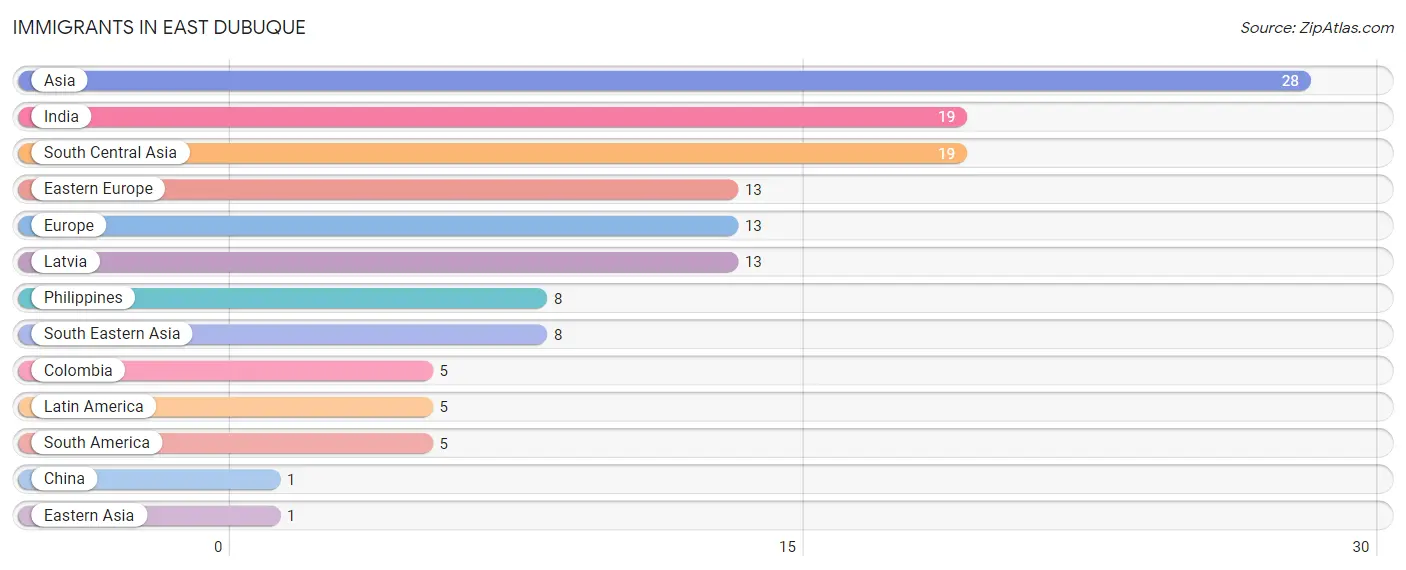
The most numerous immigrant groups reported in East Dubuque came from Asia (28 | 1.7%), India (19 | 1.2%), South Central Asia (19 | 1.2%), Eastern Europe (13 | 0.8%), and Europe (13 | 0.8%), together accounting for 5.6% of all East Dubuque residents.
| Immigration Origin | # Population | % Population |
| Asia | 28 | 1.7% |
| China | 1 | 0.1% |
| Colombia | 5 | 0.3% |
| Eastern Asia | 1 | 0.1% |
| Eastern Europe | 13 | 0.8% |
| Europe | 13 | 0.8% |
| India | 19 | 1.2% |
| Latin America | 5 | 0.3% |
| Latvia | 13 | 0.8% |
| Philippines | 8 | 0.5% |
| South America | 5 | 0.3% |
| South Central Asia | 19 | 1.2% |
| South Eastern Asia | 8 | 0.5% | View All 13 Rows |
Sex and Age in East Dubuque
Sex and Age in East Dubuque
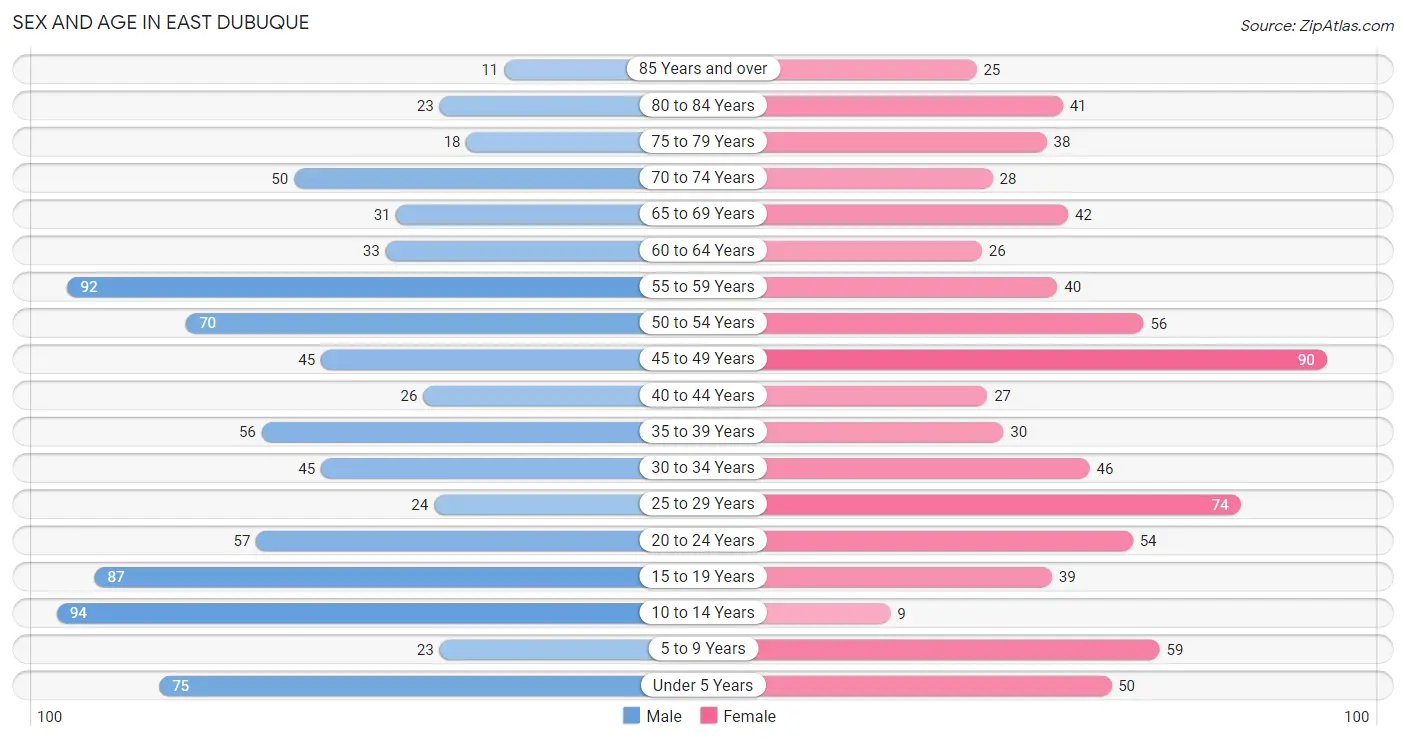
The most populous age groups in East Dubuque are 10 to 14 Years (94 | 10.9%) for men and 45 to 49 Years (90 | 11.6%) for women.
| Age Bracket | Male | Female |
| Under 5 Years | 75 (8.7%) | 50 (6.5%) |
| 5 to 9 Years | 23 (2.7%) | 59 (7.6%) |
| 10 to 14 Years | 94 (10.9%) | 9 (1.2%) |
| 15 to 19 Years | 87 (10.1%) | 39 (5.0%) |
| 20 to 24 Years | 57 (6.6%) | 54 (7.0%) |
| 25 to 29 Years | 24 (2.8%) | 74 (9.6%) |
| 30 to 34 Years | 45 (5.2%) | 46 (5.9%) |
| 35 to 39 Years | 56 (6.5%) | 30 (3.9%) |
| 40 to 44 Years | 26 (3.0%) | 27 (3.5%) |
| 45 to 49 Years | 45 (5.2%) | 90 (11.6%) |
| 50 to 54 Years | 70 (8.1%) | 56 (7.2%) |
| 55 to 59 Years | 92 (10.7%) | 40 (5.2%) |
| 60 to 64 Years | 33 (3.8%) | 26 (3.4%) |
| 65 to 69 Years | 31 (3.6%) | 42 (5.4%) |
| 70 to 74 Years | 50 (5.8%) | 28 (3.6%) |
| 75 to 79 Years | 18 (2.1%) | 38 (4.9%) |
| 80 to 84 Years | 23 (2.7%) | 41 (5.3%) |
| 85 Years and over | 11 (1.3%) | 25 (3.2%) |
| Total | 860 (100.0%) | 774 (100.0%) |
Families and Households in East Dubuque
Median Family Size in East Dubuque
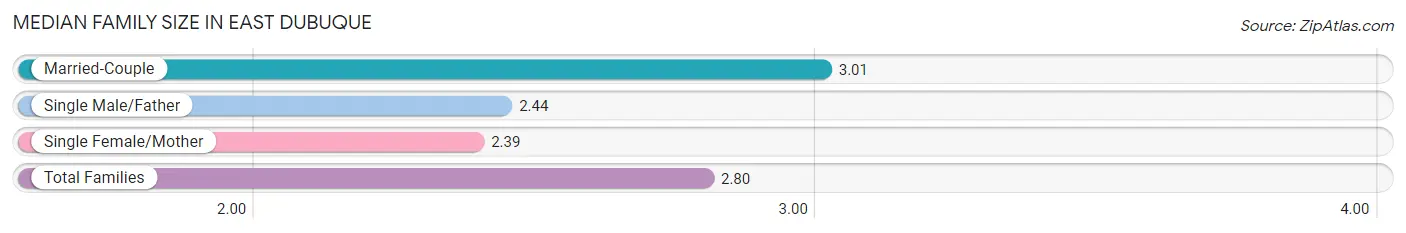
The median family size in East Dubuque is 2.80 persons per family, with married-couple families (294 | 66.8%) accounting for the largest median family size of 3.01 persons per family. On the other hand, single female/mother families (119 | 27.1%) represent the smallest median family size with 2.39 persons per family.
| Family Type | # Families | Family Size |
| Married-Couple | 294 (66.8%) | 3.01 |
| Single Male/Father | 27 (6.1%) | 2.44 |
| Single Female/Mother | 119 (27.1%) | 2.39 |
| Total Families | 440 (100.0%) | 2.80 |
Median Household Size in East Dubuque
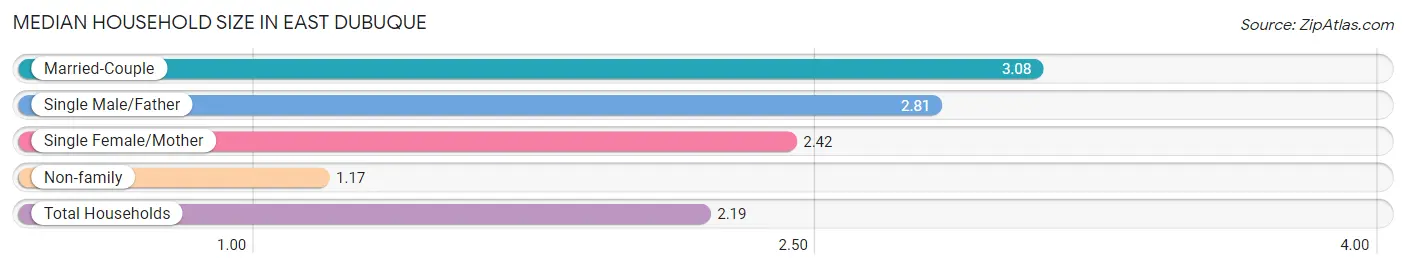
The median household size in East Dubuque is 2.19 persons per household, with married-couple households (294 | 39.8%) accounting for the largest median household size of 3.08 persons per household. non-family households (299 | 40.5%) represent the smallest median household size with 1.17 persons per household.
| Household Type | # Households | Household Size |
| Married-Couple | 294 (39.8%) | 3.08 |
| Single Male/Father | 27 (3.6%) | 2.81 |
| Single Female/Mother | 119 (16.1%) | 2.42 |
| Non-family | 299 (40.5%) | 1.17 |
| Total Households | 739 (100.0%) | 2.19 |
Household Size by Marriage Status in East Dubuque
Out of a total of 739 households in East Dubuque, 440 (59.5%) are family households, while 299 (40.5%) are nonfamily households. The most numerous type of family households are 2-person households, comprising 197, and the most common type of nonfamily households are 1-person households, comprising 253.
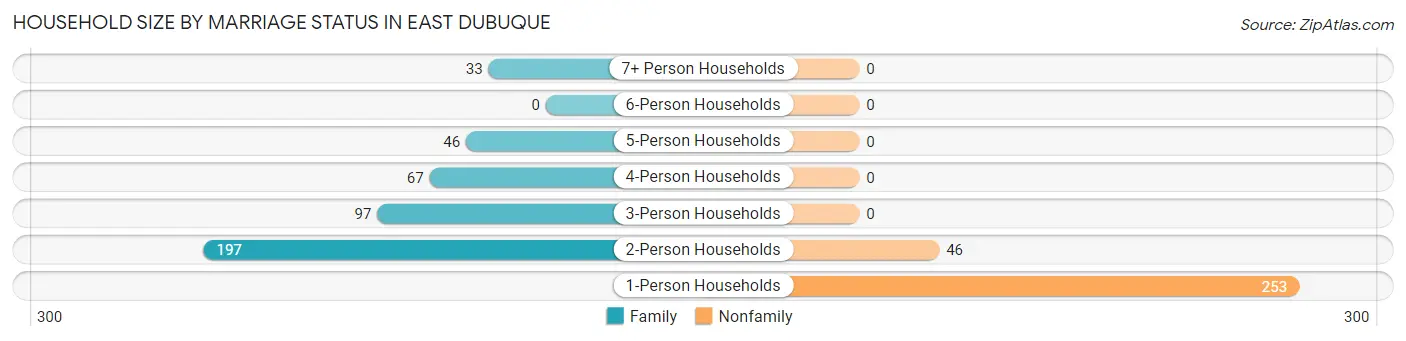
| Household Size | Family Households | Nonfamily Households |
| 1-Person Households | - | 253 (34.2%) |
| 2-Person Households | 197 (26.7%) | 46 (6.2%) |
| 3-Person Households | 97 (13.1%) | 0 (0.0%) |
| 4-Person Households | 67 (9.1%) | 0 (0.0%) |
| 5-Person Households | 46 (6.2%) | 0 (0.0%) |
| 6-Person Households | 0 (0.0%) | 0 (0.0%) |
| 7+ Person Households | 33 (4.5%) | 0 (0.0%) |
| Total | 440 (59.5%) | 299 (40.5%) |
Female Fertility in East Dubuque
Fertility by Age in East Dubuque
Average fertility rate in East Dubuque is 65.0 births per 1,000 women. Women in the age bracket of 20 to 34 years have the highest fertility rate with 121.0 births per 1,000 women. Women in the age bracket of 20 to 34 years acount for 87.5% of all women with births.
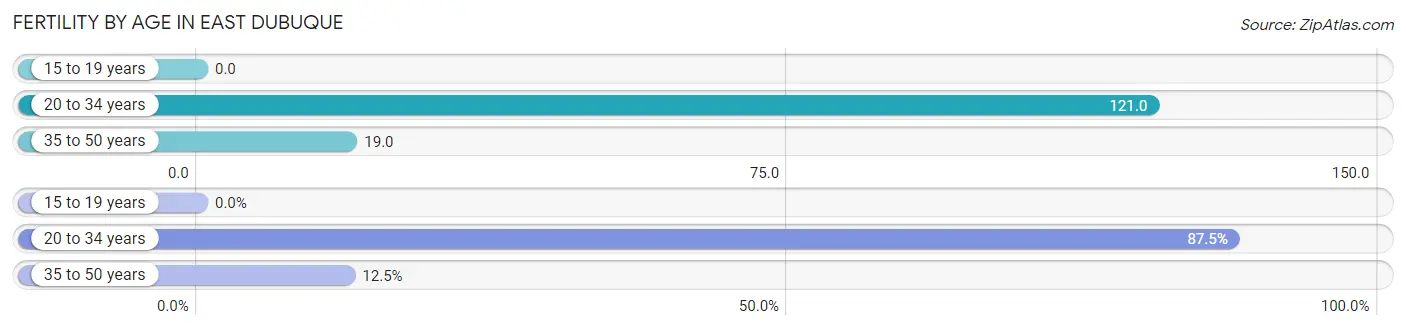
| Age Bracket | Women with Births | Births / 1,000 Women |
| 15 to 19 years | 0 (0.0%) | 0.0 |
| 20 to 34 years | 21 (87.5%) | 121.0 |
| 35 to 50 years | 3 (12.5%) | 19.0 |
| Total | 24 (100.0%) | 65.0 |
Fertility by Age by Marriage Status in East Dubuque
12.5% of women with births (24) in East Dubuque are married. The highest percentage of unmarried women with births falls into 20 to 34 years age bracket with 100.0% of them unmarried at the time of birth, while the lowest percentage of unmarried women with births belong to 35 to 50 years age bracket with 0.0% of them unmarried.
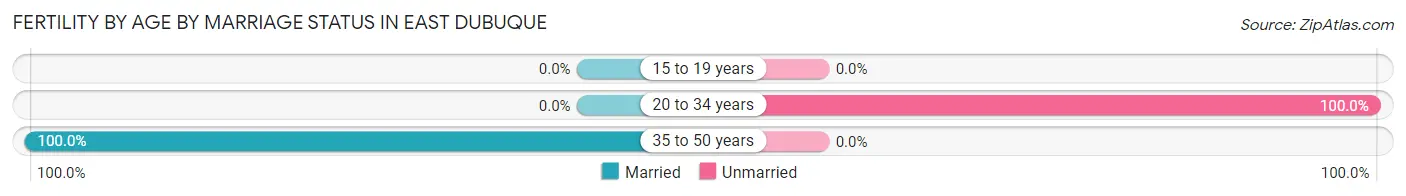
| Age Bracket | Married | Unmarried |
| 15 to 19 years | 0 (0.0%) | 0 (0.0%) |
| 20 to 34 years | 0 (0.0%) | 21 (100.0%) |
| 35 to 50 years | 3 (100.0%) | 0 (0.0%) |
| Total | 3 (12.5%) | 21 (87.5%) |
Fertility by Education in East Dubuque
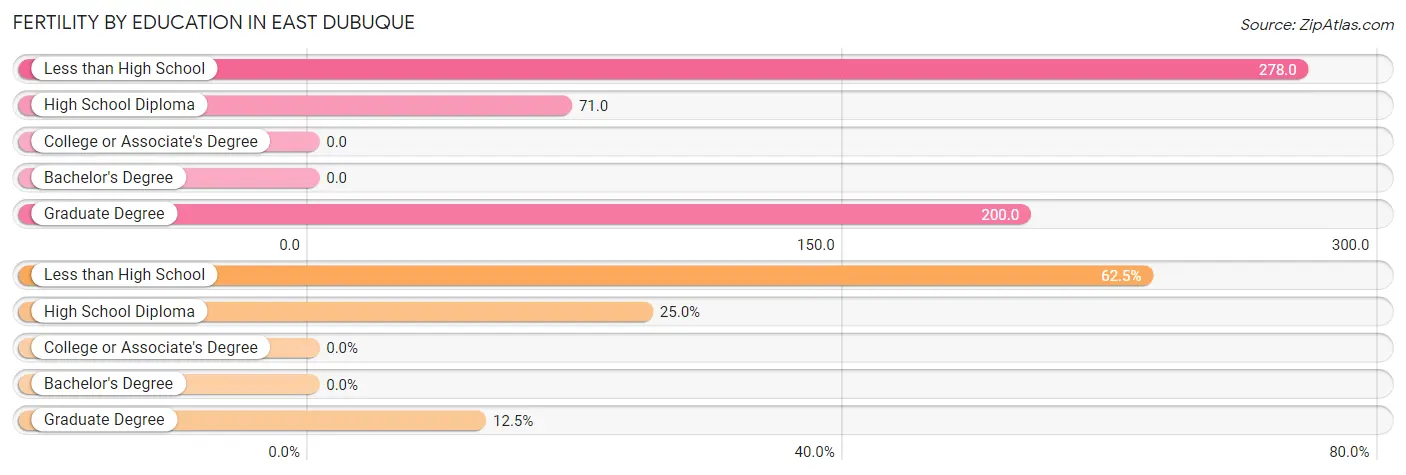
| Educational Attainment | Women with Births | Births / 1,000 Women |
| Less than High School | 15 (62.5%) | 278.0 |
| High School Diploma | 6 (25.0%) | 71.0 |
| College or Associate's Degree | 0 (0.0%) | 0.0 |
| Bachelor's Degree | 0 (0.0%) | 0.0 |
| Graduate Degree | 3 (12.5%) | 200.0 |
| Total | 24 (100.0%) | 65.0 |
Fertility by Education by Marriage Status in East Dubuque
87.5% of women with births in East Dubuque are unmarried. Women with the educational attainment of graduate degree are most likely to be married with 100.0% of them married at childbirth, while women with the educational attainment of less than high school are least likely to be married with 100.0% of them unmarried at childbirth.
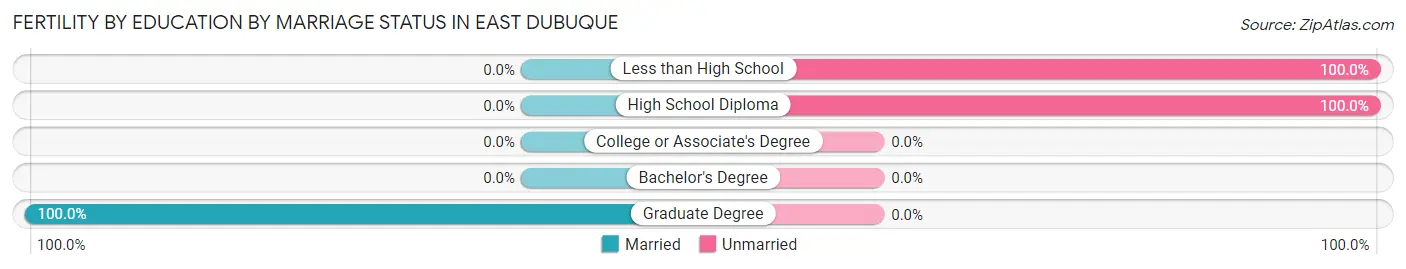
| Educational Attainment | Married | Unmarried |
| Less than High School | 0 (0.0%) | 15 (100.0%) |
| High School Diploma | 0 (0.0%) | 6 (100.0%) |
| College or Associate's Degree | 0 (0.0%) | 0 (0.0%) |
| Bachelor's Degree | 0 (0.0%) | 0 (0.0%) |
| Graduate Degree | 3 (100.0%) | 0 (0.0%) |
| Total | 3 (12.5%) | 21 (87.5%) |
Employment Characteristics in East Dubuque
Employment by Class of Employer in East Dubuque
Among the 892 employed individuals in East Dubuque, private company employees (594 | 66.6%), not-for-profit organizations (115 | 12.9%), and local government employees (98 | 11.0%) make up the most common classes of employment.
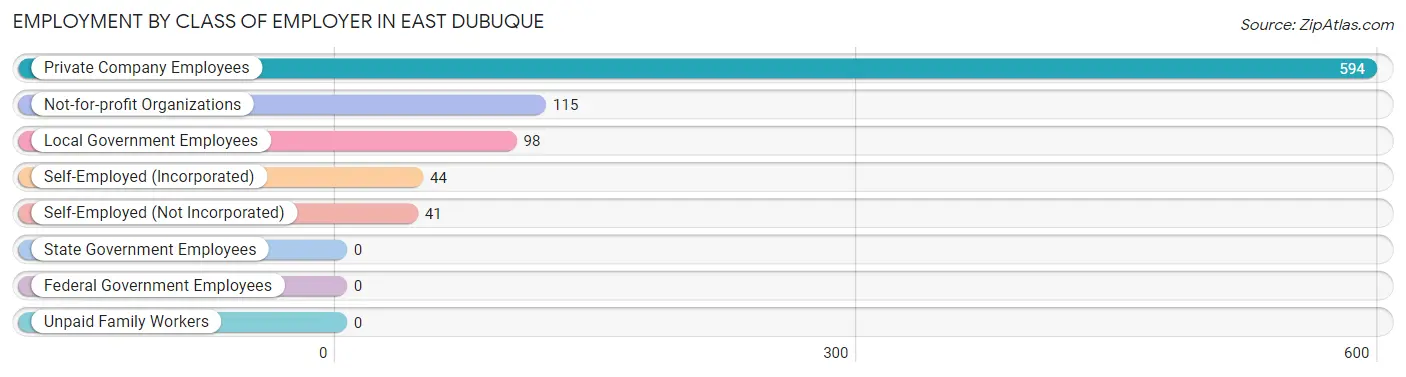
| Employer Class | # Employees | % Employees |
| Private Company Employees | 594 | 66.6% |
| Self-Employed (Incorporated) | 44 | 4.9% |
| Self-Employed (Not Incorporated) | 41 | 4.6% |
| Not-for-profit Organizations | 115 | 12.9% |
| Local Government Employees | 98 | 11.0% |
| State Government Employees | 0 | 0.0% |
| Federal Government Employees | 0 | 0.0% |
| Unpaid Family Workers | 0 | 0.0% |
| Total | 892 | 100.0% |
Employment Status by Age in East Dubuque
According to the labor force statistics for East Dubuque, out of the total population over 16 years of age (1,268), 73.7% or 935 individuals are in the labor force, with 4.2% or 39 of them unemployed. The age group with the highest labor force participation rate is 25 to 29 years, with 100.0% or 98 individuals in the labor force. Within the labor force, the 20 to 24 years age range has the highest percentage of unemployed individuals, with 15.0% or 15 of them being unemployed.
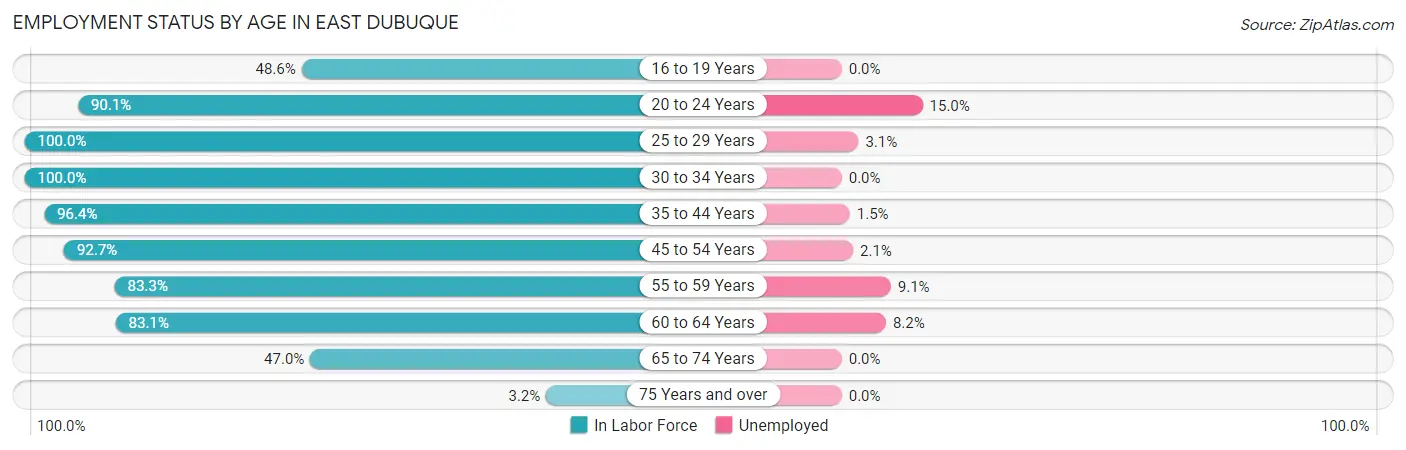
| Age Bracket | In Labor Force | Unemployed |
| 16 to 19 Years | 34 (48.6%) | 0 (0.0%) |
| 20 to 24 Years | 100 (90.1%) | 15 (15.0%) |
| 25 to 29 Years | 98 (100.0%) | 3 (3.1%) |
| 30 to 34 Years | 91 (100.0%) | 0 (0.0%) |
| 35 to 44 Years | 134 (96.4%) | 2 (1.5%) |
| 45 to 54 Years | 242 (92.7%) | 5 (2.1%) |
| 55 to 59 Years | 110 (83.3%) | 10 (9.1%) |
| 60 to 64 Years | 49 (83.1%) | 4 (8.2%) |
| 65 to 74 Years | 71 (47.0%) | 0 (0.0%) |
| 75 Years and over | 5 (3.2%) | 0 (0.0%) |
| Total | 935 (73.7%) | 39 (4.2%) |
Employment Status by Educational Attainment in East Dubuque
According to labor force statistics for East Dubuque, 92.8% of individuals (724) out of the total population between 25 and 64 years of age (780) are in the labor force, with 3.3% or 24 of them being unemployed. The group with the highest labor force participation rate are those with the educational attainment of bachelor's degree or higher, with 99.5% or 221 individuals in the labor force. Within the labor force, individuals with less than high school education have the highest percentage of unemployment, with 20.8% or 5 of them being unemployed.
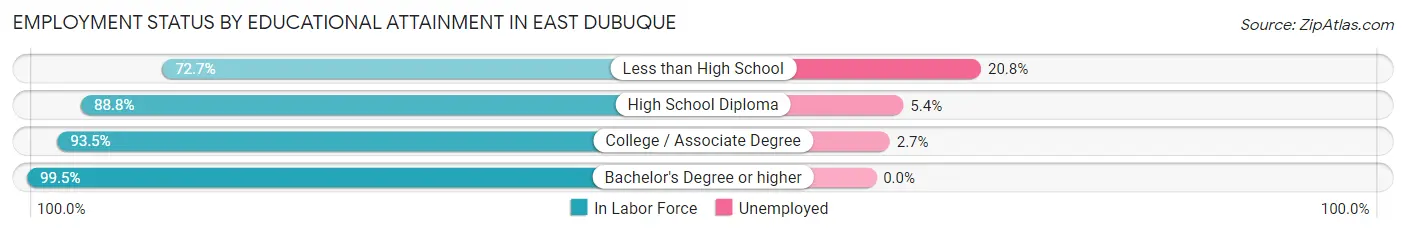
| Educational Attainment | In Labor Force | Unemployed |
| Less than High School | 24 (72.7%) | 7 (20.8%) |
| High School Diploma | 222 (88.8%) | 14 (5.4%) |
| College / Associate Degree | 257 (93.5%) | 7 (2.7%) |
| Bachelor's Degree or higher | 221 (99.5%) | 0 (0.0%) |
| Total | 724 (92.8%) | 26 (3.3%) |
Employment Occupations by Sex in East Dubuque
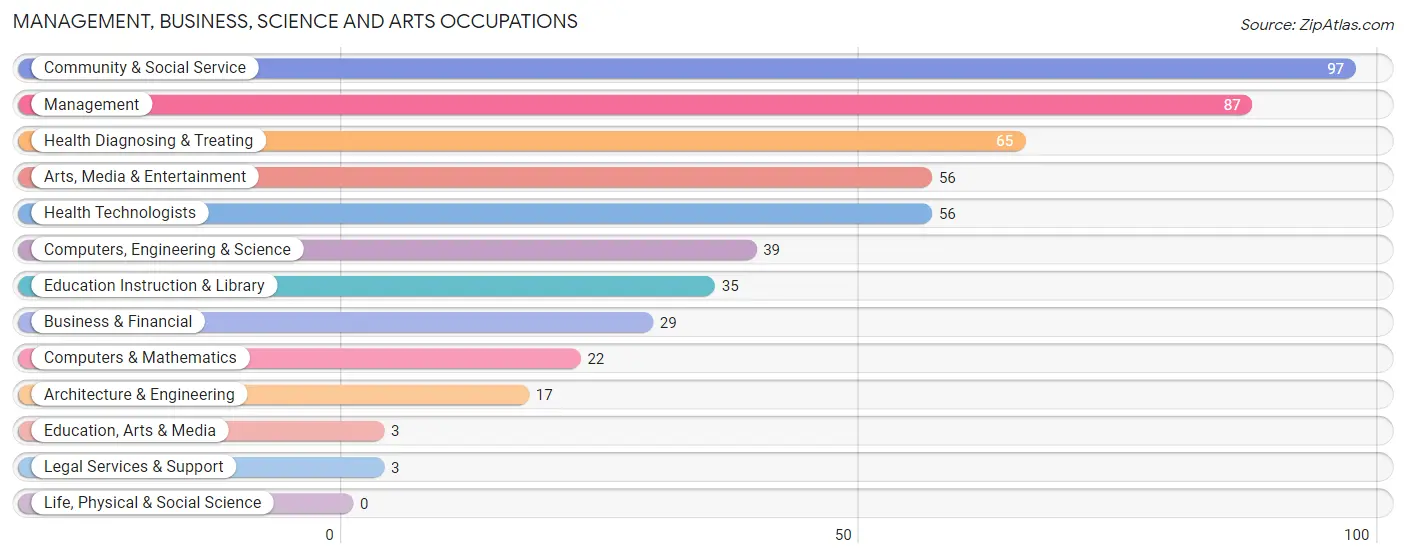
Management, Business, Science and Arts Occupations
The most common Management, Business, Science and Arts occupations in East Dubuque are Community & Social Service (97 | 10.8%), Management (87 | 9.7%), Health Diagnosing & Treating (65 | 7.3%), Arts, Media & Entertainment (56 | 6.3%), and Health Technologists (56 | 6.3%).
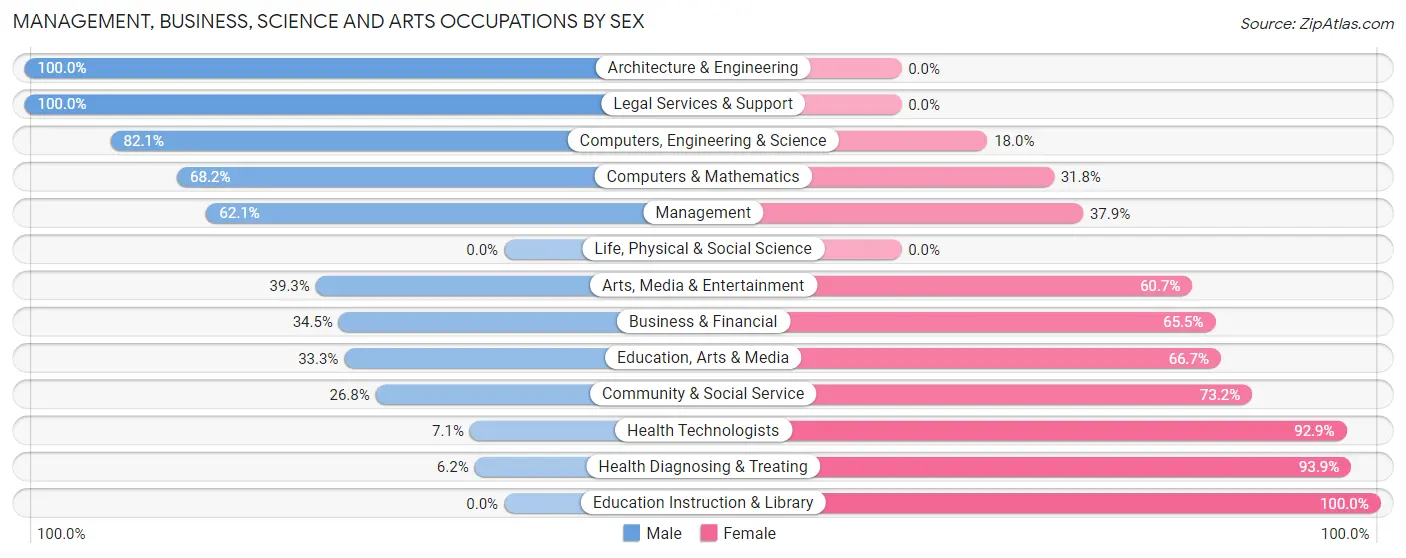
Management, Business, Science and Arts Occupations by Sex
Within the Management, Business, Science and Arts occupations in East Dubuque, the most male-oriented occupations are Architecture & Engineering (100.0%), Legal Services & Support (100.0%), and Computers, Engineering & Science (82.1%), while the most female-oriented occupations are Education Instruction & Library (100.0%), Health Diagnosing & Treating (93.9%), and Health Technologists (92.9%).
| Occupation | Male | Female |
| Management | 54 (62.1%) | 33 (37.9%) |
| Business & Financial | 10 (34.5%) | 19 (65.5%) |
| Computers, Engineering & Science | 32 (82.1%) | 7 (17.9%) |
| Computers & Mathematics | 15 (68.2%) | 7 (31.8%) |
| Architecture & Engineering | 17 (100.0%) | 0 (0.0%) |
| Life, Physical & Social Science | 0 (0.0%) | 0 (0.0%) |
| Community & Social Service | 26 (26.8%) | 71 (73.2%) |
| Education, Arts & Media | 1 (33.3%) | 2 (66.7%) |
| Legal Services & Support | 3 (100.0%) | 0 (0.0%) |
| Education Instruction & Library | 0 (0.0%) | 35 (100.0%) |
| Arts, Media & Entertainment | 22 (39.3%) | 34 (60.7%) |
| Health Diagnosing & Treating | 4 (6.1%) | 61 (93.9%) |
| Health Technologists | 4 (7.1%) | 52 (92.9%) |
| Total (Category) | 126 (39.8%) | 191 (60.3%) |
| Total (Overall) | 452 (50.5%) | 443 (49.5%) |
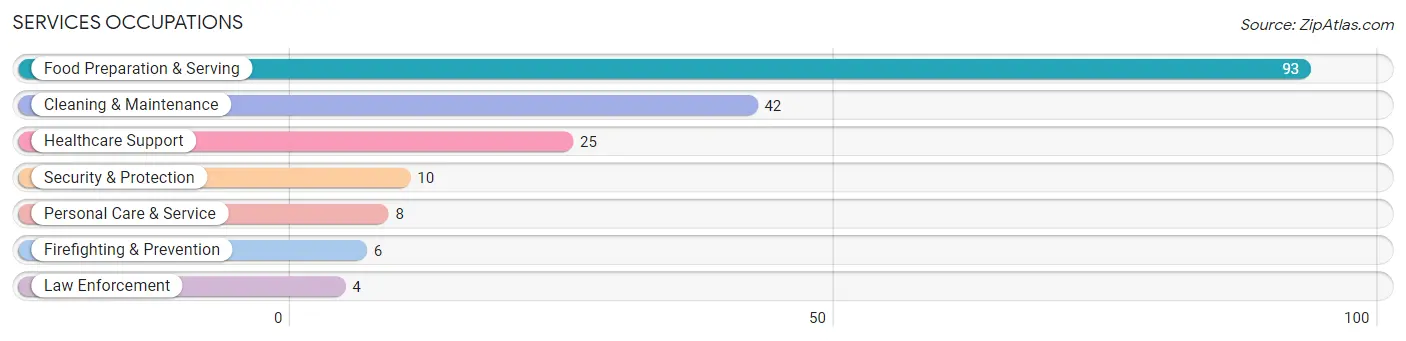
Services Occupations
The most common Services occupations in East Dubuque are Food Preparation & Serving (93 | 10.4%), Cleaning & Maintenance (42 | 4.7%), Healthcare Support (25 | 2.8%), Security & Protection (10 | 1.1%), and Personal Care & Service (8 | 0.9%).
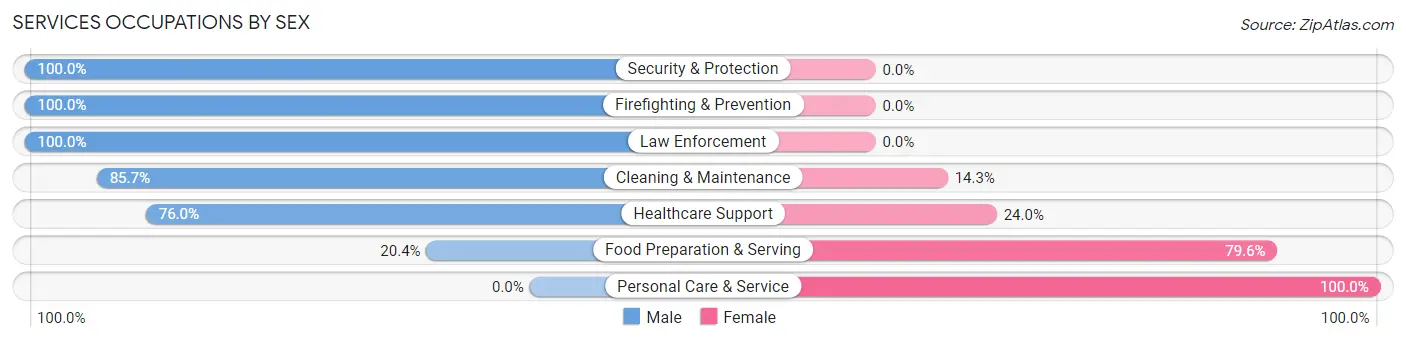
Services Occupations by Sex
Within the Services occupations in East Dubuque, the most male-oriented occupations are Security & Protection (100.0%), Firefighting & Prevention (100.0%), and Law Enforcement (100.0%), while the most female-oriented occupations are Personal Care & Service (100.0%), Food Preparation & Serving (79.6%), and Healthcare Support (24.0%).
| Occupation | Male | Female |
| Healthcare Support | 19 (76.0%) | 6 (24.0%) |
| Security & Protection | 10 (100.0%) | 0 (0.0%) |
| Firefighting & Prevention | 6 (100.0%) | 0 (0.0%) |
| Law Enforcement | 4 (100.0%) | 0 (0.0%) |
| Food Preparation & Serving | 19 (20.4%) | 74 (79.6%) |
| Cleaning & Maintenance | 36 (85.7%) | 6 (14.3%) |
| Personal Care & Service | 0 (0.0%) | 8 (100.0%) |
| Total (Category) | 84 (47.2%) | 94 (52.8%) |
| Total (Overall) | 452 (50.5%) | 443 (49.5%) |
Sales and Office Occupations
The most common Sales and Office occupations in East Dubuque are Sales & Related (107 | 12.0%), and Office & Administration (105 | 11.7%).

Sales and Office Occupations by Sex

| Occupation | Male | Female |
| Sales & Related | 61 (57.0%) | 46 (43.0%) |
| Office & Administration | 17 (16.2%) | 88 (83.8%) |
| Total (Category) | 78 (36.8%) | 134 (63.2%) |
| Total (Overall) | 452 (50.5%) | 443 (49.5%) |
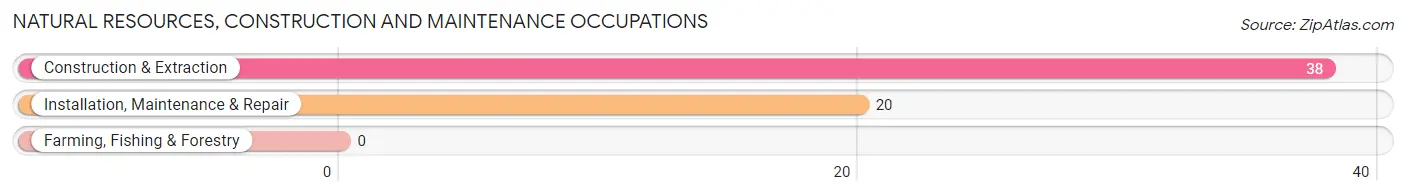
Natural Resources, Construction and Maintenance Occupations
The most common Natural Resources, Construction and Maintenance occupations in East Dubuque are Construction & Extraction (38 | 4.3%), and Installation, Maintenance & Repair (20 | 2.2%).
Natural Resources, Construction and Maintenance Occupations by Sex
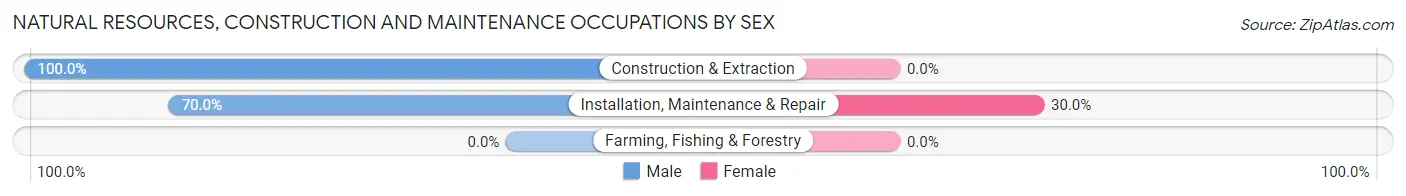
| Occupation | Male | Female |
| Farming, Fishing & Forestry | 0 (0.0%) | 0 (0.0%) |
| Construction & Extraction | 38 (100.0%) | 0 (0.0%) |
| Installation, Maintenance & Repair | 14 (70.0%) | 6 (30.0%) |
| Total (Category) | 52 (89.7%) | 6 (10.3%) |
| Total (Overall) | 452 (50.5%) | 443 (49.5%) |
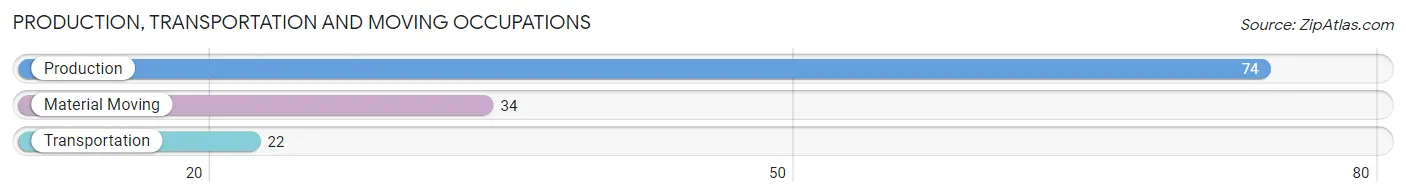
Production, Transportation and Moving Occupations
The most common Production, Transportation and Moving occupations in East Dubuque are Production (74 | 8.3%), Material Moving (34 | 3.8%), and Transportation (22 | 2.5%).
Production, Transportation and Moving Occupations by Sex
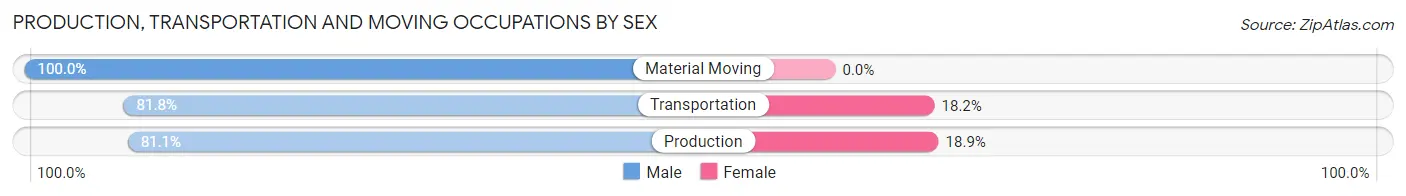
| Occupation | Male | Female |
| Production | 60 (81.1%) | 14 (18.9%) |
| Transportation | 18 (81.8%) | 4 (18.2%) |
| Material Moving | 34 (100.0%) | 0 (0.0%) |
| Total (Category) | 112 (86.2%) | 18 (13.9%) |
| Total (Overall) | 452 (50.5%) | 443 (49.5%) |
Employment Industries by Sex in East Dubuque
Employment Industries in East Dubuque
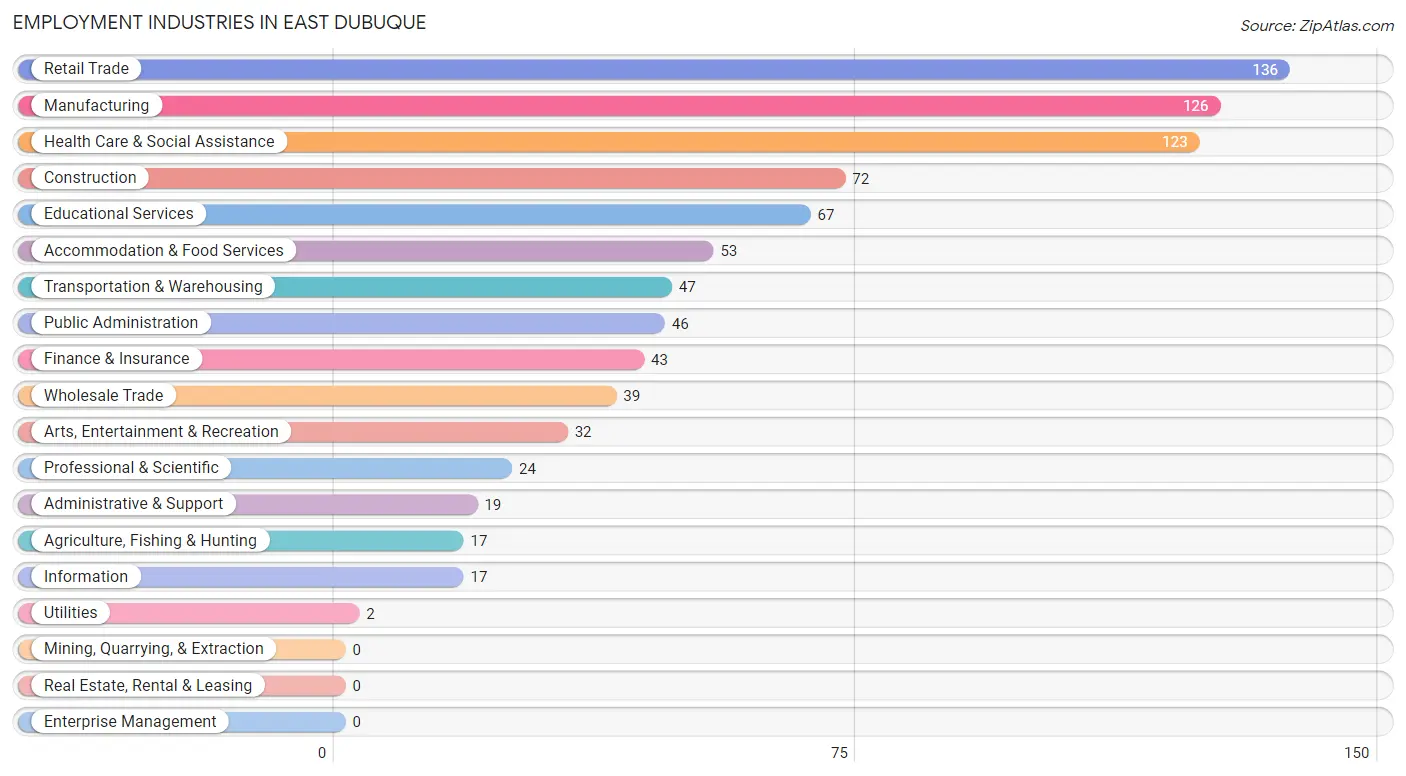
The major employment industries in East Dubuque include Retail Trade (136 | 15.2%), Manufacturing (126 | 14.1%), Health Care & Social Assistance (123 | 13.7%), Construction (72 | 8.0%), and Educational Services (67 | 7.5%).
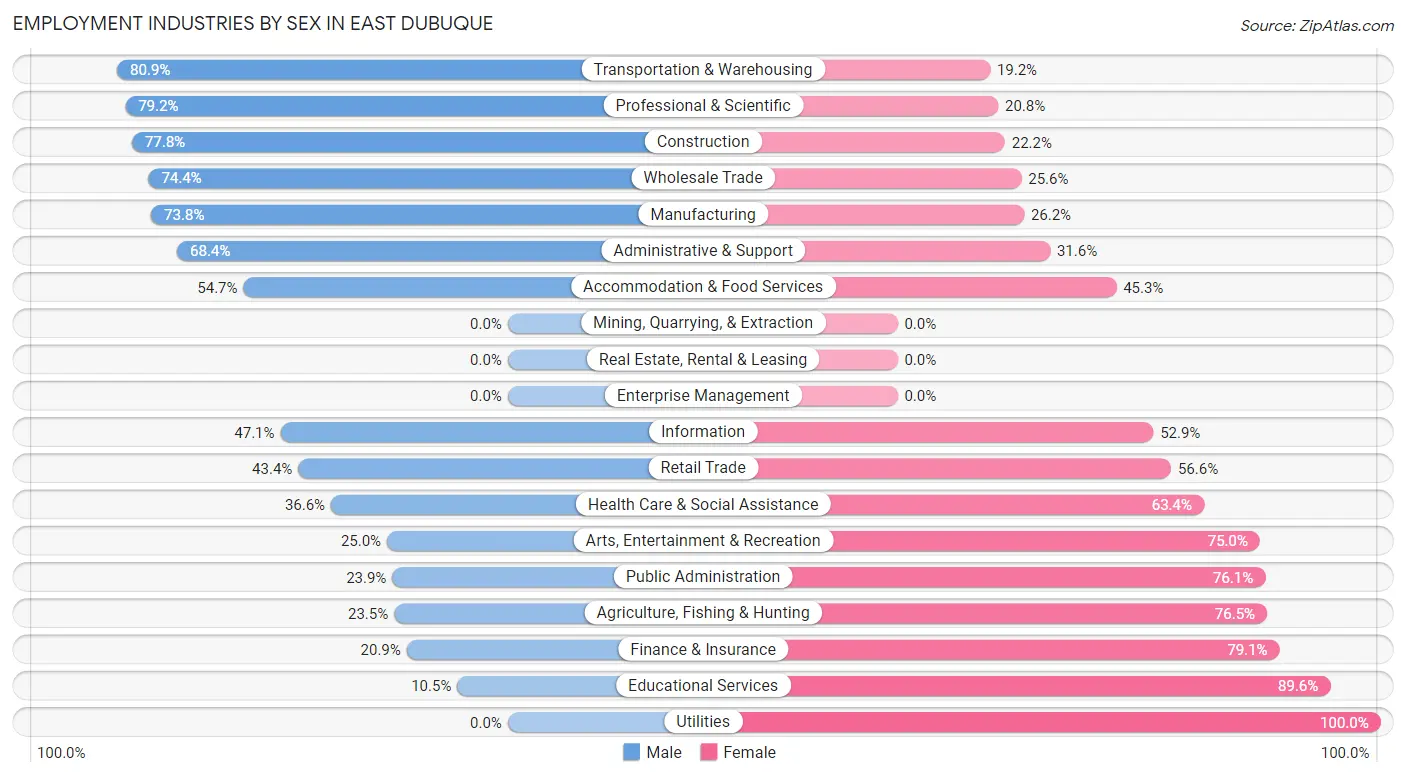
Employment Industries by Sex in East Dubuque
The East Dubuque industries that see more men than women are Transportation & Warehousing (80.8%), Professional & Scientific (79.2%), and Construction (77.8%), whereas the industries that tend to have a higher number of women are Utilities (100.0%), Educational Services (89.5%), and Finance & Insurance (79.1%).
| Industry | Male | Female |
| Agriculture, Fishing & Hunting | 4 (23.5%) | 13 (76.5%) |
| Mining, Quarrying, & Extraction | 0 (0.0%) | 0 (0.0%) |
| Construction | 56 (77.8%) | 16 (22.2%) |
| Manufacturing | 93 (73.8%) | 33 (26.2%) |
| Wholesale Trade | 29 (74.4%) | 10 (25.6%) |
| Retail Trade | 59 (43.4%) | 77 (56.6%) |
| Transportation & Warehousing | 38 (80.8%) | 9 (19.2%) |
| Utilities | 0 (0.0%) | 2 (100.0%) |
| Information | 8 (47.1%) | 9 (52.9%) |
| Finance & Insurance | 9 (20.9%) | 34 (79.1%) |
| Real Estate, Rental & Leasing | 0 (0.0%) | 0 (0.0%) |
| Professional & Scientific | 19 (79.2%) | 5 (20.8%) |
| Enterprise Management | 0 (0.0%) | 0 (0.0%) |
| Administrative & Support | 13 (68.4%) | 6 (31.6%) |
| Educational Services | 7 (10.4%) | 60 (89.5%) |
| Health Care & Social Assistance | 45 (36.6%) | 78 (63.4%) |
| Arts, Entertainment & Recreation | 8 (25.0%) | 24 (75.0%) |
| Accommodation & Food Services | 29 (54.7%) | 24 (45.3%) |
| Public Administration | 11 (23.9%) | 35 (76.1%) |
| Total | 452 (50.5%) | 443 (49.5%) |
Education in East Dubuque
School Enrollment in East Dubuque
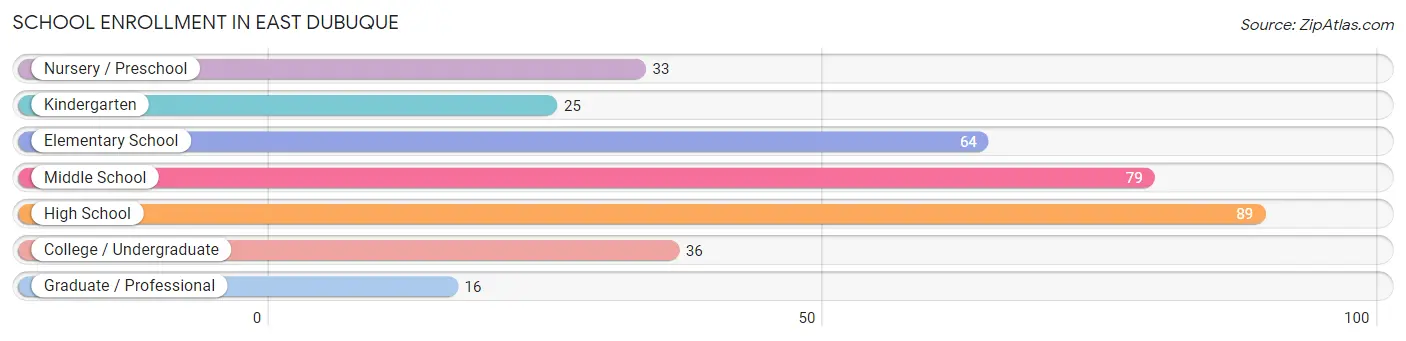
The most common levels of schooling among the 342 students in East Dubuque are high school (89 | 26.0%), middle school (79 | 23.1%), and elementary school (64 | 18.7%).
| School Level | # Students | % Students |
| Nursery / Preschool | 33 | 9.7% |
| Kindergarten | 25 | 7.3% |
| Elementary School | 64 | 18.7% |
| Middle School | 79 | 23.1% |
| High School | 89 | 26.0% |
| College / Undergraduate | 36 | 10.5% |
| Graduate / Professional | 16 | 4.7% |
| Total | 342 | 100.0% |
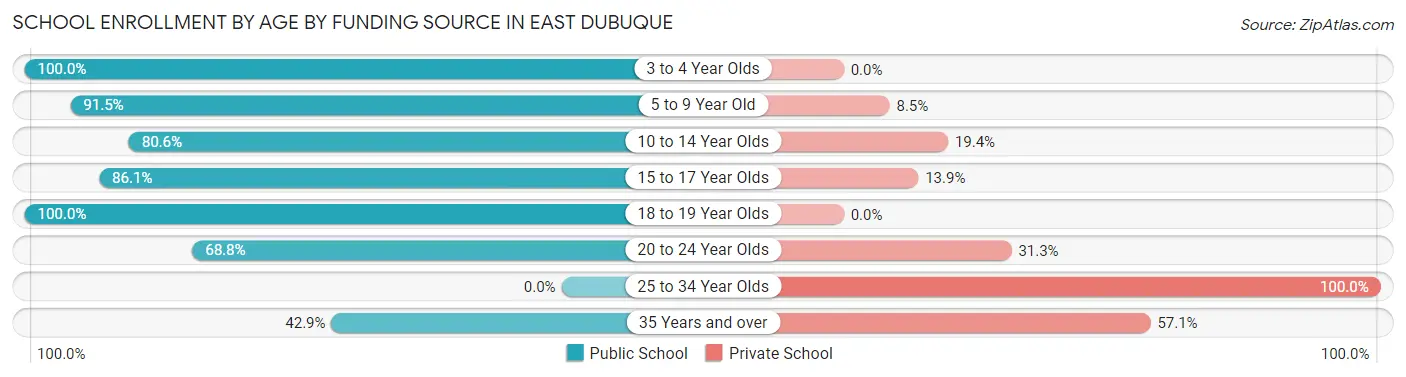
School Enrollment by Age by Funding Source in East Dubuque
Out of a total of 342 students who are enrolled in schools in East Dubuque, 58 (17.0%) attend a private institution, while the remaining 284 (83.0%) are enrolled in public schools. The age group of 25 to 34 year olds has the highest likelihood of being enrolled in private schools, with 8 (100.0% in the age bracket) enrolled. Conversely, the age group of 3 to 4 year olds has the lowest likelihood of being enrolled in a private school, with 28 (100.0% in the age bracket) attending a public institution.
| Age Bracket | Public School | Private School |
| 3 to 4 Year Olds | 28 (100.0%) | 0 (0.0%) |
| 5 to 9 Year Old | 75 (91.5%) | 7 (8.5%) |
| 10 to 14 Year Olds | 83 (80.6%) | 20 (19.4%) |
| 15 to 17 Year Olds | 62 (86.1%) | 10 (13.9%) |
| 18 to 19 Year Olds | 19 (100.0%) | 0 (0.0%) |
| 20 to 24 Year Olds | 11 (68.8%) | 5 (31.2%) |
| 25 to 34 Year Olds | 0 (0.0%) | 8 (100.0%) |
| 35 Years and over | 6 (42.9%) | 8 (57.1%) |
| Total | 284 (83.0%) | 58 (17.0%) |
Educational Attainment by Field of Study in East Dubuque
Business (84 | 29.5%), visual & performing arts (33 | 11.6%), science & technology (24 | 8.4%), education (23 | 8.1%), and engineering (22 | 7.7%) are the most common fields of study among 285 individuals in East Dubuque who have obtained a bachelor's degree or higher.
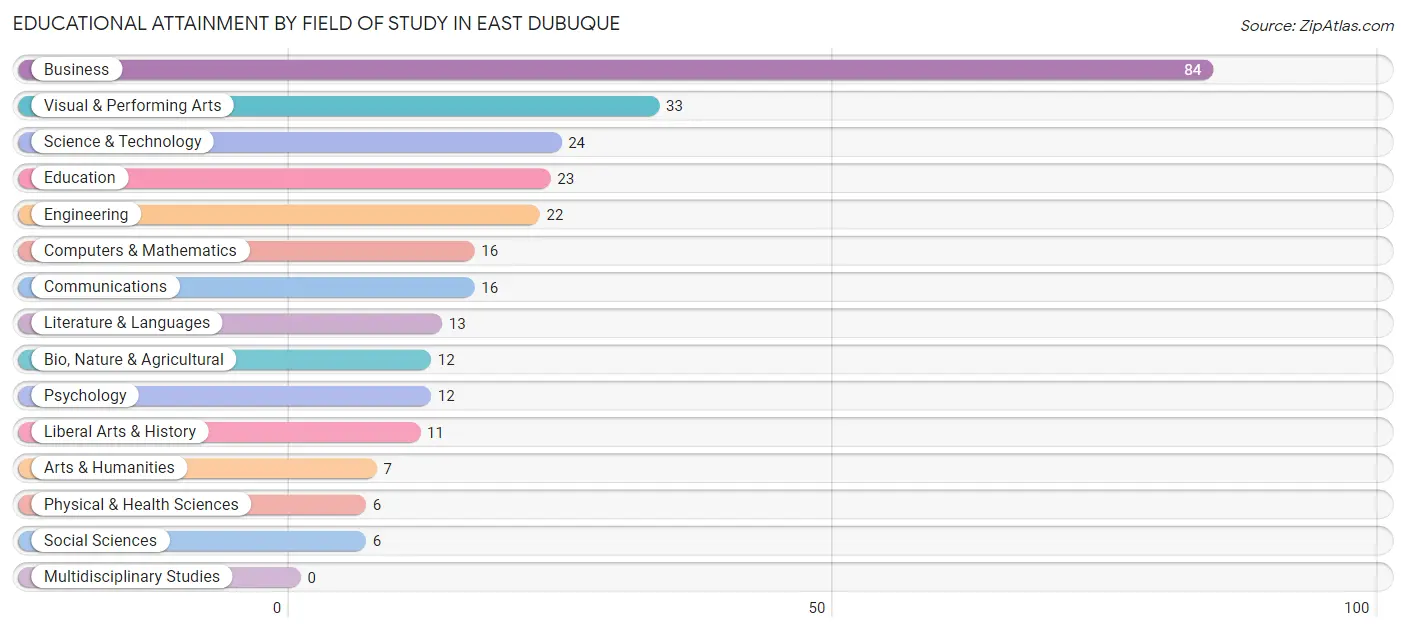
| Field of Study | # Graduates | % Graduates |
| Computers & Mathematics | 16 | 5.6% |
| Bio, Nature & Agricultural | 12 | 4.2% |
| Physical & Health Sciences | 6 | 2.1% |
| Psychology | 12 | 4.2% |
| Social Sciences | 6 | 2.1% |
| Engineering | 22 | 7.7% |
| Multidisciplinary Studies | 0 | 0.0% |
| Science & Technology | 24 | 8.4% |
| Business | 84 | 29.5% |
| Education | 23 | 8.1% |
| Literature & Languages | 13 | 4.6% |
| Liberal Arts & History | 11 | 3.9% |
| Visual & Performing Arts | 33 | 11.6% |
| Communications | 16 | 5.6% |
| Arts & Humanities | 7 | 2.5% |
| Total | 285 | 100.0% |
Transportation & Commute in East Dubuque
Vehicle Availability by Sex in East Dubuque
The most prevalent vehicle ownership categories in East Dubuque are males with 2 vehicles (230, accounting for 51.2%) and females with 2 vehicles (220, making up 52.0%).
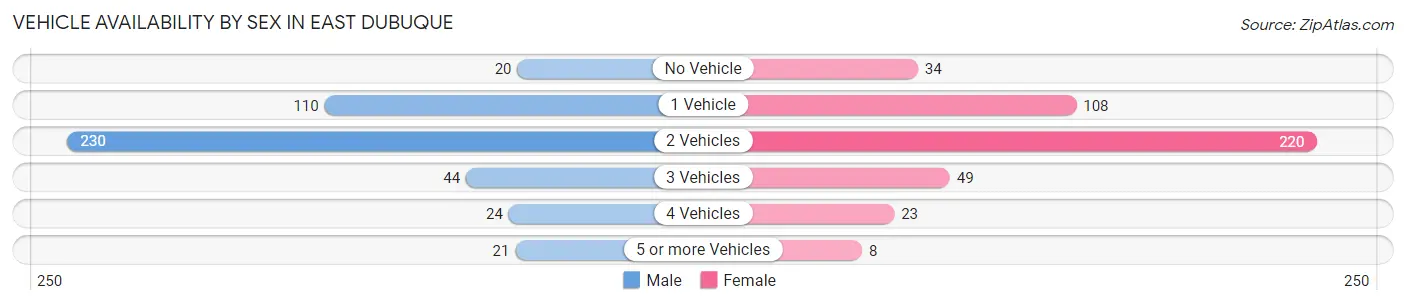
| Vehicles Available | Male | Female |
| No Vehicle | 20 (4.4%) | 34 (7.7%) |
| 1 Vehicle | 110 (24.5%) | 108 (24.4%) |
| 2 Vehicles | 230 (51.2%) | 220 (49.8%) |
| 3 Vehicles | 44 (9.8%) | 49 (11.1%) |
| 4 Vehicles | 24 (5.3%) | 23 (5.2%) |
| 5 or more Vehicles | 21 (4.7%) | 8 (1.8%) |
| Total | 449 (100.0%) | 442 (100.0%) |
Commute Time in East Dubuque
The most frequently occuring commute durations in East Dubuque are 15 to 19 minutes (276 commuters, 32.5%), 10 to 14 minutes (166 commuters, 19.5%), and 5 to 9 minutes (151 commuters, 17.8%).
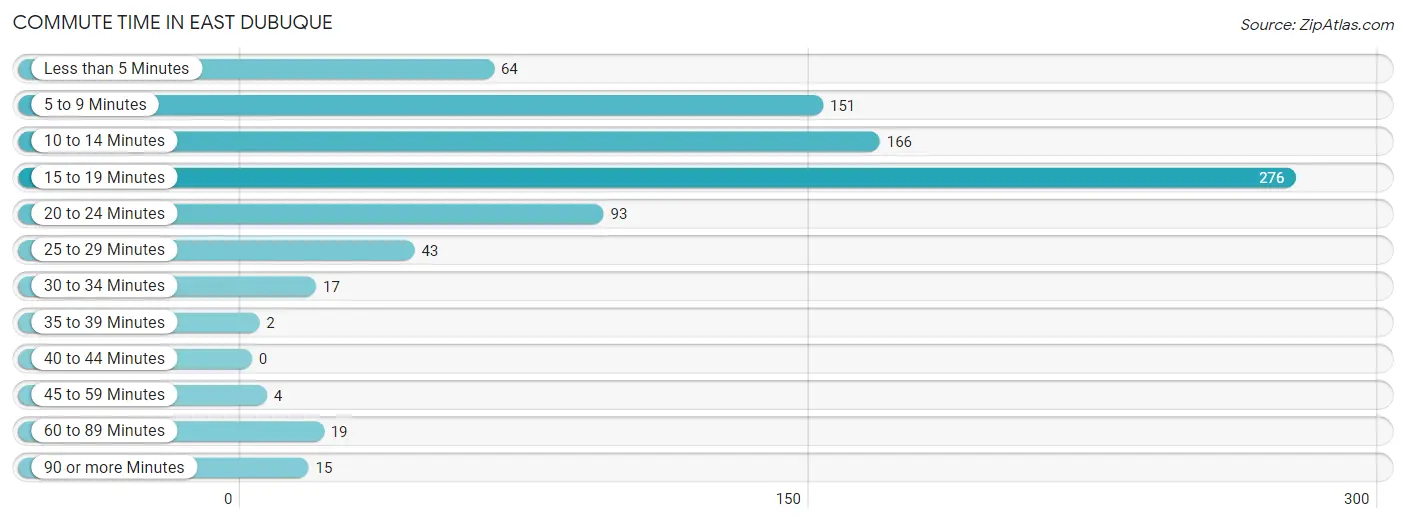
| Commute Time | # Commuters | % Commuters |
| Less than 5 Minutes | 64 | 7.5% |
| 5 to 9 Minutes | 151 | 17.8% |
| 10 to 14 Minutes | 166 | 19.5% |
| 15 to 19 Minutes | 276 | 32.5% |
| 20 to 24 Minutes | 93 | 10.9% |
| 25 to 29 Minutes | 43 | 5.1% |
| 30 to 34 Minutes | 17 | 2.0% |
| 35 to 39 Minutes | 2 | 0.2% |
| 40 to 44 Minutes | 0 | 0.0% |
| 45 to 59 Minutes | 4 | 0.5% |
| 60 to 89 Minutes | 19 | 2.2% |
| 90 or more Minutes | 15 | 1.8% |
Commute Time by Sex in East Dubuque
The most common commute times in East Dubuque are 15 to 19 minutes (122 commuters, 29.3%) for males and 15 to 19 minutes (154 commuters, 35.6%) for females.
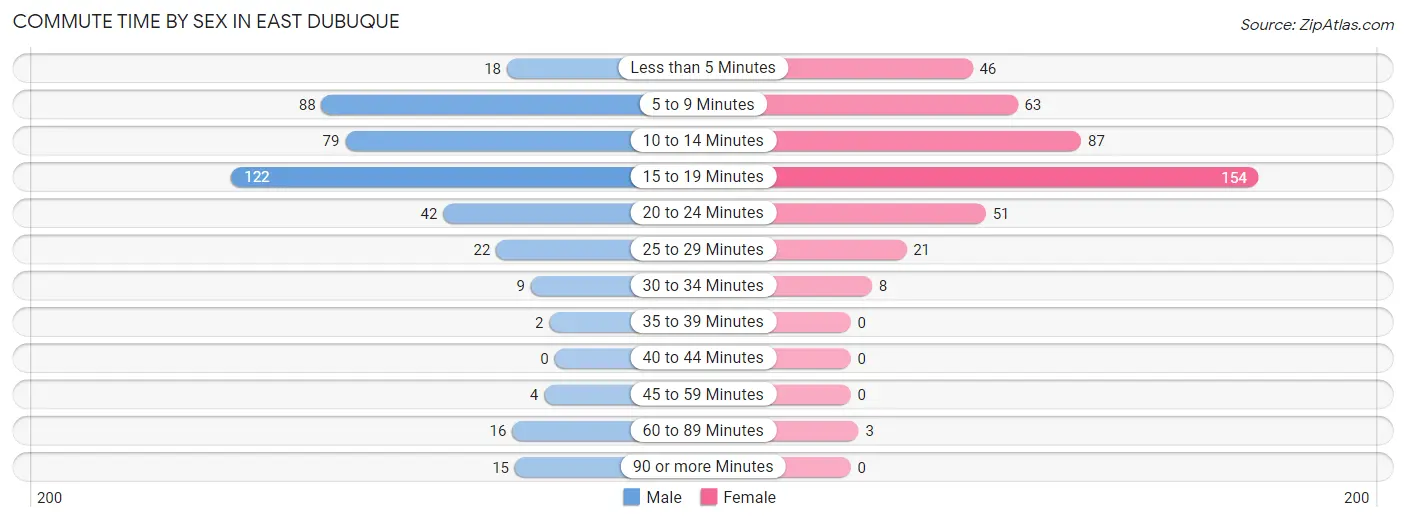
| Commute Time | Male | Female |
| Less than 5 Minutes | 18 (4.3%) | 46 (10.6%) |
| 5 to 9 Minutes | 88 (21.1%) | 63 (14.5%) |
| 10 to 14 Minutes | 79 (18.9%) | 87 (20.1%) |
| 15 to 19 Minutes | 122 (29.3%) | 154 (35.6%) |
| 20 to 24 Minutes | 42 (10.1%) | 51 (11.8%) |
| 25 to 29 Minutes | 22 (5.3%) | 21 (4.9%) |
| 30 to 34 Minutes | 9 (2.2%) | 8 (1.8%) |
| 35 to 39 Minutes | 2 (0.5%) | 0 (0.0%) |
| 40 to 44 Minutes | 0 (0.0%) | 0 (0.0%) |
| 45 to 59 Minutes | 4 (1.0%) | 0 (0.0%) |
| 60 to 89 Minutes | 16 (3.8%) | 3 (0.7%) |
| 90 or more Minutes | 15 (3.6%) | 0 (0.0%) |
Time of Departure to Work by Sex in East Dubuque
The most frequent times of departure to work in East Dubuque are 12:00 PM to 3:59 PM (61, 14.6%) for males and 7:00 AM to 7:29 AM (87, 20.1%) for females.
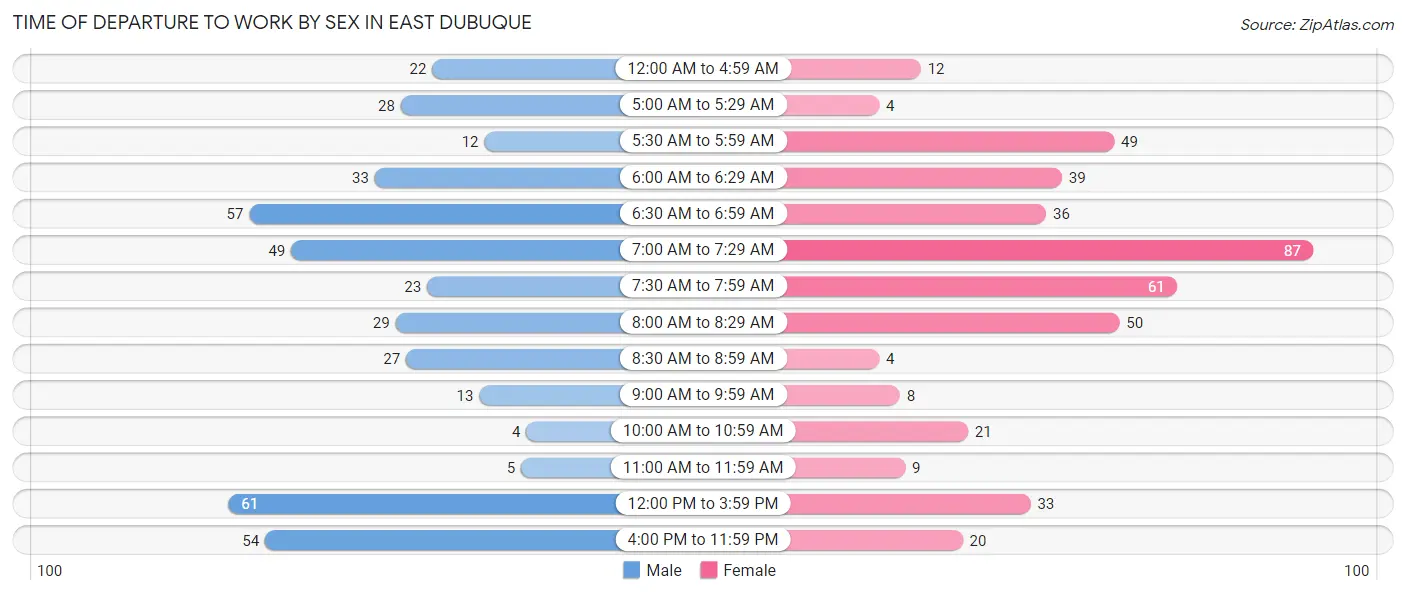
| Time of Departure | Male | Female |
| 12:00 AM to 4:59 AM | 22 (5.3%) | 12 (2.8%) |
| 5:00 AM to 5:29 AM | 28 (6.7%) | 4 (0.9%) |
| 5:30 AM to 5:59 AM | 12 (2.9%) | 49 (11.3%) |
| 6:00 AM to 6:29 AM | 33 (7.9%) | 39 (9.0%) |
| 6:30 AM to 6:59 AM | 57 (13.7%) | 36 (8.3%) |
| 7:00 AM to 7:29 AM | 49 (11.7%) | 87 (20.1%) |
| 7:30 AM to 7:59 AM | 23 (5.5%) | 61 (14.1%) |
| 8:00 AM to 8:29 AM | 29 (7.0%) | 50 (11.6%) |
| 8:30 AM to 8:59 AM | 27 (6.5%) | 4 (0.9%) |
| 9:00 AM to 9:59 AM | 13 (3.1%) | 8 (1.8%) |
| 10:00 AM to 10:59 AM | 4 (1.0%) | 21 (4.9%) |
| 11:00 AM to 11:59 AM | 5 (1.2%) | 9 (2.1%) |
| 12:00 PM to 3:59 PM | 61 (14.6%) | 33 (7.6%) |
| 4:00 PM to 11:59 PM | 54 (13.0%) | 20 (4.6%) |
| Total | 417 (100.0%) | 433 (100.0%) |
Housing Occupancy in East Dubuque
Occupancy by Ownership in East Dubuque
Of the total 739 dwellings in East Dubuque, owner-occupied units account for 491 (66.4%), while renter-occupied units make up 248 (33.6%).
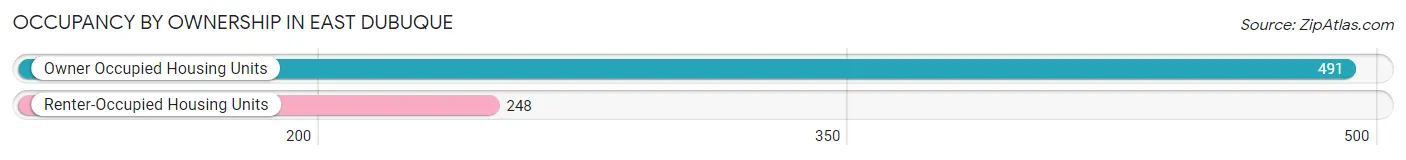
| Occupancy | # Housing Units | % Housing Units |
| Owner Occupied Housing Units | 491 | 66.4% |
| Renter-Occupied Housing Units | 248 | 33.6% |
| Total Occupied Housing Units | 739 | 100.0% |
Occupancy by Household Size in East Dubuque
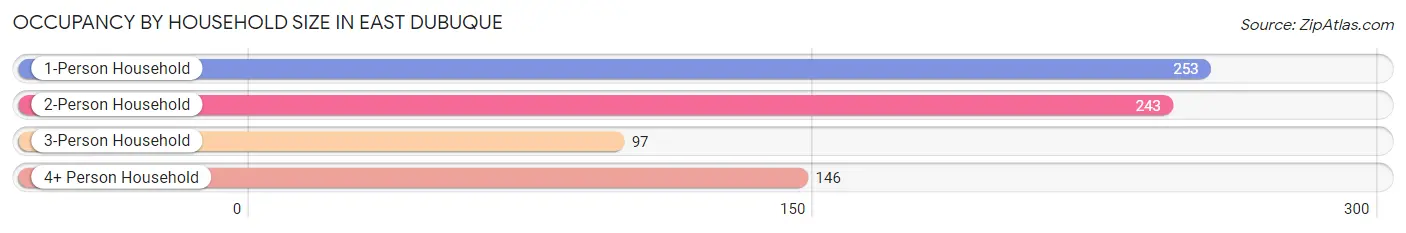
| Household Size | # Housing Units | % Housing Units |
| 1-Person Household | 253 | 34.2% |
| 2-Person Household | 243 | 32.9% |
| 3-Person Household | 97 | 13.1% |
| 4+ Person Household | 146 | 19.8% |
| Total Housing Units | 739 | 100.0% |
Occupancy by Ownership by Household Size in East Dubuque
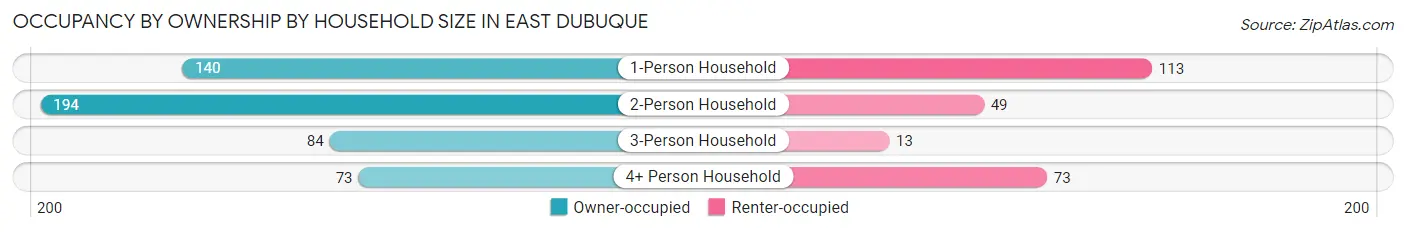
| Household Size | Owner-occupied | Renter-occupied |
| 1-Person Household | 140 (55.3%) | 113 (44.7%) |
| 2-Person Household | 194 (79.8%) | 49 (20.2%) |
| 3-Person Household | 84 (86.6%) | 13 (13.4%) |
| 4+ Person Household | 73 (50.0%) | 73 (50.0%) |
| Total Housing Units | 491 (66.4%) | 248 (33.6%) |
Occupancy by Educational Attainment in East Dubuque
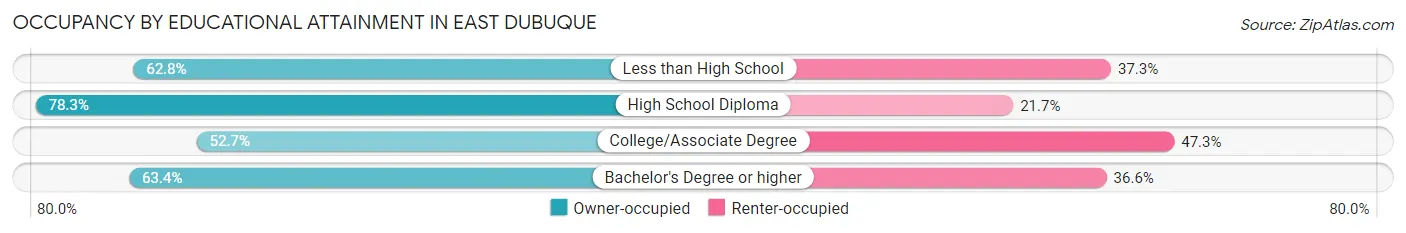
| Household Size | Owner-occupied | Renter-occupied |
| Less than High School | 32 (62.7%) | 19 (37.2%) |
| High School Diploma | 234 (78.3%) | 65 (21.7%) |
| College/Associate Degree | 107 (52.7%) | 96 (47.3%) |
| Bachelor's Degree or higher | 118 (63.4%) | 68 (36.6%) |
Occupancy by Age of Householder in East Dubuque
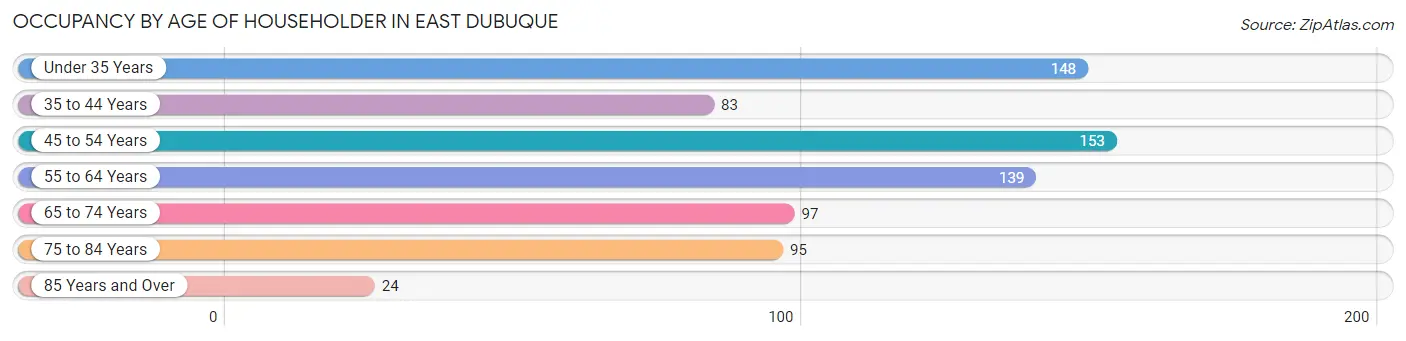
| Age Bracket | # Households | % Households |
| Under 35 Years | 148 | 20.0% |
| 35 to 44 Years | 83 | 11.2% |
| 45 to 54 Years | 153 | 20.7% |
| 55 to 64 Years | 139 | 18.8% |
| 65 to 74 Years | 97 | 13.1% |
| 75 to 84 Years | 95 | 12.9% |
| 85 Years and Over | 24 | 3.3% |
| Total | 739 | 100.0% |
Housing Finances in East Dubuque
Median Income by Occupancy in East Dubuque
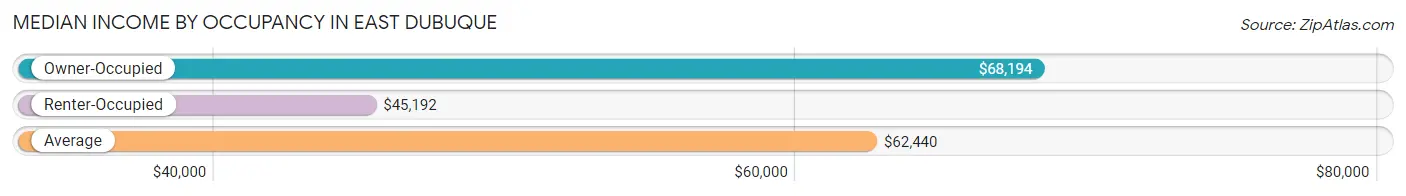
| Occupancy Type | # Households | Median Income |
| Owner-Occupied | 491 (66.4%) | $68,194 |
| Renter-Occupied | 248 (33.6%) | $45,192 |
| Average | 739 (100.0%) | $62,440 |
Occupancy by Householder Income Bracket in East Dubuque
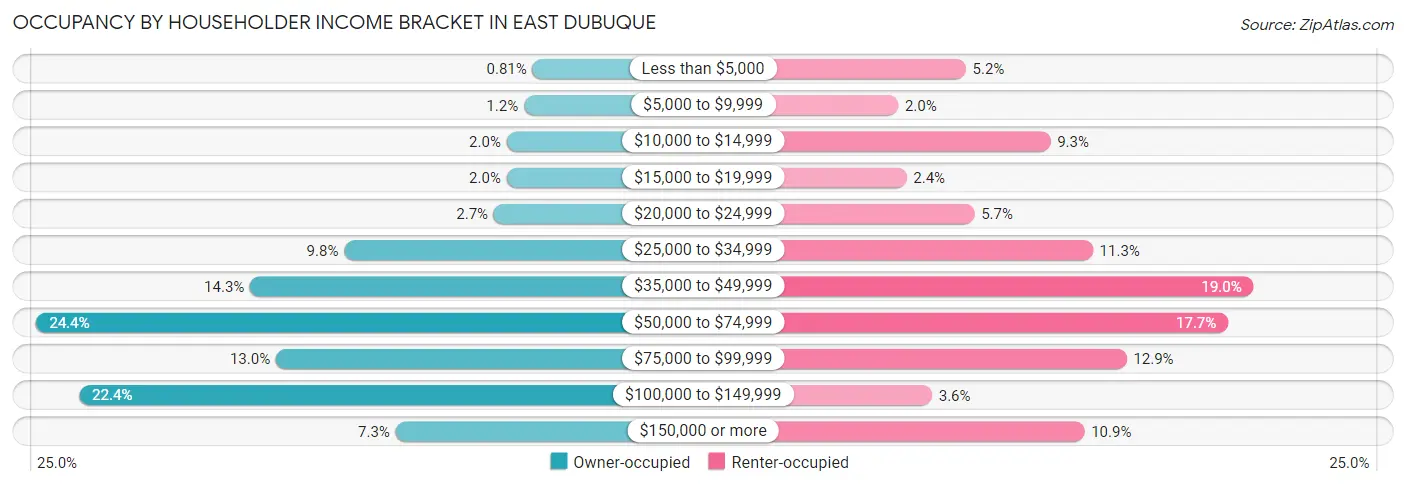
| Income Bracket | Owner-occupied | Renter-occupied |
| Less than $5,000 | 4 (0.8%) | 13 (5.2%) |
| $5,000 to $9,999 | 6 (1.2%) | 5 (2.0%) |
| $10,000 to $14,999 | 10 (2.0%) | 23 (9.3%) |
| $15,000 to $19,999 | 10 (2.0%) | 6 (2.4%) |
| $20,000 to $24,999 | 13 (2.6%) | 14 (5.7%) |
| $25,000 to $34,999 | 48 (9.8%) | 28 (11.3%) |
| $35,000 to $49,999 | 70 (14.3%) | 47 (19.0%) |
| $50,000 to $74,999 | 120 (24.4%) | 44 (17.7%) |
| $75,000 to $99,999 | 64 (13.0%) | 32 (12.9%) |
| $100,000 to $149,999 | 110 (22.4%) | 9 (3.6%) |
| $150,000 or more | 36 (7.3%) | 27 (10.9%) |
| Total | 491 (100.0%) | 248 (100.0%) |
Monthly Housing Cost Tiers in East Dubuque
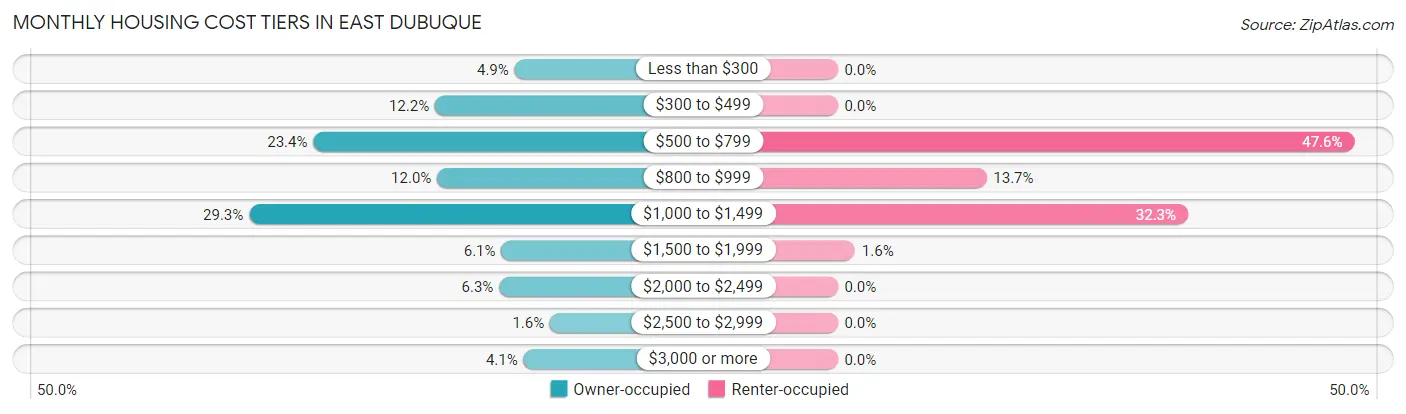
| Monthly Cost | Owner-occupied | Renter-occupied |
| Less than $300 | 24 (4.9%) | 0 (0.0%) |
| $300 to $499 | 60 (12.2%) | 0 (0.0%) |
| $500 to $799 | 115 (23.4%) | 118 (47.6%) |
| $800 to $999 | 59 (12.0%) | 34 (13.7%) |
| $1,000 to $1,499 | 144 (29.3%) | 80 (32.3%) |
| $1,500 to $1,999 | 30 (6.1%) | 4 (1.6%) |
| $2,000 to $2,499 | 31 (6.3%) | 0 (0.0%) |
| $2,500 to $2,999 | 8 (1.6%) | 0 (0.0%) |
| $3,000 or more | 20 (4.1%) | 0 (0.0%) |
| Total | 491 (100.0%) | 248 (100.0%) |
Physical Housing Characteristics in East Dubuque
Housing Structures in East Dubuque
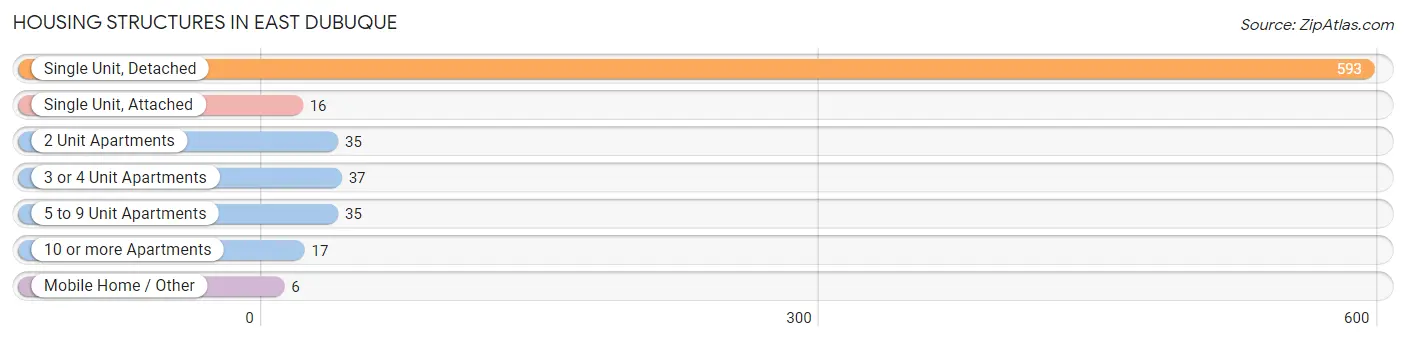
| Structure Type | # Housing Units | % Housing Units |
| Single Unit, Detached | 593 | 80.2% |
| Single Unit, Attached | 16 | 2.2% |
| 2 Unit Apartments | 35 | 4.7% |
| 3 or 4 Unit Apartments | 37 | 5.0% |
| 5 to 9 Unit Apartments | 35 | 4.7% |
| 10 or more Apartments | 17 | 2.3% |
| Mobile Home / Other | 6 | 0.8% |
| Total | 739 | 100.0% |
Housing Structures by Occupancy in East Dubuque
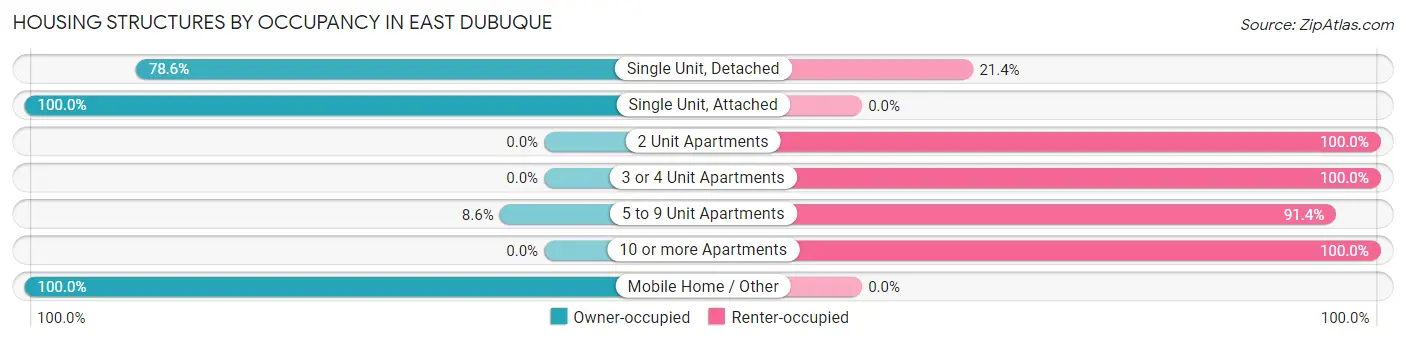
| Structure Type | Owner-occupied | Renter-occupied |
| Single Unit, Detached | 466 (78.6%) | 127 (21.4%) |
| Single Unit, Attached | 16 (100.0%) | 0 (0.0%) |
| 2 Unit Apartments | 0 (0.0%) | 35 (100.0%) |
| 3 or 4 Unit Apartments | 0 (0.0%) | 37 (100.0%) |
| 5 to 9 Unit Apartments | 3 (8.6%) | 32 (91.4%) |
| 10 or more Apartments | 0 (0.0%) | 17 (100.0%) |
| Mobile Home / Other | 6 (100.0%) | 0 (0.0%) |
| Total | 491 (66.4%) | 248 (33.6%) |
Housing Structures by Number of Rooms in East Dubuque
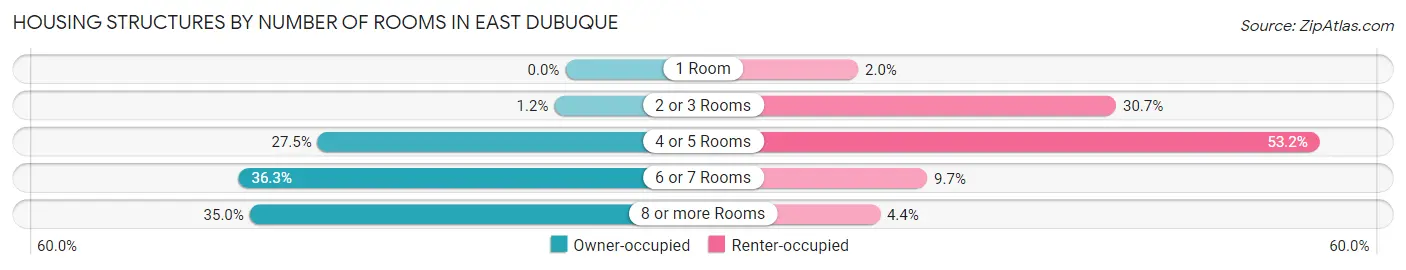
| Number of Rooms | Owner-occupied | Renter-occupied |
| 1 Room | 0 (0.0%) | 5 (2.0%) |
| 2 or 3 Rooms | 6 (1.2%) | 76 (30.6%) |
| 4 or 5 Rooms | 135 (27.5%) | 132 (53.2%) |
| 6 or 7 Rooms | 178 (36.2%) | 24 (9.7%) |
| 8 or more Rooms | 172 (35.0%) | 11 (4.4%) |
| Total | 491 (100.0%) | 248 (100.0%) |
Housing Structure by Heating Type in East Dubuque
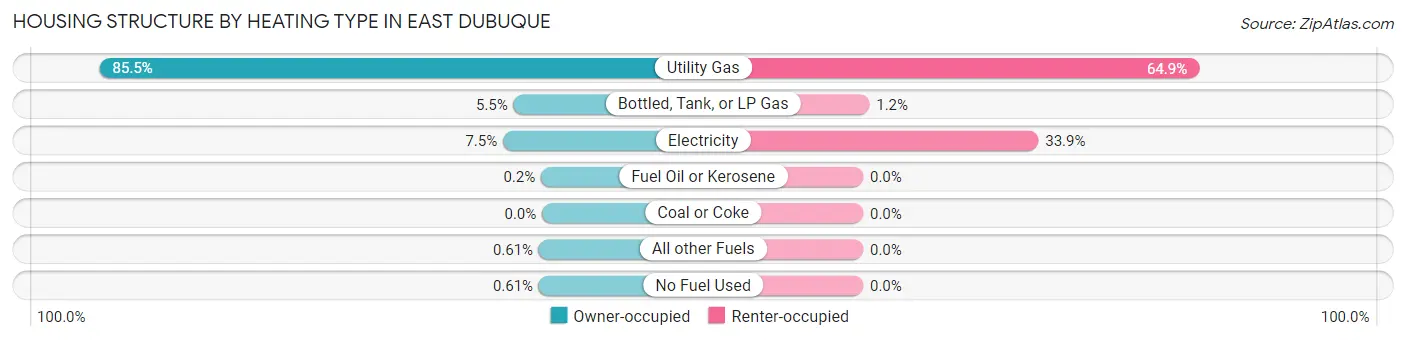
| Heating Type | Owner-occupied | Renter-occupied |
| Utility Gas | 420 (85.5%) | 161 (64.9%) |
| Bottled, Tank, or LP Gas | 27 (5.5%) | 3 (1.2%) |
| Electricity | 37 (7.5%) | 84 (33.9%) |
| Fuel Oil or Kerosene | 1 (0.2%) | 0 (0.0%) |
| Coal or Coke | 0 (0.0%) | 0 (0.0%) |
| All other Fuels | 3 (0.6%) | 0 (0.0%) |
| No Fuel Used | 3 (0.6%) | 0 (0.0%) |
| Total | 491 (100.0%) | 248 (100.0%) |
Household Vehicle Usage in East Dubuque
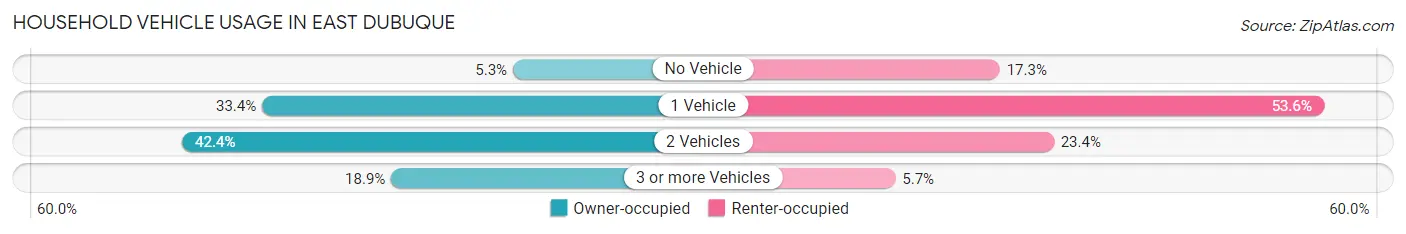
| Vehicles per Household | Owner-occupied | Renter-occupied |
| No Vehicle | 26 (5.3%) | 43 (17.3%) |
| 1 Vehicle | 164 (33.4%) | 133 (53.6%) |
| 2 Vehicles | 208 (42.4%) | 58 (23.4%) |
| 3 or more Vehicles | 93 (18.9%) | 14 (5.7%) |
| Total | 491 (100.0%) | 248 (100.0%) |
Real Estate & Mortgages in East Dubuque
Real Estate and Mortgage Overview in East Dubuque
| Characteristic | Without Mortgage | With Mortgage |
| Housing Units | 185 | 306 |
| Median Property Value | $139,200 | $153,600 |
| Median Household Income | $54,063 | $34 |
| Monthly Housing Costs | $531 | $20 |
| Real Estate Taxes | $2,443 | $0 |
Property Value by Mortgage Status in East Dubuque
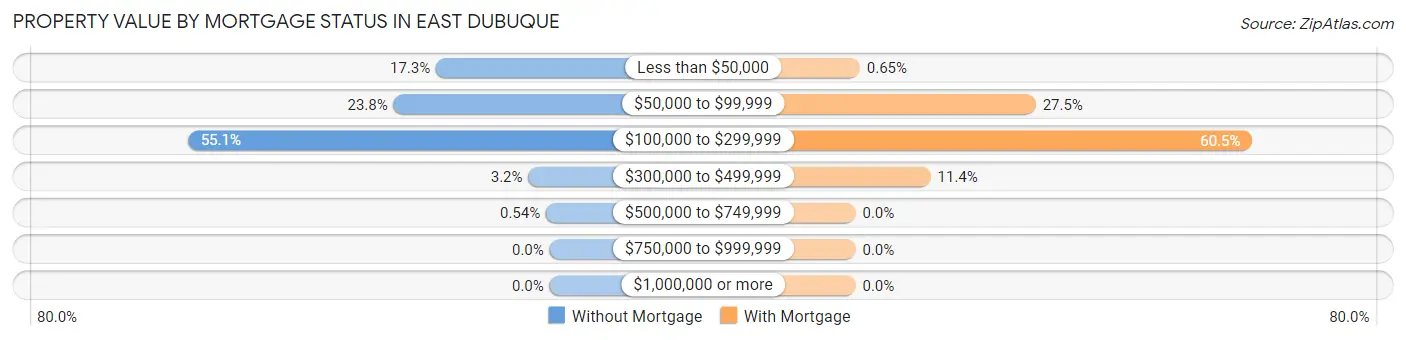
| Property Value | Without Mortgage | With Mortgage |
| Less than $50,000 | 32 (17.3%) | 2 (0.6%) |
| $50,000 to $99,999 | 44 (23.8%) | 84 (27.5%) |
| $100,000 to $299,999 | 102 (55.1%) | 185 (60.5%) |
| $300,000 to $499,999 | 6 (3.2%) | 35 (11.4%) |
| $500,000 to $749,999 | 1 (0.5%) | 0 (0.0%) |
| $750,000 to $999,999 | 0 (0.0%) | 0 (0.0%) |
| $1,000,000 or more | 0 (0.0%) | 0 (0.0%) |
| Total | 185 (100.0%) | 306 (100.0%) |
Household Income by Mortgage Status in East Dubuque
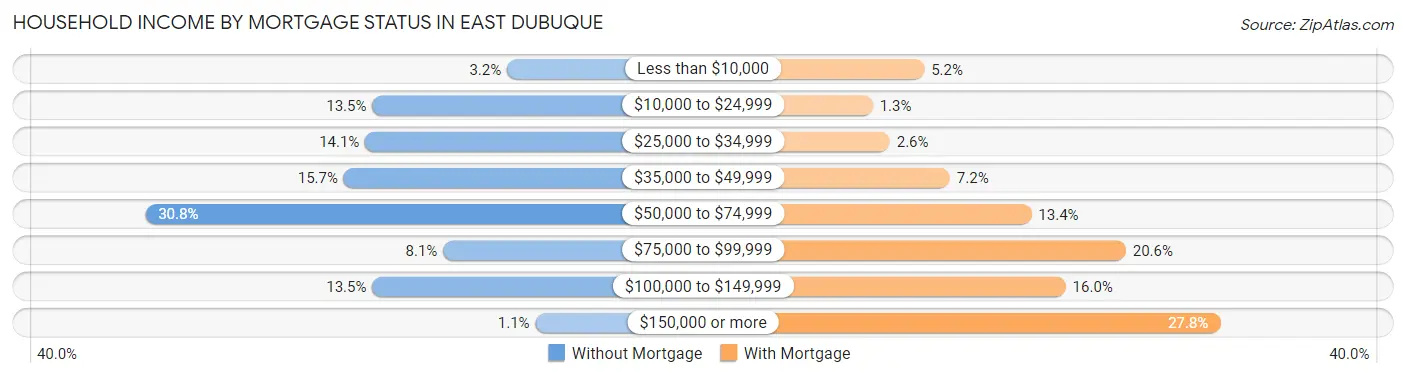
| Household Income | Without Mortgage | With Mortgage |
| Less than $10,000 | 6 (3.2%) | 16 (5.2%) |
| $10,000 to $24,999 | 25 (13.5%) | 4 (1.3%) |
| $25,000 to $34,999 | 26 (14.1%) | 8 (2.6%) |
| $35,000 to $49,999 | 29 (15.7%) | 22 (7.2%) |
| $50,000 to $74,999 | 57 (30.8%) | 41 (13.4%) |
| $75,000 to $99,999 | 15 (8.1%) | 63 (20.6%) |
| $100,000 to $149,999 | 25 (13.5%) | 49 (16.0%) |
| $150,000 or more | 2 (1.1%) | 85 (27.8%) |
| Total | 185 (100.0%) | 306 (100.0%) |
Property Value to Household Income Ratio in East Dubuque
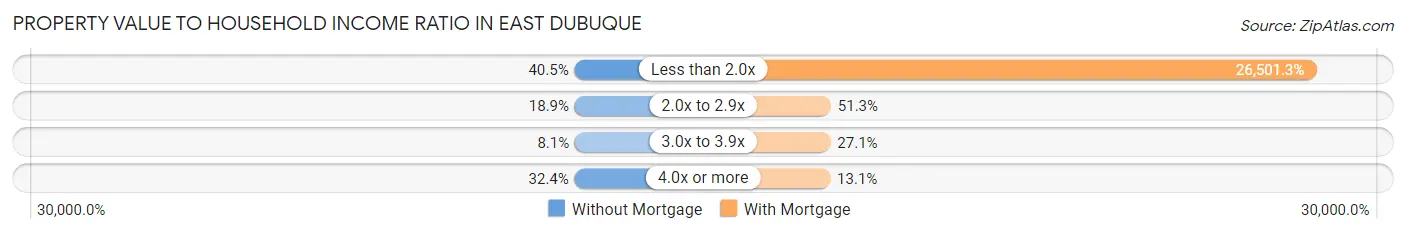
| Value-to-Income Ratio | Without Mortgage | With Mortgage |
| Less than 2.0x | 75 (40.5%) | 81,094 (26,501.3%) |
| 2.0x to 2.9x | 35 (18.9%) | 157 (51.3%) |
| 3.0x to 3.9x | 15 (8.1%) | 83 (27.1%) |
| 4.0x or more | 60 (32.4%) | 40 (13.1%) |
| Total | 185 (100.0%) | 306 (100.0%) |
Real Estate Taxes by Mortgage Status in East Dubuque
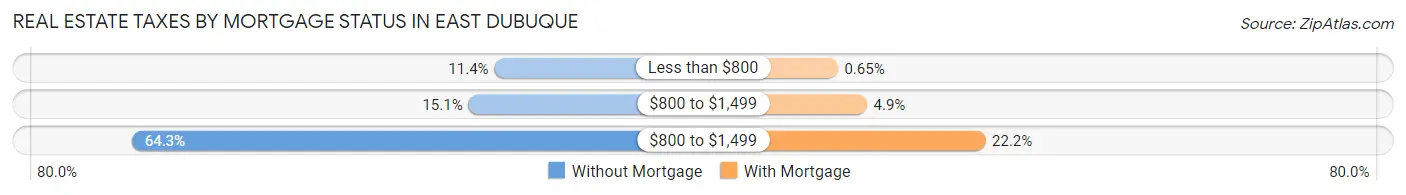
| Property Taxes | Without Mortgage | With Mortgage |
| Less than $800 | 21 (11.4%) | 2 (0.6%) |
| $800 to $1,499 | 28 (15.1%) | 15 (4.9%) |
| $800 to $1,499 | 119 (64.3%) | 68 (22.2%) |
| Total | 185 (100.0%) | 306 (100.0%) |
Health & Disability in East Dubuque
Health Insurance Coverage by Age in East Dubuque
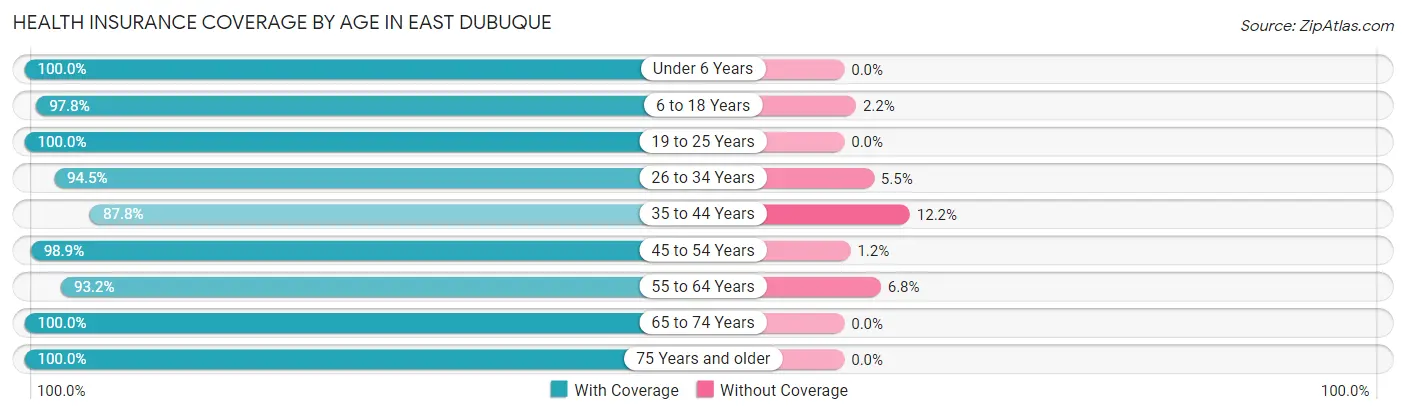
| Age Bracket | With Coverage | Without Coverage |
| Under 6 Years | 144 (100.0%) | 0 (0.0%) |
| 6 to 18 Years | 269 (97.8%) | 6 (2.2%) |
| 19 to 25 Years | 136 (100.0%) | 0 (0.0%) |
| 26 to 34 Years | 171 (94.5%) | 10 (5.5%) |
| 35 to 44 Years | 122 (87.8%) | 17 (12.2%) |
| 45 to 54 Years | 257 (98.9%) | 3 (1.1%) |
| 55 to 64 Years | 178 (93.2%) | 13 (6.8%) |
| 65 to 74 Years | 150 (100.0%) | 0 (0.0%) |
| 75 Years and older | 146 (100.0%) | 0 (0.0%) |
| Total | 1,573 (97.0%) | 49 (3.0%) |
Health Insurance Coverage by Citizenship Status in East Dubuque
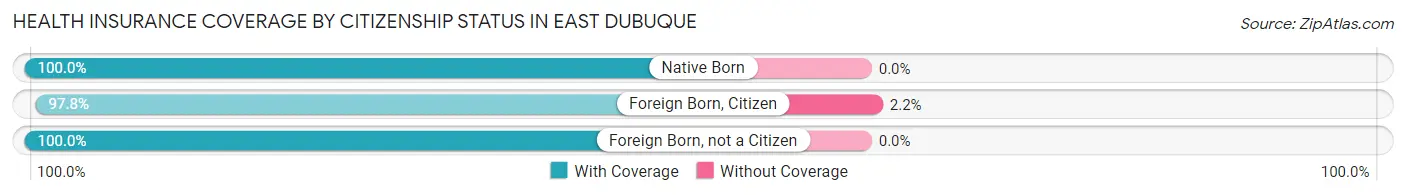
| Citizenship Status | With Coverage | Without Coverage |
| Native Born | 144 (100.0%) | 0 (0.0%) |
| Foreign Born, Citizen | 269 (97.8%) | 6 (2.2%) |
| Foreign Born, not a Citizen | 136 (100.0%) | 0 (0.0%) |
Health Insurance Coverage by Household Income in East Dubuque
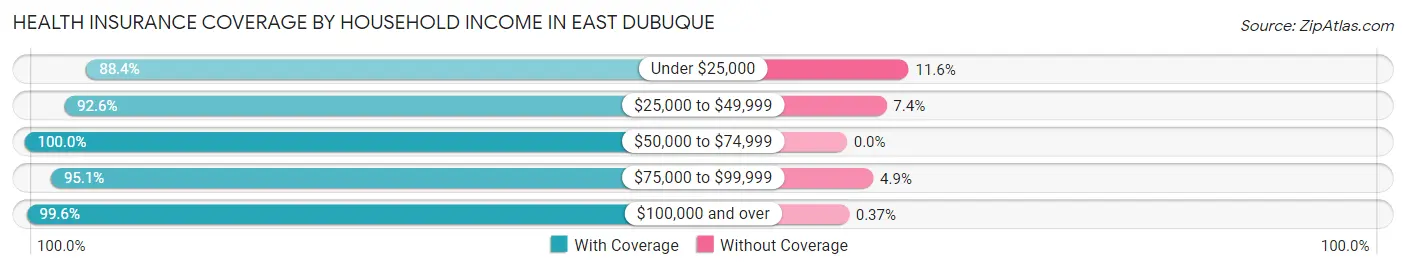
| Household Income | With Coverage | Without Coverage |
| Under $25,000 | 107 (88.4%) | 14 (11.6%) |
| $25,000 to $49,999 | 262 (92.6%) | 21 (7.4%) |
| $50,000 to $74,999 | 434 (100.0%) | 0 (0.0%) |
| $75,000 to $99,999 | 231 (95.1%) | 12 (4.9%) |
| $100,000 and over | 538 (99.6%) | 2 (0.4%) |
Public vs Private Health Insurance Coverage by Age in East Dubuque
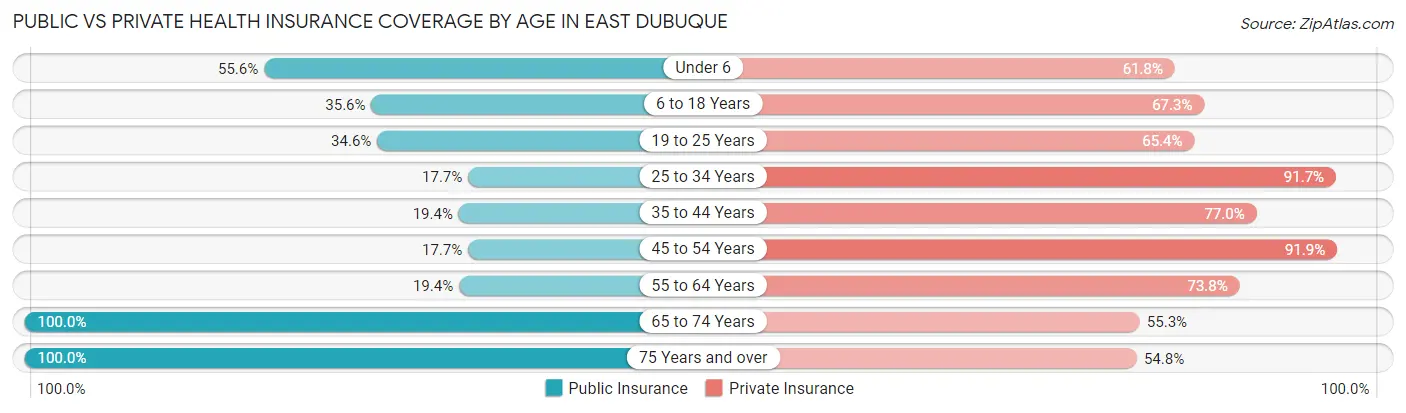
| Age Bracket | Public Insurance | Private Insurance |
| Under 6 | 80 (55.6%) | 89 (61.8%) |
| 6 to 18 Years | 98 (35.6%) | 185 (67.3%) |
| 19 to 25 Years | 47 (34.6%) | 89 (65.4%) |
| 25 to 34 Years | 32 (17.7%) | 166 (91.7%) |
| 35 to 44 Years | 27 (19.4%) | 107 (77.0%) |
| 45 to 54 Years | 46 (17.7%) | 239 (91.9%) |
| 55 to 64 Years | 37 (19.4%) | 141 (73.8%) |
| 65 to 74 Years | 150 (100.0%) | 83 (55.3%) |
| 75 Years and over | 146 (100.0%) | 80 (54.8%) |
| Total | 663 (40.9%) | 1,179 (72.7%) |
Disability Status by Sex by Age in East Dubuque
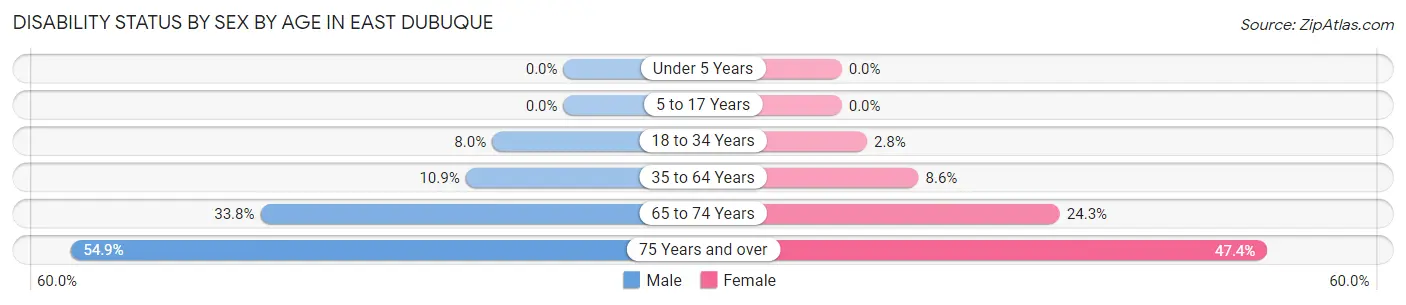
| Age Bracket | Male | Female |
| Under 5 Years | 0 (0.0%) | 0 (0.0%) |
| 5 to 17 Years | 0 (0.0%) | 0 (0.0%) |
| 18 to 34 Years | 12 (8.0%) | 5 (2.8%) |
| 35 to 64 Years | 35 (10.9%) | 23 (8.6%) |
| 65 to 74 Years | 27 (33.8%) | 17 (24.3%) |
| 75 Years and over | 28 (54.9%) | 45 (47.4%) |
Disability Class by Sex by Age in East Dubuque
Disability Class: Hearing Difficulty
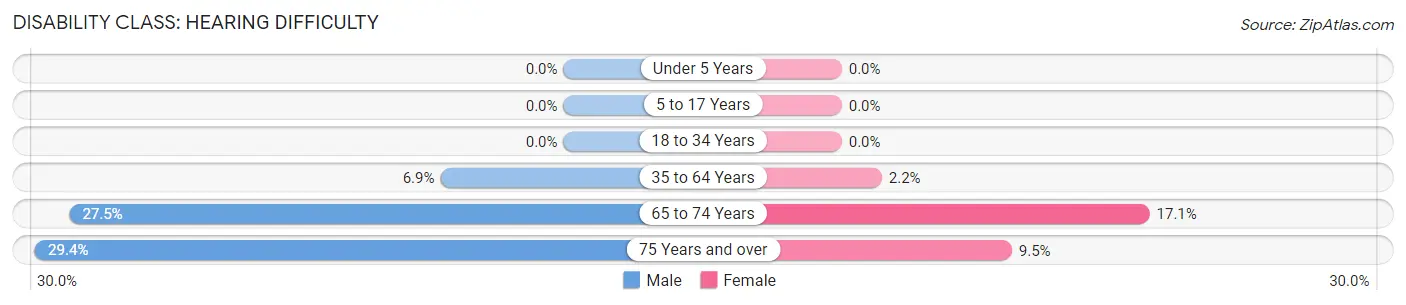
| Age Bracket | Male | Female |
| Under 5 Years | 0 (0.0%) | 0 (0.0%) |
| 5 to 17 Years | 0 (0.0%) | 0 (0.0%) |
| 18 to 34 Years | 0 (0.0%) | 0 (0.0%) |
| 35 to 64 Years | 22 (6.9%) | 6 (2.2%) |
| 65 to 74 Years | 22 (27.5%) | 12 (17.1%) |
| 75 Years and over | 15 (29.4%) | 9 (9.5%) |
Disability Class: Vision Difficulty
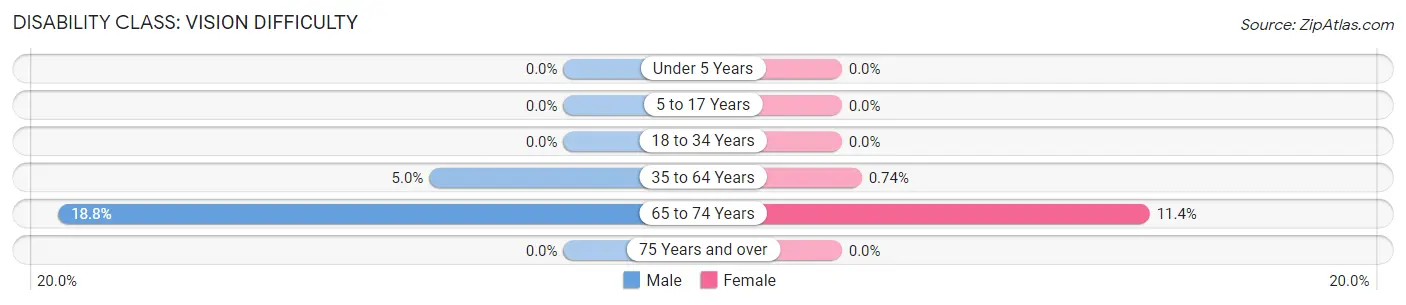
| Age Bracket | Male | Female |
| Under 5 Years | 0 (0.0%) | 0 (0.0%) |
| 5 to 17 Years | 0 (0.0%) | 0 (0.0%) |
| 18 to 34 Years | 0 (0.0%) | 0 (0.0%) |
| 35 to 64 Years | 16 (5.0%) | 2 (0.7%) |
| 65 to 74 Years | 15 (18.8%) | 8 (11.4%) |
| 75 Years and over | 0 (0.0%) | 0 (0.0%) |
Disability Class: Cognitive Difficulty
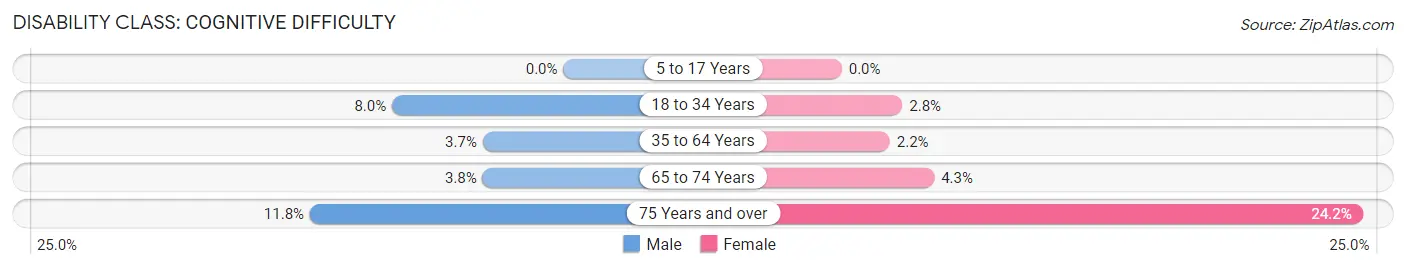
| Age Bracket | Male | Female |
| 5 to 17 Years | 0 (0.0%) | 0 (0.0%) |
| 18 to 34 Years | 12 (8.0%) | 5 (2.8%) |
| 35 to 64 Years | 12 (3.7%) | 6 (2.2%) |
| 65 to 74 Years | 3 (3.7%) | 3 (4.3%) |
| 75 Years and over | 6 (11.8%) | 23 (24.2%) |
Disability Class: Ambulatory Difficulty
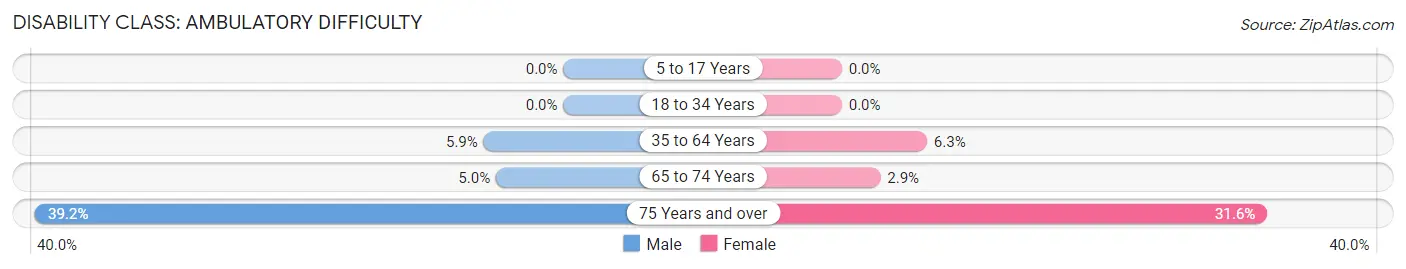
| Age Bracket | Male | Female |
| 5 to 17 Years | 0 (0.0%) | 0 (0.0%) |
| 18 to 34 Years | 0 (0.0%) | 0 (0.0%) |
| 35 to 64 Years | 19 (5.9%) | 17 (6.3%) |
| 65 to 74 Years | 4 (5.0%) | 2 (2.9%) |
| 75 Years and over | 20 (39.2%) | 30 (31.6%) |
Disability Class: Self-Care Difficulty
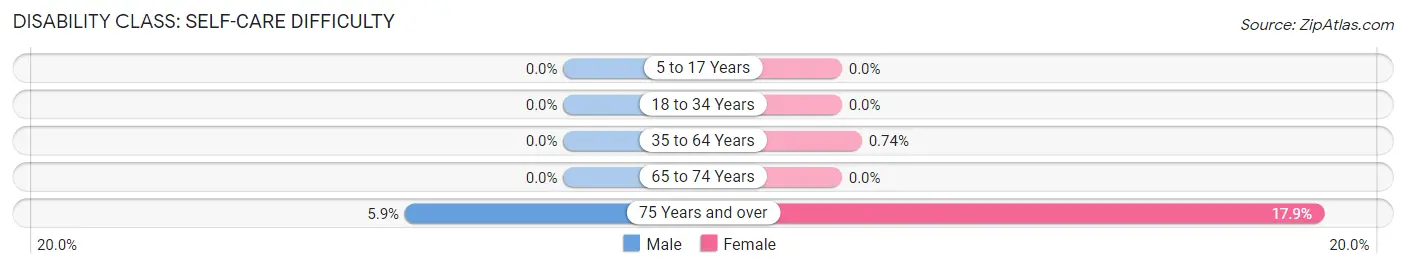
| Age Bracket | Male | Female |
| 5 to 17 Years | 0 (0.0%) | 0 (0.0%) |
| 18 to 34 Years | 0 (0.0%) | 0 (0.0%) |
| 35 to 64 Years | 0 (0.0%) | 2 (0.7%) |
| 65 to 74 Years | 0 (0.0%) | 0 (0.0%) |
| 75 Years and over | 3 (5.9%) | 17 (17.9%) |
Technology Access in East Dubuque
Computing Device Access in East Dubuque
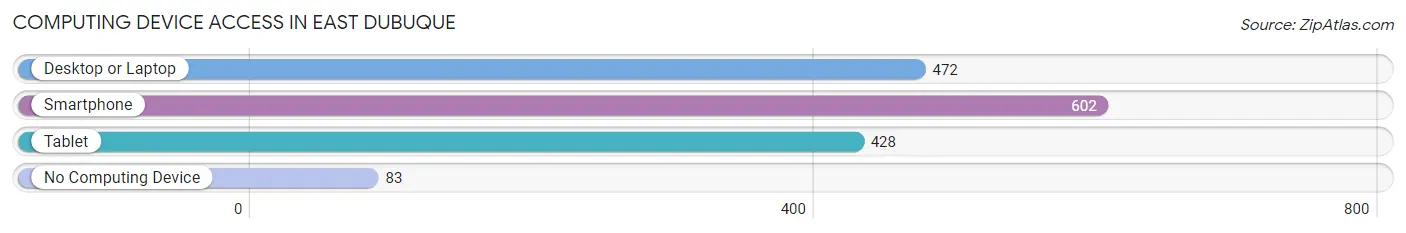
| Device Type | # Households | % Households |
| Desktop or Laptop | 472 | 63.9% |
| Smartphone | 602 | 81.5% |
| Tablet | 428 | 57.9% |
| No Computing Device | 83 | 11.2% |
| Total | 739 | 100.0% |
Internet Access in East Dubuque
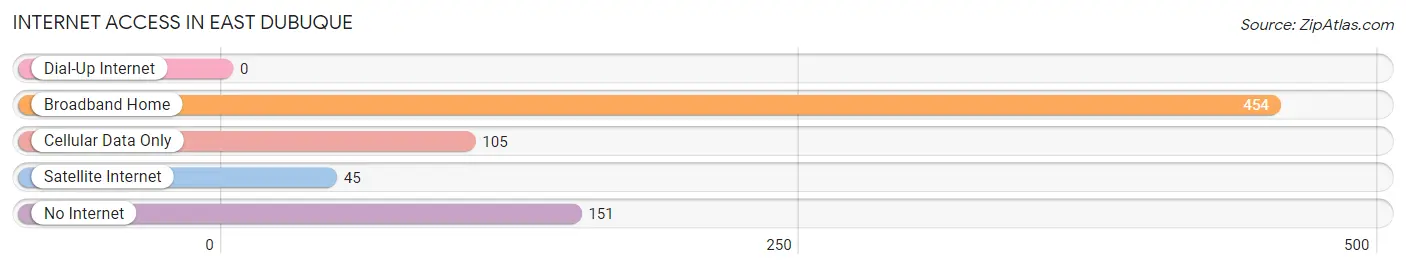
| Internet Type | # Households | % Households |
| Dial-Up Internet | 0 | 0.0% |
| Broadband Home | 454 | 61.4% |
| Cellular Data Only | 105 | 14.2% |
| Satellite Internet | 45 | 6.1% |
| No Internet | 151 | 20.4% |
| Total | 739 | 100.0% |
East Dubuque Summary
History
East Dubuque, Illinois is a small city located in Jo Daviess County, Illinois, along the Mississippi River. The city was founded in 1856 by a group of German immigrants who were looking for a place to settle and start a new life. The city was originally known as “Dubuque”, but the name was changed to “East Dubuque” in 1872 to differentiate it from the city of Dubuque, Iowa, which is located across the river.
East Dubuque has a rich history that dates back to the early 1800s. The first settlers in the area were Native Americans, who were attracted to the area due to its abundance of natural resources. The first European settlers arrived in the area in the early 1800s, and the city was officially founded in 1856.
The city quickly grew and prospered due to its location on the Mississippi River, which provided access to markets in the Midwest and beyond. The city was also home to several industries, including a sawmill, a flour mill, a brewery, and a brickyard.
In the late 1800s, East Dubuque was a bustling city with a population of over 3,000 people. The city was home to several churches, schools, and businesses, and was a popular destination for tourists.
Geography
East Dubuque is located in Jo Daviess County, Illinois, along the Mississippi River. The city is situated on the east bank of the river, and is bordered by the cities of Dubuque, Iowa, and Galena, Illinois. The city is located approximately 25 miles south of the Wisconsin border, and is approximately 90 miles west of Chicago.
The city has a total area of 1.7 square miles, all of which is land. The city is located at an elevation of 645 feet above sea level. The city is located in a humid continental climate zone, and experiences hot, humid summers and cold, snowy winters.
Economy
East Dubuque’s economy is largely based on tourism and agriculture. The city is home to several tourist attractions, including the Dubuque County Historical Society Museum, the Dubuque Arboretum and Botanical Gardens, and the National Mississippi River Museum and Aquarium. The city is also home to several wineries, breweries, and distilleries, which attract visitors from all over the Midwest.
Agriculture is also an important part of the city’s economy. The city is home to several farms, which produce a variety of crops, including corn, soybeans, wheat, and hay. The city is also home to several livestock farms, which produce beef, pork, and poultry.
Demographics
As of the 2010 census, East Dubuque had a population of 2,945 people. The city has a population density of 1,735 people per square mile. The median age of the city’s population is 44.7 years, and the median household income is $45,945.
The city is predominantly white, with 92.3% of the population identifying as white. The city is also home to a small Hispanic population, with 4.2% of the population identifying as Hispanic or Latino. The city is also home to a small African American population, with 1.2% of the population identifying as African American.
Conclusion
East Dubuque, Illinois is a small city located in Jo Daviess County, Illinois, along the Mississippi River. The city was founded in 1856 by a group of German immigrants, and has a rich history that dates back to the early 1800s. The city is located in a humid continental climate zone, and experiences hot, humid summers and cold, snowy winters. The city’s economy is largely based on tourism and agriculture, and the city is home to several tourist attractions, wineries, breweries, and distilleries. As of the 2010 census, East Dubuque had a population of 2,945 people, with a median age of 44.7 years and a median household income of $45,945.
Common Questions
What is Per Capita Income in East Dubuque?
Per Capita income in East Dubuque is $33,465.
What is the Median Family Income in East Dubuque?
Median Family Income in East Dubuque is $72,368.
What is the Median Household income in East Dubuque?
Median Household Income in East Dubuque is $62,440.
What is Income or Wage Gap in East Dubuque?
Income or Wage Gap in East Dubuque is 24.1%.
Women in East Dubuque earn 75.9 cents for every dollar earned by a man.
What is Inequality or Gini Index in East Dubuque?
Inequality or Gini Index in East Dubuque is 0.38.
What is the Total Population of East Dubuque?
Total Population of East Dubuque is 1,634.
What is the Total Male Population of East Dubuque?
Total Male Population of East Dubuque is 860.
What is the Total Female Population of East Dubuque?
Total Female Population of East Dubuque is 774.
What is the Ratio of Males per 100 Females in East Dubuque?
There are 111.11 Males per 100 Females in East Dubuque.
What is the Ratio of Females per 100 Males in East Dubuque?
There are 90.00 Females per 100 Males in East Dubuque.
What is the Median Population Age in East Dubuque?
Median Population Age in East Dubuque is 39.9 Years.
What is the Average Family Size in East Dubuque
Average Family Size in East Dubuque is 2.8 People.
What is the Average Household Size in East Dubuque
Average Household Size in East Dubuque is 2.2 People.
How Large is the Labor Force in East Dubuque?
There are 935 People in the Labor Forcein in East Dubuque.
What is the Percentage of People in the Labor Force in East Dubuque?
73.7% of People are in the Labor Force in East Dubuque.
What is the Unemployment Rate in East Dubuque?
Unemployment Rate in East Dubuque is 4.2%.