Dixon, IL Map & Demographics
Dixon Map
Dixon Overview
$26,524
PER CAPITA INCOME
$70,389
AVG FAMILY INCOME
$52,208
AVG HOUSEHOLD INCOME
31.3%
WAGE / INCOME GAP [ % ]
68.7¢/ $1
WAGE / INCOME GAP [ $ ]
0.45
INEQUALITY / GINI INDEX
15,573
TOTAL POPULATION
8,812
MALE POPULATION
6,761
FEMALE POPULATION
130.34
MALES / 100 FEMALES
76.72
FEMALES / 100 MALES
41.2
MEDIAN AGE
2.9
AVG FAMILY SIZE
2.1
AVG HOUSEHOLD SIZE
6,522
LABOR FORCE [ PEOPLE ]
50.0%
PERCENT IN LABOR FORCE
2.9%
UNEMPLOYMENT RATE
Dixon Zip Codes
Income in Dixon
Income Overview in Dixon
Per Capita Income in Dixon is $26,524, while median incomes of families and households are $70,389 and $52,208 respectively.
| Characteristic | Number | Measure |
| Per Capita Income | 15,573 | $26,524 |
| Median Family Income | 3,170 | $70,389 |
| Mean Family Income | 3,170 | $83,571 |
| Median Household Income | 6,064 | $52,208 |
| Mean Household Income | 6,064 | $66,671 |
| Income Deficit | 3,170 | $0 |
| Wage / Income Gap (%) | 15,573 | 31.29% |
| Wage / Income Gap ($) | 15,573 | 68.71¢ per $1 |
| Gini / Inequality Index | 15,573 | 0.45 |
Earnings by Sex in Dixon
Average Earnings in Dixon are $38,245, $46,046 for men and $31,637 for women, a difference of 31.3%.
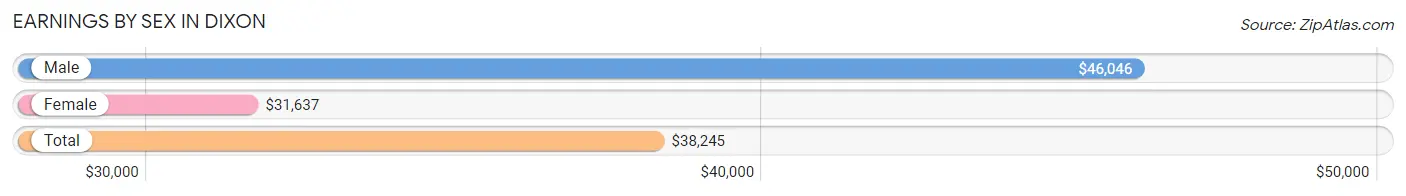
| Sex | Number | Average Earnings |
| Male | 3,291 (48.0%) | $46,046 |
| Female | 3,571 (52.0%) | $31,637 |
| Total | 6,862 (100.0%) | $38,245 |
Earnings by Sex by Income Bracket in Dixon
The most common earnings brackets in Dixon are $100,000+ for men (479 | 14.5%) and $30,000 to $34,999 for women (343 | 9.6%).
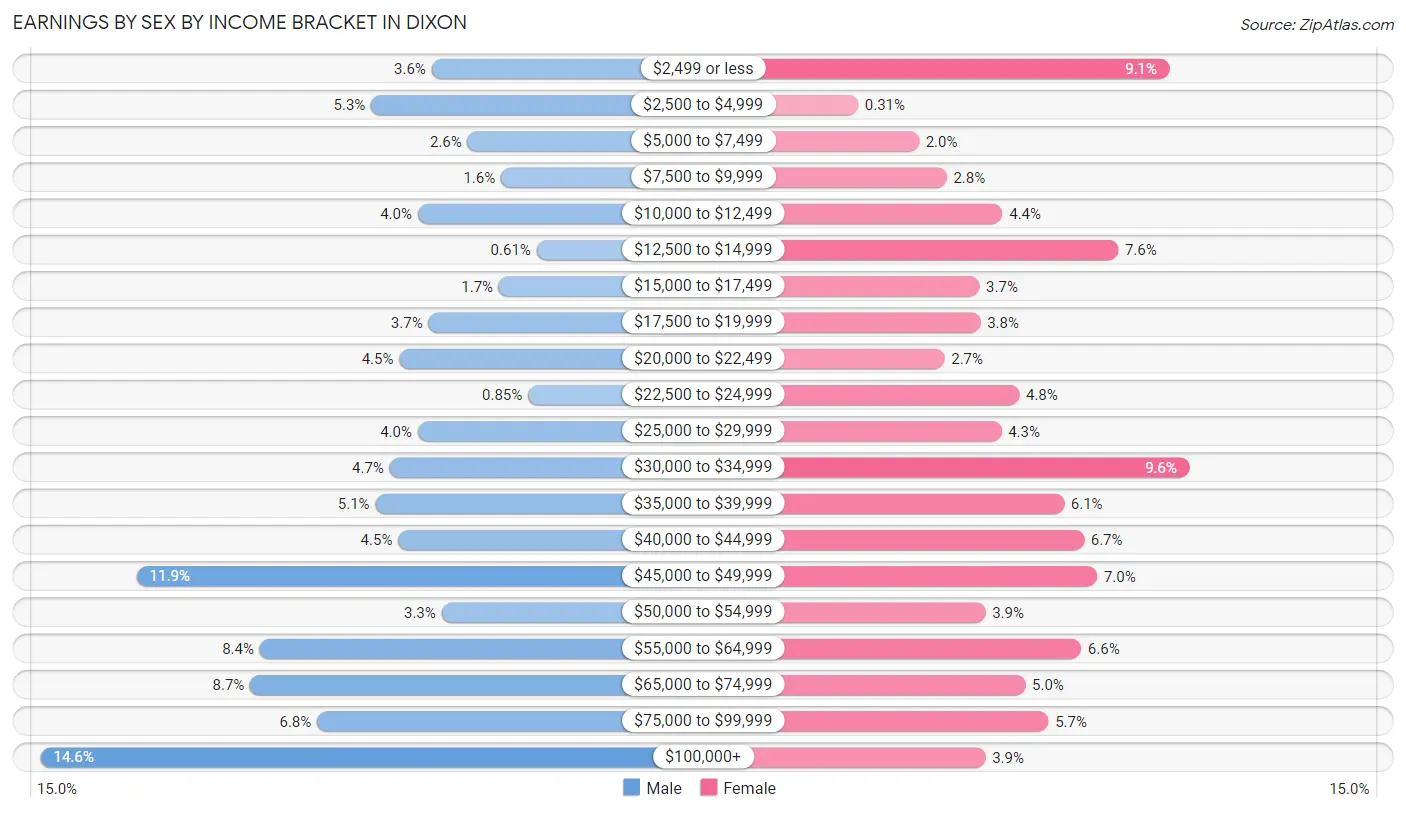
| Income | Male | Female |
| $2,499 or less | 117 (3.6%) | 323 (9.0%) |
| $2,500 to $4,999 | 173 (5.3%) | 11 (0.3%) |
| $5,000 to $7,499 | 84 (2.5%) | 72 (2.0%) |
| $7,500 to $9,999 | 53 (1.6%) | 100 (2.8%) |
| $10,000 to $12,499 | 130 (4.0%) | 156 (4.4%) |
| $12,500 to $14,999 | 20 (0.6%) | 272 (7.6%) |
| $15,000 to $17,499 | 55 (1.7%) | 133 (3.7%) |
| $17,500 to $19,999 | 120 (3.6%) | 134 (3.7%) |
| $20,000 to $22,499 | 147 (4.5%) | 98 (2.7%) |
| $22,500 to $24,999 | 28 (0.9%) | 173 (4.8%) |
| $25,000 to $29,999 | 130 (4.0%) | 155 (4.3%) |
| $30,000 to $34,999 | 156 (4.7%) | 343 (9.6%) |
| $35,000 to $39,999 | 169 (5.1%) | 218 (6.1%) |
| $40,000 to $44,999 | 148 (4.5%) | 238 (6.7%) |
| $45,000 to $49,999 | 390 (11.8%) | 251 (7.0%) |
| $50,000 to $54,999 | 108 (3.3%) | 139 (3.9%) |
| $55,000 to $64,999 | 276 (8.4%) | 235 (6.6%) |
| $65,000 to $74,999 | 285 (8.7%) | 179 (5.0%) |
| $75,000 to $99,999 | 223 (6.8%) | 202 (5.7%) |
| $100,000+ | 479 (14.5%) | 139 (3.9%) |
| Total | 3,291 (100.0%) | 3,571 (100.0%) |
Earnings by Sex by Educational Attainment in Dixon
Average earnings in Dixon are $48,514 for men and $35,754 for women, a difference of 26.3%. Men with an educational attainment of graduate degree enjoy the highest average annual earnings of $118,441, while those with high school diploma education earn the least with $46,009. Women with an educational attainment of graduate degree earn the most with the average annual earnings of $78,281, while those with less than high school education have the smallest earnings of $5,801.
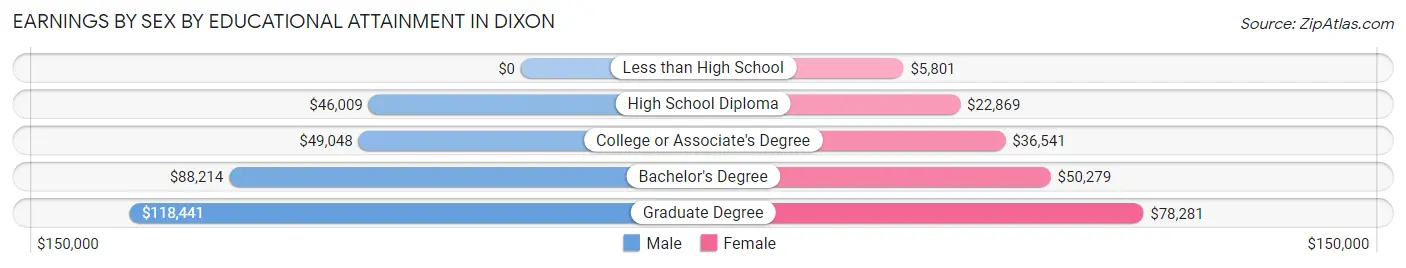
| Educational Attainment | Male Income | Female Income |
| Less than High School | - | - |
| High School Diploma | $46,009 | $22,869 |
| College or Associate's Degree | $49,048 | $36,541 |
| Bachelor's Degree | $88,214 | $50,279 |
| Graduate Degree | $118,441 | $78,281 |
| Total | $48,514 | $35,754 |
Family Income in Dixon
Family Income Brackets in Dixon
According to the Dixon family income data, there are 590 families falling into the $50,000 to $74,999 income range, which is the most common income bracket and makes up 18.6% of all families. Conversely, the $10,000 to $14,999 income bracket is the least frequent group with only 38 families (1.2%) belonging to this category.
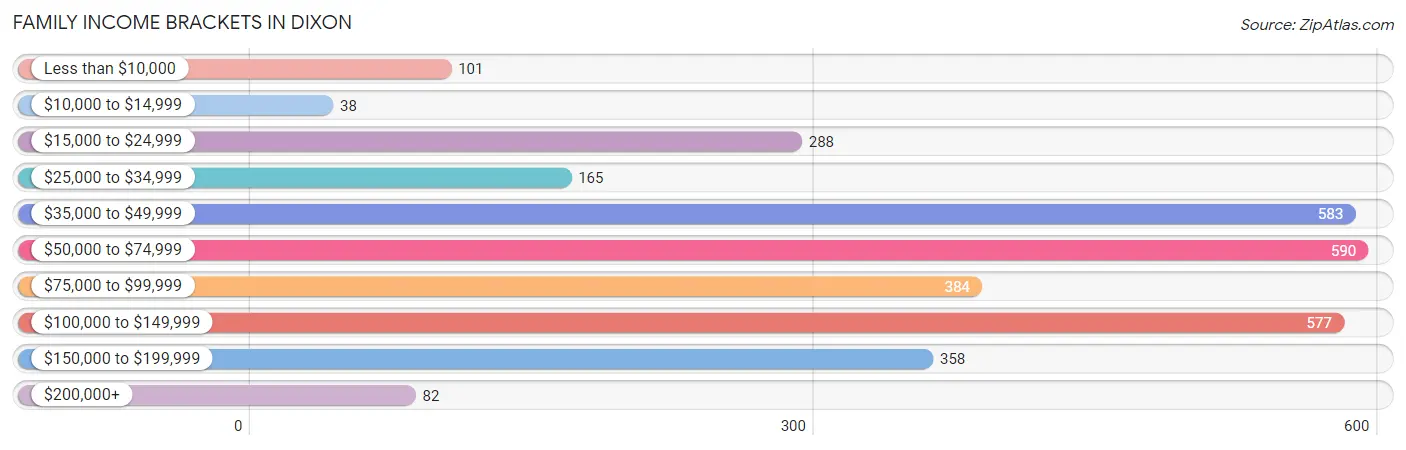
| Income Bracket | # Families | % Families |
| Less than $10,000 | 101 | 3.2% |
| $10,000 to $14,999 | 38 | 1.2% |
| $15,000 to $24,999 | 288 | 9.1% |
| $25,000 to $34,999 | 165 | 5.2% |
| $35,000 to $49,999 | 583 | 18.4% |
| $50,000 to $74,999 | 590 | 18.6% |
| $75,000 to $99,999 | 384 | 12.1% |
| $100,000 to $149,999 | 577 | 18.2% |
| $150,000 to $199,999 | 358 | 11.3% |
| $200,000+ | 82 | 2.6% |
Family Income by Famaliy Size in Dixon
6-person families (45 | 1.4%) account for the highest median family income in Dixon with $109,141 per family, while 2-person families (1,634 | 51.5%) have the highest median income of $29,949 per family member.
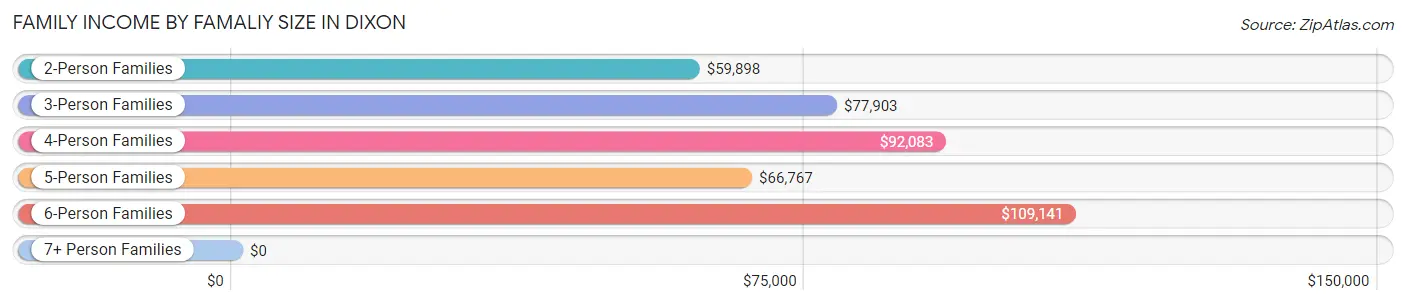
| Income Bracket | # Families | Median Income |
| 2-Person Families | 1,634 (51.5%) | $59,898 |
| 3-Person Families | 743 (23.4%) | $77,903 |
| 4-Person Families | 549 (17.3%) | $92,083 |
| 5-Person Families | 189 (6.0%) | $66,767 |
| 6-Person Families | 45 (1.4%) | $109,141 |
| 7+ Person Families | 10 (0.3%) | $0 |
| Total | 3,170 (100.0%) | $70,389 |
Family Income by Number of Earners in Dixon
The median family income in Dixon is $70,389, with families comprising 3+ earners (276) having the highest median family income of $127,500, while families with no earners (456) have the lowest median family income of $33,382, accounting for 8.7% and 14.4% of families, respectively.
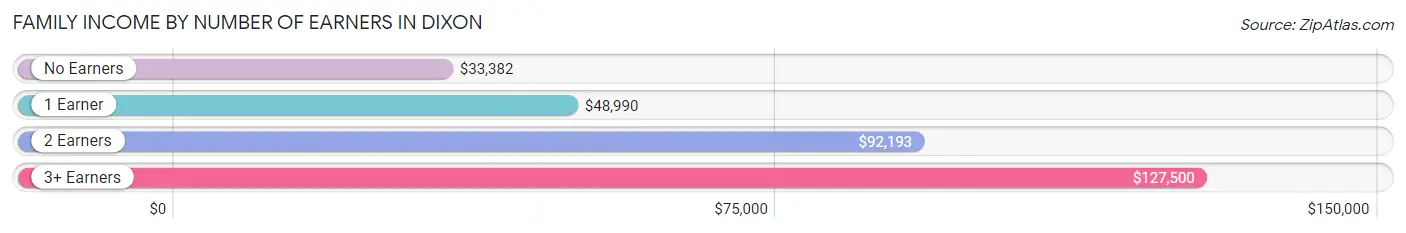
| Number of Earners | # Families | Median Income |
| No Earners | 456 (14.4%) | $33,382 |
| 1 Earner | 953 (30.1%) | $48,990 |
| 2 Earners | 1,485 (46.9%) | $92,193 |
| 3+ Earners | 276 (8.7%) | $127,500 |
| Total | 3,170 (100.0%) | $70,389 |
Household Income in Dixon
Household Income Brackets in Dixon
With 1,195 households falling in the category, the $50,000 to $74,999 income range is the most frequent in Dixon, accounting for 19.7% of all households. In contrast, only 200 households (3.3%) fall into the $200,000+ income bracket, making it the least populous group.
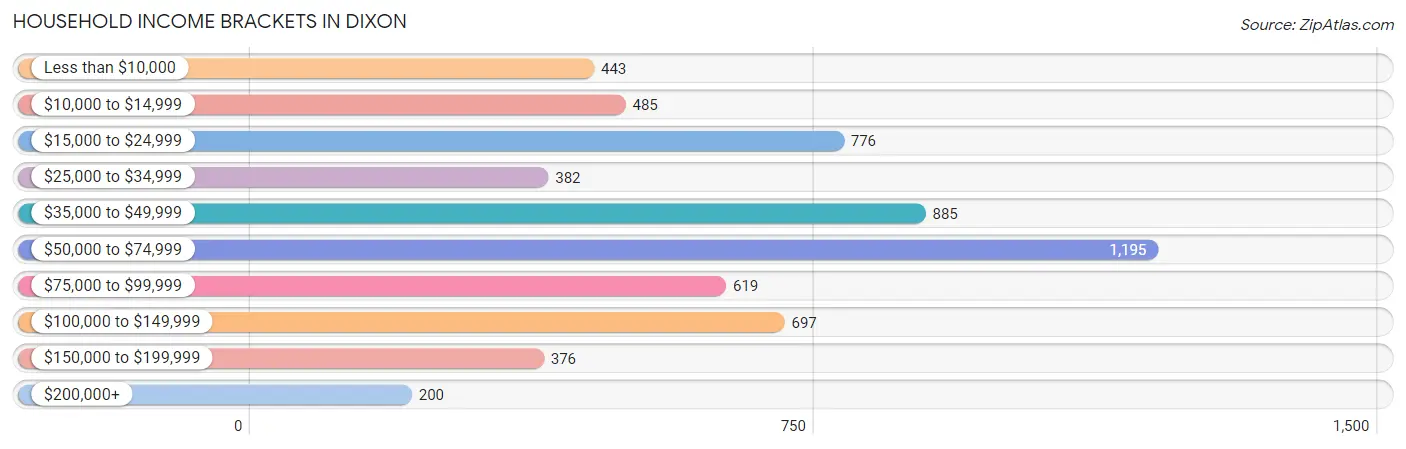
| Income Bracket | # Households | % Households |
| Less than $10,000 | 443 | 7.3% |
| $10,000 to $14,999 | 485 | 8.0% |
| $15,000 to $24,999 | 776 | 12.8% |
| $25,000 to $34,999 | 382 | 6.3% |
| $35,000 to $49,999 | 885 | 14.6% |
| $50,000 to $74,999 | 1,195 | 19.7% |
| $75,000 to $99,999 | 619 | 10.2% |
| $100,000 to $149,999 | 697 | 11.5% |
| $150,000 to $199,999 | 376 | 6.2% |
| $200,000+ | 200 | 3.3% |
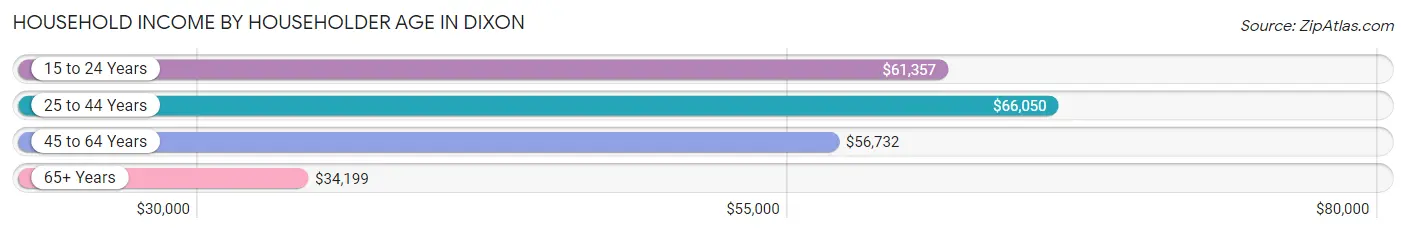
Household Income by Householder Age in Dixon
The median household income in Dixon is $52,208, with the highest median household income of $66,050 found in the 25 to 44 years age bracket for the primary householder. A total of 1,686 households (27.8%) fall into this category. Meanwhile, the 65+ years age bracket for the primary householder has the lowest median household income of $34,199, with 1,823 households (30.1%) in this group.
| Income Bracket | # Households | Median Income |
| 15 to 24 Years | 294 (4.9%) | $61,357 |
| 25 to 44 Years | 1,686 (27.8%) | $66,050 |
| 45 to 64 Years | 2,261 (37.3%) | $56,732 |
| 65+ Years | 1,823 (30.1%) | $34,199 |
| Total | 6,064 (100.0%) | $52,208 |
Poverty in Dixon
Income Below Poverty by Sex and Age in Dixon
With 17.3% poverty level for males and 20.0% for females among the residents of Dixon, 5 year old males and 5 year old females are the most vulnerable to poverty, with 32 males (100.0%) and 20 females (52.6%) in their respective age groups living below the poverty level.
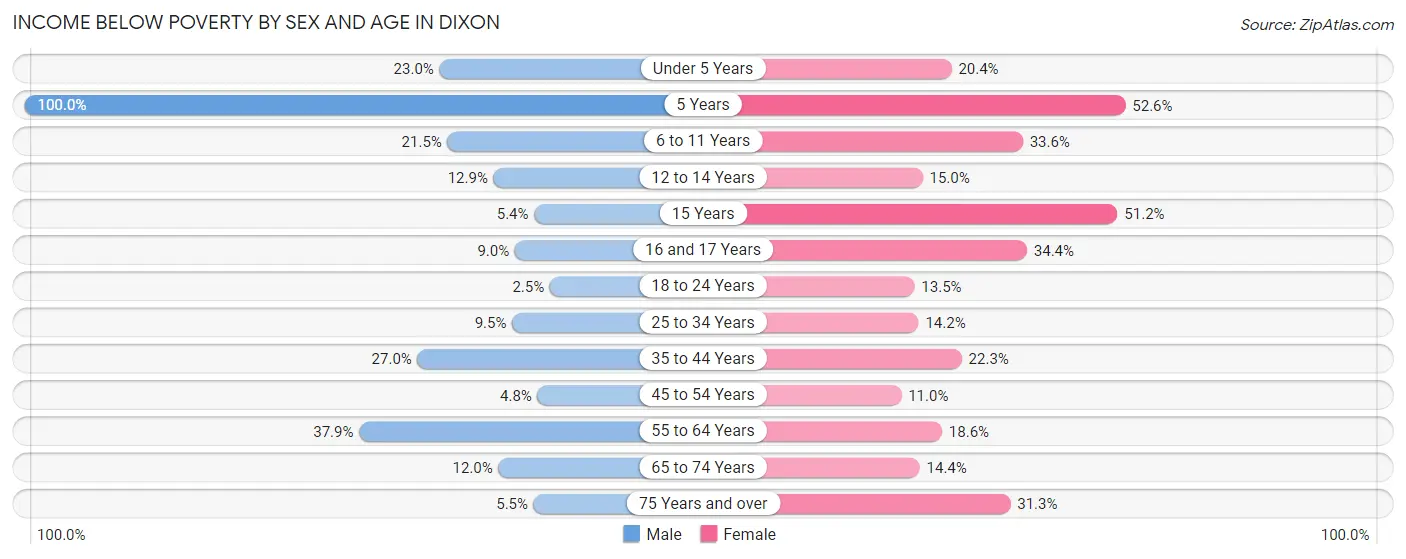
| Age Bracket | Male | Female |
| Under 5 Years | 90 (23.0%) | 58 (20.3%) |
| 5 Years | 32 (100.0%) | 20 (52.6%) |
| 6 to 11 Years | 140 (21.5%) | 92 (33.6%) |
| 12 to 14 Years | 46 (12.9%) | 43 (15.0%) |
| 15 Years | 7 (5.4%) | 22 (51.2%) |
| 16 and 17 Years | 25 (9.0%) | 79 (34.4%) |
| 18 to 24 Years | 9 (2.5%) | 60 (13.5%) |
| 25 to 34 Years | 90 (9.5%) | 136 (14.2%) |
| 35 to 44 Years | 182 (27.0%) | 184 (22.3%) |
| 45 to 54 Years | 36 (4.8%) | 76 (11.0%) |
| 55 to 64 Years | 376 (37.9%) | 199 (18.6%) |
| 65 to 74 Years | 67 (12.0%) | 91 (14.4%) |
| 75 Years and over | 17 (5.5%) | 257 (31.3%) |
| Total | 1,117 (17.3%) | 1,317 (20.0%) |
Income Above Poverty by Sex and Age in Dixon
According to the poverty statistics in Dixon, males aged 18 to 24 years and females aged 45 to 54 years are the age groups that are most secure financially, with 97.5% of males and 89.0% of females in these age groups living above the poverty line.
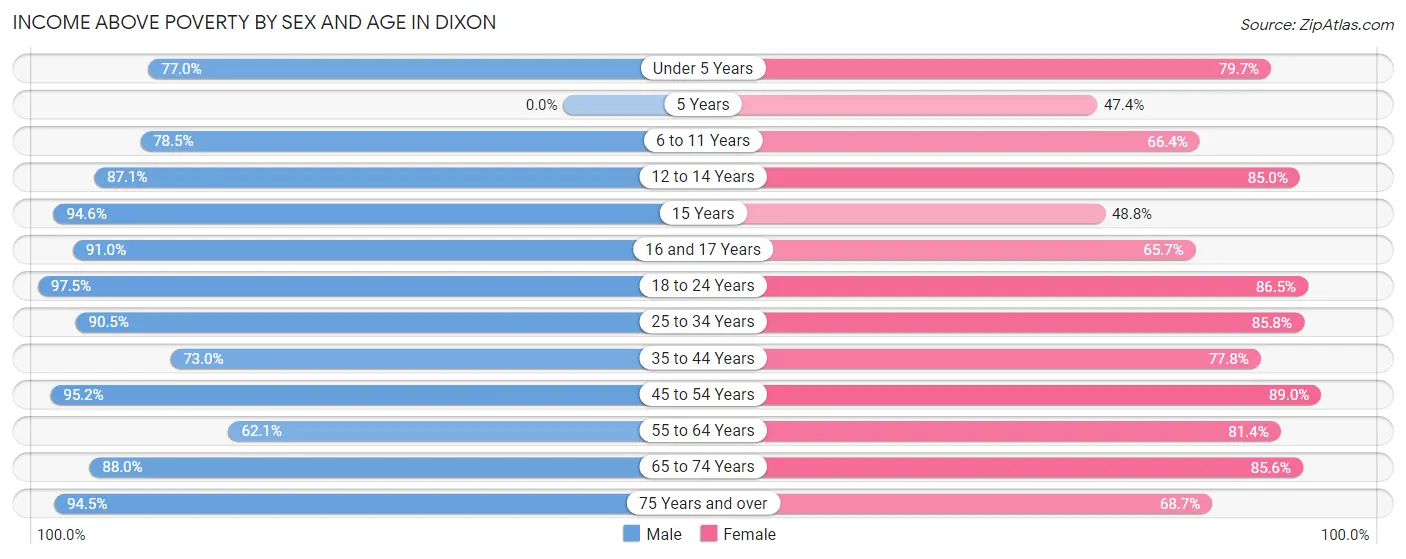
| Age Bracket | Male | Female |
| Under 5 Years | 302 (77.0%) | 227 (79.6%) |
| 5 Years | 0 (0.0%) | 18 (47.4%) |
| 6 to 11 Years | 512 (78.5%) | 182 (66.4%) |
| 12 to 14 Years | 310 (87.1%) | 244 (85.0%) |
| 15 Years | 123 (94.6%) | 21 (48.8%) |
| 16 and 17 Years | 254 (91.0%) | 151 (65.6%) |
| 18 to 24 Years | 355 (97.5%) | 385 (86.5%) |
| 25 to 34 Years | 859 (90.5%) | 819 (85.8%) |
| 35 to 44 Years | 491 (73.0%) | 643 (77.7%) |
| 45 to 54 Years | 719 (95.2%) | 613 (89.0%) |
| 55 to 64 Years | 617 (62.1%) | 872 (81.4%) |
| 65 to 74 Years | 490 (88.0%) | 539 (85.6%) |
| 75 Years and over | 294 (94.5%) | 565 (68.7%) |
| Total | 5,326 (82.7%) | 5,279 (80.0%) |
Income Below Poverty Among Married-Couple Families in Dixon
The poverty statistics for married-couple families in Dixon show that 1.3% or 27 of the total 2,069 families live below the poverty line. Families with 1 or 2 children have the highest poverty rate of 4.0%, comprising of 27 families. On the other hand, families with no children have the lowest poverty rate of 0.0%, which includes 0 families.
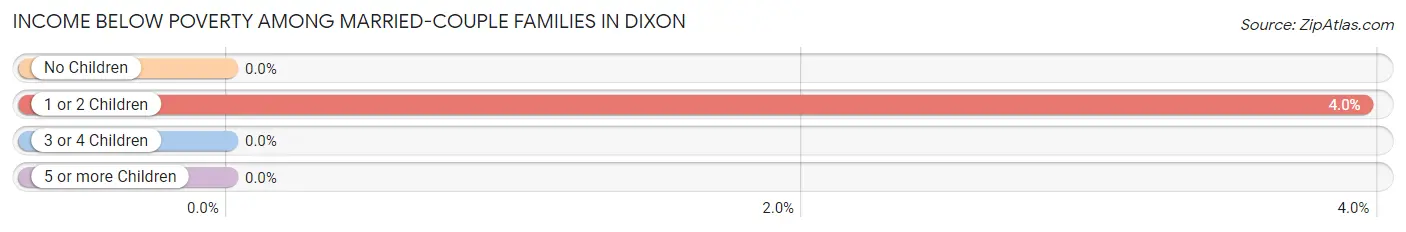
| Children | Above Poverty | Below Poverty |
| No Children | 1,255 (100.0%) | 0 (0.0%) |
| 1 or 2 Children | 656 (96.1%) | 27 (4.0%) |
| 3 or 4 Children | 131 (100.0%) | 0 (0.0%) |
| 5 or more Children | 0 (0.0%) | 0 (0.0%) |
| Total | 2,042 (98.7%) | 27 (1.3%) |
Income Below Poverty Among Single-Parent Households in Dixon
According to the poverty data in Dixon, 39.3% or 92 single-father households and 29.3% or 254 single-mother households are living below the poverty line. Among single-father households, those with 1 or 2 children have the highest poverty rate, with 92 households (53.8%) experiencing poverty. Likewise, among single-mother households, those with 3 or 4 children have the highest poverty rate, with 144 households (100.0%) falling below the poverty line.
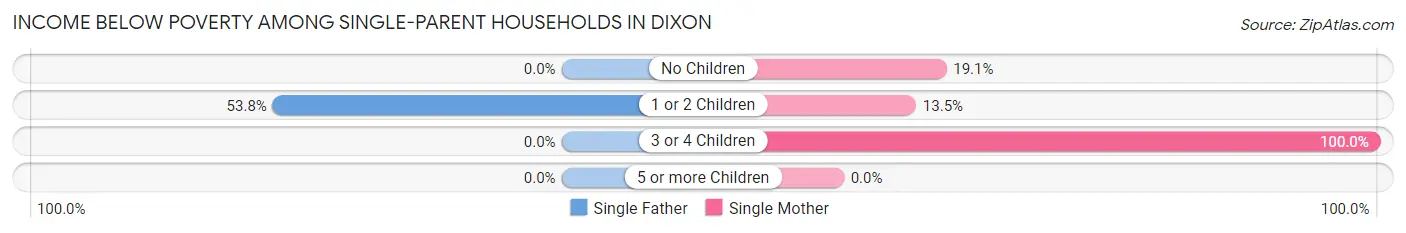
| Children | Single Father | Single Mother |
| No Children | 0 (0.0%) | 43 (19.1%) |
| 1 or 2 Children | 92 (53.8%) | 67 (13.5%) |
| 3 or 4 Children | 0 (0.0%) | 144 (100.0%) |
| 5 or more Children | 0 (0.0%) | 0 (0.0%) |
| Total | 92 (39.3%) | 254 (29.3%) |
Income Below Poverty Among Married-Couple vs Single-Parent Households in Dixon
The poverty data for Dixon shows that 27 of the married-couple family households (1.3%) and 346 of the single-parent households (31.4%) are living below the poverty level. Within the married-couple family households, those with 1 or 2 children have the highest poverty rate, with 27 households (4.0%) falling below the poverty line. Among the single-parent households, those with 3 or 4 children have the highest poverty rate, with 144 household (91.1%) living below poverty.
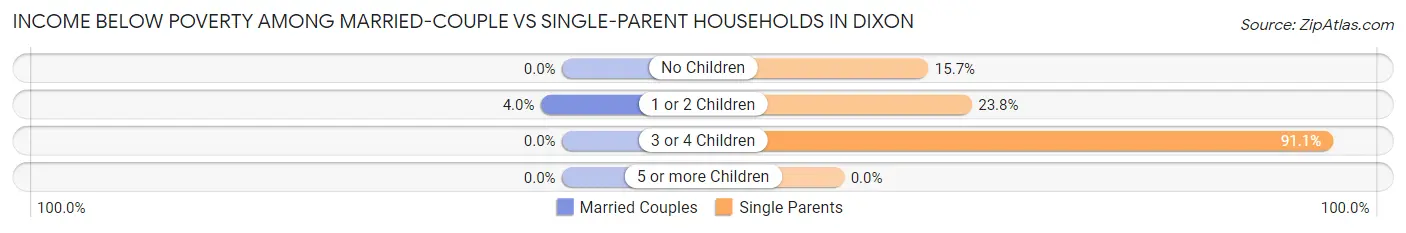
| Children | Married-Couple Families | Single-Parent Households |
| No Children | 0 (0.0%) | 43 (15.7%) |
| 1 or 2 Children | 27 (4.0%) | 159 (23.8%) |
| 3 or 4 Children | 0 (0.0%) | 144 (91.1%) |
| 5 or more Children | 0 (0.0%) | 0 (0.0%) |
| Total | 27 (1.3%) | 346 (31.4%) |
Race in Dixon
The most populous races in Dixon are White / Caucasian (12,849 | 82.5%), Black / African American (1,582 | 10.2%), and Hispanic or Latino (1,198 | 7.7%).
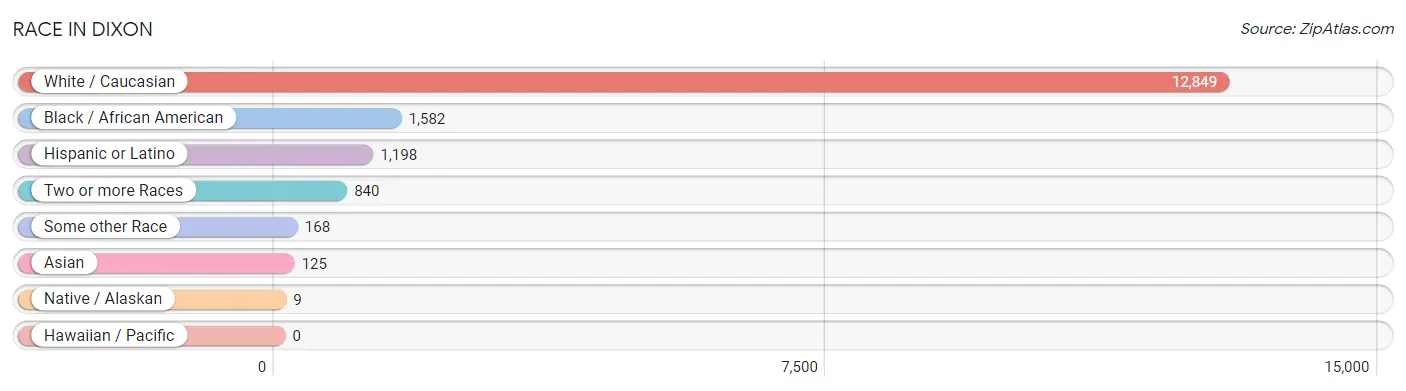
| Race | # Population | % Population |
| Asian | 125 | 0.8% |
| Black / African American | 1,582 | 10.2% |
| Hawaiian / Pacific | 0 | 0.0% |
| Hispanic or Latino | 1,198 | 7.7% |
| Native / Alaskan | 9 | 0.1% |
| White / Caucasian | 12,849 | 82.5% |
| Two or more Races | 840 | 5.4% |
| Some other Race | 168 | 1.1% |
| Total | 15,573 | 100.0% |
Ancestry in Dixon
The most populous ancestries reported in Dixon are German (4,648 | 29.8%), Irish (2,304 | 14.8%), English (1,568 | 10.1%), Mexican (777 | 5.0%), and American (661 | 4.2%), together accounting for 63.9% of all Dixon residents.
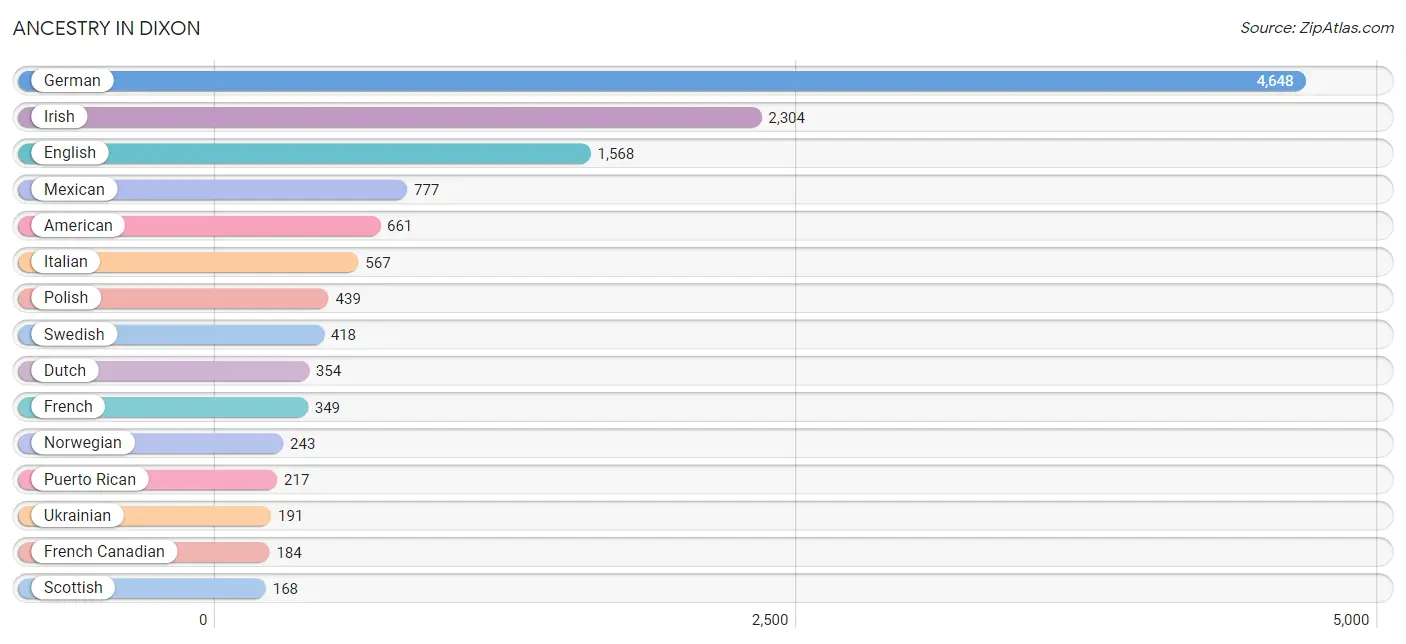
| Ancestry | # Population | % Population |
| African | 13 | 0.1% |
| American | 661 | 4.2% |
| Arab | 20 | 0.1% |
| Argentinean | 7 | 0.0% |
| Australian | 4 | 0.0% |
| Belgian | 93 | 0.6% |
| Bhutanese | 26 | 0.2% |
| British | 119 | 0.8% |
| Bulgarian | 43 | 0.3% |
| Burmese | 11 | 0.1% |
| Cambodian | 3 | 0.0% |
| Canadian | 8 | 0.1% |
| Central American | 29 | 0.2% |
| Central American Indian | 16 | 0.1% |
| Cherokee | 5 | 0.0% |
| Colombian | 28 | 0.2% |
| Croatian | 15 | 0.1% |
| Czech | 93 | 0.6% |
| Danish | 32 | 0.2% |
| Dutch | 354 | 2.3% |
| Eastern European | 74 | 0.5% |
| English | 1,568 | 10.1% |
| European | 110 | 0.7% |
| French | 349 | 2.2% |
| French Canadian | 184 | 1.2% |
| German | 4,648 | 29.8% |
| Greek | 62 | 0.4% |
| Haitian | 7 | 0.0% |
| Hungarian | 120 | 0.8% |
| Indian (Asian) | 16 | 0.1% |
| Irish | 2,304 | 14.8% |
| Italian | 567 | 3.6% |
| Jamaican | 9 | 0.1% |
| Korean | 92 | 0.6% |
| Lebanese | 8 | 0.1% |
| Mexican | 777 | 5.0% |
| Northern European | 9 | 0.1% |
| Norwegian | 243 | 1.6% |
| Palestinian | 12 | 0.1% |
| Pennsylvania German | 33 | 0.2% |
| Polish | 439 | 2.8% |
| Pueblo | 16 | 0.1% |
| Puerto Rican | 217 | 1.4% |
| Russian | 15 | 0.1% |
| Salvadoran | 29 | 0.2% |
| Scotch-Irish | 103 | 0.7% |
| Scottish | 168 | 1.1% |
| Serbian | 16 | 0.1% |
| Sioux | 48 | 0.3% |
| Slovak | 16 | 0.1% |
| South American | 35 | 0.2% |
| Spanish American Indian | 11 | 0.1% |
| Subsaharan African | 13 | 0.1% |
| Swedish | 418 | 2.7% |
| Swiss | 76 | 0.5% |
| Thai | 56 | 0.4% |
| Ukrainian | 191 | 1.2% |
| Welsh | 60 | 0.4% | View All 58 Rows |
Immigrants in Dixon
The most numerous immigrant groups reported in Dixon came from Latin America (264 | 1.7%), Central America (248 | 1.6%), Mexico (204 | 1.3%), Asia (125 | 0.8%), and Europe (75 | 0.5%), together accounting for 5.9% of all Dixon residents.
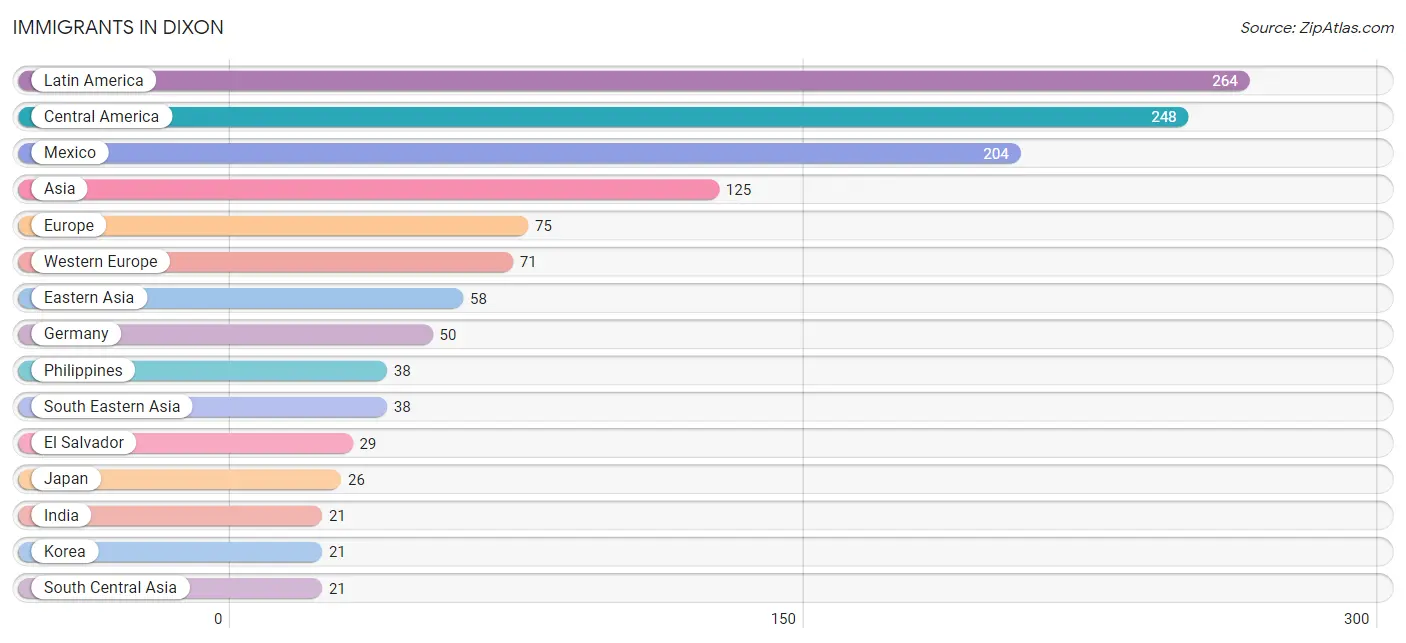
| Immigration Origin | # Population | % Population |
| Argentina | 7 | 0.0% |
| Asia | 125 | 0.8% |
| Australia | 4 | 0.0% |
| Canada | 13 | 0.1% |
| Caribbean | 4 | 0.0% |
| Central America | 248 | 1.6% |
| China | 11 | 0.1% |
| Colombia | 5 | 0.0% |
| Eastern Asia | 58 | 0.4% |
| Eastern Europe | 4 | 0.0% |
| El Salvador | 29 | 0.2% |
| Europe | 75 | 0.5% |
| France | 7 | 0.0% |
| Germany | 50 | 0.3% |
| Guatemala | 15 | 0.1% |
| India | 21 | 0.1% |
| Jamaica | 4 | 0.0% |
| Japan | 26 | 0.2% |
| Korea | 21 | 0.1% |
| Latin America | 264 | 1.7% |
| Mexico | 204 | 1.3% |
| Oceania | 4 | 0.0% |
| Philippines | 38 | 0.2% |
| Saudi Arabia | 8 | 0.1% |
| South America | 12 | 0.1% |
| South Central Asia | 21 | 0.1% |
| South Eastern Asia | 38 | 0.2% |
| Switzerland | 14 | 0.1% |
| Ukraine | 4 | 0.0% |
| Western Asia | 8 | 0.1% |
| Western Europe | 71 | 0.5% | View All 31 Rows |
Sex and Age in Dixon
Sex and Age in Dixon
The most populous age groups in Dixon are 55 to 59 Years (859 | 9.8%) for men and 60 to 64 Years (567 | 8.4%) for women.
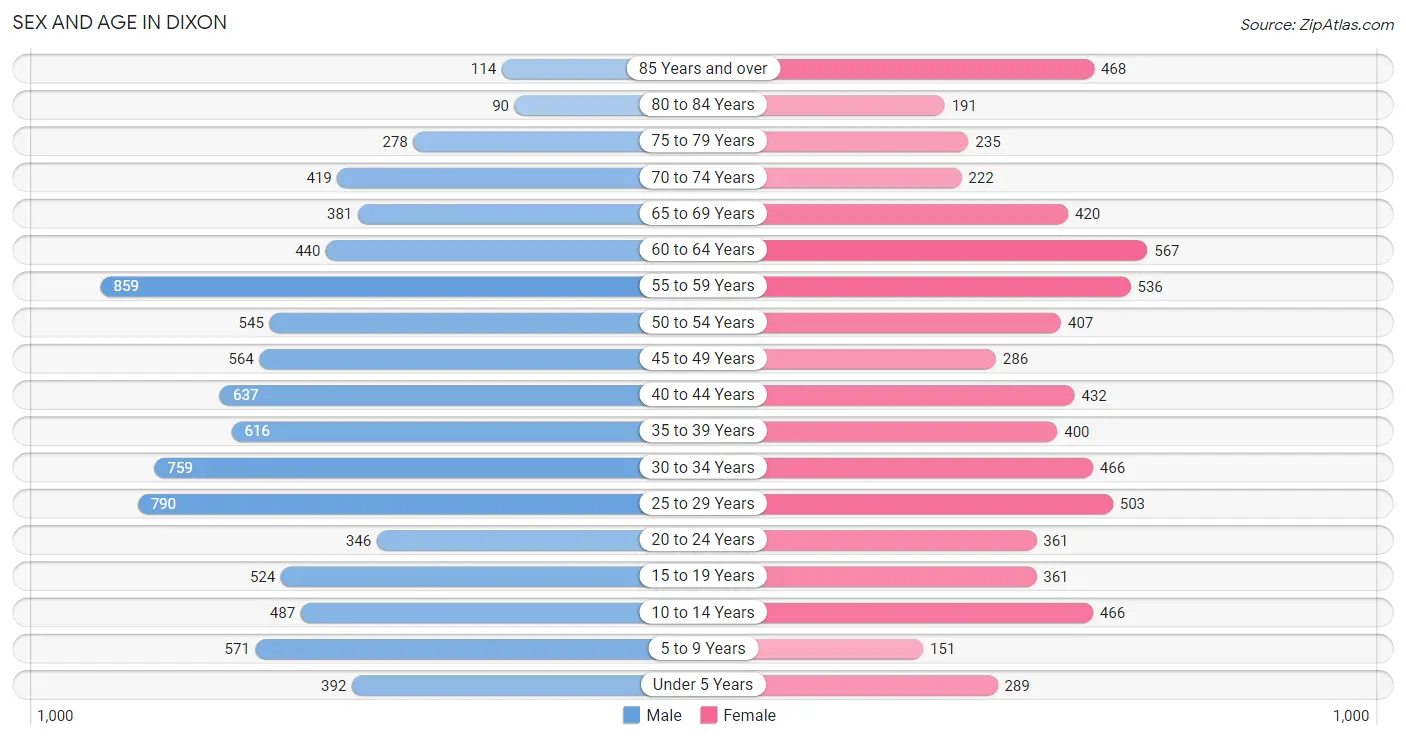
| Age Bracket | Male | Female |
| Under 5 Years | 392 (4.4%) | 289 (4.3%) |
| 5 to 9 Years | 571 (6.5%) | 151 (2.2%) |
| 10 to 14 Years | 487 (5.5%) | 466 (6.9%) |
| 15 to 19 Years | 524 (5.9%) | 361 (5.3%) |
| 20 to 24 Years | 346 (3.9%) | 361 (5.3%) |
| 25 to 29 Years | 790 (9.0%) | 503 (7.4%) |
| 30 to 34 Years | 759 (8.6%) | 466 (6.9%) |
| 35 to 39 Years | 616 (7.0%) | 400 (5.9%) |
| 40 to 44 Years | 637 (7.2%) | 432 (6.4%) |
| 45 to 49 Years | 564 (6.4%) | 286 (4.2%) |
| 50 to 54 Years | 545 (6.2%) | 407 (6.0%) |
| 55 to 59 Years | 859 (9.8%) | 536 (7.9%) |
| 60 to 64 Years | 440 (5.0%) | 567 (8.4%) |
| 65 to 69 Years | 381 (4.3%) | 420 (6.2%) |
| 70 to 74 Years | 419 (4.8%) | 222 (3.3%) |
| 75 to 79 Years | 278 (3.2%) | 235 (3.5%) |
| 80 to 84 Years | 90 (1.0%) | 191 (2.8%) |
| 85 Years and over | 114 (1.3%) | 468 (6.9%) |
| Total | 8,812 (100.0%) | 6,761 (100.0%) |
Families and Households in Dixon
Median Family Size in Dixon
The median family size in Dixon is 2.90 persons per family, with single male/father families (234 | 7.4%) accounting for the largest median family size of 3.1 persons per family. On the other hand, single female/mother families (867 | 27.4%) represent the smallest median family size with 2.67 persons per family.
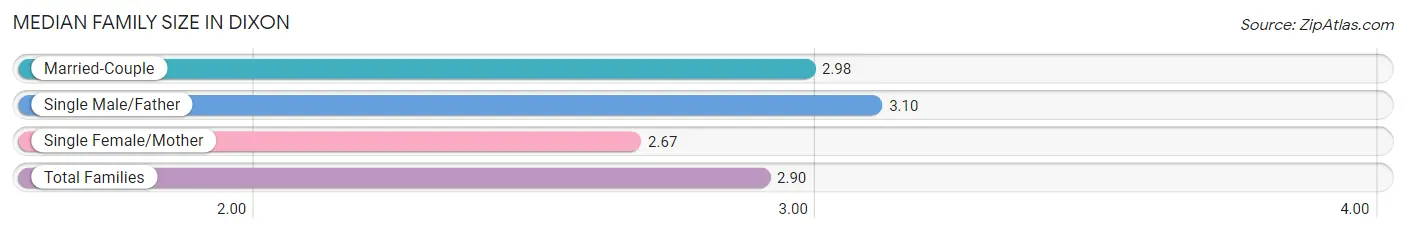
| Family Type | # Families | Family Size |
| Married-Couple | 2,069 (65.3%) | 2.98 |
| Single Male/Father | 234 (7.4%) | 3.10 |
| Single Female/Mother | 867 (27.4%) | 2.67 |
| Total Families | 3,170 (100.0%) | 2.90 |
Median Household Size in Dixon
The median household size in Dixon is 2.13 persons per household, with single male/father households (234 | 3.9%) accounting for the largest median household size of 3.55 persons per household. non-family households (2,894 | 47.7%) represent the smallest median household size with 1.14 persons per household.
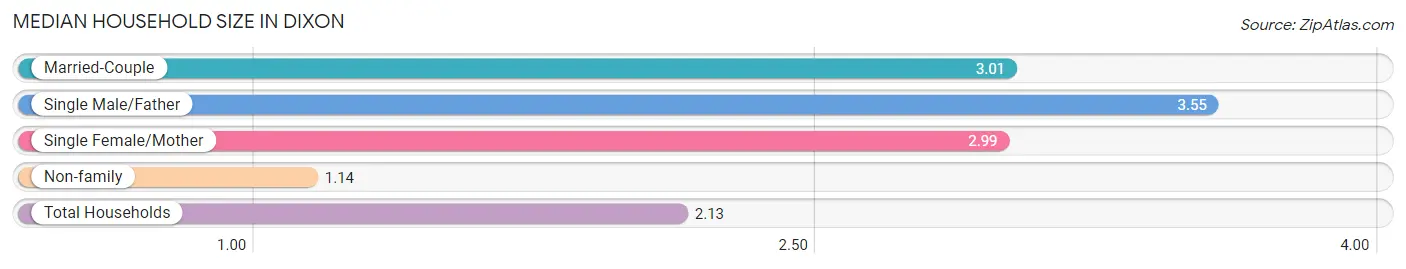
| Household Type | # Households | Household Size |
| Married-Couple | 2,069 (34.1%) | 3.01 |
| Single Male/Father | 234 (3.9%) | 3.55 |
| Single Female/Mother | 867 (14.3%) | 2.99 |
| Non-family | 2,894 (47.7%) | 1.14 |
| Total Households | 6,064 (100.0%) | 2.13 |
Household Size by Marriage Status in Dixon
Out of a total of 6,064 households in Dixon, 3,170 (52.3%) are family households, while 2,894 (47.7%) are nonfamily households. The most numerous type of family households are 2-person households, comprising 1,505, and the most common type of nonfamily households are 1-person households, comprising 2,554.
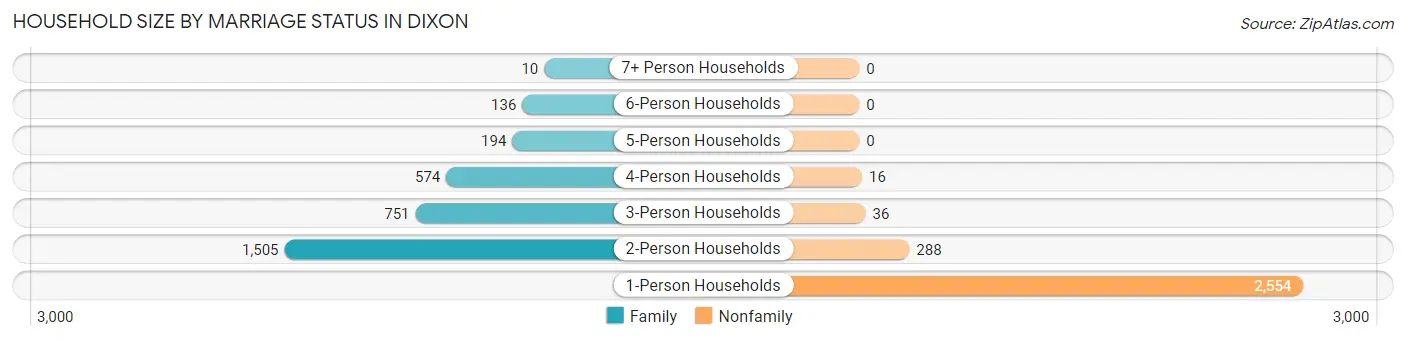
| Household Size | Family Households | Nonfamily Households |
| 1-Person Households | - | 2,554 (42.1%) |
| 2-Person Households | 1,505 (24.8%) | 288 (4.8%) |
| 3-Person Households | 751 (12.4%) | 36 (0.6%) |
| 4-Person Households | 574 (9.5%) | 16 (0.3%) |
| 5-Person Households | 194 (3.2%) | 0 (0.0%) |
| 6-Person Households | 136 (2.2%) | 0 (0.0%) |
| 7+ Person Households | 10 (0.2%) | 0 (0.0%) |
| Total | 3,170 (52.3%) | 2,894 (47.7%) |
Female Fertility in Dixon
Fertility by Age in Dixon
Average fertility rate in Dixon is 38.0 births per 1,000 women. Women in the age bracket of 20 to 34 years have the highest fertility rate with 76.0 births per 1,000 women. Women in the age bracket of 20 to 34 years acount for 92.7% of all women with births.
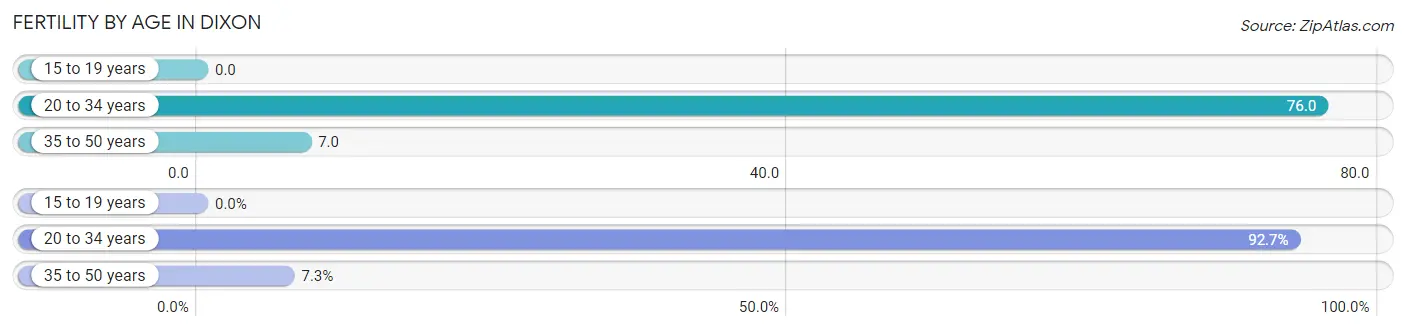
| Age Bracket | Women with Births | Births / 1,000 Women |
| 15 to 19 years | 0 (0.0%) | 0.0 |
| 20 to 34 years | 101 (92.7%) | 76.0 |
| 35 to 50 years | 8 (7.3%) | 7.0 |
| Total | 109 (100.0%) | 38.0 |
Fertility by Age by Marriage Status in Dixon
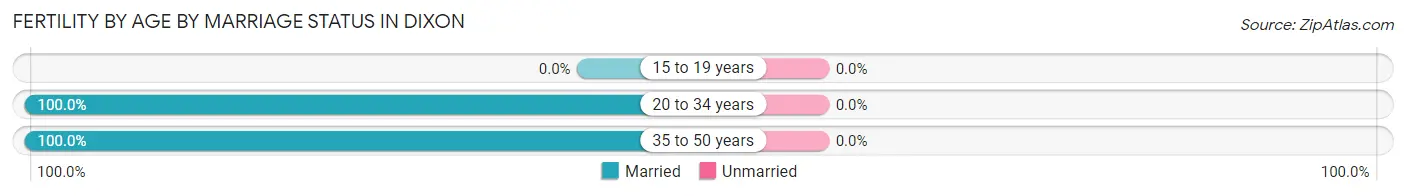
| Age Bracket | Married | Unmarried |
| 15 to 19 years | 0 (0.0%) | 0 (0.0%) |
| 20 to 34 years | 101 (100.0%) | 0 (0.0%) |
| 35 to 50 years | 8 (100.0%) | 0 (0.0%) |
| Total | 109 (100.0%) | 0 (0.0%) |
Fertility by Education in Dixon
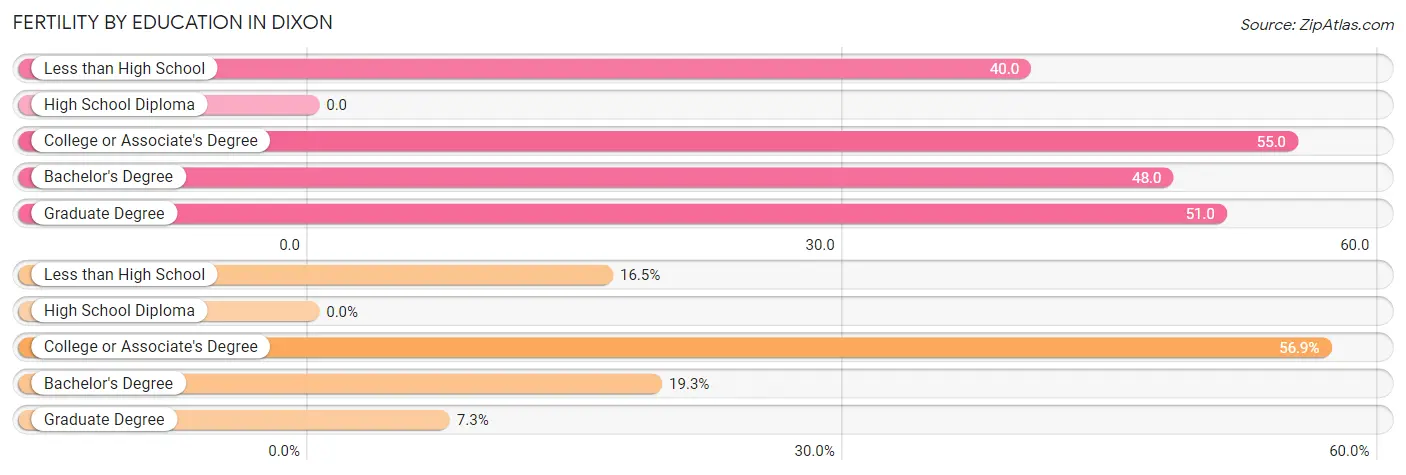
| Educational Attainment | Women with Births | Births / 1,000 Women |
| Less than High School | 18 (16.5%) | 40.0 |
| High School Diploma | 0 (0.0%) | 0.0 |
| College or Associate's Degree | 62 (56.9%) | 55.0 |
| Bachelor's Degree | 21 (19.3%) | 48.0 |
| Graduate Degree | 8 (7.3%) | 51.0 |
| Total | 109 (100.0%) | 38.0 |
Fertility by Education by Marriage Status in Dixon
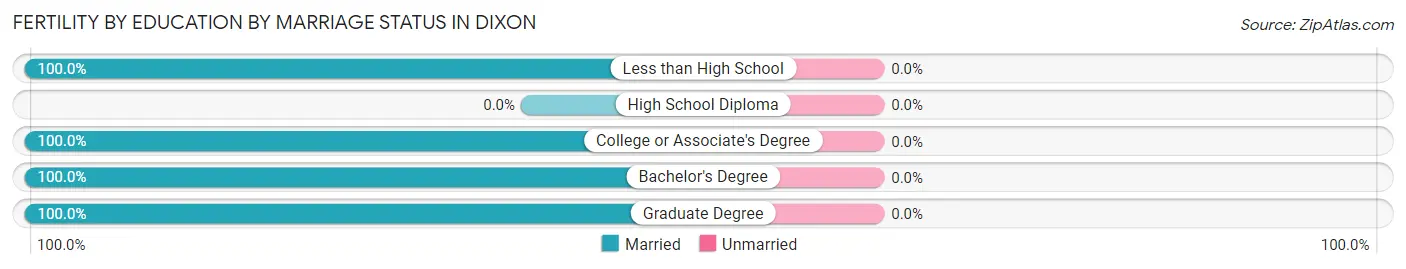
| Educational Attainment | Married | Unmarried |
| Less than High School | 18 (100.0%) | 0 (0.0%) |
| High School Diploma | 0 (0.0%) | 0 (0.0%) |
| College or Associate's Degree | 62 (100.0%) | 0 (0.0%) |
| Bachelor's Degree | 21 (100.0%) | 0 (0.0%) |
| Graduate Degree | 8 (100.0%) | 0 (0.0%) |
| Total | 109 (100.0%) | 0 (0.0%) |
Employment Characteristics in Dixon
Employment by Class of Employer in Dixon
Among the 6,292 employed individuals in Dixon, private company employees (4,150 | 66.0%), local government employees (707 | 11.2%), and not-for-profit organizations (684 | 10.9%) make up the most common classes of employment.
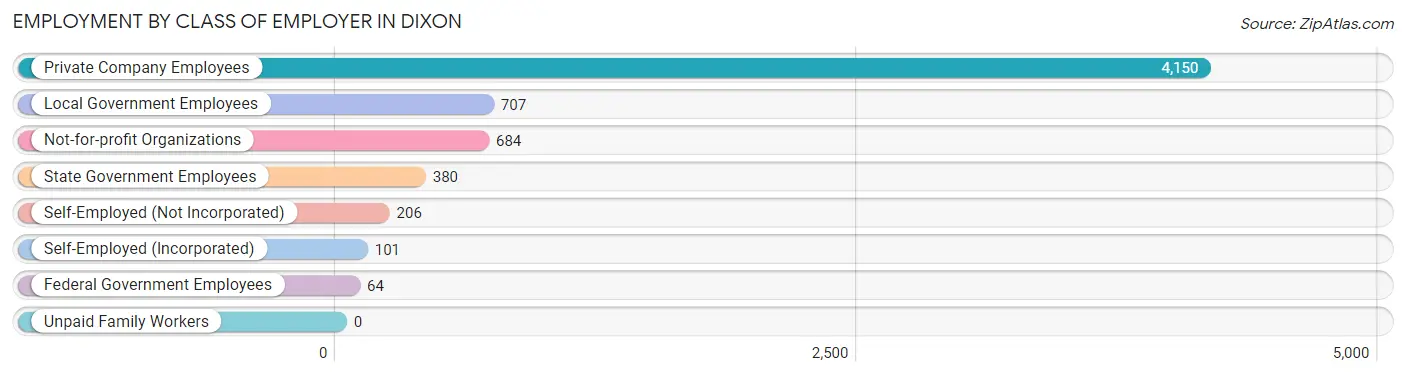
| Employer Class | # Employees | % Employees |
| Private Company Employees | 4,150 | 66.0% |
| Self-Employed (Incorporated) | 101 | 1.6% |
| Self-Employed (Not Incorporated) | 206 | 3.3% |
| Not-for-profit Organizations | 684 | 10.9% |
| Local Government Employees | 707 | 11.2% |
| State Government Employees | 380 | 6.0% |
| Federal Government Employees | 64 | 1.0% |
| Unpaid Family Workers | 0 | 0.0% |
| Total | 6,292 | 100.0% |
Employment Status by Age in Dixon
According to the labor force statistics for Dixon, out of the total population over 16 years of age (13,044), 50.0% or 6,522 individuals are in the labor force, with 2.9% or 189 of them unemployed. The age group with the highest labor force participation rate is 20 to 24 years, with 78.5% or 555 individuals in the labor force. Within the labor force, the 35 to 44 years age range has the highest percentage of unemployed individuals, with 5.7% or 70 of them being unemployed.
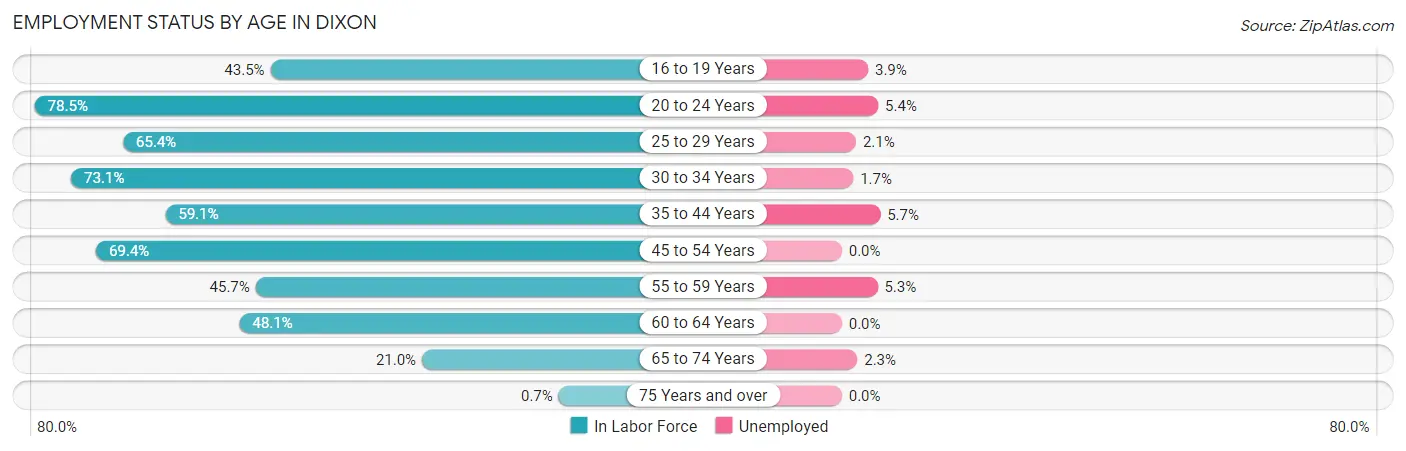
| Age Bracket | In Labor Force | Unemployed |
| 16 to 19 Years | 310 (43.5%) | 12 (3.9%) |
| 20 to 24 Years | 555 (78.5%) | 30 (5.4%) |
| 25 to 29 Years | 846 (65.4%) | 18 (2.1%) |
| 30 to 34 Years | 895 (73.1%) | 15 (1.7%) |
| 35 to 44 Years | 1,232 (59.1%) | 70 (5.7%) |
| 45 to 54 Years | 1,251 (69.4%) | 0 (0.0%) |
| 55 to 59 Years | 638 (45.7%) | 34 (5.3%) |
| 60 to 64 Years | 484 (48.1%) | 0 (0.0%) |
| 65 to 74 Years | 303 (21.0%) | 7 (2.3%) |
| 75 Years and over | 10 (0.7%) | 0 (0.0%) |
| Total | 6,522 (50.0%) | 189 (2.9%) |
Employment Status by Educational Attainment in Dixon
According to labor force statistics for Dixon, 60.7% of individuals (5,346) out of the total population between 25 and 64 years of age (8,807) are in the labor force, with 2.6% or 139 of them being unemployed. The group with the highest labor force participation rate are those with the educational attainment of bachelor's degree or higher, with 83.5% or 1,334 individuals in the labor force. Within the labor force, individuals with less than high school education have the highest percentage of unemployment, with 5.7% or 20 of them being unemployed.
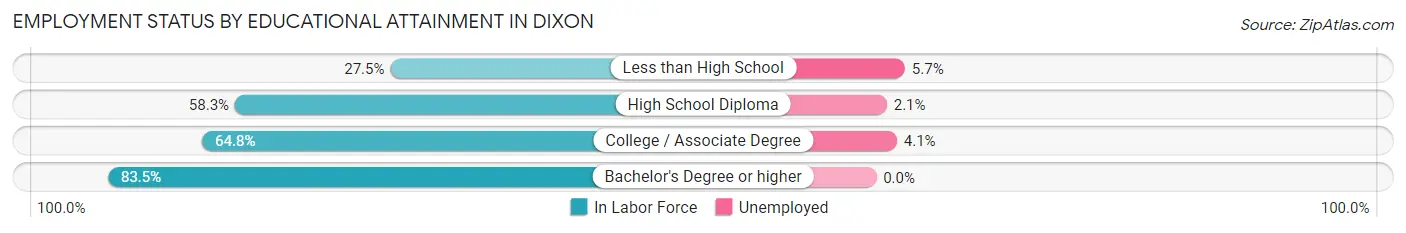
| Educational Attainment | In Labor Force | Unemployed |
| Less than High School | 353 (27.5%) | 73 (5.7%) |
| High School Diploma | 1,635 (58.3%) | 59 (2.1%) |
| College / Associate Degree | 2,023 (64.8%) | 128 (4.1%) |
| Bachelor's Degree or higher | 1,334 (83.5%) | 0 (0.0%) |
| Total | 5,346 (60.7%) | 229 (2.6%) |
Employment Occupations by Sex in Dixon
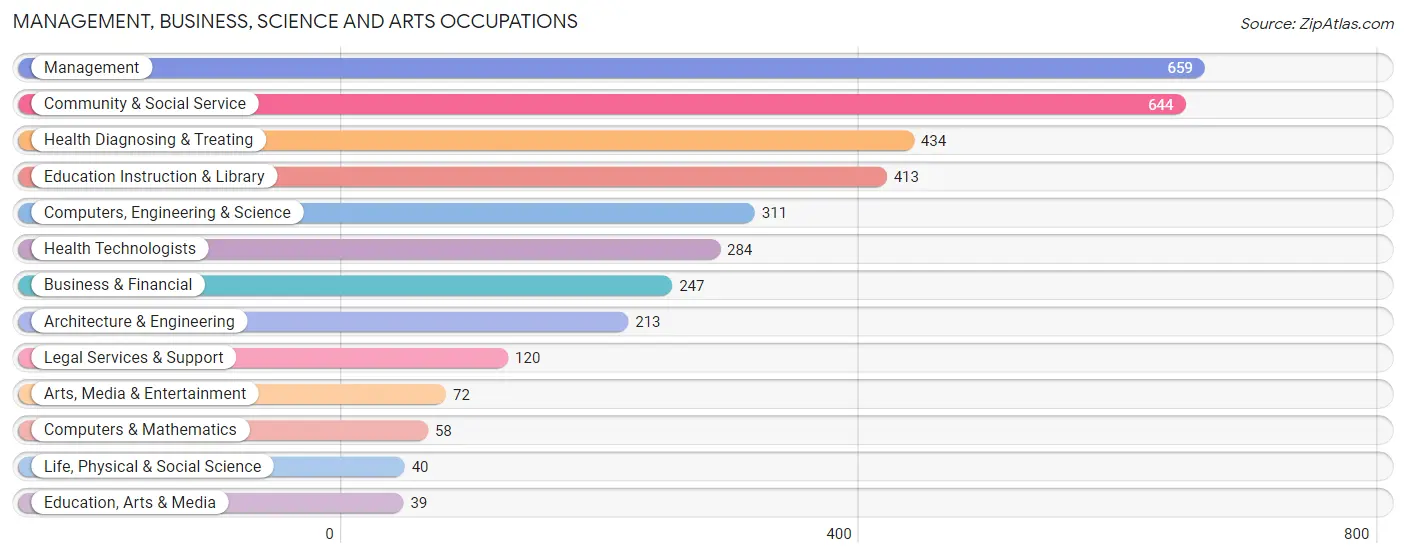
Management, Business, Science and Arts Occupations
The most common Management, Business, Science and Arts occupations in Dixon are Management (659 | 10.4%), Community & Social Service (644 | 10.2%), Health Diagnosing & Treating (434 | 6.9%), Education Instruction & Library (413 | 6.5%), and Computers, Engineering & Science (311 | 4.9%).
Management, Business, Science and Arts Occupations by Sex
Within the Management, Business, Science and Arts occupations in Dixon, the most male-oriented occupations are Computers & Mathematics (84.5%), Life, Physical & Social Science (80.0%), and Computers, Engineering & Science (71.1%), while the most female-oriented occupations are Arts, Media & Entertainment (100.0%), Education Instruction & Library (80.1%), and Community & Social Service (71.4%).
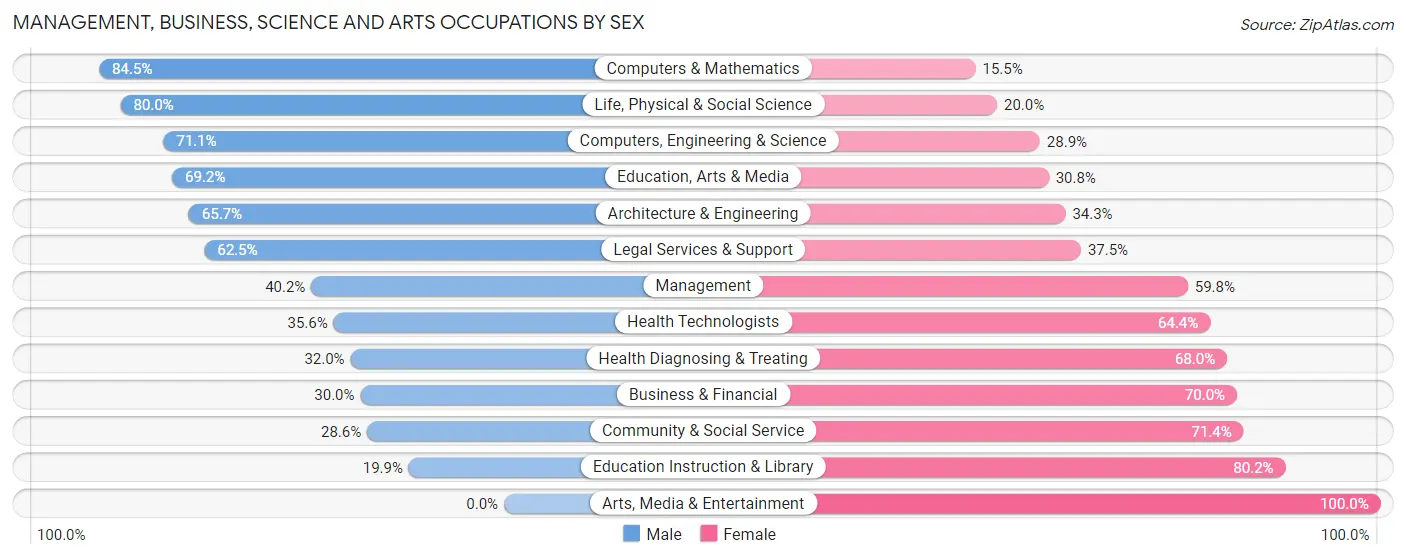
| Occupation | Male | Female |
| Management | 265 (40.2%) | 394 (59.8%) |
| Business & Financial | 74 (30.0%) | 173 (70.0%) |
| Computers, Engineering & Science | 221 (71.1%) | 90 (28.9%) |
| Computers & Mathematics | 49 (84.5%) | 9 (15.5%) |
| Architecture & Engineering | 140 (65.7%) | 73 (34.3%) |
| Life, Physical & Social Science | 32 (80.0%) | 8 (20.0%) |
| Community & Social Service | 184 (28.6%) | 460 (71.4%) |
| Education, Arts & Media | 27 (69.2%) | 12 (30.8%) |
| Legal Services & Support | 75 (62.5%) | 45 (37.5%) |
| Education Instruction & Library | 82 (19.9%) | 331 (80.1%) |
| Arts, Media & Entertainment | 0 (0.0%) | 72 (100.0%) |
| Health Diagnosing & Treating | 139 (32.0%) | 295 (68.0%) |
| Health Technologists | 101 (35.6%) | 183 (64.4%) |
| Total (Category) | 883 (38.5%) | 1,412 (61.5%) |
| Total (Overall) | 2,958 (46.7%) | 3,377 (53.3%) |
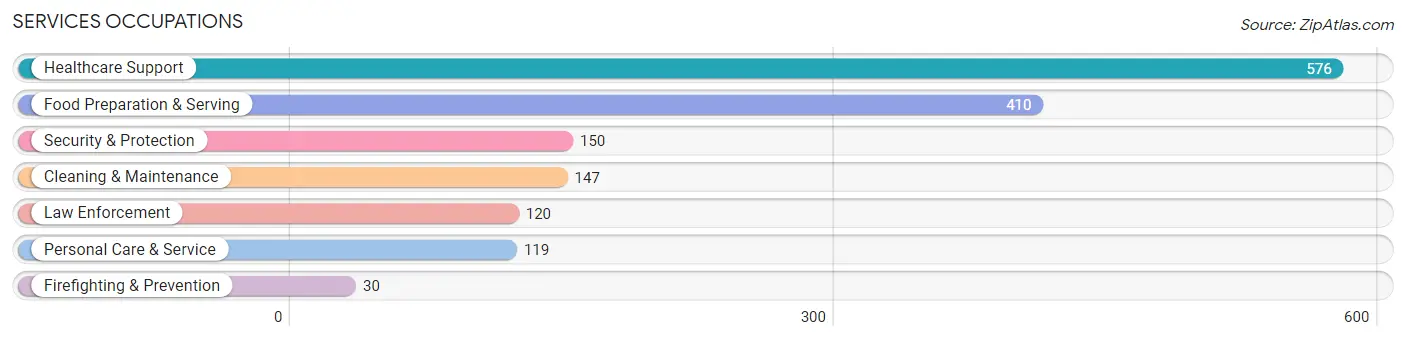
Services Occupations
The most common Services occupations in Dixon are Healthcare Support (576 | 9.1%), Food Preparation & Serving (410 | 6.5%), Security & Protection (150 | 2.4%), Cleaning & Maintenance (147 | 2.3%), and Law Enforcement (120 | 1.9%).
Services Occupations by Sex
Within the Services occupations in Dixon, the most male-oriented occupations are Firefighting & Prevention (100.0%), Security & Protection (98.0%), and Law Enforcement (97.5%), while the most female-oriented occupations are Personal Care & Service (100.0%), Healthcare Support (88.5%), and Food Preparation & Serving (70.0%).
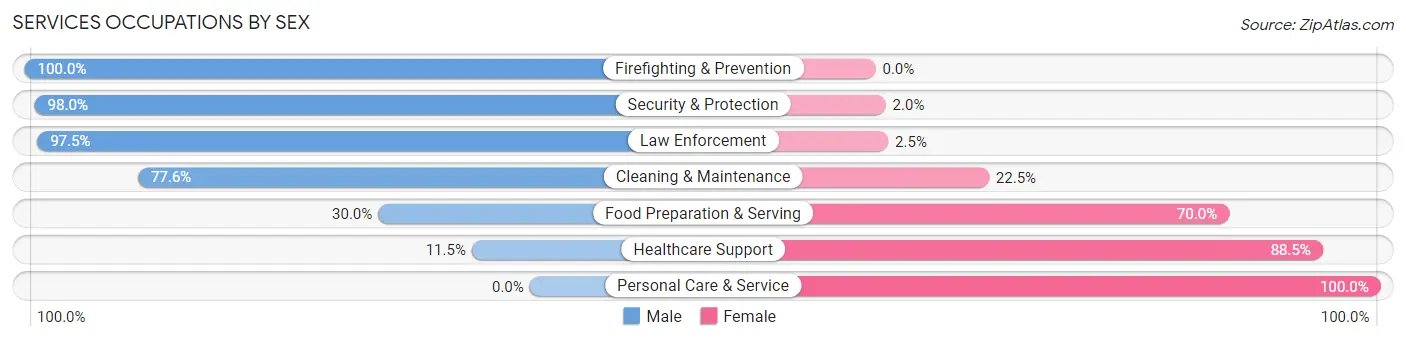
| Occupation | Male | Female |
| Healthcare Support | 66 (11.5%) | 510 (88.5%) |
| Security & Protection | 147 (98.0%) | 3 (2.0%) |
| Firefighting & Prevention | 30 (100.0%) | 0 (0.0%) |
| Law Enforcement | 117 (97.5%) | 3 (2.5%) |
| Food Preparation & Serving | 123 (30.0%) | 287 (70.0%) |
| Cleaning & Maintenance | 114 (77.5%) | 33 (22.5%) |
| Personal Care & Service | 0 (0.0%) | 119 (100.0%) |
| Total (Category) | 450 (32.1%) | 952 (67.9%) |
| Total (Overall) | 2,958 (46.7%) | 3,377 (53.3%) |
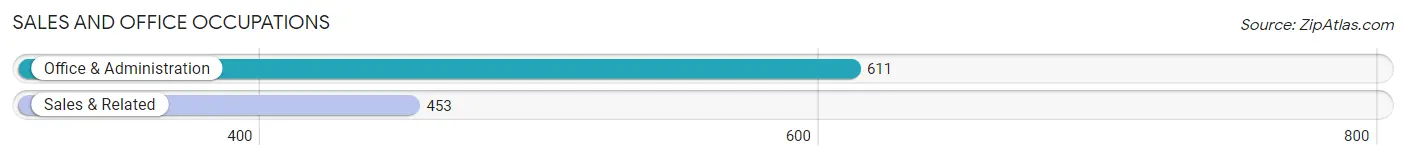
Sales and Office Occupations
The most common Sales and Office occupations in Dixon are Office & Administration (611 | 9.6%), and Sales & Related (453 | 7.1%).
Sales and Office Occupations by Sex
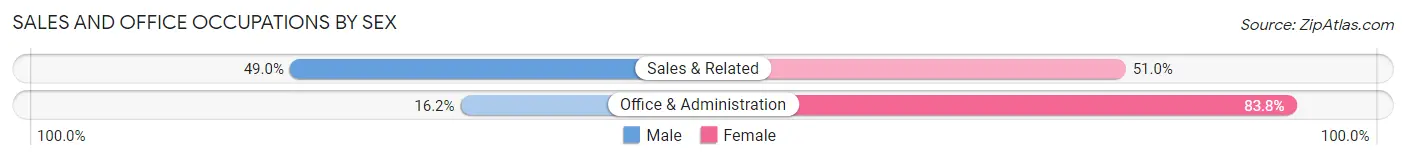
| Occupation | Male | Female |
| Sales & Related | 222 (49.0%) | 231 (51.0%) |
| Office & Administration | 99 (16.2%) | 512 (83.8%) |
| Total (Category) | 321 (30.2%) | 743 (69.8%) |
| Total (Overall) | 2,958 (46.7%) | 3,377 (53.3%) |
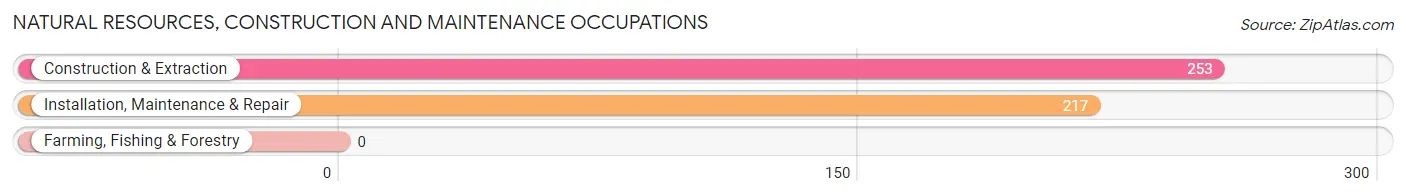
Natural Resources, Construction and Maintenance Occupations
The most common Natural Resources, Construction and Maintenance occupations in Dixon are Construction & Extraction (253 | 4.0%), and Installation, Maintenance & Repair (217 | 3.4%).
Natural Resources, Construction and Maintenance Occupations by Sex
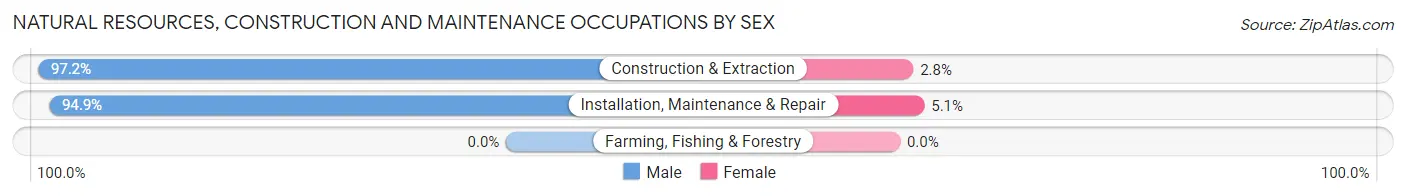
| Occupation | Male | Female |
| Farming, Fishing & Forestry | 0 (0.0%) | 0 (0.0%) |
| Construction & Extraction | 246 (97.2%) | 7 (2.8%) |
| Installation, Maintenance & Repair | 206 (94.9%) | 11 (5.1%) |
| Total (Category) | 452 (96.2%) | 18 (3.8%) |
| Total (Overall) | 2,958 (46.7%) | 3,377 (53.3%) |
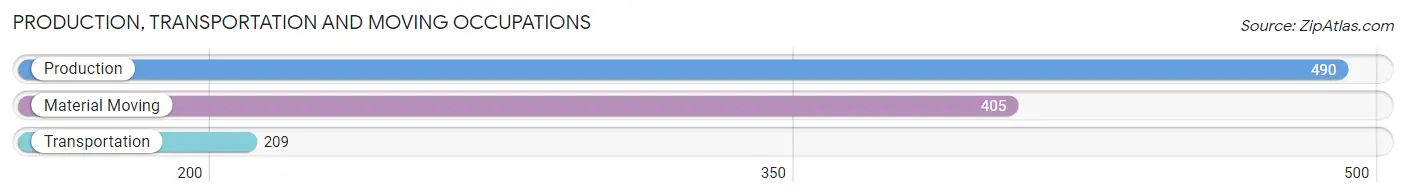
Production, Transportation and Moving Occupations
The most common Production, Transportation and Moving occupations in Dixon are Production (490 | 7.7%), Material Moving (405 | 6.4%), and Transportation (209 | 3.3%).
Production, Transportation and Moving Occupations by Sex
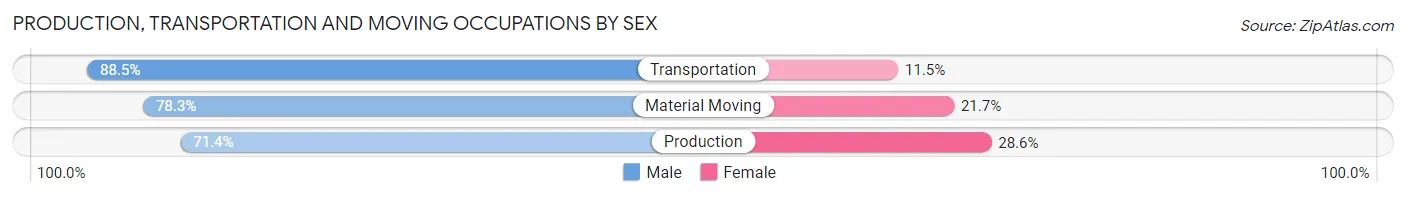
| Occupation | Male | Female |
| Production | 350 (71.4%) | 140 (28.6%) |
| Transportation | 185 (88.5%) | 24 (11.5%) |
| Material Moving | 317 (78.3%) | 88 (21.7%) |
| Total (Category) | 852 (77.2%) | 252 (22.8%) |
| Total (Overall) | 2,958 (46.7%) | 3,377 (53.3%) |
Employment Industries by Sex in Dixon
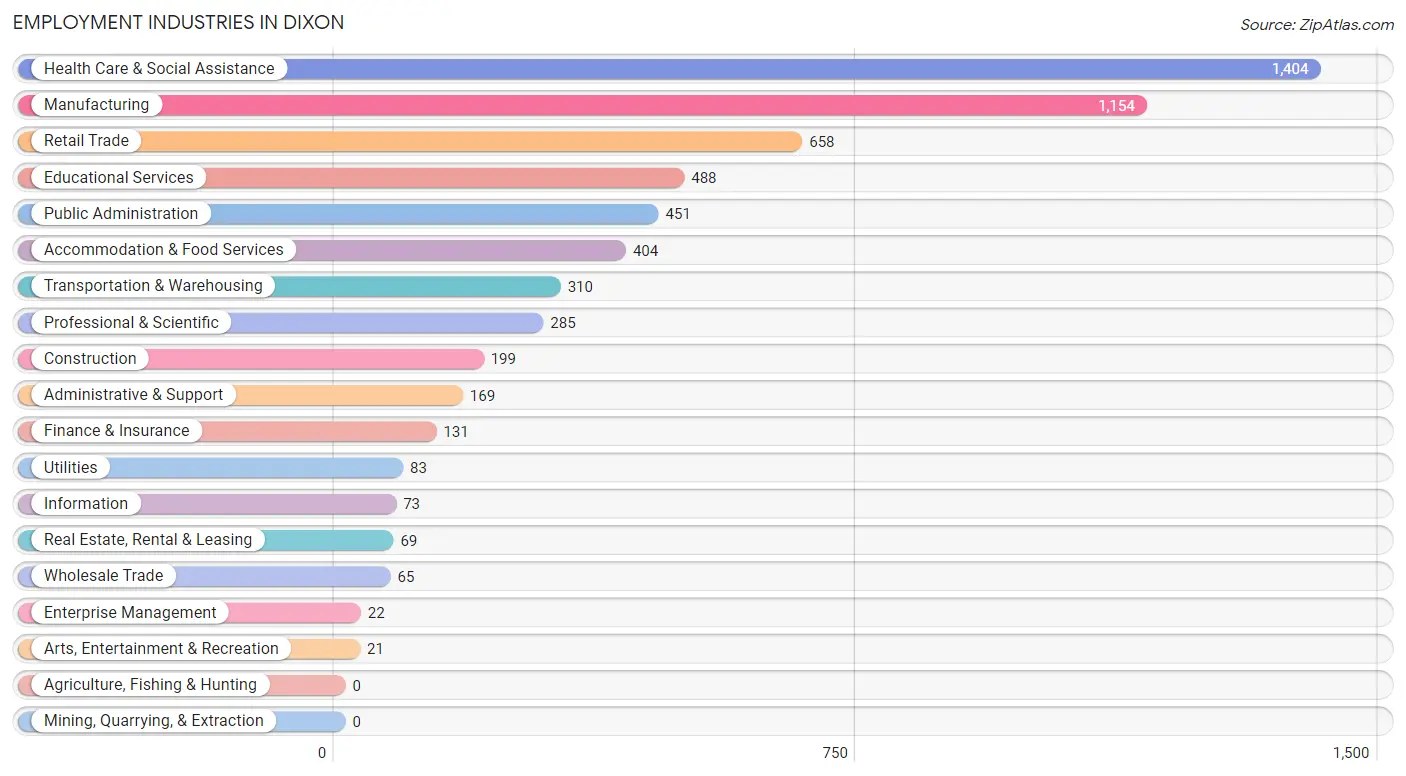
Employment Industries in Dixon
The major employment industries in Dixon include Health Care & Social Assistance (1,404 | 22.2%), Manufacturing (1,154 | 18.2%), Retail Trade (658 | 10.4%), Educational Services (488 | 7.7%), and Public Administration (451 | 7.1%).
Employment Industries by Sex in Dixon
The Dixon industries that see more men than women are Construction (92.0%), Wholesale Trade (75.4%), and Manufacturing (71.7%), whereas the industries that tend to have a higher number of women are Arts, Entertainment & Recreation (100.0%), Finance & Insurance (87.8%), and Information (87.7%).
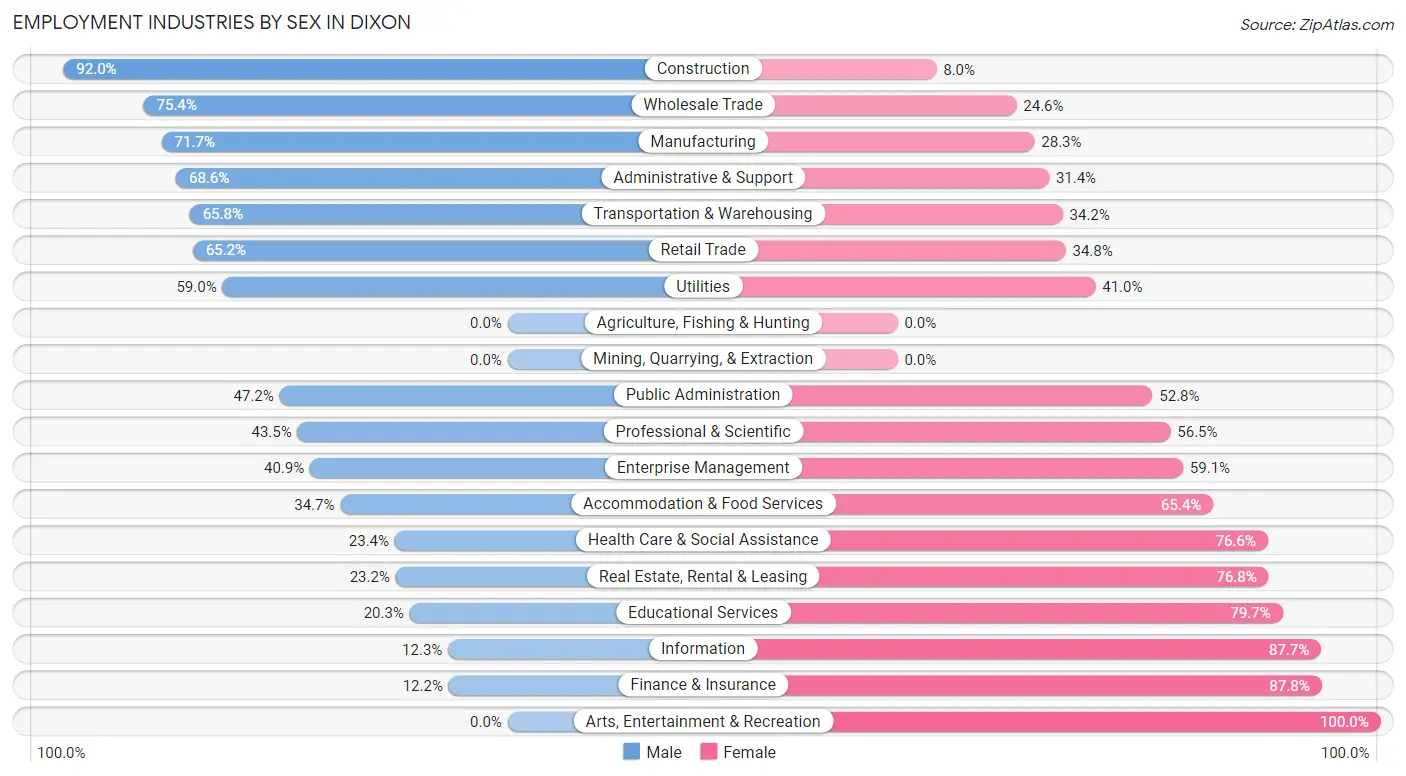
| Industry | Male | Female |
| Agriculture, Fishing & Hunting | 0 (0.0%) | 0 (0.0%) |
| Mining, Quarrying, & Extraction | 0 (0.0%) | 0 (0.0%) |
| Construction | 183 (92.0%) | 16 (8.0%) |
| Manufacturing | 827 (71.7%) | 327 (28.3%) |
| Wholesale Trade | 49 (75.4%) | 16 (24.6%) |
| Retail Trade | 429 (65.2%) | 229 (34.8%) |
| Transportation & Warehousing | 204 (65.8%) | 106 (34.2%) |
| Utilities | 49 (59.0%) | 34 (41.0%) |
| Information | 9 (12.3%) | 64 (87.7%) |
| Finance & Insurance | 16 (12.2%) | 115 (87.8%) |
| Real Estate, Rental & Leasing | 16 (23.2%) | 53 (76.8%) |
| Professional & Scientific | 124 (43.5%) | 161 (56.5%) |
| Enterprise Management | 9 (40.9%) | 13 (59.1%) |
| Administrative & Support | 116 (68.6%) | 53 (31.4%) |
| Educational Services | 99 (20.3%) | 389 (79.7%) |
| Health Care & Social Assistance | 328 (23.4%) | 1,076 (76.6%) |
| Arts, Entertainment & Recreation | 0 (0.0%) | 21 (100.0%) |
| Accommodation & Food Services | 140 (34.6%) | 264 (65.3%) |
| Public Administration | 213 (47.2%) | 238 (52.8%) |
| Total | 2,958 (46.7%) | 3,377 (53.3%) |
Education in Dixon
School Enrollment in Dixon
The most common levels of schooling among the 2,939 students in Dixon are high school (888 | 30.2%), middle school (751 | 25.6%), and elementary school (522 | 17.8%).
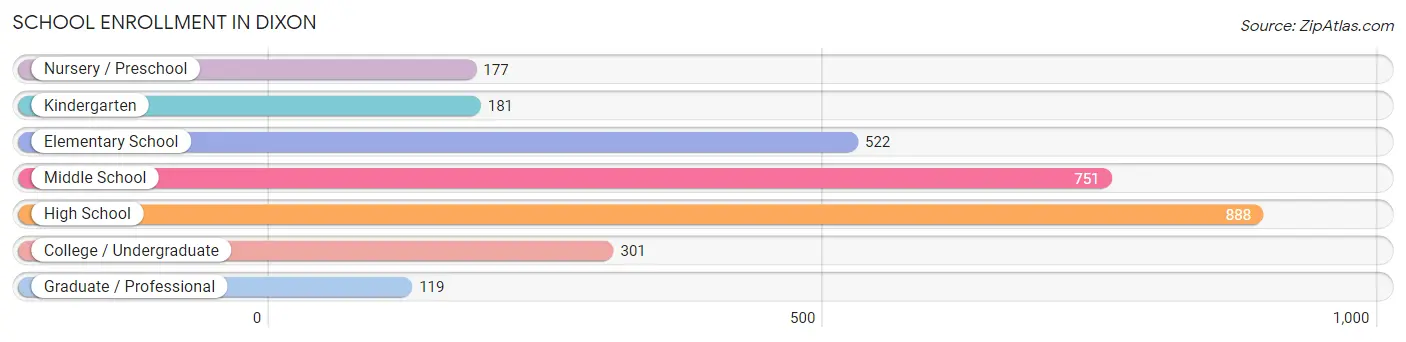
| School Level | # Students | % Students |
| Nursery / Preschool | 177 | 6.0% |
| Kindergarten | 181 | 6.2% |
| Elementary School | 522 | 17.8% |
| Middle School | 751 | 25.6% |
| High School | 888 | 30.2% |
| College / Undergraduate | 301 | 10.2% |
| Graduate / Professional | 119 | 4.1% |
| Total | 2,939 | 100.0% |
School Enrollment by Age by Funding Source in Dixon
Out of a total of 2,939 students who are enrolled in schools in Dixon, 608 (20.7%) attend a private institution, while the remaining 2,331 (79.3%) are enrolled in public schools. The age group of 18 to 19 year olds has the highest likelihood of being enrolled in private schools, with 89 (53.6% in the age bracket) enrolled. Conversely, the age group of 3 to 4 year olds has the lowest likelihood of being enrolled in a private school, with 125 (100.0% in the age bracket) attending a public institution.
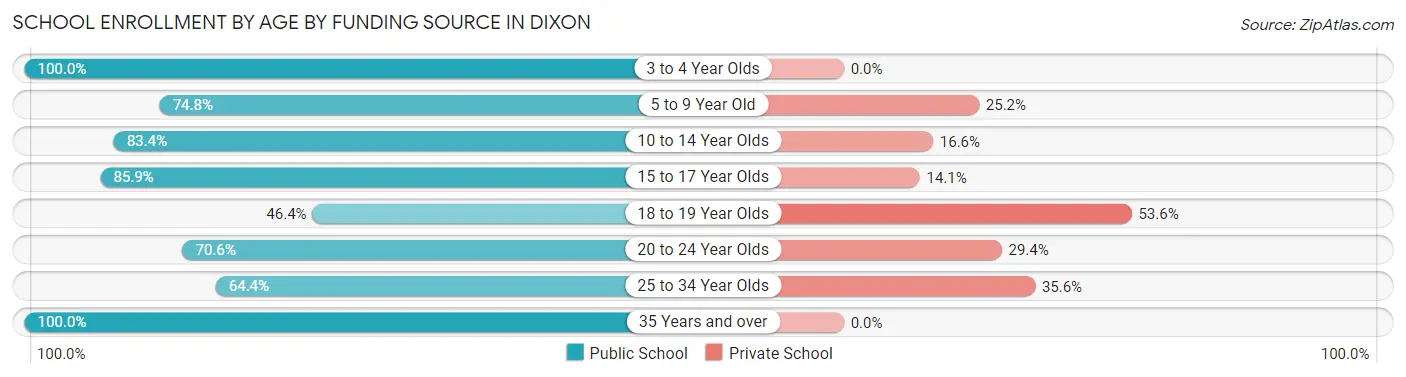
| Age Bracket | Public School | Private School |
| 3 to 4 Year Olds | 125 (100.0%) | 0 (0.0%) |
| 5 to 9 Year Old | 526 (74.8%) | 177 (25.2%) |
| 10 to 14 Year Olds | 783 (83.4%) | 156 (16.6%) |
| 15 to 17 Year Olds | 535 (85.9%) | 88 (14.1%) |
| 18 to 19 Year Olds | 77 (46.4%) | 89 (53.6%) |
| 20 to 24 Year Olds | 84 (70.6%) | 35 (29.4%) |
| 25 to 34 Year Olds | 112 (64.4%) | 62 (35.6%) |
| 35 Years and over | 90 (100.0%) | 0 (0.0%) |
| Total | 2,331 (79.3%) | 608 (20.7%) |
Educational Attainment by Field of Study in Dixon
Business (593 | 26.3%), education (351 | 15.5%), social sciences (210 | 9.3%), psychology (192 | 8.5%), and science & technology (191 | 8.5%) are the most common fields of study among 2,257 individuals in Dixon who have obtained a bachelor's degree or higher.
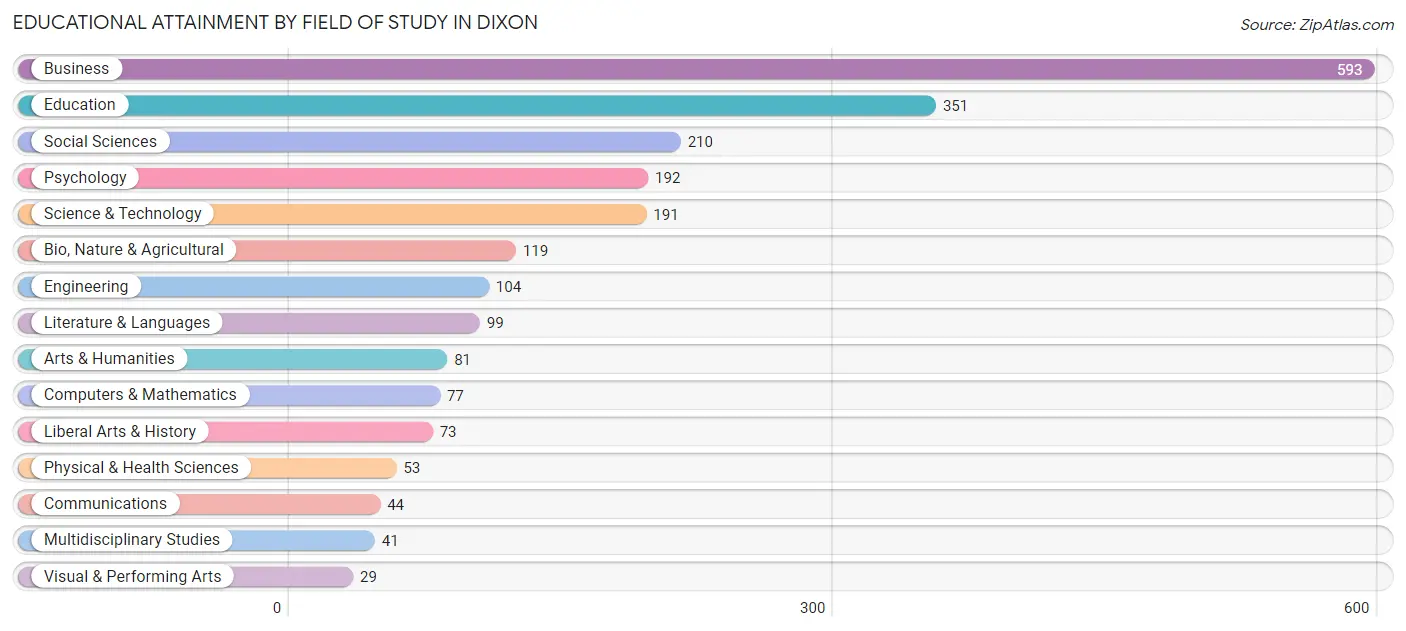
| Field of Study | # Graduates | % Graduates |
| Computers & Mathematics | 77 | 3.4% |
| Bio, Nature & Agricultural | 119 | 5.3% |
| Physical & Health Sciences | 53 | 2.4% |
| Psychology | 192 | 8.5% |
| Social Sciences | 210 | 9.3% |
| Engineering | 104 | 4.6% |
| Multidisciplinary Studies | 41 | 1.8% |
| Science & Technology | 191 | 8.5% |
| Business | 593 | 26.3% |
| Education | 351 | 15.5% |
| Literature & Languages | 99 | 4.4% |
| Liberal Arts & History | 73 | 3.2% |
| Visual & Performing Arts | 29 | 1.3% |
| Communications | 44 | 1.9% |
| Arts & Humanities | 81 | 3.6% |
| Total | 2,257 | 100.0% |
Transportation & Commute in Dixon
Vehicle Availability by Sex in Dixon
The most prevalent vehicle ownership categories in Dixon are males with 2 vehicles (1,506, accounting for 51.3%) and females with 2 vehicles (1,504, making up 45.2%).
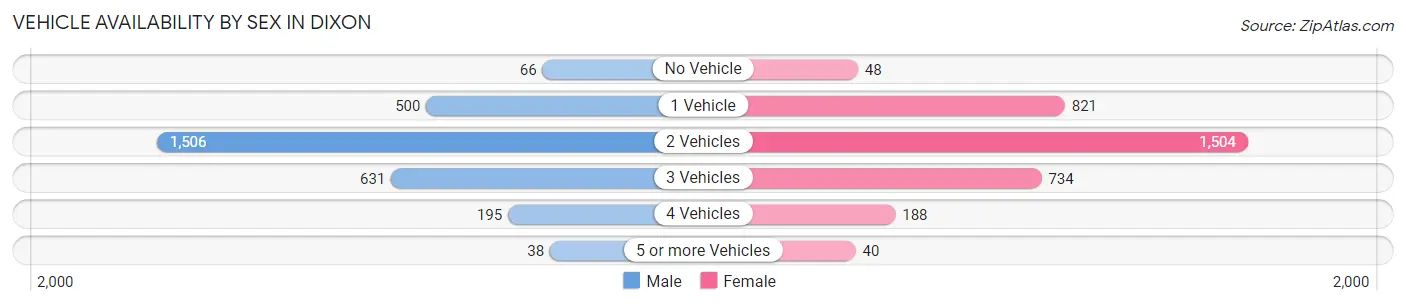
| Vehicles Available | Male | Female |
| No Vehicle | 66 (2.2%) | 48 (1.4%) |
| 1 Vehicle | 500 (17.0%) | 821 (24.6%) |
| 2 Vehicles | 1,506 (51.3%) | 1,504 (45.1%) |
| 3 Vehicles | 631 (21.5%) | 734 (22.0%) |
| 4 Vehicles | 195 (6.6%) | 188 (5.6%) |
| 5 or more Vehicles | 38 (1.3%) | 40 (1.2%) |
| Total | 2,936 (100.0%) | 3,335 (100.0%) |
Commute Time in Dixon
The most frequently occuring commute durations in Dixon are 5 to 9 minutes (1,570 commuters, 25.9%), 10 to 14 minutes (1,089 commuters, 18.0%), and 20 to 24 minutes (707 commuters, 11.7%).
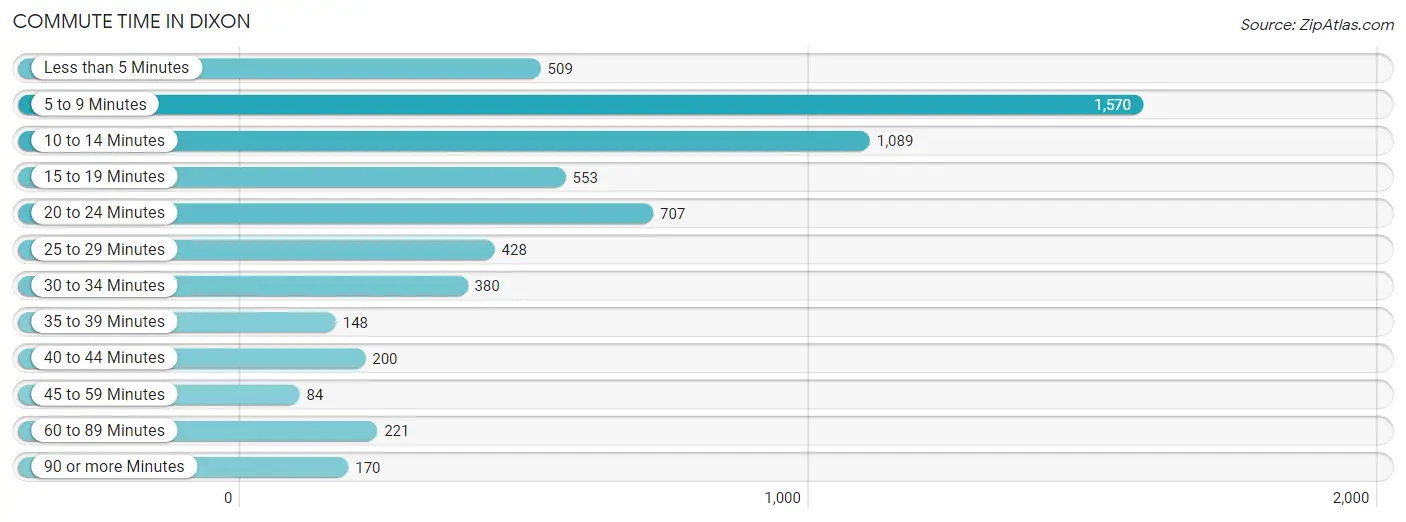
| Commute Time | # Commuters | % Commuters |
| Less than 5 Minutes | 509 | 8.4% |
| 5 to 9 Minutes | 1,570 | 25.9% |
| 10 to 14 Minutes | 1,089 | 18.0% |
| 15 to 19 Minutes | 553 | 9.1% |
| 20 to 24 Minutes | 707 | 11.7% |
| 25 to 29 Minutes | 428 | 7.1% |
| 30 to 34 Minutes | 380 | 6.3% |
| 35 to 39 Minutes | 148 | 2.4% |
| 40 to 44 Minutes | 200 | 3.3% |
| 45 to 59 Minutes | 84 | 1.4% |
| 60 to 89 Minutes | 221 | 3.6% |
| 90 or more Minutes | 170 | 2.8% |
Commute Time by Sex in Dixon
The most common commute times in Dixon are 5 to 9 minutes (783 commuters, 26.9%) for males and 5 to 9 minutes (787 commuters, 25.0%) for females.
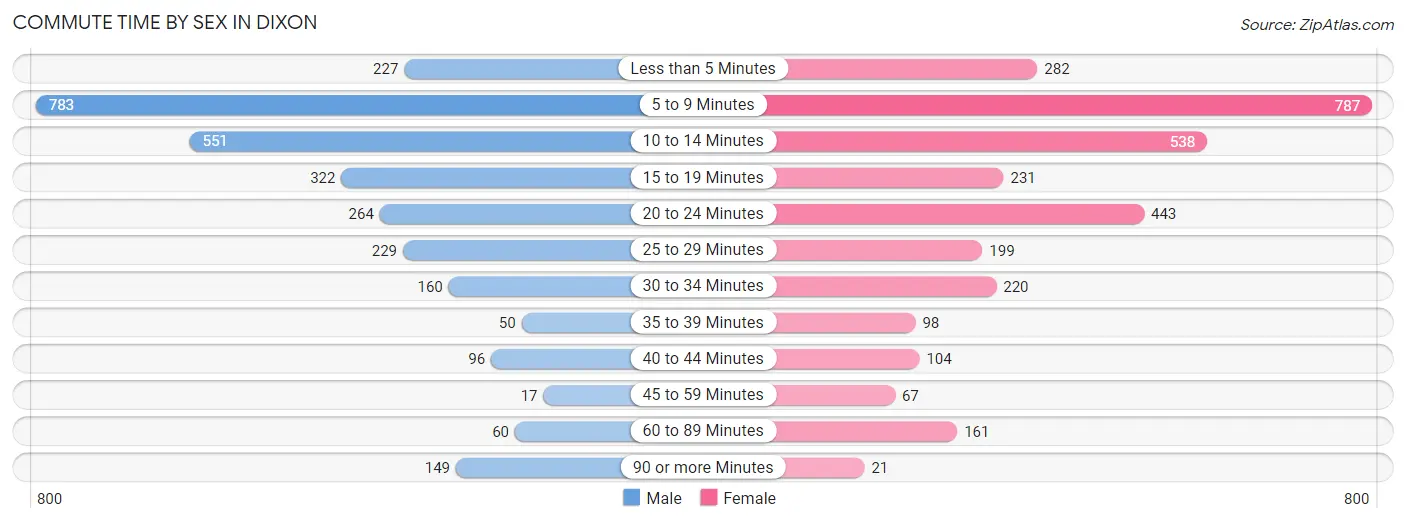
| Commute Time | Male | Female |
| Less than 5 Minutes | 227 (7.8%) | 282 (8.9%) |
| 5 to 9 Minutes | 783 (26.9%) | 787 (25.0%) |
| 10 to 14 Minutes | 551 (19.0%) | 538 (17.1%) |
| 15 to 19 Minutes | 322 (11.1%) | 231 (7.3%) |
| 20 to 24 Minutes | 264 (9.1%) | 443 (14.1%) |
| 25 to 29 Minutes | 229 (7.9%) | 199 (6.3%) |
| 30 to 34 Minutes | 160 (5.5%) | 220 (7.0%) |
| 35 to 39 Minutes | 50 (1.7%) | 98 (3.1%) |
| 40 to 44 Minutes | 96 (3.3%) | 104 (3.3%) |
| 45 to 59 Minutes | 17 (0.6%) | 67 (2.1%) |
| 60 to 89 Minutes | 60 (2.1%) | 161 (5.1%) |
| 90 or more Minutes | 149 (5.1%) | 21 (0.7%) |
Time of Departure to Work by Sex in Dixon
The most frequent times of departure to work in Dixon are 6:30 AM to 6:59 AM (507, 17.4%) for males and 7:30 AM to 7:59 AM (584, 18.5%) for females.
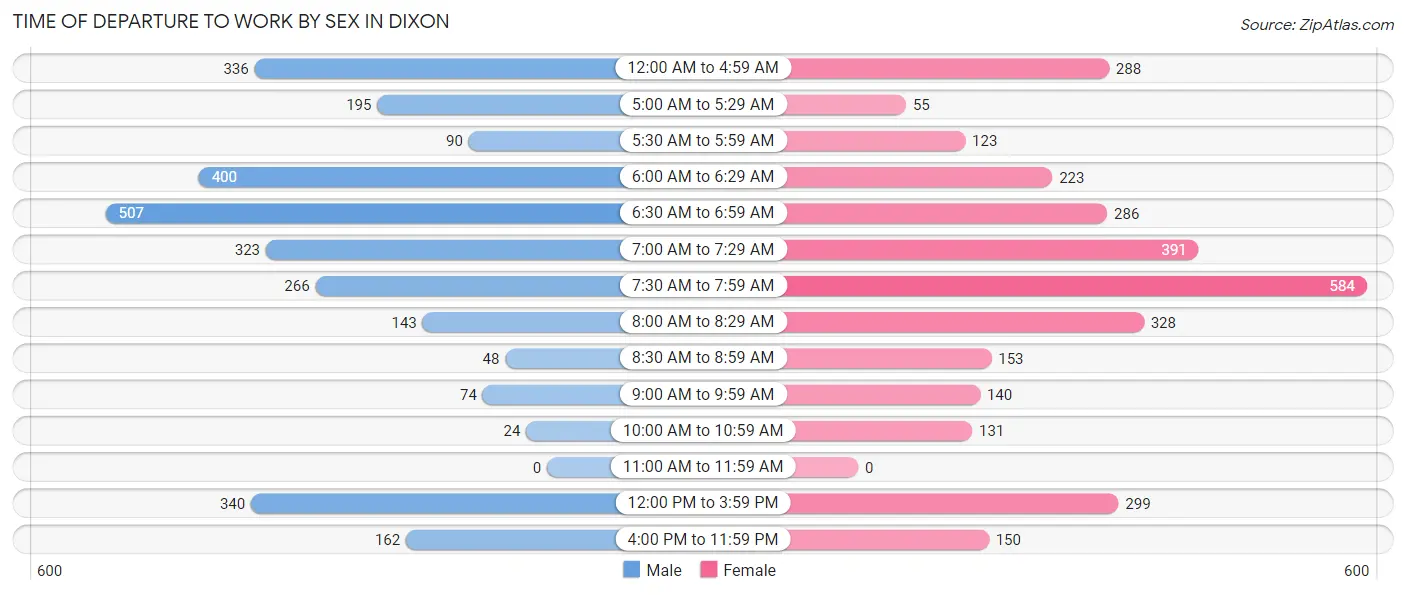
| Time of Departure | Male | Female |
| 12:00 AM to 4:59 AM | 336 (11.6%) | 288 (9.1%) |
| 5:00 AM to 5:29 AM | 195 (6.7%) | 55 (1.8%) |
| 5:30 AM to 5:59 AM | 90 (3.1%) | 123 (3.9%) |
| 6:00 AM to 6:29 AM | 400 (13.8%) | 223 (7.1%) |
| 6:30 AM to 6:59 AM | 507 (17.4%) | 286 (9.1%) |
| 7:00 AM to 7:29 AM | 323 (11.1%) | 391 (12.4%) |
| 7:30 AM to 7:59 AM | 266 (9.1%) | 584 (18.5%) |
| 8:00 AM to 8:29 AM | 143 (4.9%) | 328 (10.4%) |
| 8:30 AM to 8:59 AM | 48 (1.7%) | 153 (4.9%) |
| 9:00 AM to 9:59 AM | 74 (2.5%) | 140 (4.4%) |
| 10:00 AM to 10:59 AM | 24 (0.8%) | 131 (4.2%) |
| 11:00 AM to 11:59 AM | 0 (0.0%) | 0 (0.0%) |
| 12:00 PM to 3:59 PM | 340 (11.7%) | 299 (9.5%) |
| 4:00 PM to 11:59 PM | 162 (5.6%) | 150 (4.8%) |
| Total | 2,908 (100.0%) | 3,151 (100.0%) |
Housing Occupancy in Dixon
Occupancy by Ownership in Dixon
Of the total 6,064 dwellings in Dixon, owner-occupied units account for 3,688 (60.8%), while renter-occupied units make up 2,376 (39.2%).
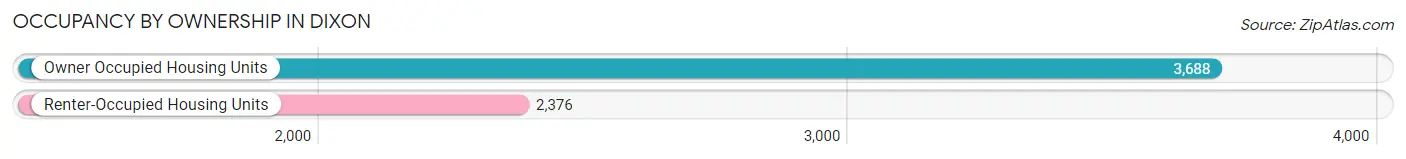
| Occupancy | # Housing Units | % Housing Units |
| Owner Occupied Housing Units | 3,688 | 60.8% |
| Renter-Occupied Housing Units | 2,376 | 39.2% |
| Total Occupied Housing Units | 6,064 | 100.0% |
Occupancy by Household Size in Dixon
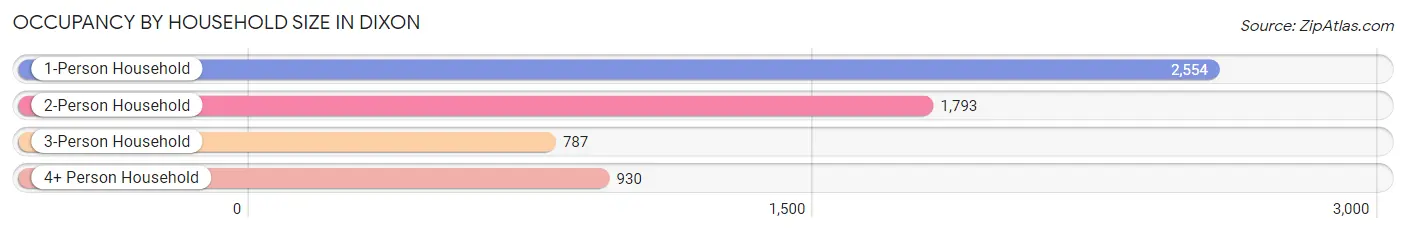
| Household Size | # Housing Units | % Housing Units |
| 1-Person Household | 2,554 | 42.1% |
| 2-Person Household | 1,793 | 29.6% |
| 3-Person Household | 787 | 13.0% |
| 4+ Person Household | 930 | 15.3% |
| Total Housing Units | 6,064 | 100.0% |
Occupancy by Ownership by Household Size in Dixon
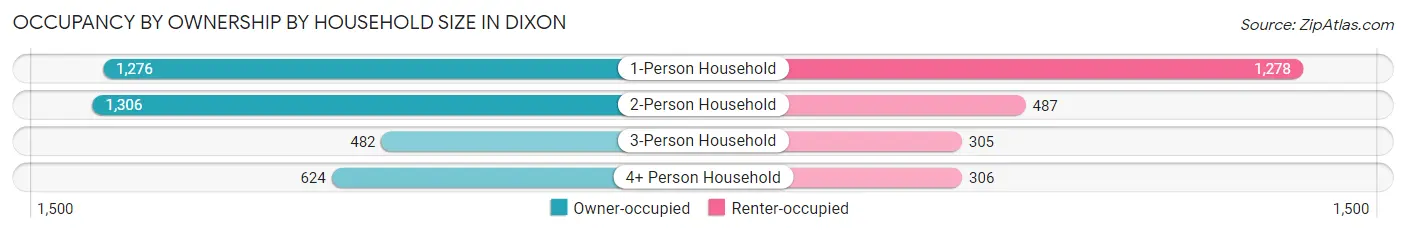
| Household Size | Owner-occupied | Renter-occupied |
| 1-Person Household | 1,276 (50.0%) | 1,278 (50.0%) |
| 2-Person Household | 1,306 (72.8%) | 487 (27.2%) |
| 3-Person Household | 482 (61.3%) | 305 (38.8%) |
| 4+ Person Household | 624 (67.1%) | 306 (32.9%) |
| Total Housing Units | 3,688 (60.8%) | 2,376 (39.2%) |
Occupancy by Educational Attainment in Dixon
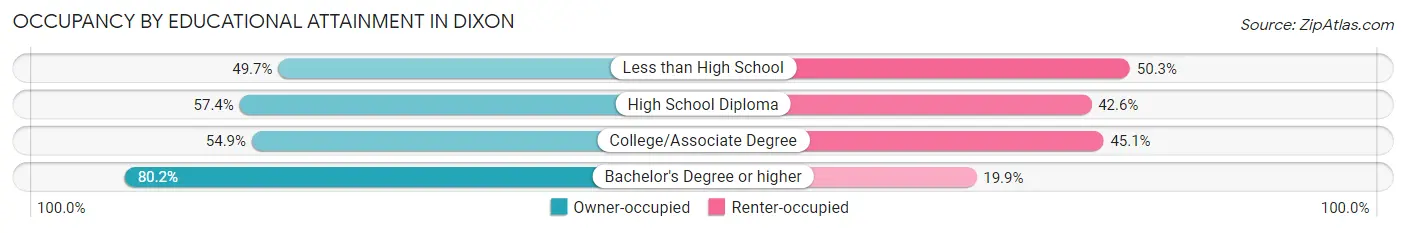
| Household Size | Owner-occupied | Renter-occupied |
| Less than High School | 247 (49.7%) | 250 (50.3%) |
| High School Diploma | 1,234 (57.4%) | 917 (42.6%) |
| College/Associate Degree | 1,157 (54.9%) | 949 (45.1%) |
| Bachelor's Degree or higher | 1,050 (80.1%) | 260 (19.9%) |
Occupancy by Age of Householder in Dixon
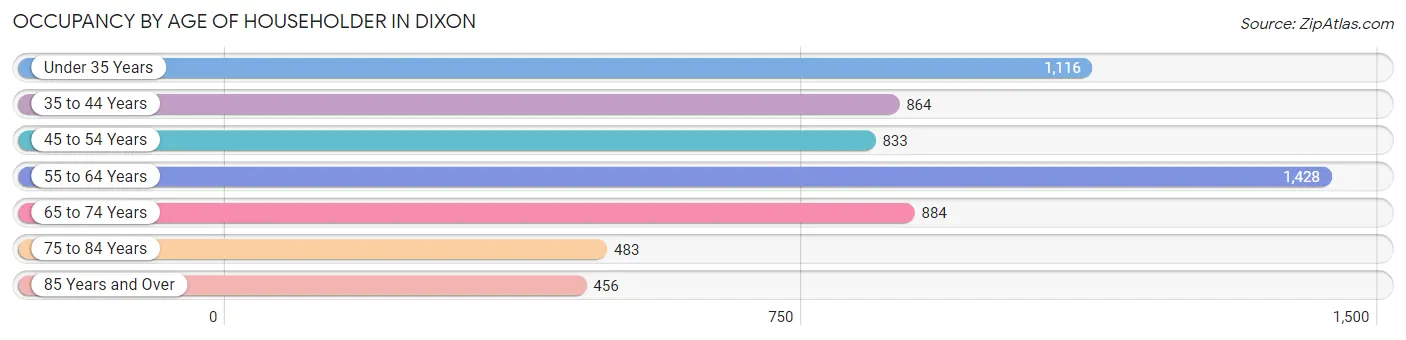
| Age Bracket | # Households | % Households |
| Under 35 Years | 1,116 | 18.4% |
| 35 to 44 Years | 864 | 14.2% |
| 45 to 54 Years | 833 | 13.7% |
| 55 to 64 Years | 1,428 | 23.5% |
| 65 to 74 Years | 884 | 14.6% |
| 75 to 84 Years | 483 | 8.0% |
| 85 Years and Over | 456 | 7.5% |
| Total | 6,064 | 100.0% |
Housing Finances in Dixon
Median Income by Occupancy in Dixon
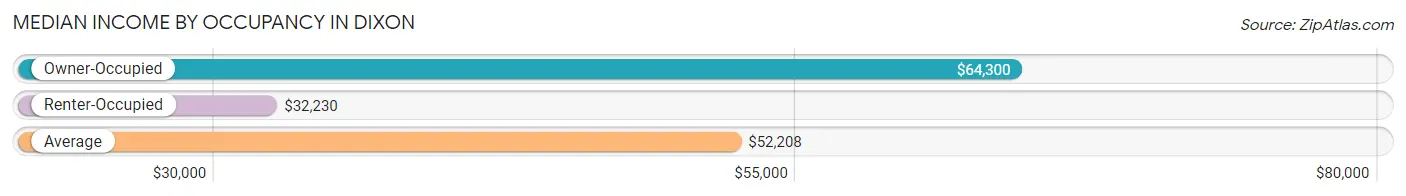
| Occupancy Type | # Households | Median Income |
| Owner-Occupied | 3,688 (60.8%) | $64,300 |
| Renter-Occupied | 2,376 (39.2%) | $32,230 |
| Average | 6,064 (100.0%) | $52,208 |
Occupancy by Householder Income Bracket in Dixon
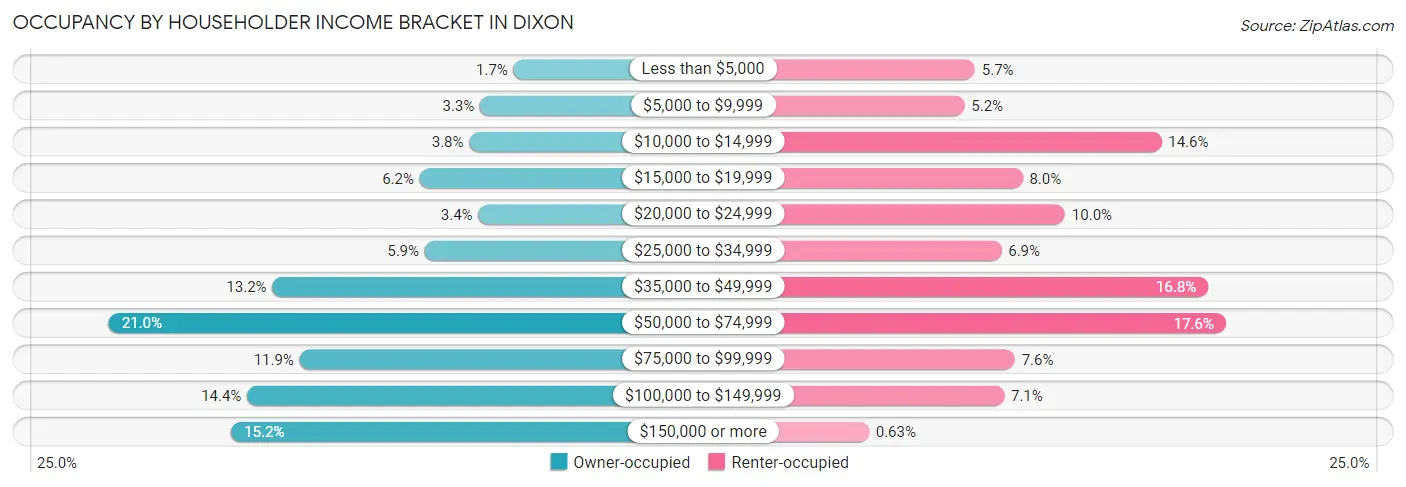
| Income Bracket | Owner-occupied | Renter-occupied |
| Less than $5,000 | 63 (1.7%) | 135 (5.7%) |
| $5,000 to $9,999 | 122 (3.3%) | 123 (5.2%) |
| $10,000 to $14,999 | 141 (3.8%) | 346 (14.6%) |
| $15,000 to $19,999 | 228 (6.2%) | 189 (8.0%) |
| $20,000 to $24,999 | 125 (3.4%) | 237 (10.0%) |
| $25,000 to $34,999 | 219 (5.9%) | 165 (6.9%) |
| $35,000 to $49,999 | 487 (13.2%) | 399 (16.8%) |
| $50,000 to $74,999 | 774 (21.0%) | 419 (17.6%) |
| $75,000 to $99,999 | 439 (11.9%) | 180 (7.6%) |
| $100,000 to $149,999 | 531 (14.4%) | 168 (7.1%) |
| $150,000 or more | 559 (15.2%) | 15 (0.6%) |
| Total | 3,688 (100.0%) | 2,376 (100.0%) |
Monthly Housing Cost Tiers in Dixon
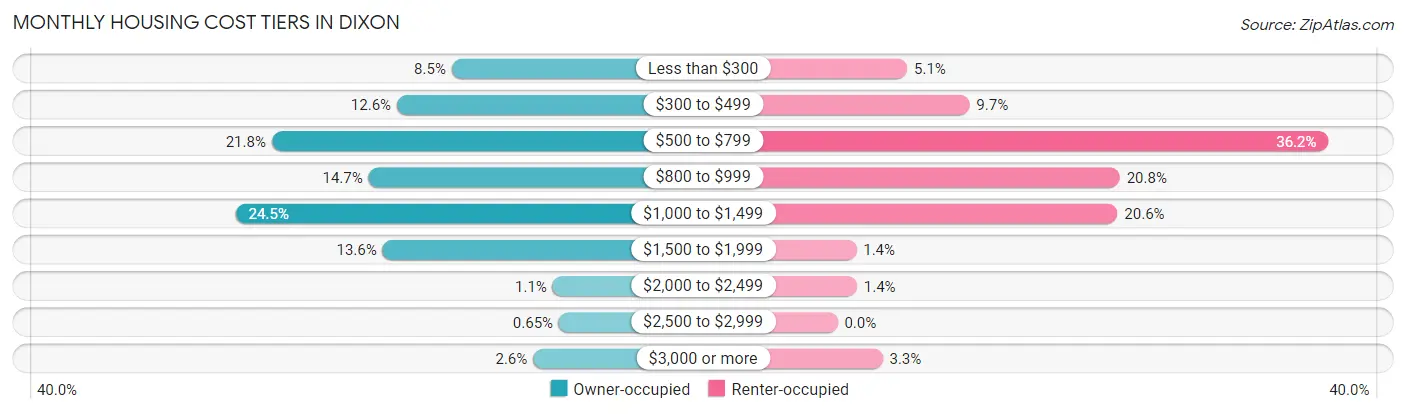
| Monthly Cost | Owner-occupied | Renter-occupied |
| Less than $300 | 315 (8.5%) | 122 (5.1%) |
| $300 to $499 | 464 (12.6%) | 231 (9.7%) |
| $500 to $799 | 804 (21.8%) | 859 (36.1%) |
| $800 to $999 | 541 (14.7%) | 494 (20.8%) |
| $1,000 to $1,499 | 902 (24.5%) | 490 (20.6%) |
| $1,500 to $1,999 | 503 (13.6%) | 33 (1.4%) |
| $2,000 to $2,499 | 41 (1.1%) | 34 (1.4%) |
| $2,500 to $2,999 | 24 (0.6%) | 0 (0.0%) |
| $3,000 or more | 94 (2.5%) | 79 (3.3%) |
| Total | 3,688 (100.0%) | 2,376 (100.0%) |
Physical Housing Characteristics in Dixon
Housing Structures in Dixon
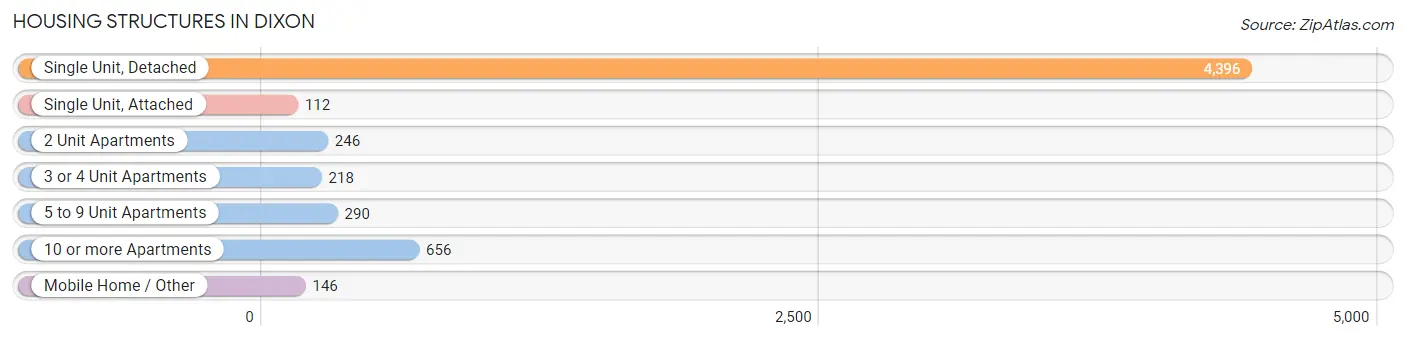
| Structure Type | # Housing Units | % Housing Units |
| Single Unit, Detached | 4,396 | 72.5% |
| Single Unit, Attached | 112 | 1.8% |
| 2 Unit Apartments | 246 | 4.1% |
| 3 or 4 Unit Apartments | 218 | 3.6% |
| 5 to 9 Unit Apartments | 290 | 4.8% |
| 10 or more Apartments | 656 | 10.8% |
| Mobile Home / Other | 146 | 2.4% |
| Total | 6,064 | 100.0% |
Housing Structures by Occupancy in Dixon
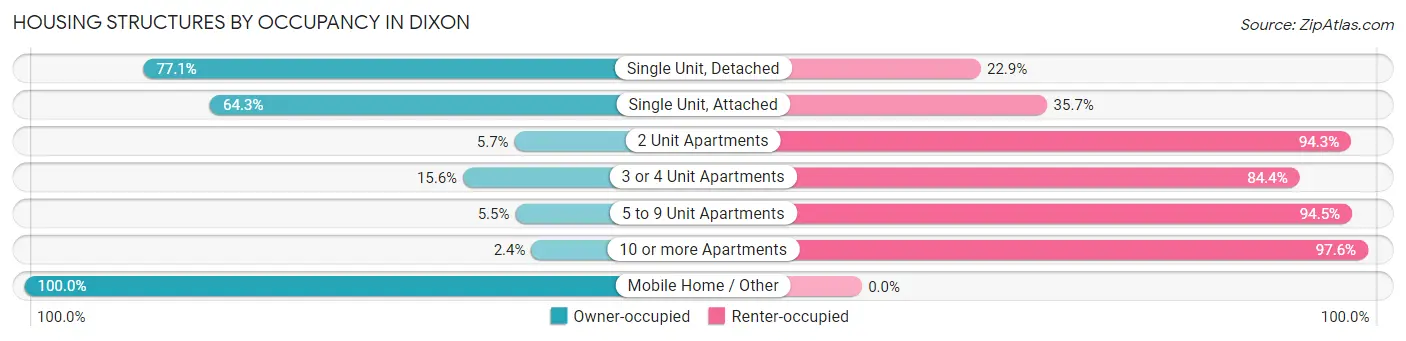
| Structure Type | Owner-occupied | Renter-occupied |
| Single Unit, Detached | 3,390 (77.1%) | 1,006 (22.9%) |
| Single Unit, Attached | 72 (64.3%) | 40 (35.7%) |
| 2 Unit Apartments | 14 (5.7%) | 232 (94.3%) |
| 3 or 4 Unit Apartments | 34 (15.6%) | 184 (84.4%) |
| 5 to 9 Unit Apartments | 16 (5.5%) | 274 (94.5%) |
| 10 or more Apartments | 16 (2.4%) | 640 (97.6%) |
| Mobile Home / Other | 146 (100.0%) | 0 (0.0%) |
| Total | 3,688 (60.8%) | 2,376 (39.2%) |
Housing Structures by Number of Rooms in Dixon
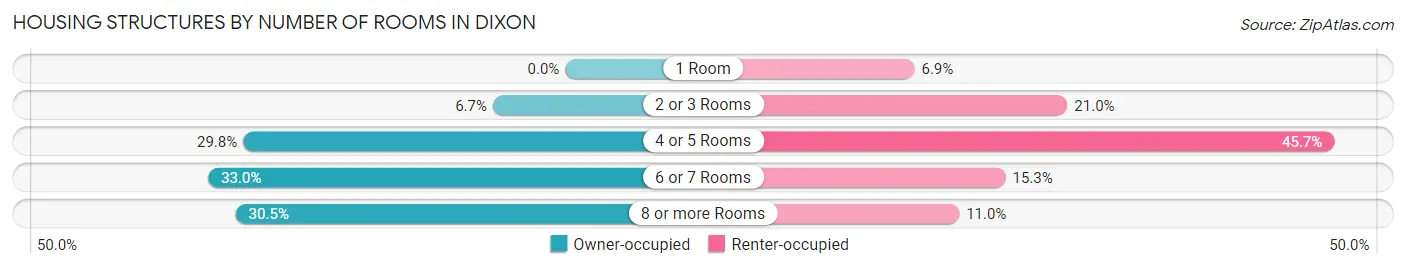
| Number of Rooms | Owner-occupied | Renter-occupied |
| 1 Room | 0 (0.0%) | 164 (6.9%) |
| 2 or 3 Rooms | 247 (6.7%) | 500 (21.0%) |
| 4 or 5 Rooms | 1,099 (29.8%) | 1,086 (45.7%) |
| 6 or 7 Rooms | 1,218 (33.0%) | 364 (15.3%) |
| 8 or more Rooms | 1,124 (30.5%) | 262 (11.0%) |
| Total | 3,688 (100.0%) | 2,376 (100.0%) |
Housing Structure by Heating Type in Dixon
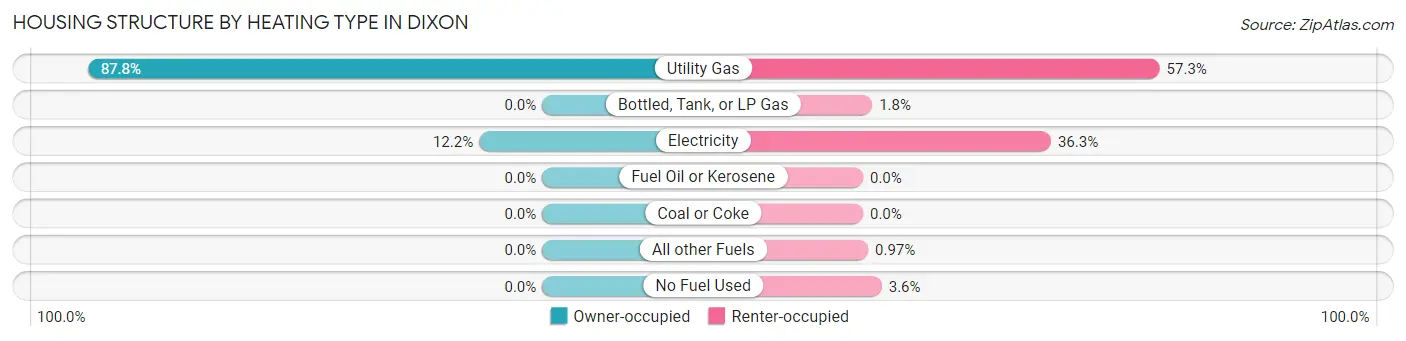
| Heating Type | Owner-occupied | Renter-occupied |
| Utility Gas | 3,238 (87.8%) | 1,362 (57.3%) |
| Bottled, Tank, or LP Gas | 0 (0.0%) | 42 (1.8%) |
| Electricity | 450 (12.2%) | 863 (36.3%) |
| Fuel Oil or Kerosene | 0 (0.0%) | 0 (0.0%) |
| Coal or Coke | 0 (0.0%) | 0 (0.0%) |
| All other Fuels | 0 (0.0%) | 23 (1.0%) |
| No Fuel Used | 0 (0.0%) | 86 (3.6%) |
| Total | 3,688 (100.0%) | 2,376 (100.0%) |
Household Vehicle Usage in Dixon
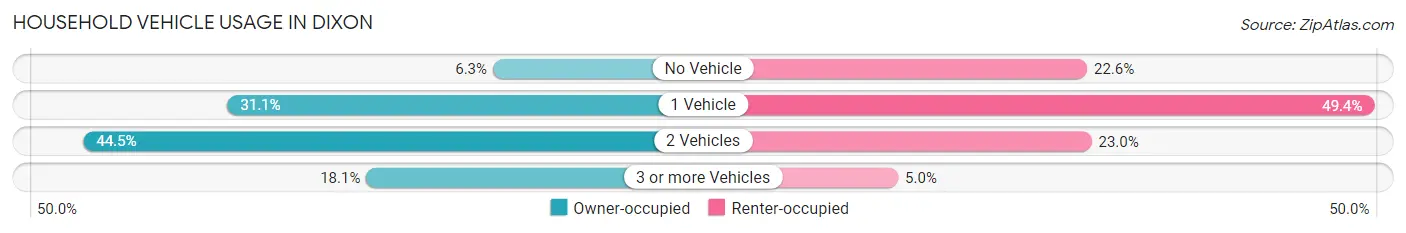
| Vehicles per Household | Owner-occupied | Renter-occupied |
| No Vehicle | 232 (6.3%) | 537 (22.6%) |
| 1 Vehicle | 1,146 (31.1%) | 1,174 (49.4%) |
| 2 Vehicles | 1,642 (44.5%) | 547 (23.0%) |
| 3 or more Vehicles | 668 (18.1%) | 118 (5.0%) |
| Total | 3,688 (100.0%) | 2,376 (100.0%) |
Real Estate & Mortgages in Dixon
Real Estate and Mortgage Overview in Dixon
| Characteristic | Without Mortgage | With Mortgage |
| Housing Units | 1,343 | 2,345 |
| Median Property Value | $96,800 | $118,900 |
| Median Household Income | $52,344 | $376 |
| Monthly Housing Costs | $478 | $77 |
| Real Estate Taxes | $2,254 | $20 |
Property Value by Mortgage Status in Dixon
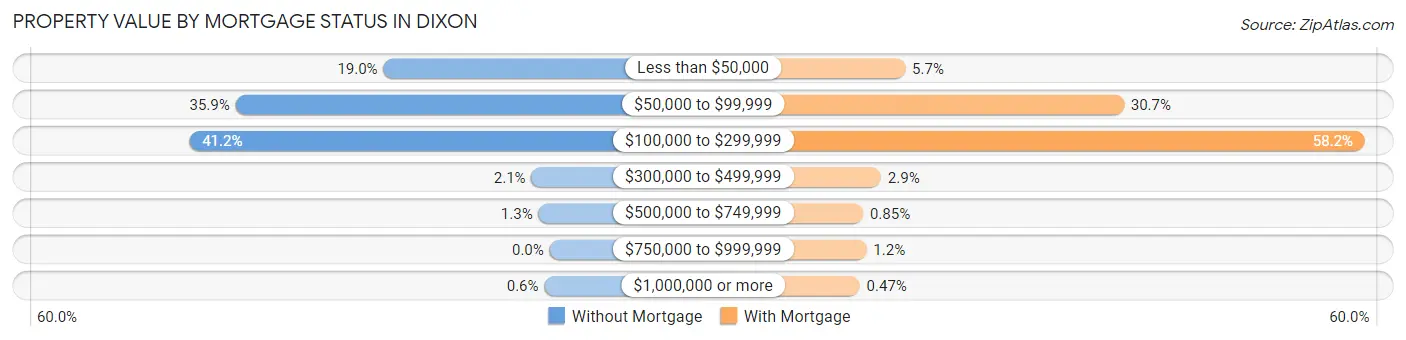
| Property Value | Without Mortgage | With Mortgage |
| Less than $50,000 | 255 (19.0%) | 133 (5.7%) |
| $50,000 to $99,999 | 482 (35.9%) | 719 (30.7%) |
| $100,000 to $299,999 | 553 (41.2%) | 1,365 (58.2%) |
| $300,000 to $499,999 | 28 (2.1%) | 68 (2.9%) |
| $500,000 to $749,999 | 17 (1.3%) | 20 (0.9%) |
| $750,000 to $999,999 | 0 (0.0%) | 29 (1.2%) |
| $1,000,000 or more | 8 (0.6%) | 11 (0.5%) |
| Total | 1,343 (100.0%) | 2,345 (100.0%) |
Household Income by Mortgage Status in Dixon
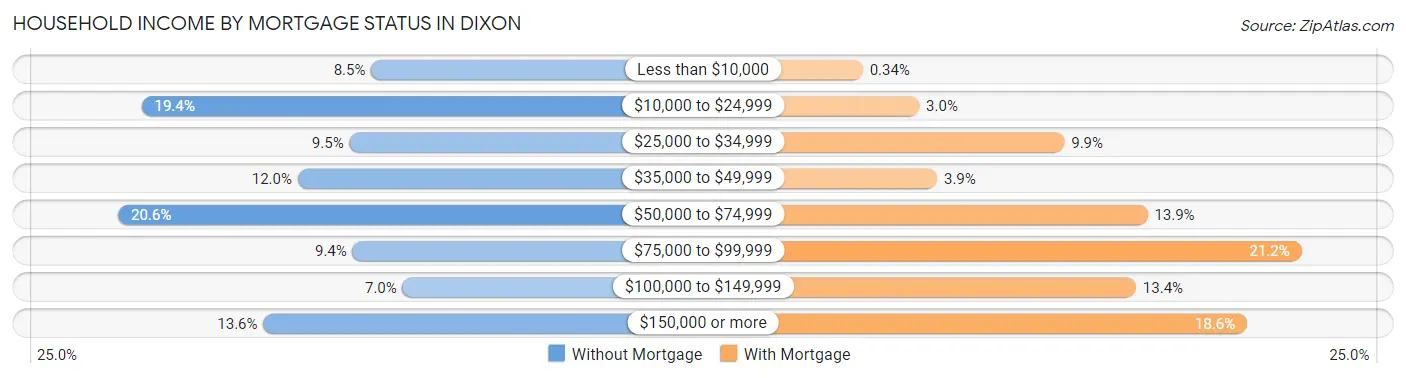
| Household Income | Without Mortgage | With Mortgage |
| Less than $10,000 | 114 (8.5%) | 8 (0.3%) |
| $10,000 to $24,999 | 261 (19.4%) | 71 (3.0%) |
| $25,000 to $34,999 | 128 (9.5%) | 233 (9.9%) |
| $35,000 to $49,999 | 161 (12.0%) | 91 (3.9%) |
| $50,000 to $74,999 | 276 (20.5%) | 326 (13.9%) |
| $75,000 to $99,999 | 126 (9.4%) | 498 (21.2%) |
| $100,000 to $149,999 | 94 (7.0%) | 313 (13.4%) |
| $150,000 or more | 183 (13.6%) | 437 (18.6%) |
| Total | 1,343 (100.0%) | 2,345 (100.0%) |
Property Value to Household Income Ratio in Dixon
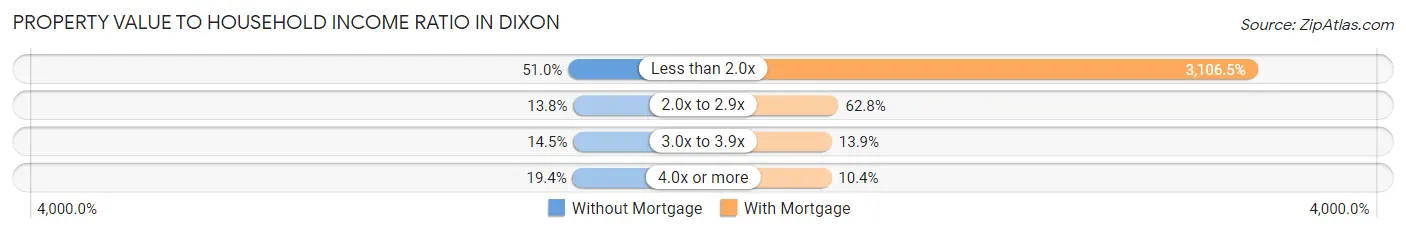
| Value-to-Income Ratio | Without Mortgage | With Mortgage |
| Less than 2.0x | 685 (51.0%) | 72,847 (3,106.5%) |
| 2.0x to 2.9x | 185 (13.8%) | 1,472 (62.8%) |
| 3.0x to 3.9x | 195 (14.5%) | 327 (13.9%) |
| 4.0x or more | 261 (19.4%) | 244 (10.4%) |
| Total | 1,343 (100.0%) | 2,345 (100.0%) |
Real Estate Taxes by Mortgage Status in Dixon
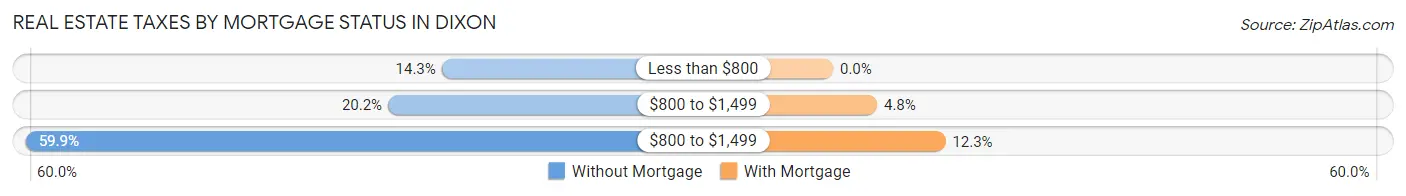
| Property Taxes | Without Mortgage | With Mortgage |
| Less than $800 | 192 (14.3%) | 0 (0.0%) |
| $800 to $1,499 | 271 (20.2%) | 113 (4.8%) |
| $800 to $1,499 | 804 (59.9%) | 289 (12.3%) |
| Total | 1,343 (100.0%) | 2,345 (100.0%) |
Health & Disability in Dixon
Health Insurance Coverage by Age in Dixon

| Age Bracket | With Coverage | Without Coverage |
| Under 6 Years | 747 (99.5%) | 4 (0.5%) |
| 6 to 18 Years | 2,387 (98.6%) | 33 (1.4%) |
| 19 to 25 Years | 784 (89.5%) | 92 (10.5%) |
| 26 to 34 Years | 1,572 (92.2%) | 132 (7.7%) |
| 35 to 44 Years | 1,392 (92.8%) | 108 (7.2%) |
| 45 to 54 Years | 1,387 (96.1%) | 57 (4.0%) |
| 55 to 64 Years | 2,016 (97.7%) | 48 (2.3%) |
| 65 to 74 Years | 1,187 (100.0%) | 0 (0.0%) |
| 75 Years and older | 1,133 (100.0%) | 0 (0.0%) |
| Total | 12,605 (96.4%) | 474 (3.6%) |
Health Insurance Coverage by Citizenship Status in Dixon
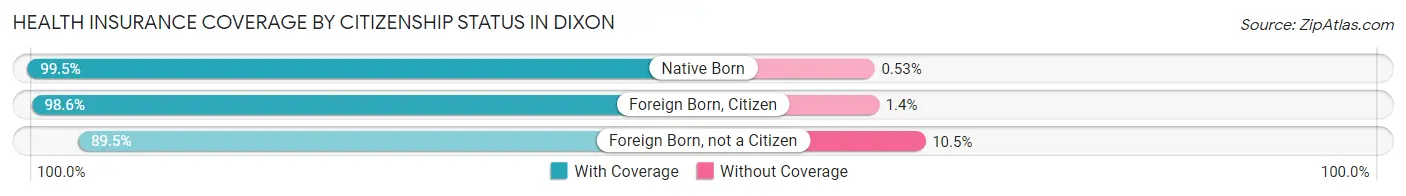
| Citizenship Status | With Coverage | Without Coverage |
| Native Born | 747 (99.5%) | 4 (0.5%) |
| Foreign Born, Citizen | 2,387 (98.6%) | 33 (1.4%) |
| Foreign Born, not a Citizen | 784 (89.5%) | 92 (10.5%) |
Health Insurance Coverage by Household Income in Dixon
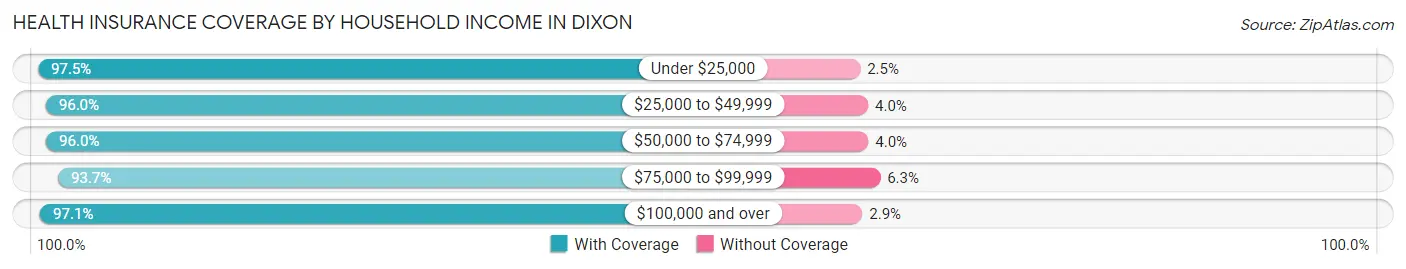
| Household Income | With Coverage | Without Coverage |
| Under $25,000 | 2,215 (97.5%) | 57 (2.5%) |
| $25,000 to $49,999 | 2,360 (96.0%) | 98 (4.0%) |
| $50,000 to $74,999 | 2,682 (96.0%) | 113 (4.0%) |
| $75,000 to $99,999 | 1,348 (93.7%) | 90 (6.3%) |
| $100,000 and over | 3,856 (97.1%) | 116 (2.9%) |
Public vs Private Health Insurance Coverage by Age in Dixon
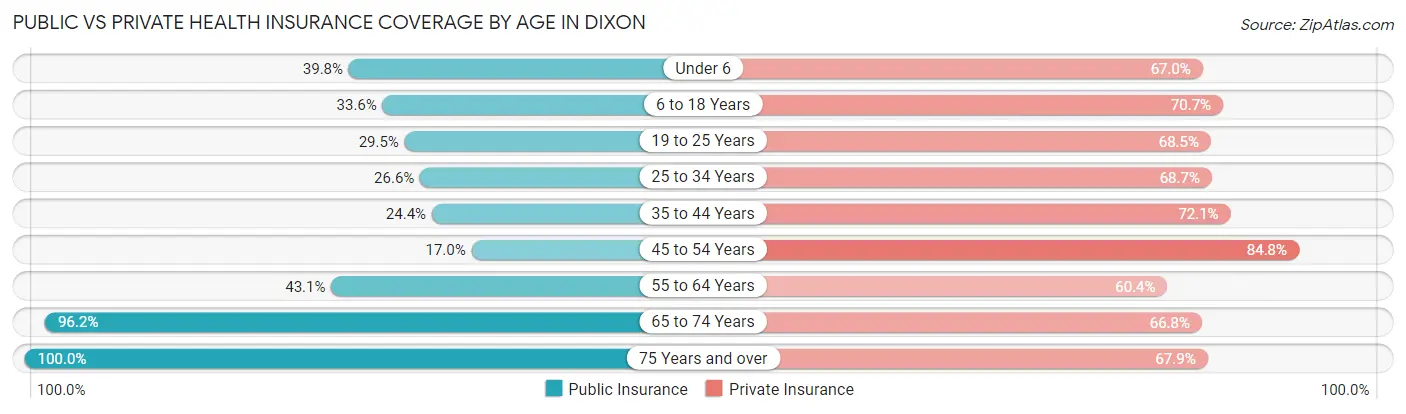
| Age Bracket | Public Insurance | Private Insurance |
| Under 6 | 299 (39.8%) | 503 (67.0%) |
| 6 to 18 Years | 812 (33.6%) | 1,712 (70.7%) |
| 19 to 25 Years | 258 (29.4%) | 600 (68.5%) |
| 25 to 34 Years | 453 (26.6%) | 1,170 (68.7%) |
| 35 to 44 Years | 366 (24.4%) | 1,082 (72.1%) |
| 45 to 54 Years | 246 (17.0%) | 1,225 (84.8%) |
| 55 to 64 Years | 889 (43.1%) | 1,247 (60.4%) |
| 65 to 74 Years | 1,142 (96.2%) | 793 (66.8%) |
| 75 Years and over | 1,133 (100.0%) | 769 (67.9%) |
| Total | 5,598 (42.8%) | 9,101 (69.6%) |
Disability Status by Sex by Age in Dixon
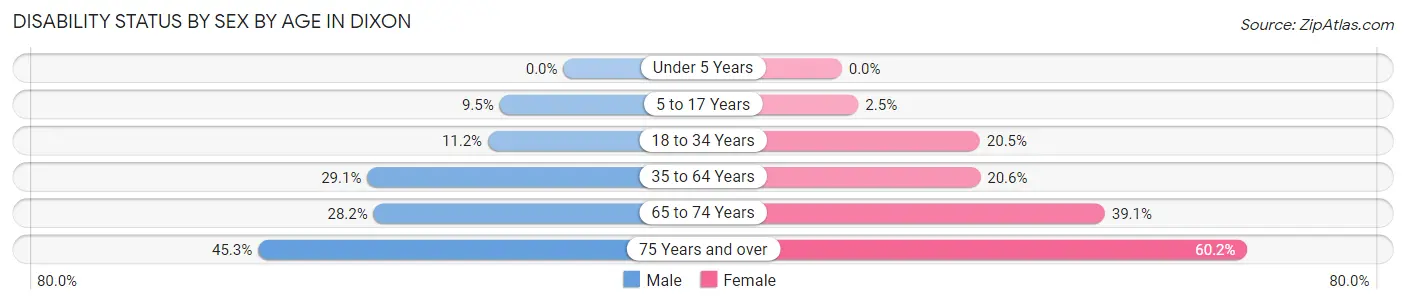
| Age Bracket | Male | Female |
| Under 5 Years | 0 (0.0%) | 0 (0.0%) |
| 5 to 17 Years | 139 (9.5%) | 22 (2.5%) |
| 18 to 34 Years | 147 (11.2%) | 287 (20.5%) |
| 35 to 64 Years | 705 (29.1%) | 532 (20.6%) |
| 65 to 74 Years | 157 (28.2%) | 246 (39.1%) |
| 75 Years and over | 141 (45.3%) | 495 (60.2%) |
Disability Class by Sex by Age in Dixon
Disability Class: Hearing Difficulty
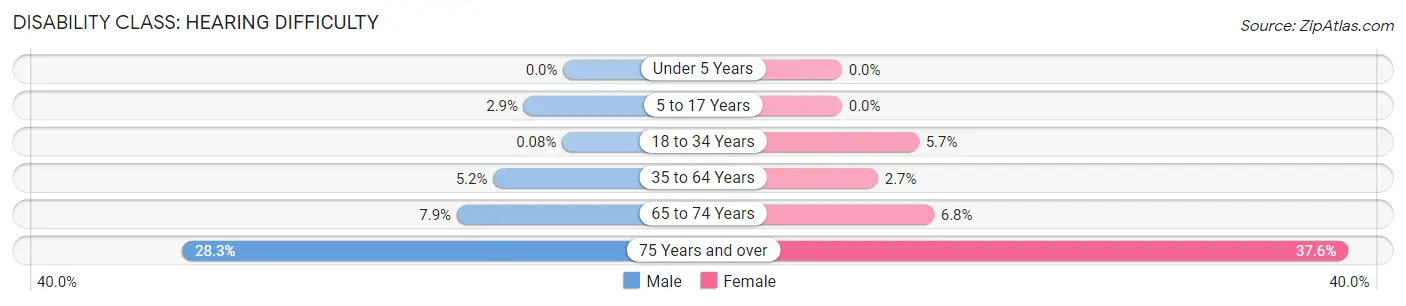
| Age Bracket | Male | Female |
| Under 5 Years | 0 (0.0%) | 0 (0.0%) |
| 5 to 17 Years | 43 (2.9%) | 0 (0.0%) |
| 18 to 34 Years | 1 (0.1%) | 80 (5.7%) |
| 35 to 64 Years | 126 (5.2%) | 69 (2.7%) |
| 65 to 74 Years | 44 (7.9%) | 43 (6.8%) |
| 75 Years and over | 88 (28.3%) | 309 (37.6%) |
Disability Class: Vision Difficulty
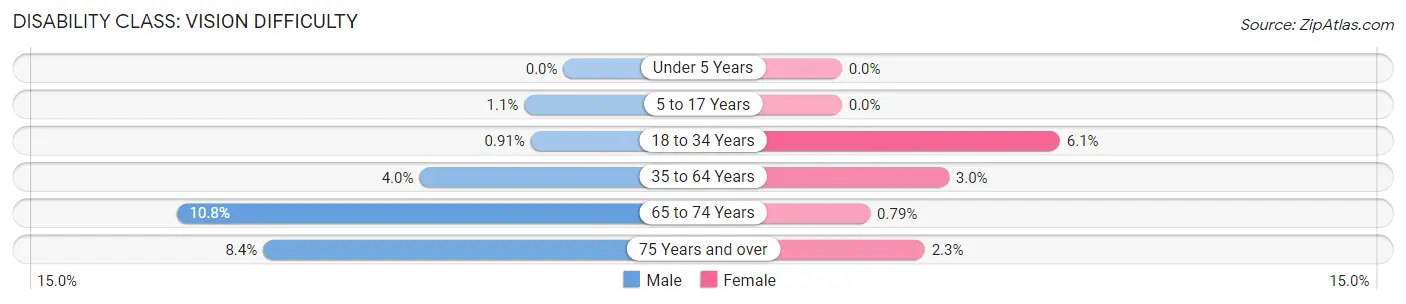
| Age Bracket | Male | Female |
| Under 5 Years | 0 (0.0%) | 0 (0.0%) |
| 5 to 17 Years | 16 (1.1%) | 0 (0.0%) |
| 18 to 34 Years | 12 (0.9%) | 85 (6.1%) |
| 35 to 64 Years | 97 (4.0%) | 77 (3.0%) |
| 65 to 74 Years | 60 (10.8%) | 5 (0.8%) |
| 75 Years and over | 26 (8.4%) | 19 (2.3%) |
Disability Class: Cognitive Difficulty
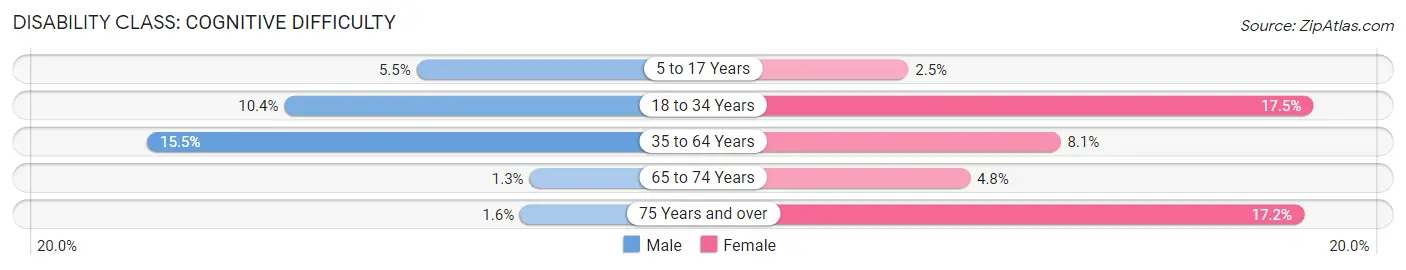
| Age Bracket | Male | Female |
| 5 to 17 Years | 80 (5.4%) | 22 (2.5%) |
| 18 to 34 Years | 136 (10.4%) | 245 (17.5%) |
| 35 to 64 Years | 374 (15.4%) | 210 (8.1%) |
| 65 to 74 Years | 7 (1.3%) | 30 (4.8%) |
| 75 Years and over | 5 (1.6%) | 141 (17.2%) |
Disability Class: Ambulatory Difficulty
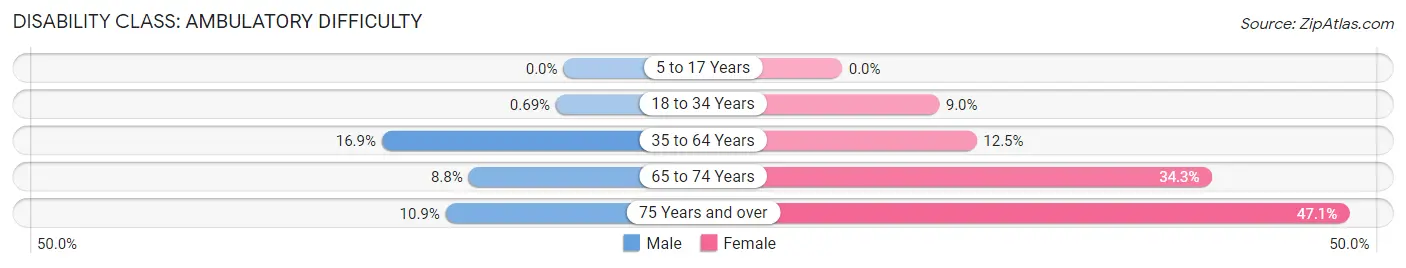
| Age Bracket | Male | Female |
| 5 to 17 Years | 0 (0.0%) | 0 (0.0%) |
| 18 to 34 Years | 9 (0.7%) | 126 (9.0%) |
| 35 to 64 Years | 408 (16.9%) | 323 (12.5%) |
| 65 to 74 Years | 49 (8.8%) | 216 (34.3%) |
| 75 Years and over | 34 (10.9%) | 387 (47.1%) |
Disability Class: Self-Care Difficulty
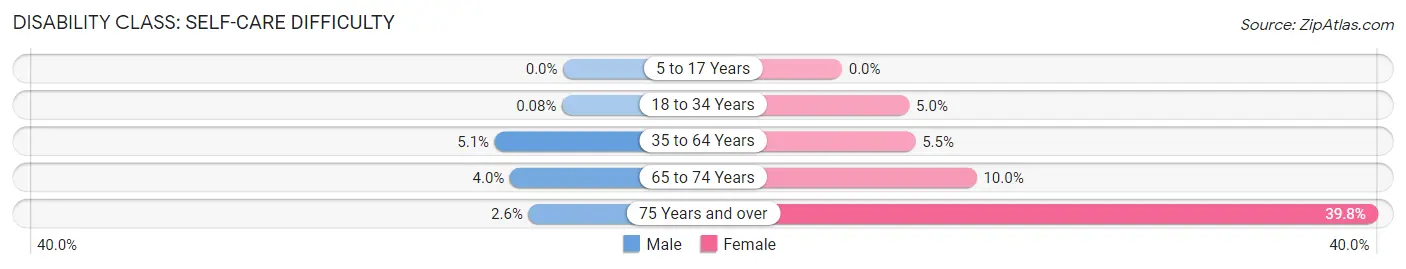
| Age Bracket | Male | Female |
| 5 to 17 Years | 0 (0.0%) | 0 (0.0%) |
| 18 to 34 Years | 1 (0.1%) | 70 (5.0%) |
| 35 to 64 Years | 123 (5.1%) | 141 (5.4%) |
| 65 to 74 Years | 22 (4.0%) | 63 (10.0%) |
| 75 Years and over | 8 (2.6%) | 327 (39.8%) |
Technology Access in Dixon
Computing Device Access in Dixon
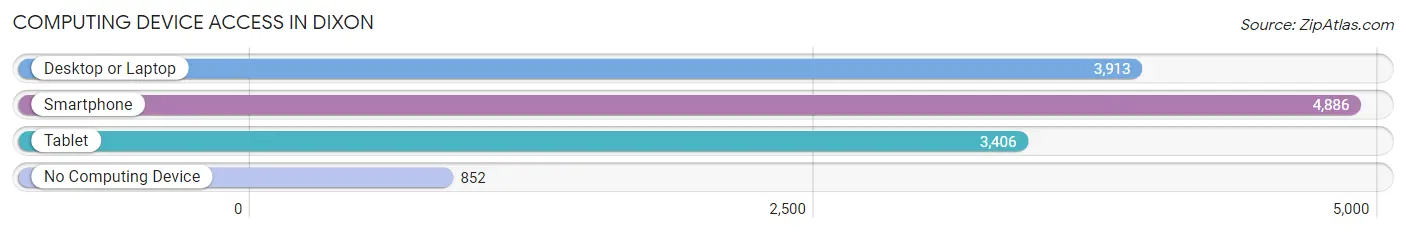
| Device Type | # Households | % Households |
| Desktop or Laptop | 3,913 | 64.5% |
| Smartphone | 4,886 | 80.6% |
| Tablet | 3,406 | 56.2% |
| No Computing Device | 852 | 14.1% |
| Total | 6,064 | 100.0% |
Internet Access in Dixon
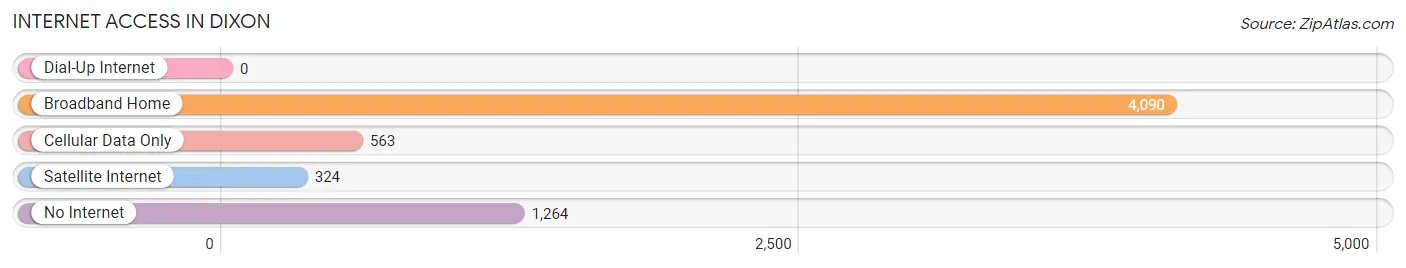
| Internet Type | # Households | % Households |
| Dial-Up Internet | 0 | 0.0% |
| Broadband Home | 4,090 | 67.4% |
| Cellular Data Only | 563 | 9.3% |
| Satellite Internet | 324 | 5.3% |
| No Internet | 1,264 | 20.8% |
| Total | 6,064 | 100.0% |
Dixon Summary
Dixon, Illinois is a city located in Lee County, Illinois, United States. It is the county seat of Lee County and is located on the Rock River. As of the 2010 census, the city had a population of 15,733.
History
Dixon was founded in 1827 by John Dixon, a settler from Ohio. He named the city after himself and it was incorporated in 1853. The city was a major stop on the Underground Railroad, with many slaves escaping to freedom in Canada.
During the Civil War, Dixon was a major center of activity. It was the site of the Grand Review of the Union Army in 1865, when General Ulysses S. Grant reviewed the troops before they marched off to fight in the Battle of Appomattox.
In the late 19th century, Dixon was a major center of industry, with several factories and mills located in the city. It was also a major transportation hub, with the Chicago and Northwestern Railroad running through the city.
Geography
Dixon is located at 41°50'N 89°30'W (41.829, -89.500). According to the 2010 census, the city has a total area of 8.9 square miles (23.1 km2), of which 8.8 square miles (22.8 km2) is land and 0.1 square miles (0.3 km2) is water.
Economy
Dixon’s economy is largely based on manufacturing and agriculture. The city is home to several factories and mills, including a paper mill, a steel mill, and a plastics plant. Agriculture is also an important part of the local economy, with corn, soybeans, and wheat being the main crops.
The city is also home to several retail stores, restaurants, and other businesses. Dixon is also home to a number of government offices, including the Lee County Courthouse and the Dixon Correctional Center.
Demographics
As of the 2010 census, there were 15,733 people, 6,541 households, and 4,093 families residing in the city. The population density was 1,788.3 people per square mile (692.2/km2). There were 6,945 housing units at an average density of 783.3 per square mile (302.7/km2). The racial makeup of the city was 87.2% White, 8.2% African American, 0.3% Native American, 0.7% Asian, 0.1% Pacific Islander, 1.7% from other races, and 1.8% from two or more races. Hispanic or Latino of any race were 4.7% of the population.
There were 6,541 households, out of which 30.2% had children under the age of 18 living with them, 44.2% were married couples living together, 14.2% had a female householder with no husband present, and 36.3% were non-families. 30.7% of all households were made up of individuals, and 13.2% had someone living alone who was 65 years of age or older. The average household size was 2.41 and the average family size was 3.00.
In the city, the population was spread out, with 25.2% under the age of 18, 8.7% from 18 to 24, 28.2% from 25 to 44, 22.2% from 45 to 64, and 15.7% who were 65 years of age or older. The median age was 36 years. For every 100 females, there were 93.2 males. For every 100 females age 18 and over, there were 89.2 males.
The median income for a household in the city was $37,813, and the median income for a family was $45,945. Males had a median income of $35,945 versus $25,945 for females. The per capita income for the city was $18,945. About 8.7% of families and 11.2% of the population were below the poverty line, including 15.2% of those under age 18 and 8.2% of those age 65 or over.
Common Questions
What is Per Capita Income in Dixon?
Per Capita income in Dixon is $26,524.
What is the Median Family Income in Dixon?
Median Family Income in Dixon is $70,389.
What is the Median Household income in Dixon?
Median Household Income in Dixon is $52,208.
What is Income or Wage Gap in Dixon?
Income or Wage Gap in Dixon is 31.3%.
Women in Dixon earn 68.7 cents for every dollar earned by a man.
What is Inequality or Gini Index in Dixon?
Inequality or Gini Index in Dixon is 0.45.
What is the Total Population of Dixon?
Total Population of Dixon is 15,573.
What is the Total Male Population of Dixon?
Total Male Population of Dixon is 8,812.
What is the Total Female Population of Dixon?
Total Female Population of Dixon is 6,761.
What is the Ratio of Males per 100 Females in Dixon?
There are 130.34 Males per 100 Females in Dixon.
What is the Ratio of Females per 100 Males in Dixon?
There are 76.72 Females per 100 Males in Dixon.
What is the Median Population Age in Dixon?
Median Population Age in Dixon is 41.2 Years.
What is the Average Family Size in Dixon
Average Family Size in Dixon is 2.9 People.
What is the Average Household Size in Dixon
Average Household Size in Dixon is 2.1 People.
How Large is the Labor Force in Dixon?
There are 6,522 People in the Labor Forcein in Dixon.
What is the Percentage of People in the Labor Force in Dixon?
50.0% of People are in the Labor Force in Dixon.
What is the Unemployment Rate in Dixon?
Unemployment Rate in Dixon is 2.9%.