Dallas City, IL Map & Demographics
Dallas City Map
Dallas City Overview
$33,689
PER CAPITA INCOME
$77,670
AVG FAMILY INCOME
$48,125
AVG HOUSEHOLD INCOME
0.50
INEQUALITY / GINI INDEX
846
TOTAL POPULATION
418
MALE POPULATION
428
FEMALE POPULATION
97.66
MALES / 100 FEMALES
102.39
FEMALES / 100 MALES
50.2
MEDIAN AGE
2.8
AVG FAMILY SIZE
2.0
AVG HOUSEHOLD SIZE
394
LABOR FORCE [ PEOPLE ]
58.0%
PERCENT IN LABOR FORCE
7.9%
UNEMPLOYMENT RATE
Dallas City Zip Codes
Dallas City Area Codes
Income in Dallas City
Income Overview in Dallas City
Per Capita Income in Dallas City is $33,689, while median incomes of families and households are $77,670 and $48,125 respectively.
| Characteristic | Number | Measure |
| Per Capita Income | 846 | $33,689 |
| Median Family Income | 215 | $77,670 |
| Mean Family Income | 215 | $73,858 |
| Median Household Income | 404 | $48,125 |
| Mean Household Income | 404 | $67,642 |
| Income Deficit | 215 | $0 |
| Wage / Income Gap (%) | 846 | 0.00% |
| Wage / Income Gap ($) | 846 | 100.00¢ per $1 |
| Gini / Inequality Index | 846 | 0.50 |
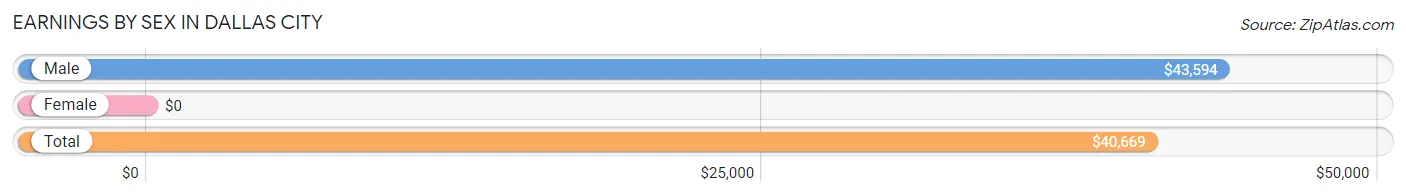
Earnings by Sex in Dallas City
| Sex | Number | Average Earnings |
| Male | 239 (58.7%) | $43,594 |
| Female | 168 (41.3%) | $0 |
| Total | 407 (100.0%) | $40,669 |
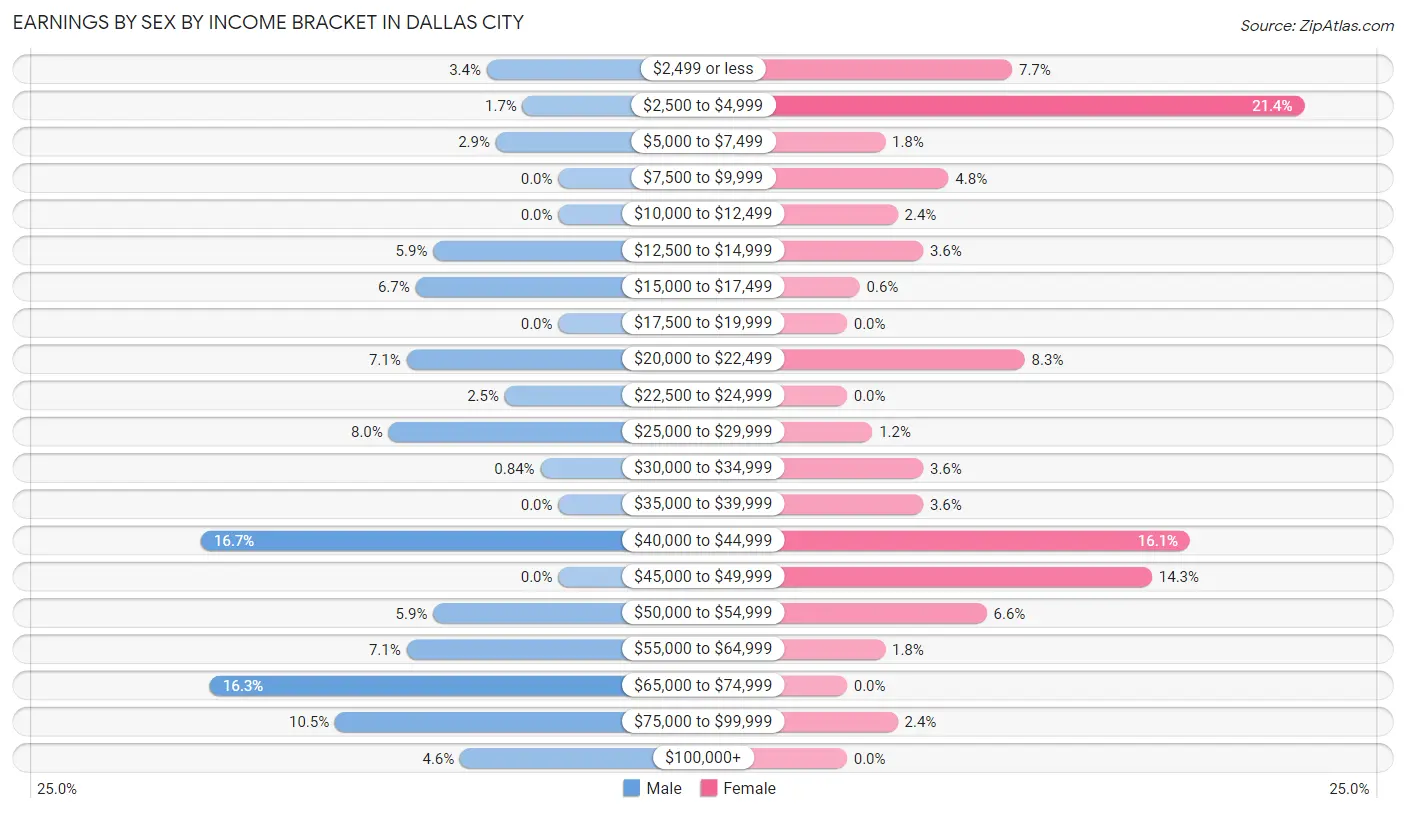
Earnings by Sex by Income Bracket in Dallas City
The most common earnings brackets in Dallas City are $40,000 to $44,999 for men (40 | 16.7%) and $2,500 to $4,999 for women (36 | 21.4%).
| Income | Male | Female |
| $2,499 or less | 8 (3.4%) | 13 (7.7%) |
| $2,500 to $4,999 | 4 (1.7%) | 36 (21.4%) |
| $5,000 to $7,499 | 7 (2.9%) | 3 (1.8%) |
| $7,500 to $9,999 | 0 (0.0%) | 8 (4.8%) |
| $10,000 to $12,499 | 0 (0.0%) | 4 (2.4%) |
| $12,500 to $14,999 | 14 (5.9%) | 6 (3.6%) |
| $15,000 to $17,499 | 16 (6.7%) | 1 (0.6%) |
| $17,500 to $19,999 | 0 (0.0%) | 0 (0.0%) |
| $20,000 to $22,499 | 17 (7.1%) | 14 (8.3%) |
| $22,500 to $24,999 | 6 (2.5%) | 0 (0.0%) |
| $25,000 to $29,999 | 19 (8.0%) | 2 (1.2%) |
| $30,000 to $34,999 | 2 (0.8%) | 6 (3.6%) |
| $35,000 to $39,999 | 0 (0.0%) | 6 (3.6%) |
| $40,000 to $44,999 | 40 (16.7%) | 27 (16.1%) |
| $45,000 to $49,999 | 0 (0.0%) | 24 (14.3%) |
| $50,000 to $54,999 | 14 (5.9%) | 11 (6.6%) |
| $55,000 to $64,999 | 17 (7.1%) | 3 (1.8%) |
| $65,000 to $74,999 | 39 (16.3%) | 0 (0.0%) |
| $75,000 to $99,999 | 25 (10.5%) | 4 (2.4%) |
| $100,000+ | 11 (4.6%) | 0 (0.0%) |
| Total | 239 (100.0%) | 168 (100.0%) |
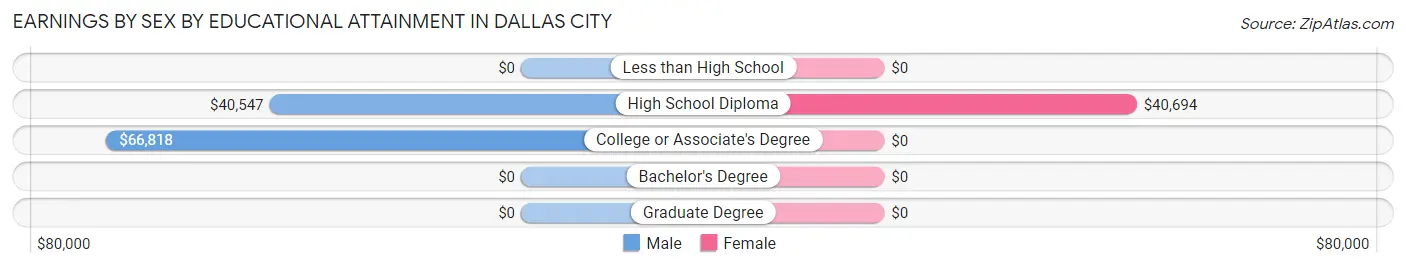
Earnings by Sex by Educational Attainment in Dallas City
Average earnings in Dallas City are $52,292 for men and $30,417 for women, a difference of 41.8%. Men with an educational attainment of college or associate's degree enjoy the highest average annual earnings of $66,818, while those with high school diploma education earn the least with $40,547. Women with an educational attainment of high school diploma earn the most with the average annual earnings of $40,694, while those with high school diploma education have the smallest earnings of $40,694.
| Educational Attainment | Male Income | Female Income |
| Less than High School | - | - |
| High School Diploma | $40,547 | $40,694 |
| College or Associate's Degree | $66,818 | $0 |
| Bachelor's Degree | - | - |
| Graduate Degree | - | - |
| Total | $52,292 | $30,417 |
Family Income in Dallas City
Family Income Brackets in Dallas City
According to the Dallas City family income data, there are 65 families falling into the $75,000 to $99,999 income range, which is the most common income bracket and makes up 30.2% of all families.
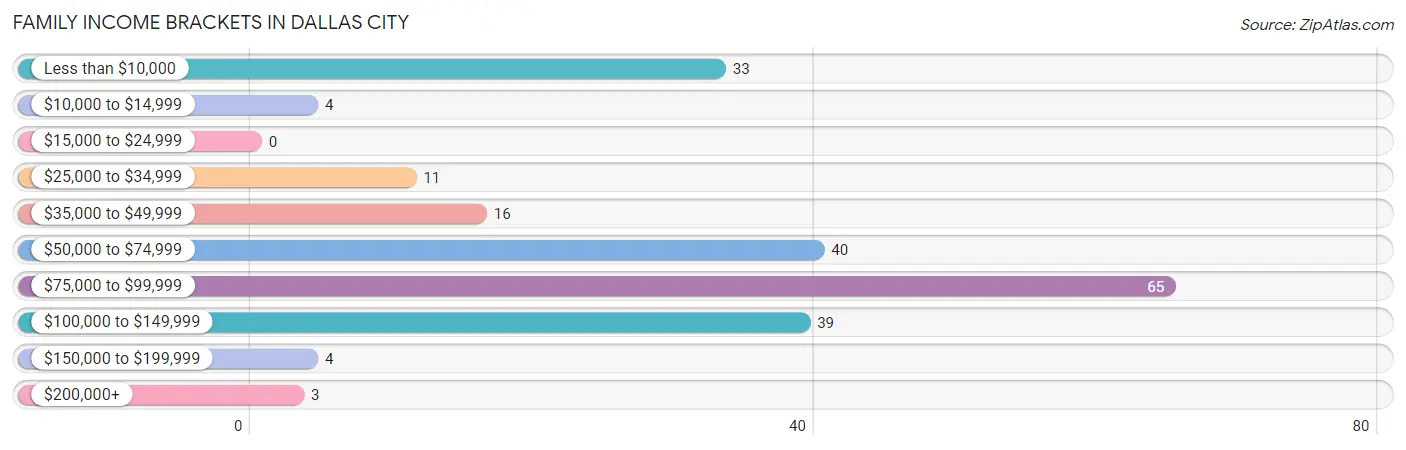
| Income Bracket | # Families | % Families |
| Less than $10,000 | 33 | 15.3% |
| $10,000 to $14,999 | 4 | 1.9% |
| $15,000 to $24,999 | 0 | 0.0% |
| $25,000 to $34,999 | 11 | 5.1% |
| $35,000 to $49,999 | 16 | 7.4% |
| $50,000 to $74,999 | 40 | 18.6% |
| $75,000 to $99,999 | 65 | 30.2% |
| $100,000 to $149,999 | 39 | 18.1% |
| $150,000 to $199,999 | 4 | 1.9% |
| $200,000+ | 3 | 1.4% |
Family Income by Famaliy Size in Dallas City
4-person families (13 | 6.0%) account for the highest median family income in Dallas City with $120,938 per family, while 2-person families (127 | 59.1%) have the highest median income of $39,688 per family member.
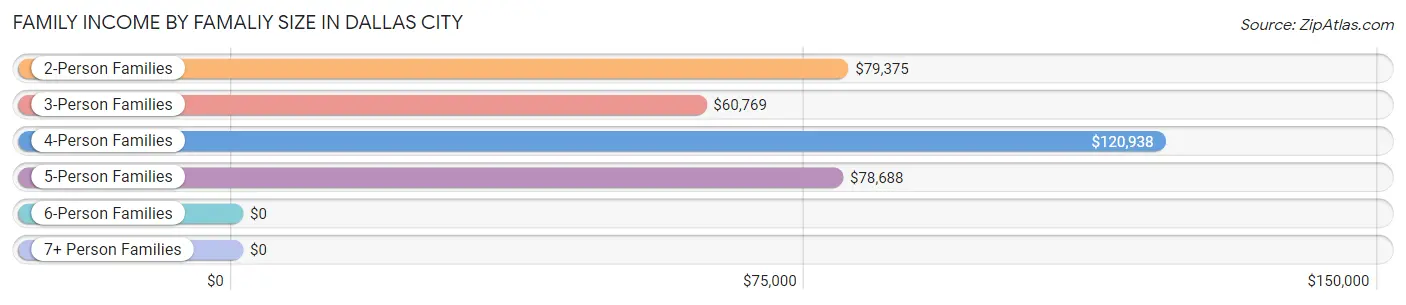
| Income Bracket | # Families | Median Income |
| 2-Person Families | 127 (59.1%) | $79,375 |
| 3-Person Families | 34 (15.8%) | $60,769 |
| 4-Person Families | 13 (6.0%) | $120,938 |
| 5-Person Families | 37 (17.2%) | $78,688 |
| 6-Person Families | 0 (0.0%) | $0 |
| 7+ Person Families | 4 (1.9%) | $0 |
| Total | 215 (100.0%) | $77,670 |
Family Income by Number of Earners in Dallas City
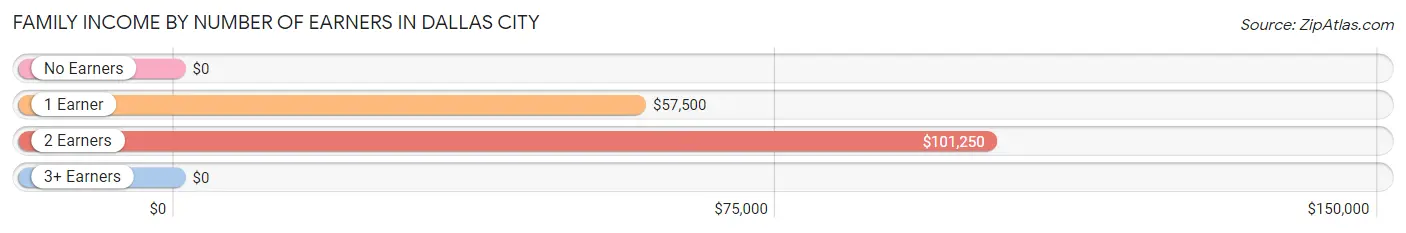
| Number of Earners | # Families | Median Income |
| No Earners | 44 (20.5%) | $0 |
| 1 Earner | 80 (37.2%) | $57,500 |
| 2 Earners | 71 (33.0%) | $101,250 |
| 3+ Earners | 20 (9.3%) | $0 |
| Total | 215 (100.0%) | $77,670 |
Household Income in Dallas City
Household Income Brackets in Dallas City
With 77 households falling in the category, the $50,000 to $74,999 income range is the most frequent in Dallas City, accounting for 19.1% of all households. In contrast, only 7 households (1.7%) fall into the $150,000 to $199,999 income bracket, making it the least populous group.
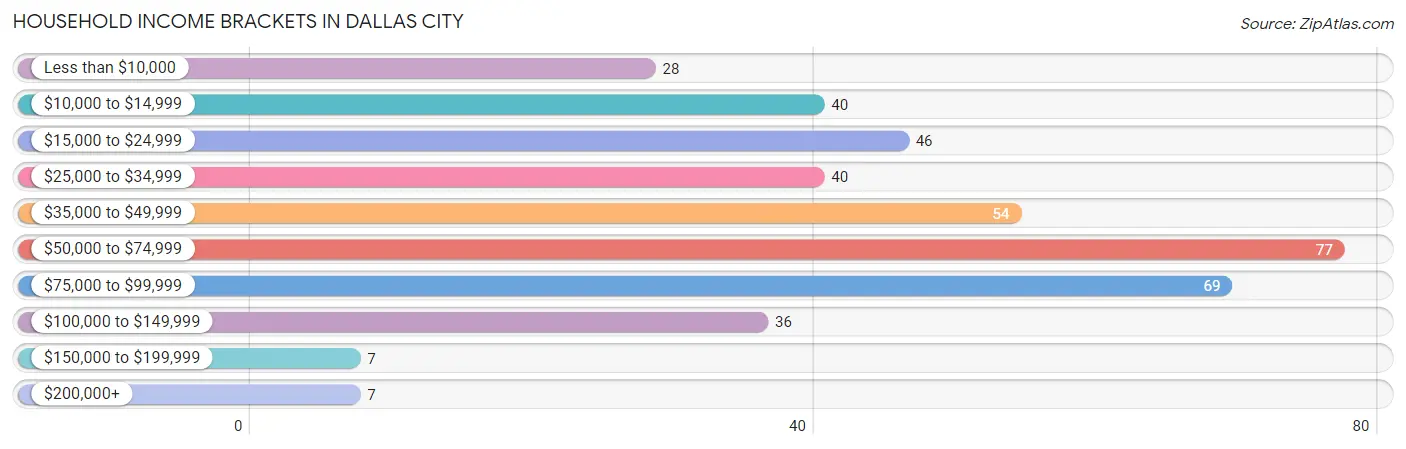
| Income Bracket | # Households | % Households |
| Less than $10,000 | 28 | 6.9% |
| $10,000 to $14,999 | 40 | 9.9% |
| $15,000 to $24,999 | 46 | 11.4% |
| $25,000 to $34,999 | 40 | 9.9% |
| $35,000 to $49,999 | 54 | 13.4% |
| $50,000 to $74,999 | 77 | 19.1% |
| $75,000 to $99,999 | 69 | 17.1% |
| $100,000 to $149,999 | 36 | 8.9% |
| $150,000 to $199,999 | 7 | 1.7% |
| $200,000+ | 7 | 1.7% |
Household Income by Householder Age in Dallas City
The median household income in Dallas City is $48,125, with the highest median household income of $63,750 found in the 45 to 64 years age bracket for the primary householder. A total of 178 households (44.1%) fall into this category. Meanwhile, the 65+ years age bracket for the primary householder has the lowest median household income of $35,588, with 112 households (27.7%) in this group.
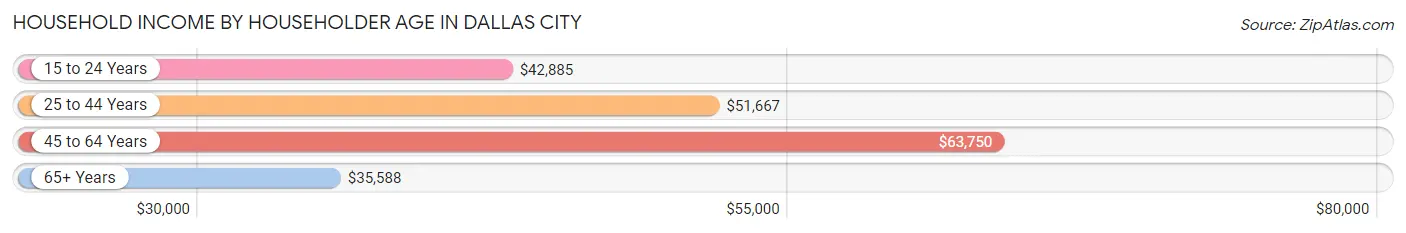
| Income Bracket | # Households | Median Income |
| 15 to 24 Years | 22 (5.4%) | $42,885 |
| 25 to 44 Years | 92 (22.8%) | $51,667 |
| 45 to 64 Years | 178 (44.1%) | $63,750 |
| 65+ Years | 112 (27.7%) | $35,588 |
| Total | 404 (100.0%) | $48,125 |
Poverty in Dallas City
Income Below Poverty by Sex and Age in Dallas City
With 16.4% poverty level for males and 26.6% for females among the residents of Dallas City, 12 to 14 year old males and under 5 year old females are the most vulnerable to poverty, with 8 males (72.7%) and 21 females (84.0%) in their respective age groups living below the poverty level.
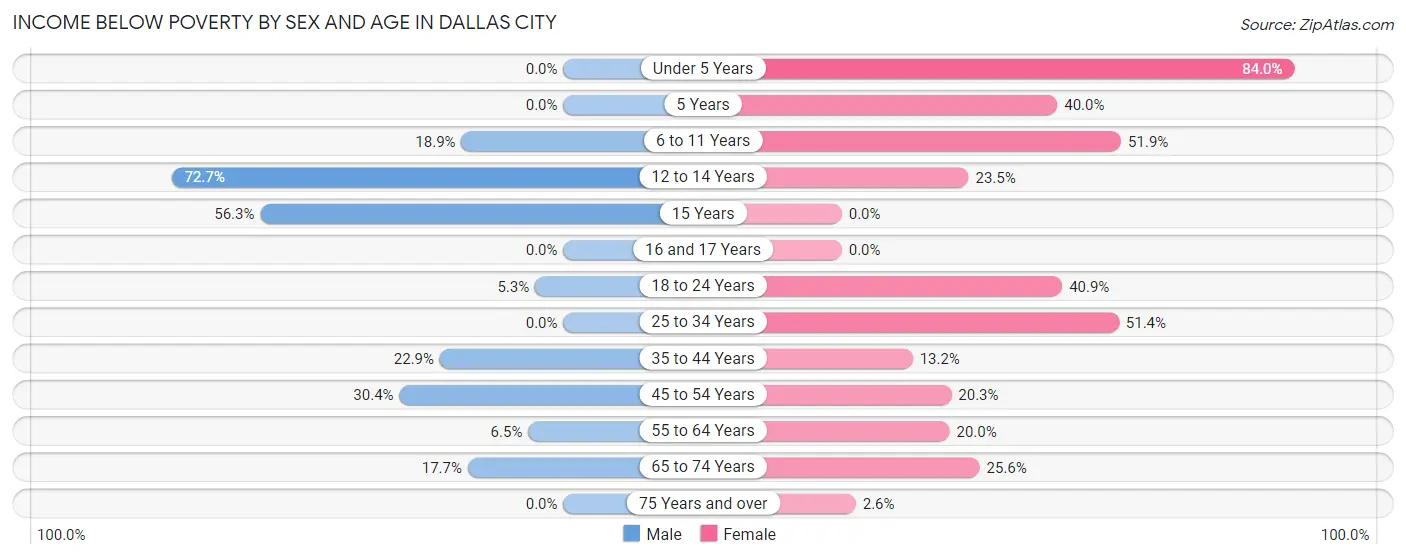
| Age Bracket | Male | Female |
| Under 5 Years | 0 (0.0%) | 21 (84.0%) |
| 5 Years | 0 (0.0%) | 4 (40.0%) |
| 6 to 11 Years | 7 (18.9%) | 14 (51.8%) |
| 12 to 14 Years | 8 (72.7%) | 4 (23.5%) |
| 15 Years | 9 (56.2%) | 0 (0.0%) |
| 16 and 17 Years | 0 (0.0%) | 0 (0.0%) |
| 18 to 24 Years | 2 (5.3%) | 9 (40.9%) |
| 25 to 34 Years | 0 (0.0%) | 18 (51.4%) |
| 35 to 44 Years | 11 (22.9%) | 5 (13.2%) |
| 45 to 54 Years | 14 (30.4%) | 12 (20.3%) |
| 55 to 64 Years | 6 (6.5%) | 14 (20.0%) |
| 65 to 74 Years | 11 (17.7%) | 11 (25.6%) |
| 75 Years and over | 0 (0.0%) | 2 (2.6%) |
| Total | 68 (16.4%) | 114 (26.6%) |
Income Above Poverty by Sex and Age in Dallas City
According to the poverty statistics in Dallas City, males aged under 5 years and females aged 15 years are the age groups that are most secure financially, with 100.0% of males and 100.0% of females in these age groups living above the poverty line.
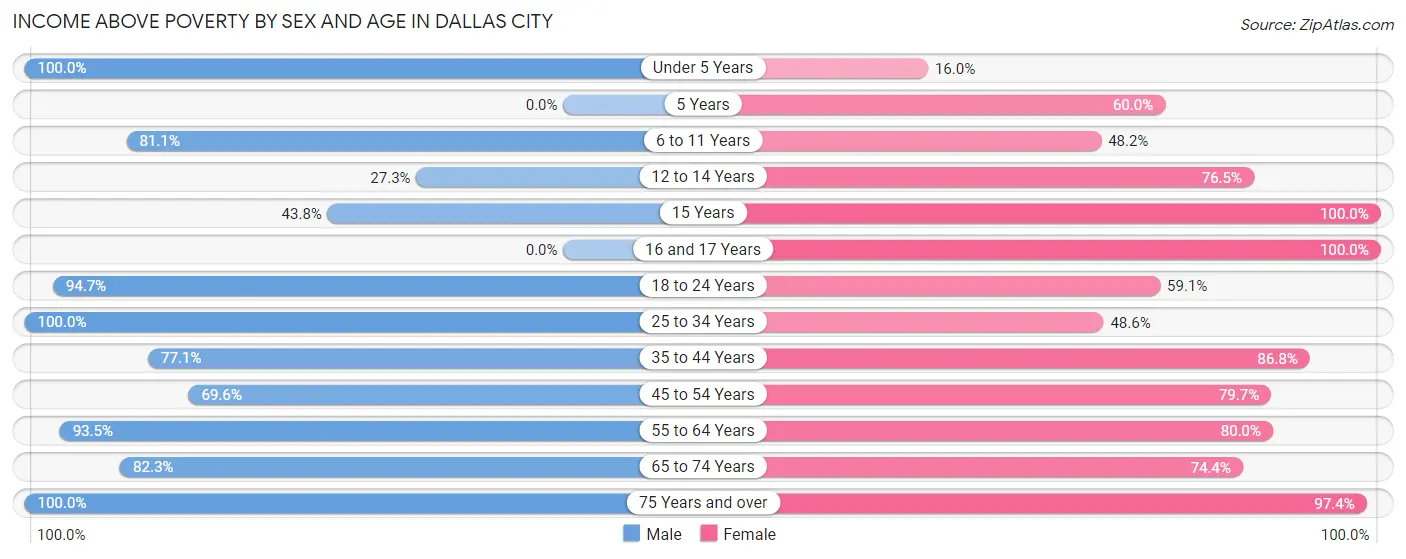
| Age Bracket | Male | Female |
| Under 5 Years | 17 (100.0%) | 4 (16.0%) |
| 5 Years | 0 (0.0%) | 6 (60.0%) |
| 6 to 11 Years | 30 (81.1%) | 13 (48.1%) |
| 12 to 14 Years | 3 (27.3%) | 13 (76.5%) |
| 15 Years | 7 (43.8%) | 4 (100.0%) |
| 16 and 17 Years | 0 (0.0%) | 1 (100.0%) |
| 18 to 24 Years | 36 (94.7%) | 13 (59.1%) |
| 25 to 34 Years | 28 (100.0%) | 17 (48.6%) |
| 35 to 44 Years | 37 (77.1%) | 33 (86.8%) |
| 45 to 54 Years | 32 (69.6%) | 47 (79.7%) |
| 55 to 64 Years | 86 (93.5%) | 56 (80.0%) |
| 65 to 74 Years | 51 (82.3%) | 32 (74.4%) |
| 75 Years and over | 20 (100.0%) | 75 (97.4%) |
| Total | 347 (83.6%) | 314 (73.4%) |
Income Below Poverty Among Married-Couple Families in Dallas City
The poverty statistics for married-couple families in Dallas City show that 2.4% or 4 of the total 167 families live below the poverty line. Families with 5 or more children have the highest poverty rate of 100.0%, comprising of 4 families. On the other hand, families with no children have the lowest poverty rate of 0.0%, which includes 0 families.
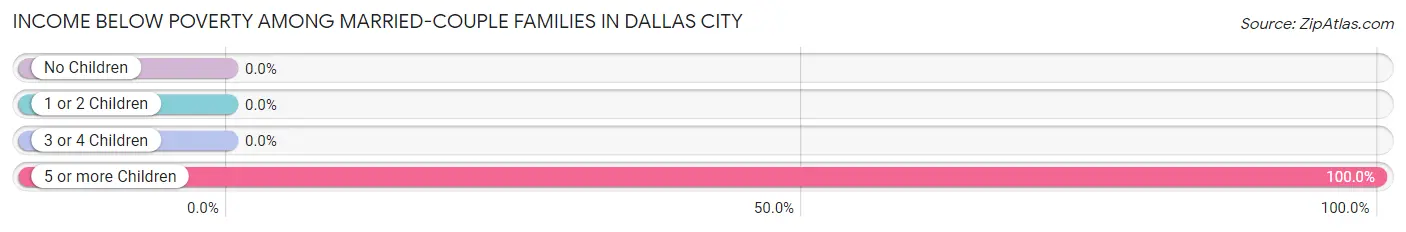
| Children | Above Poverty | Below Poverty |
| No Children | 102 (100.0%) | 0 (0.0%) |
| 1 or 2 Children | 45 (100.0%) | 0 (0.0%) |
| 3 or 4 Children | 16 (100.0%) | 0 (0.0%) |
| 5 or more Children | 0 (0.0%) | 4 (100.0%) |
| Total | 163 (97.6%) | 4 (2.4%) |
Income Below Poverty Among Single-Parent Households in Dallas City
According to the poverty data in Dallas City, 52.4% or 11 single-father households and 96.3% or 26 single-mother households are living below the poverty line. Among single-father households, those with 1 or 2 children have the highest poverty rate, with 11 households (61.1%) experiencing poverty. Likewise, among single-mother households, those with 1 or 2 children have the highest poverty rate, with 22 households (100.0%) falling below the poverty line.
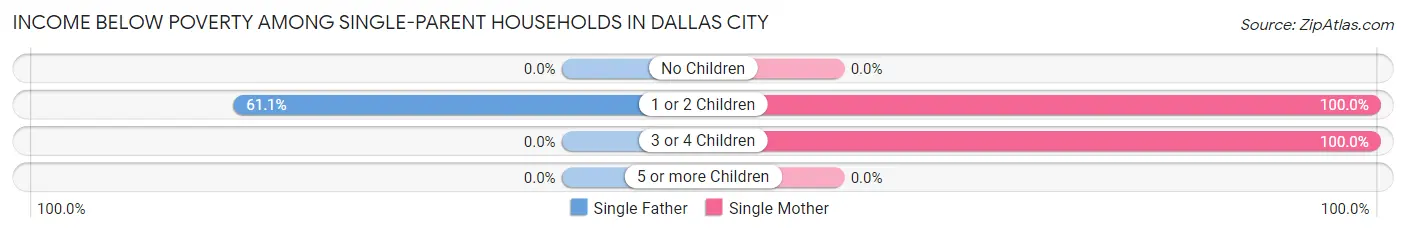
| Children | Single Father | Single Mother |
| No Children | 0 (0.0%) | 0 (0.0%) |
| 1 or 2 Children | 11 (61.1%) | 22 (100.0%) |
| 3 or 4 Children | 0 (0.0%) | 4 (100.0%) |
| 5 or more Children | 0 (0.0%) | 0 (0.0%) |
| Total | 11 (52.4%) | 26 (96.3%) |
Income Below Poverty Among Married-Couple vs Single-Parent Households in Dallas City
The poverty data for Dallas City shows that 4 of the married-couple family households (2.4%) and 37 of the single-parent households (77.1%) are living below the poverty level. Within the married-couple family households, those with 5 or more children have the highest poverty rate, with 4 households (100.0%) falling below the poverty line. Among the single-parent households, those with 3 or 4 children have the highest poverty rate, with 4 household (100.0%) living below poverty.
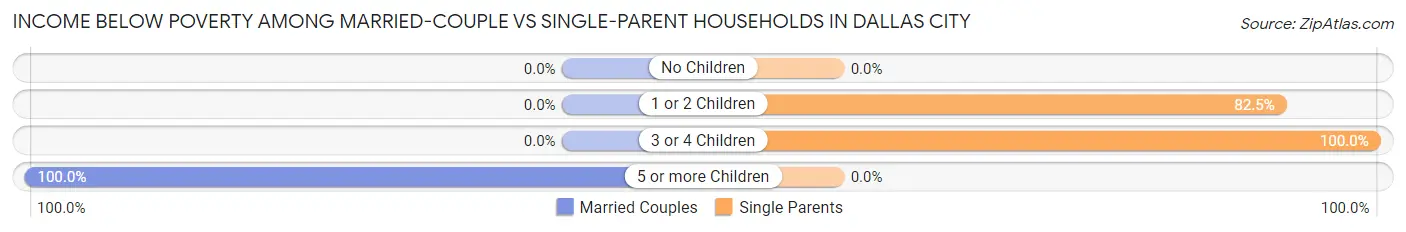
| Children | Married-Couple Families | Single-Parent Households |
| No Children | 0 (0.0%) | 0 (0.0%) |
| 1 or 2 Children | 0 (0.0%) | 33 (82.5%) |
| 3 or 4 Children | 0 (0.0%) | 4 (100.0%) |
| 5 or more Children | 4 (100.0%) | 0 (0.0%) |
| Total | 4 (2.4%) | 37 (77.1%) |
Race in Dallas City
The most populous races in Dallas City are White / Caucasian (788 | 93.1%), Hispanic or Latino (65 | 7.7%), and Two or more Races (36 | 4.3%).
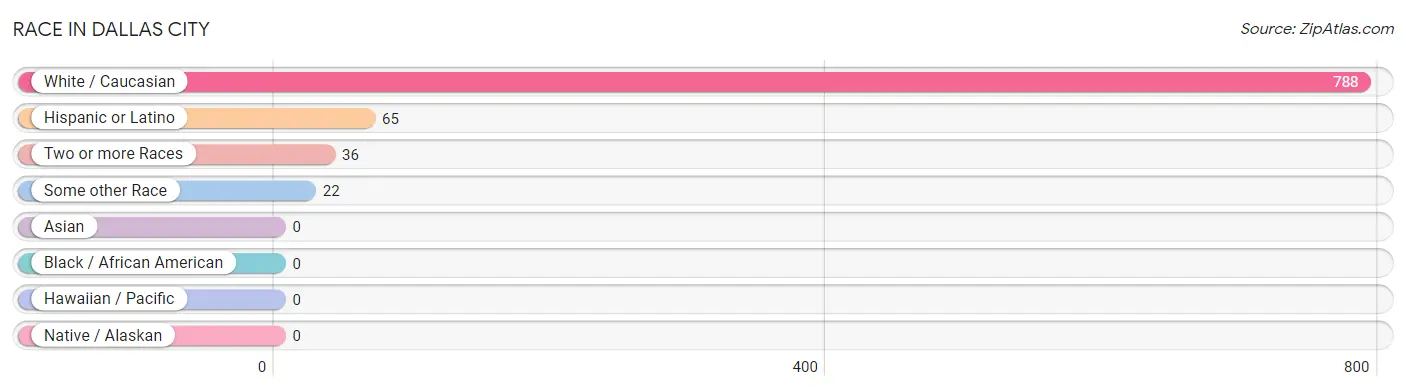
| Race | # Population | % Population |
| Asian | 0 | 0.0% |
| Black / African American | 0 | 0.0% |
| Hawaiian / Pacific | 0 | 0.0% |
| Hispanic or Latino | 65 | 7.7% |
| Native / Alaskan | 0 | 0.0% |
| White / Caucasian | 788 | 93.1% |
| Two or more Races | 36 | 4.3% |
| Some other Race | 22 | 2.6% |
| Total | 846 | 100.0% |
Ancestry in Dallas City
The most populous ancestries reported in Dallas City are German (201 | 23.8%), Irish (127 | 15.0%), Swedish (98 | 11.6%), English (79 | 9.3%), and Mexican (65 | 7.7%), together accounting for 67.4% of all Dallas City residents.
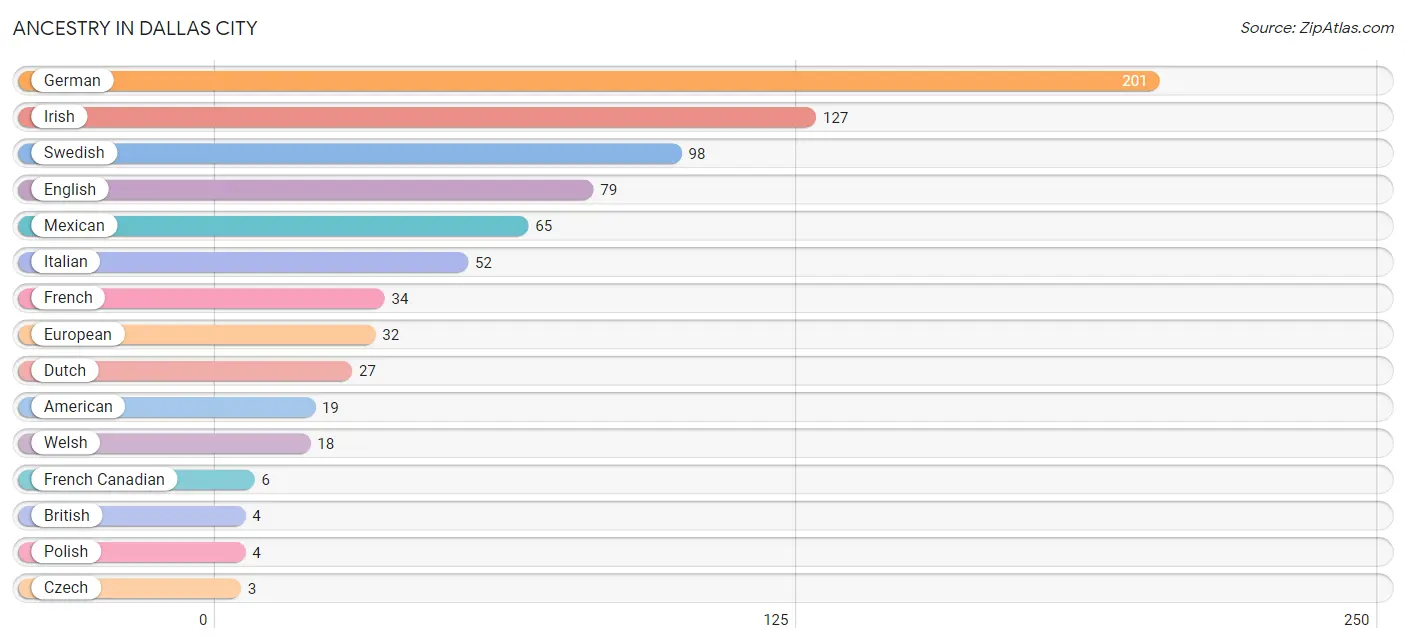
| Ancestry | # Population | % Population |
| American | 19 | 2.2% |
| Blackfeet | 1 | 0.1% |
| British | 4 | 0.5% |
| Czech | 3 | 0.4% |
| Dutch | 27 | 3.2% |
| English | 79 | 9.3% |
| European | 32 | 3.8% |
| French | 34 | 4.0% |
| French Canadian | 6 | 0.7% |
| German | 201 | 23.8% |
| Irish | 127 | 15.0% |
| Italian | 52 | 6.1% |
| Mexican | 65 | 7.7% |
| Norwegian | 3 | 0.4% |
| Polish | 4 | 0.5% |
| Swedish | 98 | 11.6% |
| Welsh | 18 | 2.1% | View All 17 Rows |
Immigrants in Dallas City
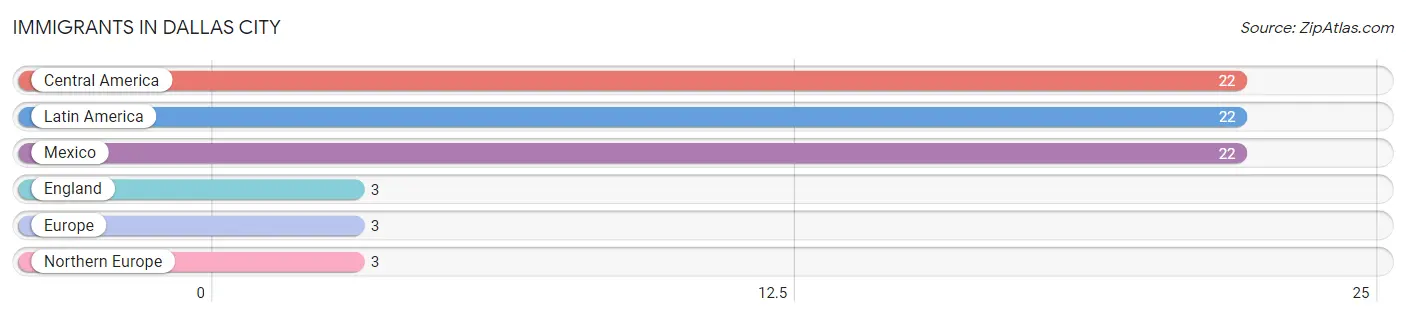
The most numerous immigrant groups reported in Dallas City came from Central America (22 | 2.6%), Latin America (22 | 2.6%), Mexico (22 | 2.6%), England (3 | 0.4%), and Europe (3 | 0.4%), together accounting for 8.5% of all Dallas City residents.
| Immigration Origin | # Population | % Population |
| Central America | 22 | 2.6% |
| England | 3 | 0.4% |
| Europe | 3 | 0.4% |
| Latin America | 22 | 2.6% |
| Mexico | 22 | 2.6% |
| Northern Europe | 3 | 0.4% | View All 6 Rows |
Sex and Age in Dallas City
Sex and Age in Dallas City
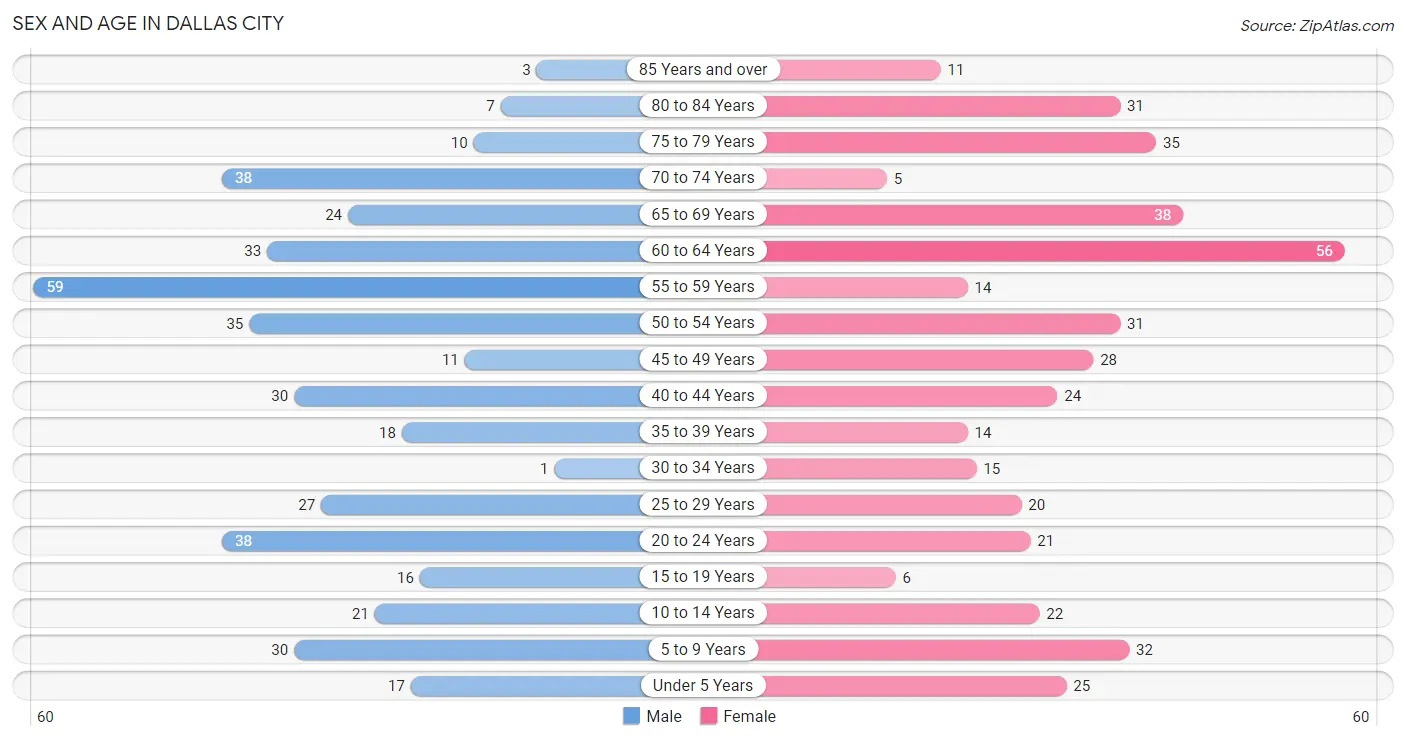
The most populous age groups in Dallas City are 55 to 59 Years (59 | 14.1%) for men and 60 to 64 Years (56 | 13.1%) for women.
| Age Bracket | Male | Female |
| Under 5 Years | 17 (4.1%) | 25 (5.8%) |
| 5 to 9 Years | 30 (7.2%) | 32 (7.5%) |
| 10 to 14 Years | 21 (5.0%) | 22 (5.1%) |
| 15 to 19 Years | 16 (3.8%) | 6 (1.4%) |
| 20 to 24 Years | 38 (9.1%) | 21 (4.9%) |
| 25 to 29 Years | 27 (6.5%) | 20 (4.7%) |
| 30 to 34 Years | 1 (0.2%) | 15 (3.5%) |
| 35 to 39 Years | 18 (4.3%) | 14 (3.3%) |
| 40 to 44 Years | 30 (7.2%) | 24 (5.6%) |
| 45 to 49 Years | 11 (2.6%) | 28 (6.5%) |
| 50 to 54 Years | 35 (8.4%) | 31 (7.2%) |
| 55 to 59 Years | 59 (14.1%) | 14 (3.3%) |
| 60 to 64 Years | 33 (7.9%) | 56 (13.1%) |
| 65 to 69 Years | 24 (5.7%) | 38 (8.9%) |
| 70 to 74 Years | 38 (9.1%) | 5 (1.2%) |
| 75 to 79 Years | 10 (2.4%) | 35 (8.2%) |
| 80 to 84 Years | 7 (1.7%) | 31 (7.2%) |
| 85 Years and over | 3 (0.7%) | 11 (2.6%) |
| Total | 418 (100.0%) | 428 (100.0%) |
Families and Households in Dallas City
Median Family Size in Dallas City
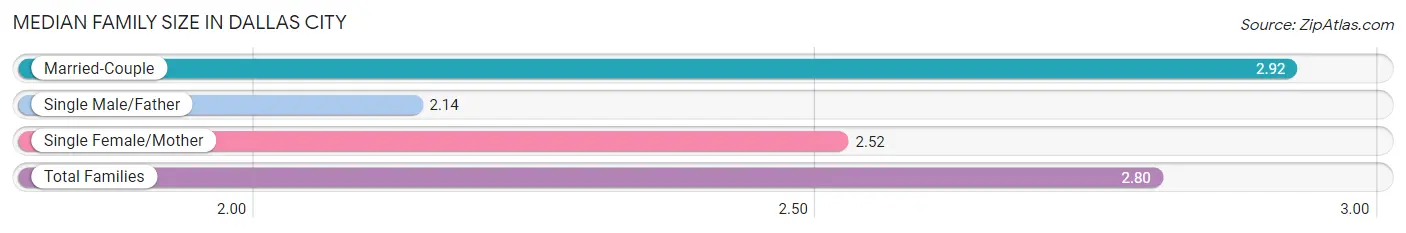
The median family size in Dallas City is 2.80 persons per family, with married-couple families (167 | 77.7%) accounting for the largest median family size of 2.92 persons per family. On the other hand, single male/father families (21 | 9.8%) represent the smallest median family size with 2.14 persons per family.
| Family Type | # Families | Family Size |
| Married-Couple | 167 (77.7%) | 2.92 |
| Single Male/Father | 21 (9.8%) | 2.14 |
| Single Female/Mother | 27 (12.6%) | 2.52 |
| Total Families | 215 (100.0%) | 2.80 |
Median Household Size in Dallas City
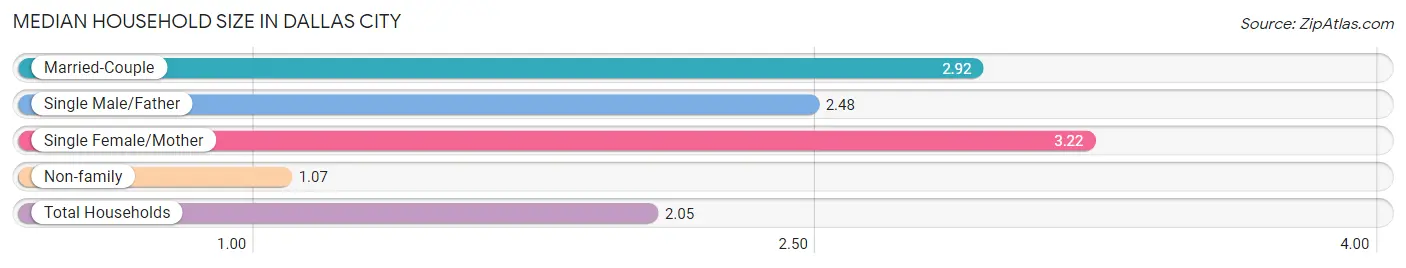
The median household size in Dallas City is 2.05 persons per household, with single female/mother households (27 | 6.7%) accounting for the largest median household size of 3.22 persons per household. non-family households (189 | 46.8%) represent the smallest median household size with 1.07 persons per household.
| Household Type | # Households | Household Size |
| Married-Couple | 167 (41.3%) | 2.92 |
| Single Male/Father | 21 (5.2%) | 2.48 |
| Single Female/Mother | 27 (6.7%) | 3.22 |
| Non-family | 189 (46.8%) | 1.07 |
| Total Households | 404 (100.0%) | 2.05 |
Household Size by Marriage Status in Dallas City
Out of a total of 404 households in Dallas City, 215 (53.2%) are family households, while 189 (46.8%) are nonfamily households. The most numerous type of family households are 2-person households, comprising 109, and the most common type of nonfamily households are 1-person households, comprising 169.
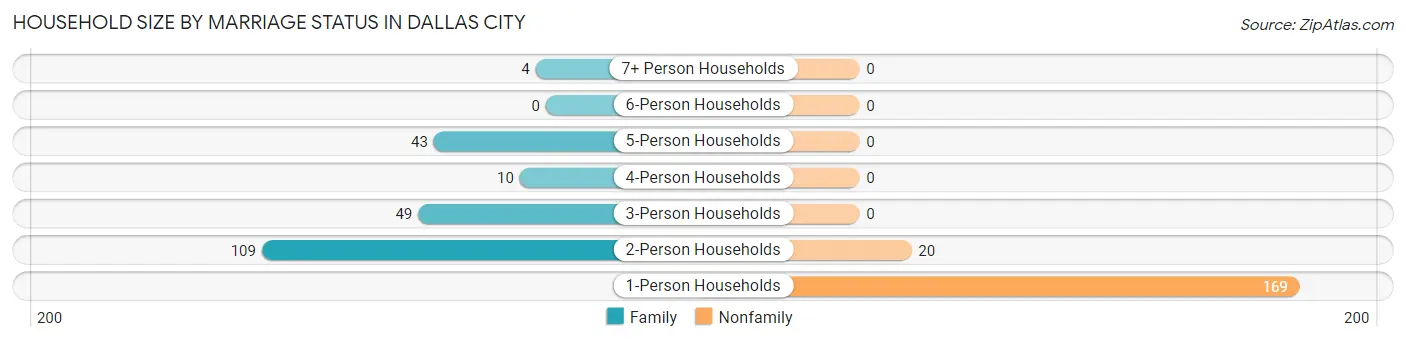
| Household Size | Family Households | Nonfamily Households |
| 1-Person Households | - | 169 (41.8%) |
| 2-Person Households | 109 (27.0%) | 20 (5.0%) |
| 3-Person Households | 49 (12.1%) | 0 (0.0%) |
| 4-Person Households | 10 (2.5%) | 0 (0.0%) |
| 5-Person Households | 43 (10.6%) | 0 (0.0%) |
| 6-Person Households | 0 (0.0%) | 0 (0.0%) |
| 7+ Person Households | 4 (1.0%) | 0 (0.0%) |
| Total | 215 (53.2%) | 189 (46.8%) |
Female Fertility in Dallas City
Fertility by Age in Dallas City
Average fertility rate in Dallas City is 55.0 births per 1,000 women. Women in the age bracket of 20 to 34 years have the highest fertility rate with 125.0 births per 1,000 women. Women in the age bracket of 20 to 34 years acount for 100.0% of all women with births.
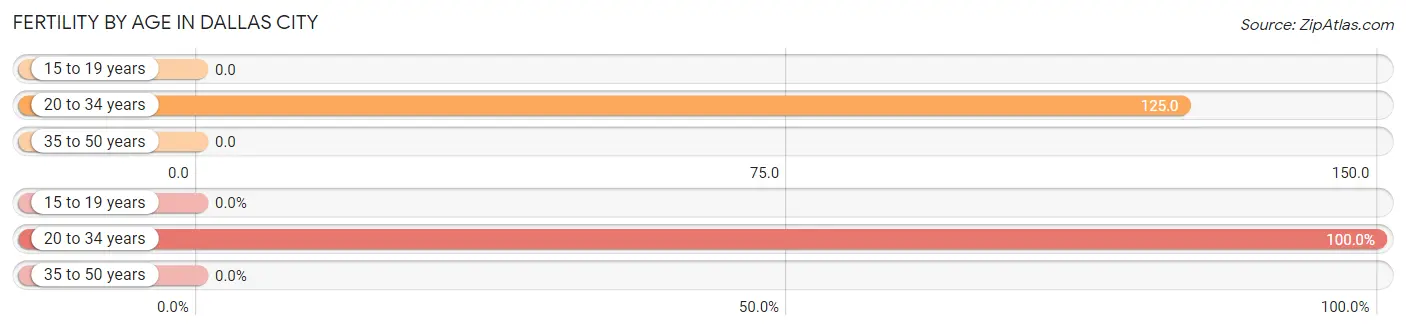
| Age Bracket | Women with Births | Births / 1,000 Women |
| 15 to 19 years | 0 (0.0%) | 0.0 |
| 20 to 34 years | 7 (100.0%) | 125.0 |
| 35 to 50 years | 0 (0.0%) | 0.0 |
| Total | 7 (100.0%) | 55.0 |
Fertility by Age by Marriage Status in Dallas City
57.1% of women with births (7) in Dallas City are married. The highest percentage of unmarried women with births falls into 20 to 34 years age bracket with 42.9% of them unmarried at the time of birth, while the lowest percentage of unmarried women with births belong to 20 to 34 years age bracket with 42.9% of them unmarried.
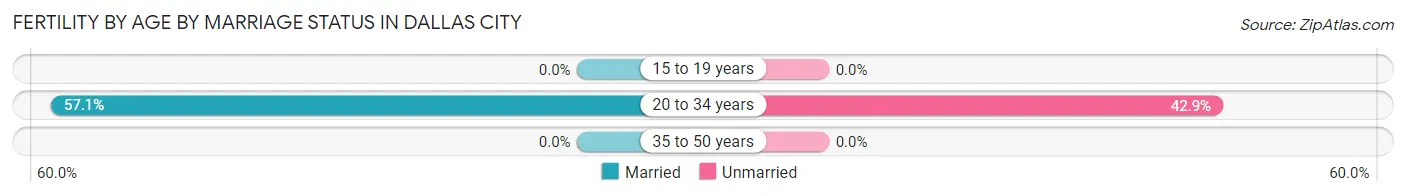
| Age Bracket | Married | Unmarried |
| 15 to 19 years | 0 (0.0%) | 0 (0.0%) |
| 20 to 34 years | 4 (57.1%) | 3 (42.9%) |
| 35 to 50 years | 0 (0.0%) | 0 (0.0%) |
| Total | 4 (57.1%) | 3 (42.9%) |
Fertility by Education in Dallas City
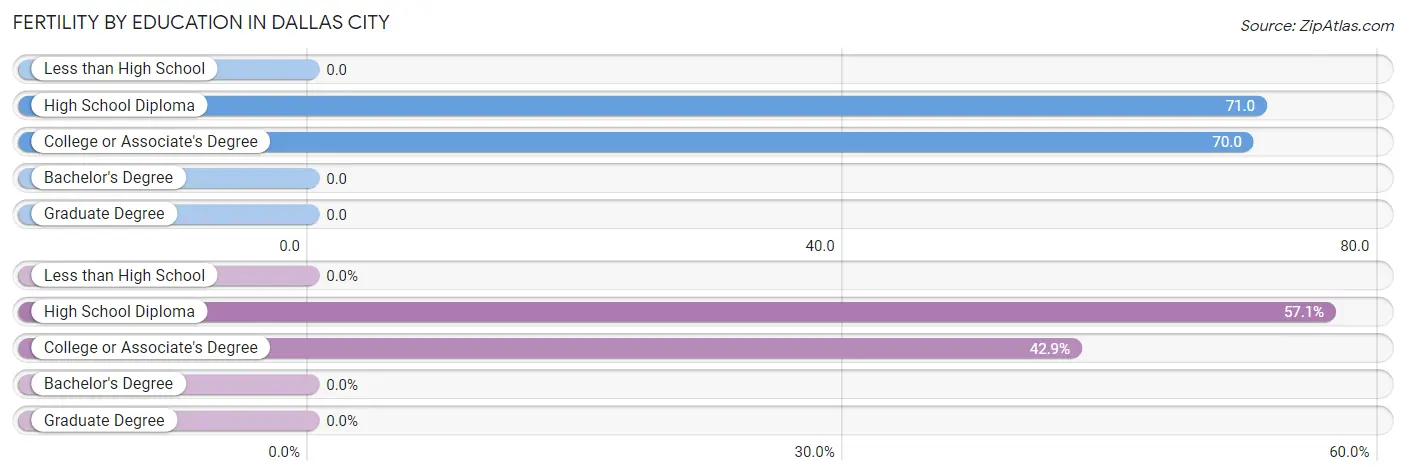
| Educational Attainment | Women with Births | Births / 1,000 Women |
| Less than High School | 0 (0.0%) | 0.0 |
| High School Diploma | 4 (57.1%) | 71.0 |
| College or Associate's Degree | 3 (42.9%) | 70.0 |
| Bachelor's Degree | 0 (0.0%) | 0.0 |
| Graduate Degree | 0 (0.0%) | 0.0 |
| Total | 7 (100.0%) | 55.0 |
Fertility by Education by Marriage Status in Dallas City
42.9% of women with births in Dallas City are unmarried. Women with the educational attainment of high school diploma are most likely to be married with 100.0% of them married at childbirth, while women with the educational attainment of college or associate's degree are least likely to be married with 100.0% of them unmarried at childbirth.
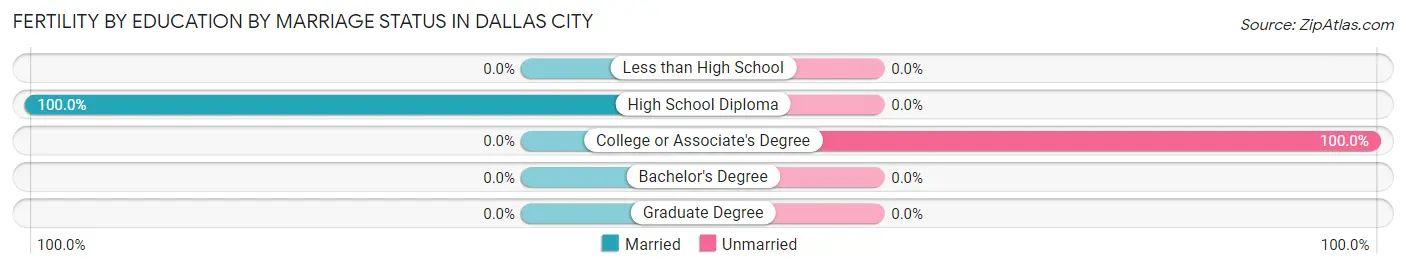
| Educational Attainment | Married | Unmarried |
| Less than High School | 0 (0.0%) | 0 (0.0%) |
| High School Diploma | 4 (100.0%) | 0 (0.0%) |
| College or Associate's Degree | 0 (0.0%) | 3 (100.0%) |
| Bachelor's Degree | 0 (0.0%) | 0 (0.0%) |
| Graduate Degree | 0 (0.0%) | 0 (0.0%) |
| Total | 4 (57.1%) | 3 (42.9%) |
Employment Characteristics in Dallas City
Employment by Class of Employer in Dallas City
Among the 357 employed individuals in Dallas City, private company employees (251 | 70.3%), self-employed (not incorporated) (55 | 15.4%), and self-employed (incorporated) (20 | 5.6%) make up the most common classes of employment.
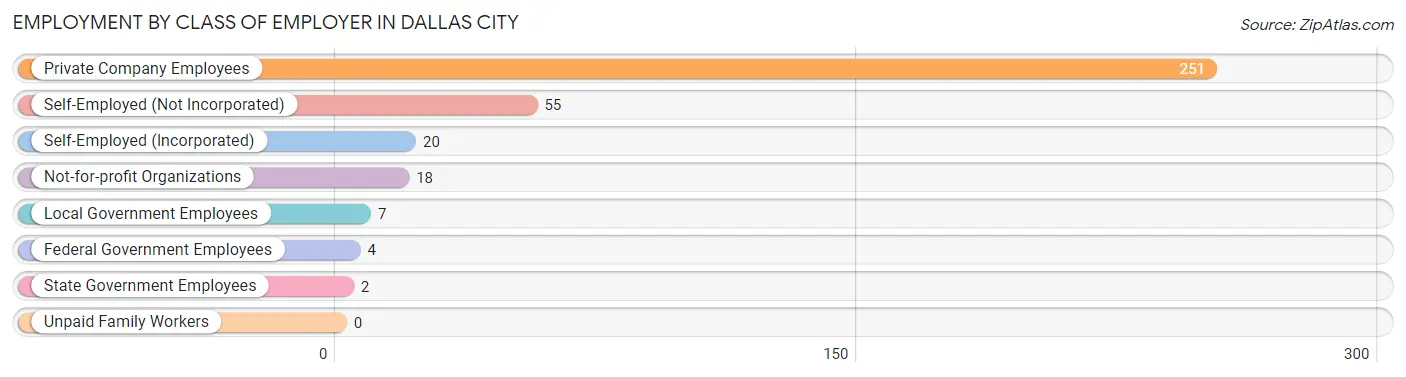
| Employer Class | # Employees | % Employees |
| Private Company Employees | 251 | 70.3% |
| Self-Employed (Incorporated) | 20 | 5.6% |
| Self-Employed (Not Incorporated) | 55 | 15.4% |
| Not-for-profit Organizations | 18 | 5.0% |
| Local Government Employees | 7 | 2.0% |
| State Government Employees | 2 | 0.6% |
| Federal Government Employees | 4 | 1.1% |
| Unpaid Family Workers | 0 | 0.0% |
| Total | 357 | 100.0% |
Employment Status by Age in Dallas City
According to the labor force statistics for Dallas City, out of the total population over 16 years of age (679), 58.0% or 394 individuals are in the labor force, with 7.9% or 31 of them unemployed. The age group with the highest labor force participation rate is 30 to 34 years, with 100.0% or 16 individuals in the labor force. Within the labor force, the 30 to 34 years age range has the highest percentage of unemployed individuals, with 25.0% or 4 of them being unemployed.
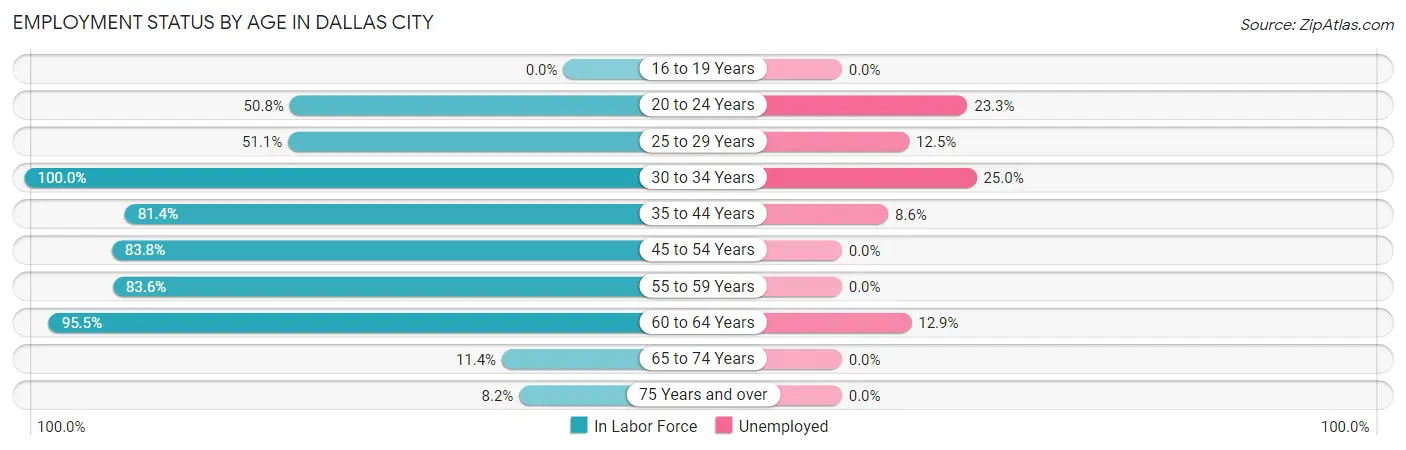
| Age Bracket | In Labor Force | Unemployed |
| 16 to 19 Years | 0 (0.0%) | 0 (0.0%) |
| 20 to 24 Years | 30 (50.8%) | 7 (23.3%) |
| 25 to 29 Years | 24 (51.1%) | 3 (12.5%) |
| 30 to 34 Years | 16 (100.0%) | 4 (25.0%) |
| 35 to 44 Years | 70 (81.4%) | 6 (8.6%) |
| 45 to 54 Years | 88 (83.8%) | 0 (0.0%) |
| 55 to 59 Years | 61 (83.6%) | 0 (0.0%) |
| 60 to 64 Years | 85 (95.5%) | 11 (12.9%) |
| 65 to 74 Years | 12 (11.4%) | 0 (0.0%) |
| 75 Years and over | 8 (8.2%) | 0 (0.0%) |
| Total | 394 (58.0%) | 31 (7.9%) |
Employment Status by Educational Attainment in Dallas City
According to labor force statistics for Dallas City, 82.7% of individuals (344) out of the total population between 25 and 64 years of age (416) are in the labor force, with 7.0% or 24 of them being unemployed. The group with the highest labor force participation rate are those with the educational attainment of bachelor's degree or higher, with 95.2% or 40 individuals in the labor force. Within the labor force, individuals with high school diploma education have the highest percentage of unemployment, with 12.2% or 20 of them being unemployed.
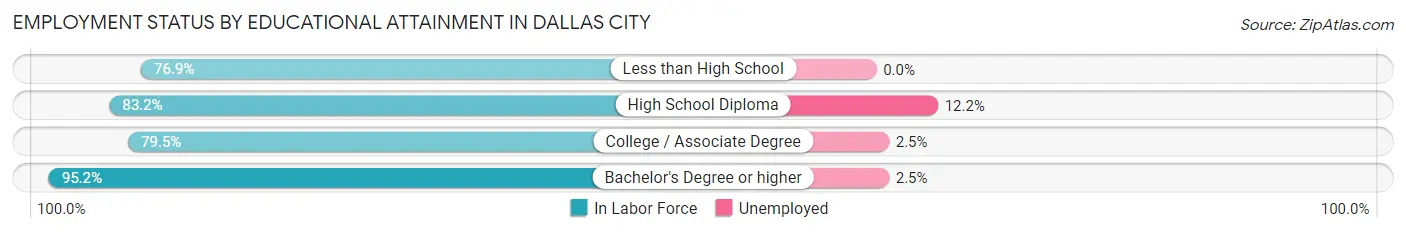
| Educational Attainment | In Labor Force | Unemployed |
| Less than High School | 20 (76.9%) | 0 (0.0%) |
| High School Diploma | 164 (83.2%) | 24 (12.2%) |
| College / Associate Degree | 120 (79.5%) | 4 (2.5%) |
| Bachelor's Degree or higher | 40 (95.2%) | 1 (2.5%) |
| Total | 344 (82.7%) | 29 (7.0%) |
Employment Occupations by Sex in Dallas City
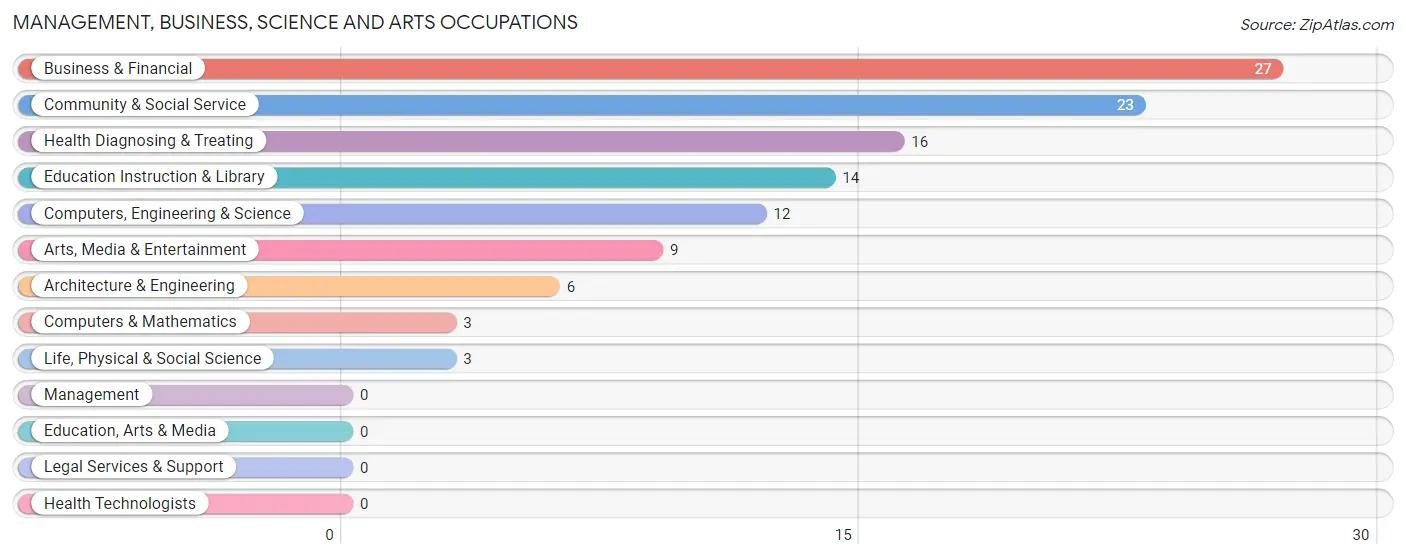
Management, Business, Science and Arts Occupations
The most common Management, Business, Science and Arts occupations in Dallas City are Business & Financial (27 | 7.4%), Community & Social Service (23 | 6.3%), Health Diagnosing & Treating (16 | 4.4%), Education Instruction & Library (14 | 3.9%), and Computers, Engineering & Science (12 | 3.3%).
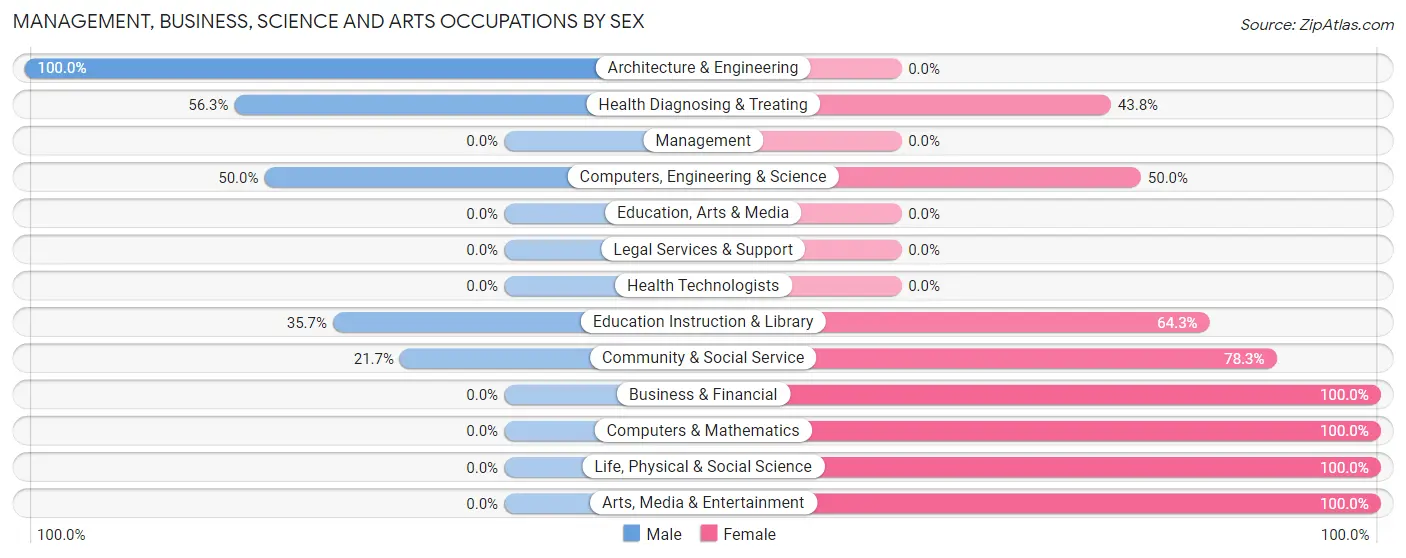
Management, Business, Science and Arts Occupations by Sex
Within the Management, Business, Science and Arts occupations in Dallas City, the most male-oriented occupations are Architecture & Engineering (100.0%), Health Diagnosing & Treating (56.2%), and Computers, Engineering & Science (50.0%), while the most female-oriented occupations are Business & Financial (100.0%), Computers & Mathematics (100.0%), and Life, Physical & Social Science (100.0%).
| Occupation | Male | Female |
| Management | 0 (0.0%) | 0 (0.0%) |
| Business & Financial | 0 (0.0%) | 27 (100.0%) |
| Computers, Engineering & Science | 6 (50.0%) | 6 (50.0%) |
| Computers & Mathematics | 0 (0.0%) | 3 (100.0%) |
| Architecture & Engineering | 6 (100.0%) | 0 (0.0%) |
| Life, Physical & Social Science | 0 (0.0%) | 3 (100.0%) |
| Community & Social Service | 5 (21.7%) | 18 (78.3%) |
| Education, Arts & Media | 0 (0.0%) | 0 (0.0%) |
| Legal Services & Support | 0 (0.0%) | 0 (0.0%) |
| Education Instruction & Library | 5 (35.7%) | 9 (64.3%) |
| Arts, Media & Entertainment | 0 (0.0%) | 9 (100.0%) |
| Health Diagnosing & Treating | 9 (56.2%) | 7 (43.8%) |
| Health Technologists | 0 (0.0%) | 0 (0.0%) |
| Total (Category) | 20 (25.6%) | 58 (74.4%) |
| Total (Overall) | 210 (57.9%) | 153 (42.1%) |
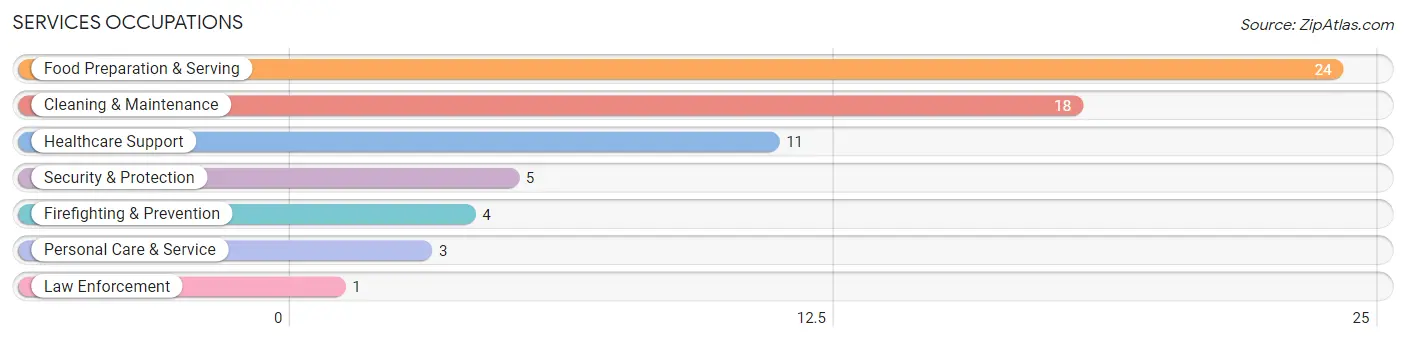
Services Occupations
The most common Services occupations in Dallas City are Food Preparation & Serving (24 | 6.6%), Cleaning & Maintenance (18 | 5.0%), Healthcare Support (11 | 3.0%), Security & Protection (5 | 1.4%), and Firefighting & Prevention (4 | 1.1%).
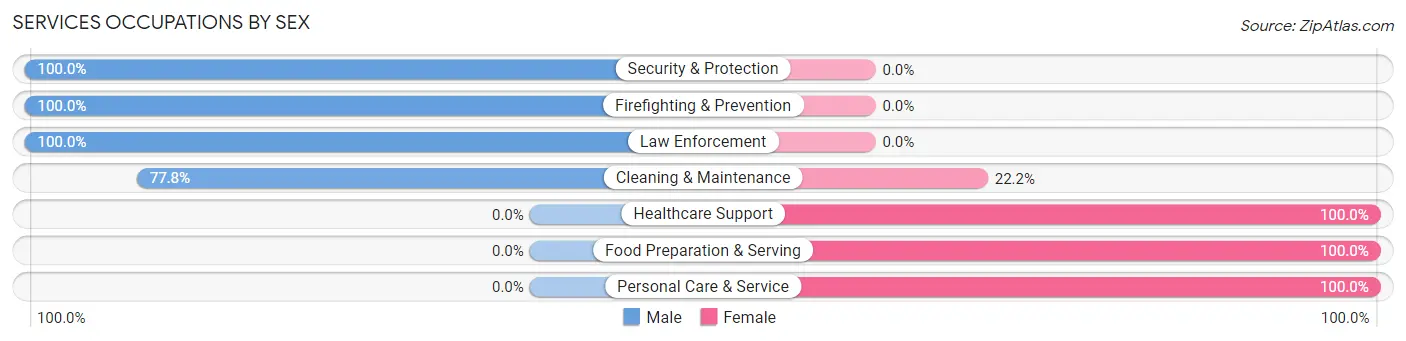
Services Occupations by Sex
Within the Services occupations in Dallas City, the most male-oriented occupations are Security & Protection (100.0%), Firefighting & Prevention (100.0%), and Law Enforcement (100.0%), while the most female-oriented occupations are Healthcare Support (100.0%), Food Preparation & Serving (100.0%), and Personal Care & Service (100.0%).
| Occupation | Male | Female |
| Healthcare Support | 0 (0.0%) | 11 (100.0%) |
| Security & Protection | 5 (100.0%) | 0 (0.0%) |
| Firefighting & Prevention | 4 (100.0%) | 0 (0.0%) |
| Law Enforcement | 1 (100.0%) | 0 (0.0%) |
| Food Preparation & Serving | 0 (0.0%) | 24 (100.0%) |
| Cleaning & Maintenance | 14 (77.8%) | 4 (22.2%) |
| Personal Care & Service | 0 (0.0%) | 3 (100.0%) |
| Total (Category) | 19 (31.1%) | 42 (68.9%) |
| Total (Overall) | 210 (57.9%) | 153 (42.1%) |
Sales and Office Occupations
The most common Sales and Office occupations in Dallas City are Office & Administration (21 | 5.8%), and Sales & Related (18 | 5.0%).

Sales and Office Occupations by Sex

| Occupation | Male | Female |
| Sales & Related | 5 (27.8%) | 13 (72.2%) |
| Office & Administration | 8 (38.1%) | 13 (61.9%) |
| Total (Category) | 13 (33.3%) | 26 (66.7%) |
| Total (Overall) | 210 (57.9%) | 153 (42.1%) |
Natural Resources, Construction and Maintenance Occupations
The most common Natural Resources, Construction and Maintenance occupations in Dallas City are Construction & Extraction (36 | 9.9%), and Installation, Maintenance & Repair (15 | 4.1%).
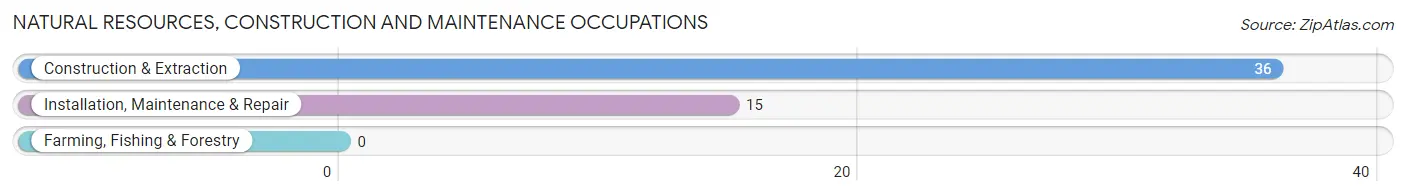
Natural Resources, Construction and Maintenance Occupations by Sex

| Occupation | Male | Female |
| Farming, Fishing & Forestry | 0 (0.0%) | 0 (0.0%) |
| Construction & Extraction | 36 (100.0%) | 0 (0.0%) |
| Installation, Maintenance & Repair | 15 (100.0%) | 0 (0.0%) |
| Total (Category) | 51 (100.0%) | 0 (0.0%) |
| Total (Overall) | 210 (57.9%) | 153 (42.1%) |
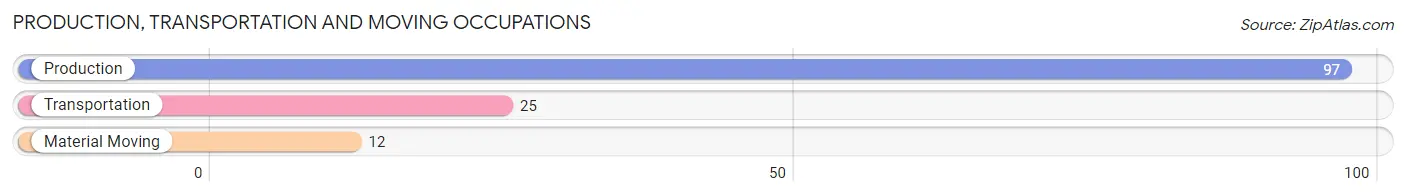
Production, Transportation and Moving Occupations
The most common Production, Transportation and Moving occupations in Dallas City are Production (97 | 26.7%), Transportation (25 | 6.9%), and Material Moving (12 | 3.3%).
Production, Transportation and Moving Occupations by Sex
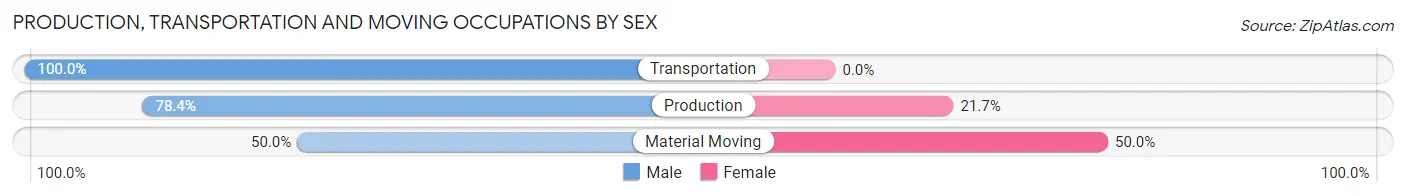
| Occupation | Male | Female |
| Production | 76 (78.3%) | 21 (21.6%) |
| Transportation | 25 (100.0%) | 0 (0.0%) |
| Material Moving | 6 (50.0%) | 6 (50.0%) |
| Total (Category) | 107 (79.8%) | 27 (20.2%) |
| Total (Overall) | 210 (57.9%) | 153 (42.1%) |
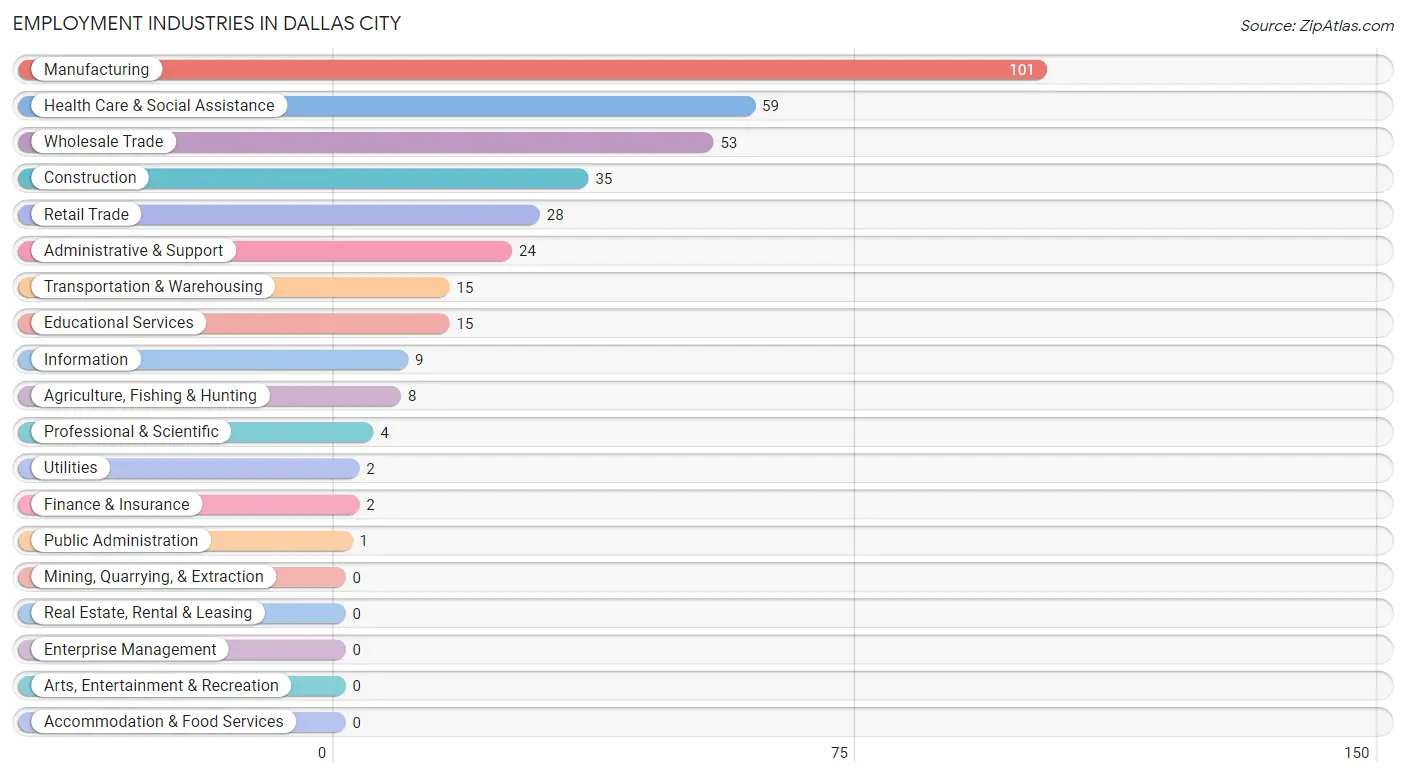
Employment Industries by Sex in Dallas City
Employment Industries in Dallas City
The major employment industries in Dallas City include Manufacturing (101 | 27.8%), Health Care & Social Assistance (59 | 16.3%), Wholesale Trade (53 | 14.6%), Construction (35 | 9.6%), and Retail Trade (28 | 7.7%).
Employment Industries by Sex in Dallas City
The Dallas City industries that see more men than women are Construction (100.0%), Transportation & Warehousing (100.0%), and Utilities (100.0%), whereas the industries that tend to have a higher number of women are Agriculture, Fishing & Hunting (100.0%), Information (100.0%), and Health Care & Social Assistance (79.7%).
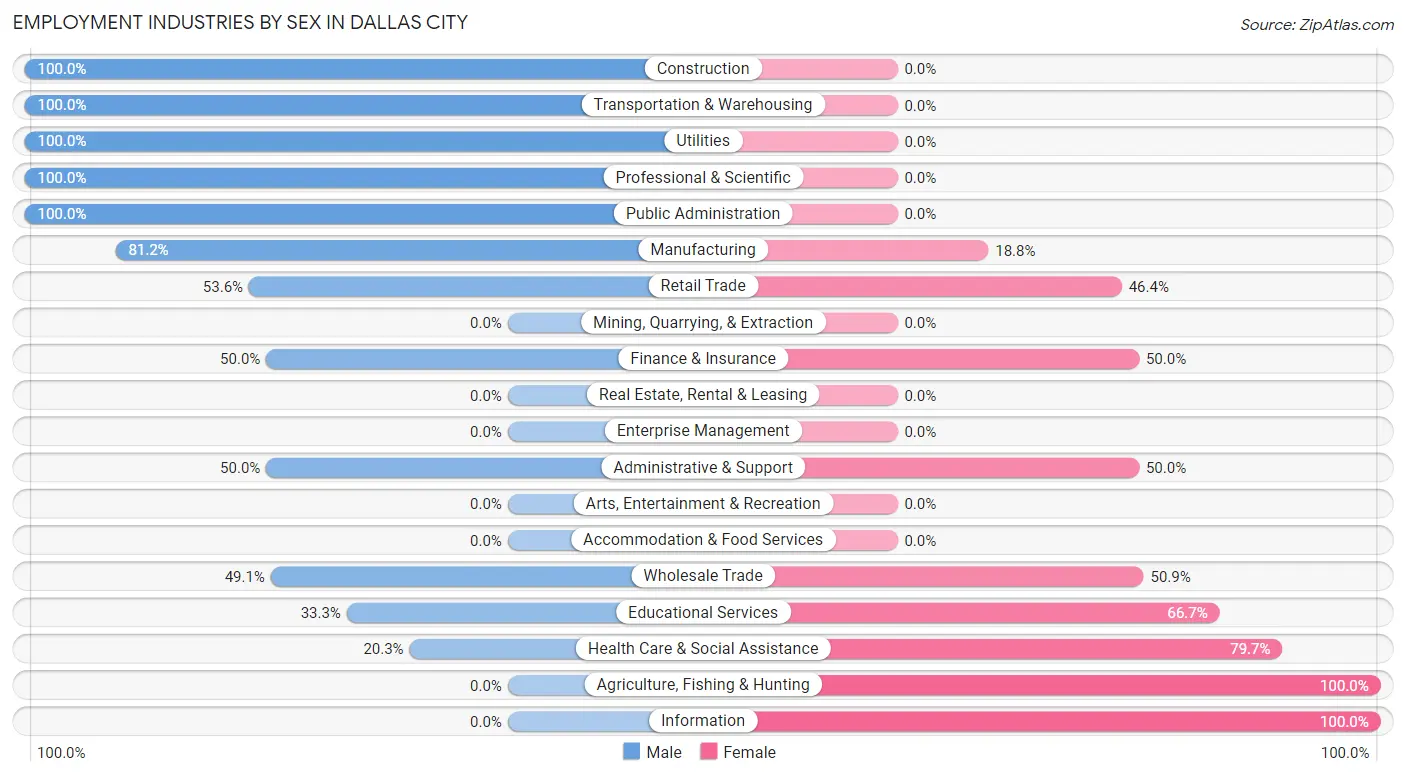
| Industry | Male | Female |
| Agriculture, Fishing & Hunting | 0 (0.0%) | 8 (100.0%) |
| Mining, Quarrying, & Extraction | 0 (0.0%) | 0 (0.0%) |
| Construction | 35 (100.0%) | 0 (0.0%) |
| Manufacturing | 82 (81.2%) | 19 (18.8%) |
| Wholesale Trade | 26 (49.1%) | 27 (50.9%) |
| Retail Trade | 15 (53.6%) | 13 (46.4%) |
| Transportation & Warehousing | 15 (100.0%) | 0 (0.0%) |
| Utilities | 2 (100.0%) | 0 (0.0%) |
| Information | 0 (0.0%) | 9 (100.0%) |
| Finance & Insurance | 1 (50.0%) | 1 (50.0%) |
| Real Estate, Rental & Leasing | 0 (0.0%) | 0 (0.0%) |
| Professional & Scientific | 4 (100.0%) | 0 (0.0%) |
| Enterprise Management | 0 (0.0%) | 0 (0.0%) |
| Administrative & Support | 12 (50.0%) | 12 (50.0%) |
| Educational Services | 5 (33.3%) | 10 (66.7%) |
| Health Care & Social Assistance | 12 (20.3%) | 47 (79.7%) |
| Arts, Entertainment & Recreation | 0 (0.0%) | 0 (0.0%) |
| Accommodation & Food Services | 0 (0.0%) | 0 (0.0%) |
| Public Administration | 1 (100.0%) | 0 (0.0%) |
| Total | 210 (57.9%) | 153 (42.1%) |
Education in Dallas City
School Enrollment in Dallas City
The most common levels of schooling among the 129 students in Dallas City are elementary school (38 | 29.5%), middle school (34 | 26.4%), and high school (22 | 17.1%).
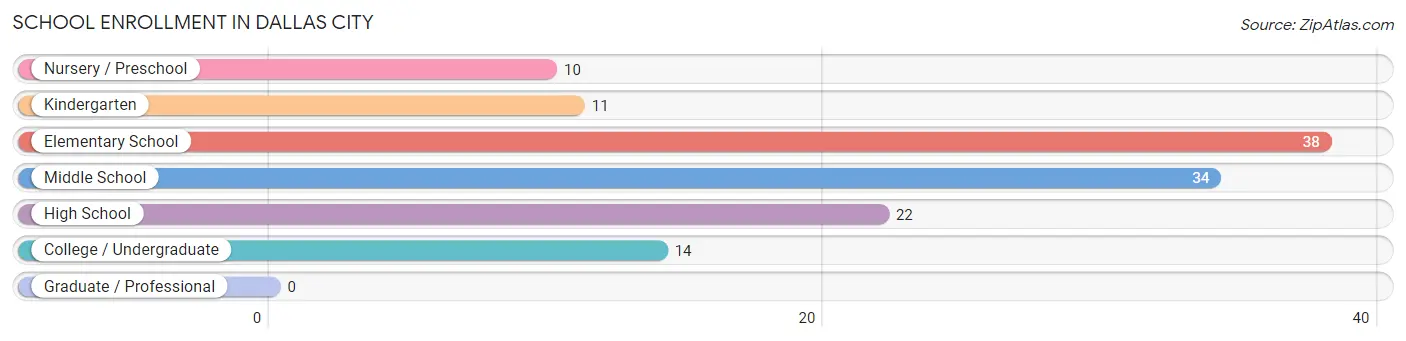
| School Level | # Students | % Students |
| Nursery / Preschool | 10 | 7.7% |
| Kindergarten | 11 | 8.5% |
| Elementary School | 38 | 29.5% |
| Middle School | 34 | 26.4% |
| High School | 22 | 17.1% |
| College / Undergraduate | 14 | 10.8% |
| Graduate / Professional | 0 | 0.0% |
| Total | 129 | 100.0% |
School Enrollment by Age by Funding Source in Dallas City
Out of a total of 129 students who are enrolled in schools in Dallas City, 45 (34.9%) attend a private institution, while the remaining 84 (65.1%) are enrolled in public schools. The age group of 15 to 17 year olds has the highest likelihood of being enrolled in private schools, with 20 (95.2% in the age bracket) enrolled. Conversely, the age group of 3 to 4 year olds has the lowest likelihood of being enrolled in a private school, with 5 (100.0% in the age bracket) attending a public institution.
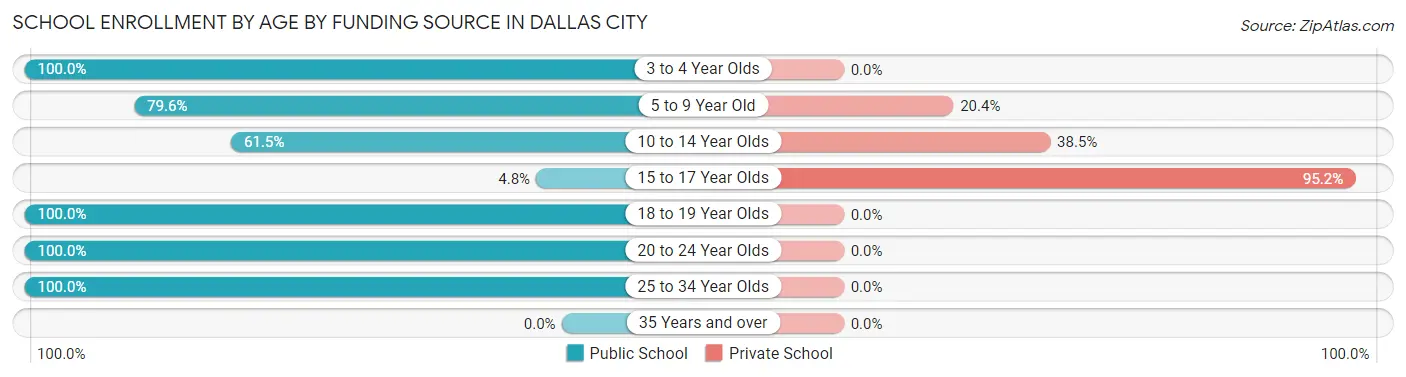
| Age Bracket | Public School | Private School |
| 3 to 4 Year Olds | 5 (100.0%) | 0 (0.0%) |
| 5 to 9 Year Old | 39 (79.6%) | 10 (20.4%) |
| 10 to 14 Year Olds | 24 (61.5%) | 15 (38.5%) |
| 15 to 17 Year Olds | 1 (4.8%) | 20 (95.2%) |
| 18 to 19 Year Olds | 1 (100.0%) | 0 (0.0%) |
| 20 to 24 Year Olds | 8 (100.0%) | 0 (0.0%) |
| 25 to 34 Year Olds | 6 (100.0%) | 0 (0.0%) |
| 35 Years and over | 0 (0.0%) | 0 (0.0%) |
| Total | 84 (65.1%) | 45 (34.9%) |
Educational Attainment by Field of Study in Dallas City
Business (12 | 22.6%), arts & humanities (11 | 20.7%), psychology (6 | 11.3%), engineering (5 | 9.4%), and bio, nature & agricultural (3 | 5.7%) are the most common fields of study among 53 individuals in Dallas City who have obtained a bachelor's degree or higher.
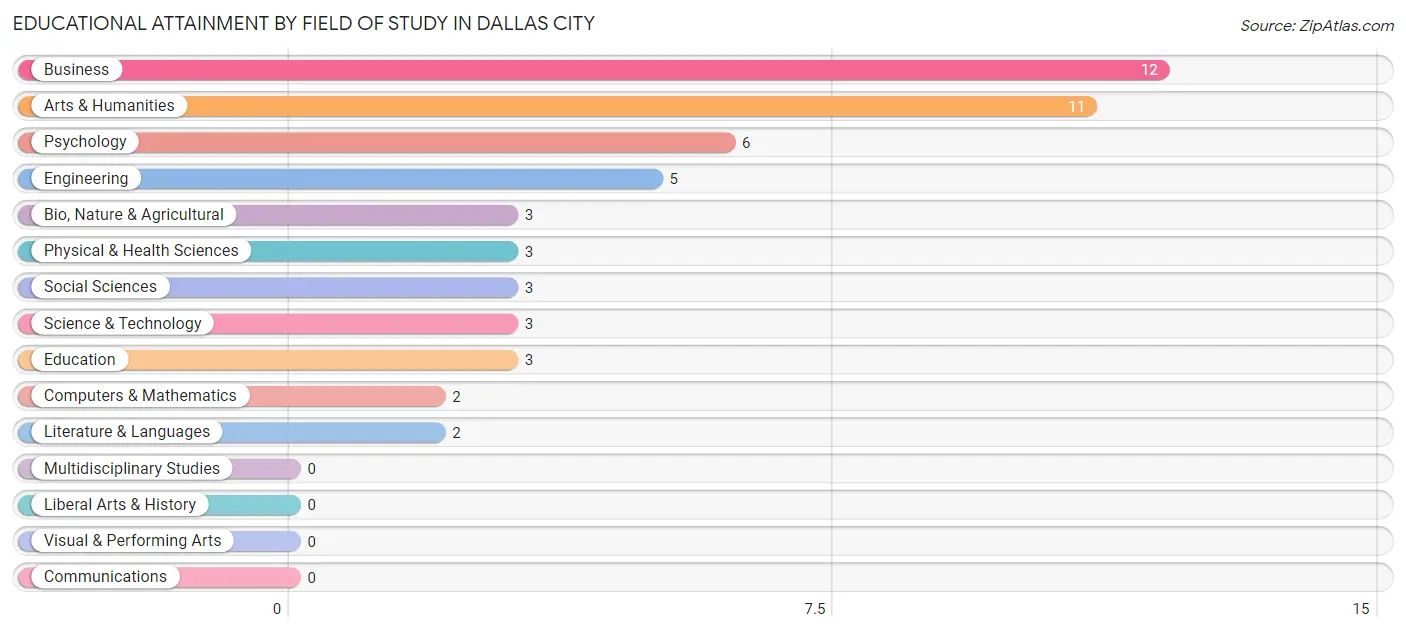
| Field of Study | # Graduates | % Graduates |
| Computers & Mathematics | 2 | 3.8% |
| Bio, Nature & Agricultural | 3 | 5.7% |
| Physical & Health Sciences | 3 | 5.7% |
| Psychology | 6 | 11.3% |
| Social Sciences | 3 | 5.7% |
| Engineering | 5 | 9.4% |
| Multidisciplinary Studies | 0 | 0.0% |
| Science & Technology | 3 | 5.7% |
| Business | 12 | 22.6% |
| Education | 3 | 5.7% |
| Literature & Languages | 2 | 3.8% |
| Liberal Arts & History | 0 | 0.0% |
| Visual & Performing Arts | 0 | 0.0% |
| Communications | 0 | 0.0% |
| Arts & Humanities | 11 | 20.7% |
| Total | 53 | 100.0% |
Transportation & Commute in Dallas City
Vehicle Availability by Sex in Dallas City
The most prevalent vehicle ownership categories in Dallas City are males with 2 vehicles (96, accounting for 46.4%) and females with 2 vehicles (67, making up 67.1%).
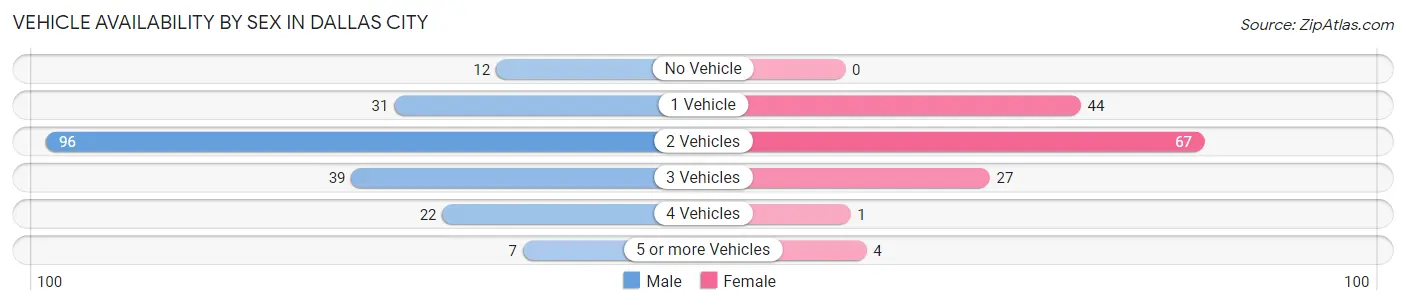
| Vehicles Available | Male | Female |
| No Vehicle | 12 (5.8%) | 0 (0.0%) |
| 1 Vehicle | 31 (15.0%) | 44 (30.8%) |
| 2 Vehicles | 96 (46.4%) | 67 (46.9%) |
| 3 Vehicles | 39 (18.8%) | 27 (18.9%) |
| 4 Vehicles | 22 (10.6%) | 1 (0.7%) |
| 5 or more Vehicles | 7 (3.4%) | 4 (2.8%) |
| Total | 207 (100.0%) | 143 (100.0%) |
Commute Time in Dallas City
The most frequently occuring commute durations in Dallas City are 30 to 34 minutes (100 commuters, 31.1%), 20 to 24 minutes (61 commuters, 18.9%), and 45 to 59 minutes (53 commuters, 16.5%).
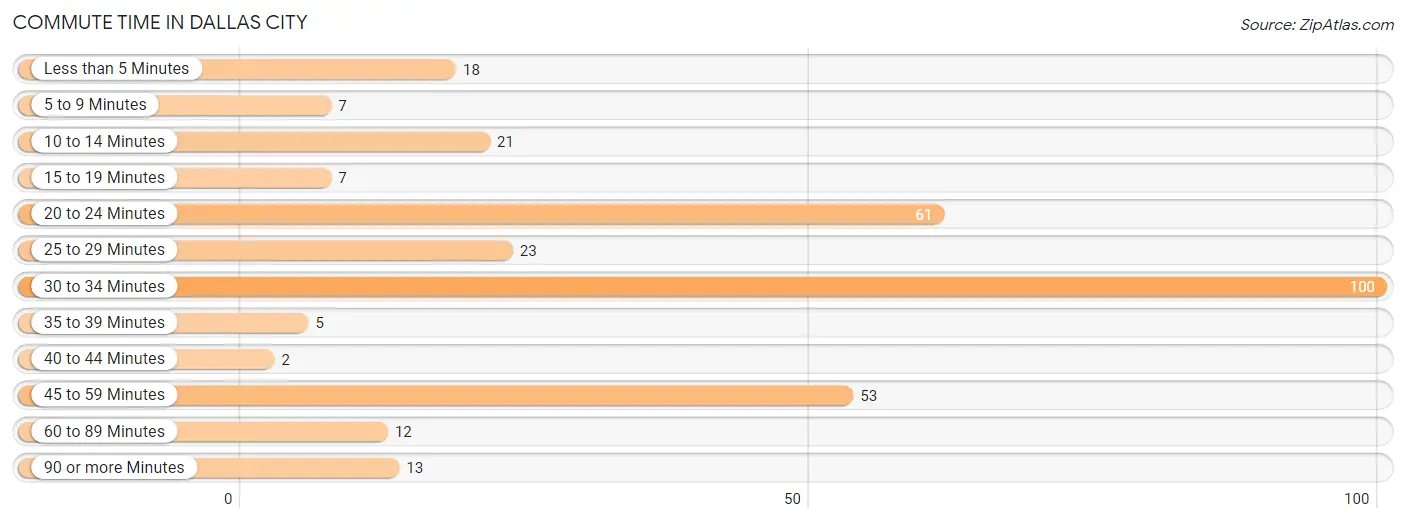
| Commute Time | # Commuters | % Commuters |
| Less than 5 Minutes | 18 | 5.6% |
| 5 to 9 Minutes | 7 | 2.2% |
| 10 to 14 Minutes | 21 | 6.5% |
| 15 to 19 Minutes | 7 | 2.2% |
| 20 to 24 Minutes | 61 | 18.9% |
| 25 to 29 Minutes | 23 | 7.1% |
| 30 to 34 Minutes | 100 | 31.1% |
| 35 to 39 Minutes | 5 | 1.5% |
| 40 to 44 Minutes | 2 | 0.6% |
| 45 to 59 Minutes | 53 | 16.5% |
| 60 to 89 Minutes | 12 | 3.7% |
| 90 or more Minutes | 13 | 4.0% |
Commute Time by Sex in Dallas City
The most common commute times in Dallas City are 30 to 34 minutes (55 commuters, 27.8%) for males and 20 to 24 minutes (45 commuters, 36.3%) for females.
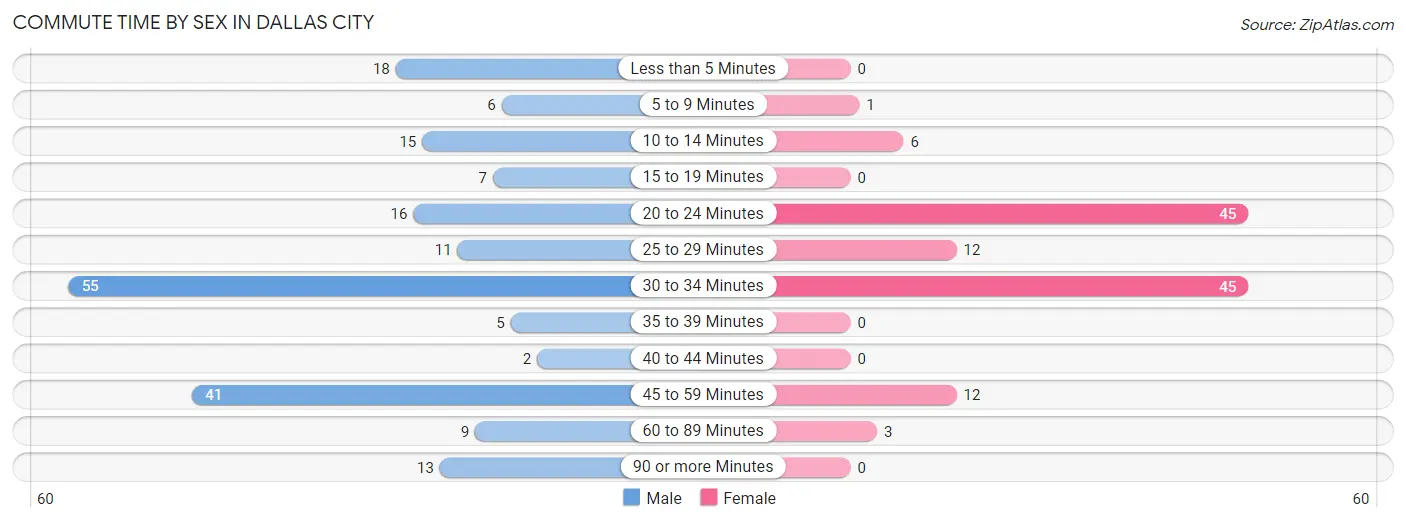
| Commute Time | Male | Female |
| Less than 5 Minutes | 18 (9.1%) | 0 (0.0%) |
| 5 to 9 Minutes | 6 (3.0%) | 1 (0.8%) |
| 10 to 14 Minutes | 15 (7.6%) | 6 (4.8%) |
| 15 to 19 Minutes | 7 (3.5%) | 0 (0.0%) |
| 20 to 24 Minutes | 16 (8.1%) | 45 (36.3%) |
| 25 to 29 Minutes | 11 (5.6%) | 12 (9.7%) |
| 30 to 34 Minutes | 55 (27.8%) | 45 (36.3%) |
| 35 to 39 Minutes | 5 (2.5%) | 0 (0.0%) |
| 40 to 44 Minutes | 2 (1.0%) | 0 (0.0%) |
| 45 to 59 Minutes | 41 (20.7%) | 12 (9.7%) |
| 60 to 89 Minutes | 9 (4.5%) | 3 (2.4%) |
| 90 or more Minutes | 13 (6.6%) | 0 (0.0%) |
Time of Departure to Work by Sex in Dallas City
The most frequent times of departure to work in Dallas City are 12:00 AM to 4:59 AM (53, 26.8%) for males and 7:00 AM to 7:29 AM (31, 25.0%) for females.
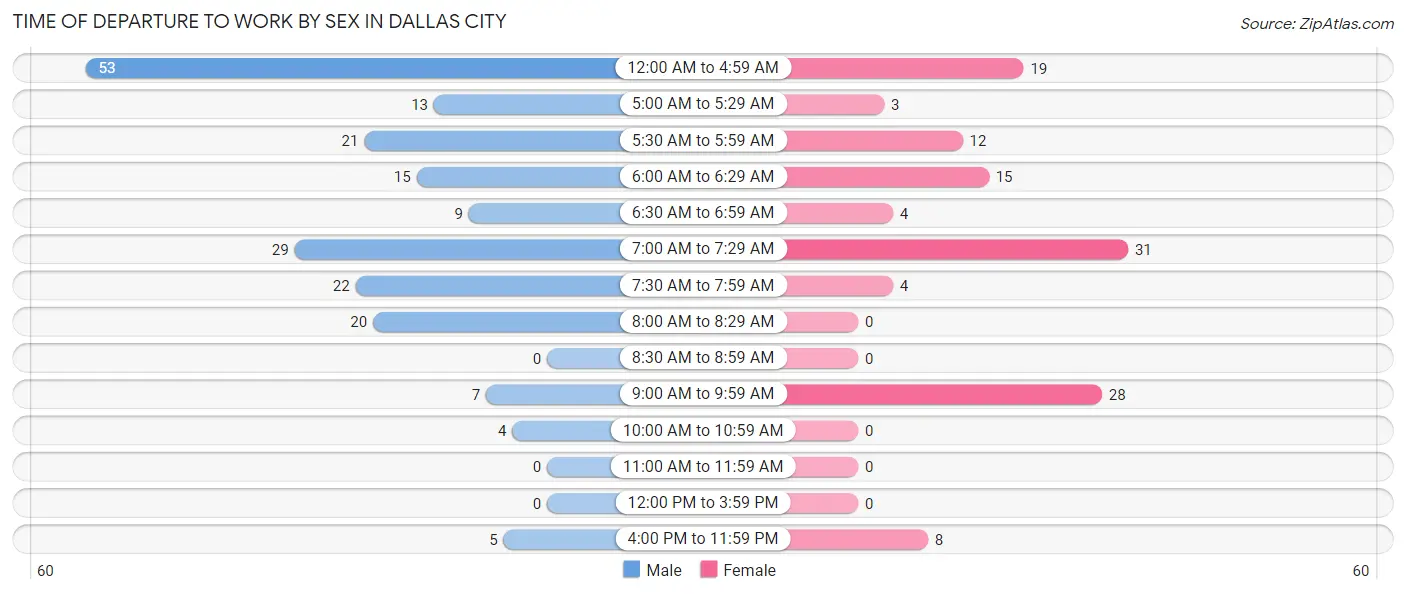
| Time of Departure | Male | Female |
| 12:00 AM to 4:59 AM | 53 (26.8%) | 19 (15.3%) |
| 5:00 AM to 5:29 AM | 13 (6.6%) | 3 (2.4%) |
| 5:30 AM to 5:59 AM | 21 (10.6%) | 12 (9.7%) |
| 6:00 AM to 6:29 AM | 15 (7.6%) | 15 (12.1%) |
| 6:30 AM to 6:59 AM | 9 (4.5%) | 4 (3.2%) |
| 7:00 AM to 7:29 AM | 29 (14.6%) | 31 (25.0%) |
| 7:30 AM to 7:59 AM | 22 (11.1%) | 4 (3.2%) |
| 8:00 AM to 8:29 AM | 20 (10.1%) | 0 (0.0%) |
| 8:30 AM to 8:59 AM | 0 (0.0%) | 0 (0.0%) |
| 9:00 AM to 9:59 AM | 7 (3.5%) | 28 (22.6%) |
| 10:00 AM to 10:59 AM | 4 (2.0%) | 0 (0.0%) |
| 11:00 AM to 11:59 AM | 0 (0.0%) | 0 (0.0%) |
| 12:00 PM to 3:59 PM | 0 (0.0%) | 0 (0.0%) |
| 4:00 PM to 11:59 PM | 5 (2.5%) | 8 (6.5%) |
| Total | 198 (100.0%) | 124 (100.0%) |
Housing Occupancy in Dallas City
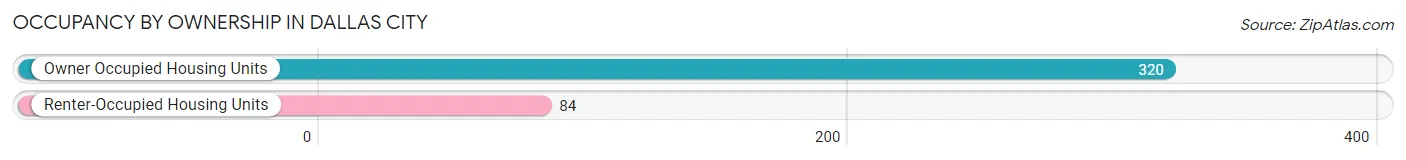
Occupancy by Ownership in Dallas City
Of the total 404 dwellings in Dallas City, owner-occupied units account for 320 (79.2%), while renter-occupied units make up 84 (20.8%).
| Occupancy | # Housing Units | % Housing Units |
| Owner Occupied Housing Units | 320 | 79.2% |
| Renter-Occupied Housing Units | 84 | 20.8% |
| Total Occupied Housing Units | 404 | 100.0% |
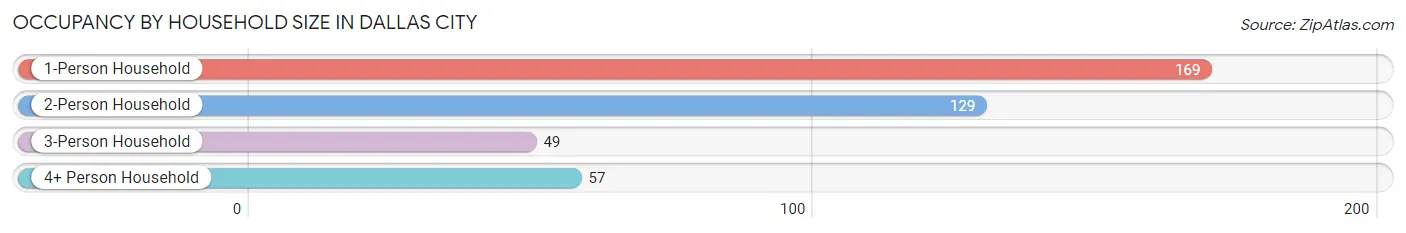
Occupancy by Household Size in Dallas City
| Household Size | # Housing Units | % Housing Units |
| 1-Person Household | 169 | 41.8% |
| 2-Person Household | 129 | 31.9% |
| 3-Person Household | 49 | 12.1% |
| 4+ Person Household | 57 | 14.1% |
| Total Housing Units | 404 | 100.0% |
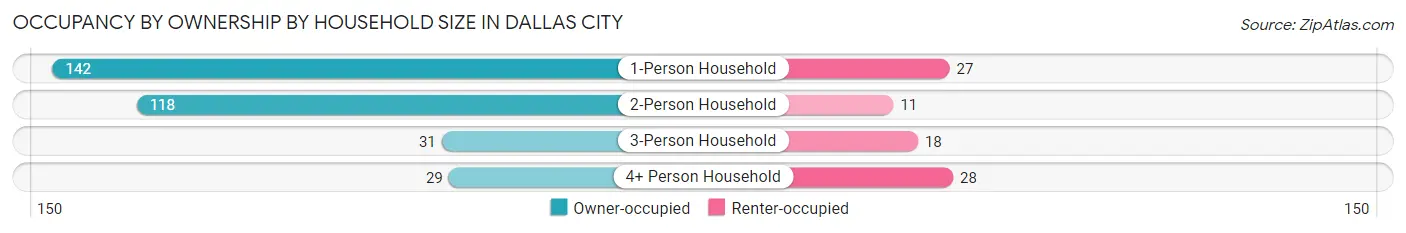
Occupancy by Ownership by Household Size in Dallas City
| Household Size | Owner-occupied | Renter-occupied |
| 1-Person Household | 142 (84.0%) | 27 (16.0%) |
| 2-Person Household | 118 (91.5%) | 11 (8.5%) |
| 3-Person Household | 31 (63.3%) | 18 (36.7%) |
| 4+ Person Household | 29 (50.9%) | 28 (49.1%) |
| Total Housing Units | 320 (79.2%) | 84 (20.8%) |
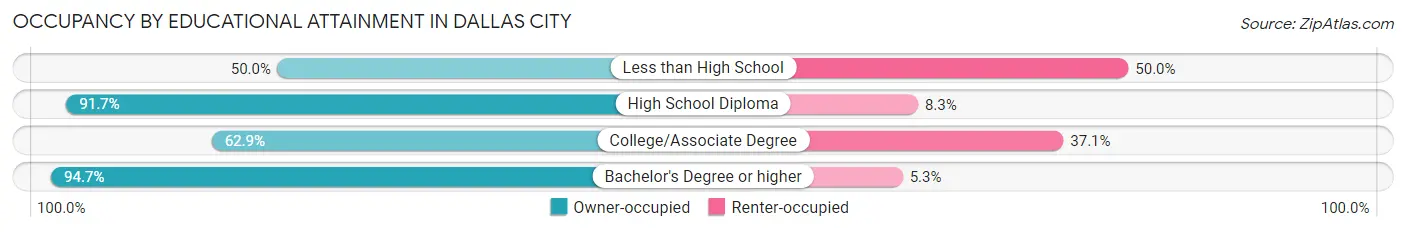
Occupancy by Educational Attainment in Dallas City
| Household Size | Owner-occupied | Renter-occupied |
| Less than High School | 7 (50.0%) | 7 (50.0%) |
| High School Diploma | 177 (91.7%) | 16 (8.3%) |
| College/Associate Degree | 100 (62.9%) | 59 (37.1%) |
| Bachelor's Degree or higher | 36 (94.7%) | 2 (5.3%) |
Occupancy by Age of Householder in Dallas City
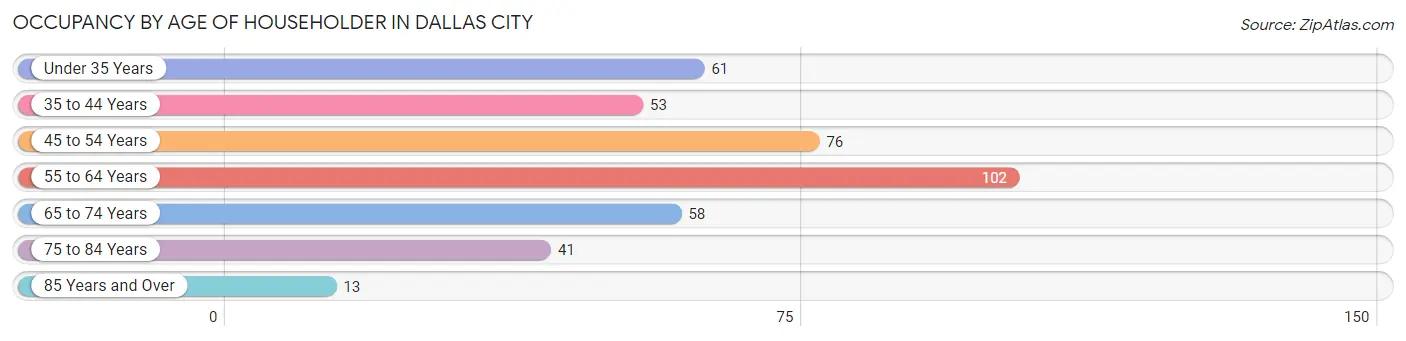
| Age Bracket | # Households | % Households |
| Under 35 Years | 61 | 15.1% |
| 35 to 44 Years | 53 | 13.1% |
| 45 to 54 Years | 76 | 18.8% |
| 55 to 64 Years | 102 | 25.3% |
| 65 to 74 Years | 58 | 14.4% |
| 75 to 84 Years | 41 | 10.2% |
| 85 Years and Over | 13 | 3.2% |
| Total | 404 | 100.0% |
Housing Finances in Dallas City
Median Income by Occupancy in Dallas City
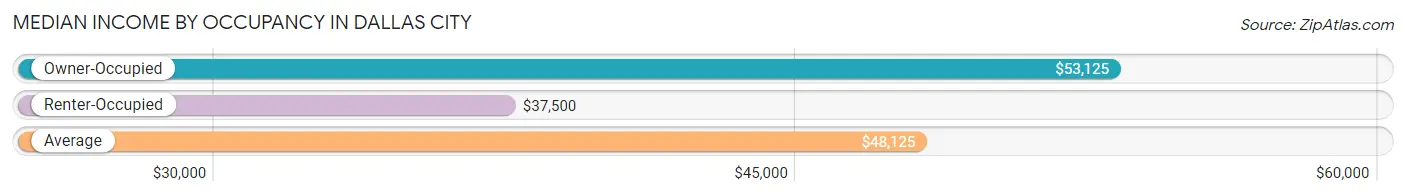
| Occupancy Type | # Households | Median Income |
| Owner-Occupied | 320 (79.2%) | $53,125 |
| Renter-Occupied | 84 (20.8%) | $37,500 |
| Average | 404 (100.0%) | $48,125 |
Occupancy by Householder Income Bracket in Dallas City
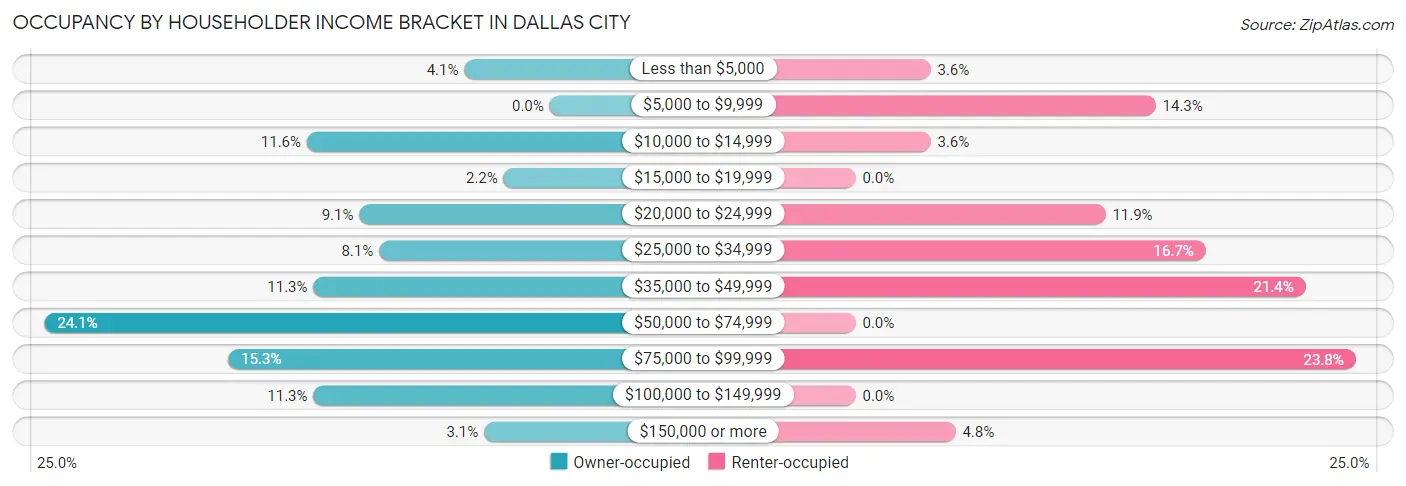
| Income Bracket | Owner-occupied | Renter-occupied |
| Less than $5,000 | 13 (4.1%) | 3 (3.6%) |
| $5,000 to $9,999 | 0 (0.0%) | 12 (14.3%) |
| $10,000 to $14,999 | 37 (11.6%) | 3 (3.6%) |
| $15,000 to $19,999 | 7 (2.2%) | 0 (0.0%) |
| $20,000 to $24,999 | 29 (9.1%) | 10 (11.9%) |
| $25,000 to $34,999 | 26 (8.1%) | 14 (16.7%) |
| $35,000 to $49,999 | 36 (11.3%) | 18 (21.4%) |
| $50,000 to $74,999 | 77 (24.1%) | 0 (0.0%) |
| $75,000 to $99,999 | 49 (15.3%) | 20 (23.8%) |
| $100,000 to $149,999 | 36 (11.3%) | 0 (0.0%) |
| $150,000 or more | 10 (3.1%) | 4 (4.8%) |
| Total | 320 (100.0%) | 84 (100.0%) |
Monthly Housing Cost Tiers in Dallas City
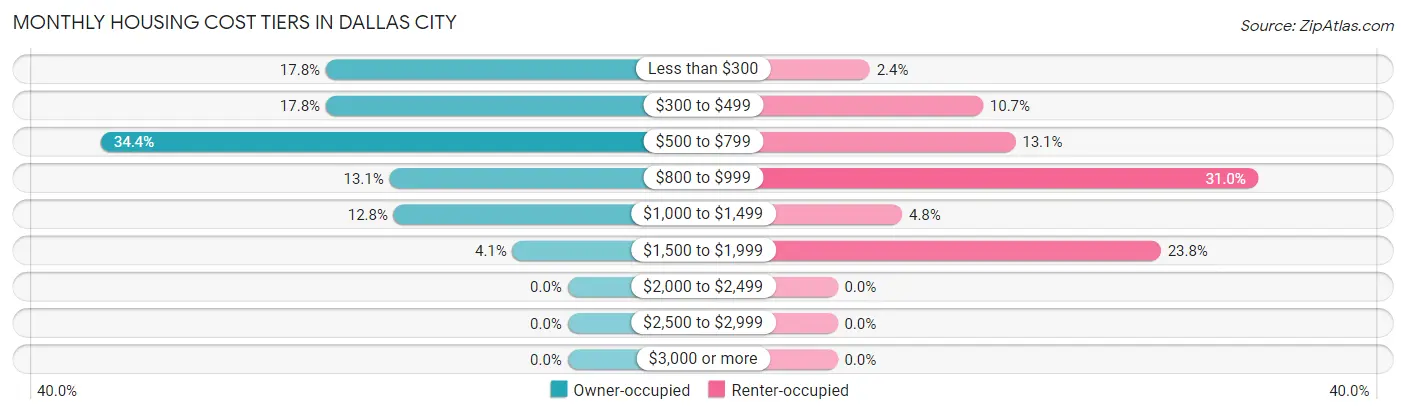
| Monthly Cost | Owner-occupied | Renter-occupied |
| Less than $300 | 57 (17.8%) | 2 (2.4%) |
| $300 to $499 | 57 (17.8%) | 9 (10.7%) |
| $500 to $799 | 110 (34.4%) | 11 (13.1%) |
| $800 to $999 | 42 (13.1%) | 26 (30.9%) |
| $1,000 to $1,499 | 41 (12.8%) | 4 (4.8%) |
| $1,500 to $1,999 | 13 (4.1%) | 20 (23.8%) |
| $2,000 to $2,499 | 0 (0.0%) | 0 (0.0%) |
| $2,500 to $2,999 | 0 (0.0%) | 0 (0.0%) |
| $3,000 or more | 0 (0.0%) | 0 (0.0%) |
| Total | 320 (100.0%) | 84 (100.0%) |
Physical Housing Characteristics in Dallas City
Housing Structures in Dallas City
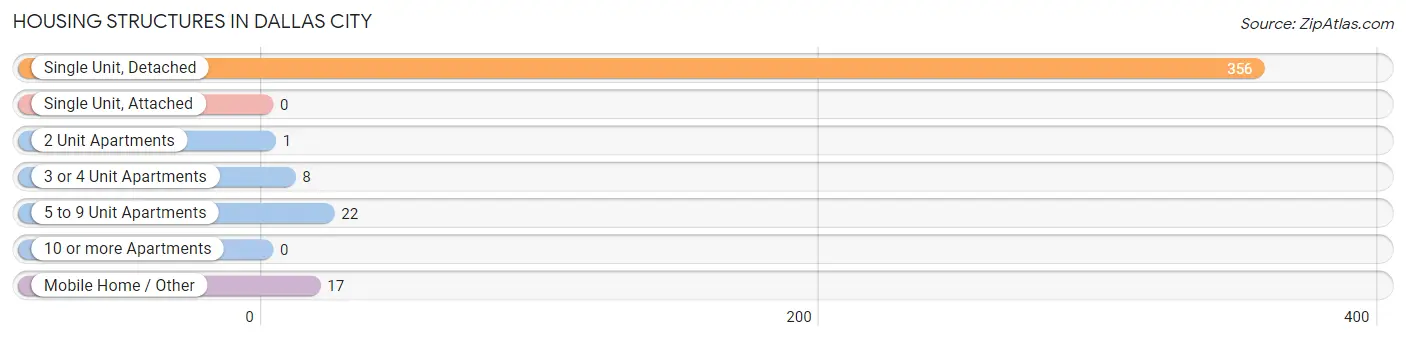
| Structure Type | # Housing Units | % Housing Units |
| Single Unit, Detached | 356 | 88.1% |
| Single Unit, Attached | 0 | 0.0% |
| 2 Unit Apartments | 1 | 0.3% |
| 3 or 4 Unit Apartments | 8 | 2.0% |
| 5 to 9 Unit Apartments | 22 | 5.4% |
| 10 or more Apartments | 0 | 0.0% |
| Mobile Home / Other | 17 | 4.2% |
| Total | 404 | 100.0% |
Housing Structures by Occupancy in Dallas City
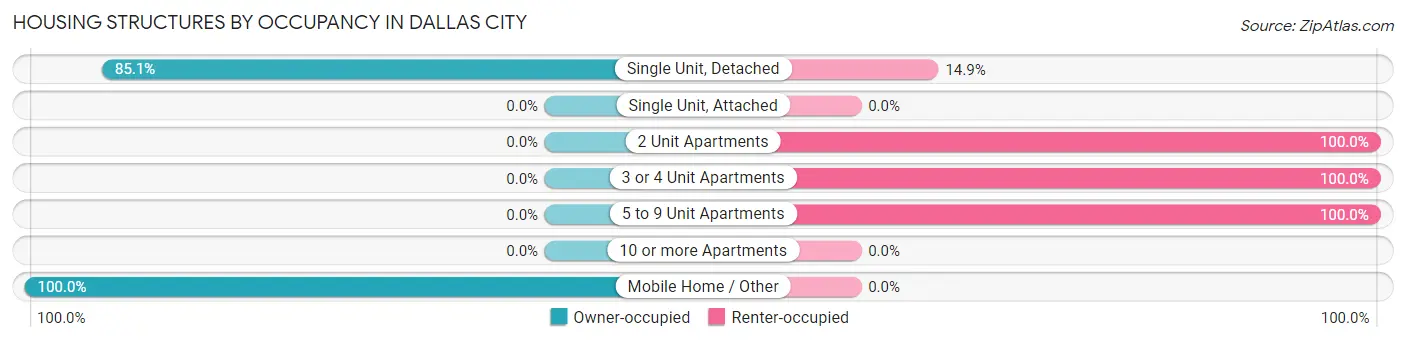
| Structure Type | Owner-occupied | Renter-occupied |
| Single Unit, Detached | 303 (85.1%) | 53 (14.9%) |
| Single Unit, Attached | 0 (0.0%) | 0 (0.0%) |
| 2 Unit Apartments | 0 (0.0%) | 1 (100.0%) |
| 3 or 4 Unit Apartments | 0 (0.0%) | 8 (100.0%) |
| 5 to 9 Unit Apartments | 0 (0.0%) | 22 (100.0%) |
| 10 or more Apartments | 0 (0.0%) | 0 (0.0%) |
| Mobile Home / Other | 17 (100.0%) | 0 (0.0%) |
| Total | 320 (79.2%) | 84 (20.8%) |
Housing Structures by Number of Rooms in Dallas City
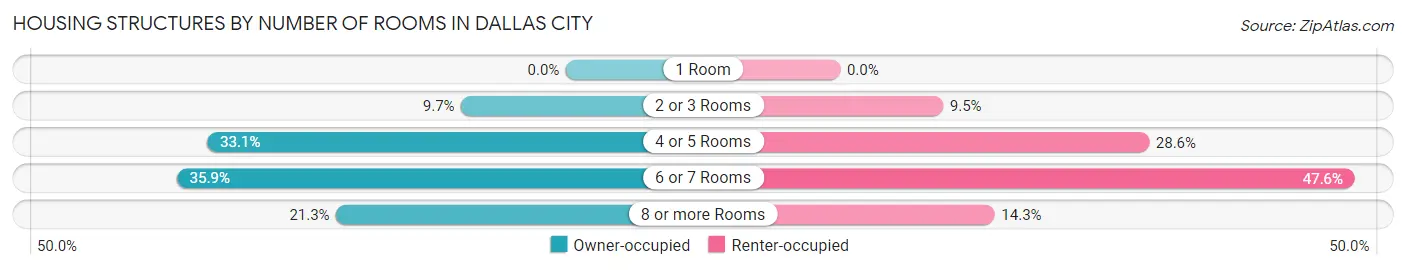
| Number of Rooms | Owner-occupied | Renter-occupied |
| 1 Room | 0 (0.0%) | 0 (0.0%) |
| 2 or 3 Rooms | 31 (9.7%) | 8 (9.5%) |
| 4 or 5 Rooms | 106 (33.1%) | 24 (28.6%) |
| 6 or 7 Rooms | 115 (35.9%) | 40 (47.6%) |
| 8 or more Rooms | 68 (21.2%) | 12 (14.3%) |
| Total | 320 (100.0%) | 84 (100.0%) |
Housing Structure by Heating Type in Dallas City
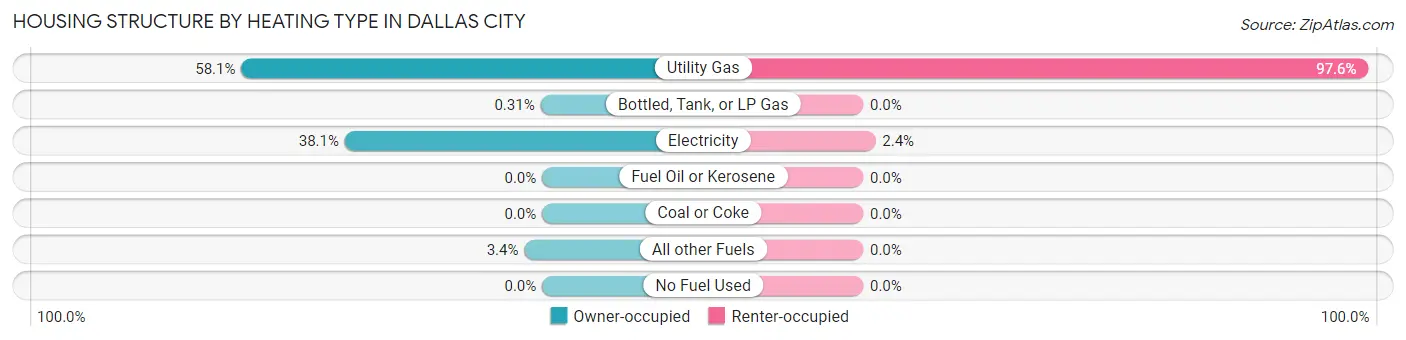
| Heating Type | Owner-occupied | Renter-occupied |
| Utility Gas | 186 (58.1%) | 82 (97.6%) |
| Bottled, Tank, or LP Gas | 1 (0.3%) | 0 (0.0%) |
| Electricity | 122 (38.1%) | 2 (2.4%) |
| Fuel Oil or Kerosene | 0 (0.0%) | 0 (0.0%) |
| Coal or Coke | 0 (0.0%) | 0 (0.0%) |
| All other Fuels | 11 (3.4%) | 0 (0.0%) |
| No Fuel Used | 0 (0.0%) | 0 (0.0%) |
| Total | 320 (100.0%) | 84 (100.0%) |
Household Vehicle Usage in Dallas City
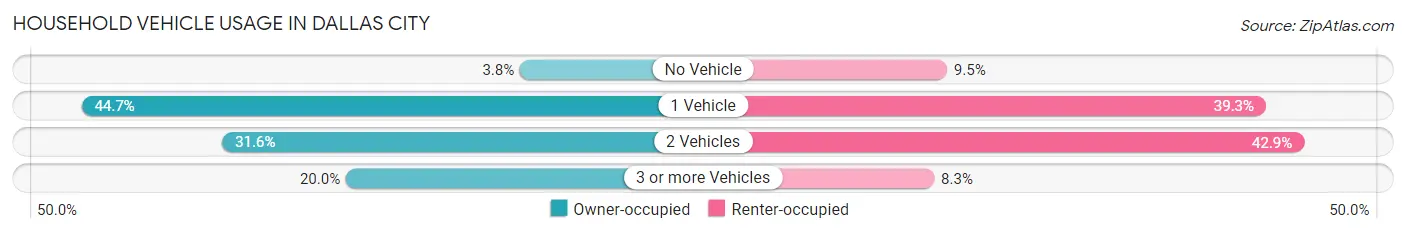
| Vehicles per Household | Owner-occupied | Renter-occupied |
| No Vehicle | 12 (3.7%) | 8 (9.5%) |
| 1 Vehicle | 143 (44.7%) | 33 (39.3%) |
| 2 Vehicles | 101 (31.6%) | 36 (42.9%) |
| 3 or more Vehicles | 64 (20.0%) | 7 (8.3%) |
| Total | 320 (100.0%) | 84 (100.0%) |
Real Estate & Mortgages in Dallas City
Real Estate and Mortgage Overview in Dallas City
| Characteristic | Without Mortgage | With Mortgage |
| Housing Units | 190 | 130 |
| Median Property Value | $50,000 | $102,800 |
| Median Household Income | - | - |
| Monthly Housing Costs | $427 | $0 |
| Real Estate Taxes | $1,231 | $4 |
Property Value by Mortgage Status in Dallas City
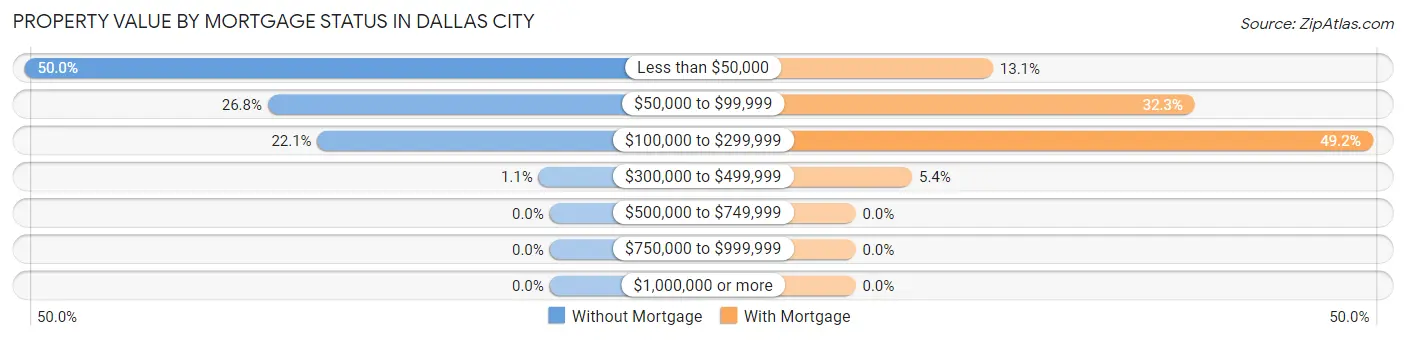
| Property Value | Without Mortgage | With Mortgage |
| Less than $50,000 | 95 (50.0%) | 17 (13.1%) |
| $50,000 to $99,999 | 51 (26.8%) | 42 (32.3%) |
| $100,000 to $299,999 | 42 (22.1%) | 64 (49.2%) |
| $300,000 to $499,999 | 2 (1.1%) | 7 (5.4%) |
| $500,000 to $749,999 | 0 (0.0%) | 0 (0.0%) |
| $750,000 to $999,999 | 0 (0.0%) | 0 (0.0%) |
| $1,000,000 or more | 0 (0.0%) | 0 (0.0%) |
| Total | 190 (100.0%) | 130 (100.0%) |
Household Income by Mortgage Status in Dallas City
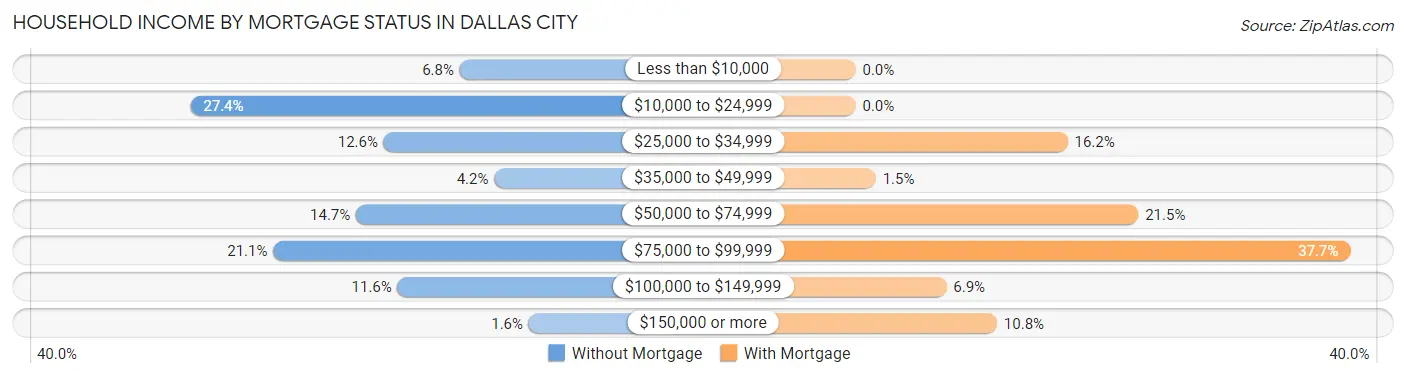
| Household Income | Without Mortgage | With Mortgage |
| Less than $10,000 | 13 (6.8%) | 0 (0.0%) |
| $10,000 to $24,999 | 52 (27.4%) | 0 (0.0%) |
| $25,000 to $34,999 | 24 (12.6%) | 21 (16.2%) |
| $35,000 to $49,999 | 8 (4.2%) | 2 (1.5%) |
| $50,000 to $74,999 | 28 (14.7%) | 28 (21.5%) |
| $75,000 to $99,999 | 40 (21.0%) | 49 (37.7%) |
| $100,000 to $149,999 | 22 (11.6%) | 9 (6.9%) |
| $150,000 or more | 3 (1.6%) | 14 (10.8%) |
| Total | 190 (100.0%) | 130 (100.0%) |
Property Value to Household Income Ratio in Dallas City
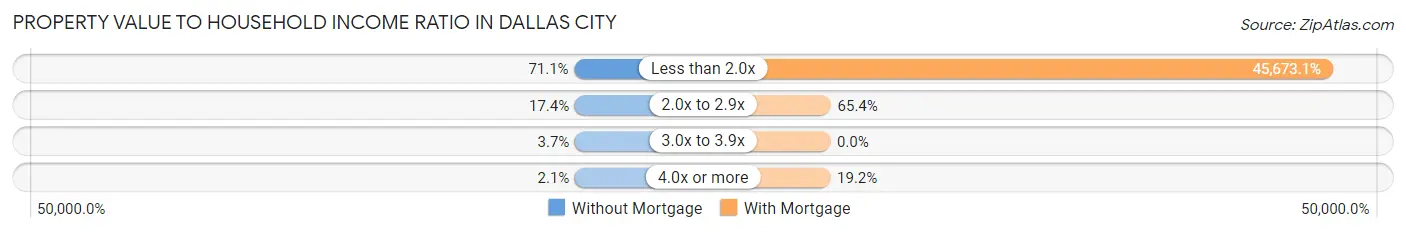
| Value-to-Income Ratio | Without Mortgage | With Mortgage |
| Less than 2.0x | 135 (71.1%) | 59,375 (45,673.1%) |
| 2.0x to 2.9x | 33 (17.4%) | 85 (65.4%) |
| 3.0x to 3.9x | 7 (3.7%) | 0 (0.0%) |
| 4.0x or more | 4 (2.1%) | 25 (19.2%) |
| Total | 190 (100.0%) | 130 (100.0%) |
Real Estate Taxes by Mortgage Status in Dallas City
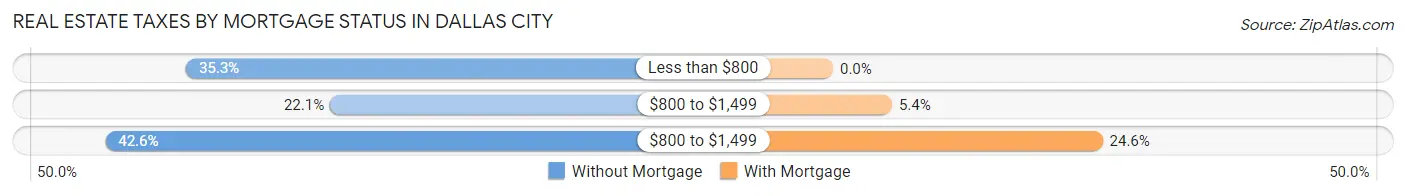
| Property Taxes | Without Mortgage | With Mortgage |
| Less than $800 | 67 (35.3%) | 0 (0.0%) |
| $800 to $1,499 | 42 (22.1%) | 7 (5.4%) |
| $800 to $1,499 | 81 (42.6%) | 32 (24.6%) |
| Total | 190 (100.0%) | 130 (100.0%) |
Health & Disability in Dallas City
Health Insurance Coverage by Age in Dallas City
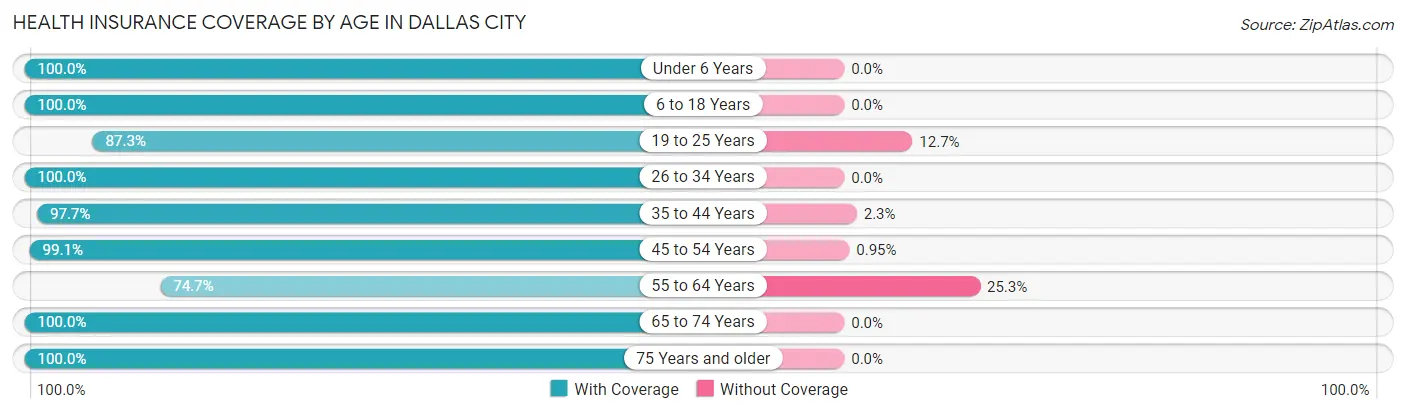
| Age Bracket | With Coverage | Without Coverage |
| Under 6 Years | 52 (100.0%) | 0 (0.0%) |
| 6 to 18 Years | 117 (100.0%) | 0 (0.0%) |
| 19 to 25 Years | 55 (87.3%) | 8 (12.7%) |
| 26 to 34 Years | 59 (100.0%) | 0 (0.0%) |
| 35 to 44 Years | 84 (97.7%) | 2 (2.3%) |
| 45 to 54 Years | 104 (99.1%) | 1 (0.9%) |
| 55 to 64 Years | 121 (74.7%) | 41 (25.3%) |
| 65 to 74 Years | 105 (100.0%) | 0 (0.0%) |
| 75 Years and older | 97 (100.0%) | 0 (0.0%) |
| Total | 794 (93.9%) | 52 (6.1%) |
Health Insurance Coverage by Citizenship Status in Dallas City

| Citizenship Status | With Coverage | Without Coverage |
| Native Born | 52 (100.0%) | 0 (0.0%) |
| Foreign Born, Citizen | 117 (100.0%) | 0 (0.0%) |
| Foreign Born, not a Citizen | 55 (87.3%) | 8 (12.7%) |
Health Insurance Coverage by Household Income in Dallas City
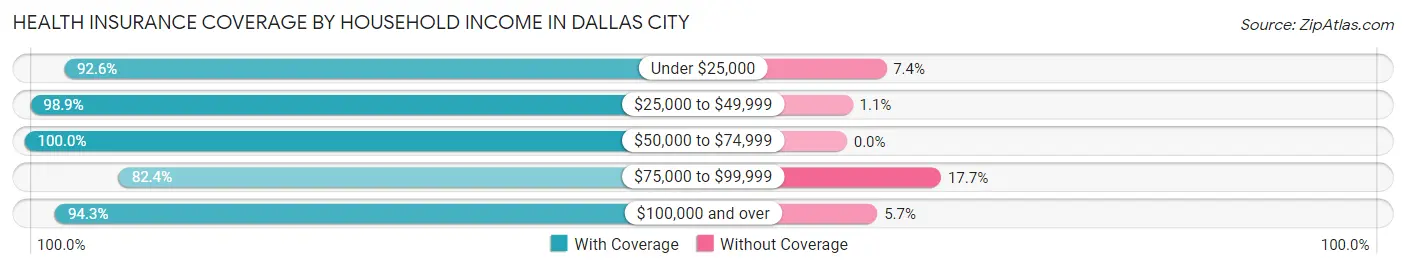
| Household Income | With Coverage | Without Coverage |
| Under $25,000 | 138 (92.6%) | 11 (7.4%) |
| $25,000 to $49,999 | 182 (98.9%) | 2 (1.1%) |
| $50,000 to $74,999 | 169 (100.0%) | 0 (0.0%) |
| $75,000 to $99,999 | 140 (82.4%) | 30 (17.6%) |
| $100,000 and over | 149 (94.3%) | 9 (5.7%) |
Public vs Private Health Insurance Coverage by Age in Dallas City
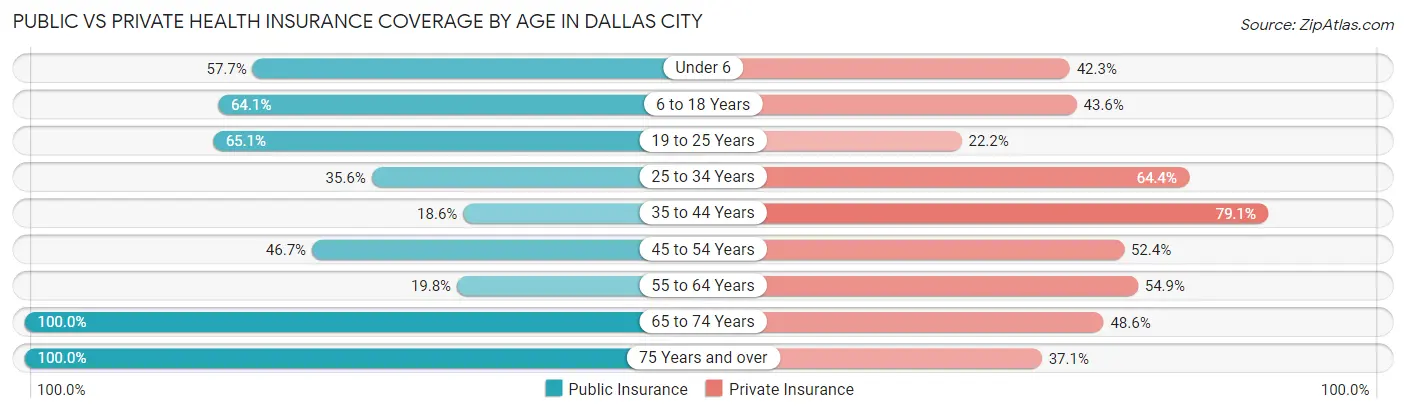
| Age Bracket | Public Insurance | Private Insurance |
| Under 6 | 30 (57.7%) | 22 (42.3%) |
| 6 to 18 Years | 75 (64.1%) | 51 (43.6%) |
| 19 to 25 Years | 41 (65.1%) | 14 (22.2%) |
| 25 to 34 Years | 21 (35.6%) | 38 (64.4%) |
| 35 to 44 Years | 16 (18.6%) | 68 (79.1%) |
| 45 to 54 Years | 49 (46.7%) | 55 (52.4%) |
| 55 to 64 Years | 32 (19.8%) | 89 (54.9%) |
| 65 to 74 Years | 105 (100.0%) | 51 (48.6%) |
| 75 Years and over | 97 (100.0%) | 36 (37.1%) |
| Total | 466 (55.1%) | 424 (50.1%) |
Disability Status by Sex by Age in Dallas City
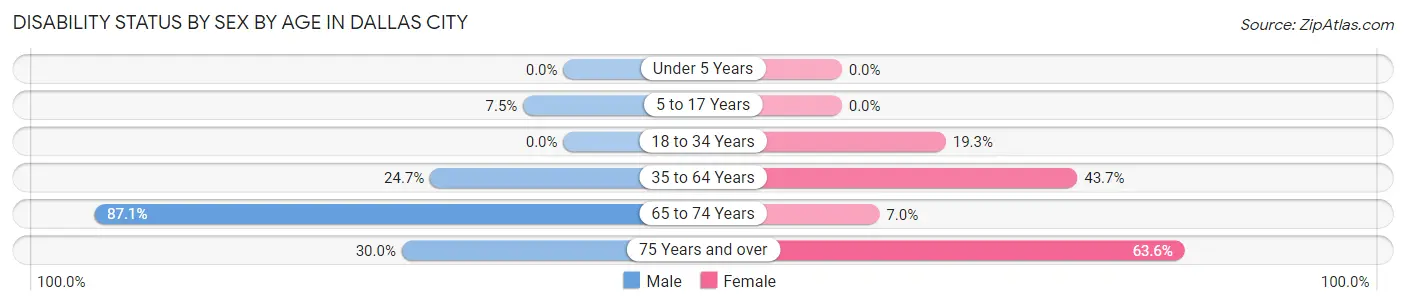
| Age Bracket | Male | Female |
| Under 5 Years | 0 (0.0%) | 0 (0.0%) |
| 5 to 17 Years | 5 (7.5%) | 0 (0.0%) |
| 18 to 34 Years | 0 (0.0%) | 11 (19.3%) |
| 35 to 64 Years | 46 (24.7%) | 73 (43.7%) |
| 65 to 74 Years | 54 (87.1%) | 3 (7.0%) |
| 75 Years and over | 6 (30.0%) | 49 (63.6%) |
Disability Class by Sex by Age in Dallas City
Disability Class: Hearing Difficulty
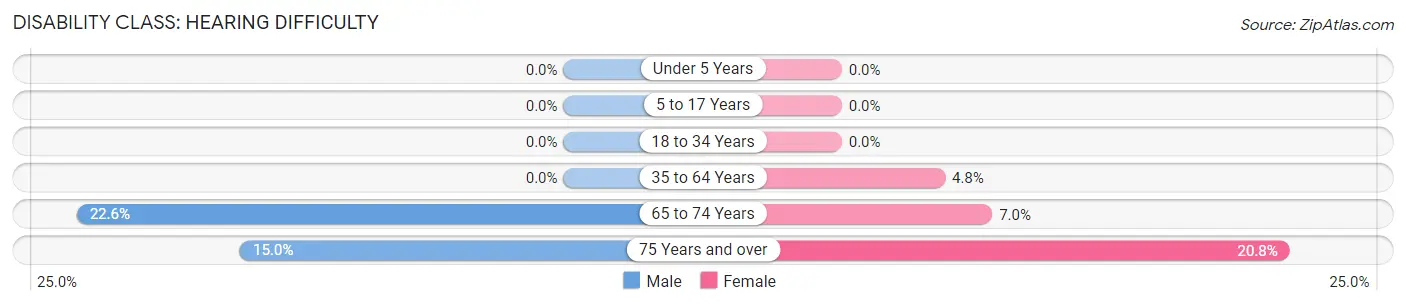
| Age Bracket | Male | Female |
| Under 5 Years | 0 (0.0%) | 0 (0.0%) |
| 5 to 17 Years | 0 (0.0%) | 0 (0.0%) |
| 18 to 34 Years | 0 (0.0%) | 0 (0.0%) |
| 35 to 64 Years | 0 (0.0%) | 8 (4.8%) |
| 65 to 74 Years | 14 (22.6%) | 3 (7.0%) |
| 75 Years and over | 3 (15.0%) | 16 (20.8%) |
Disability Class: Vision Difficulty
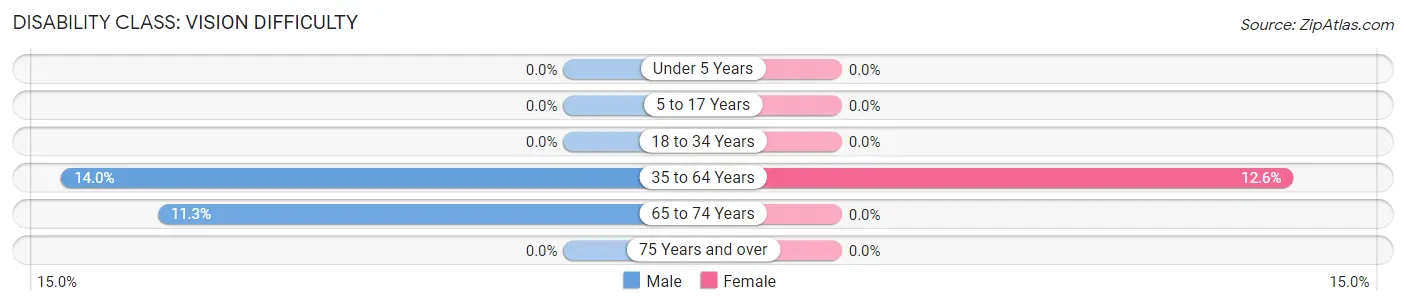
| Age Bracket | Male | Female |
| Under 5 Years | 0 (0.0%) | 0 (0.0%) |
| 5 to 17 Years | 0 (0.0%) | 0 (0.0%) |
| 18 to 34 Years | 0 (0.0%) | 0 (0.0%) |
| 35 to 64 Years | 26 (14.0%) | 21 (12.6%) |
| 65 to 74 Years | 7 (11.3%) | 0 (0.0%) |
| 75 Years and over | 0 (0.0%) | 0 (0.0%) |
Disability Class: Cognitive Difficulty
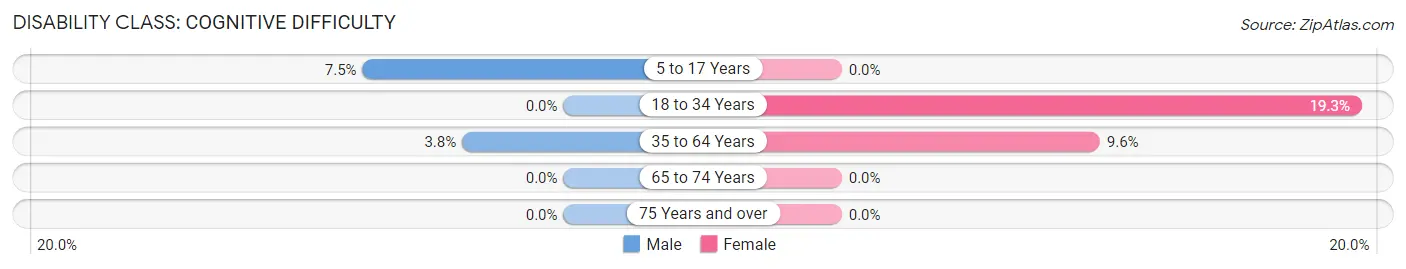
| Age Bracket | Male | Female |
| 5 to 17 Years | 5 (7.5%) | 0 (0.0%) |
| 18 to 34 Years | 0 (0.0%) | 11 (19.3%) |
| 35 to 64 Years | 7 (3.8%) | 16 (9.6%) |
| 65 to 74 Years | 0 (0.0%) | 0 (0.0%) |
| 75 Years and over | 0 (0.0%) | 0 (0.0%) |
Disability Class: Ambulatory Difficulty
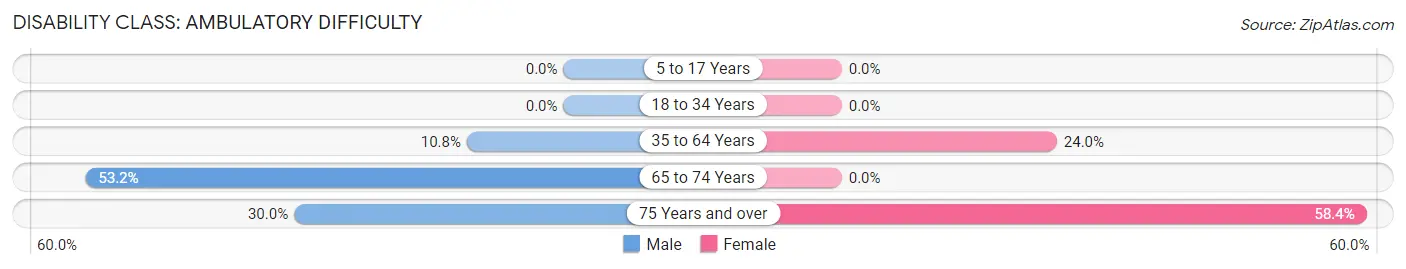
| Age Bracket | Male | Female |
| 5 to 17 Years | 0 (0.0%) | 0 (0.0%) |
| 18 to 34 Years | 0 (0.0%) | 0 (0.0%) |
| 35 to 64 Years | 20 (10.7%) | 40 (23.9%) |
| 65 to 74 Years | 33 (53.2%) | 0 (0.0%) |
| 75 Years and over | 6 (30.0%) | 45 (58.4%) |
Disability Class: Self-Care Difficulty
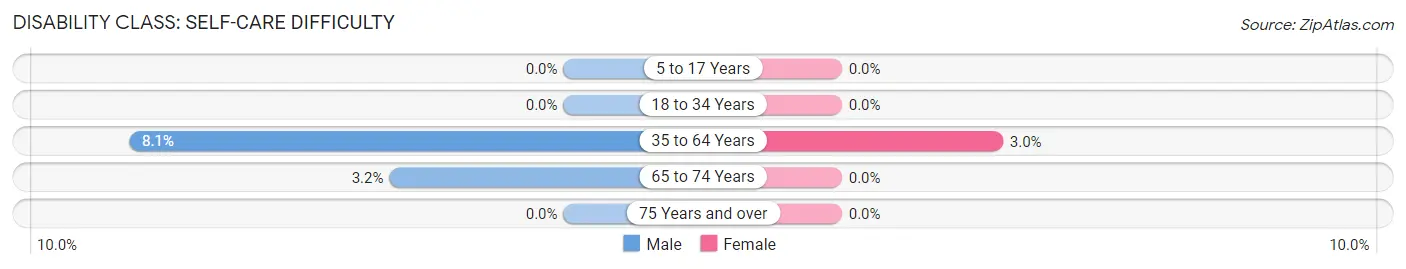
| Age Bracket | Male | Female |
| 5 to 17 Years | 0 (0.0%) | 0 (0.0%) |
| 18 to 34 Years | 0 (0.0%) | 0 (0.0%) |
| 35 to 64 Years | 15 (8.1%) | 5 (3.0%) |
| 65 to 74 Years | 2 (3.2%) | 0 (0.0%) |
| 75 Years and over | 0 (0.0%) | 0 (0.0%) |
Technology Access in Dallas City
Computing Device Access in Dallas City
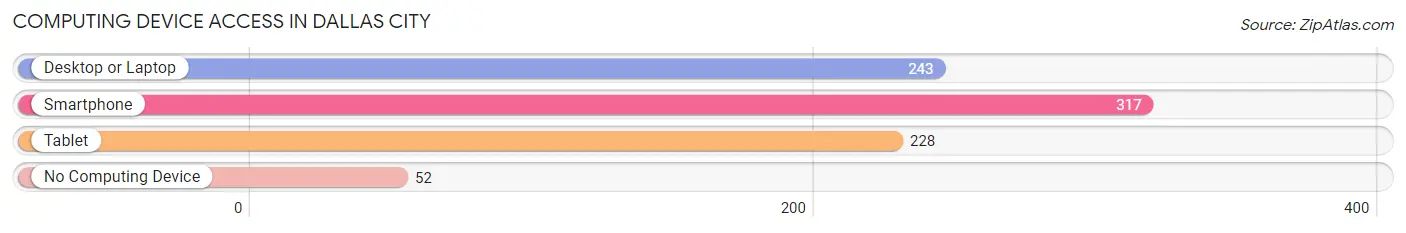
| Device Type | # Households | % Households |
| Desktop or Laptop | 243 | 60.2% |
| Smartphone | 317 | 78.5% |
| Tablet | 228 | 56.4% |
| No Computing Device | 52 | 12.9% |
| Total | 404 | 100.0% |
Internet Access in Dallas City
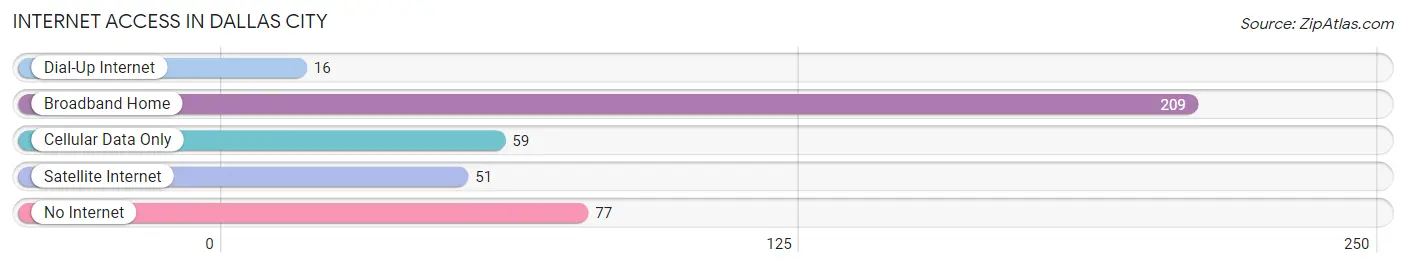
| Internet Type | # Households | % Households |
| Dial-Up Internet | 16 | 4.0% |
| Broadband Home | 209 | 51.7% |
| Cellular Data Only | 59 | 14.6% |
| Satellite Internet | 51 | 12.6% |
| No Internet | 77 | 19.1% |
| Total | 404 | 100.0% |
Dallas City Summary
City of Dallas IL
Dallas, Illinois is a small city located in the northern part of the state, in Marion County. It is situated on the banks of the Kaskaskia River, and is part of the Centralia-Salem-Herrin Metropolitan Statistical Area. The city has a population of approximately 1,500 people, and is the county seat of Marion County.
History
The area that is now Dallas was first settled in 1819 by a group of settlers from Kentucky. The settlement was originally known as “Kaskaskia”, after the nearby river. In 1821, the town was renamed “Dallas”, after Alexander J. Dallas, the Secretary of the Treasury under President James Madison.
In 1839, the town was officially incorporated as a city. During the Civil War, Dallas was a major center of activity for the Union Army, and was the site of several battles. After the war, the city experienced a period of growth and prosperity, and by the early 1900s, it had become a major agricultural center.
Geography
Dallas is located in the northern part of Illinois, in Marion County. It is situated on the banks of the Kaskaskia River, and is part of the Centralia-Salem-Herrin Metropolitan Statistical Area. The city has a total area of 1.3 square miles, all of which is land.
The climate in Dallas is classified as humid continental, with hot, humid summers and cold, snowy winters. The average annual temperature is around 50 degrees Fahrenheit, and the average annual precipitation is around 40 inches.
Economy
The economy of Dallas is largely based on agriculture. The city is home to several large farms, and is a major producer of corn, soybeans, and wheat. In addition, the city is home to several manufacturing companies, including a paper mill and a furniture factory.
The city also has a thriving tourism industry, with several attractions, including the Kaskaskia River State Park, the Marion County Historical Museum, and the Dallas City Park.
Demographics
As of the 2010 census, the population of Dallas was 1,500 people. The racial makeup of the city was 97.3% White, 0.7% African American, 0.3% Native American, 0.3% Asian, and 1.3% from other races. The median household income was $37,500, and the median family income was $45,000.
Conclusion
Dallas, Illinois is a small city located in the northern part of the state, in Marion County. It is situated on the banks of the Kaskaskia River, and is part of the Centralia-Salem-Herrin Metropolitan Statistical Area. The city has a population of approximately 1,500 people, and is the county seat of Marion County. The economy of Dallas is largely based on agriculture, and the city is also home to several manufacturing companies and a thriving tourism industry. The racial makeup of the city is predominantly White, with a small percentage of African American, Native American, and Asian residents.
Common Questions
What is Per Capita Income in Dallas City?
Per Capita income in Dallas City is $33,689.
What is the Median Family Income in Dallas City?
Median Family Income in Dallas City is $77,670.
What is the Median Household income in Dallas City?
Median Household Income in Dallas City is $48,125.
What is Inequality or Gini Index in Dallas City?
Inequality or Gini Index in Dallas City is 0.50.
What is the Total Population of Dallas City?
Total Population of Dallas City is 846.
What is the Total Male Population of Dallas City?
Total Male Population of Dallas City is 418.
What is the Total Female Population of Dallas City?
Total Female Population of Dallas City is 428.
What is the Ratio of Males per 100 Females in Dallas City?
There are 97.66 Males per 100 Females in Dallas City.
What is the Ratio of Females per 100 Males in Dallas City?
There are 102.39 Females per 100 Males in Dallas City.
What is the Median Population Age in Dallas City?
Median Population Age in Dallas City is 50.2 Years.
What is the Average Family Size in Dallas City
Average Family Size in Dallas City is 2.8 People.
What is the Average Household Size in Dallas City
Average Household Size in Dallas City is 2.0 People.
How Large is the Labor Force in Dallas City?
There are 394 People in the Labor Forcein in Dallas City.
What is the Percentage of People in the Labor Force in Dallas City?
58.0% of People are in the Labor Force in Dallas City.
What is the Unemployment Rate in Dallas City?
Unemployment Rate in Dallas City is 7.9%.