Central City, IL Map & Demographics
Central City Map
Central City Overview
$22,089
PER CAPITA INCOME
$45,729
AVG FAMILY INCOME
$39,688
AVG HOUSEHOLD INCOME
46.3%
WAGE / INCOME GAP [ % ]
53.7¢/ $1
WAGE / INCOME GAP [ $ ]
$5,441
FAMILY INCOME DEFICIT
0.42
INEQUALITY / GINI INDEX
1,154
TOTAL POPULATION
541
MALE POPULATION
613
FEMALE POPULATION
88.25
MALES / 100 FEMALES
113.31
FEMALES / 100 MALES
38.1
MEDIAN AGE
2.8
AVG FAMILY SIZE
2.4
AVG HOUSEHOLD SIZE
502
LABOR FORCE [ PEOPLE ]
56.7%
PERCENT IN LABOR FORCE
3.2%
UNEMPLOYMENT RATE
Income in Central City
Income Overview in Central City
Per Capita Income in Central City is $22,089, while median incomes of families and households are $45,729 and $39,688 respectively.
| Characteristic | Number | Measure |
| Per Capita Income | 1,154 | $22,089 |
| Median Family Income | 328 | $45,729 |
| Mean Family Income | 328 | $53,167 |
| Median Household Income | 475 | $39,688 |
| Mean Household Income | 475 | $54,587 |
| Income Deficit | 328 | $5,441 |
| Wage / Income Gap (%) | 1,154 | 46.32% |
| Wage / Income Gap ($) | 1,154 | 53.68¢ per $1 |
| Gini / Inequality Index | 1,154 | 0.42 |
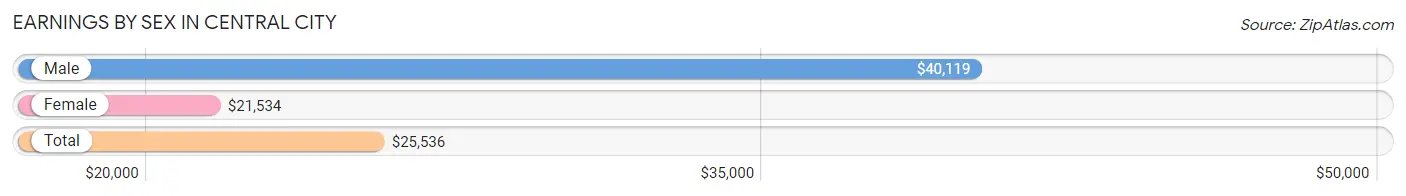
Earnings by Sex in Central City
Average Earnings in Central City are $25,536, $40,119 for men and $21,534 for women, a difference of 46.3%.
| Sex | Number | Average Earnings |
| Male | 200 (37.5%) | $40,119 |
| Female | 333 (62.5%) | $21,534 |
| Total | 533 (100.0%) | $25,536 |
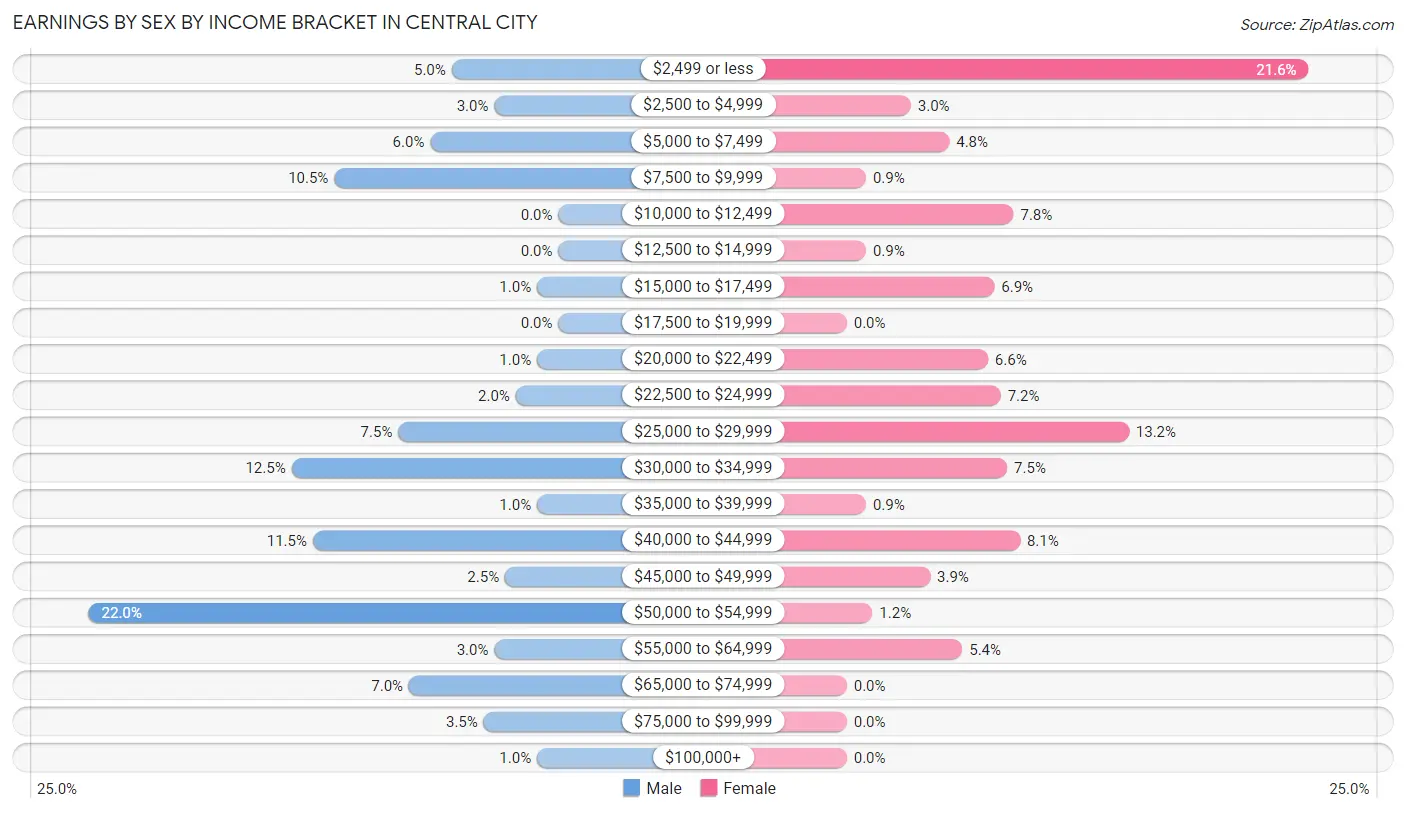
Earnings by Sex by Income Bracket in Central City
The most common earnings brackets in Central City are $50,000 to $54,999 for men (44 | 22.0%) and $2,499 or less for women (72 | 21.6%).
| Income | Male | Female |
| $2,499 or less | 10 (5.0%) | 72 (21.6%) |
| $2,500 to $4,999 | 6 (3.0%) | 10 (3.0%) |
| $5,000 to $7,499 | 12 (6.0%) | 16 (4.8%) |
| $7,500 to $9,999 | 21 (10.5%) | 3 (0.9%) |
| $10,000 to $12,499 | 0 (0.0%) | 26 (7.8%) |
| $12,500 to $14,999 | 0 (0.0%) | 3 (0.9%) |
| $15,000 to $17,499 | 2 (1.0%) | 23 (6.9%) |
| $17,500 to $19,999 | 0 (0.0%) | 0 (0.0%) |
| $20,000 to $22,499 | 2 (1.0%) | 22 (6.6%) |
| $22,500 to $24,999 | 4 (2.0%) | 24 (7.2%) |
| $25,000 to $29,999 | 15 (7.5%) | 44 (13.2%) |
| $30,000 to $34,999 | 25 (12.5%) | 25 (7.5%) |
| $35,000 to $39,999 | 2 (1.0%) | 3 (0.9%) |
| $40,000 to $44,999 | 23 (11.5%) | 27 (8.1%) |
| $45,000 to $49,999 | 5 (2.5%) | 13 (3.9%) |
| $50,000 to $54,999 | 44 (22.0%) | 4 (1.2%) |
| $55,000 to $64,999 | 6 (3.0%) | 18 (5.4%) |
| $65,000 to $74,999 | 14 (7.0%) | 0 (0.0%) |
| $75,000 to $99,999 | 7 (3.5%) | 0 (0.0%) |
| $100,000+ | 2 (1.0%) | 0 (0.0%) |
| Total | 200 (100.0%) | 333 (100.0%) |
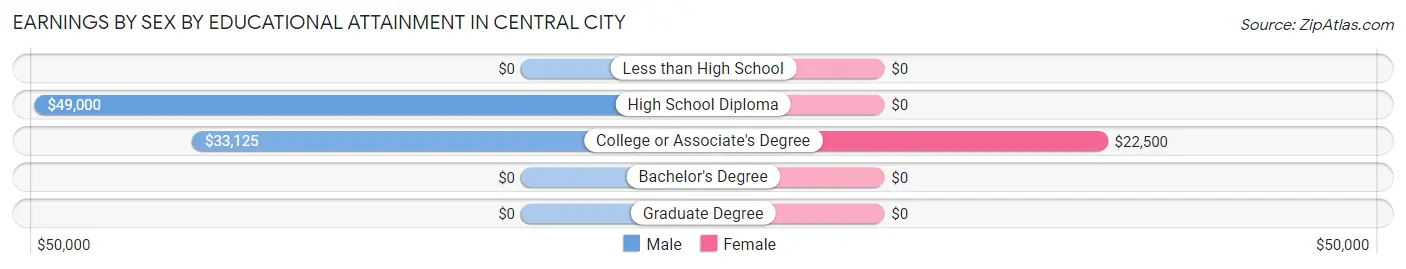
Earnings by Sex by Educational Attainment in Central City
Average earnings in Central City are $40,417 for men and $22,143 for women, a difference of 45.2%. Men with an educational attainment of high school diploma enjoy the highest average annual earnings of $49,000, while those with college or associate's degree education earn the least with $33,125. Women with an educational attainment of college or associate's degree earn the most with the average annual earnings of $22,500, while those with college or associate's degree education have the smallest earnings of $22,500.
| Educational Attainment | Male Income | Female Income |
| Less than High School | - | - |
| High School Diploma | $49,000 | $0 |
| College or Associate's Degree | $33,125 | $22,500 |
| Bachelor's Degree | - | - |
| Graduate Degree | - | - |
| Total | $40,417 | $22,143 |
Family Income in Central City
Family Income Brackets in Central City
According to the Central City family income data, there are 88 families falling into the $25,000 to $34,999 income range, which is the most common income bracket and makes up 26.8% of all families.
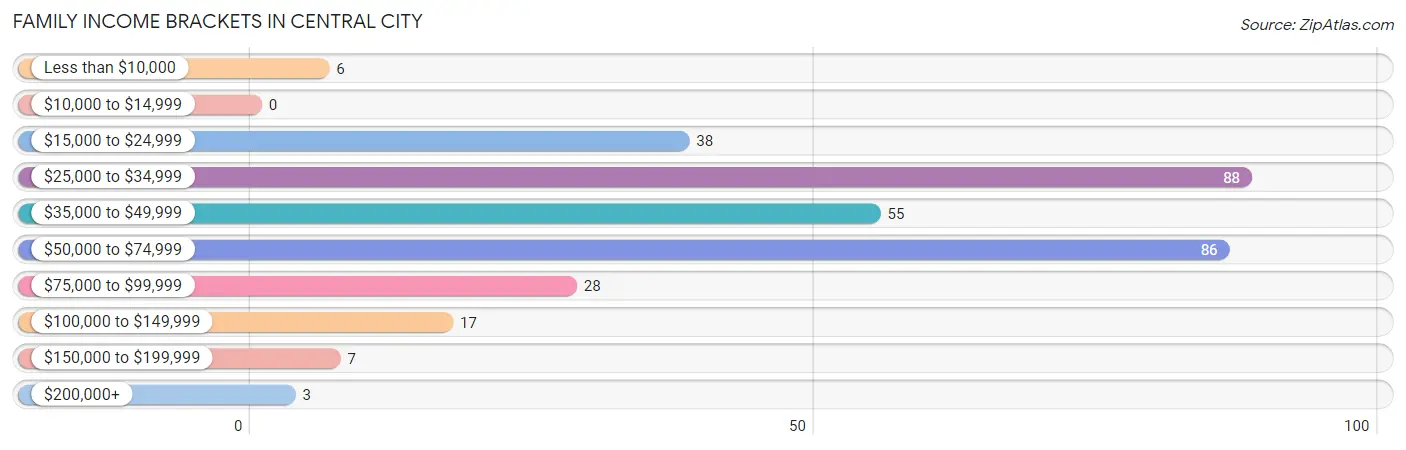
| Income Bracket | # Families | % Families |
| Less than $10,000 | 6 | 1.8% |
| $10,000 to $14,999 | 0 | 0.0% |
| $15,000 to $24,999 | 38 | 11.6% |
| $25,000 to $34,999 | 88 | 26.8% |
| $35,000 to $49,999 | 55 | 16.8% |
| $50,000 to $74,999 | 86 | 26.2% |
| $75,000 to $99,999 | 28 | 8.5% |
| $100,000 to $149,999 | 17 | 5.2% |
| $150,000 to $199,999 | 7 | 2.1% |
| $200,000+ | 3 | 0.9% |
Family Income by Famaliy Size in Central City
2-person families (136 | 41.5%) account for the highest median family income in Central City with $56,250 per family, while 2-person families (136 | 41.5%) have the highest median income of $28,125 per family member.
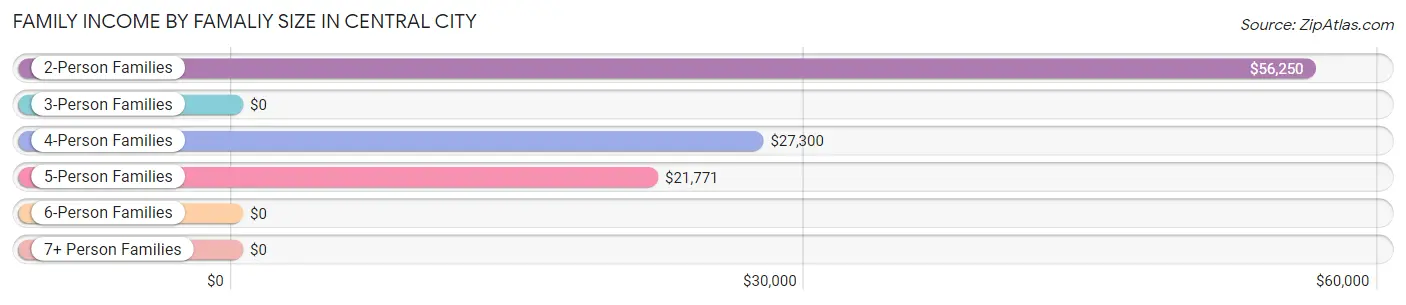
| Income Bracket | # Families | Median Income |
| 2-Person Families | 136 (41.5%) | $56,250 |
| 3-Person Families | 129 (39.3%) | $0 |
| 4-Person Families | 46 (14.0%) | $27,300 |
| 5-Person Families | 17 (5.2%) | $21,771 |
| 6-Person Families | 0 (0.0%) | $0 |
| 7+ Person Families | 0 (0.0%) | $0 |
| Total | 328 (100.0%) | $45,729 |
Family Income by Number of Earners in Central City
The median family income in Central City is $45,729, with families comprising 3+ earners (24) having the highest median family income of $106,250, while families with 1 earner (125) have the lowest median family income of $27,386, accounting for 7.3% and 38.1% of families, respectively.
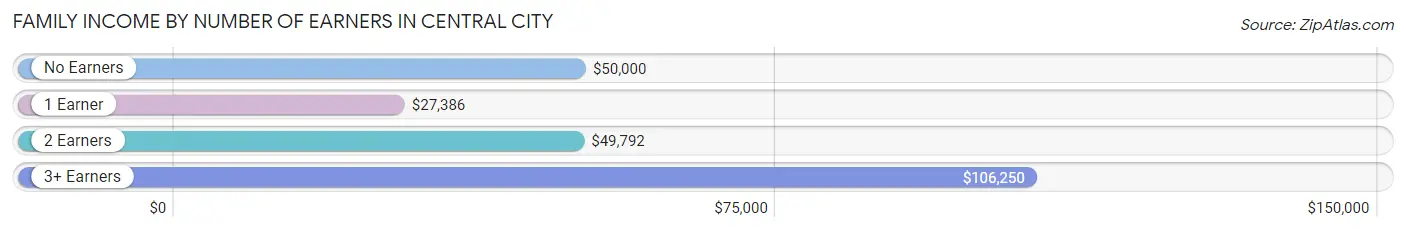
| Number of Earners | # Families | Median Income |
| No Earners | 64 (19.5%) | $50,000 |
| 1 Earner | 125 (38.1%) | $27,386 |
| 2 Earners | 115 (35.1%) | $49,792 |
| 3+ Earners | 24 (7.3%) | $106,250 |
| Total | 328 (100.0%) | $45,729 |
Household Income in Central City
Household Income Brackets in Central City
With 124 households falling in the category, the $50,000 to $74,999 income range is the most frequent in Central City, accounting for 26.1% of all households. In contrast, only 7 households (1.5%) fall into the $150,000 to $199,999 income bracket, making it the least populous group.
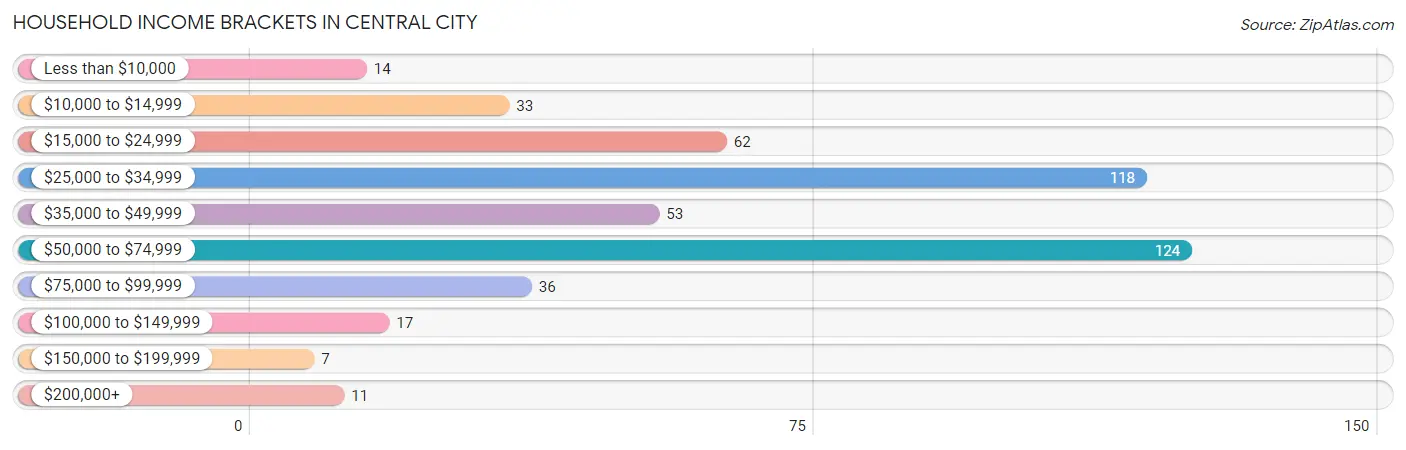
| Income Bracket | # Households | % Households |
| Less than $10,000 | 14 | 2.9% |
| $10,000 to $14,999 | 33 | 6.9% |
| $15,000 to $24,999 | 62 | 13.1% |
| $25,000 to $34,999 | 118 | 24.8% |
| $35,000 to $49,999 | 53 | 11.2% |
| $50,000 to $74,999 | 124 | 26.1% |
| $75,000 to $99,999 | 36 | 7.6% |
| $100,000 to $149,999 | 17 | 3.6% |
| $150,000 to $199,999 | 7 | 1.5% |
| $200,000+ | 11 | 2.3% |
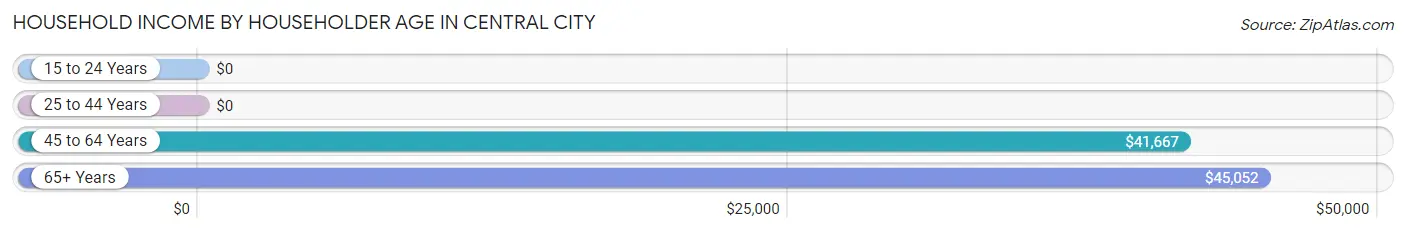
Household Income by Householder Age in Central City
The median household income in Central City is $39,688, with the highest median household income of $45,052 found in the 65+ years age bracket for the primary householder. A total of 139 households (29.3%) fall into this category. Meanwhile, the 15 to 24 years age bracket for the primary householder has the lowest median household income of $0, with 27 households (5.7%) in this group.
| Income Bracket | # Households | Median Income |
| 15 to 24 Years | 27 (5.7%) | $0 |
| 25 to 44 Years | 181 (38.1%) | $0 |
| 45 to 64 Years | 128 (27.0%) | $41,667 |
| 65+ Years | 139 (29.3%) | $45,052 |
| Total | 475 (100.0%) | $39,688 |
Poverty in Central City
Income Below Poverty by Sex and Age in Central City
With 28.1% poverty level for males and 30.2% for females among the residents of Central City, 12 to 14 year old males and 5 year old females are the most vulnerable to poverty, with 14 males (100.0%) and 1 females (100.0%) in their respective age groups living below the poverty level.
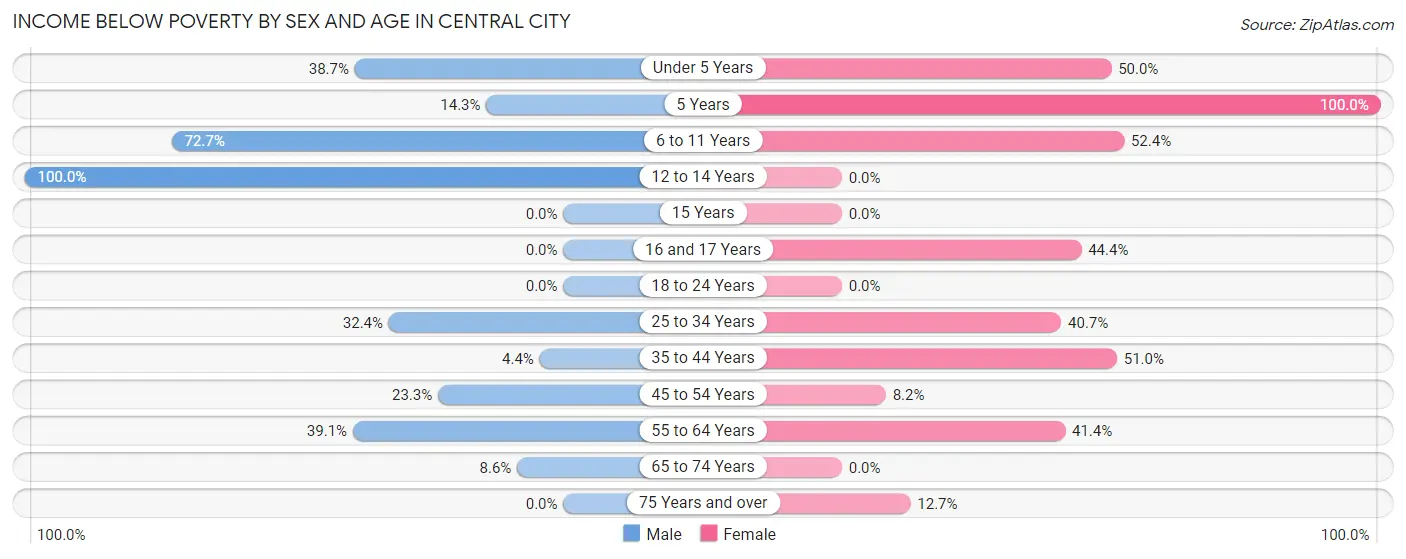
| Age Bracket | Male | Female |
| Under 5 Years | 12 (38.7%) | 23 (50.0%) |
| 5 Years | 2 (14.3%) | 1 (100.0%) |
| 6 to 11 Years | 56 (72.7%) | 11 (52.4%) |
| 12 to 14 Years | 14 (100.0%) | 0 (0.0%) |
| 15 Years | 0 (0.0%) | 0 (0.0%) |
| 16 and 17 Years | 0 (0.0%) | 12 (44.4%) |
| 18 to 24 Years | 0 (0.0%) | 0 (0.0%) |
| 25 to 34 Years | 23 (32.4%) | 46 (40.7%) |
| 35 to 44 Years | 4 (4.4%) | 49 (51.0%) |
| 45 to 54 Years | 10 (23.3%) | 4 (8.2%) |
| 55 to 64 Years | 25 (39.1%) | 29 (41.4%) |
| 65 to 74 Years | 3 (8.6%) | 0 (0.0%) |
| 75 Years and over | 0 (0.0%) | 7 (12.7%) |
| Total | 149 (28.1%) | 182 (30.2%) |
Income Above Poverty by Sex and Age in Central City
According to the poverty statistics in Central City, males aged 15 years and females aged 12 to 14 years are the age groups that are most secure financially, with 100.0% of males and 100.0% of females in these age groups living above the poverty line.
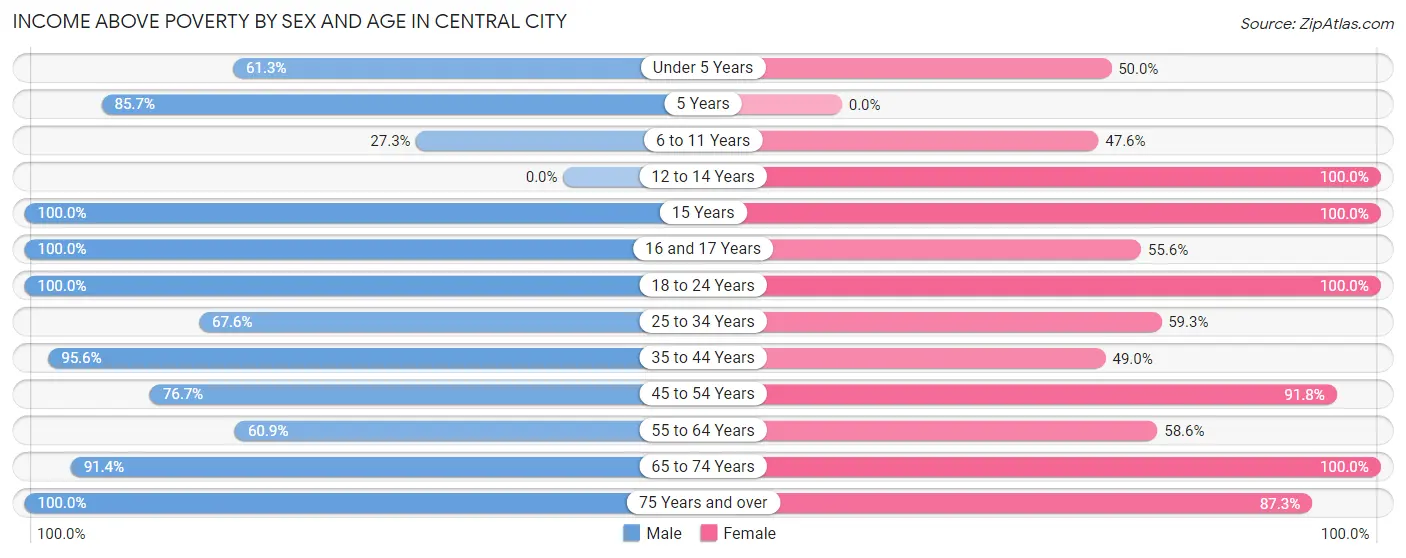
| Age Bracket | Male | Female |
| Under 5 Years | 19 (61.3%) | 23 (50.0%) |
| 5 Years | 12 (85.7%) | 0 (0.0%) |
| 6 to 11 Years | 21 (27.3%) | 10 (47.6%) |
| 12 to 14 Years | 0 (0.0%) | 21 (100.0%) |
| 15 Years | 19 (100.0%) | 2 (100.0%) |
| 16 and 17 Years | 6 (100.0%) | 15 (55.6%) |
| 18 to 24 Years | 36 (100.0%) | 49 (100.0%) |
| 25 to 34 Years | 48 (67.6%) | 67 (59.3%) |
| 35 to 44 Years | 87 (95.6%) | 47 (49.0%) |
| 45 to 54 Years | 33 (76.7%) | 45 (91.8%) |
| 55 to 64 Years | 39 (60.9%) | 41 (58.6%) |
| 65 to 74 Years | 32 (91.4%) | 52 (100.0%) |
| 75 Years and over | 29 (100.0%) | 48 (87.3%) |
| Total | 381 (71.9%) | 420 (69.8%) |
Income Below Poverty Among Married-Couple Families in Central City
The poverty statistics for married-couple families in Central City show that 13.2% or 22 of the total 167 families live below the poverty line. Families with 3 or 4 children have the highest poverty rate of 100.0%, comprising of 5 families. On the other hand, families with 1 or 2 children have the lowest poverty rate of 0.0%, which includes 0 families.
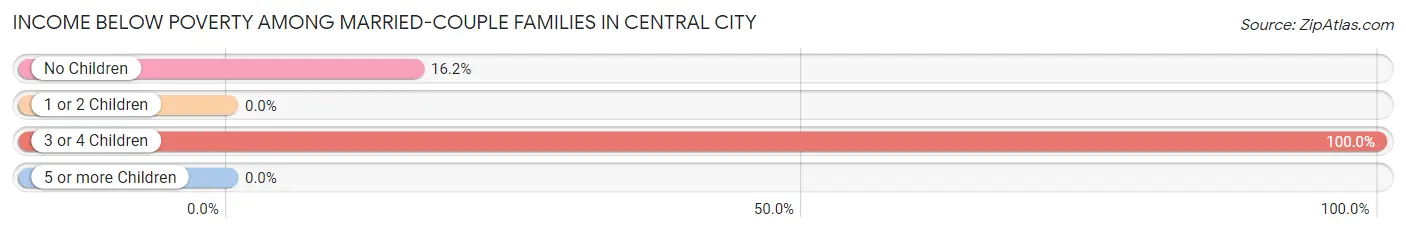
| Children | Above Poverty | Below Poverty |
| No Children | 88 (83.8%) | 17 (16.2%) |
| 1 or 2 Children | 57 (100.0%) | 0 (0.0%) |
| 3 or 4 Children | 0 (0.0%) | 5 (100.0%) |
| 5 or more Children | 0 (0.0%) | 0 (0.0%) |
| Total | 145 (86.8%) | 22 (13.2%) |
Income Below Poverty Among Single-Parent Households in Central City
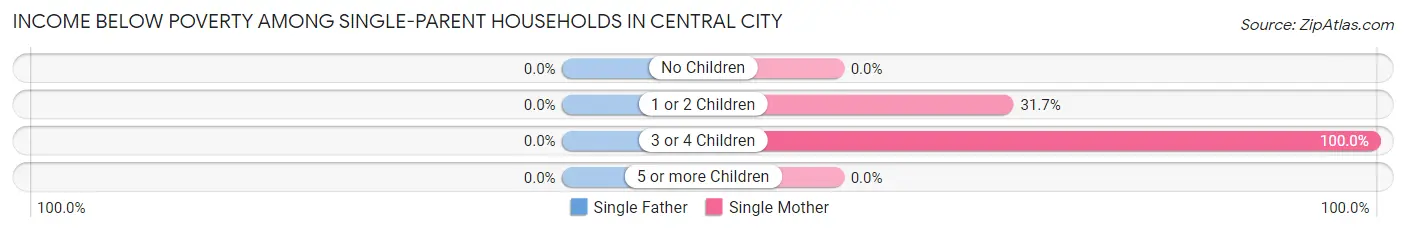
| Children | Single Father | Single Mother |
| No Children | 0 (0.0%) | 0 (0.0%) |
| 1 or 2 Children | 0 (0.0%) | 25 (31.7%) |
| 3 or 4 Children | 0 (0.0%) | 22 (100.0%) |
| 5 or more Children | 0 (0.0%) | 0 (0.0%) |
| Total | 0 (0.0%) | 47 (37.9%) |
Income Below Poverty Among Married-Couple vs Single-Parent Households in Central City
The poverty data for Central City shows that 22 of the married-couple family households (13.2%) and 47 of the single-parent households (29.2%) are living below the poverty level. Within the married-couple family households, those with 3 or 4 children have the highest poverty rate, with 5 households (100.0%) falling below the poverty line. Among the single-parent households, those with 3 or 4 children have the highest poverty rate, with 22 household (100.0%) living below poverty.
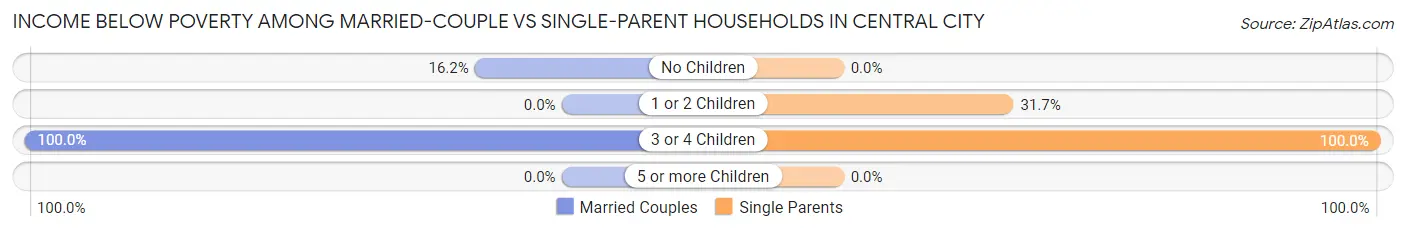
| Children | Married-Couple Families | Single-Parent Households |
| No Children | 17 (16.2%) | 0 (0.0%) |
| 1 or 2 Children | 0 (0.0%) | 25 (31.7%) |
| 3 or 4 Children | 5 (100.0%) | 22 (100.0%) |
| 5 or more Children | 0 (0.0%) | 0 (0.0%) |
| Total | 22 (13.2%) | 47 (29.2%) |
Race in Central City
The most populous races in Central City are White / Caucasian (1,119 | 97.0%), Hispanic or Latino (19 | 1.7%), and Two or more Races (19 | 1.7%).
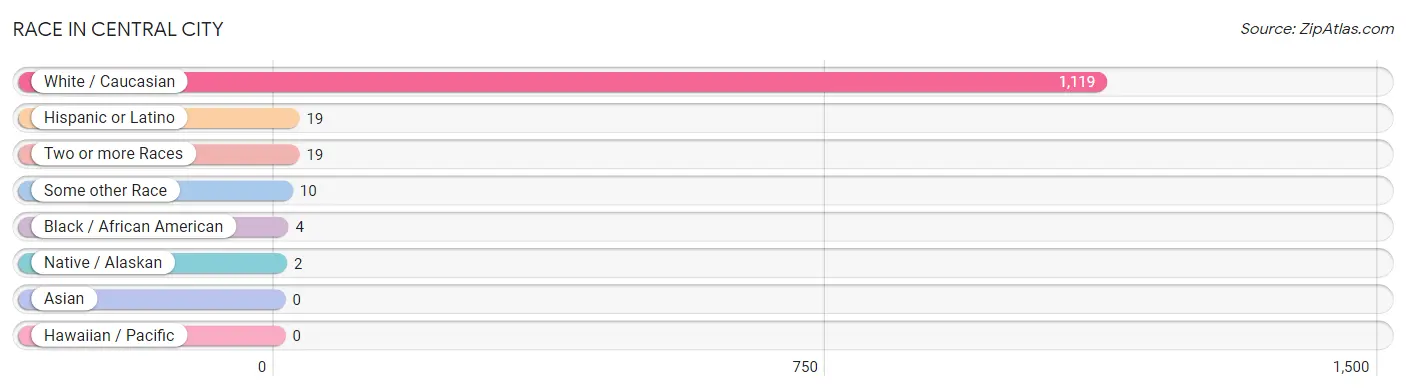
| Race | # Population | % Population |
| Asian | 0 | 0.0% |
| Black / African American | 4 | 0.4% |
| Hawaiian / Pacific | 0 | 0.0% |
| Hispanic or Latino | 19 | 1.7% |
| Native / Alaskan | 2 | 0.2% |
| White / Caucasian | 1,119 | 97.0% |
| Two or more Races | 19 | 1.7% |
| Some other Race | 10 | 0.9% |
| Total | 1,154 | 100.0% |
Ancestry in Central City
The most populous ancestries reported in Central City are German (243 | 21.1%), Irish (126 | 10.9%), English (71 | 6.1%), American (61 | 5.3%), and Italian (50 | 4.3%), together accounting for 47.8% of all Central City residents.
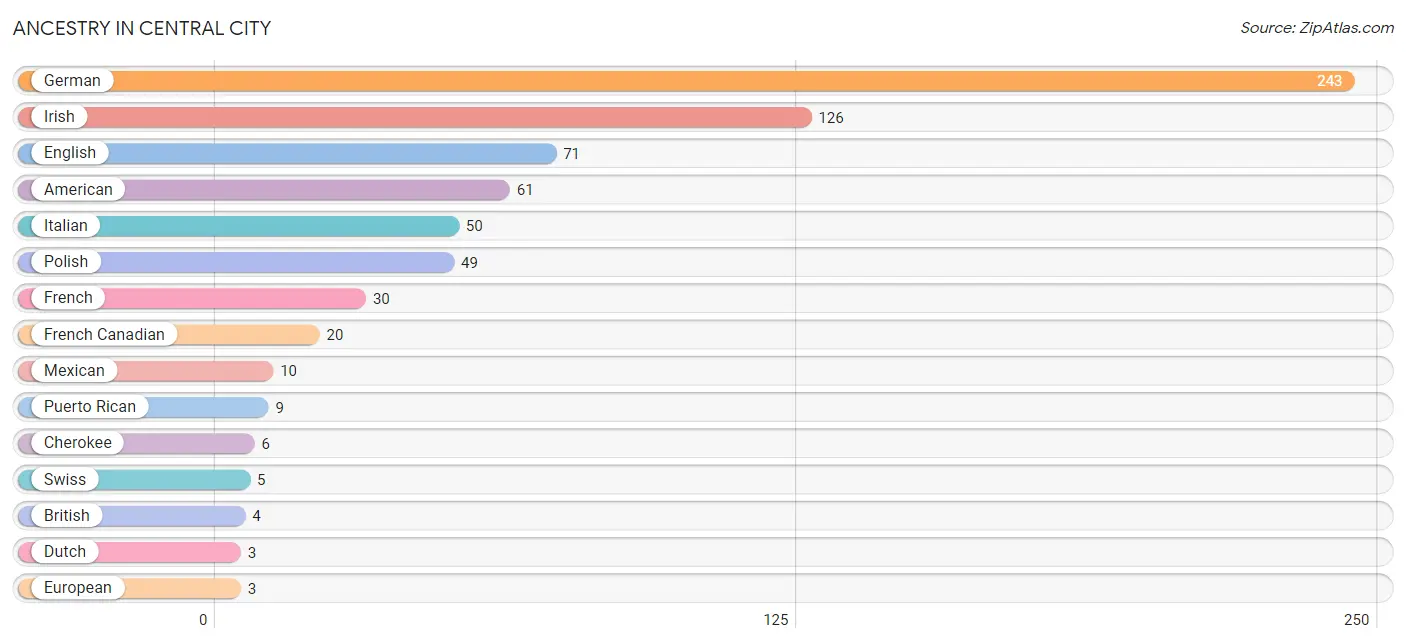
| Ancestry | # Population | % Population |
| American | 61 | 5.3% |
| British | 4 | 0.4% |
| Cherokee | 6 | 0.5% |
| Dutch | 3 | 0.3% |
| English | 71 | 6.1% |
| European | 3 | 0.3% |
| French | 30 | 2.6% |
| French Canadian | 20 | 1.7% |
| German | 243 | 21.1% |
| Irish | 126 | 10.9% |
| Italian | 50 | 4.3% |
| Mexican | 10 | 0.9% |
| Mexican American Indian | 2 | 0.2% |
| Polish | 49 | 4.3% |
| Puerto Rican | 9 | 0.8% |
| Scottish | 2 | 0.2% |
| Swiss | 5 | 0.4% | View All 17 Rows |
Immigrants in Central City
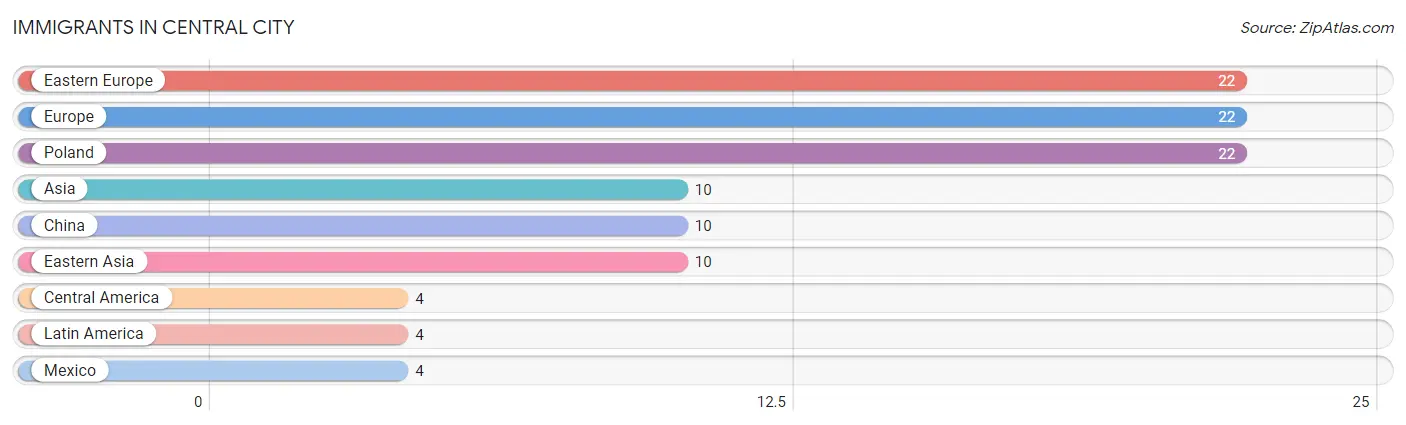
The most numerous immigrant groups reported in Central City came from Eastern Europe (22 | 1.9%), Europe (22 | 1.9%), Poland (22 | 1.9%), Asia (10 | 0.9%), and China (10 | 0.9%), together accounting for 7.5% of all Central City residents.
| Immigration Origin | # Population | % Population |
| Asia | 10 | 0.9% |
| Central America | 4 | 0.4% |
| China | 10 | 0.9% |
| Eastern Asia | 10 | 0.9% |
| Eastern Europe | 22 | 1.9% |
| Europe | 22 | 1.9% |
| Latin America | 4 | 0.4% |
| Mexico | 4 | 0.4% |
| Poland | 22 | 1.9% | View All 9 Rows |
Sex and Age in Central City
Sex and Age in Central City
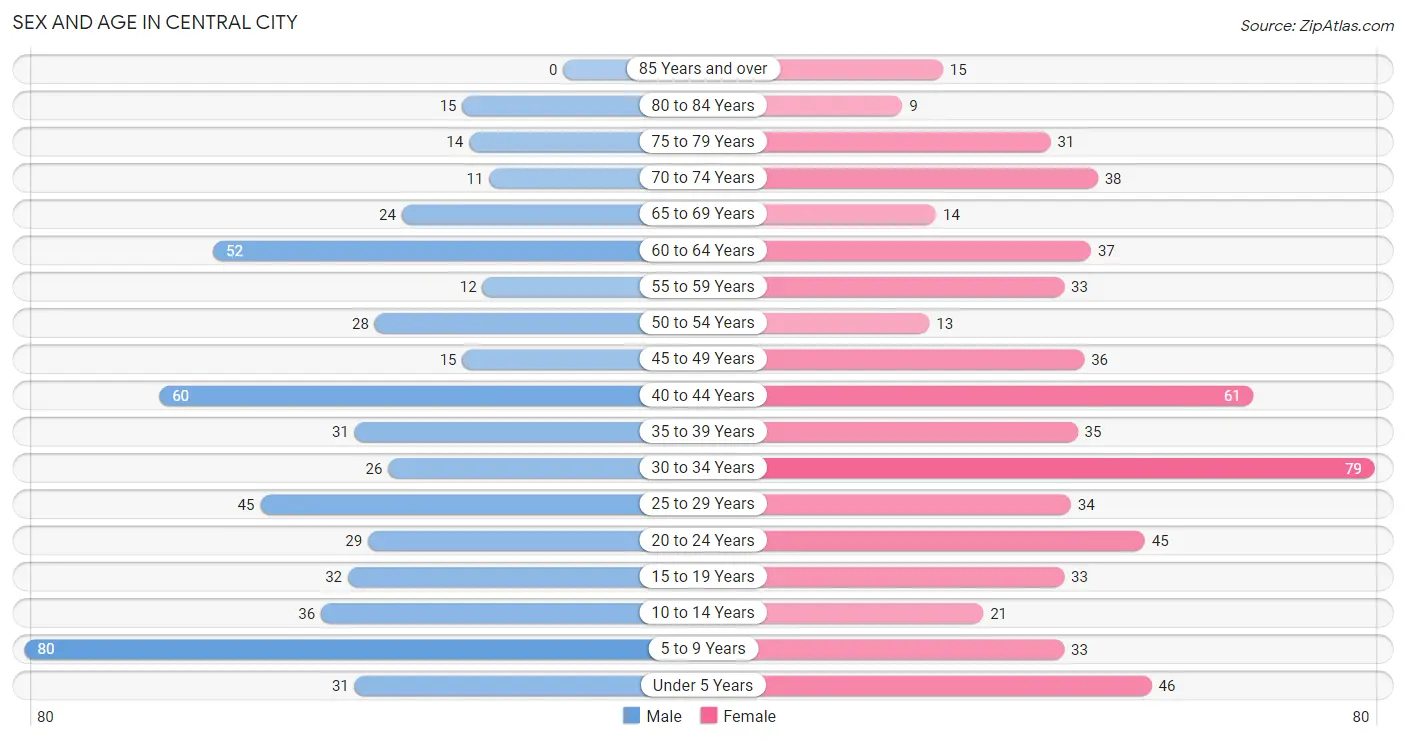
The most populous age groups in Central City are 5 to 9 Years (80 | 14.8%) for men and 30 to 34 Years (79 | 12.9%) for women.
| Age Bracket | Male | Female |
| Under 5 Years | 31 (5.7%) | 46 (7.5%) |
| 5 to 9 Years | 80 (14.8%) | 33 (5.4%) |
| 10 to 14 Years | 36 (6.7%) | 21 (3.4%) |
| 15 to 19 Years | 32 (5.9%) | 33 (5.4%) |
| 20 to 24 Years | 29 (5.4%) | 45 (7.3%) |
| 25 to 29 Years | 45 (8.3%) | 34 (5.6%) |
| 30 to 34 Years | 26 (4.8%) | 79 (12.9%) |
| 35 to 39 Years | 31 (5.7%) | 35 (5.7%) |
| 40 to 44 Years | 60 (11.1%) | 61 (10.0%) |
| 45 to 49 Years | 15 (2.8%) | 36 (5.9%) |
| 50 to 54 Years | 28 (5.2%) | 13 (2.1%) |
| 55 to 59 Years | 12 (2.2%) | 33 (5.4%) |
| 60 to 64 Years | 52 (9.6%) | 37 (6.0%) |
| 65 to 69 Years | 24 (4.4%) | 14 (2.3%) |
| 70 to 74 Years | 11 (2.0%) | 38 (6.2%) |
| 75 to 79 Years | 14 (2.6%) | 31 (5.1%) |
| 80 to 84 Years | 15 (2.8%) | 9 (1.5%) |
| 85 Years and over | 0 (0.0%) | 15 (2.5%) |
| Total | 541 (100.0%) | 613 (100.0%) |
Families and Households in Central City
Median Family Size in Central City
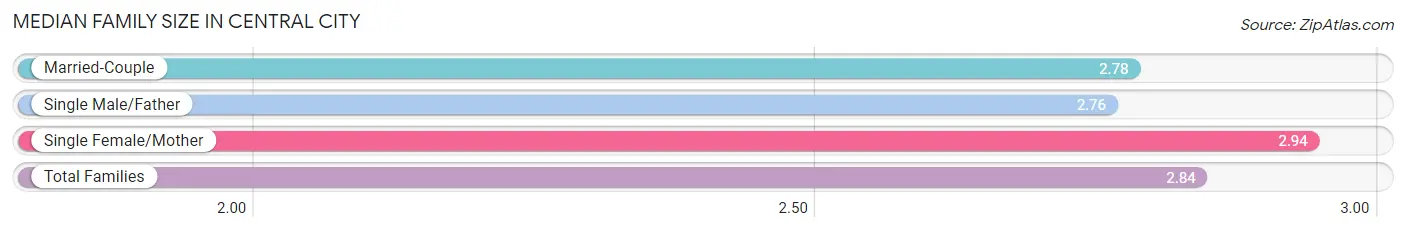
The median family size in Central City is 2.84 persons per family, with single female/mother families (124 | 37.8%) accounting for the largest median family size of 2.94 persons per family. On the other hand, single male/father families (37 | 11.3%) represent the smallest median family size with 2.76 persons per family.
| Family Type | # Families | Family Size |
| Married-Couple | 167 (50.9%) | 2.78 |
| Single Male/Father | 37 (11.3%) | 2.76 |
| Single Female/Mother | 124 (37.8%) | 2.94 |
| Total Families | 328 (100.0%) | 2.84 |
Median Household Size in Central City
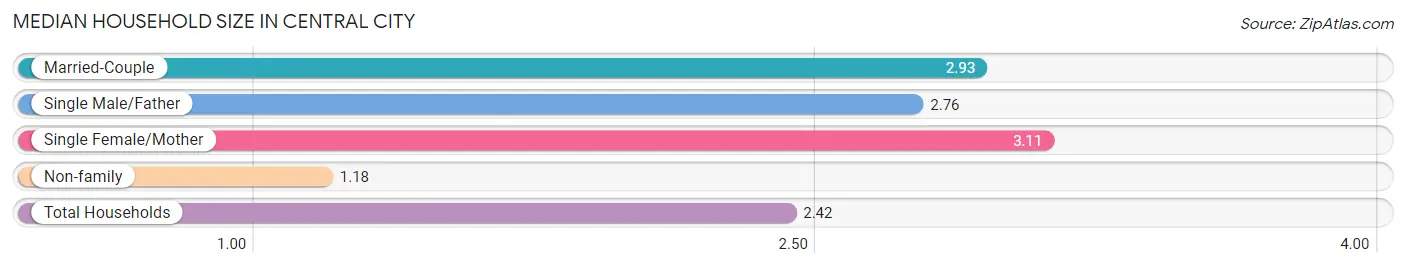
The median household size in Central City is 2.42 persons per household, with single female/mother households (124 | 26.1%) accounting for the largest median household size of 3.11 persons per household. non-family households (147 | 30.9%) represent the smallest median household size with 1.18 persons per household.
| Household Type | # Households | Household Size |
| Married-Couple | 167 (35.2%) | 2.93 |
| Single Male/Father | 37 (7.8%) | 2.76 |
| Single Female/Mother | 124 (26.1%) | 3.11 |
| Non-family | 147 (30.9%) | 1.18 |
| Total Households | 475 (100.0%) | 2.42 |
Household Size by Marriage Status in Central City
Out of a total of 475 households in Central City, 328 (69.1%) are family households, while 147 (30.9%) are nonfamily households. The most numerous type of family households are 3-person households, comprising 148, and the most common type of nonfamily households are 1-person households, comprising 122.
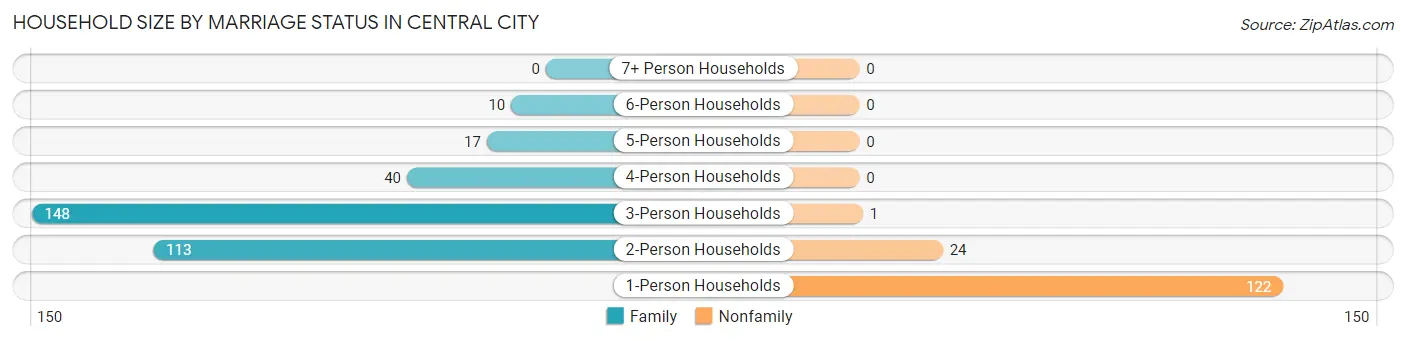
| Household Size | Family Households | Nonfamily Households |
| 1-Person Households | - | 122 (25.7%) |
| 2-Person Households | 113 (23.8%) | 24 (5.1%) |
| 3-Person Households | 148 (31.2%) | 1 (0.2%) |
| 4-Person Households | 40 (8.4%) | 0 (0.0%) |
| 5-Person Households | 17 (3.6%) | 0 (0.0%) |
| 6-Person Households | 10 (2.1%) | 0 (0.0%) |
| 7+ Person Households | 0 (0.0%) | 0 (0.0%) |
| Total | 328 (69.1%) | 147 (30.9%) |
Female Fertility in Central City
Fertility by Age in Central City
Average fertility rate in Central City is 27.0 births per 1,000 women. Women in the age bracket of 20 to 34 years have the highest fertility rate with 32.0 births per 1,000 women. Women in the age bracket of 20 to 34 years acount for 55.6% of all women with births.
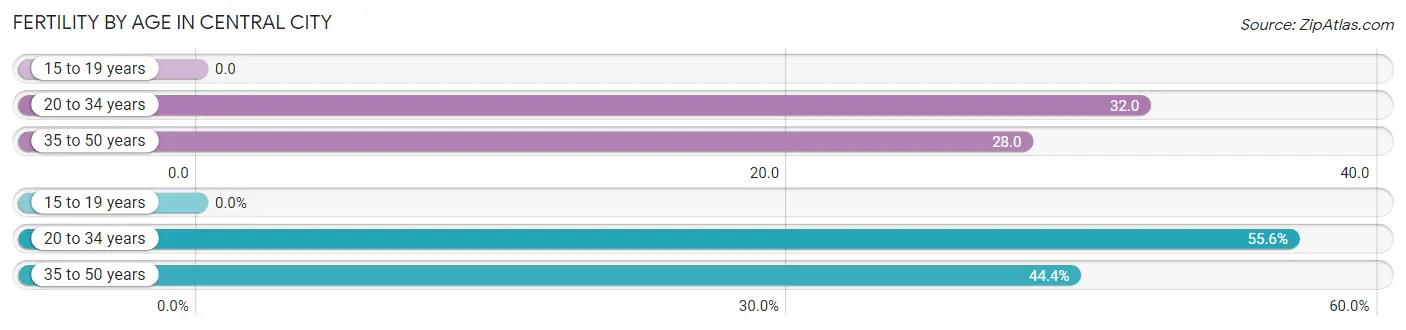
| Age Bracket | Women with Births | Births / 1,000 Women |
| 15 to 19 years | 0 (0.0%) | 0.0 |
| 20 to 34 years | 5 (55.6%) | 32.0 |
| 35 to 50 years | 4 (44.4%) | 28.0 |
| Total | 9 (100.0%) | 27.0 |
Fertility by Age by Marriage Status in Central City
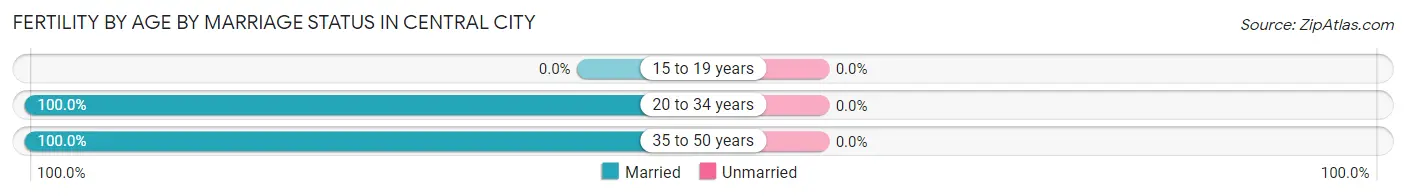
| Age Bracket | Married | Unmarried |
| 15 to 19 years | 0 (0.0%) | 0 (0.0%) |
| 20 to 34 years | 5 (100.0%) | 0 (0.0%) |
| 35 to 50 years | 4 (100.0%) | 0 (0.0%) |
| Total | 9 (100.0%) | 0 (0.0%) |
Fertility by Education in Central City
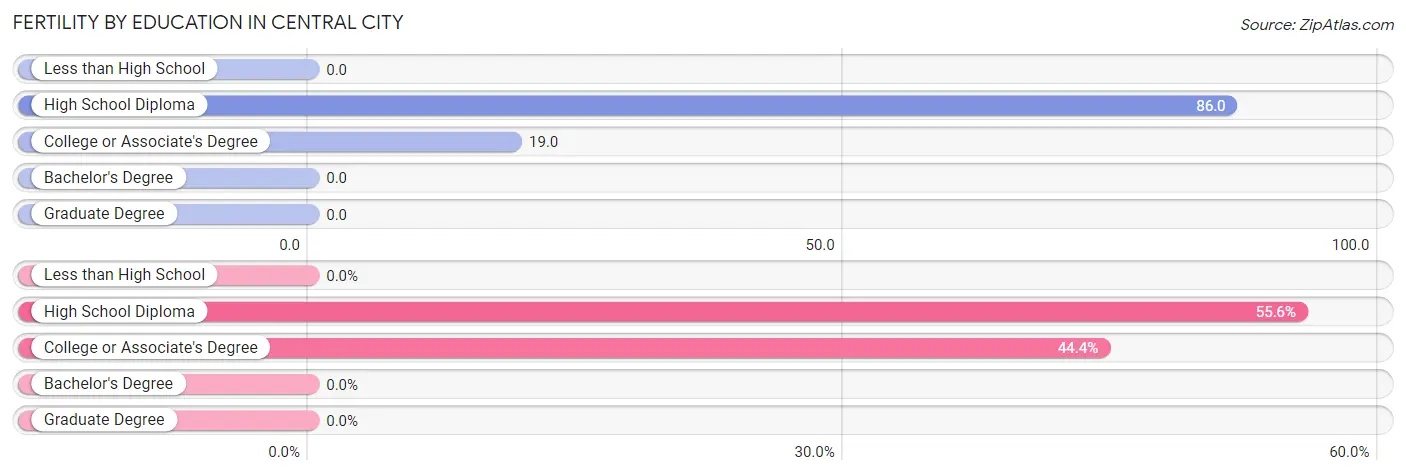
| Educational Attainment | Women with Births | Births / 1,000 Women |
| Less than High School | 0 (0.0%) | 0.0 |
| High School Diploma | 5 (55.6%) | 86.0 |
| College or Associate's Degree | 4 (44.4%) | 19.0 |
| Bachelor's Degree | 0 (0.0%) | 0.0 |
| Graduate Degree | 0 (0.0%) | 0.0 |
| Total | 9 (100.0%) | 27.0 |
Fertility by Education by Marriage Status in Central City
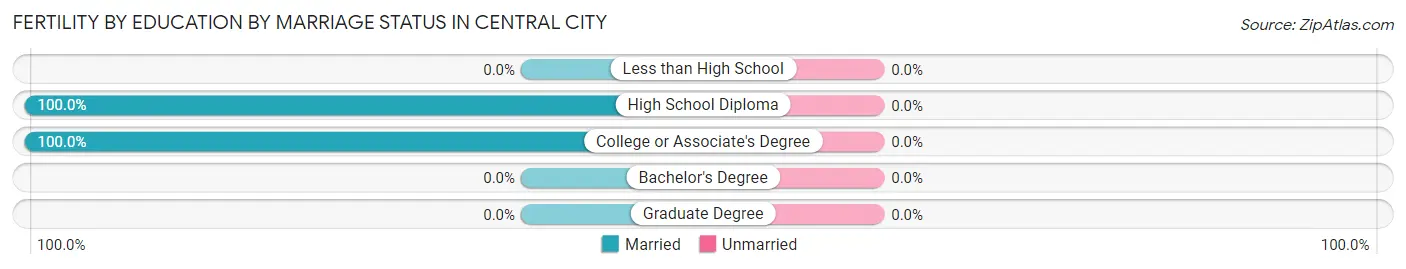
| Educational Attainment | Married | Unmarried |
| Less than High School | 0 (0.0%) | 0 (0.0%) |
| High School Diploma | 5 (100.0%) | 0 (0.0%) |
| College or Associate's Degree | 4 (100.0%) | 0 (0.0%) |
| Bachelor's Degree | 0 (0.0%) | 0 (0.0%) |
| Graduate Degree | 0 (0.0%) | 0 (0.0%) |
| Total | 9 (100.0%) | 0 (0.0%) |
Employment Characteristics in Central City
Employment by Class of Employer in Central City
Among the 485 employed individuals in Central City, private company employees (341 | 70.3%), local government employees (76 | 15.7%), and state government employees (23 | 4.7%) make up the most common classes of employment.
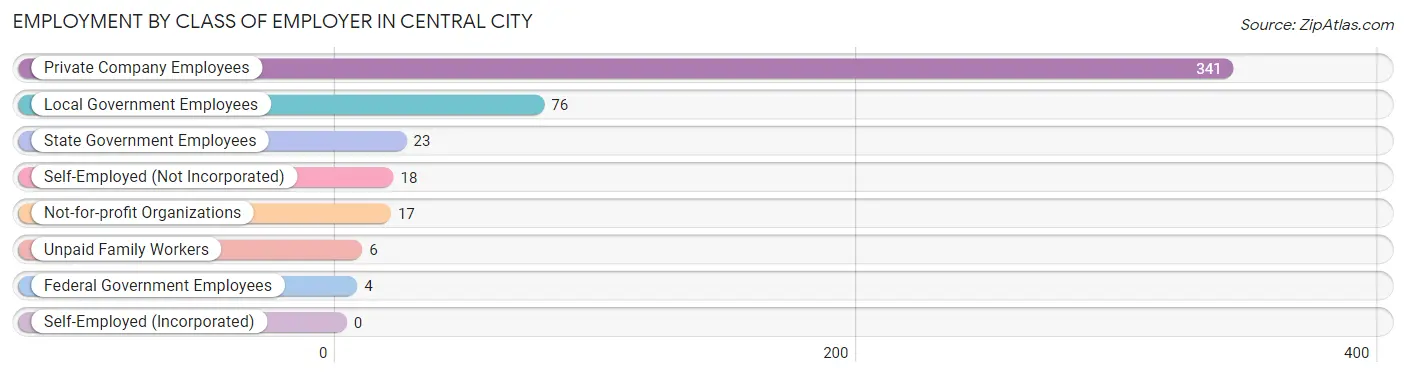
| Employer Class | # Employees | % Employees |
| Private Company Employees | 341 | 70.3% |
| Self-Employed (Incorporated) | 0 | 0.0% |
| Self-Employed (Not Incorporated) | 18 | 3.7% |
| Not-for-profit Organizations | 17 | 3.5% |
| Local Government Employees | 76 | 15.7% |
| State Government Employees | 23 | 4.7% |
| Federal Government Employees | 4 | 0.8% |
| Unpaid Family Workers | 6 | 1.2% |
| Total | 485 | 100.0% |
Employment Status by Age in Central City
According to the labor force statistics for Central City, out of the total population over 16 years of age (886), 56.7% or 502 individuals are in the labor force, with 3.2% or 16 of them unemployed. The age group with the highest labor force participation rate is 16 to 19 years, with 93.2% or 41 individuals in the labor force. Within the labor force, the 65 to 74 years age range has the highest percentage of unemployed individuals, with 33.3% or 3 of them being unemployed.
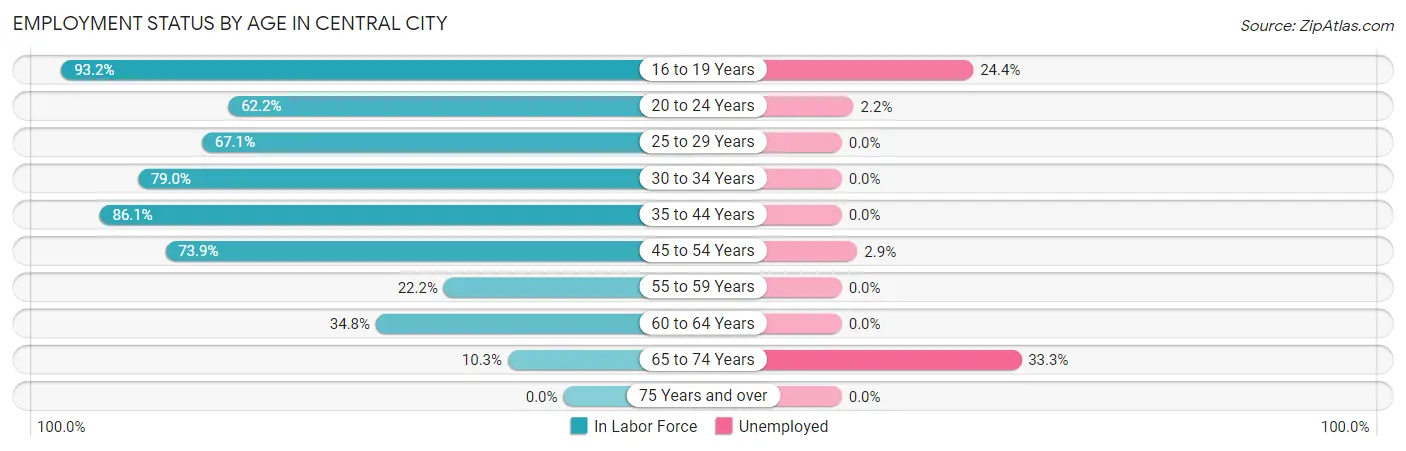
| Age Bracket | In Labor Force | Unemployed |
| 16 to 19 Years | 41 (93.2%) | 10 (24.4%) |
| 20 to 24 Years | 46 (62.2%) | 1 (2.2%) |
| 25 to 29 Years | 53 (67.1%) | 0 (0.0%) |
| 30 to 34 Years | 83 (79.0%) | 0 (0.0%) |
| 35 to 44 Years | 161 (86.1%) | 0 (0.0%) |
| 45 to 54 Years | 68 (73.9%) | 2 (2.9%) |
| 55 to 59 Years | 10 (22.2%) | 0 (0.0%) |
| 60 to 64 Years | 31 (34.8%) | 0 (0.0%) |
| 65 to 74 Years | 9 (10.3%) | 3 (33.3%) |
| 75 Years and over | 0 (0.0%) | 0 (0.0%) |
| Total | 502 (56.7%) | 16 (3.2%) |
Employment Status by Educational Attainment in Central City
According to labor force statistics for Central City, 68.0% of individuals (406) out of the total population between 25 and 64 years of age (597) are in the labor force, with 0.5% or 2 of them being unemployed. The group with the highest labor force participation rate are those with the educational attainment of college / associate degree, with 73.7% or 224 individuals in the labor force. Within the labor force, individuals with bachelor's degree or higher education have the highest percentage of unemployment, with 6.7% or 2 of them being unemployed.
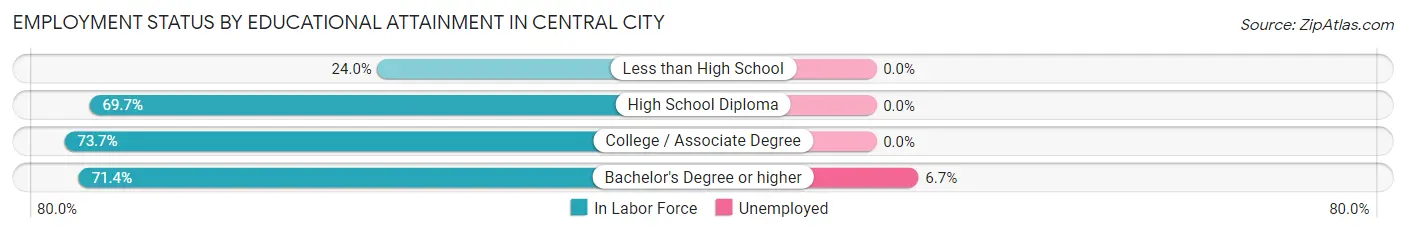
| Educational Attainment | In Labor Force | Unemployed |
| Less than High School | 12 (24.0%) | 0 (0.0%) |
| High School Diploma | 140 (69.7%) | 0 (0.0%) |
| College / Associate Degree | 224 (73.7%) | 0 (0.0%) |
| Bachelor's Degree or higher | 30 (71.4%) | 3 (6.7%) |
| Total | 406 (68.0%) | 3 (0.5%) |
Employment Occupations by Sex in Central City
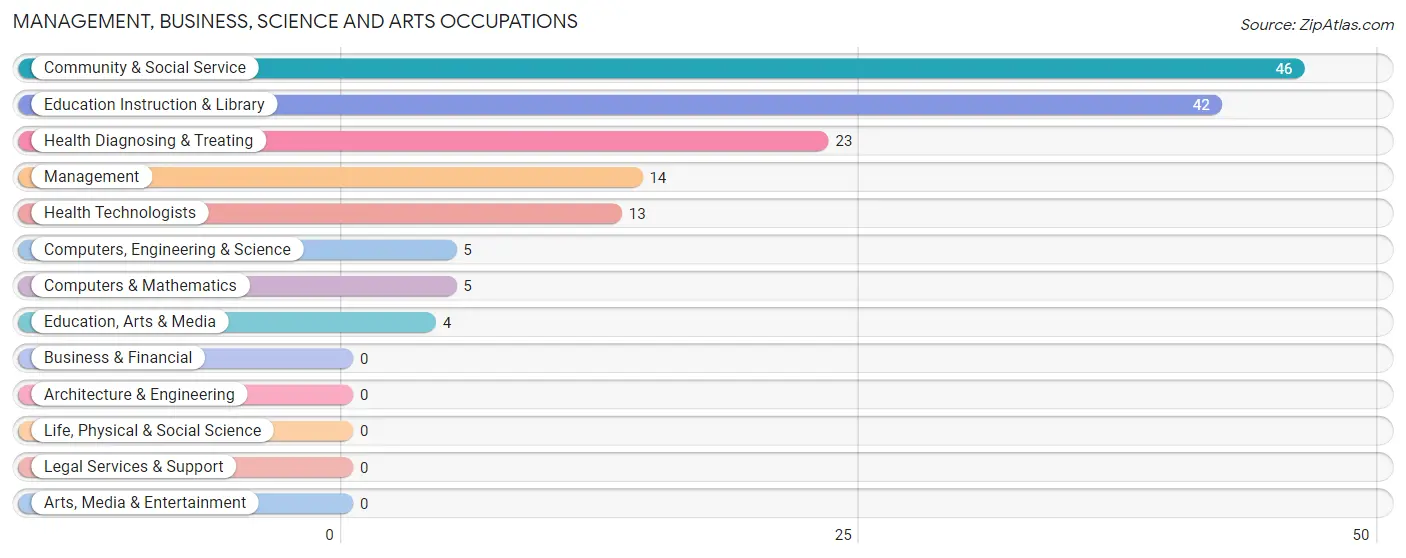
Management, Business, Science and Arts Occupations
The most common Management, Business, Science and Arts occupations in Central City are Community & Social Service (46 | 9.5%), Education Instruction & Library (42 | 8.6%), Health Diagnosing & Treating (23 | 4.7%), Management (14 | 2.9%), and Health Technologists (13 | 2.7%).
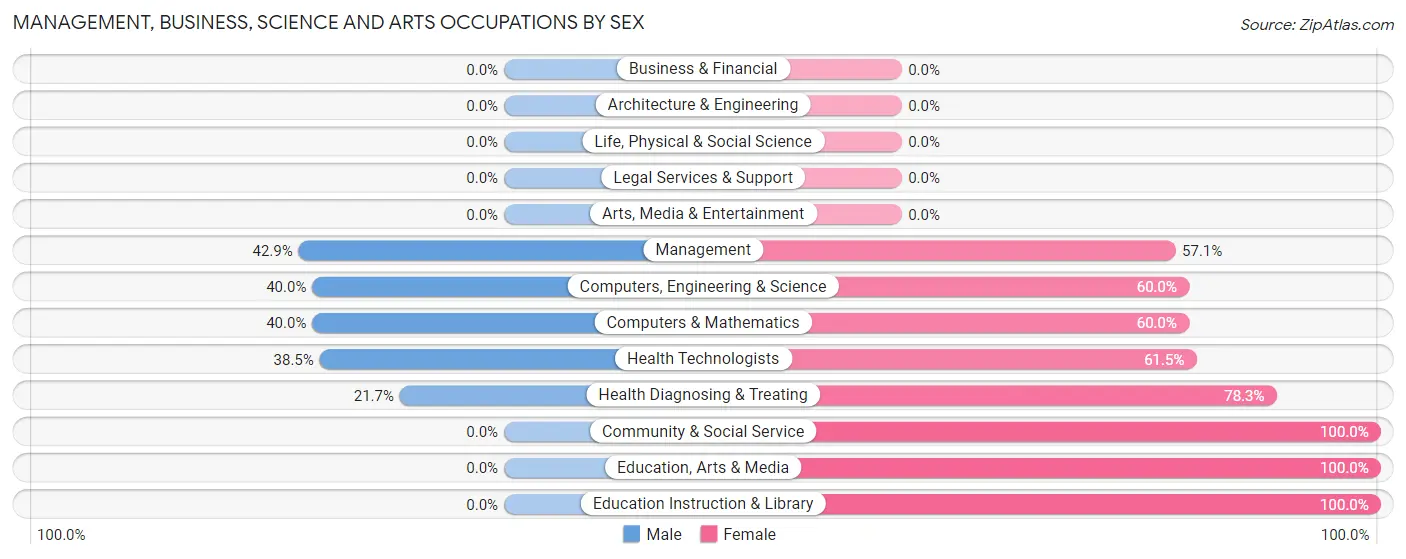
Management, Business, Science and Arts Occupations by Sex
Within the Management, Business, Science and Arts occupations in Central City, the most male-oriented occupations are Management (42.9%), Computers, Engineering & Science (40.0%), and Computers & Mathematics (40.0%), while the most female-oriented occupations are Community & Social Service (100.0%), Education, Arts & Media (100.0%), and Education Instruction & Library (100.0%).
| Occupation | Male | Female |
| Management | 6 (42.9%) | 8 (57.1%) |
| Business & Financial | 0 (0.0%) | 0 (0.0%) |
| Computers, Engineering & Science | 2 (40.0%) | 3 (60.0%) |
| Computers & Mathematics | 2 (40.0%) | 3 (60.0%) |
| Architecture & Engineering | 0 (0.0%) | 0 (0.0%) |
| Life, Physical & Social Science | 0 (0.0%) | 0 (0.0%) |
| Community & Social Service | 0 (0.0%) | 46 (100.0%) |
| Education, Arts & Media | 0 (0.0%) | 4 (100.0%) |
| Legal Services & Support | 0 (0.0%) | 0 (0.0%) |
| Education Instruction & Library | 0 (0.0%) | 42 (100.0%) |
| Arts, Media & Entertainment | 0 (0.0%) | 0 (0.0%) |
| Health Diagnosing & Treating | 5 (21.7%) | 18 (78.3%) |
| Health Technologists | 5 (38.5%) | 8 (61.5%) |
| Total (Category) | 13 (14.8%) | 75 (85.2%) |
| Total (Overall) | 177 (36.4%) | 309 (63.6%) |
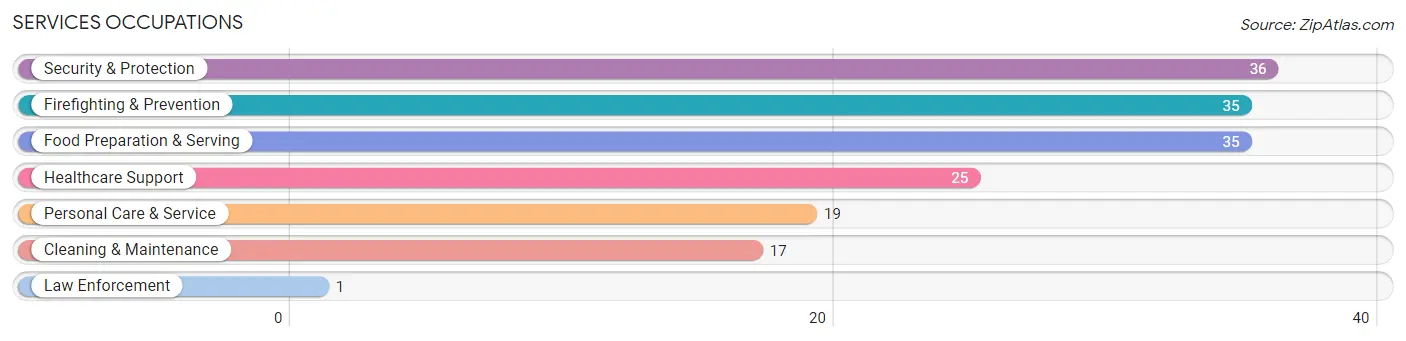
Services Occupations
The most common Services occupations in Central City are Security & Protection (36 | 7.4%), Firefighting & Prevention (35 | 7.2%), Food Preparation & Serving (35 | 7.2%), Healthcare Support (25 | 5.1%), and Personal Care & Service (19 | 3.9%).
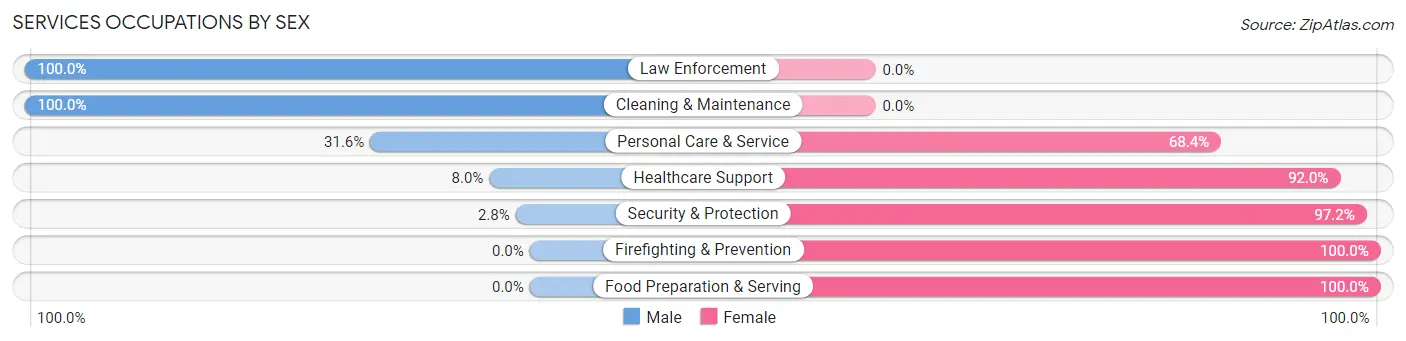
Services Occupations by Sex
Within the Services occupations in Central City, the most male-oriented occupations are Law Enforcement (100.0%), Cleaning & Maintenance (100.0%), and Personal Care & Service (31.6%), while the most female-oriented occupations are Firefighting & Prevention (100.0%), Food Preparation & Serving (100.0%), and Security & Protection (97.2%).
| Occupation | Male | Female |
| Healthcare Support | 2 (8.0%) | 23 (92.0%) |
| Security & Protection | 1 (2.8%) | 35 (97.2%) |
| Firefighting & Prevention | 0 (0.0%) | 35 (100.0%) |
| Law Enforcement | 1 (100.0%) | 0 (0.0%) |
| Food Preparation & Serving | 0 (0.0%) | 35 (100.0%) |
| Cleaning & Maintenance | 17 (100.0%) | 0 (0.0%) |
| Personal Care & Service | 6 (31.6%) | 13 (68.4%) |
| Total (Category) | 26 (19.7%) | 106 (80.3%) |
| Total (Overall) | 177 (36.4%) | 309 (63.6%) |
Sales and Office Occupations
The most common Sales and Office occupations in Central City are Sales & Related (58 | 11.9%), and Office & Administration (51 | 10.5%).

Sales and Office Occupations by Sex

| Occupation | Male | Female |
| Sales & Related | 8 (13.8%) | 50 (86.2%) |
| Office & Administration | 11 (21.6%) | 40 (78.4%) |
| Total (Category) | 19 (17.4%) | 90 (82.6%) |
| Total (Overall) | 177 (36.4%) | 309 (63.6%) |
Natural Resources, Construction and Maintenance Occupations
The most common Natural Resources, Construction and Maintenance occupations in Central City are Construction & Extraction (29 | 6.0%), and Installation, Maintenance & Repair (7 | 1.4%).
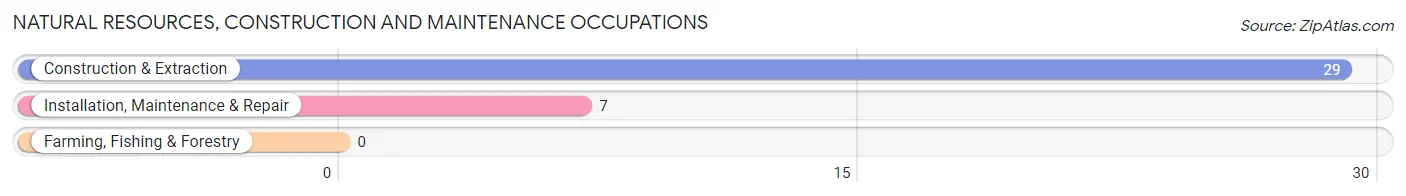
Natural Resources, Construction and Maintenance Occupations by Sex

| Occupation | Male | Female |
| Farming, Fishing & Forestry | 0 (0.0%) | 0 (0.0%) |
| Construction & Extraction | 29 (100.0%) | 0 (0.0%) |
| Installation, Maintenance & Repair | 7 (100.0%) | 0 (0.0%) |
| Total (Category) | 36 (100.0%) | 0 (0.0%) |
| Total (Overall) | 177 (36.4%) | 309 (63.6%) |
Production, Transportation and Moving Occupations
The most common Production, Transportation and Moving occupations in Central City are Production (90 | 18.5%), Material Moving (18 | 3.7%), and Transportation (13 | 2.7%).
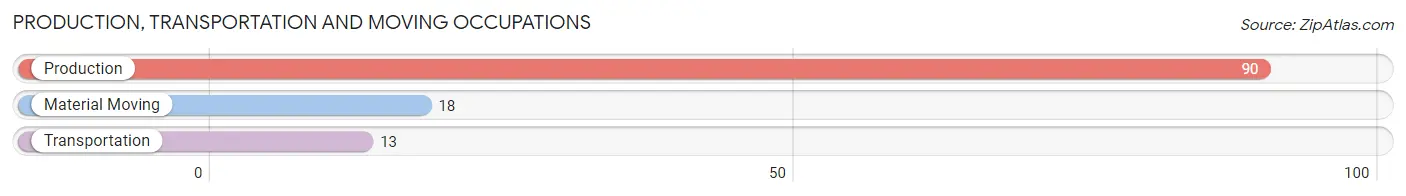
Production, Transportation and Moving Occupations by Sex
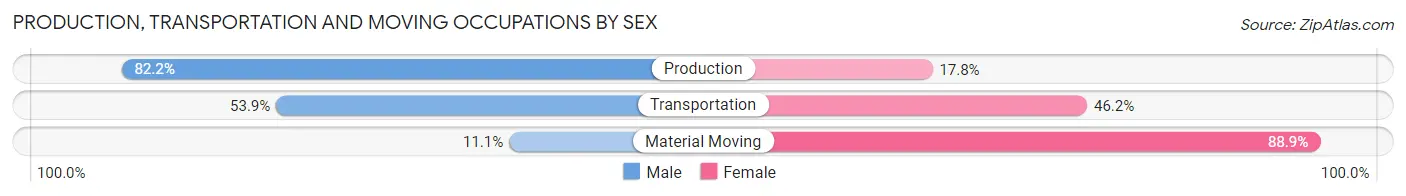
| Occupation | Male | Female |
| Production | 74 (82.2%) | 16 (17.8%) |
| Transportation | 7 (53.8%) | 6 (46.2%) |
| Material Moving | 2 (11.1%) | 16 (88.9%) |
| Total (Category) | 83 (68.6%) | 38 (31.4%) |
| Total (Overall) | 177 (36.4%) | 309 (63.6%) |
Employment Industries by Sex in Central City
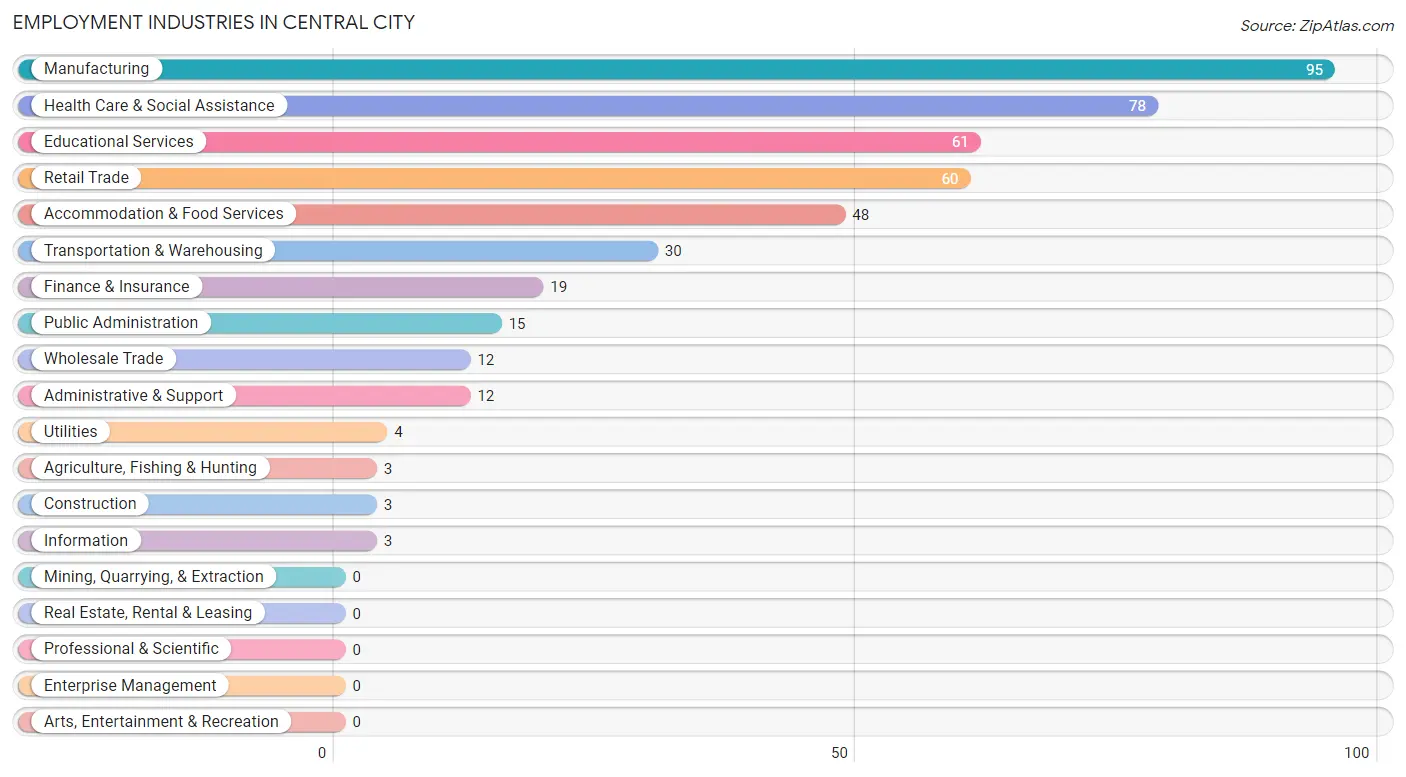
Employment Industries in Central City
The major employment industries in Central City include Manufacturing (95 | 19.6%), Health Care & Social Assistance (78 | 16.1%), Educational Services (61 | 12.6%), Retail Trade (60 | 12.3%), and Accommodation & Food Services (48 | 9.9%).
Employment Industries by Sex in Central City
The Central City industries that see more men than women are Construction (100.0%), Manufacturing (100.0%), and Utilities (100.0%), whereas the industries that tend to have a higher number of women are Agriculture, Fishing & Hunting (100.0%), Information (100.0%), and Finance & Insurance (100.0%).
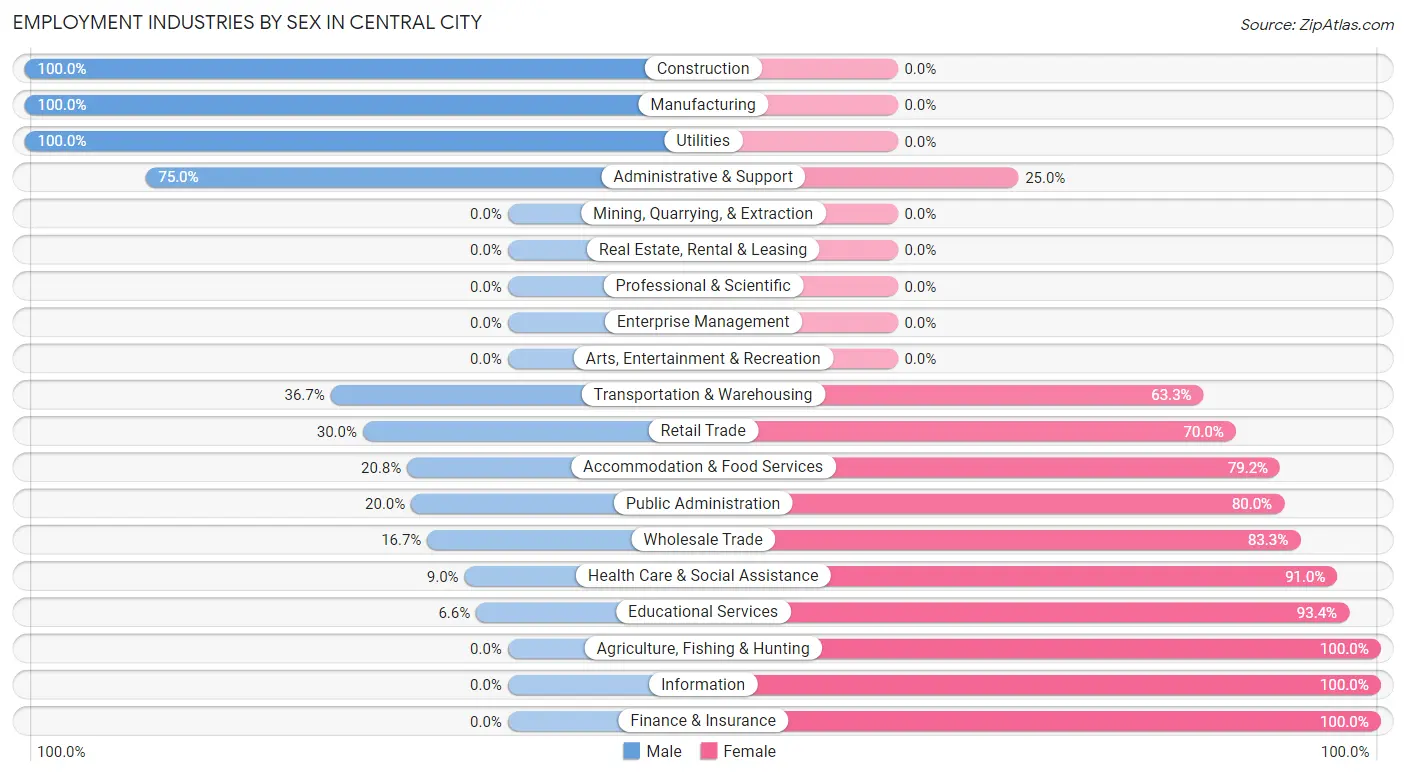
| Industry | Male | Female |
| Agriculture, Fishing & Hunting | 0 (0.0%) | 3 (100.0%) |
| Mining, Quarrying, & Extraction | 0 (0.0%) | 0 (0.0%) |
| Construction | 3 (100.0%) | 0 (0.0%) |
| Manufacturing | 95 (100.0%) | 0 (0.0%) |
| Wholesale Trade | 2 (16.7%) | 10 (83.3%) |
| Retail Trade | 18 (30.0%) | 42 (70.0%) |
| Transportation & Warehousing | 11 (36.7%) | 19 (63.3%) |
| Utilities | 4 (100.0%) | 0 (0.0%) |
| Information | 0 (0.0%) | 3 (100.0%) |
| Finance & Insurance | 0 (0.0%) | 19 (100.0%) |
| Real Estate, Rental & Leasing | 0 (0.0%) | 0 (0.0%) |
| Professional & Scientific | 0 (0.0%) | 0 (0.0%) |
| Enterprise Management | 0 (0.0%) | 0 (0.0%) |
| Administrative & Support | 9 (75.0%) | 3 (25.0%) |
| Educational Services | 4 (6.6%) | 57 (93.4%) |
| Health Care & Social Assistance | 7 (9.0%) | 71 (91.0%) |
| Arts, Entertainment & Recreation | 0 (0.0%) | 0 (0.0%) |
| Accommodation & Food Services | 10 (20.8%) | 38 (79.2%) |
| Public Administration | 3 (20.0%) | 12 (80.0%) |
| Total | 177 (36.4%) | 309 (63.6%) |
Education in Central City
School Enrollment in Central City
The most common levels of schooling among the 281 students in Central City are elementary school (95 | 33.8%), high school (51 | 18.1%), and middle school (45 | 16.0%).
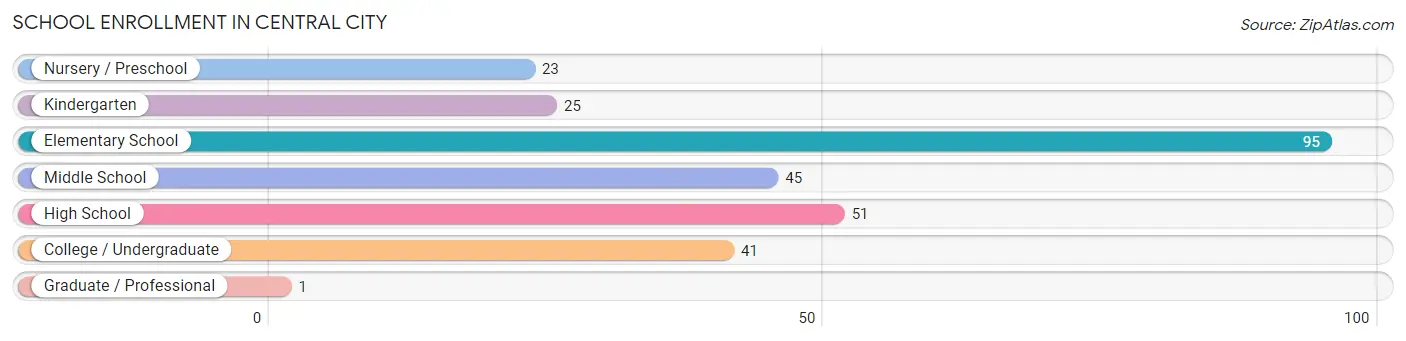
| School Level | # Students | % Students |
| Nursery / Preschool | 23 | 8.2% |
| Kindergarten | 25 | 8.9% |
| Elementary School | 95 | 33.8% |
| Middle School | 45 | 16.0% |
| High School | 51 | 18.1% |
| College / Undergraduate | 41 | 14.6% |
| Graduate / Professional | 1 | 0.4% |
| Total | 281 | 100.0% |
School Enrollment by Age by Funding Source in Central City
Out of a total of 281 students who are enrolled in schools in Central City, 15 (5.3%) attend a private institution, while the remaining 266 (94.7%) are enrolled in public schools. The age group of 10 to 14 year olds has the highest likelihood of being enrolled in private schools, with 13 (23.6% in the age bracket) enrolled. Conversely, the age group of 3 to 4 year olds has the lowest likelihood of being enrolled in a private school, with 20 (100.0% in the age bracket) attending a public institution.
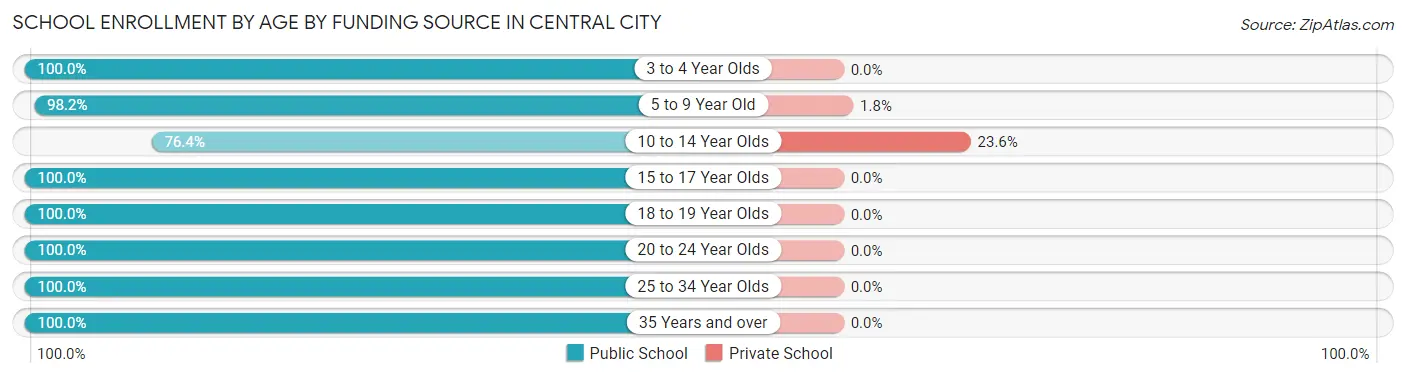
| Age Bracket | Public School | Private School |
| 3 to 4 Year Olds | 20 (100.0%) | 0 (0.0%) |
| 5 to 9 Year Old | 111 (98.2%) | 2 (1.8%) |
| 10 to 14 Year Olds | 42 (76.4%) | 13 (23.6%) |
| 15 to 17 Year Olds | 48 (100.0%) | 0 (0.0%) |
| 18 to 19 Year Olds | 11 (100.0%) | 0 (0.0%) |
| 20 to 24 Year Olds | 23 (100.0%) | 0 (0.0%) |
| 25 to 34 Year Olds | 1 (100.0%) | 0 (0.0%) |
| 35 Years and over | 10 (100.0%) | 0 (0.0%) |
| Total | 266 (94.7%) | 15 (5.3%) |
Educational Attainment by Field of Study in Central City
Bio, nature & agricultural (20 | 30.8%), business (14 | 21.5%), literature & languages (9 | 13.9%), physical & health sciences (5 | 7.7%), and psychology (4 | 6.1%) are the most common fields of study among 65 individuals in Central City who have obtained a bachelor's degree or higher.
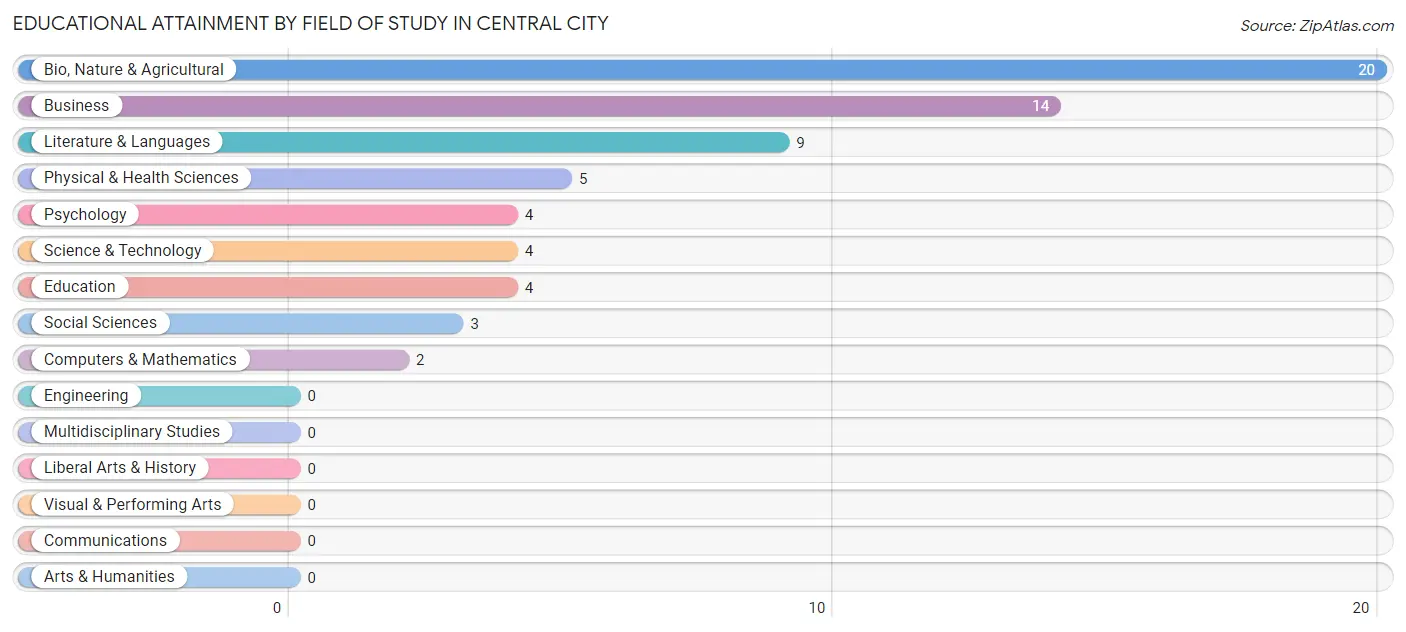
| Field of Study | # Graduates | % Graduates |
| Computers & Mathematics | 2 | 3.1% |
| Bio, Nature & Agricultural | 20 | 30.8% |
| Physical & Health Sciences | 5 | 7.7% |
| Psychology | 4 | 6.1% |
| Social Sciences | 3 | 4.6% |
| Engineering | 0 | 0.0% |
| Multidisciplinary Studies | 0 | 0.0% |
| Science & Technology | 4 | 6.1% |
| Business | 14 | 21.5% |
| Education | 4 | 6.1% |
| Literature & Languages | 9 | 13.9% |
| Liberal Arts & History | 0 | 0.0% |
| Visual & Performing Arts | 0 | 0.0% |
| Communications | 0 | 0.0% |
| Arts & Humanities | 0 | 0.0% |
| Total | 65 | 100.0% |
Transportation & Commute in Central City
Vehicle Availability by Sex in Central City
The most prevalent vehicle ownership categories in Central City are males with 2 vehicles (58, accounting for 32.8%) and females with 2 vehicles (69, making up 18.8%).
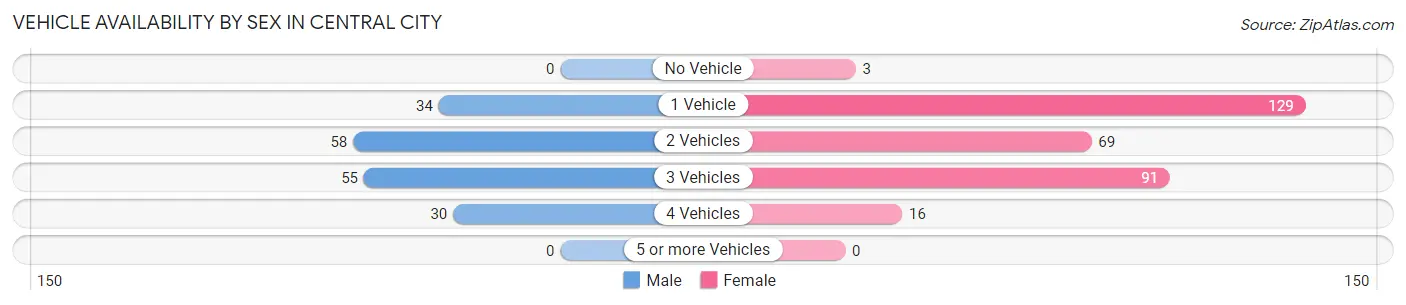
| Vehicles Available | Male | Female |
| No Vehicle | 0 (0.0%) | 3 (1.0%) |
| 1 Vehicle | 34 (19.2%) | 129 (41.9%) |
| 2 Vehicles | 58 (32.8%) | 69 (22.4%) |
| 3 Vehicles | 55 (31.1%) | 91 (29.5%) |
| 4 Vehicles | 30 (17.0%) | 16 (5.2%) |
| 5 or more Vehicles | 0 (0.0%) | 0 (0.0%) |
| Total | 177 (100.0%) | 308 (100.0%) |
Commute Time in Central City
The most frequently occuring commute durations in Central City are 5 to 9 minutes (159 commuters, 33.3%), 10 to 14 minutes (117 commuters, 24.5%), and 25 to 29 minutes (42 commuters, 8.8%).
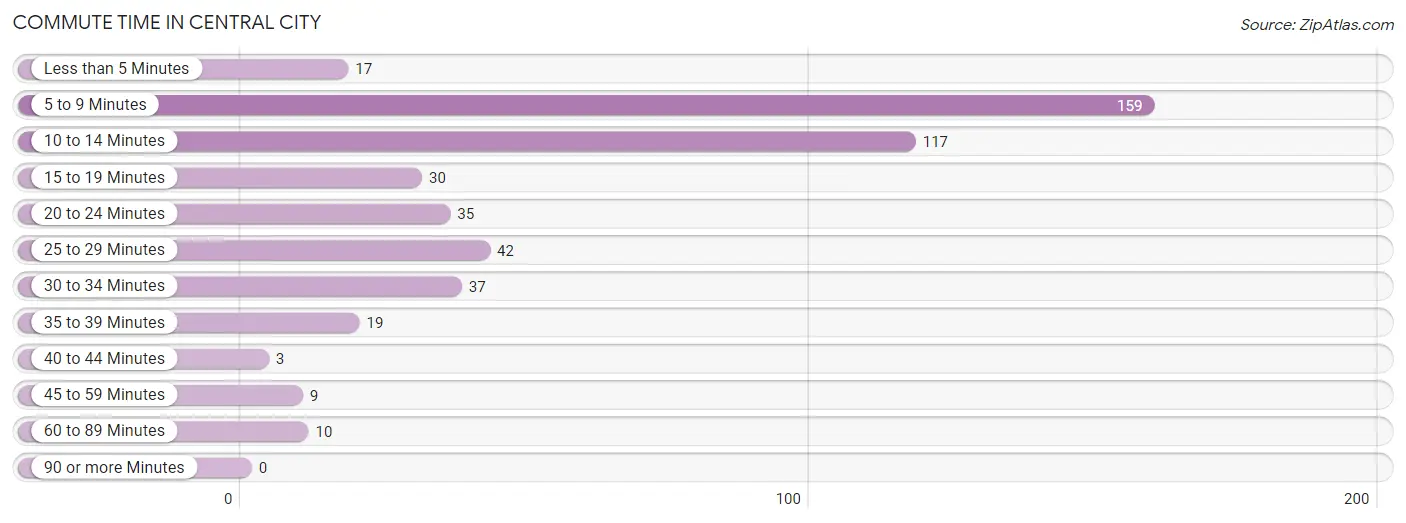
| Commute Time | # Commuters | % Commuters |
| Less than 5 Minutes | 17 | 3.6% |
| 5 to 9 Minutes | 159 | 33.3% |
| 10 to 14 Minutes | 117 | 24.5% |
| 15 to 19 Minutes | 30 | 6.3% |
| 20 to 24 Minutes | 35 | 7.3% |
| 25 to 29 Minutes | 42 | 8.8% |
| 30 to 34 Minutes | 37 | 7.7% |
| 35 to 39 Minutes | 19 | 4.0% |
| 40 to 44 Minutes | 3 | 0.6% |
| 45 to 59 Minutes | 9 | 1.9% |
| 60 to 89 Minutes | 10 | 2.1% |
| 90 or more Minutes | 0 | 0.0% |
Commute Time by Sex in Central City
The most common commute times in Central City are 10 to 14 minutes (58 commuters, 33.1%) for males and 5 to 9 minutes (123 commuters, 40.6%) for females.
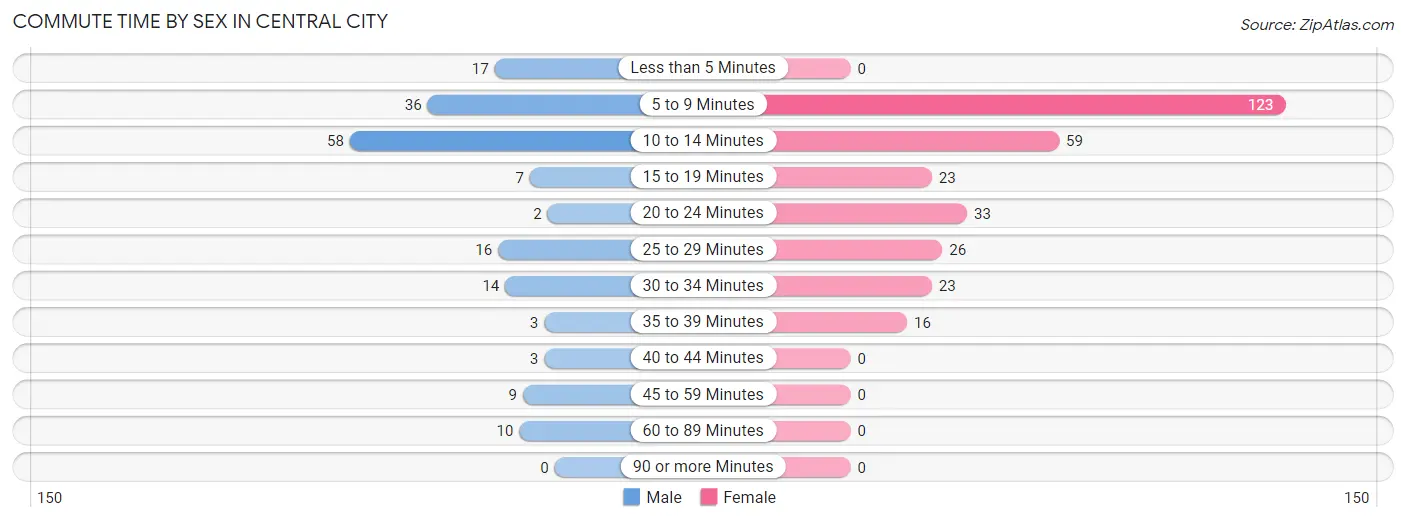
| Commute Time | Male | Female |
| Less than 5 Minutes | 17 (9.7%) | 0 (0.0%) |
| 5 to 9 Minutes | 36 (20.6%) | 123 (40.6%) |
| 10 to 14 Minutes | 58 (33.1%) | 59 (19.5%) |
| 15 to 19 Minutes | 7 (4.0%) | 23 (7.6%) |
| 20 to 24 Minutes | 2 (1.1%) | 33 (10.9%) |
| 25 to 29 Minutes | 16 (9.1%) | 26 (8.6%) |
| 30 to 34 Minutes | 14 (8.0%) | 23 (7.6%) |
| 35 to 39 Minutes | 3 (1.7%) | 16 (5.3%) |
| 40 to 44 Minutes | 3 (1.7%) | 0 (0.0%) |
| 45 to 59 Minutes | 9 (5.1%) | 0 (0.0%) |
| 60 to 89 Minutes | 10 (5.7%) | 0 (0.0%) |
| 90 or more Minutes | 0 (0.0%) | 0 (0.0%) |
Time of Departure to Work by Sex in Central City
The most frequent times of departure to work in Central City are 12:00 AM to 4:59 AM (31, 17.7%) for males and 7:30 AM to 7:59 AM (94, 31.0%) for females.
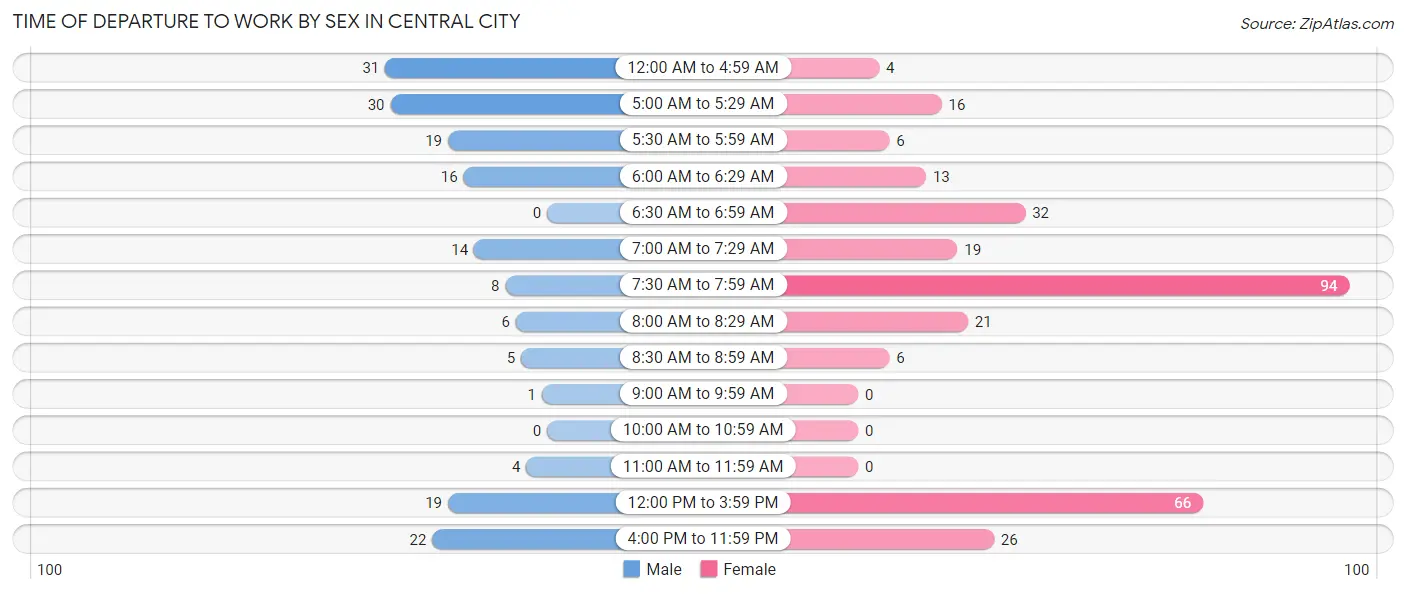
| Time of Departure | Male | Female |
| 12:00 AM to 4:59 AM | 31 (17.7%) | 4 (1.3%) |
| 5:00 AM to 5:29 AM | 30 (17.1%) | 16 (5.3%) |
| 5:30 AM to 5:59 AM | 19 (10.9%) | 6 (2.0%) |
| 6:00 AM to 6:29 AM | 16 (9.1%) | 13 (4.3%) |
| 6:30 AM to 6:59 AM | 0 (0.0%) | 32 (10.6%) |
| 7:00 AM to 7:29 AM | 14 (8.0%) | 19 (6.3%) |
| 7:30 AM to 7:59 AM | 8 (4.6%) | 94 (31.0%) |
| 8:00 AM to 8:29 AM | 6 (3.4%) | 21 (6.9%) |
| 8:30 AM to 8:59 AM | 5 (2.9%) | 6 (2.0%) |
| 9:00 AM to 9:59 AM | 1 (0.6%) | 0 (0.0%) |
| 10:00 AM to 10:59 AM | 0 (0.0%) | 0 (0.0%) |
| 11:00 AM to 11:59 AM | 4 (2.3%) | 0 (0.0%) |
| 12:00 PM to 3:59 PM | 19 (10.9%) | 66 (21.8%) |
| 4:00 PM to 11:59 PM | 22 (12.6%) | 26 (8.6%) |
| Total | 175 (100.0%) | 303 (100.0%) |
Housing Occupancy in Central City
Occupancy by Ownership in Central City
Of the total 475 dwellings in Central City, owner-occupied units account for 319 (67.2%), while renter-occupied units make up 156 (32.8%).
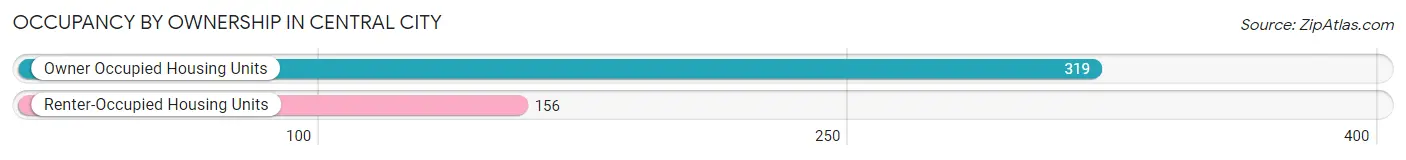
| Occupancy | # Housing Units | % Housing Units |
| Owner Occupied Housing Units | 319 | 67.2% |
| Renter-Occupied Housing Units | 156 | 32.8% |
| Total Occupied Housing Units | 475 | 100.0% |
Occupancy by Household Size in Central City
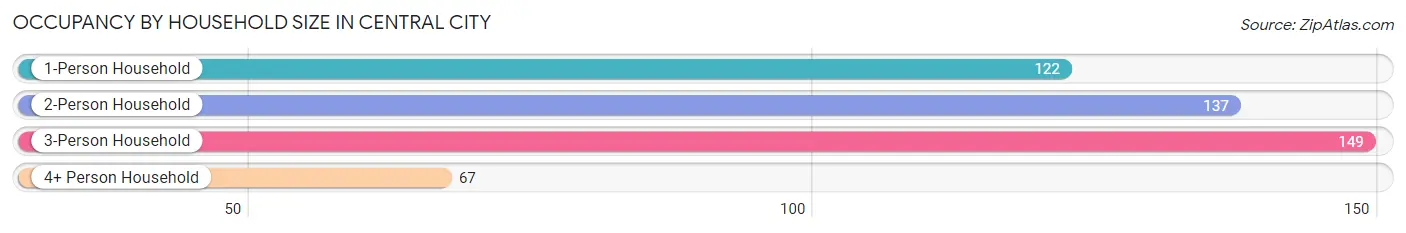
| Household Size | # Housing Units | % Housing Units |
| 1-Person Household | 122 | 25.7% |
| 2-Person Household | 137 | 28.8% |
| 3-Person Household | 149 | 31.4% |
| 4+ Person Household | 67 | 14.1% |
| Total Housing Units | 475 | 100.0% |
Occupancy by Ownership by Household Size in Central City
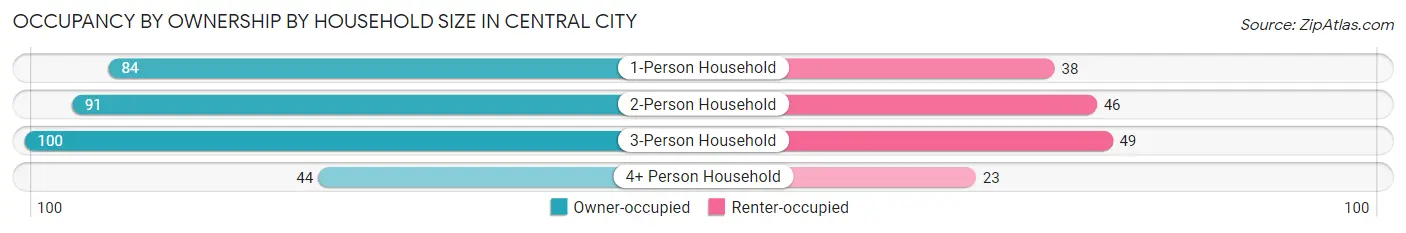
| Household Size | Owner-occupied | Renter-occupied |
| 1-Person Household | 84 (68.9%) | 38 (31.1%) |
| 2-Person Household | 91 (66.4%) | 46 (33.6%) |
| 3-Person Household | 100 (67.1%) | 49 (32.9%) |
| 4+ Person Household | 44 (65.7%) | 23 (34.3%) |
| Total Housing Units | 319 (67.2%) | 156 (32.8%) |
Occupancy by Educational Attainment in Central City
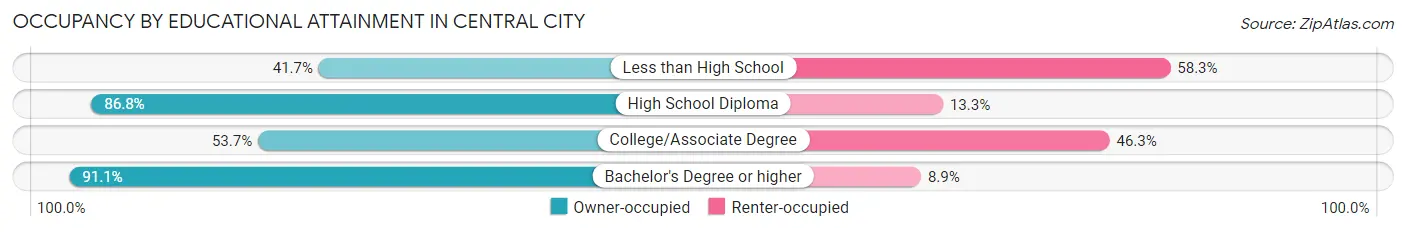
| Household Size | Owner-occupied | Renter-occupied |
| Less than High School | 10 (41.7%) | 14 (58.3%) |
| High School Diploma | 131 (86.8%) | 20 (13.3%) |
| College/Associate Degree | 137 (53.7%) | 118 (46.3%) |
| Bachelor's Degree or higher | 41 (91.1%) | 4 (8.9%) |
Occupancy by Age of Householder in Central City
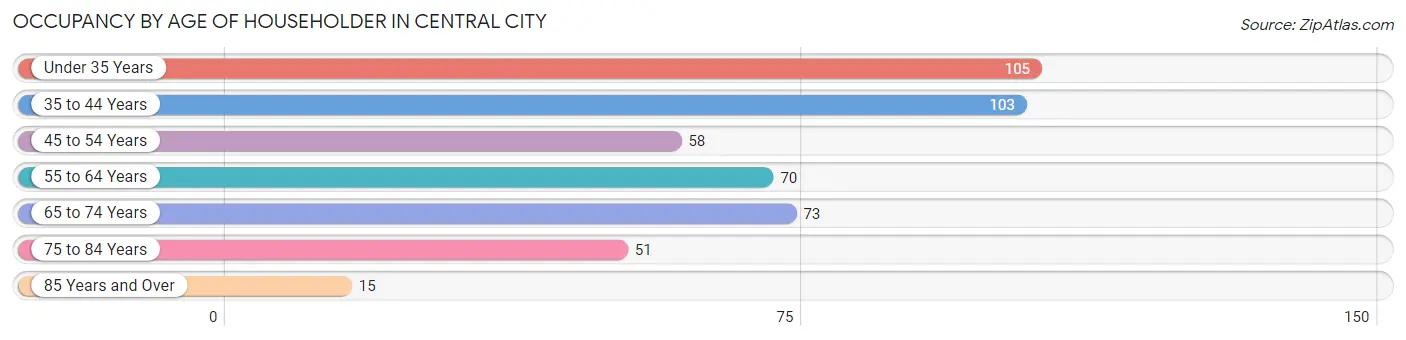
| Age Bracket | # Households | % Households |
| Under 35 Years | 105 | 22.1% |
| 35 to 44 Years | 103 | 21.7% |
| 45 to 54 Years | 58 | 12.2% |
| 55 to 64 Years | 70 | 14.7% |
| 65 to 74 Years | 73 | 15.4% |
| 75 to 84 Years | 51 | 10.7% |
| 85 Years and Over | 15 | 3.2% |
| Total | 475 | 100.0% |
Housing Finances in Central City
Median Income by Occupancy in Central City
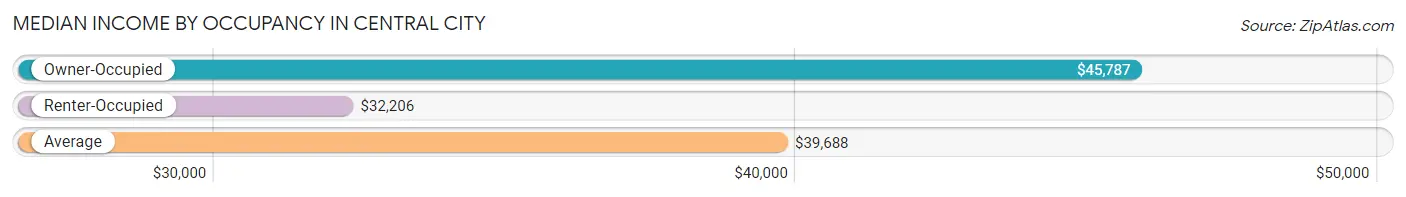
| Occupancy Type | # Households | Median Income |
| Owner-Occupied | 319 (67.2%) | $45,787 |
| Renter-Occupied | 156 (32.8%) | $32,206 |
| Average | 475 (100.0%) | $39,688 |
Occupancy by Householder Income Bracket in Central City
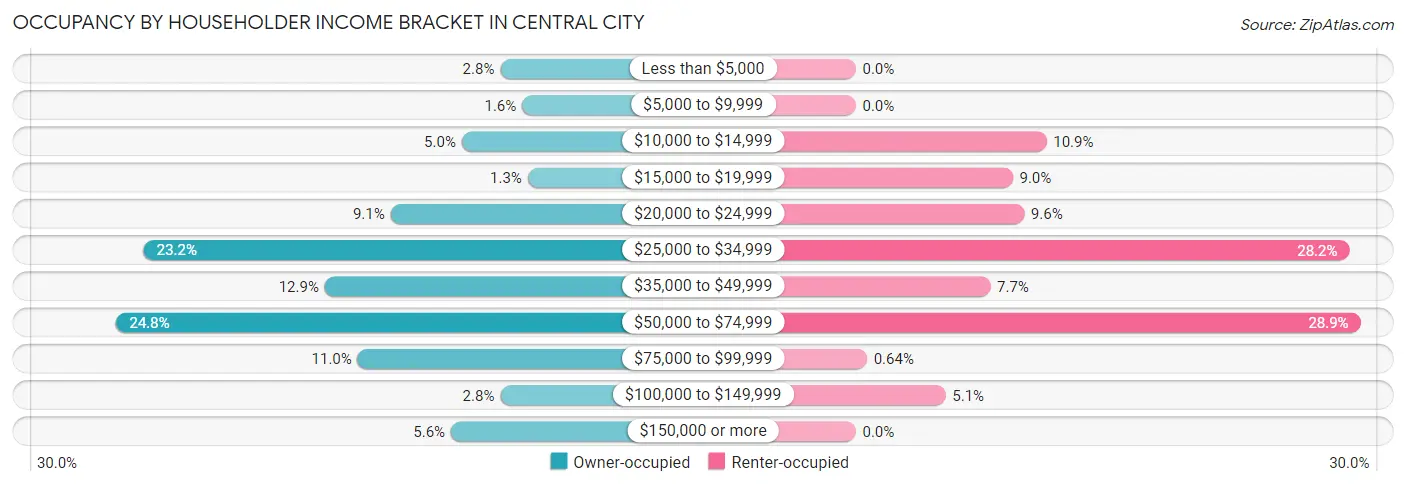
| Income Bracket | Owner-occupied | Renter-occupied |
| Less than $5,000 | 9 (2.8%) | 0 (0.0%) |
| $5,000 to $9,999 | 5 (1.6%) | 0 (0.0%) |
| $10,000 to $14,999 | 16 (5.0%) | 17 (10.9%) |
| $15,000 to $19,999 | 4 (1.3%) | 14 (9.0%) |
| $20,000 to $24,999 | 29 (9.1%) | 15 (9.6%) |
| $25,000 to $34,999 | 74 (23.2%) | 44 (28.2%) |
| $35,000 to $49,999 | 41 (12.9%) | 12 (7.7%) |
| $50,000 to $74,999 | 79 (24.8%) | 45 (28.8%) |
| $75,000 to $99,999 | 35 (11.0%) | 1 (0.6%) |
| $100,000 to $149,999 | 9 (2.8%) | 8 (5.1%) |
| $150,000 or more | 18 (5.6%) | 0 (0.0%) |
| Total | 319 (100.0%) | 156 (100.0%) |
Monthly Housing Cost Tiers in Central City
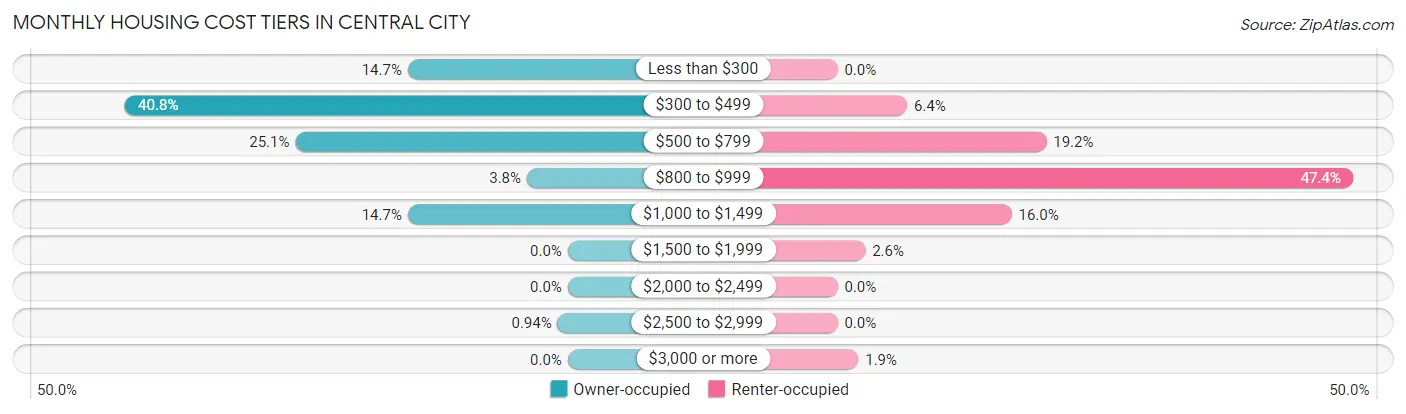
| Monthly Cost | Owner-occupied | Renter-occupied |
| Less than $300 | 47 (14.7%) | 0 (0.0%) |
| $300 to $499 | 130 (40.7%) | 10 (6.4%) |
| $500 to $799 | 80 (25.1%) | 30 (19.2%) |
| $800 to $999 | 12 (3.8%) | 74 (47.4%) |
| $1,000 to $1,499 | 47 (14.7%) | 25 (16.0%) |
| $1,500 to $1,999 | 0 (0.0%) | 4 (2.6%) |
| $2,000 to $2,499 | 0 (0.0%) | 0 (0.0%) |
| $2,500 to $2,999 | 3 (0.9%) | 0 (0.0%) |
| $3,000 or more | 0 (0.0%) | 3 (1.9%) |
| Total | 319 (100.0%) | 156 (100.0%) |
Physical Housing Characteristics in Central City
Housing Structures in Central City
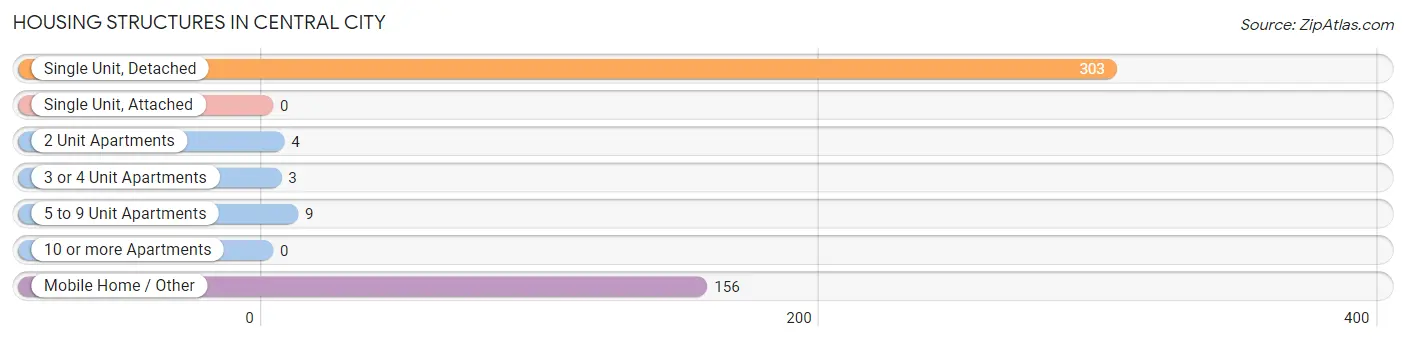
| Structure Type | # Housing Units | % Housing Units |
| Single Unit, Detached | 303 | 63.8% |
| Single Unit, Attached | 0 | 0.0% |
| 2 Unit Apartments | 4 | 0.8% |
| 3 or 4 Unit Apartments | 3 | 0.6% |
| 5 to 9 Unit Apartments | 9 | 1.9% |
| 10 or more Apartments | 0 | 0.0% |
| Mobile Home / Other | 156 | 32.8% |
| Total | 475 | 100.0% |
Housing Structures by Occupancy in Central City
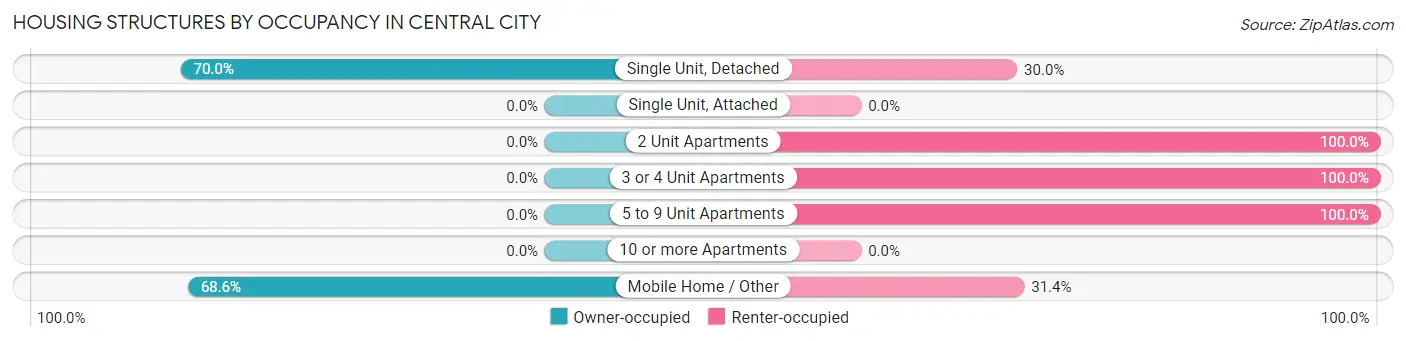
| Structure Type | Owner-occupied | Renter-occupied |
| Single Unit, Detached | 212 (70.0%) | 91 (30.0%) |
| Single Unit, Attached | 0 (0.0%) | 0 (0.0%) |
| 2 Unit Apartments | 0 (0.0%) | 4 (100.0%) |
| 3 or 4 Unit Apartments | 0 (0.0%) | 3 (100.0%) |
| 5 to 9 Unit Apartments | 0 (0.0%) | 9 (100.0%) |
| 10 or more Apartments | 0 (0.0%) | 0 (0.0%) |
| Mobile Home / Other | 107 (68.6%) | 49 (31.4%) |
| Total | 319 (67.2%) | 156 (32.8%) |
Housing Structures by Number of Rooms in Central City
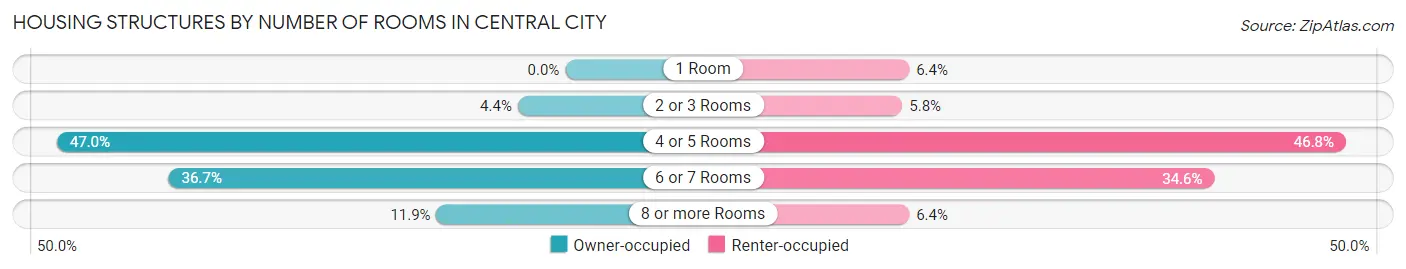
| Number of Rooms | Owner-occupied | Renter-occupied |
| 1 Room | 0 (0.0%) | 10 (6.4%) |
| 2 or 3 Rooms | 14 (4.4%) | 9 (5.8%) |
| 4 or 5 Rooms | 150 (47.0%) | 73 (46.8%) |
| 6 or 7 Rooms | 117 (36.7%) | 54 (34.6%) |
| 8 or more Rooms | 38 (11.9%) | 10 (6.4%) |
| Total | 319 (100.0%) | 156 (100.0%) |
Housing Structure by Heating Type in Central City
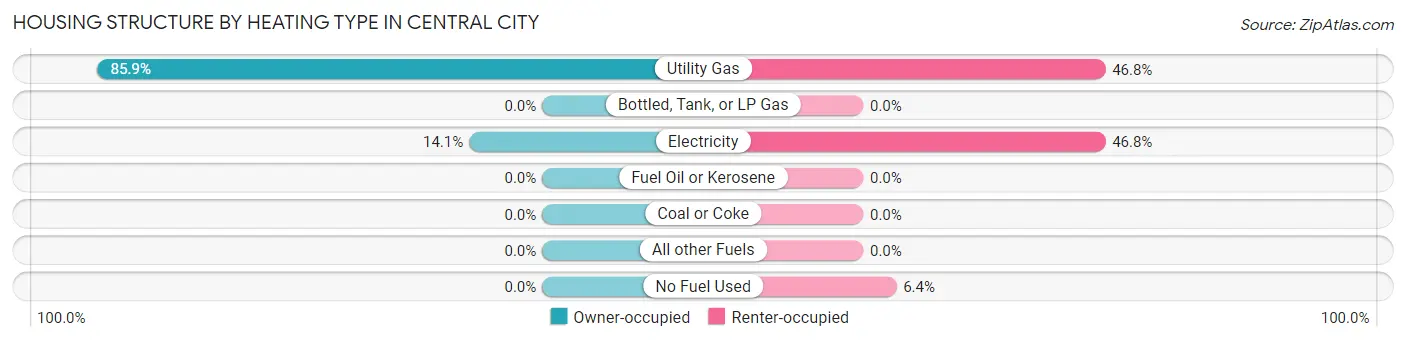
| Heating Type | Owner-occupied | Renter-occupied |
| Utility Gas | 274 (85.9%) | 73 (46.8%) |
| Bottled, Tank, or LP Gas | 0 (0.0%) | 0 (0.0%) |
| Electricity | 45 (14.1%) | 73 (46.8%) |
| Fuel Oil or Kerosene | 0 (0.0%) | 0 (0.0%) |
| Coal or Coke | 0 (0.0%) | 0 (0.0%) |
| All other Fuels | 0 (0.0%) | 0 (0.0%) |
| No Fuel Used | 0 (0.0%) | 10 (6.4%) |
| Total | 319 (100.0%) | 156 (100.0%) |
Household Vehicle Usage in Central City
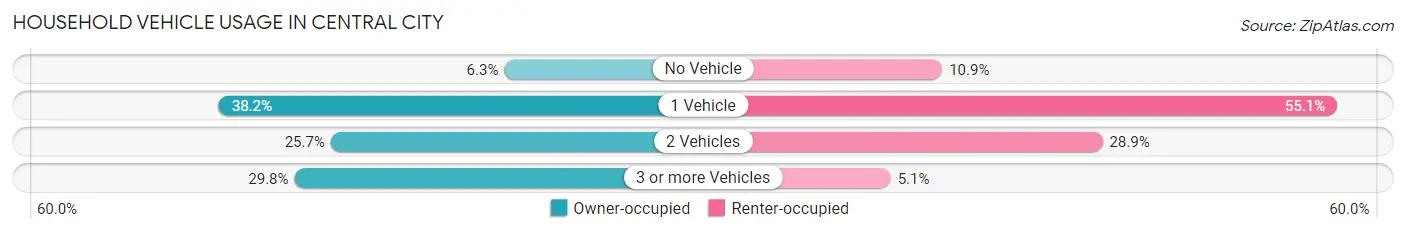
| Vehicles per Household | Owner-occupied | Renter-occupied |
| No Vehicle | 20 (6.3%) | 17 (10.9%) |
| 1 Vehicle | 122 (38.2%) | 86 (55.1%) |
| 2 Vehicles | 82 (25.7%) | 45 (28.8%) |
| 3 or more Vehicles | 95 (29.8%) | 8 (5.1%) |
| Total | 319 (100.0%) | 156 (100.0%) |
Real Estate & Mortgages in Central City
Real Estate and Mortgage Overview in Central City
| Characteristic | Without Mortgage | With Mortgage |
| Housing Units | 201 | 118 |
| Median Property Value | $24,000 | $95,000 |
| Median Household Income | $33,173 | $15 |
| Monthly Housing Costs | $337 | $0 |
| Real Estate Taxes | $432 | $9 |
Property Value by Mortgage Status in Central City
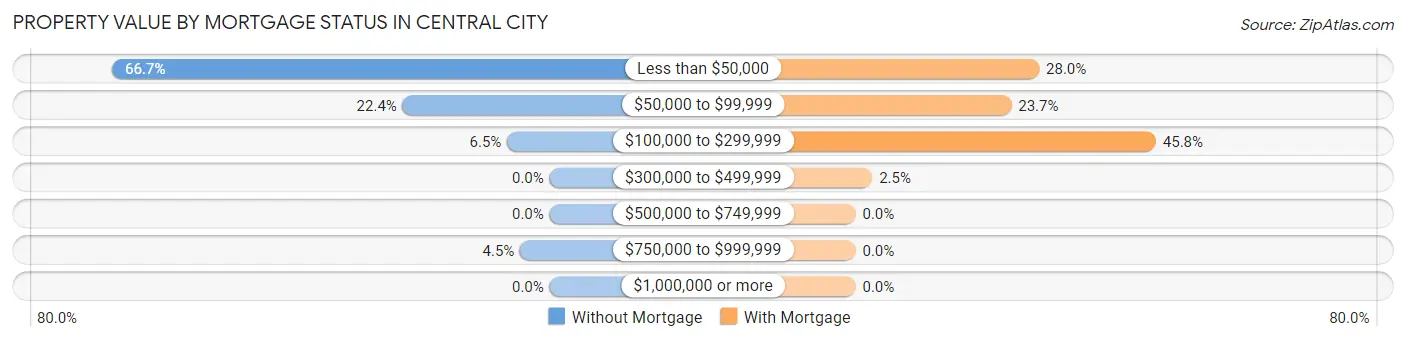
| Property Value | Without Mortgage | With Mortgage |
| Less than $50,000 | 134 (66.7%) | 33 (28.0%) |
| $50,000 to $99,999 | 45 (22.4%) | 28 (23.7%) |
| $100,000 to $299,999 | 13 (6.5%) | 54 (45.8%) |
| $300,000 to $499,999 | 0 (0.0%) | 3 (2.5%) |
| $500,000 to $749,999 | 0 (0.0%) | 0 (0.0%) |
| $750,000 to $999,999 | 9 (4.5%) | 0 (0.0%) |
| $1,000,000 or more | 0 (0.0%) | 0 (0.0%) |
| Total | 201 (100.0%) | 118 (100.0%) |
Household Income by Mortgage Status in Central City
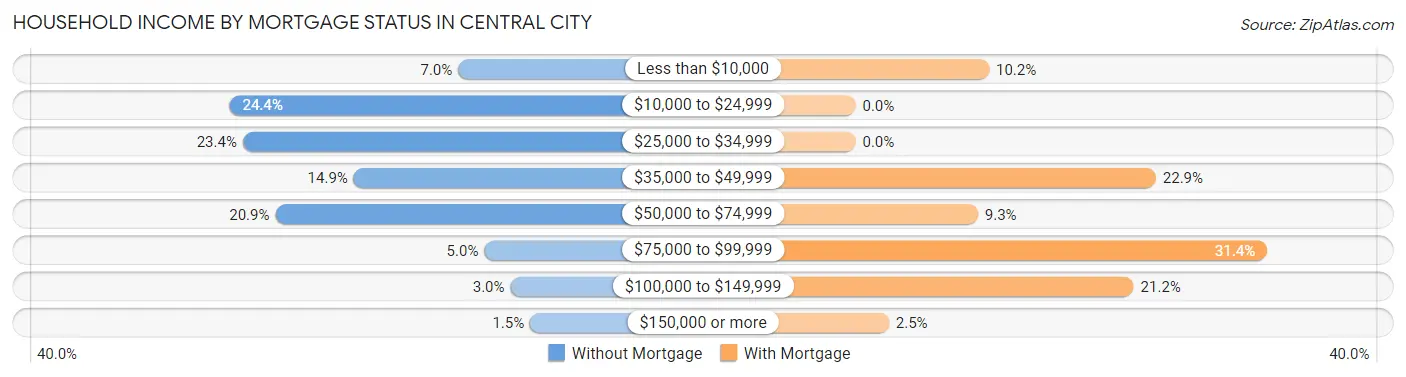
| Household Income | Without Mortgage | With Mortgage |
| Less than $10,000 | 14 (7.0%) | 12 (10.2%) |
| $10,000 to $24,999 | 49 (24.4%) | 0 (0.0%) |
| $25,000 to $34,999 | 47 (23.4%) | 0 (0.0%) |
| $35,000 to $49,999 | 30 (14.9%) | 27 (22.9%) |
| $50,000 to $74,999 | 42 (20.9%) | 11 (9.3%) |
| $75,000 to $99,999 | 10 (5.0%) | 37 (31.4%) |
| $100,000 to $149,999 | 6 (3.0%) | 25 (21.2%) |
| $150,000 or more | 3 (1.5%) | 3 (2.5%) |
| Total | 201 (100.0%) | 118 (100.0%) |
Property Value to Household Income Ratio in Central City
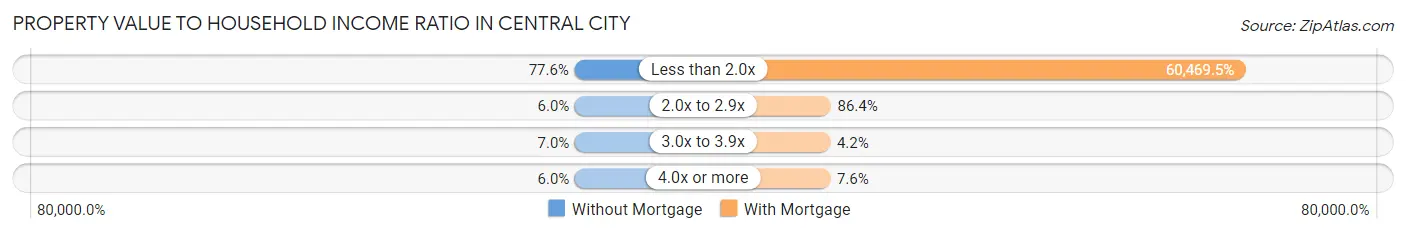
| Value-to-Income Ratio | Without Mortgage | With Mortgage |
| Less than 2.0x | 156 (77.6%) | 71,354 (60,469.5%) |
| 2.0x to 2.9x | 12 (6.0%) | 102 (86.4%) |
| 3.0x to 3.9x | 14 (7.0%) | 5 (4.2%) |
| 4.0x or more | 12 (6.0%) | 9 (7.6%) |
| Total | 201 (100.0%) | 118 (100.0%) |
Real Estate Taxes by Mortgage Status in Central City
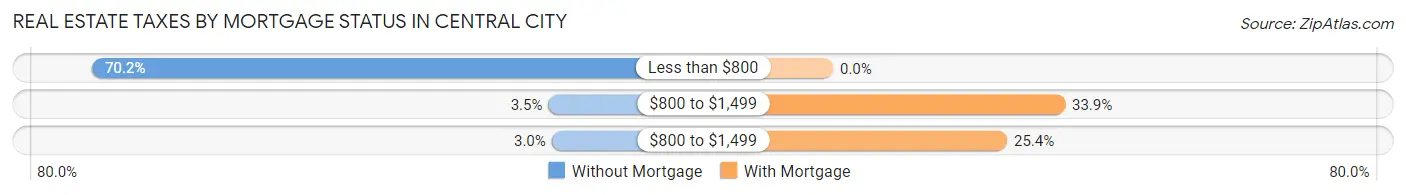
| Property Taxes | Without Mortgage | With Mortgage |
| Less than $800 | 141 (70.2%) | 0 (0.0%) |
| $800 to $1,499 | 7 (3.5%) | 40 (33.9%) |
| $800 to $1,499 | 6 (3.0%) | 30 (25.4%) |
| Total | 201 (100.0%) | 118 (100.0%) |
Health & Disability in Central City
Health Insurance Coverage by Age in Central City
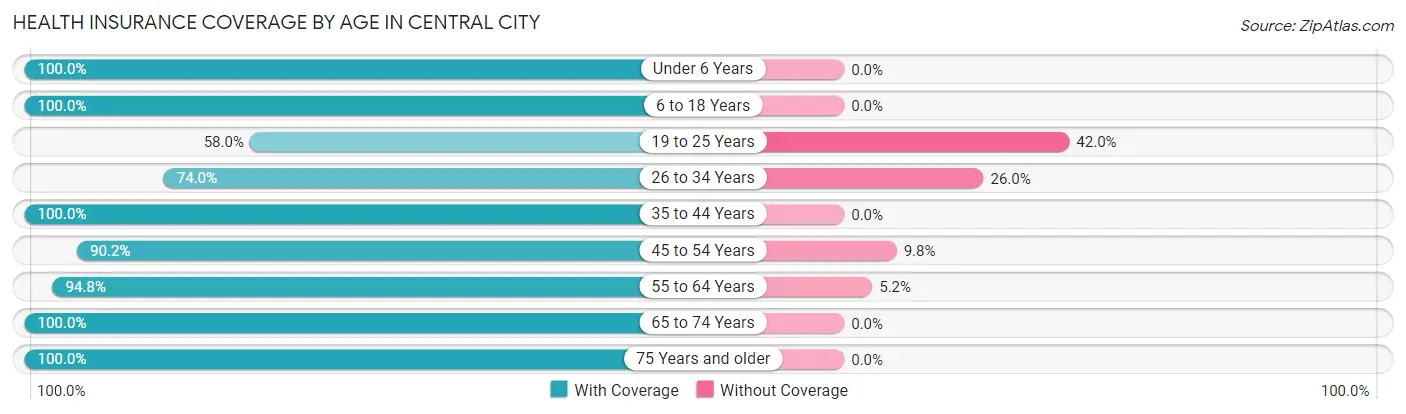
| Age Bracket | With Coverage | Without Coverage |
| Under 6 Years | 94 (100.0%) | 0 (0.0%) |
| 6 to 18 Years | 214 (100.0%) | 0 (0.0%) |
| 19 to 25 Years | 47 (58.0%) | 34 (42.0%) |
| 26 to 34 Years | 134 (74.0%) | 47 (26.0%) |
| 35 to 44 Years | 187 (100.0%) | 0 (0.0%) |
| 45 to 54 Years | 83 (90.2%) | 9 (9.8%) |
| 55 to 64 Years | 127 (94.8%) | 7 (5.2%) |
| 65 to 74 Years | 87 (100.0%) | 0 (0.0%) |
| 75 Years and older | 84 (100.0%) | 0 (0.0%) |
| Total | 1,057 (91.6%) | 97 (8.4%) |
Health Insurance Coverage by Citizenship Status in Central City
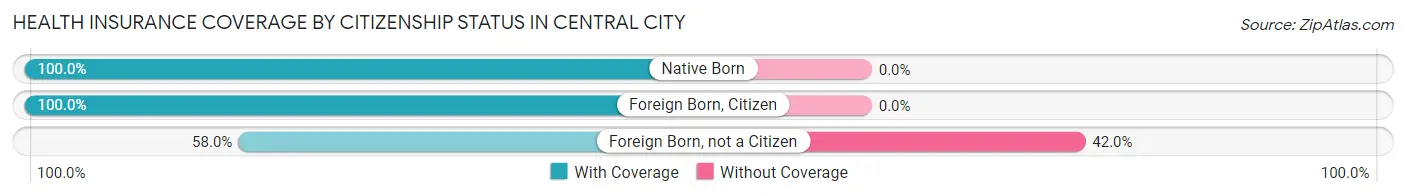
| Citizenship Status | With Coverage | Without Coverage |
| Native Born | 94 (100.0%) | 0 (0.0%) |
| Foreign Born, Citizen | 214 (100.0%) | 0 (0.0%) |
| Foreign Born, not a Citizen | 47 (58.0%) | 34 (42.0%) |
Health Insurance Coverage by Household Income in Central City
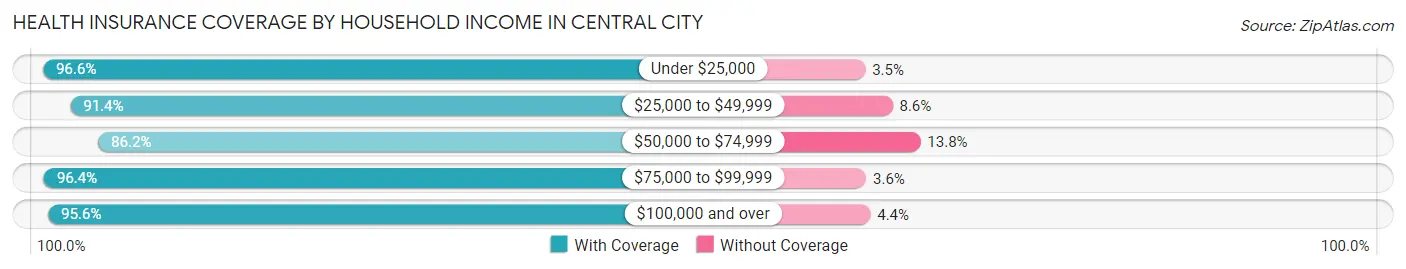
| Household Income | With Coverage | Without Coverage |
| Under $25,000 | 196 (96.6%) | 7 (3.5%) |
| $25,000 to $49,999 | 416 (91.4%) | 39 (8.6%) |
| $50,000 to $74,999 | 275 (86.2%) | 44 (13.8%) |
| $75,000 to $99,999 | 80 (96.4%) | 3 (3.6%) |
| $100,000 and over | 87 (95.6%) | 4 (4.4%) |
Public vs Private Health Insurance Coverage by Age in Central City
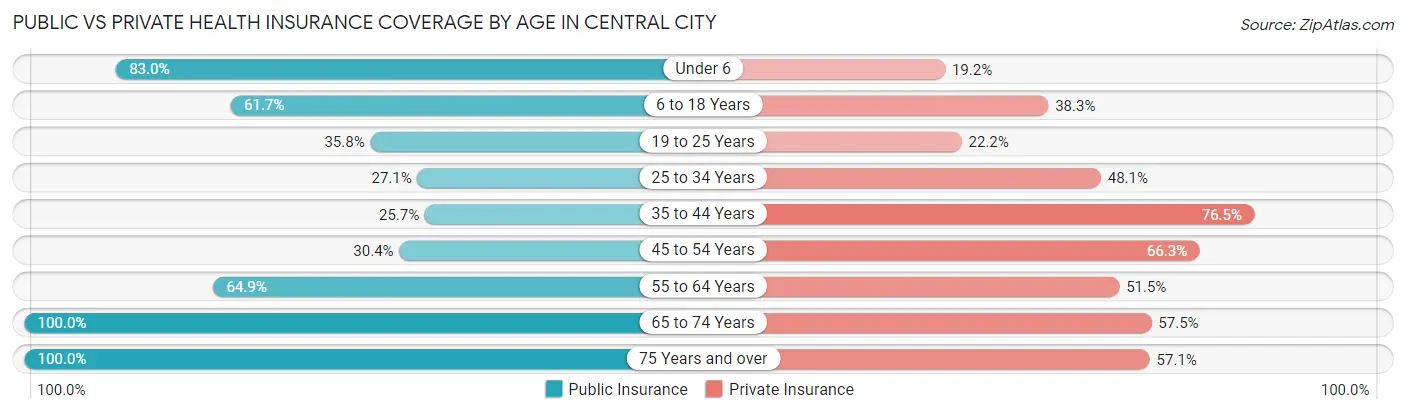
| Age Bracket | Public Insurance | Private Insurance |
| Under 6 | 78 (83.0%) | 18 (19.2%) |
| 6 to 18 Years | 132 (61.7%) | 82 (38.3%) |
| 19 to 25 Years | 29 (35.8%) | 18 (22.2%) |
| 25 to 34 Years | 49 (27.1%) | 87 (48.1%) |
| 35 to 44 Years | 48 (25.7%) | 143 (76.5%) |
| 45 to 54 Years | 28 (30.4%) | 61 (66.3%) |
| 55 to 64 Years | 87 (64.9%) | 69 (51.5%) |
| 65 to 74 Years | 87 (100.0%) | 50 (57.5%) |
| 75 Years and over | 84 (100.0%) | 48 (57.1%) |
| Total | 622 (53.9%) | 576 (49.9%) |
Disability Status by Sex by Age in Central City
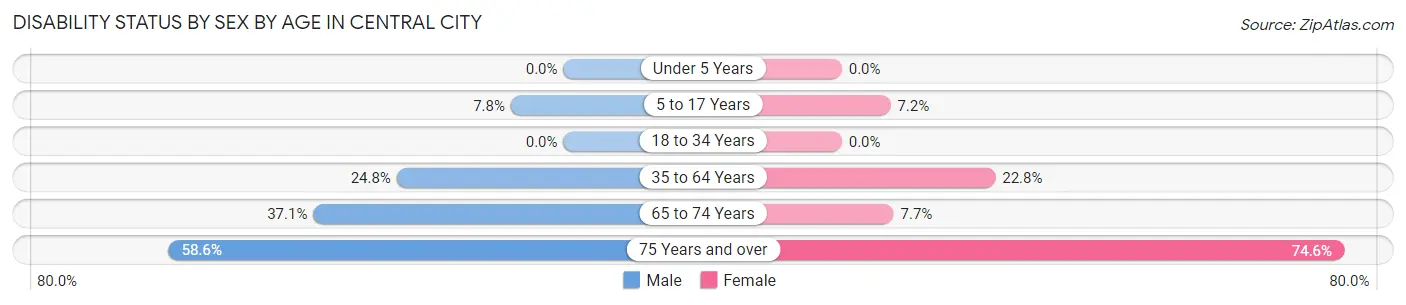
| Age Bracket | Male | Female |
| Under 5 Years | 0 (0.0%) | 0 (0.0%) |
| 5 to 17 Years | 11 (7.8%) | 6 (7.2%) |
| 18 to 34 Years | 0 (0.0%) | 0 (0.0%) |
| 35 to 64 Years | 49 (24.7%) | 49 (22.8%) |
| 65 to 74 Years | 13 (37.1%) | 4 (7.7%) |
| 75 Years and over | 17 (58.6%) | 41 (74.6%) |
Disability Class by Sex by Age in Central City
Disability Class: Hearing Difficulty
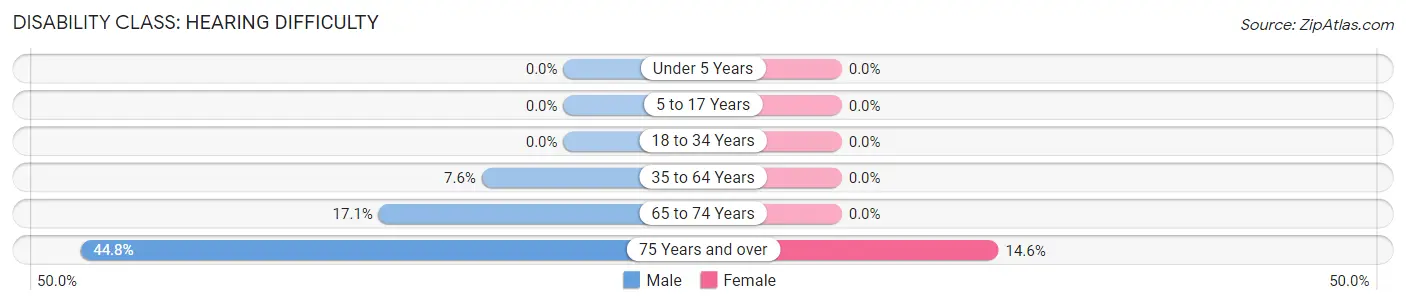
| Age Bracket | Male | Female |
| Under 5 Years | 0 (0.0%) | 0 (0.0%) |
| 5 to 17 Years | 0 (0.0%) | 0 (0.0%) |
| 18 to 34 Years | 0 (0.0%) | 0 (0.0%) |
| 35 to 64 Years | 15 (7.6%) | 0 (0.0%) |
| 65 to 74 Years | 6 (17.1%) | 0 (0.0%) |
| 75 Years and over | 13 (44.8%) | 8 (14.5%) |
Disability Class: Vision Difficulty
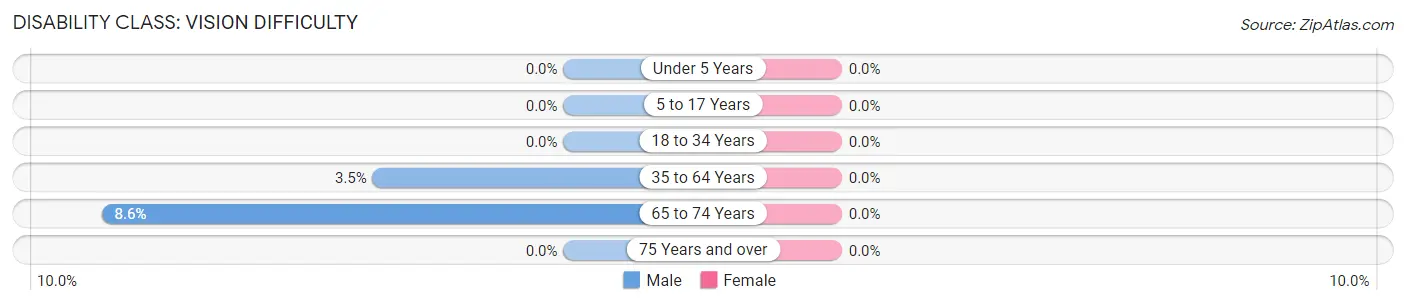
| Age Bracket | Male | Female |
| Under 5 Years | 0 (0.0%) | 0 (0.0%) |
| 5 to 17 Years | 0 (0.0%) | 0 (0.0%) |
| 18 to 34 Years | 0 (0.0%) | 0 (0.0%) |
| 35 to 64 Years | 7 (3.5%) | 0 (0.0%) |
| 65 to 74 Years | 3 (8.6%) | 0 (0.0%) |
| 75 Years and over | 0 (0.0%) | 0 (0.0%) |
Disability Class: Cognitive Difficulty
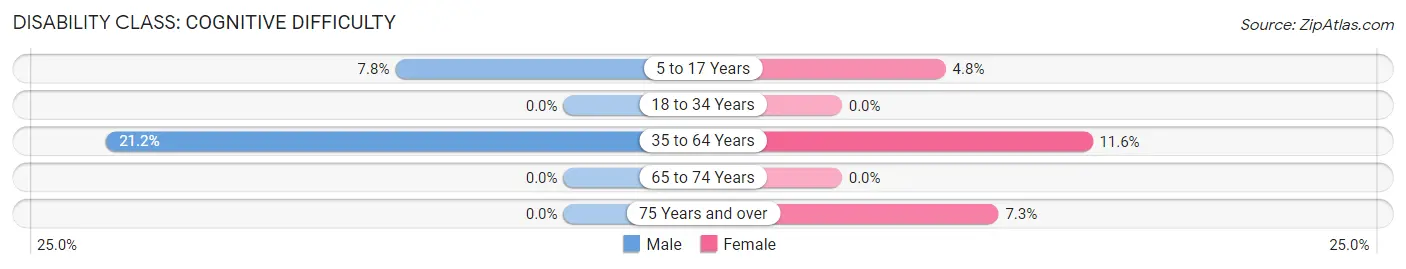
| Age Bracket | Male | Female |
| 5 to 17 Years | 11 (7.8%) | 4 (4.8%) |
| 18 to 34 Years | 0 (0.0%) | 0 (0.0%) |
| 35 to 64 Years | 42 (21.2%) | 25 (11.6%) |
| 65 to 74 Years | 0 (0.0%) | 0 (0.0%) |
| 75 Years and over | 0 (0.0%) | 4 (7.3%) |
Disability Class: Ambulatory Difficulty
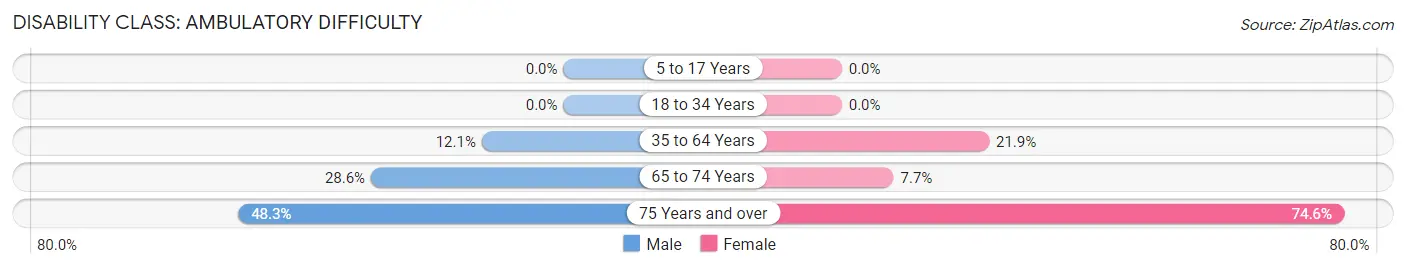
| Age Bracket | Male | Female |
| 5 to 17 Years | 0 (0.0%) | 0 (0.0%) |
| 18 to 34 Years | 0 (0.0%) | 0 (0.0%) |
| 35 to 64 Years | 24 (12.1%) | 47 (21.9%) |
| 65 to 74 Years | 10 (28.6%) | 4 (7.7%) |
| 75 Years and over | 14 (48.3%) | 41 (74.6%) |
Disability Class: Self-Care Difficulty
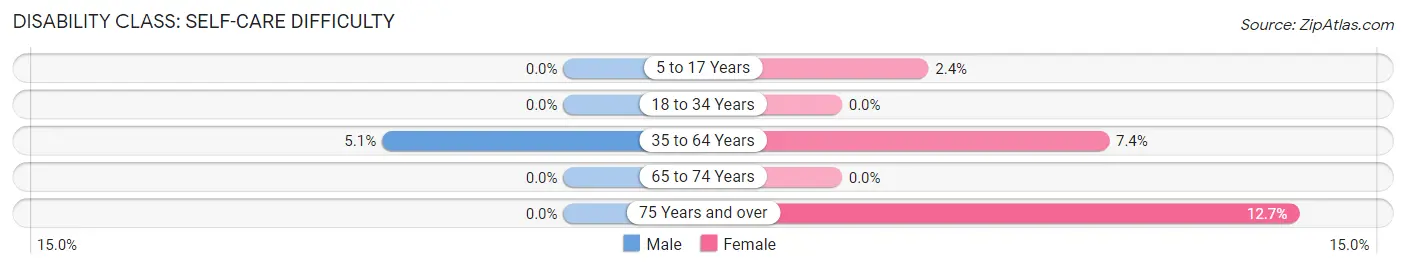
| Age Bracket | Male | Female |
| 5 to 17 Years | 0 (0.0%) | 2 (2.4%) |
| 18 to 34 Years | 0 (0.0%) | 0 (0.0%) |
| 35 to 64 Years | 10 (5.1%) | 16 (7.4%) |
| 65 to 74 Years | 0 (0.0%) | 0 (0.0%) |
| 75 Years and over | 0 (0.0%) | 7 (12.7%) |
Technology Access in Central City
Computing Device Access in Central City
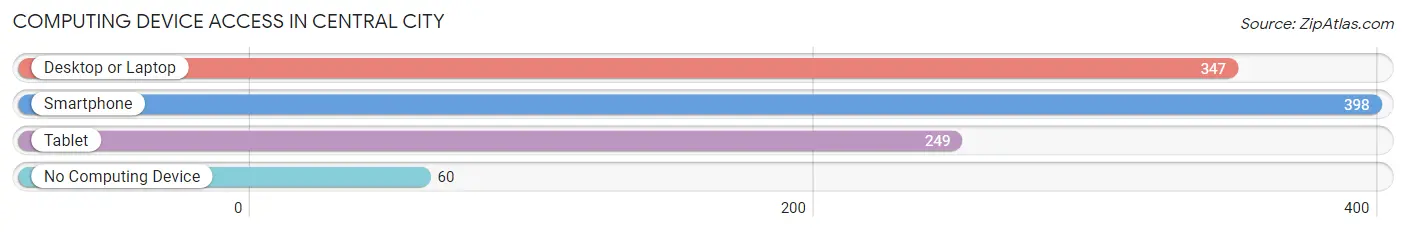
| Device Type | # Households | % Households |
| Desktop or Laptop | 347 | 73.1% |
| Smartphone | 398 | 83.8% |
| Tablet | 249 | 52.4% |
| No Computing Device | 60 | 12.6% |
| Total | 475 | 100.0% |
Internet Access in Central City
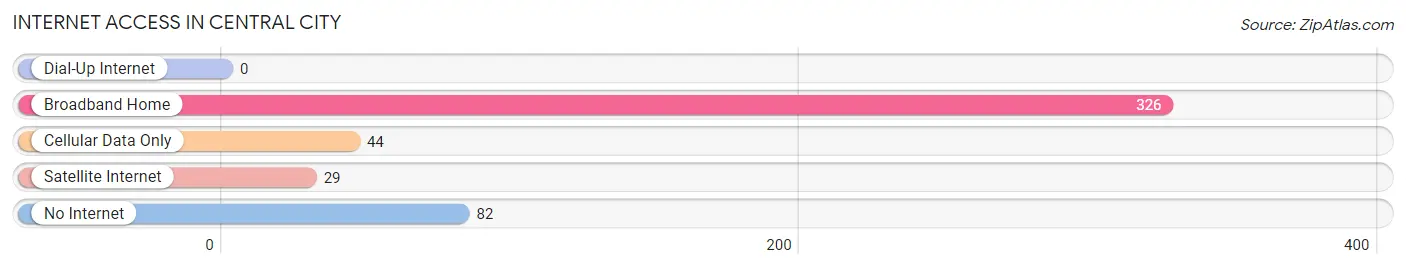
| Internet Type | # Households | % Households |
| Dial-Up Internet | 0 | 0.0% |
| Broadband Home | 326 | 68.6% |
| Cellular Data Only | 44 | 9.3% |
| Satellite Internet | 29 | 6.1% |
| No Internet | 82 | 17.3% |
| Total | 475 | 100.0% |
Central City Summary
Introduction
Central City is a small city located in the state of Illinois. It is located in the southwestern part of the state, about 40 miles from St. Louis, Missouri. The city has a population of approximately 4,000 people and is the county seat of Marion County. Central City is a small, rural community with a rich history and a vibrant economy.
History
Central City was founded in 1819 by a group of settlers from Kentucky. The city was originally known as “Marion” and was named after the Revolutionary War hero, Francis Marion. The city was incorporated in 1837 and was renamed “Central City” in 1845.
The city was an important stop on the Underground Railroad, with many slaves escaping to freedom in the North. During the Civil War, Central City was a major supply center for the Union Army. After the war, the city experienced a period of growth and prosperity.
In the late 19th century, Central City was a major center for coal mining. The city was also home to several factories, including a glass factory, a brick factory, and a furniture factory.
Geography
Central City is located in the southwestern part of Illinois, about 40 miles from St. Louis, Missouri. The city is situated in the Central Illinois Basin, which is part of the larger Mississippi River Valley. The city is surrounded by rolling hills and farmland.
The climate in Central City is humid continental, with hot summers and cold winters. The average annual temperature is around 50 degrees Fahrenheit. The average annual precipitation is around 40 inches.
Economy
Central City’s economy is largely based on agriculture and manufacturing. The city is home to several factories, including a glass factory, a brick factory, and a furniture factory. The city is also home to several agricultural businesses, including a dairy farm, a grain elevator, and a feed mill.
The city is also home to several retail businesses, including a grocery store, a hardware store, and a clothing store. The city is also home to several restaurants, bars, and other entertainment venues.
Demographics
As of the 2010 census, the population of Central City was 4,000. The racial makeup of the city was 97.2% White, 0.7% African American, 0.3% Native American, 0.2% Asian, 0.1% Pacific Islander, and 1.5% from other races. The median household income was $37,000.
Conclusion
Central City is a small city located in the southwestern part of Illinois. The city has a rich history and a vibrant economy. The city is largely based on agriculture and manufacturing, and is home to several factories, agricultural businesses, and retail businesses. The population of Central City is 4,000, and the median household income is $37,000.
Common Questions
What is Per Capita Income in Central City?
Per Capita income in Central City is $22,089.
What is the Median Family Income in Central City?
Median Family Income in Central City is $45,729.
What is the Median Household income in Central City?
Median Household Income in Central City is $39,688.
What is Income or Wage Gap in Central City?
Income or Wage Gap in Central City is 46.3%.
Women in Central City earn 53.7 cents for every dollar earned by a man.
What is Family Income Deficit in Central City?
Family Income Deficit in Central City is $5,441.
Families that are below poverty line in Central City earn $5,441 less on average than the poverty threshold level.
What is Inequality or Gini Index in Central City?
Inequality or Gini Index in Central City is 0.42.
What is the Total Population of Central City?
Total Population of Central City is 1,154.
What is the Total Male Population of Central City?
Total Male Population of Central City is 541.
What is the Total Female Population of Central City?
Total Female Population of Central City is 613.
What is the Ratio of Males per 100 Females in Central City?
There are 88.25 Males per 100 Females in Central City.
What is the Ratio of Females per 100 Males in Central City?
There are 113.31 Females per 100 Males in Central City.
What is the Median Population Age in Central City?
Median Population Age in Central City is 38.1 Years.
What is the Average Family Size in Central City
Average Family Size in Central City is 2.8 People.
What is the Average Household Size in Central City
Average Household Size in Central City is 2.4 People.
How Large is the Labor Force in Central City?
There are 502 People in the Labor Forcein in Central City.
What is the Percentage of People in the Labor Force in Central City?
56.7% of People are in the Labor Force in Central City.
What is the Unemployment Rate in Central City?
Unemployment Rate in Central City is 3.2%.