Catlin, IL Map & Demographics
Catlin Map
Catlin Overview
$35,304
PER CAPITA INCOME
$88,578
AVG FAMILY INCOME
$62,039
AVG HOUSEHOLD INCOME
42.8%
WAGE / INCOME GAP [ % ]
57.2¢/ $1
WAGE / INCOME GAP [ $ ]
0.36
INEQUALITY / GINI INDEX
2,091
TOTAL POPULATION
1,050
MALE POPULATION
1,041
FEMALE POPULATION
100.86
MALES / 100 FEMALES
99.14
FEMALES / 100 MALES
42.3
MEDIAN AGE
2.9
AVG FAMILY SIZE
2.2
AVG HOUSEHOLD SIZE
1,189
LABOR FORCE [ PEOPLE ]
66.3%
PERCENT IN LABOR FORCE
Catlin Zip Codes
Catlin Area Codes
Income in Catlin
Income Overview in Catlin
Per Capita Income in Catlin is $35,304, while median incomes of families and households are $88,578 and $62,039 respectively.
| Characteristic | Number | Measure |
| Per Capita Income | 2,091 | $35,304 |
| Median Family Income | 549 | $88,578 |
| Mean Family Income | 549 | $95,041 |
| Median Household Income | 966 | $62,039 |
| Mean Household Income | 966 | $76,319 |
| Income Deficit | 549 | $0 |
| Wage / Income Gap (%) | 2,091 | 42.83% |
| Wage / Income Gap ($) | 2,091 | 57.17¢ per $1 |
| Gini / Inequality Index | 2,091 | 0.36 |
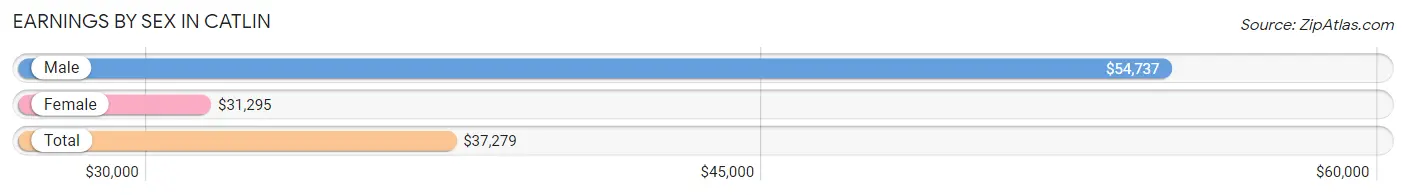
Earnings by Sex in Catlin
Average Earnings in Catlin are $37,279, $54,737 for men and $31,295 for women, a difference of 42.8%.
| Sex | Number | Average Earnings |
| Male | 640 (52.4%) | $54,737 |
| Female | 582 (47.6%) | $31,295 |
| Total | 1,222 (100.0%) | $37,279 |
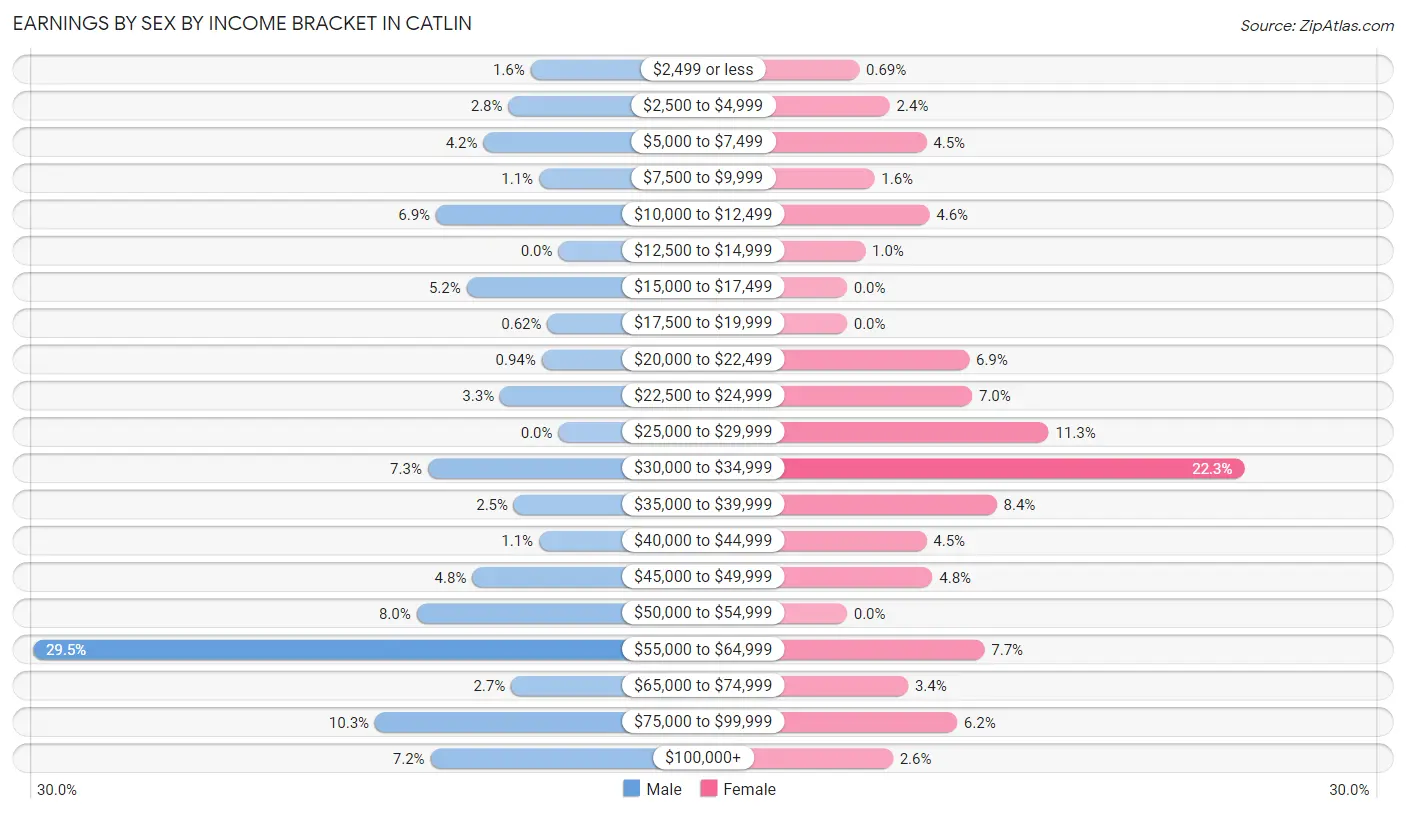
Earnings by Sex by Income Bracket in Catlin
The most common earnings brackets in Catlin are $55,000 to $64,999 for men (189 | 29.5%) and $30,000 to $34,999 for women (130 | 22.3%).
| Income | Male | Female |
| $2,499 or less | 10 (1.6%) | 4 (0.7%) |
| $2,500 to $4,999 | 18 (2.8%) | 14 (2.4%) |
| $5,000 to $7,499 | 27 (4.2%) | 26 (4.5%) |
| $7,500 to $9,999 | 7 (1.1%) | 9 (1.5%) |
| $10,000 to $12,499 | 44 (6.9%) | 27 (4.6%) |
| $12,500 to $14,999 | 0 (0.0%) | 6 (1.0%) |
| $15,000 to $17,499 | 33 (5.2%) | 0 (0.0%) |
| $17,500 to $19,999 | 4 (0.6%) | 0 (0.0%) |
| $20,000 to $22,499 | 6 (0.9%) | 40 (6.9%) |
| $22,500 to $24,999 | 21 (3.3%) | 41 (7.0%) |
| $25,000 to $29,999 | 0 (0.0%) | 66 (11.3%) |
| $30,000 to $34,999 | 47 (7.3%) | 130 (22.3%) |
| $35,000 to $39,999 | 16 (2.5%) | 49 (8.4%) |
| $40,000 to $44,999 | 7 (1.1%) | 26 (4.5%) |
| $45,000 to $49,999 | 31 (4.8%) | 28 (4.8%) |
| $50,000 to $54,999 | 51 (8.0%) | 0 (0.0%) |
| $55,000 to $64,999 | 189 (29.5%) | 45 (7.7%) |
| $65,000 to $74,999 | 17 (2.7%) | 20 (3.4%) |
| $75,000 to $99,999 | 66 (10.3%) | 36 (6.2%) |
| $100,000+ | 46 (7.2%) | 15 (2.6%) |
| Total | 640 (100.0%) | 582 (100.0%) |
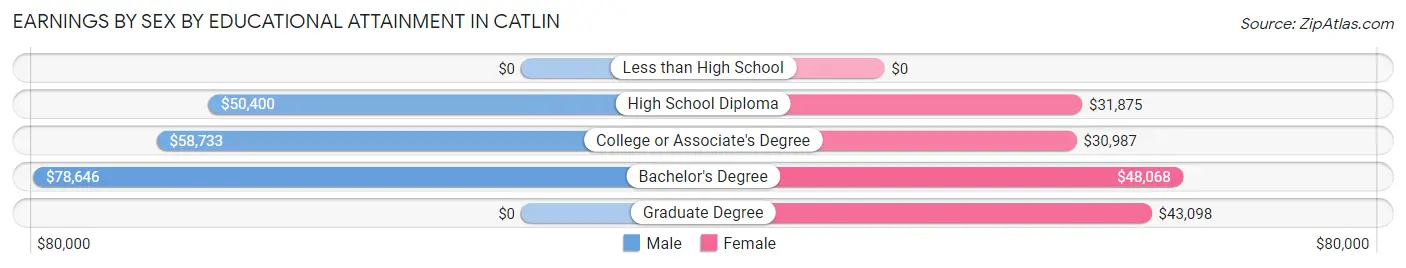
Earnings by Sex by Educational Attainment in Catlin
Average earnings in Catlin are $57,949 for men and $31,618 for women, a difference of 45.4%. Men with an educational attainment of bachelor's degree enjoy the highest average annual earnings of $78,646, while those with high school diploma education earn the least with $50,400. Women with an educational attainment of bachelor's degree earn the most with the average annual earnings of $48,068, while those with college or associate's degree education have the smallest earnings of $30,987.
| Educational Attainment | Male Income | Female Income |
| Less than High School | - | - |
| High School Diploma | $50,400 | $31,875 |
| College or Associate's Degree | $58,733 | $30,987 |
| Bachelor's Degree | $78,646 | $48,068 |
| Graduate Degree | - | - |
| Total | $57,949 | $31,618 |
Family Income in Catlin
Family Income Brackets in Catlin
According to the Catlin family income data, there are 180 families falling into the $100,000 to $149,999 income range, which is the most common income bracket and makes up 32.8% of all families.
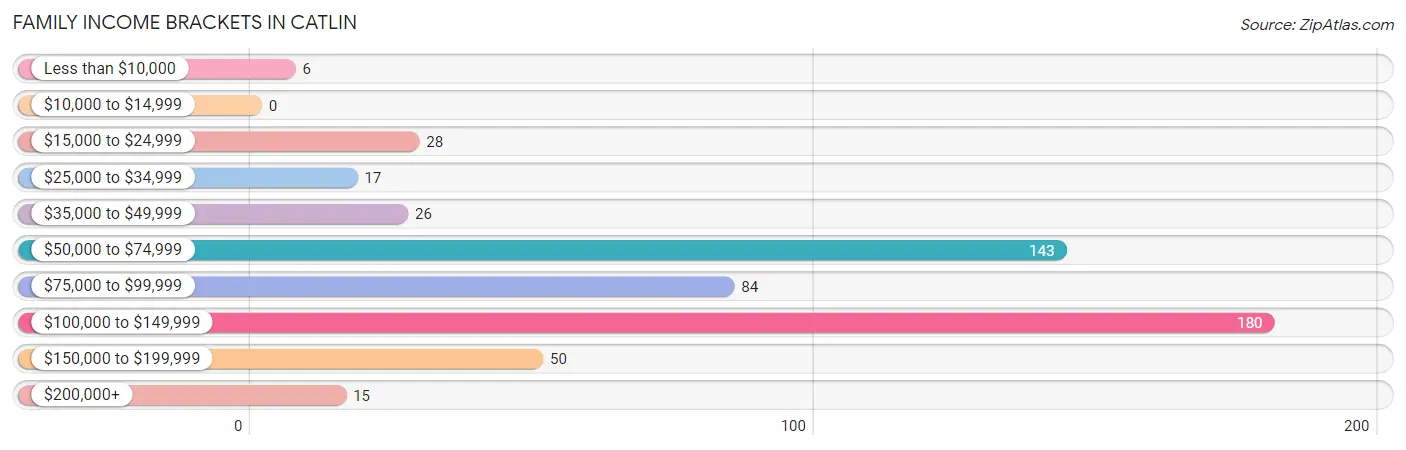
| Income Bracket | # Families | % Families |
| Less than $10,000 | 6 | 1.1% |
| $10,000 to $14,999 | 0 | 0.0% |
| $15,000 to $24,999 | 28 | 5.1% |
| $25,000 to $34,999 | 17 | 3.1% |
| $35,000 to $49,999 | 26 | 4.7% |
| $50,000 to $74,999 | 143 | 26.0% |
| $75,000 to $99,999 | 84 | 15.3% |
| $100,000 to $149,999 | 180 | 32.8% |
| $150,000 to $199,999 | 50 | 9.1% |
| $200,000+ | 15 | 2.7% |
Family Income by Famaliy Size in Catlin
5-person families (16 | 2.9%) account for the highest median family income in Catlin with $149,167 per family, while 3-person families (156 | 28.4%) have the highest median income of $35,170 per family member.
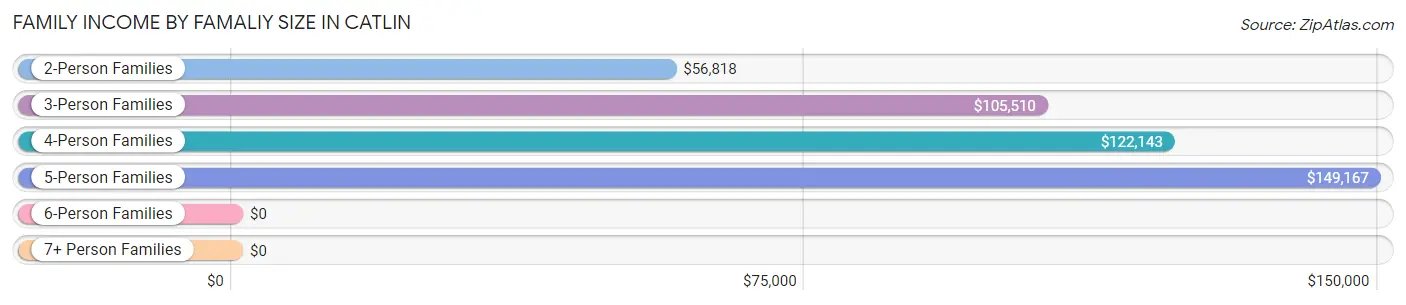
| Income Bracket | # Families | Median Income |
| 2-Person Families | 262 (47.7%) | $56,818 |
| 3-Person Families | 156 (28.4%) | $105,510 |
| 4-Person Families | 104 (18.9%) | $122,143 |
| 5-Person Families | 16 (2.9%) | $149,167 |
| 6-Person Families | 11 (2.0%) | $0 |
| 7+ Person Families | 0 (0.0%) | $0 |
| Total | 549 (100.0%) | $88,578 |
Family Income by Number of Earners in Catlin
The median family income in Catlin is $88,578, with families comprising 3+ earners (79) having the highest median family income of $106,454, while families with 1 earner (116) have the lowest median family income of $51,528, accounting for 14.4% and 21.1% of families, respectively.
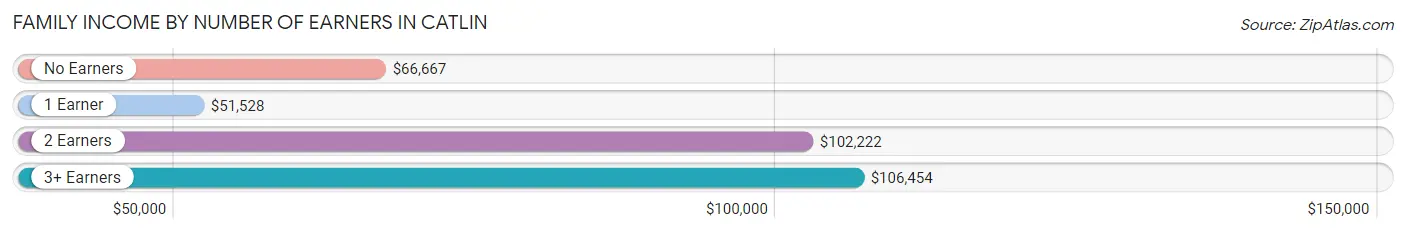
| Number of Earners | # Families | Median Income |
| No Earners | 70 (12.8%) | $66,667 |
| 1 Earner | 116 (21.1%) | $51,528 |
| 2 Earners | 284 (51.7%) | $102,222 |
| 3+ Earners | 79 (14.4%) | $106,454 |
| Total | 549 (100.0%) | $88,578 |
Household Income in Catlin
Household Income Brackets in Catlin
With 222 households falling in the category, the $100,000 to $149,999 income range is the most frequent in Catlin, accounting for 23.0% of all households. In contrast, only 15 households (1.5%) fall into the $200,000+ income bracket, making it the least populous group.
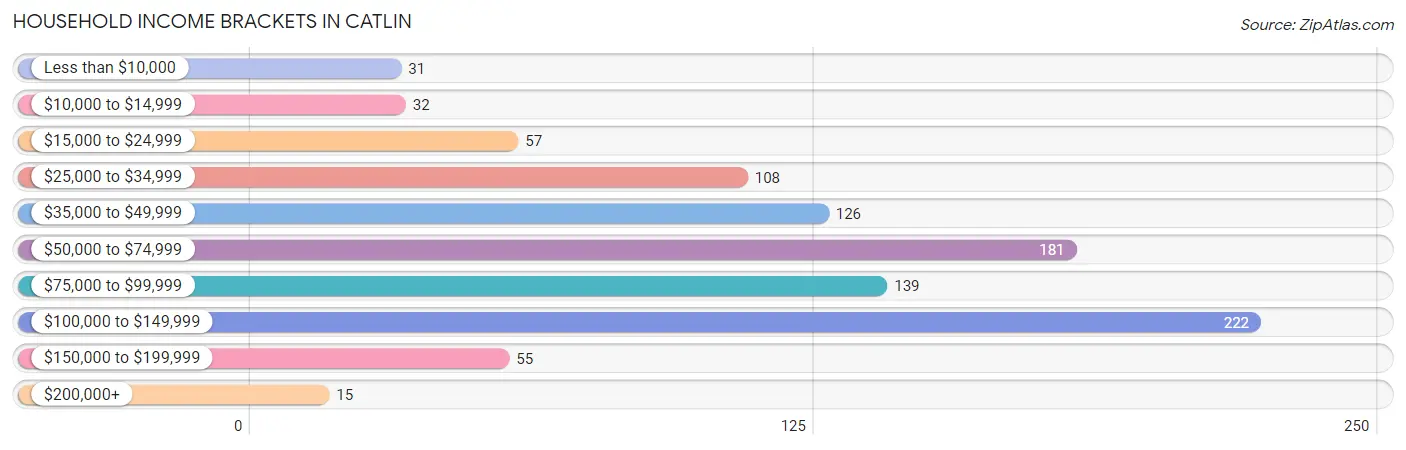
| Income Bracket | # Households | % Households |
| Less than $10,000 | 31 | 3.2% |
| $10,000 to $14,999 | 32 | 3.3% |
| $15,000 to $24,999 | 57 | 5.9% |
| $25,000 to $34,999 | 108 | 11.2% |
| $35,000 to $49,999 | 126 | 13.0% |
| $50,000 to $74,999 | 181 | 18.7% |
| $75,000 to $99,999 | 139 | 14.4% |
| $100,000 to $149,999 | 222 | 23.0% |
| $150,000 to $199,999 | 55 | 5.7% |
| $200,000+ | 15 | 1.6% |
Household Income by Householder Age in Catlin
The median household income in Catlin is $62,039, with the highest median household income of $89,938 found in the 45 to 64 years age bracket for the primary householder. A total of 325 households (33.6%) fall into this category. Meanwhile, the 65+ years age bracket for the primary householder has the lowest median household income of $44,583, with 317 households (32.8%) in this group.
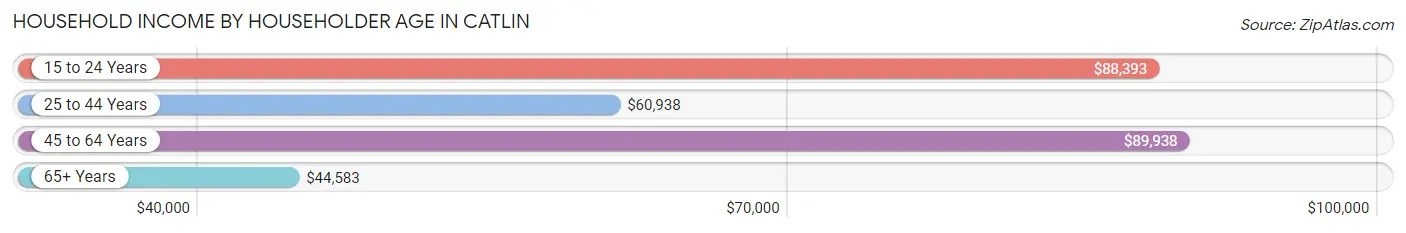
| Income Bracket | # Households | Median Income |
| 15 to 24 Years | 41 (4.2%) | $88,393 |
| 25 to 44 Years | 283 (29.3%) | $60,938 |
| 45 to 64 Years | 325 (33.6%) | $89,938 |
| 65+ Years | 317 (32.8%) | $44,583 |
| Total | 966 (100.0%) | $62,039 |
Poverty in Catlin
Income Below Poverty by Sex and Age in Catlin
With 3.1% poverty level for males and 8.2% for females among the residents of Catlin, 65 to 74 year old males and 18 to 24 year old females are the most vulnerable to poverty, with 4 males (8.7%) and 20 females (35.7%) in their respective age groups living below the poverty level.
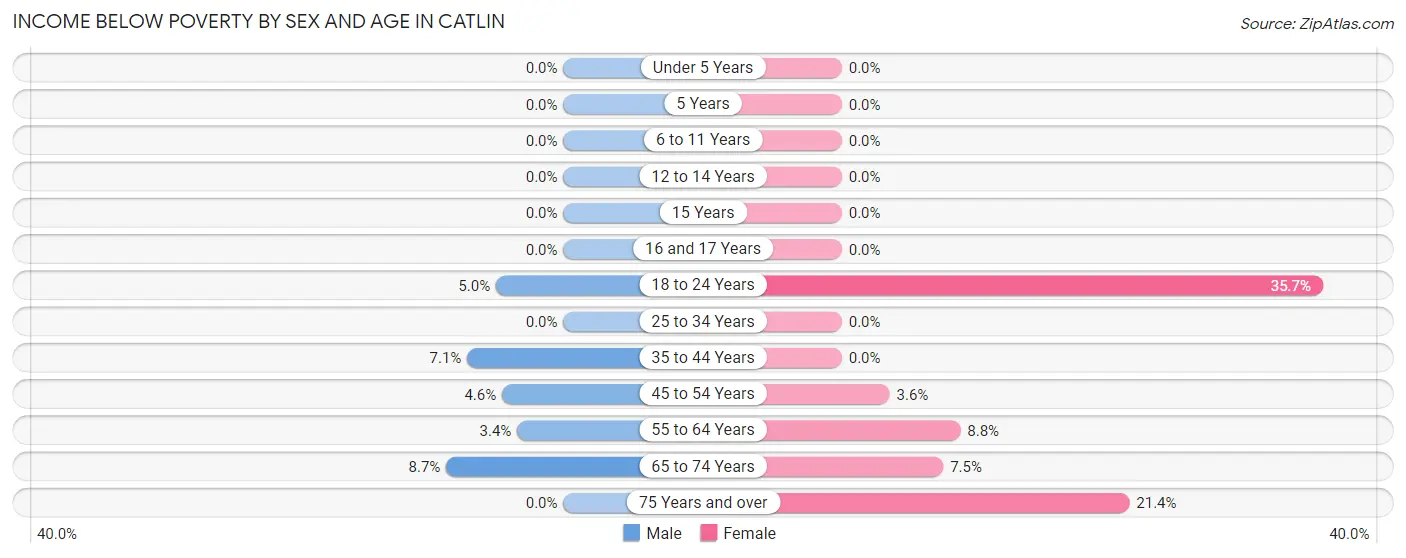
| Age Bracket | Male | Female |
| Under 5 Years | 0 (0.0%) | 0 (0.0%) |
| 5 Years | 0 (0.0%) | 0 (0.0%) |
| 6 to 11 Years | 0 (0.0%) | 0 (0.0%) |
| 12 to 14 Years | 0 (0.0%) | 0 (0.0%) |
| 15 Years | 0 (0.0%) | 0 (0.0%) |
| 16 and 17 Years | 0 (0.0%) | 0 (0.0%) |
| 18 to 24 Years | 10 (5.0%) | 20 (35.7%) |
| 25 to 34 Years | 0 (0.0%) | 0 (0.0%) |
| 35 to 44 Years | 7 (7.1%) | 0 (0.0%) |
| 45 to 54 Years | 5 (4.5%) | 6 (3.5%) |
| 55 to 64 Years | 6 (3.4%) | 11 (8.8%) |
| 65 to 74 Years | 4 (8.7%) | 7 (7.5%) |
| 75 Years and over | 0 (0.0%) | 41 (21.3%) |
| Total | 32 (3.1%) | 85 (8.2%) |
Income Above Poverty by Sex and Age in Catlin
According to the poverty statistics in Catlin, males aged under 5 years and females aged under 5 years are the age groups that are most secure financially, with 100.0% of males and 100.0% of females in these age groups living above the poverty line.
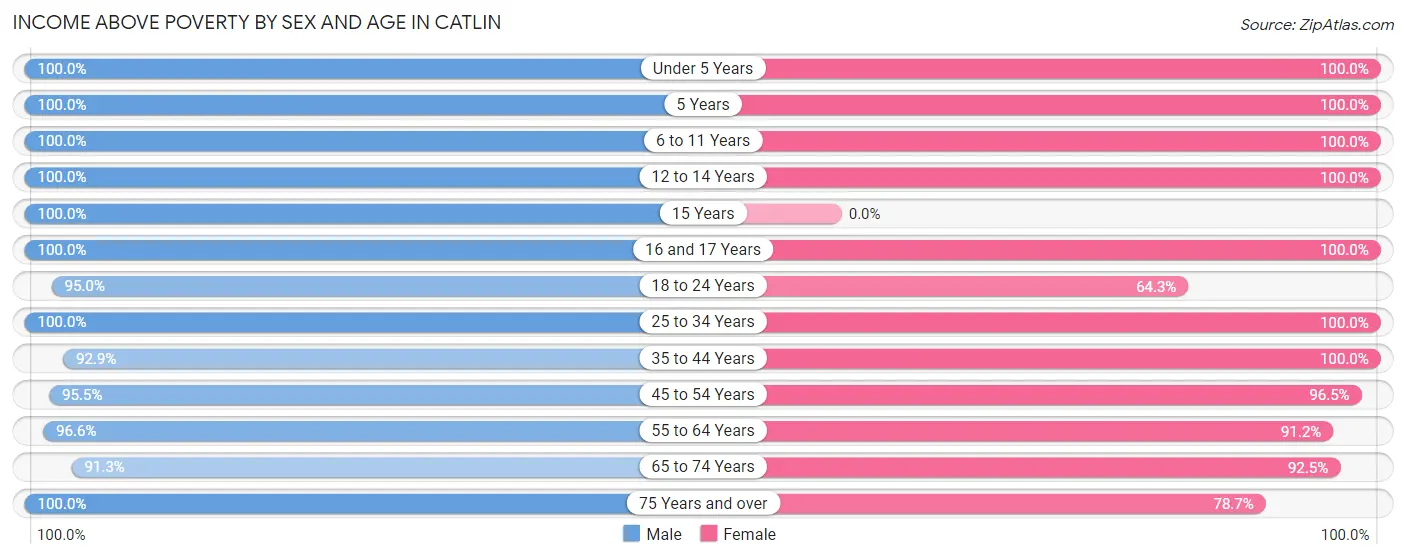
| Age Bracket | Male | Female |
| Under 5 Years | 26 (100.0%) | 13 (100.0%) |
| 5 Years | 11 (100.0%) | 9 (100.0%) |
| 6 to 11 Years | 101 (100.0%) | 66 (100.0%) |
| 12 to 14 Years | 17 (100.0%) | 30 (100.0%) |
| 15 Years | 18 (100.0%) | 0 (0.0%) |
| 16 and 17 Years | 36 (100.0%) | 4 (100.0%) |
| 18 to 24 Years | 190 (95.0%) | 36 (64.3%) |
| 25 to 34 Years | 149 (100.0%) | 159 (100.0%) |
| 35 to 44 Years | 91 (92.9%) | 122 (100.0%) |
| 45 to 54 Years | 105 (95.5%) | 163 (96.5%) |
| 55 to 64 Years | 169 (96.6%) | 114 (91.2%) |
| 65 to 74 Years | 42 (91.3%) | 86 (92.5%) |
| 75 Years and over | 60 (100.0%) | 151 (78.6%) |
| Total | 1,015 (96.9%) | 953 (91.8%) |
Income Below Poverty Among Married-Couple Families in Catlin
The poverty statistics for married-couple families in Catlin show that 1.4% or 6 of the total 420 families live below the poverty line. Families with no children have the highest poverty rate of 1.9%, comprising of 6 families. On the other hand, families with 1 or 2 children have the lowest poverty rate of 0.0%, which includes 0 families.
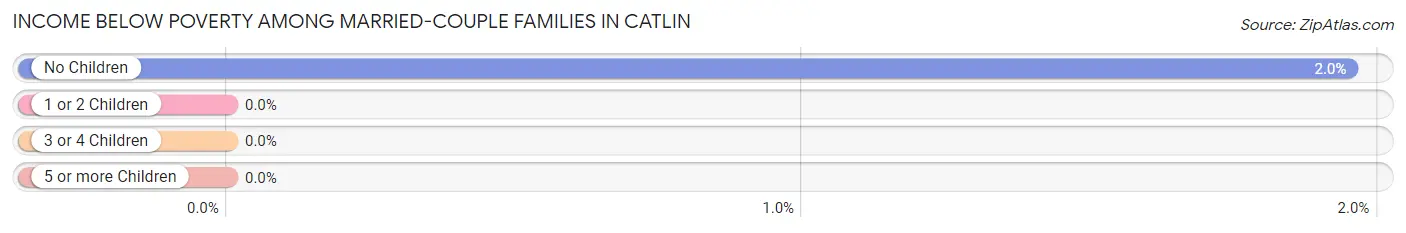
| Children | Above Poverty | Below Poverty |
| No Children | 301 (98.1%) | 6 (1.9%) |
| 1 or 2 Children | 86 (100.0%) | 0 (0.0%) |
| 3 or 4 Children | 27 (100.0%) | 0 (0.0%) |
| 5 or more Children | 0 (0.0%) | 0 (0.0%) |
| Total | 414 (98.6%) | 6 (1.4%) |
Income Below Poverty Among Single-Parent Households in Catlin
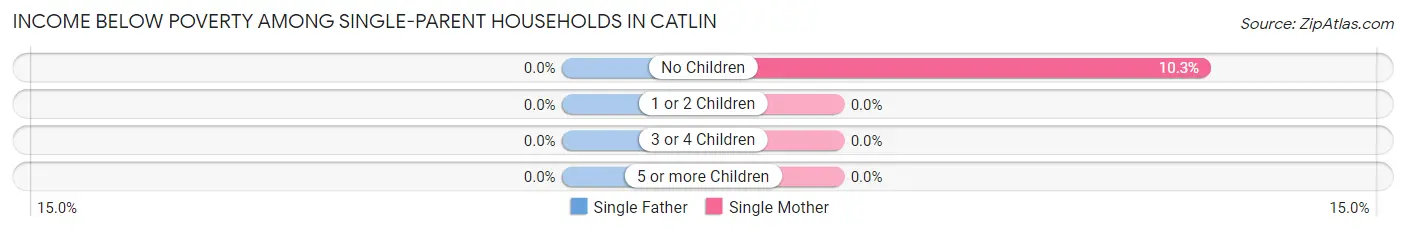
| Children | Single Father | Single Mother |
| No Children | 0 (0.0%) | 4 (10.3%) |
| 1 or 2 Children | 0 (0.0%) | 0 (0.0%) |
| 3 or 4 Children | 0 (0.0%) | 0 (0.0%) |
| 5 or more Children | 0 (0.0%) | 0 (0.0%) |
| Total | 0 (0.0%) | 4 (5.7%) |
Income Below Poverty Among Married-Couple vs Single-Parent Households in Catlin
The poverty data for Catlin shows that 6 of the married-couple family households (1.4%) and 4 of the single-parent households (3.1%) are living below the poverty level. Within the married-couple family households, those with no children have the highest poverty rate, with 6 households (1.9%) falling below the poverty line. Among the single-parent households, those with no children have the highest poverty rate, with 4 household (5.6%) living below poverty.
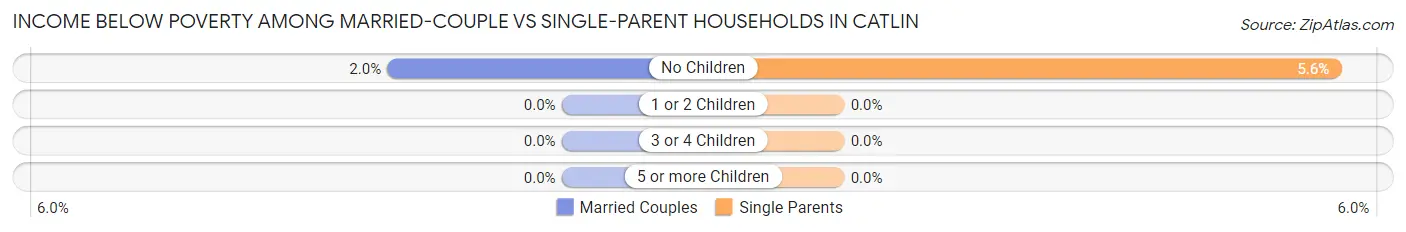
| Children | Married-Couple Families | Single-Parent Households |
| No Children | 6 (1.9%) | 4 (5.6%) |
| 1 or 2 Children | 0 (0.0%) | 0 (0.0%) |
| 3 or 4 Children | 0 (0.0%) | 0 (0.0%) |
| 5 or more Children | 0 (0.0%) | 0 (0.0%) |
| Total | 6 (1.4%) | 4 (3.1%) |
Race in Catlin
The most populous races in Catlin are White / Caucasian (2,074 | 99.2%), Hispanic or Latino (136 | 6.5%), and Two or more Races (17 | 0.8%).
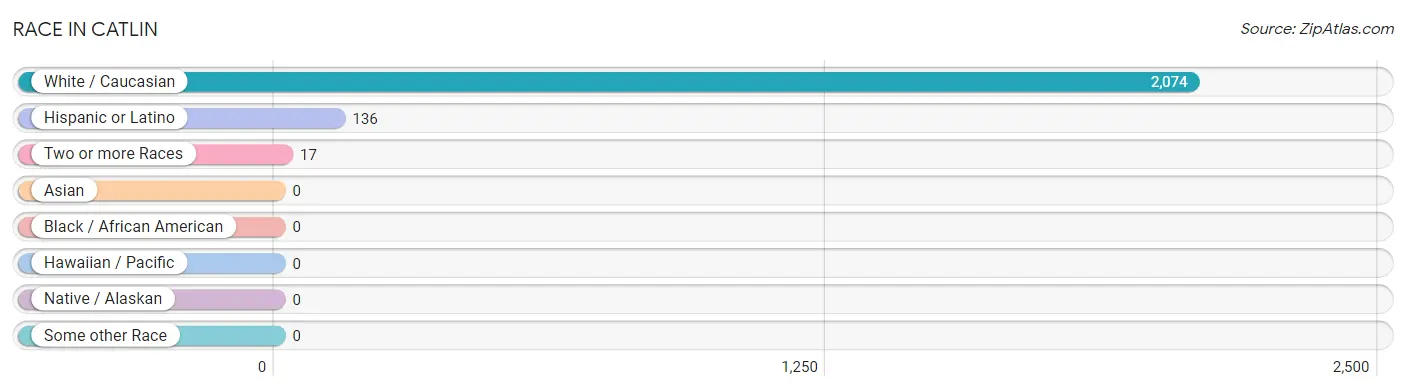
| Race | # Population | % Population |
| Asian | 0 | 0.0% |
| Black / African American | 0 | 0.0% |
| Hawaiian / Pacific | 0 | 0.0% |
| Hispanic or Latino | 136 | 6.5% |
| Native / Alaskan | 0 | 0.0% |
| White / Caucasian | 2,074 | 99.2% |
| Two or more Races | 17 | 0.8% |
| Some other Race | 0 | 0.0% |
| Total | 2,091 | 100.0% |
Ancestry in Catlin
The most populous ancestries reported in Catlin are English (327 | 15.6%), German (296 | 14.2%), Irish (278 | 13.3%), American (271 | 13.0%), and Mexican (103 | 4.9%), together accounting for 61.0% of all Catlin residents.
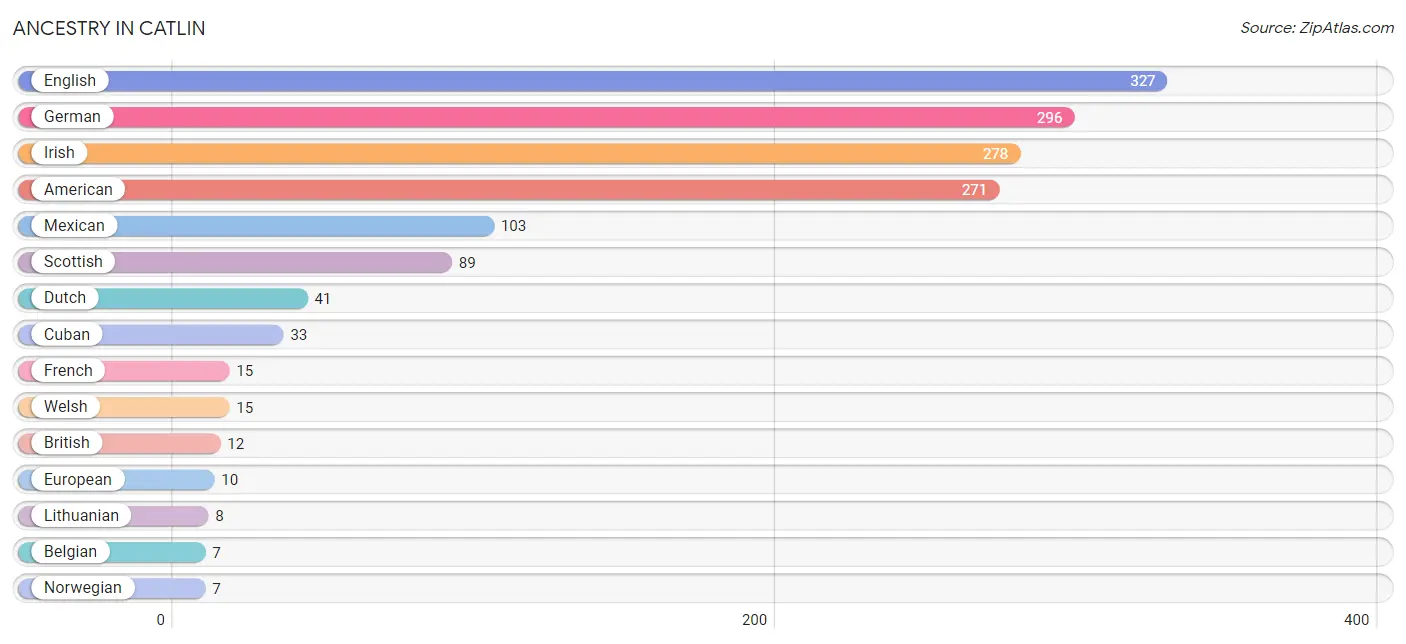
| Ancestry | # Population | % Population |
| American | 271 | 13.0% |
| Belgian | 7 | 0.3% |
| British | 12 | 0.6% |
| Canadian | 4 | 0.2% |
| Cuban | 33 | 1.6% |
| Czechoslovakian | 4 | 0.2% |
| Dutch | 41 | 2.0% |
| English | 327 | 15.6% |
| European | 10 | 0.5% |
| French | 15 | 0.7% |
| German | 296 | 14.2% |
| Irish | 278 | 13.3% |
| Lithuanian | 8 | 0.4% |
| Mexican | 103 | 4.9% |
| Nigerian | 6 | 0.3% |
| Norwegian | 7 | 0.3% |
| Scotch-Irish | 4 | 0.2% |
| Scottish | 89 | 4.3% |
| Subsaharan African | 6 | 0.3% |
| Welsh | 15 | 0.7% | View All 20 Rows |
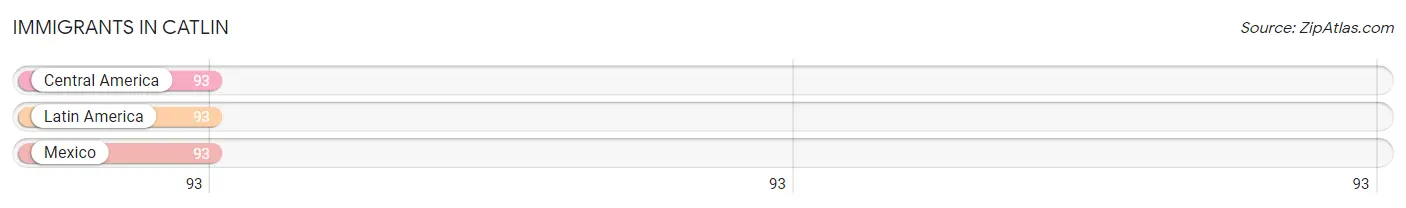
Immigrants in Catlin
The most numerous immigrant groups reported in Catlin came from Central America (93 | 4.4%), Latin America (93 | 4.4%), and Mexico (93 | 4.4%), together accounting for 13.4% of all Catlin residents.
| Immigration Origin | # Population | % Population |
| Central America | 93 | 4.4% |
| Latin America | 93 | 4.4% |
| Mexico | 93 | 4.4% | View All 3 Rows |
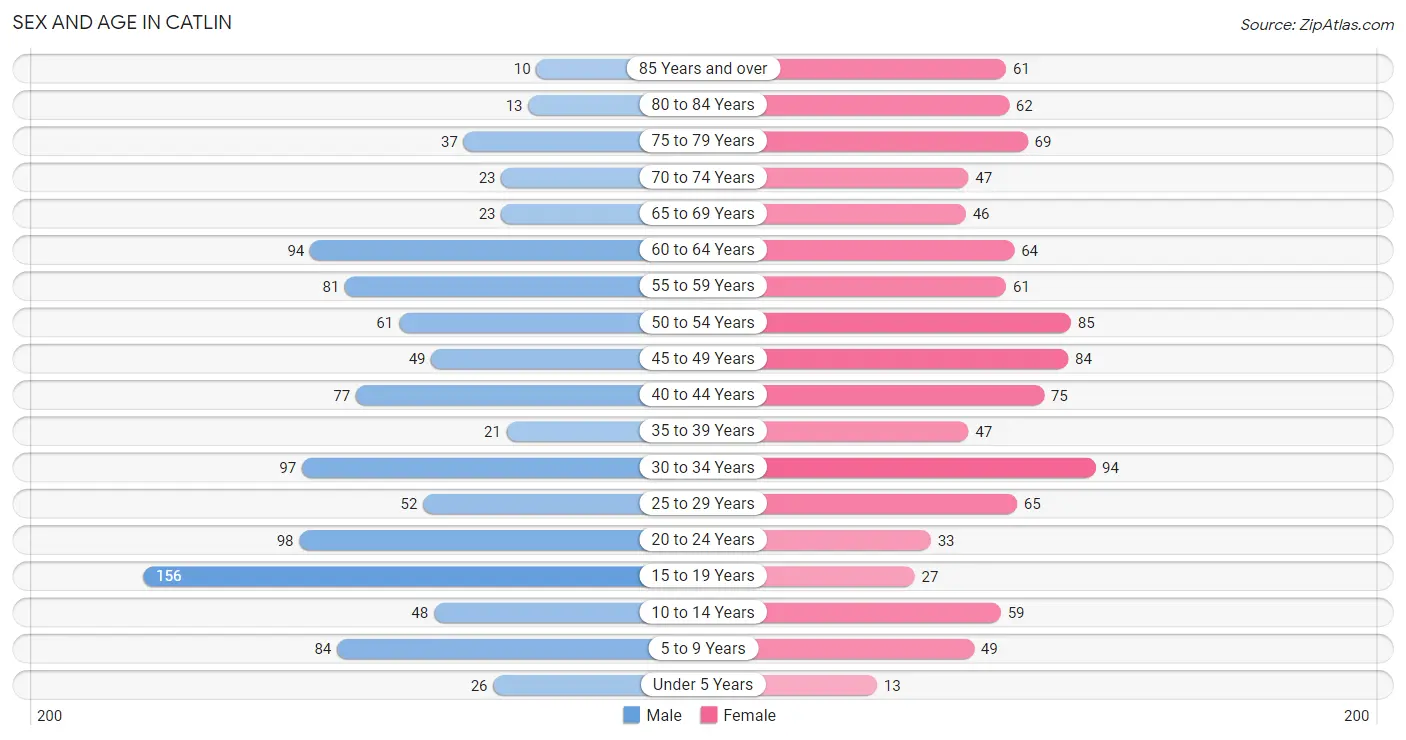
Sex and Age in Catlin
Sex and Age in Catlin
The most populous age groups in Catlin are 15 to 19 Years (156 | 14.9%) for men and 30 to 34 Years (94 | 9.0%) for women.
| Age Bracket | Male | Female |
| Under 5 Years | 26 (2.5%) | 13 (1.3%) |
| 5 to 9 Years | 84 (8.0%) | 49 (4.7%) |
| 10 to 14 Years | 48 (4.6%) | 59 (5.7%) |
| 15 to 19 Years | 156 (14.9%) | 27 (2.6%) |
| 20 to 24 Years | 98 (9.3%) | 33 (3.2%) |
| 25 to 29 Years | 52 (5.0%) | 65 (6.2%) |
| 30 to 34 Years | 97 (9.2%) | 94 (9.0%) |
| 35 to 39 Years | 21 (2.0%) | 47 (4.5%) |
| 40 to 44 Years | 77 (7.3%) | 75 (7.2%) |
| 45 to 49 Years | 49 (4.7%) | 84 (8.1%) |
| 50 to 54 Years | 61 (5.8%) | 85 (8.2%) |
| 55 to 59 Years | 81 (7.7%) | 61 (5.9%) |
| 60 to 64 Years | 94 (8.9%) | 64 (6.1%) |
| 65 to 69 Years | 23 (2.2%) | 46 (4.4%) |
| 70 to 74 Years | 23 (2.2%) | 47 (4.5%) |
| 75 to 79 Years | 37 (3.5%) | 69 (6.6%) |
| 80 to 84 Years | 13 (1.2%) | 62 (6.0%) |
| 85 Years and over | 10 (0.9%) | 61 (5.9%) |
| Total | 1,050 (100.0%) | 1,041 (100.0%) |
Families and Households in Catlin
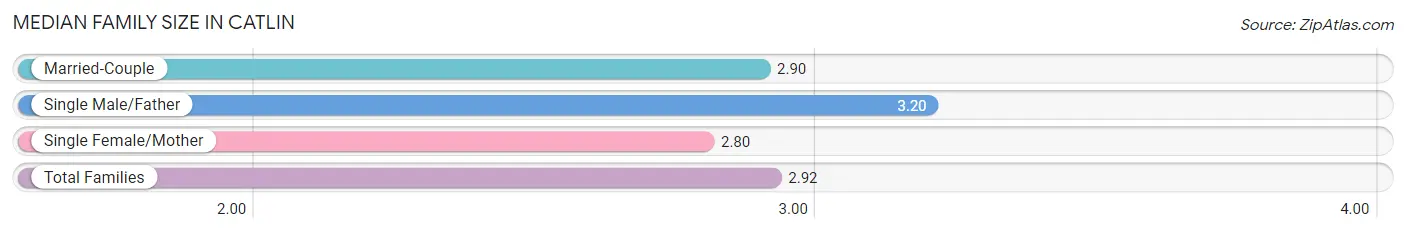
Median Family Size in Catlin
The median family size in Catlin is 2.92 persons per family, with single male/father families (59 | 10.7%) accounting for the largest median family size of 3.2 persons per family. On the other hand, single female/mother families (70 | 12.8%) represent the smallest median family size with 2.80 persons per family.
| Family Type | # Families | Family Size |
| Married-Couple | 420 (76.5%) | 2.90 |
| Single Male/Father | 59 (10.7%) | 3.20 |
| Single Female/Mother | 70 (12.8%) | 2.80 |
| Total Families | 549 (100.0%) | 2.92 |
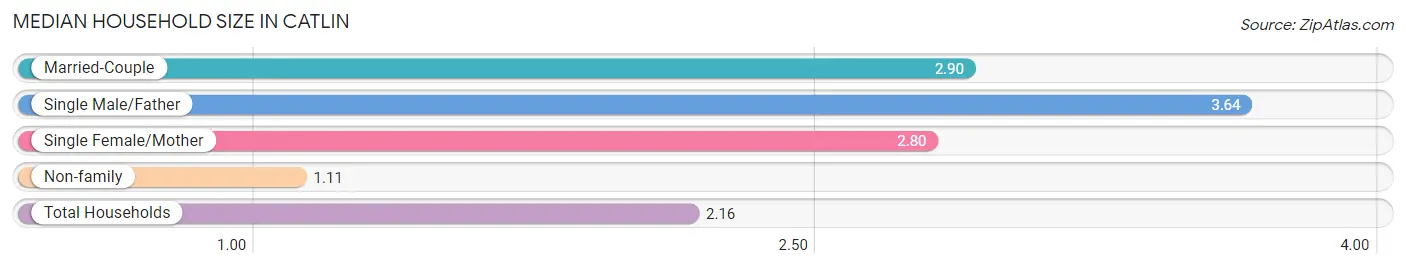
Median Household Size in Catlin
The median household size in Catlin is 2.16 persons per household, with single male/father households (59 | 6.1%) accounting for the largest median household size of 3.64 persons per household. non-family households (417 | 43.2%) represent the smallest median household size with 1.11 persons per household.
| Household Type | # Households | Household Size |
| Married-Couple | 420 (43.5%) | 2.90 |
| Single Male/Father | 59 (6.1%) | 3.64 |
| Single Female/Mother | 70 (7.2%) | 2.80 |
| Non-family | 417 (43.2%) | 1.11 |
| Total Households | 966 (100.0%) | 2.16 |
Household Size by Marriage Status in Catlin
Out of a total of 966 households in Catlin, 549 (56.8%) are family households, while 417 (43.2%) are nonfamily households. The most numerous type of family households are 2-person households, comprising 242, and the most common type of nonfamily households are 1-person households, comprising 377.
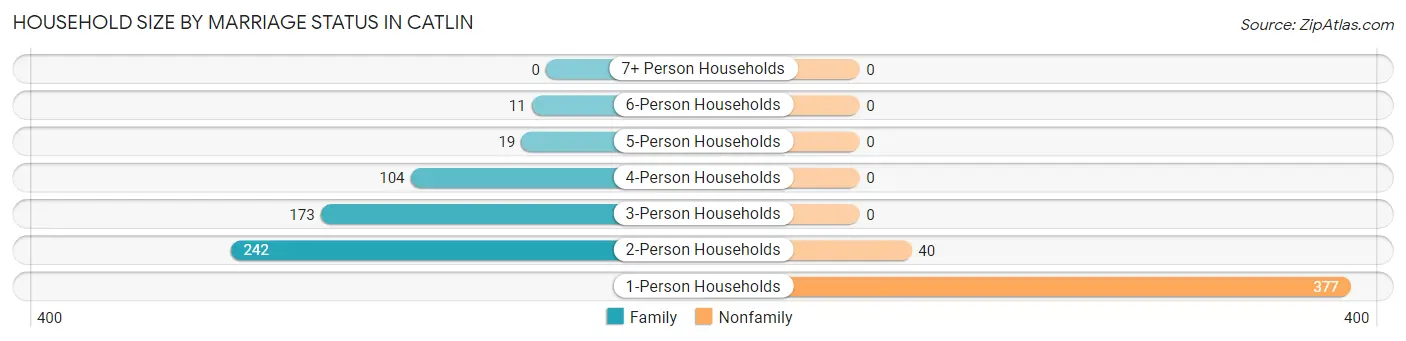
| Household Size | Family Households | Nonfamily Households |
| 1-Person Households | - | 377 (39.0%) |
| 2-Person Households | 242 (25.1%) | 40 (4.1%) |
| 3-Person Households | 173 (17.9%) | 0 (0.0%) |
| 4-Person Households | 104 (10.8%) | 0 (0.0%) |
| 5-Person Households | 19 (2.0%) | 0 (0.0%) |
| 6-Person Households | 11 (1.1%) | 0 (0.0%) |
| 7+ Person Households | 0 (0.0%) | 0 (0.0%) |
| Total | 549 (56.8%) | 417 (43.2%) |
Female Fertility in Catlin
Fertility by Age in Catlin
| Age Bracket | Women with Births | Births / 1,000 Women |
| 15 to 19 years | 0 (0.0%) | 0.0 |
| 20 to 34 years | 0 (0.0%) | 0.0 |
| 35 to 50 years | 0 (0.0%) | 0.0 |
| Total | 0 (0.0%) | 0.0 |
Fertility by Age by Marriage Status in Catlin
| Age Bracket | Married | Unmarried |
| 15 to 19 years | 0 (0.0%) | 0 (0.0%) |
| 20 to 34 years | 0 (0.0%) | 0 (0.0%) |
| 35 to 50 years | 0 (0.0%) | 0 (0.0%) |
| Total | 0 (0.0%) | 0 (0.0%) |
Fertility by Education in Catlin
| Educational Attainment | Women with Births | Births / 1,000 Women |
| Less than High School | 0 (0.0%) | 0.0 |
| High School Diploma | 0 (0.0%) | 0.0 |
| College or Associate's Degree | 0 (0.0%) | 0.0 |
| Bachelor's Degree | 0 (0.0%) | 0.0 |
| Graduate Degree | 0 (0.0%) | 0.0 |
| Total | 0 (0.0%) | 0.0 |
Fertility by Education by Marriage Status in Catlin
| Educational Attainment | Married | Unmarried |
| Less than High School | 0 (0.0%) | 0 (0.0%) |
| High School Diploma | 0 (0.0%) | 0 (0.0%) |
| College or Associate's Degree | 0 (0.0%) | 0 (0.0%) |
| Bachelor's Degree | 0 (0.0%) | 0 (0.0%) |
| Graduate Degree | 0 (0.0%) | 0 (0.0%) |
| Total | 0 (0.0%) | 0 (0.0%) |
Employment Characteristics in Catlin
Employment by Class of Employer in Catlin
Among the 1,185 employed individuals in Catlin, private company employees (806 | 68.0%), local government employees (165 | 13.9%), and self-employed (not incorporated) (63 | 5.3%) make up the most common classes of employment.
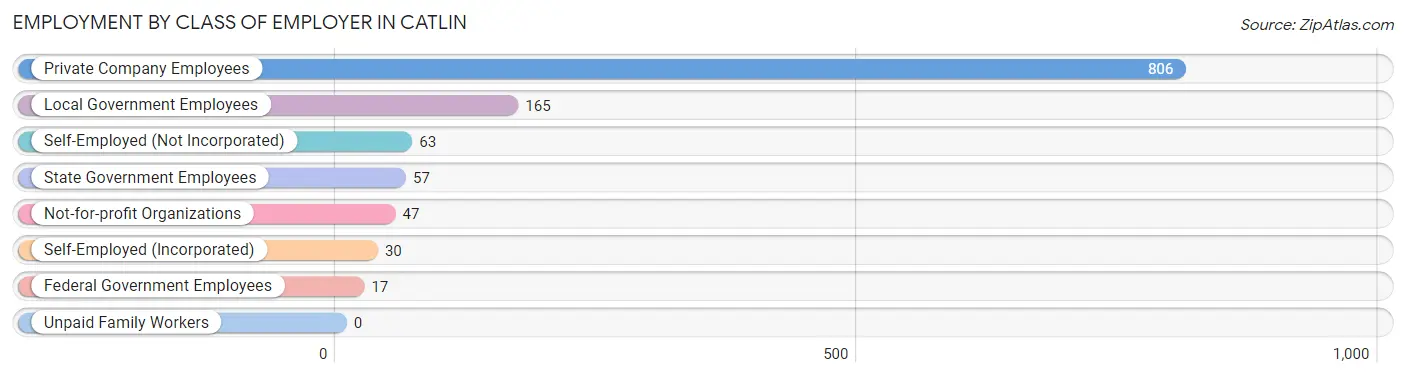
| Employer Class | # Employees | % Employees |
| Private Company Employees | 806 | 68.0% |
| Self-Employed (Incorporated) | 30 | 2.5% |
| Self-Employed (Not Incorporated) | 63 | 5.3% |
| Not-for-profit Organizations | 47 | 4.0% |
| Local Government Employees | 165 | 13.9% |
| State Government Employees | 57 | 4.8% |
| Federal Government Employees | 17 | 1.4% |
| Unpaid Family Workers | 0 | 0.0% |
| Total | 1,185 | 100.0% |
Employment Status by Age in Catlin
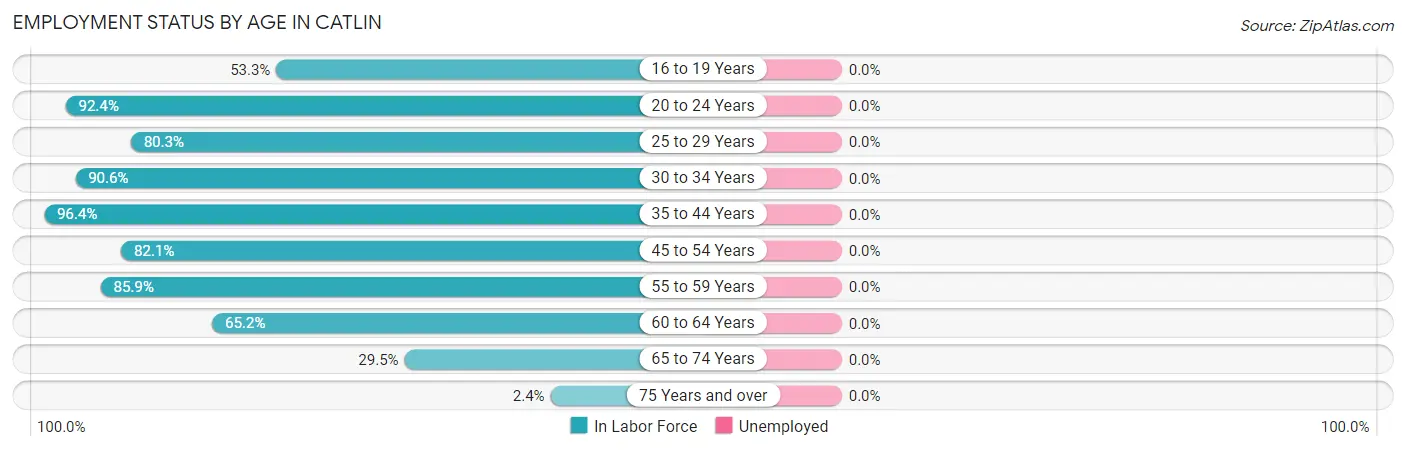
| Age Bracket | In Labor Force | Unemployed |
| 16 to 19 Years | 88 (53.3%) | 0 (0.0%) |
| 20 to 24 Years | 121 (92.4%) | 0 (0.0%) |
| 25 to 29 Years | 94 (80.3%) | 0 (0.0%) |
| 30 to 34 Years | 173 (90.6%) | 0 (0.0%) |
| 35 to 44 Years | 212 (96.4%) | 0 (0.0%) |
| 45 to 54 Years | 229 (82.1%) | 0 (0.0%) |
| 55 to 59 Years | 122 (85.9%) | 0 (0.0%) |
| 60 to 64 Years | 103 (65.2%) | 0 (0.0%) |
| 65 to 74 Years | 41 (29.5%) | 0 (0.0%) |
| 75 Years and over | 6 (2.4%) | 0 (0.0%) |
| Total | 1,189 (66.3%) | 0 (0.0%) |
Employment Status by Educational Attainment in Catlin
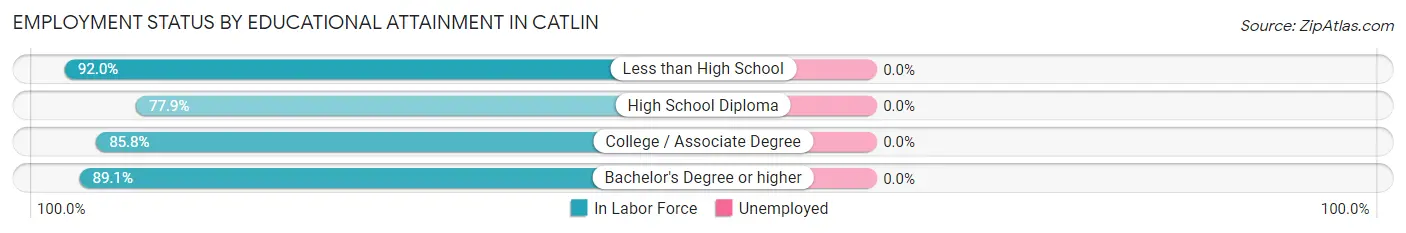
| Educational Attainment | In Labor Force | Unemployed |
| Less than High School | 69 (92.0%) | 0 (0.0%) |
| High School Diploma | 292 (77.9%) | 0 (0.0%) |
| College / Associate Degree | 343 (85.8%) | 0 (0.0%) |
| Bachelor's Degree or higher | 229 (89.1%) | 0 (0.0%) |
| Total | 933 (84.3%) | 0 (0.0%) |
Employment Occupations by Sex in Catlin
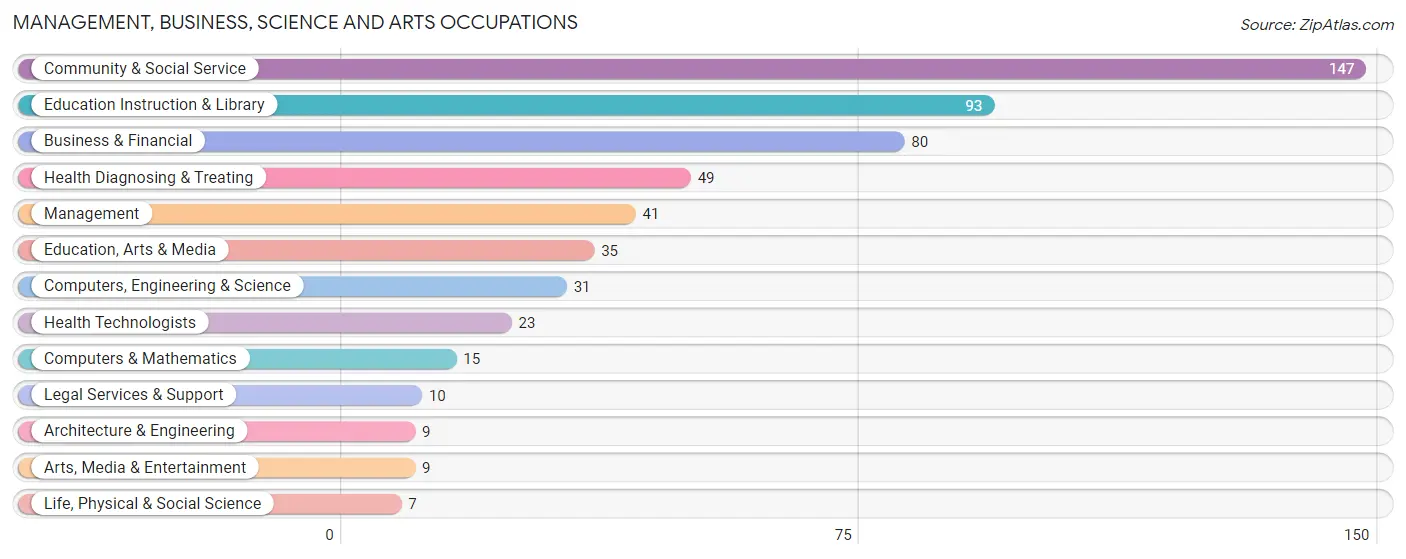
Management, Business, Science and Arts Occupations
The most common Management, Business, Science and Arts occupations in Catlin are Community & Social Service (147 | 12.4%), Education Instruction & Library (93 | 7.8%), Business & Financial (80 | 6.7%), Health Diagnosing & Treating (49 | 4.1%), and Management (41 | 3.5%).
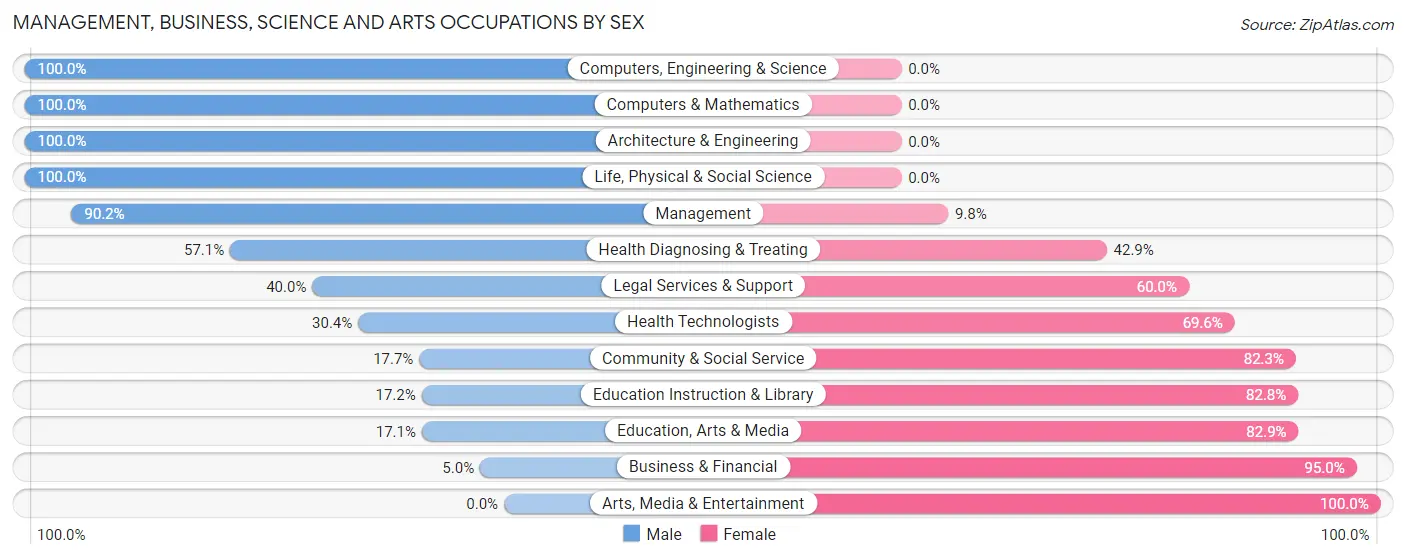
Management, Business, Science and Arts Occupations by Sex
Within the Management, Business, Science and Arts occupations in Catlin, the most male-oriented occupations are Computers, Engineering & Science (100.0%), Computers & Mathematics (100.0%), and Architecture & Engineering (100.0%), while the most female-oriented occupations are Arts, Media & Entertainment (100.0%), Business & Financial (95.0%), and Education, Arts & Media (82.9%).
| Occupation | Male | Female |
| Management | 37 (90.2%) | 4 (9.8%) |
| Business & Financial | 4 (5.0%) | 76 (95.0%) |
| Computers, Engineering & Science | 31 (100.0%) | 0 (0.0%) |
| Computers & Mathematics | 15 (100.0%) | 0 (0.0%) |
| Architecture & Engineering | 9 (100.0%) | 0 (0.0%) |
| Life, Physical & Social Science | 7 (100.0%) | 0 (0.0%) |
| Community & Social Service | 26 (17.7%) | 121 (82.3%) |
| Education, Arts & Media | 6 (17.1%) | 29 (82.9%) |
| Legal Services & Support | 4 (40.0%) | 6 (60.0%) |
| Education Instruction & Library | 16 (17.2%) | 77 (82.8%) |
| Arts, Media & Entertainment | 0 (0.0%) | 9 (100.0%) |
| Health Diagnosing & Treating | 28 (57.1%) | 21 (42.9%) |
| Health Technologists | 7 (30.4%) | 16 (69.6%) |
| Total (Category) | 126 (36.2%) | 222 (63.8%) |
| Total (Overall) | 615 (51.7%) | 574 (48.3%) |
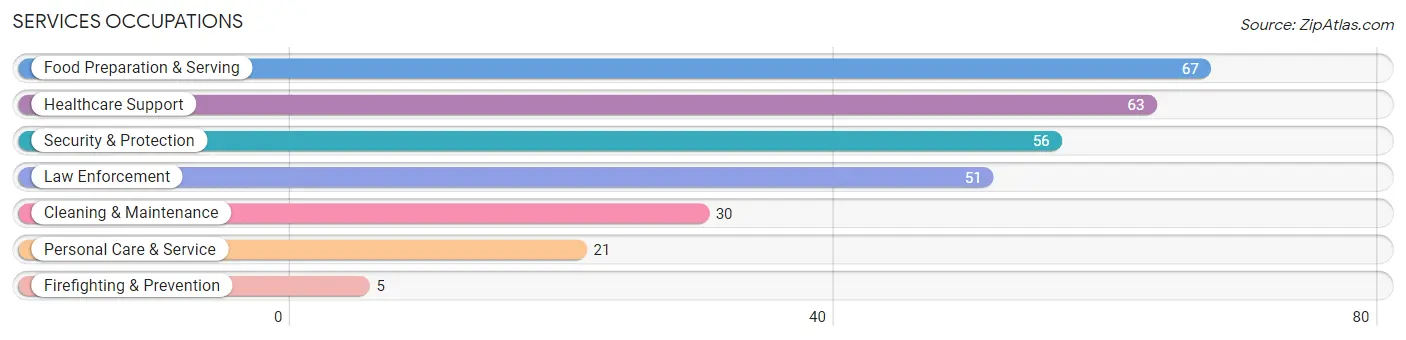
Services Occupations
The most common Services occupations in Catlin are Food Preparation & Serving (67 | 5.6%), Healthcare Support (63 | 5.3%), Security & Protection (56 | 4.7%), Law Enforcement (51 | 4.3%), and Cleaning & Maintenance (30 | 2.5%).
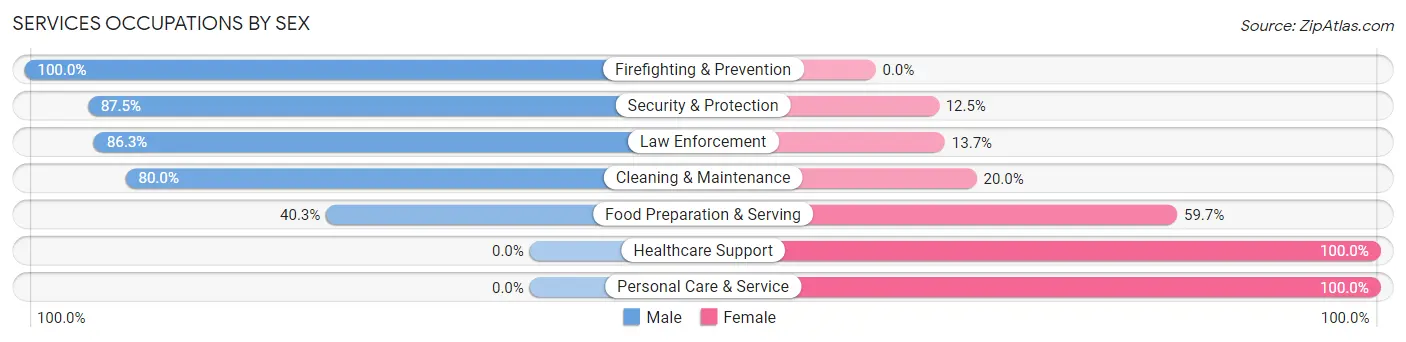
Services Occupations by Sex
Within the Services occupations in Catlin, the most male-oriented occupations are Firefighting & Prevention (100.0%), Security & Protection (87.5%), and Law Enforcement (86.3%), while the most female-oriented occupations are Healthcare Support (100.0%), Personal Care & Service (100.0%), and Food Preparation & Serving (59.7%).
| Occupation | Male | Female |
| Healthcare Support | 0 (0.0%) | 63 (100.0%) |
| Security & Protection | 49 (87.5%) | 7 (12.5%) |
| Firefighting & Prevention | 5 (100.0%) | 0 (0.0%) |
| Law Enforcement | 44 (86.3%) | 7 (13.7%) |
| Food Preparation & Serving | 27 (40.3%) | 40 (59.7%) |
| Cleaning & Maintenance | 24 (80.0%) | 6 (20.0%) |
| Personal Care & Service | 0 (0.0%) | 21 (100.0%) |
| Total (Category) | 100 (42.2%) | 137 (57.8%) |
| Total (Overall) | 615 (51.7%) | 574 (48.3%) |
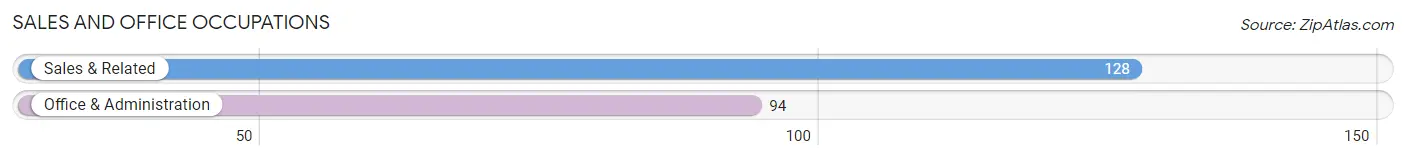
Sales and Office Occupations
The most common Sales and Office occupations in Catlin are Sales & Related (128 | 10.8%), and Office & Administration (94 | 7.9%).
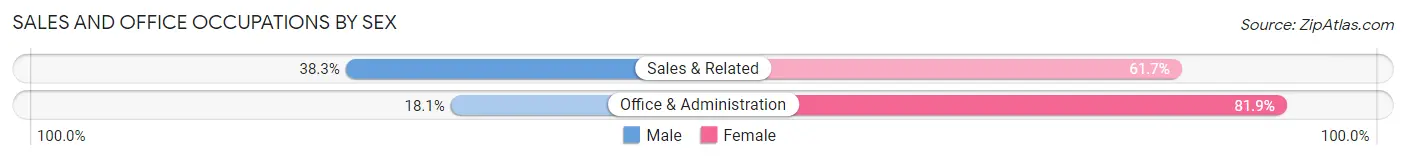
Sales and Office Occupations by Sex
| Occupation | Male | Female |
| Sales & Related | 49 (38.3%) | 79 (61.7%) |
| Office & Administration | 17 (18.1%) | 77 (81.9%) |
| Total (Category) | 66 (29.7%) | 156 (70.3%) |
| Total (Overall) | 615 (51.7%) | 574 (48.3%) |
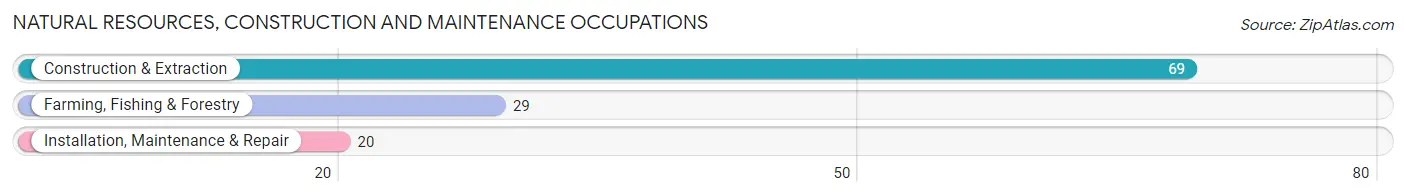
Natural Resources, Construction and Maintenance Occupations
The most common Natural Resources, Construction and Maintenance occupations in Catlin are Construction & Extraction (69 | 5.8%), Farming, Fishing & Forestry (29 | 2.4%), and Installation, Maintenance & Repair (20 | 1.7%).
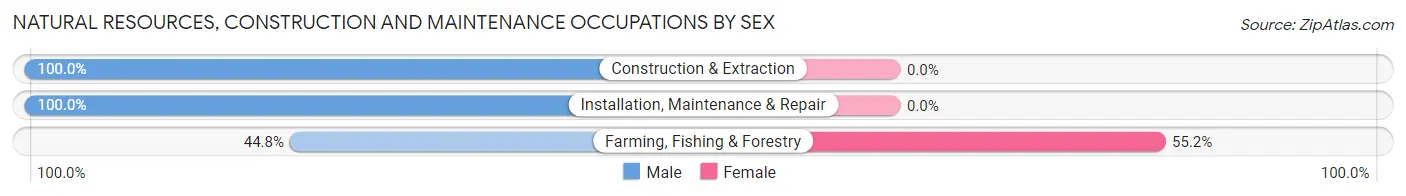
Natural Resources, Construction and Maintenance Occupations by Sex
| Occupation | Male | Female |
| Farming, Fishing & Forestry | 13 (44.8%) | 16 (55.2%) |
| Construction & Extraction | 69 (100.0%) | 0 (0.0%) |
| Installation, Maintenance & Repair | 20 (100.0%) | 0 (0.0%) |
| Total (Category) | 102 (86.4%) | 16 (13.6%) |
| Total (Overall) | 615 (51.7%) | 574 (48.3%) |
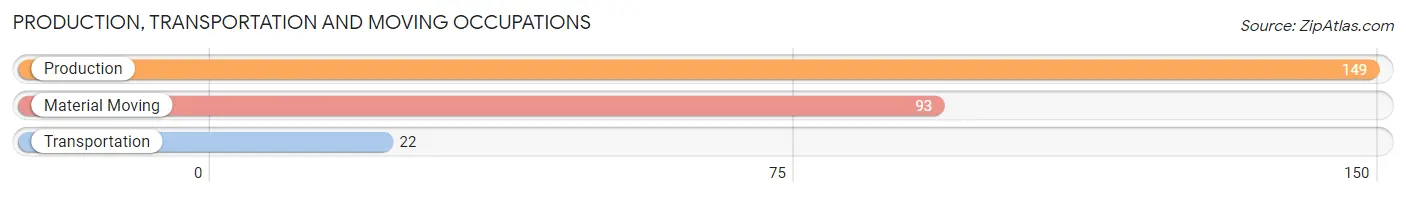
Production, Transportation and Moving Occupations
The most common Production, Transportation and Moving occupations in Catlin are Production (149 | 12.5%), Material Moving (93 | 7.8%), and Transportation (22 | 1.8%).
Production, Transportation and Moving Occupations by Sex
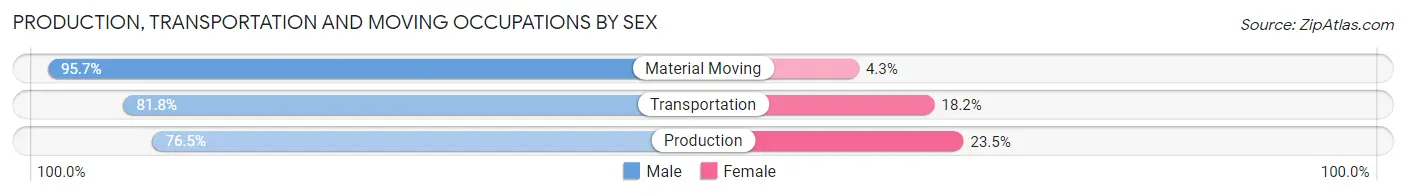
| Occupation | Male | Female |
| Production | 114 (76.5%) | 35 (23.5%) |
| Transportation | 18 (81.8%) | 4 (18.2%) |
| Material Moving | 89 (95.7%) | 4 (4.3%) |
| Total (Category) | 221 (83.7%) | 43 (16.3%) |
| Total (Overall) | 615 (51.7%) | 574 (48.3%) |
Employment Industries by Sex in Catlin
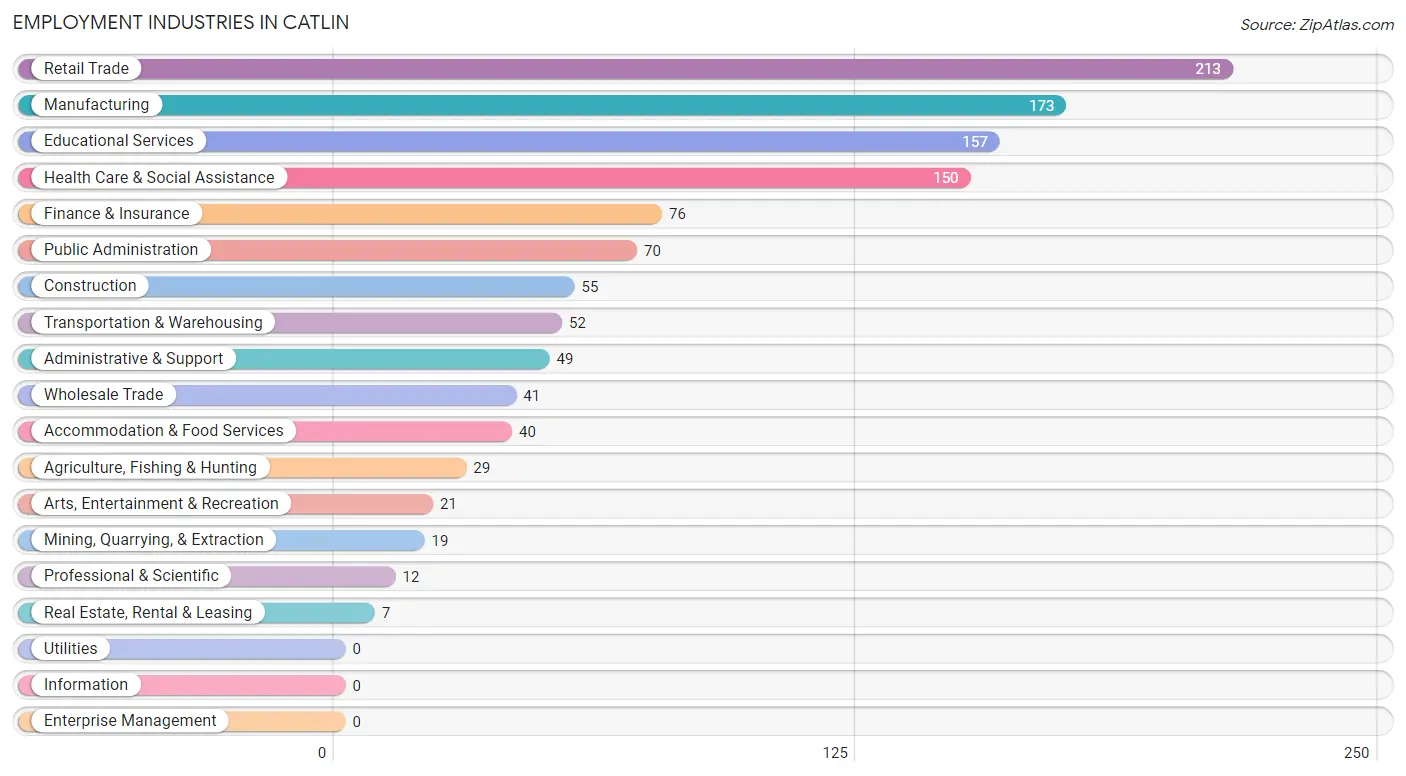
Employment Industries in Catlin
The major employment industries in Catlin include Retail Trade (213 | 17.9%), Manufacturing (173 | 14.5%), Educational Services (157 | 13.2%), Health Care & Social Assistance (150 | 12.6%), and Finance & Insurance (76 | 6.4%).
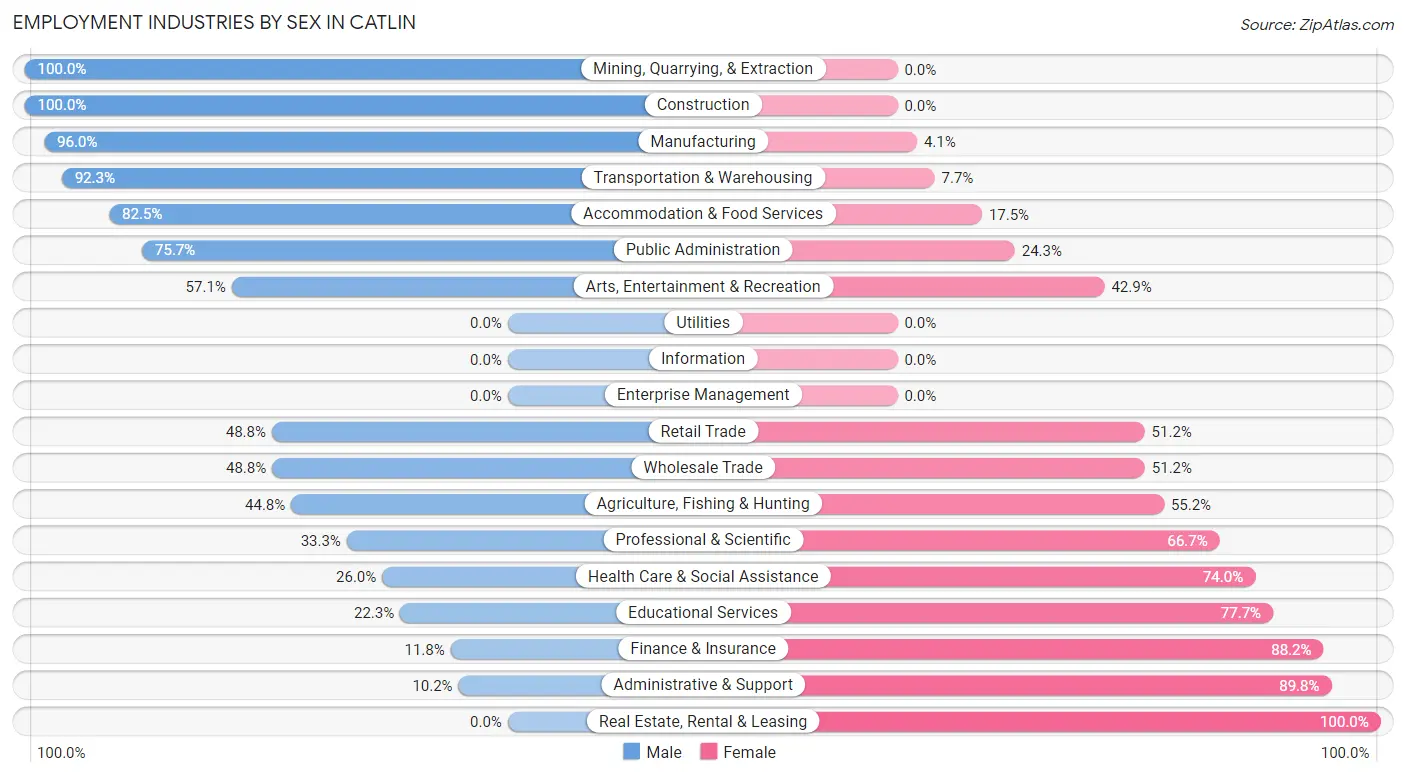
Employment Industries by Sex in Catlin
The Catlin industries that see more men than women are Mining, Quarrying, & Extraction (100.0%), Construction (100.0%), and Manufacturing (96.0%), whereas the industries that tend to have a higher number of women are Real Estate, Rental & Leasing (100.0%), Administrative & Support (89.8%), and Finance & Insurance (88.2%).
| Industry | Male | Female |
| Agriculture, Fishing & Hunting | 13 (44.8%) | 16 (55.2%) |
| Mining, Quarrying, & Extraction | 19 (100.0%) | 0 (0.0%) |
| Construction | 55 (100.0%) | 0 (0.0%) |
| Manufacturing | 166 (96.0%) | 7 (4.1%) |
| Wholesale Trade | 20 (48.8%) | 21 (51.2%) |
| Retail Trade | 104 (48.8%) | 109 (51.2%) |
| Transportation & Warehousing | 48 (92.3%) | 4 (7.7%) |
| Utilities | 0 (0.0%) | 0 (0.0%) |
| Information | 0 (0.0%) | 0 (0.0%) |
| Finance & Insurance | 9 (11.8%) | 67 (88.2%) |
| Real Estate, Rental & Leasing | 0 (0.0%) | 7 (100.0%) |
| Professional & Scientific | 4 (33.3%) | 8 (66.7%) |
| Enterprise Management | 0 (0.0%) | 0 (0.0%) |
| Administrative & Support | 5 (10.2%) | 44 (89.8%) |
| Educational Services | 35 (22.3%) | 122 (77.7%) |
| Health Care & Social Assistance | 39 (26.0%) | 111 (74.0%) |
| Arts, Entertainment & Recreation | 12 (57.1%) | 9 (42.9%) |
| Accommodation & Food Services | 33 (82.5%) | 7 (17.5%) |
| Public Administration | 53 (75.7%) | 17 (24.3%) |
| Total | 615 (51.7%) | 574 (48.3%) |
Education in Catlin
School Enrollment in Catlin
The most common levels of schooling among the 390 students in Catlin are elementary school (97 | 24.9%), middle school (81 | 20.8%), and college / undergraduate (77 | 19.7%).
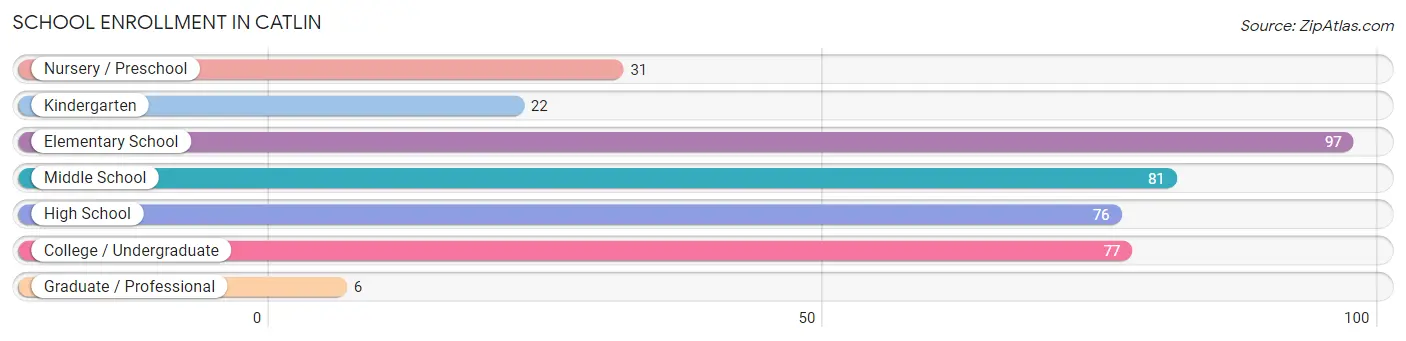
| School Level | # Students | % Students |
| Nursery / Preschool | 31 | 8.0% |
| Kindergarten | 22 | 5.6% |
| Elementary School | 97 | 24.9% |
| Middle School | 81 | 20.8% |
| High School | 76 | 19.5% |
| College / Undergraduate | 77 | 19.7% |
| Graduate / Professional | 6 | 1.5% |
| Total | 390 | 100.0% |
School Enrollment by Age by Funding Source in Catlin
Out of a total of 390 students who are enrolled in schools in Catlin, 27 (6.9%) attend a private institution, while the remaining 363 (93.1%) are enrolled in public schools. The age group of 3 to 4 year olds has the highest likelihood of being enrolled in private schools, with 19 (73.1% in the age bracket) enrolled. Conversely, the age group of 5 to 9 year old has the lowest likelihood of being enrolled in a private school, with 124 (100.0% in the age bracket) attending a public institution.
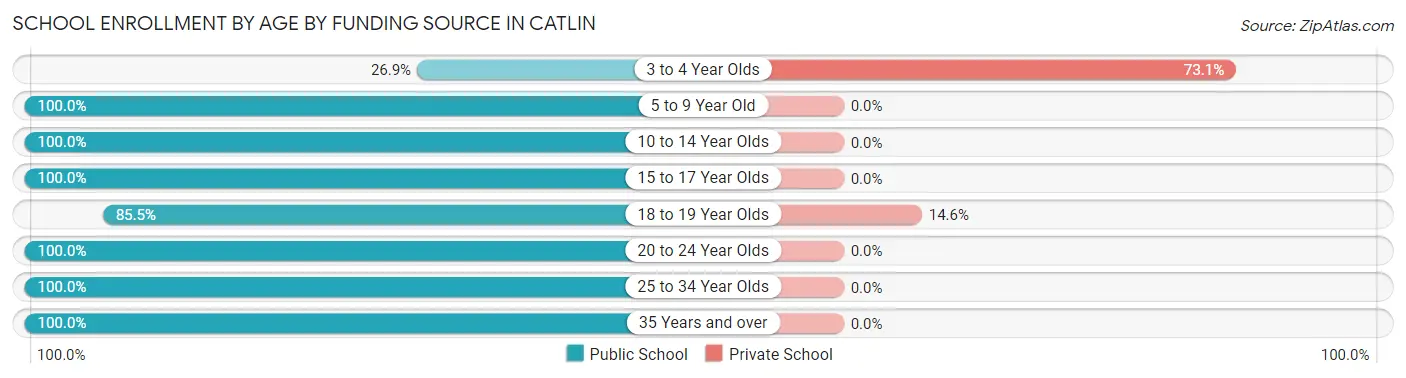
| Age Bracket | Public School | Private School |
| 3 to 4 Year Olds | 7 (26.9%) | 19 (73.1%) |
| 5 to 9 Year Old | 124 (100.0%) | 0 (0.0%) |
| 10 to 14 Year Olds | 102 (100.0%) | 0 (0.0%) |
| 15 to 17 Year Olds | 45 (100.0%) | 0 (0.0%) |
| 18 to 19 Year Olds | 47 (85.5%) | 8 (14.5%) |
| 20 to 24 Year Olds | 10 (100.0%) | 0 (0.0%) |
| 25 to 34 Year Olds | 16 (100.0%) | 0 (0.0%) |
| 35 Years and over | 12 (100.0%) | 0 (0.0%) |
| Total | 363 (93.1%) | 27 (6.9%) |
Educational Attainment by Field of Study in Catlin
Education (99 | 28.3%), arts & humanities (54 | 15.4%), business (50 | 14.3%), science & technology (36 | 10.3%), and communications (26 | 7.4%) are the most common fields of study among 350 individuals in Catlin who have obtained a bachelor's degree or higher.
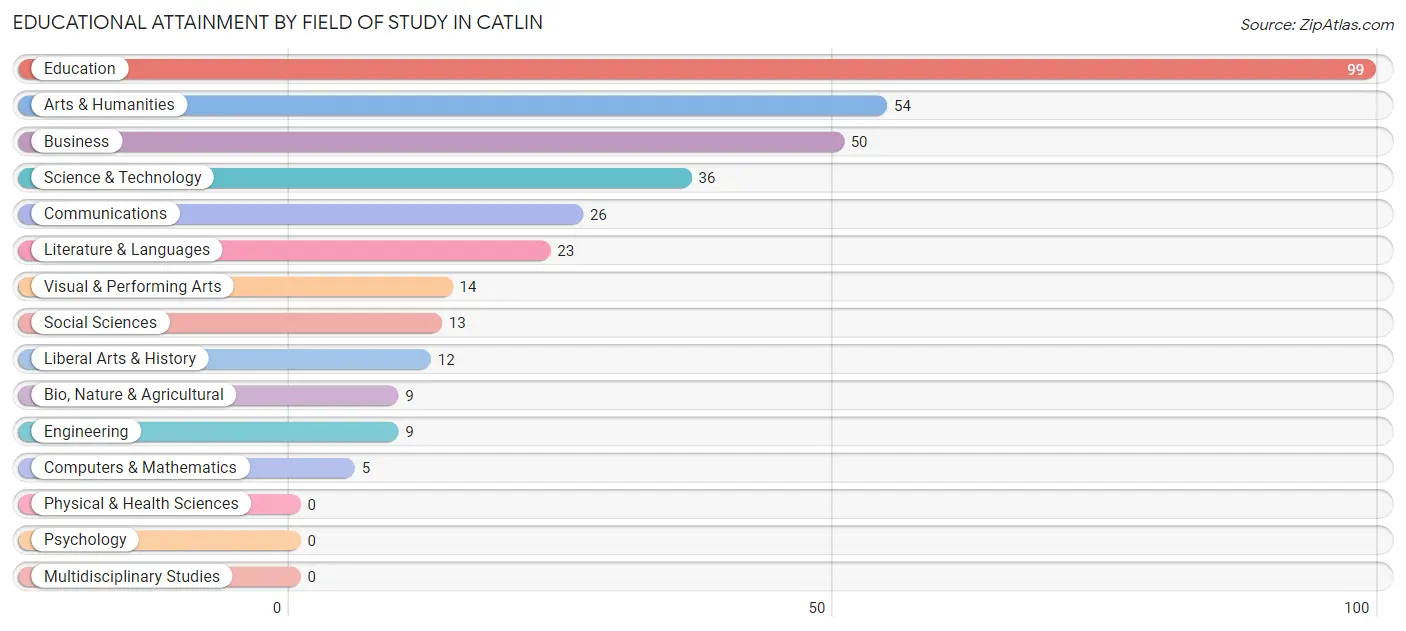
| Field of Study | # Graduates | % Graduates |
| Computers & Mathematics | 5 | 1.4% |
| Bio, Nature & Agricultural | 9 | 2.6% |
| Physical & Health Sciences | 0 | 0.0% |
| Psychology | 0 | 0.0% |
| Social Sciences | 13 | 3.7% |
| Engineering | 9 | 2.6% |
| Multidisciplinary Studies | 0 | 0.0% |
| Science & Technology | 36 | 10.3% |
| Business | 50 | 14.3% |
| Education | 99 | 28.3% |
| Literature & Languages | 23 | 6.6% |
| Liberal Arts & History | 12 | 3.4% |
| Visual & Performing Arts | 14 | 4.0% |
| Communications | 26 | 7.4% |
| Arts & Humanities | 54 | 15.4% |
| Total | 350 | 100.0% |
Transportation & Commute in Catlin
Vehicle Availability by Sex in Catlin
The most prevalent vehicle ownership categories in Catlin are males with 2 vehicles (214, accounting for 35.0%) and females with 2 vehicles (224, making up 37.3%).
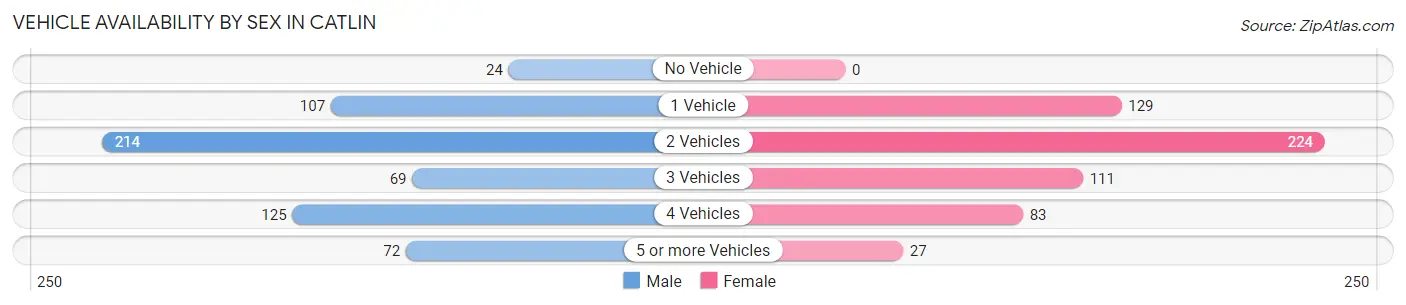
| Vehicles Available | Male | Female |
| No Vehicle | 24 (3.9%) | 0 (0.0%) |
| 1 Vehicle | 107 (17.5%) | 129 (22.5%) |
| 2 Vehicles | 214 (35.0%) | 224 (39.0%) |
| 3 Vehicles | 69 (11.3%) | 111 (19.3%) |
| 4 Vehicles | 125 (20.5%) | 83 (14.5%) |
| 5 or more Vehicles | 72 (11.8%) | 27 (4.7%) |
| Total | 611 (100.0%) | 574 (100.0%) |
Commute Time in Catlin
The most frequently occuring commute durations in Catlin are 10 to 14 minutes (257 commuters, 23.3%), 15 to 19 minutes (253 commuters, 23.0%), and 20 to 24 minutes (214 commuters, 19.4%).
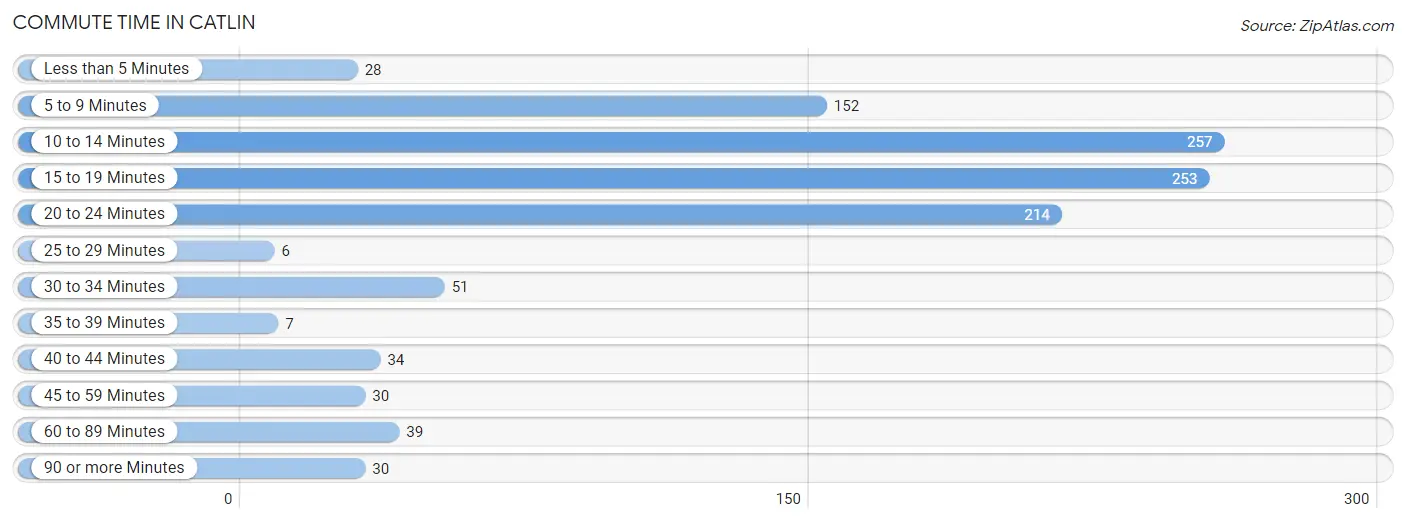
| Commute Time | # Commuters | % Commuters |
| Less than 5 Minutes | 28 | 2.5% |
| 5 to 9 Minutes | 152 | 13.8% |
| 10 to 14 Minutes | 257 | 23.3% |
| 15 to 19 Minutes | 253 | 23.0% |
| 20 to 24 Minutes | 214 | 19.4% |
| 25 to 29 Minutes | 6 | 0.5% |
| 30 to 34 Minutes | 51 | 4.6% |
| 35 to 39 Minutes | 7 | 0.6% |
| 40 to 44 Minutes | 34 | 3.1% |
| 45 to 59 Minutes | 30 | 2.7% |
| 60 to 89 Minutes | 39 | 3.5% |
| 90 or more Minutes | 30 | 2.7% |
Commute Time by Sex in Catlin
The most common commute times in Catlin are 10 to 14 minutes (124 commuters, 21.8%) for males and 15 to 19 minutes (151 commuters, 28.4%) for females.
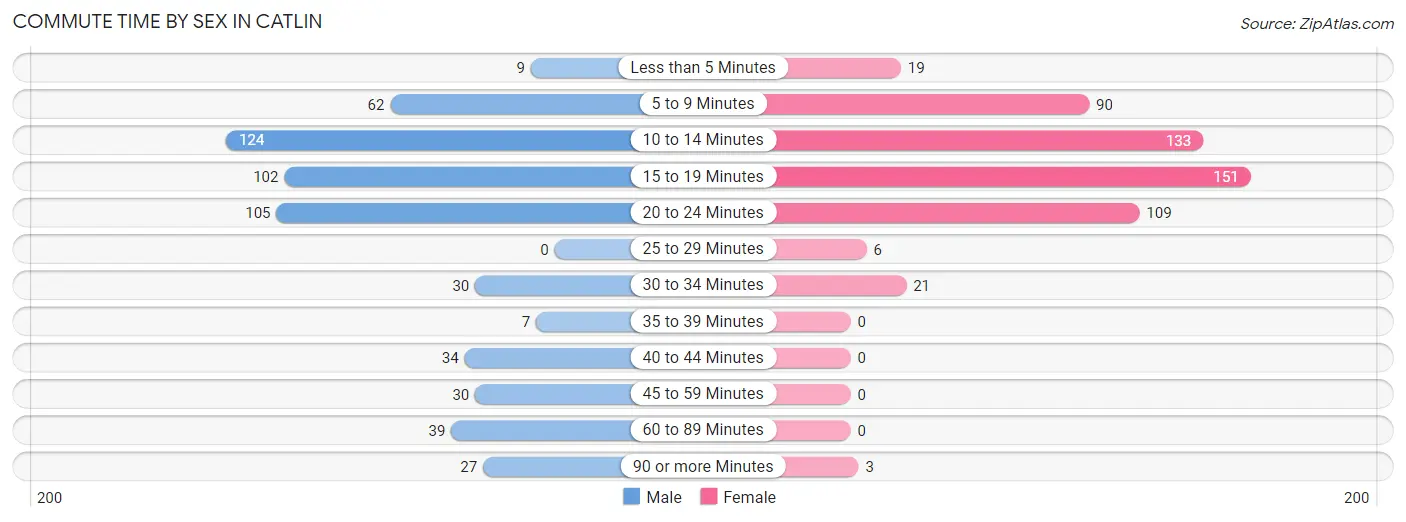
| Commute Time | Male | Female |
| Less than 5 Minutes | 9 (1.6%) | 19 (3.6%) |
| 5 to 9 Minutes | 62 (10.9%) | 90 (16.9%) |
| 10 to 14 Minutes | 124 (21.8%) | 133 (25.0%) |
| 15 to 19 Minutes | 102 (17.9%) | 151 (28.4%) |
| 20 to 24 Minutes | 105 (18.4%) | 109 (20.5%) |
| 25 to 29 Minutes | 0 (0.0%) | 6 (1.1%) |
| 30 to 34 Minutes | 30 (5.3%) | 21 (4.0%) |
| 35 to 39 Minutes | 7 (1.2%) | 0 (0.0%) |
| 40 to 44 Minutes | 34 (6.0%) | 0 (0.0%) |
| 45 to 59 Minutes | 30 (5.3%) | 0 (0.0%) |
| 60 to 89 Minutes | 39 (6.9%) | 0 (0.0%) |
| 90 or more Minutes | 27 (4.8%) | 3 (0.6%) |
Time of Departure to Work by Sex in Catlin
The most frequent times of departure to work in Catlin are 12:00 PM to 3:59 PM (163, 28.6%) for males and 8:00 AM to 8:29 AM (130, 24.4%) for females.
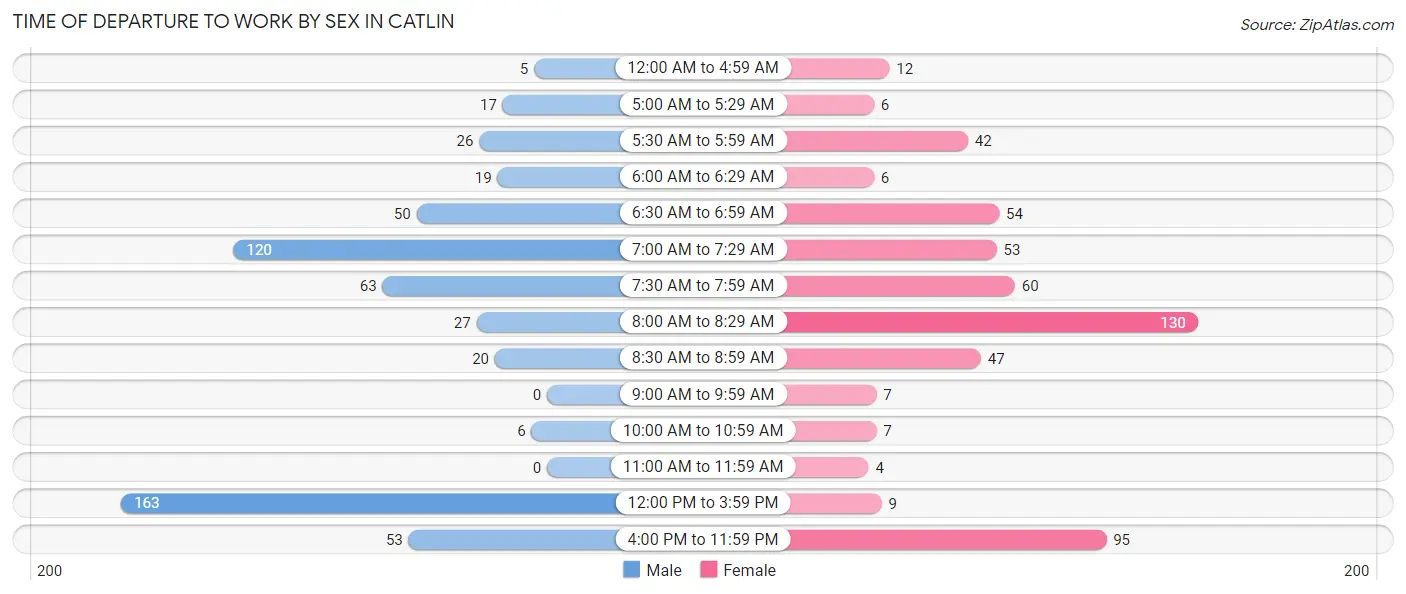
| Time of Departure | Male | Female |
| 12:00 AM to 4:59 AM | 5 (0.9%) | 12 (2.3%) |
| 5:00 AM to 5:29 AM | 17 (3.0%) | 6 (1.1%) |
| 5:30 AM to 5:59 AM | 26 (4.6%) | 42 (7.9%) |
| 6:00 AM to 6:29 AM | 19 (3.3%) | 6 (1.1%) |
| 6:30 AM to 6:59 AM | 50 (8.8%) | 54 (10.2%) |
| 7:00 AM to 7:29 AM | 120 (21.1%) | 53 (10.0%) |
| 7:30 AM to 7:59 AM | 63 (11.1%) | 60 (11.3%) |
| 8:00 AM to 8:29 AM | 27 (4.8%) | 130 (24.4%) |
| 8:30 AM to 8:59 AM | 20 (3.5%) | 47 (8.8%) |
| 9:00 AM to 9:59 AM | 0 (0.0%) | 7 (1.3%) |
| 10:00 AM to 10:59 AM | 6 (1.1%) | 7 (1.3%) |
| 11:00 AM to 11:59 AM | 0 (0.0%) | 4 (0.7%) |
| 12:00 PM to 3:59 PM | 163 (28.6%) | 9 (1.7%) |
| 4:00 PM to 11:59 PM | 53 (9.3%) | 95 (17.9%) |
| Total | 569 (100.0%) | 532 (100.0%) |
Housing Occupancy in Catlin
Occupancy by Ownership in Catlin
Of the total 966 dwellings in Catlin, owner-occupied units account for 691 (71.5%), while renter-occupied units make up 275 (28.5%).
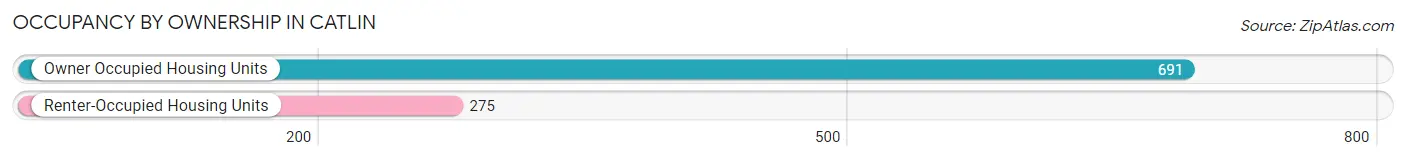
| Occupancy | # Housing Units | % Housing Units |
| Owner Occupied Housing Units | 691 | 71.5% |
| Renter-Occupied Housing Units | 275 | 28.5% |
| Total Occupied Housing Units | 966 | 100.0% |
Occupancy by Household Size in Catlin
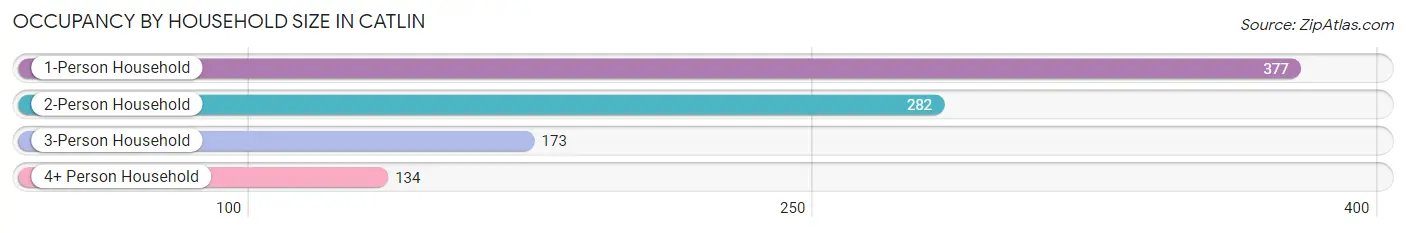
| Household Size | # Housing Units | % Housing Units |
| 1-Person Household | 377 | 39.0% |
| 2-Person Household | 282 | 29.2% |
| 3-Person Household | 173 | 17.9% |
| 4+ Person Household | 134 | 13.9% |
| Total Housing Units | 966 | 100.0% |
Occupancy by Ownership by Household Size in Catlin
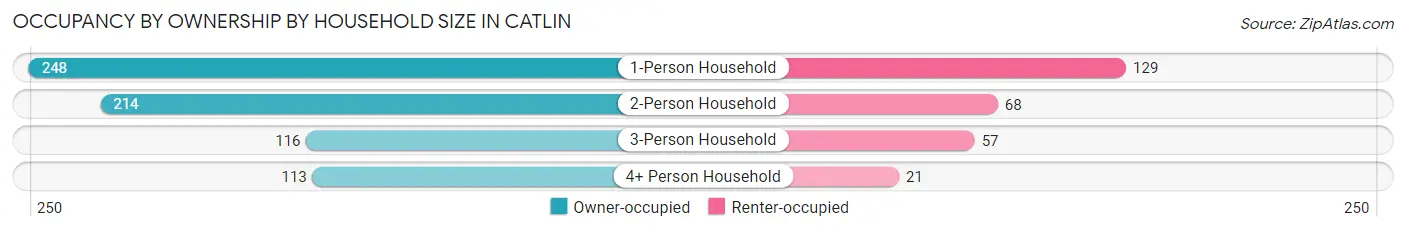
| Household Size | Owner-occupied | Renter-occupied |
| 1-Person Household | 248 (65.8%) | 129 (34.2%) |
| 2-Person Household | 214 (75.9%) | 68 (24.1%) |
| 3-Person Household | 116 (67.0%) | 57 (33.0%) |
| 4+ Person Household | 113 (84.3%) | 21 (15.7%) |
| Total Housing Units | 691 (71.5%) | 275 (28.5%) |
Occupancy by Educational Attainment in Catlin
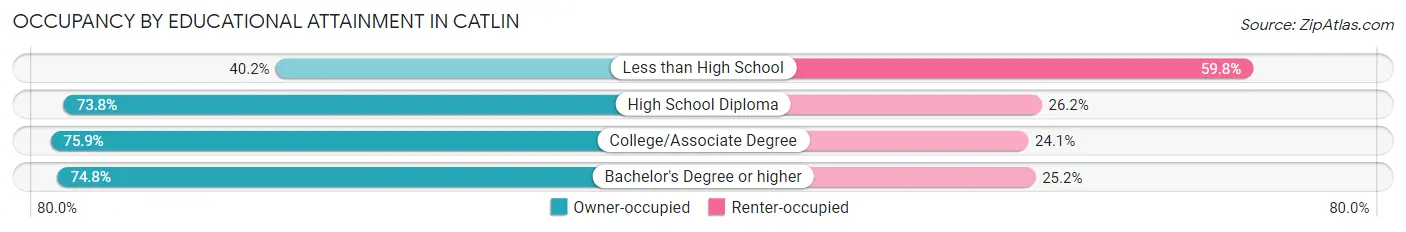
| Household Size | Owner-occupied | Renter-occupied |
| Less than High School | 37 (40.2%) | 55 (59.8%) |
| High School Diploma | 239 (73.8%) | 85 (26.2%) |
| College/Associate Degree | 252 (75.9%) | 80 (24.1%) |
| Bachelor's Degree or higher | 163 (74.8%) | 55 (25.2%) |
Occupancy by Age of Householder in Catlin
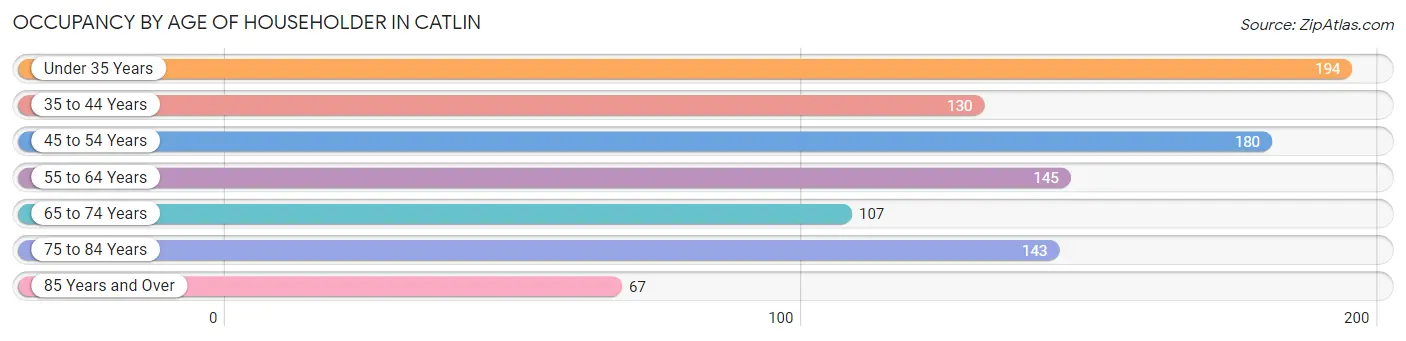
| Age Bracket | # Households | % Households |
| Under 35 Years | 194 | 20.1% |
| 35 to 44 Years | 130 | 13.5% |
| 45 to 54 Years | 180 | 18.6% |
| 55 to 64 Years | 145 | 15.0% |
| 65 to 74 Years | 107 | 11.1% |
| 75 to 84 Years | 143 | 14.8% |
| 85 Years and Over | 67 | 6.9% |
| Total | 966 | 100.0% |
Housing Finances in Catlin
Median Income by Occupancy in Catlin
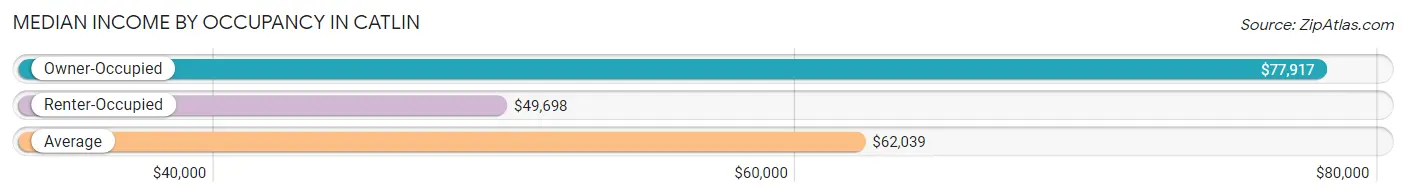
| Occupancy Type | # Households | Median Income |
| Owner-Occupied | 691 (71.5%) | $77,917 |
| Renter-Occupied | 275 (28.5%) | $49,698 |
| Average | 966 (100.0%) | $62,039 |
Occupancy by Householder Income Bracket in Catlin
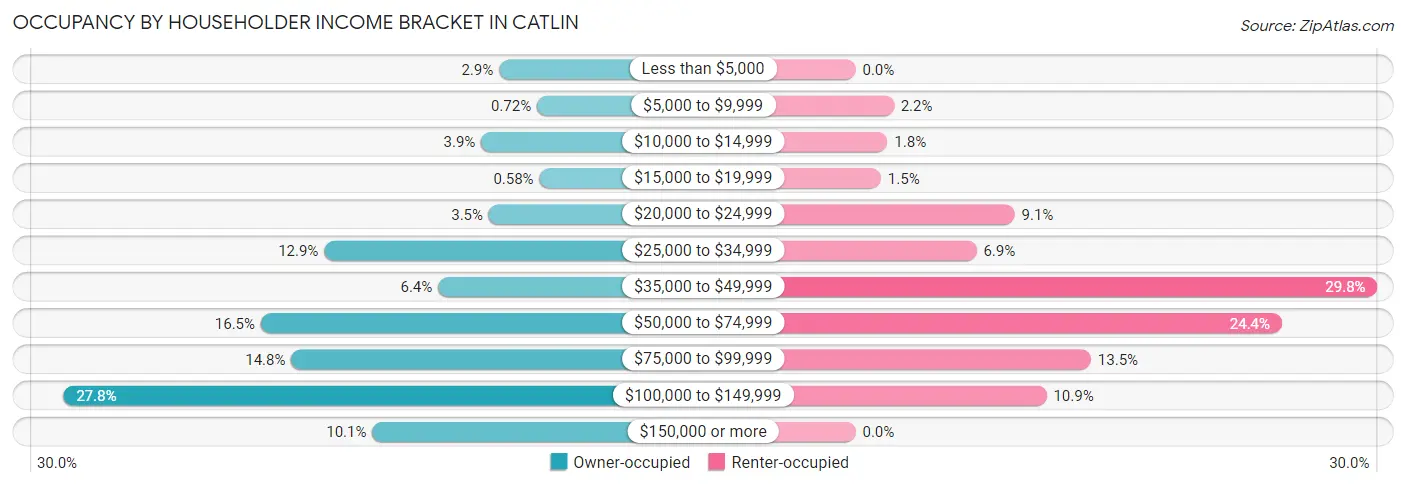
| Income Bracket | Owner-occupied | Renter-occupied |
| Less than $5,000 | 20 (2.9%) | 0 (0.0%) |
| $5,000 to $9,999 | 5 (0.7%) | 6 (2.2%) |
| $10,000 to $14,999 | 27 (3.9%) | 5 (1.8%) |
| $15,000 to $19,999 | 4 (0.6%) | 4 (1.5%) |
| $20,000 to $24,999 | 24 (3.5%) | 25 (9.1%) |
| $25,000 to $34,999 | 89 (12.9%) | 19 (6.9%) |
| $35,000 to $49,999 | 44 (6.4%) | 82 (29.8%) |
| $50,000 to $74,999 | 114 (16.5%) | 67 (24.4%) |
| $75,000 to $99,999 | 102 (14.8%) | 37 (13.5%) |
| $100,000 to $149,999 | 192 (27.8%) | 30 (10.9%) |
| $150,000 or more | 70 (10.1%) | 0 (0.0%) |
| Total | 691 (100.0%) | 275 (100.0%) |
Monthly Housing Cost Tiers in Catlin
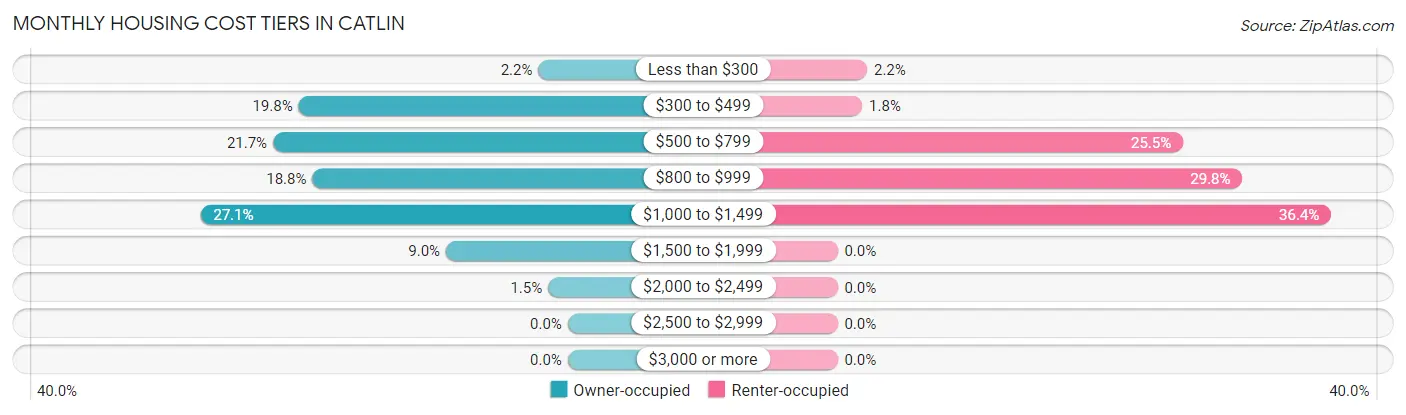
| Monthly Cost | Owner-occupied | Renter-occupied |
| Less than $300 | 15 (2.2%) | 6 (2.2%) |
| $300 to $499 | 137 (19.8%) | 5 (1.8%) |
| $500 to $799 | 150 (21.7%) | 70 (25.5%) |
| $800 to $999 | 130 (18.8%) | 82 (29.8%) |
| $1,000 to $1,499 | 187 (27.1%) | 100 (36.4%) |
| $1,500 to $1,999 | 62 (9.0%) | 0 (0.0%) |
| $2,000 to $2,499 | 10 (1.5%) | 0 (0.0%) |
| $2,500 to $2,999 | 0 (0.0%) | 0 (0.0%) |
| $3,000 or more | 0 (0.0%) | 0 (0.0%) |
| Total | 691 (100.0%) | 275 (100.0%) |
Physical Housing Characteristics in Catlin
Housing Structures in Catlin
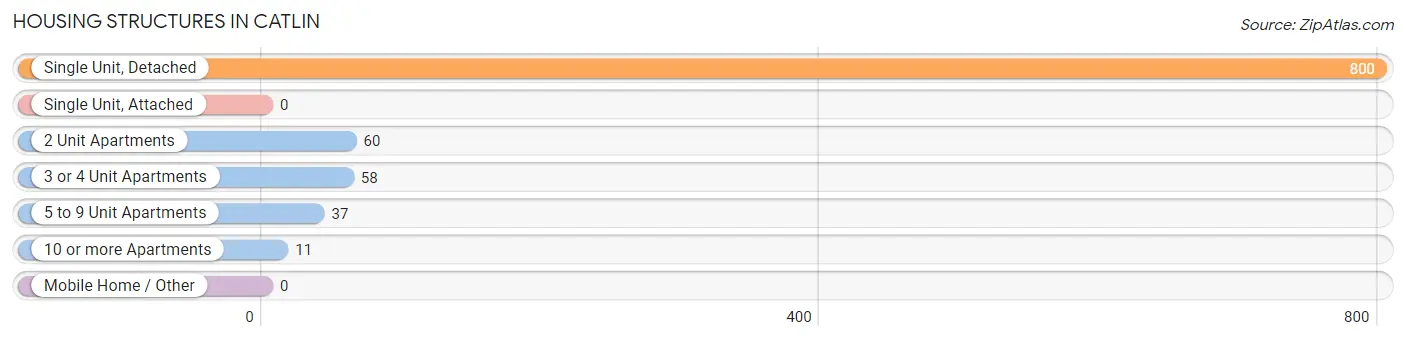
| Structure Type | # Housing Units | % Housing Units |
| Single Unit, Detached | 800 | 82.8% |
| Single Unit, Attached | 0 | 0.0% |
| 2 Unit Apartments | 60 | 6.2% |
| 3 or 4 Unit Apartments | 58 | 6.0% |
| 5 to 9 Unit Apartments | 37 | 3.8% |
| 10 or more Apartments | 11 | 1.1% |
| Mobile Home / Other | 0 | 0.0% |
| Total | 966 | 100.0% |
Housing Structures by Occupancy in Catlin
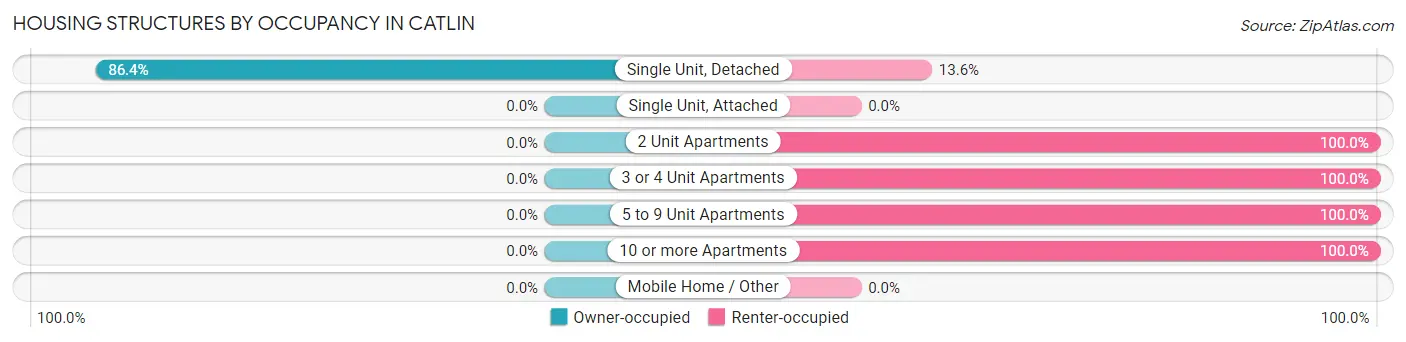
| Structure Type | Owner-occupied | Renter-occupied |
| Single Unit, Detached | 691 (86.4%) | 109 (13.6%) |
| Single Unit, Attached | 0 (0.0%) | 0 (0.0%) |
| 2 Unit Apartments | 0 (0.0%) | 60 (100.0%) |
| 3 or 4 Unit Apartments | 0 (0.0%) | 58 (100.0%) |
| 5 to 9 Unit Apartments | 0 (0.0%) | 37 (100.0%) |
| 10 or more Apartments | 0 (0.0%) | 11 (100.0%) |
| Mobile Home / Other | 0 (0.0%) | 0 (0.0%) |
| Total | 691 (71.5%) | 275 (28.5%) |
Housing Structures by Number of Rooms in Catlin
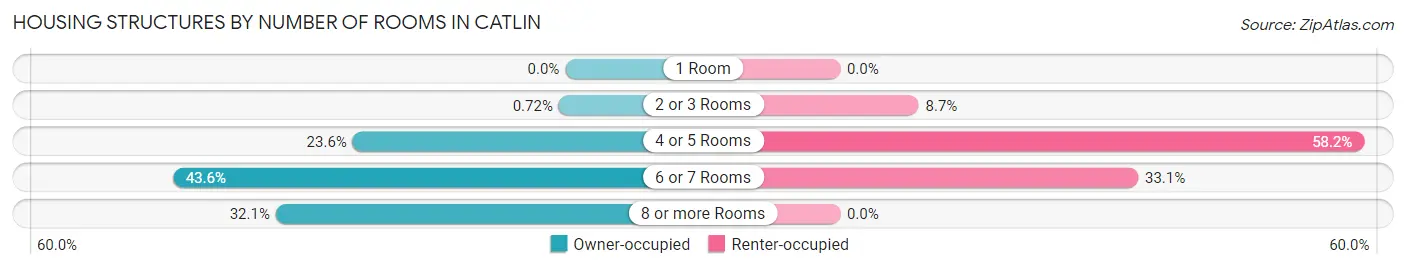
| Number of Rooms | Owner-occupied | Renter-occupied |
| 1 Room | 0 (0.0%) | 0 (0.0%) |
| 2 or 3 Rooms | 5 (0.7%) | 24 (8.7%) |
| 4 or 5 Rooms | 163 (23.6%) | 160 (58.2%) |
| 6 or 7 Rooms | 301 (43.6%) | 91 (33.1%) |
| 8 or more Rooms | 222 (32.1%) | 0 (0.0%) |
| Total | 691 (100.0%) | 275 (100.0%) |
Housing Structure by Heating Type in Catlin
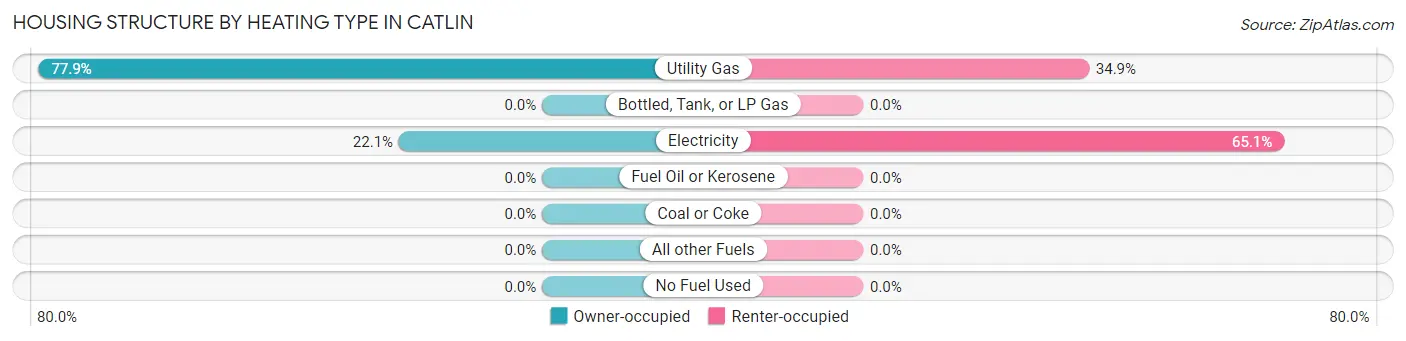
| Heating Type | Owner-occupied | Renter-occupied |
| Utility Gas | 538 (77.9%) | 96 (34.9%) |
| Bottled, Tank, or LP Gas | 0 (0.0%) | 0 (0.0%) |
| Electricity | 153 (22.1%) | 179 (65.1%) |
| Fuel Oil or Kerosene | 0 (0.0%) | 0 (0.0%) |
| Coal or Coke | 0 (0.0%) | 0 (0.0%) |
| All other Fuels | 0 (0.0%) | 0 (0.0%) |
| No Fuel Used | 0 (0.0%) | 0 (0.0%) |
| Total | 691 (100.0%) | 275 (100.0%) |
Household Vehicle Usage in Catlin
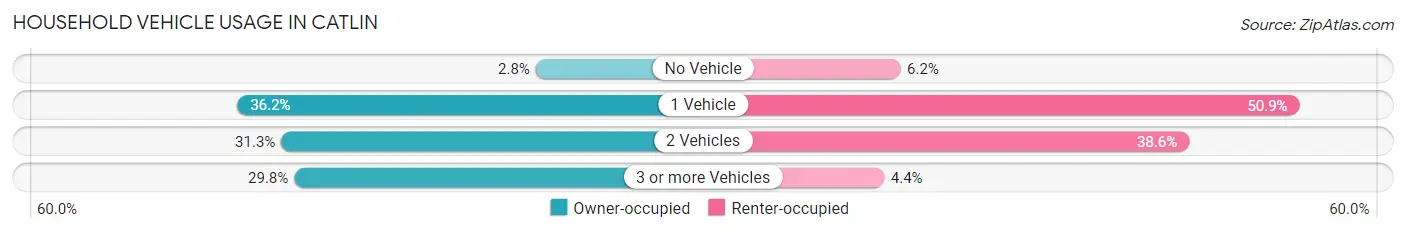
| Vehicles per Household | Owner-occupied | Renter-occupied |
| No Vehicle | 19 (2.8%) | 17 (6.2%) |
| 1 Vehicle | 250 (36.2%) | 140 (50.9%) |
| 2 Vehicles | 216 (31.3%) | 106 (38.6%) |
| 3 or more Vehicles | 206 (29.8%) | 12 (4.4%) |
| Total | 691 (100.0%) | 275 (100.0%) |
Real Estate & Mortgages in Catlin
Real Estate and Mortgage Overview in Catlin
| Characteristic | Without Mortgage | With Mortgage |
| Housing Units | 307 | 384 |
| Median Property Value | $118,800 | $107,800 |
| Median Household Income | $55,750 | $45 |
| Monthly Housing Costs | $502 | $0 |
| Real Estate Taxes | $2,112 | $34 |
Property Value by Mortgage Status in Catlin
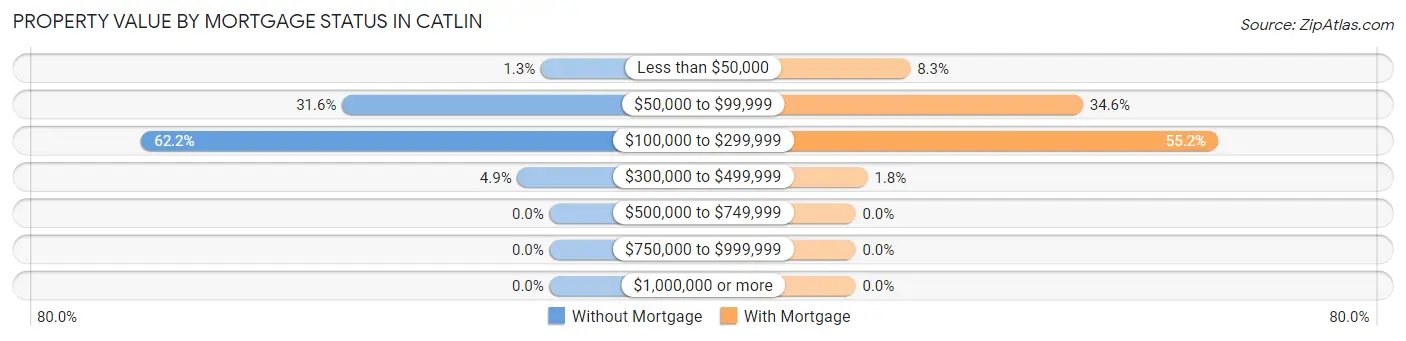
| Property Value | Without Mortgage | With Mortgage |
| Less than $50,000 | 4 (1.3%) | 32 (8.3%) |
| $50,000 to $99,999 | 97 (31.6%) | 133 (34.6%) |
| $100,000 to $299,999 | 191 (62.2%) | 212 (55.2%) |
| $300,000 to $499,999 | 15 (4.9%) | 7 (1.8%) |
| $500,000 to $749,999 | 0 (0.0%) | 0 (0.0%) |
| $750,000 to $999,999 | 0 (0.0%) | 0 (0.0%) |
| $1,000,000 or more | 0 (0.0%) | 0 (0.0%) |
| Total | 307 (100.0%) | 384 (100.0%) |
Household Income by Mortgage Status in Catlin
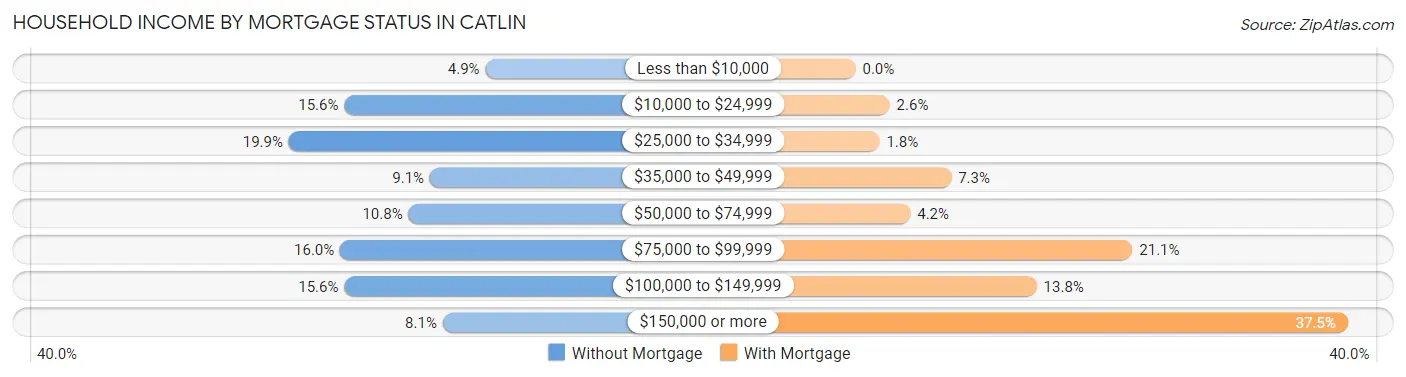
| Household Income | Without Mortgage | With Mortgage |
| Less than $10,000 | 15 (4.9%) | 0 (0.0%) |
| $10,000 to $24,999 | 48 (15.6%) | 10 (2.6%) |
| $25,000 to $34,999 | 61 (19.9%) | 7 (1.8%) |
| $35,000 to $49,999 | 28 (9.1%) | 28 (7.3%) |
| $50,000 to $74,999 | 33 (10.7%) | 16 (4.2%) |
| $75,000 to $99,999 | 49 (16.0%) | 81 (21.1%) |
| $100,000 to $149,999 | 48 (15.6%) | 53 (13.8%) |
| $150,000 or more | 25 (8.1%) | 144 (37.5%) |
| Total | 307 (100.0%) | 384 (100.0%) |
Property Value to Household Income Ratio in Catlin
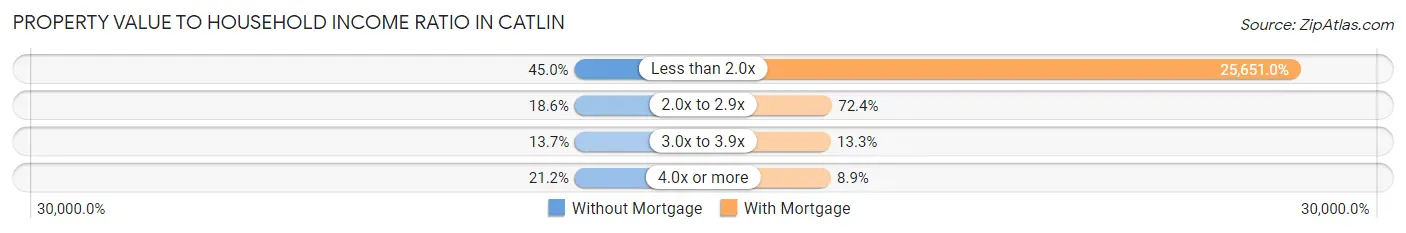
| Value-to-Income Ratio | Without Mortgage | With Mortgage |
| Less than 2.0x | 138 (45.0%) | 98,500 (25,651.0%) |
| 2.0x to 2.9x | 57 (18.6%) | 278 (72.4%) |
| 3.0x to 3.9x | 42 (13.7%) | 51 (13.3%) |
| 4.0x or more | 65 (21.2%) | 34 (8.8%) |
| Total | 307 (100.0%) | 384 (100.0%) |
Real Estate Taxes by Mortgage Status in Catlin
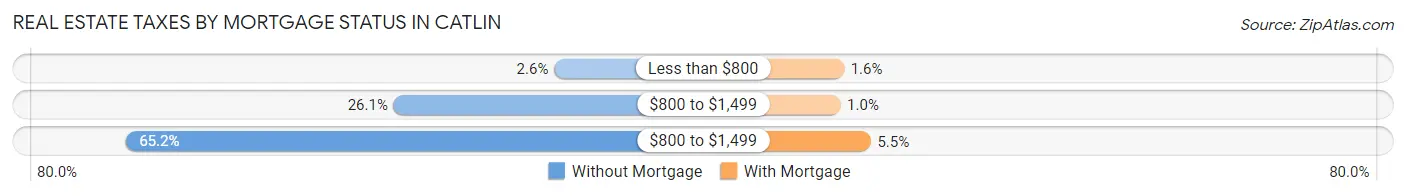
| Property Taxes | Without Mortgage | With Mortgage |
| Less than $800 | 8 (2.6%) | 6 (1.6%) |
| $800 to $1,499 | 80 (26.1%) | 4 (1.0%) |
| $800 to $1,499 | 200 (65.1%) | 21 (5.5%) |
| Total | 307 (100.0%) | 384 (100.0%) |
Health & Disability in Catlin
Health Insurance Coverage by Age in Catlin
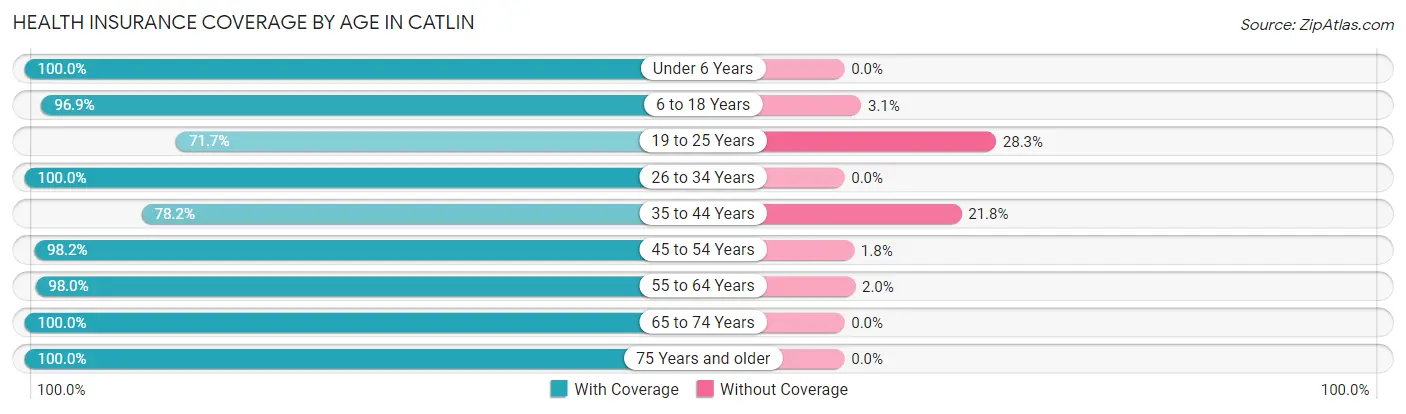
| Age Bracket | With Coverage | Without Coverage |
| Under 6 Years | 59 (100.0%) | 0 (0.0%) |
| 6 to 18 Years | 311 (96.9%) | 10 (3.1%) |
| 19 to 25 Years | 165 (71.7%) | 65 (28.3%) |
| 26 to 34 Years | 291 (100.0%) | 0 (0.0%) |
| 35 to 44 Years | 172 (78.2%) | 48 (21.8%) |
| 45 to 54 Years | 274 (98.2%) | 5 (1.8%) |
| 55 to 64 Years | 294 (98.0%) | 6 (2.0%) |
| 65 to 74 Years | 139 (100.0%) | 0 (0.0%) |
| 75 Years and older | 252 (100.0%) | 0 (0.0%) |
| Total | 1,957 (93.6%) | 134 (6.4%) |
Health Insurance Coverage by Citizenship Status in Catlin
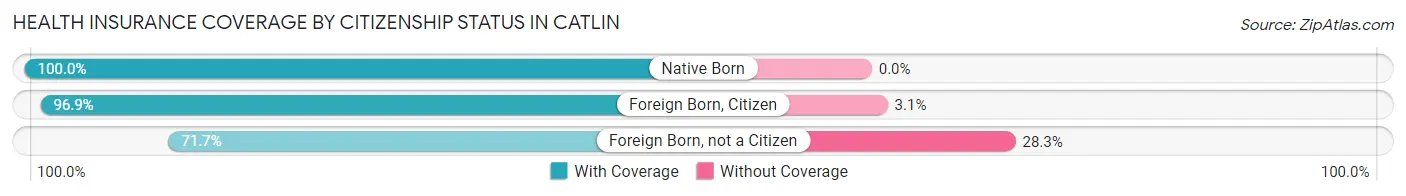
| Citizenship Status | With Coverage | Without Coverage |
| Native Born | 59 (100.0%) | 0 (0.0%) |
| Foreign Born, Citizen | 311 (96.9%) | 10 (3.1%) |
| Foreign Born, not a Citizen | 165 (71.7%) | 65 (28.3%) |
Health Insurance Coverage by Household Income in Catlin
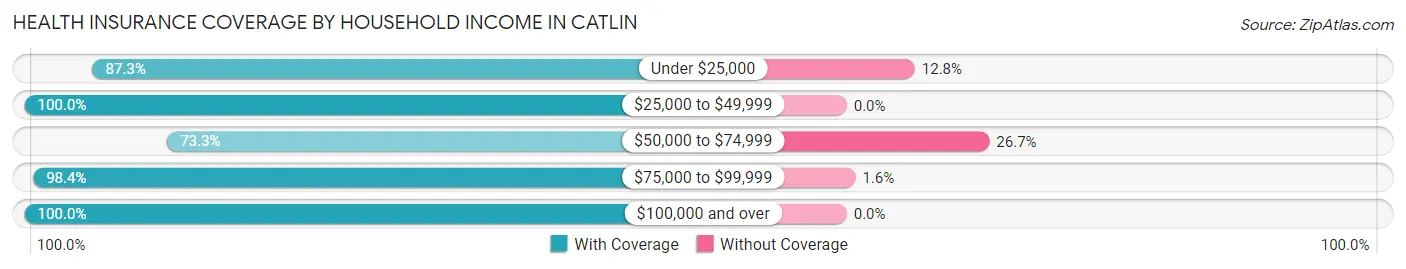
| Household Income | With Coverage | Without Coverage |
| Under $25,000 | 130 (87.3%) | 19 (12.8%) |
| $25,000 to $49,999 | 313 (100.0%) | 0 (0.0%) |
| $50,000 to $74,999 | 299 (73.3%) | 109 (26.7%) |
| $75,000 to $99,999 | 365 (98.4%) | 6 (1.6%) |
| $100,000 and over | 850 (100.0%) | 0 (0.0%) |
Public vs Private Health Insurance Coverage by Age in Catlin
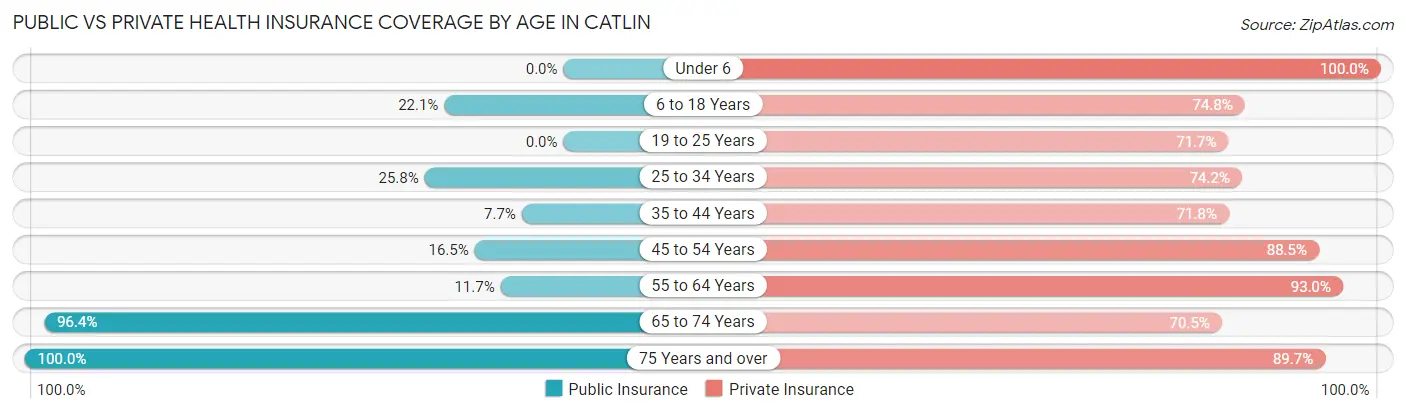
| Age Bracket | Public Insurance | Private Insurance |
| Under 6 | 0 (0.0%) | 59 (100.0%) |
| 6 to 18 Years | 71 (22.1%) | 240 (74.8%) |
| 19 to 25 Years | 0 (0.0%) | 165 (71.7%) |
| 25 to 34 Years | 75 (25.8%) | 216 (74.2%) |
| 35 to 44 Years | 17 (7.7%) | 158 (71.8%) |
| 45 to 54 Years | 46 (16.5%) | 247 (88.5%) |
| 55 to 64 Years | 35 (11.7%) | 279 (93.0%) |
| 65 to 74 Years | 134 (96.4%) | 98 (70.5%) |
| 75 Years and over | 252 (100.0%) | 226 (89.7%) |
| Total | 630 (30.1%) | 1,688 (80.7%) |
Disability Status by Sex by Age in Catlin
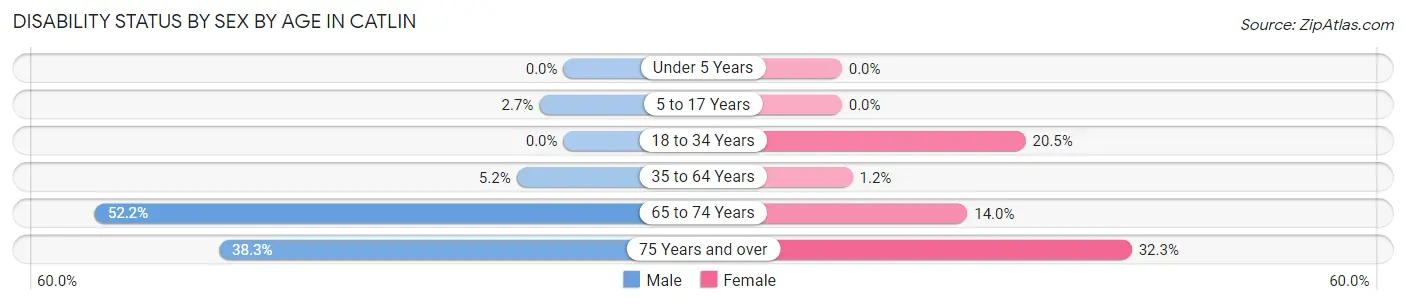
| Age Bracket | Male | Female |
| Under 5 Years | 0 (0.0%) | 0 (0.0%) |
| 5 to 17 Years | 5 (2.7%) | 0 (0.0%) |
| 18 to 34 Years | 0 (0.0%) | 44 (20.5%) |
| 35 to 64 Years | 20 (5.2%) | 5 (1.2%) |
| 65 to 74 Years | 24 (52.2%) | 13 (14.0%) |
| 75 Years and over | 23 (38.3%) | 62 (32.3%) |
Disability Class by Sex by Age in Catlin
Disability Class: Hearing Difficulty
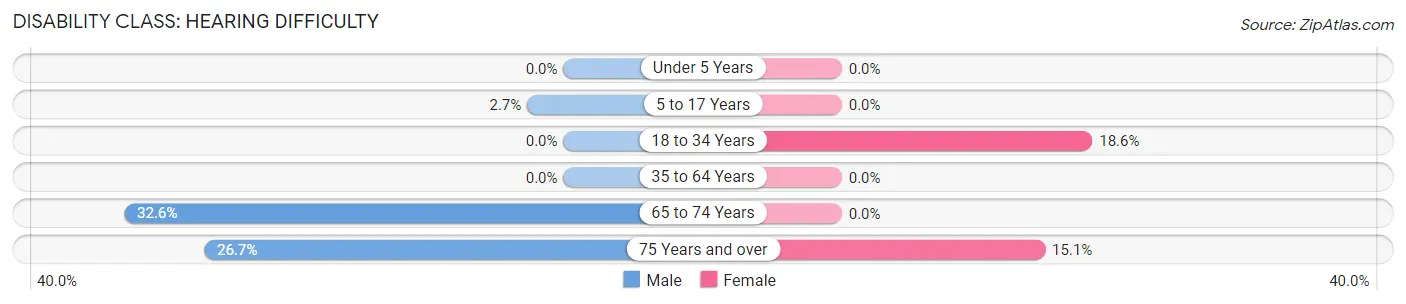
| Age Bracket | Male | Female |
| Under 5 Years | 0 (0.0%) | 0 (0.0%) |
| 5 to 17 Years | 5 (2.7%) | 0 (0.0%) |
| 18 to 34 Years | 0 (0.0%) | 40 (18.6%) |
| 35 to 64 Years | 0 (0.0%) | 0 (0.0%) |
| 65 to 74 Years | 15 (32.6%) | 0 (0.0%) |
| 75 Years and over | 16 (26.7%) | 29 (15.1%) |
Disability Class: Vision Difficulty
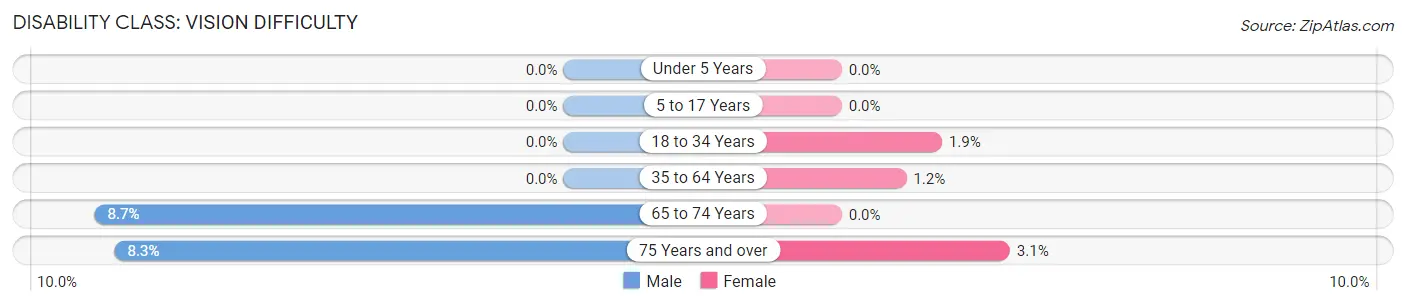
| Age Bracket | Male | Female |
| Under 5 Years | 0 (0.0%) | 0 (0.0%) |
| 5 to 17 Years | 0 (0.0%) | 0 (0.0%) |
| 18 to 34 Years | 0 (0.0%) | 4 (1.9%) |
| 35 to 64 Years | 0 (0.0%) | 5 (1.2%) |
| 65 to 74 Years | 4 (8.7%) | 0 (0.0%) |
| 75 Years and over | 5 (8.3%) | 6 (3.1%) |
Disability Class: Cognitive Difficulty
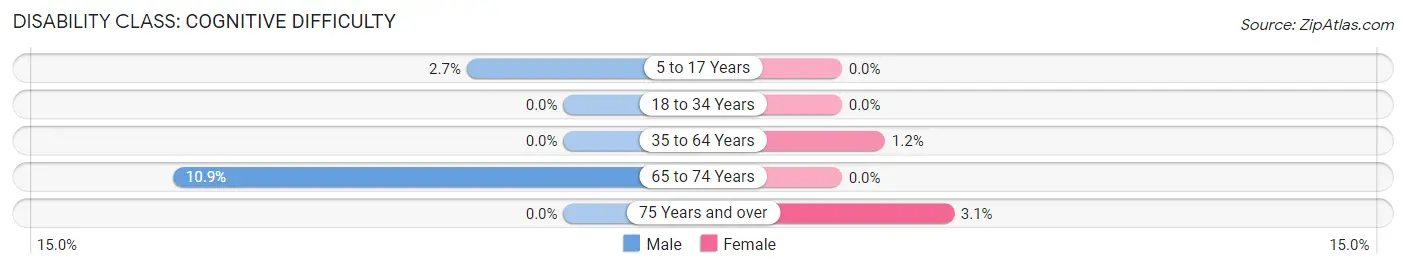
| Age Bracket | Male | Female |
| 5 to 17 Years | 5 (2.7%) | 0 (0.0%) |
| 18 to 34 Years | 0 (0.0%) | 0 (0.0%) |
| 35 to 64 Years | 0 (0.0%) | 5 (1.2%) |
| 65 to 74 Years | 5 (10.9%) | 0 (0.0%) |
| 75 Years and over | 0 (0.0%) | 6 (3.1%) |
Disability Class: Ambulatory Difficulty
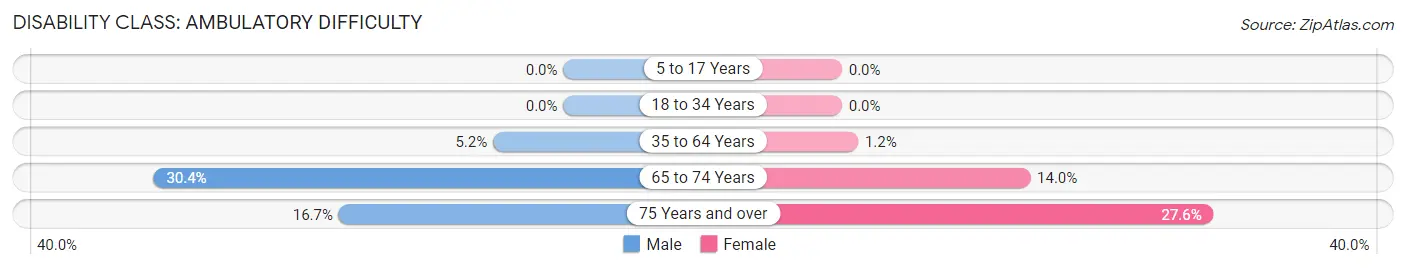
| Age Bracket | Male | Female |
| 5 to 17 Years | 0 (0.0%) | 0 (0.0%) |
| 18 to 34 Years | 0 (0.0%) | 0 (0.0%) |
| 35 to 64 Years | 20 (5.2%) | 5 (1.2%) |
| 65 to 74 Years | 14 (30.4%) | 13 (14.0%) |
| 75 Years and over | 10 (16.7%) | 53 (27.6%) |
Disability Class: Self-Care Difficulty
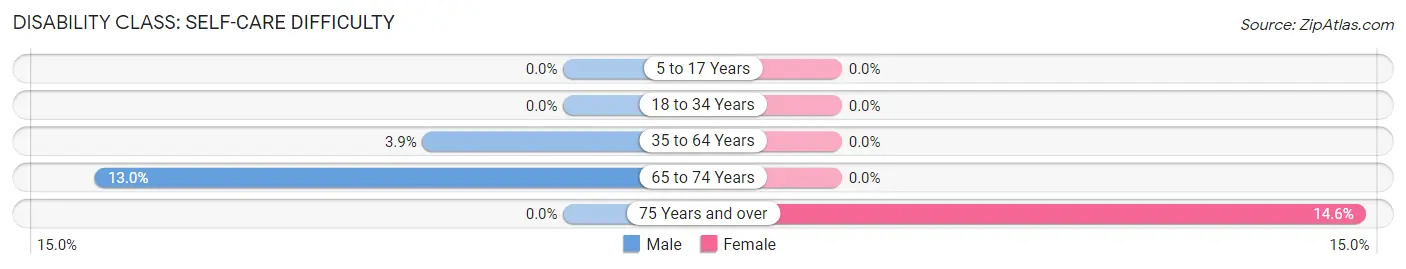
| Age Bracket | Male | Female |
| 5 to 17 Years | 0 (0.0%) | 0 (0.0%) |
| 18 to 34 Years | 0 (0.0%) | 0 (0.0%) |
| 35 to 64 Years | 15 (3.9%) | 0 (0.0%) |
| 65 to 74 Years | 6 (13.0%) | 0 (0.0%) |
| 75 Years and over | 0 (0.0%) | 28 (14.6%) |
Technology Access in Catlin
Computing Device Access in Catlin
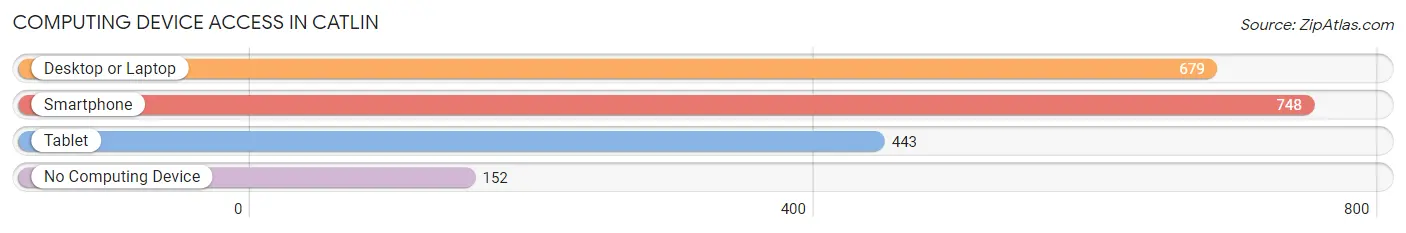
| Device Type | # Households | % Households |
| Desktop or Laptop | 679 | 70.3% |
| Smartphone | 748 | 77.4% |
| Tablet | 443 | 45.9% |
| No Computing Device | 152 | 15.7% |
| Total | 966 | 100.0% |
Internet Access in Catlin
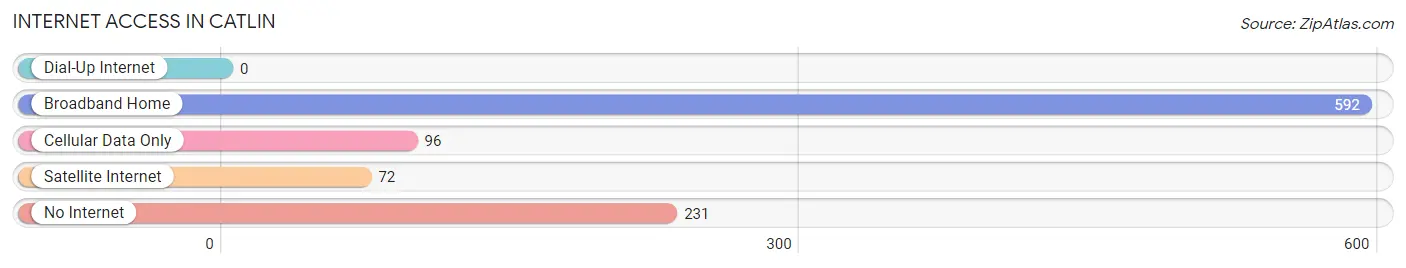
| Internet Type | # Households | % Households |
| Dial-Up Internet | 0 | 0.0% |
| Broadband Home | 592 | 61.3% |
| Cellular Data Only | 96 | 9.9% |
| Satellite Internet | 72 | 7.4% |
| No Internet | 231 | 23.9% |
| Total | 966 | 100.0% |
Catlin Summary
Catlin, Illinois is a small village located in Vermilion County, Illinois. It is situated in the eastern part of the state, about 25 miles south of Champaign and about 50 miles west of Indianapolis, Indiana. The population of Catlin was 1,717 at the 2010 census.
History
Catlin was founded in 1854 by a group of settlers from Catlin, New York. The village was named after the New York town, which was named after George Catlin, a famous painter and explorer. The first settlers in Catlin were mostly farmers, and the village quickly grew to become a thriving agricultural community.
In 1872, the Chicago and Eastern Illinois Railroad was built through Catlin, connecting the village to the larger cities of the Midwest. This allowed for the growth of the village, and by the early 1900s, Catlin had become a bustling small town.
In the early 20th century, Catlin was home to several businesses, including a bank, a hotel, a general store, a blacksmith shop, and a lumberyard. The village also had a post office, a school, and a library.
Geography
Catlin is located in the eastern part of Vermilion County, Illinois. It is situated in the eastern part of the state, about 25 miles south of Champaign and about 50 miles west of Indianapolis, Indiana.
The village is located on the banks of the Vermilion River, which flows through the village. The village is surrounded by rolling hills and farmland.
Economy
Catlin’s economy is largely based on agriculture. The village is home to several farms, which produce a variety of crops, including corn, soybeans, and wheat.
The village also has several small businesses, including a grocery store, a hardware store, a restaurant, and a gas station.
Demographics
As of the 2010 census, the population of Catlin was 1,717. The racial makeup of the village was 97.2% White, 0.7% African American, 0.3% Native American, 0.2% Asian, 0.1% Pacific Islander, 0.3% from other races, and 1.2% from two or more races. Hispanic or Latino of any race were 1.2% of the population.
The median household income in Catlin was $45,938, and the median family income was $51,250. The per capita income for the village was $20,945. About 8.2% of families and 10.2% of the population were below the poverty line, including 14.2% of those under age 18 and 5.2% of those age 65 or over.
Catlin is served by the Catlin Community Unit School District. The village is home to Catlin Elementary School, Catlin Middle School, and Catlin High School. The village also has a public library, the Catlin Public Library.
Common Questions
What is Per Capita Income in Catlin?
Per Capita income in Catlin is $35,304.
What is the Median Family Income in Catlin?
Median Family Income in Catlin is $88,578.
What is the Median Household income in Catlin?
Median Household Income in Catlin is $62,039.
What is Income or Wage Gap in Catlin?
Income or Wage Gap in Catlin is 42.8%.
Women in Catlin earn 57.2 cents for every dollar earned by a man.
What is Inequality or Gini Index in Catlin?
Inequality or Gini Index in Catlin is 0.36.
What is the Total Population of Catlin?
Total Population of Catlin is 2,091.
What is the Total Male Population of Catlin?
Total Male Population of Catlin is 1,050.
What is the Total Female Population of Catlin?
Total Female Population of Catlin is 1,041.
What is the Ratio of Males per 100 Females in Catlin?
There are 100.86 Males per 100 Females in Catlin.
What is the Ratio of Females per 100 Males in Catlin?
There are 99.14 Females per 100 Males in Catlin.
What is the Median Population Age in Catlin?
Median Population Age in Catlin is 42.3 Years.
What is the Average Family Size in Catlin
Average Family Size in Catlin is 2.9 People.
What is the Average Household Size in Catlin
Average Household Size in Catlin is 2.2 People.
How Large is the Labor Force in Catlin?
There are 1,189 People in the Labor Forcein in Catlin.
What is the Percentage of People in the Labor Force in Catlin?
66.3% of People are in the Labor Force in Catlin.