Carrollton, IL Map & Demographics
Carrollton Map
Carrollton Overview
$30,407
PER CAPITA INCOME
$71,033
AVG FAMILY INCOME
$63,026
AVG HOUSEHOLD INCOME
51.4%
WAGE / INCOME GAP [ % ]
48.6¢/ $1
WAGE / INCOME GAP [ $ ]
0.41
INEQUALITY / GINI INDEX
2,546
TOTAL POPULATION
1,316
MALE POPULATION
1,230
FEMALE POPULATION
106.99
MALES / 100 FEMALES
93.47
FEMALES / 100 MALES
38.7
MEDIAN AGE
3.3
AVG FAMILY SIZE
2.6
AVG HOUSEHOLD SIZE
1,279
LABOR FORCE [ PEOPLE ]
65.2%
PERCENT IN LABOR FORCE
1.7%
UNEMPLOYMENT RATE
Carrollton Zip Codes
Carrollton Area Codes
Income in Carrollton
Income Overview in Carrollton
Per Capita Income in Carrollton is $30,407, while median incomes of families and households are $71,033 and $63,026 respectively.
| Characteristic | Number | Measure |
| Per Capita Income | 2,546 | $30,407 |
| Median Family Income | 569 | $71,033 |
| Mean Family Income | 569 | $85,385 |
| Median Household Income | 960 | $63,026 |
| Mean Household Income | 960 | $75,825 |
| Income Deficit | 569 | $0 |
| Wage / Income Gap (%) | 2,546 | 51.43% |
| Wage / Income Gap ($) | 2,546 | 48.57¢ per $1 |
| Gini / Inequality Index | 2,546 | 0.41 |
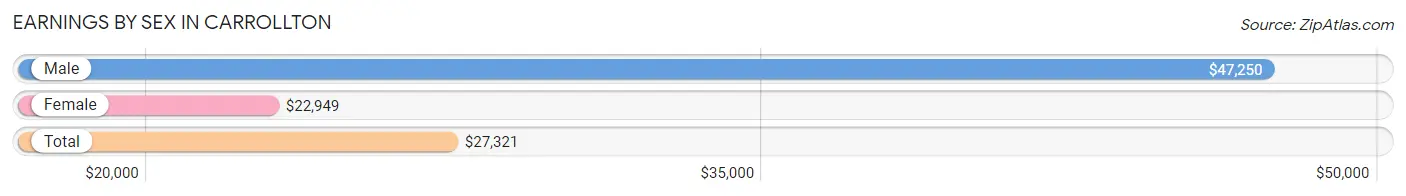
Earnings by Sex in Carrollton
Average Earnings in Carrollton are $27,321, $47,250 for men and $22,949 for women, a difference of 51.4%.
| Sex | Number | Average Earnings |
| Male | 709 (53.3%) | $47,250 |
| Female | 620 (46.7%) | $22,949 |
| Total | 1,329 (100.0%) | $27,321 |
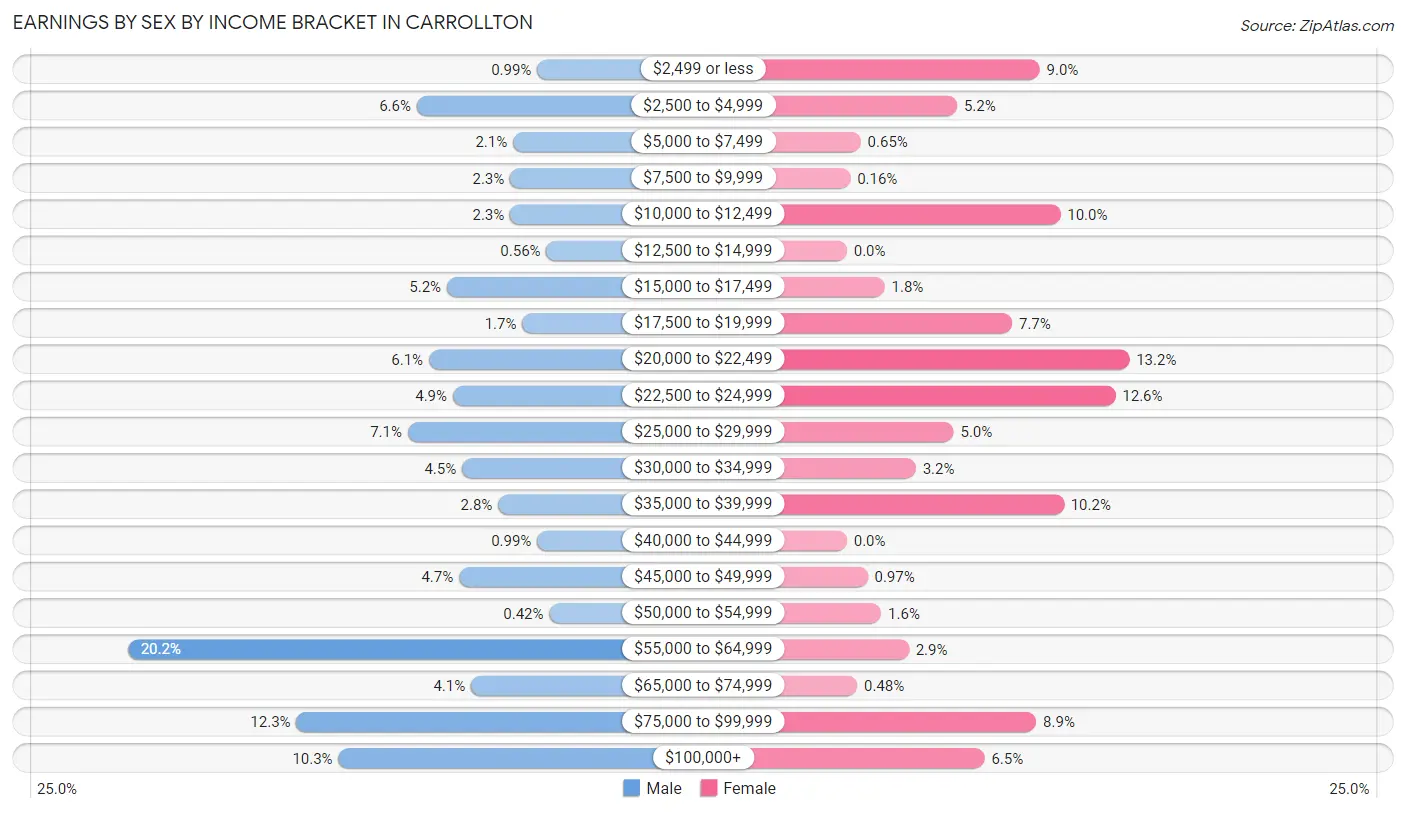
Earnings by Sex by Income Bracket in Carrollton
The most common earnings brackets in Carrollton are $55,000 to $64,999 for men (143 | 20.2%) and $20,000 to $22,499 for women (82 | 13.2%).
| Income | Male | Female |
| $2,499 or less | 7 (1.0%) | 56 (9.0%) |
| $2,500 to $4,999 | 47 (6.6%) | 32 (5.2%) |
| $5,000 to $7,499 | 15 (2.1%) | 4 (0.6%) |
| $7,500 to $9,999 | 16 (2.3%) | 1 (0.2%) |
| $10,000 to $12,499 | 16 (2.3%) | 62 (10.0%) |
| $12,500 to $14,999 | 4 (0.6%) | 0 (0.0%) |
| $15,000 to $17,499 | 37 (5.2%) | 11 (1.8%) |
| $17,500 to $19,999 | 12 (1.7%) | 48 (7.7%) |
| $20,000 to $22,499 | 43 (6.1%) | 82 (13.2%) |
| $22,500 to $24,999 | 35 (4.9%) | 78 (12.6%) |
| $25,000 to $29,999 | 50 (7.0%) | 31 (5.0%) |
| $30,000 to $34,999 | 32 (4.5%) | 20 (3.2%) |
| $35,000 to $39,999 | 20 (2.8%) | 63 (10.2%) |
| $40,000 to $44,999 | 7 (1.0%) | 0 (0.0%) |
| $45,000 to $49,999 | 33 (4.6%) | 6 (1.0%) |
| $50,000 to $54,999 | 3 (0.4%) | 10 (1.6%) |
| $55,000 to $64,999 | 143 (20.2%) | 18 (2.9%) |
| $65,000 to $74,999 | 29 (4.1%) | 3 (0.5%) |
| $75,000 to $99,999 | 87 (12.3%) | 55 (8.9%) |
| $100,000+ | 73 (10.3%) | 40 (6.5%) |
| Total | 709 (100.0%) | 620 (100.0%) |
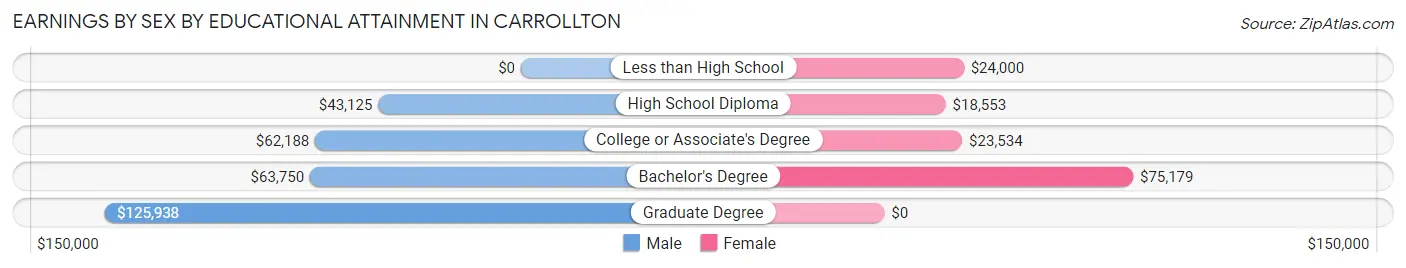
Earnings by Sex by Educational Attainment in Carrollton
Average earnings in Carrollton are $58,369 for men and $24,007 for women, a difference of 58.9%. Men with an educational attainment of graduate degree enjoy the highest average annual earnings of $125,938, while those with high school diploma education earn the least with $43,125. Women with an educational attainment of bachelor's degree earn the most with the average annual earnings of $75,179, while those with high school diploma education have the smallest earnings of $18,553.
| Educational Attainment | Male Income | Female Income |
| Less than High School | - | - |
| High School Diploma | $43,125 | $18,553 |
| College or Associate's Degree | $62,188 | $23,534 |
| Bachelor's Degree | $63,750 | $75,179 |
| Graduate Degree | $125,938 | $0 |
| Total | $58,369 | $24,007 |
Family Income in Carrollton
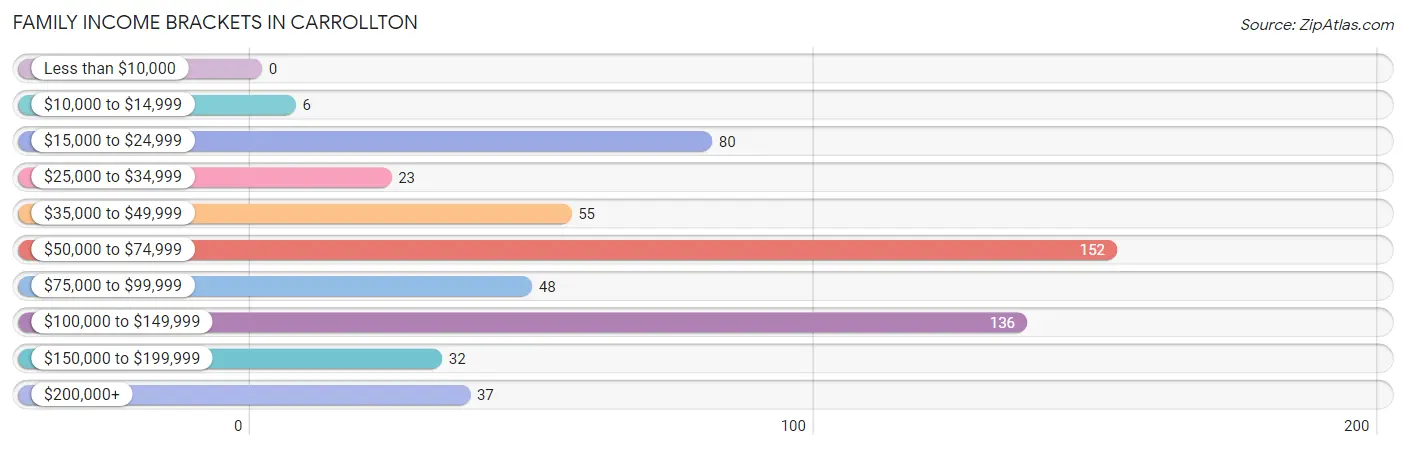
Family Income Brackets in Carrollton
According to the Carrollton family income data, there are 152 families falling into the $50,000 to $74,999 income range, which is the most common income bracket and makes up 26.7% of all families.
| Income Bracket | # Families | % Families |
| Less than $10,000 | 0 | 0.0% |
| $10,000 to $14,999 | 6 | 1.1% |
| $15,000 to $24,999 | 80 | 14.1% |
| $25,000 to $34,999 | 23 | 4.0% |
| $35,000 to $49,999 | 55 | 9.7% |
| $50,000 to $74,999 | 152 | 26.7% |
| $75,000 to $99,999 | 48 | 8.4% |
| $100,000 to $149,999 | 136 | 23.9% |
| $150,000 to $199,999 | 32 | 5.6% |
| $200,000+ | 37 | 6.5% |
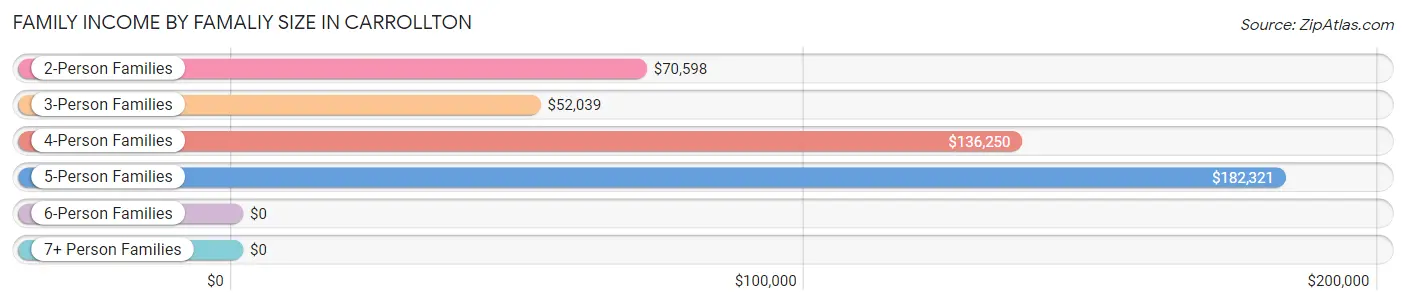
Family Income by Famaliy Size in Carrollton
5-person families (61 | 10.7%) account for the highest median family income in Carrollton with $182,321 per family, while 5-person families (61 | 10.7%) have the highest median income of $36,464 per family member.
| Income Bracket | # Families | Median Income |
| 2-Person Families | 335 (58.9%) | $70,598 |
| 3-Person Families | 117 (20.6%) | $52,039 |
| 4-Person Families | 40 (7.0%) | $136,250 |
| 5-Person Families | 61 (10.7%) | $182,321 |
| 6-Person Families | 3 (0.5%) | $0 |
| 7+ Person Families | 13 (2.3%) | $0 |
| Total | 569 (100.0%) | $71,033 |
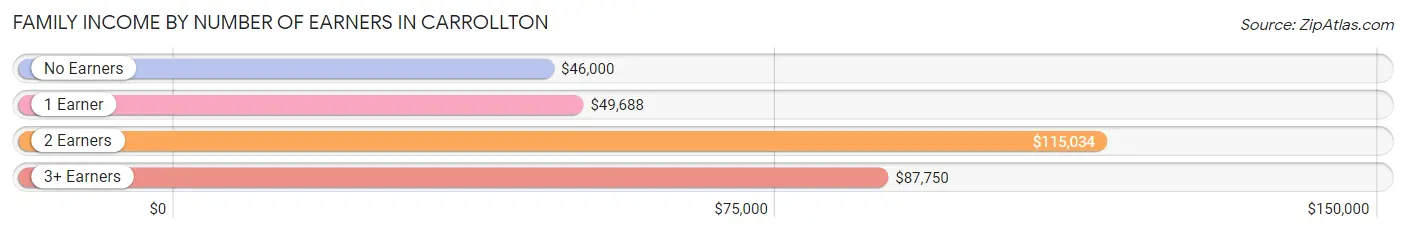
Family Income by Number of Earners in Carrollton
The median family income in Carrollton is $71,033, with families comprising 2 earners (273) having the highest median family income of $115,034, while families with no earners (94) have the lowest median family income of $46,000, accounting for 48.0% and 16.5% of families, respectively.
| Number of Earners | # Families | Median Income |
| No Earners | 94 (16.5%) | $46,000 |
| 1 Earner | 149 (26.2%) | $49,688 |
| 2 Earners | 273 (48.0%) | $115,034 |
| 3+ Earners | 53 (9.3%) | $87,750 |
| Total | 569 (100.0%) | $71,033 |
Household Income in Carrollton
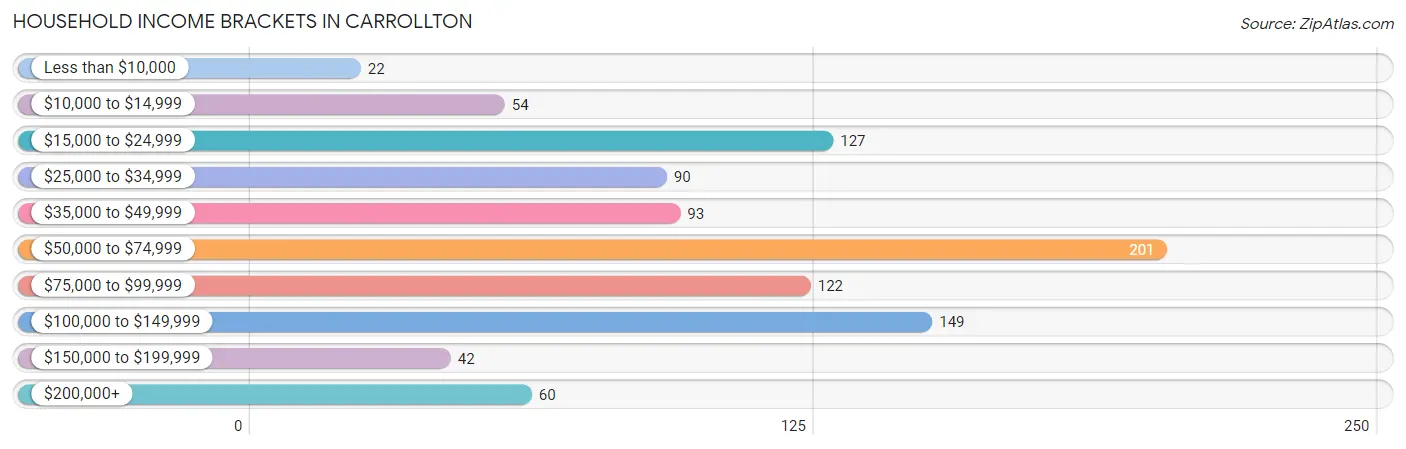
Household Income Brackets in Carrollton
With 201 households falling in the category, the $50,000 to $74,999 income range is the most frequent in Carrollton, accounting for 20.9% of all households. In contrast, only 22 households (2.3%) fall into the less than $10,000 income bracket, making it the least populous group.
| Income Bracket | # Households | % Households |
| Less than $10,000 | 22 | 2.3% |
| $10,000 to $14,999 | 54 | 5.6% |
| $15,000 to $24,999 | 127 | 13.2% |
| $25,000 to $34,999 | 90 | 9.4% |
| $35,000 to $49,999 | 93 | 9.7% |
| $50,000 to $74,999 | 201 | 20.9% |
| $75,000 to $99,999 | 122 | 12.7% |
| $100,000 to $149,999 | 149 | 15.5% |
| $150,000 to $199,999 | 42 | 4.4% |
| $200,000+ | 60 | 6.3% |
Household Income by Householder Age in Carrollton
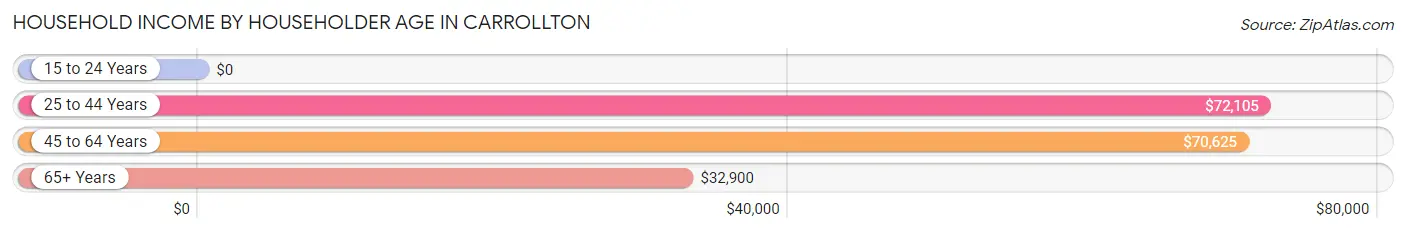
The median household income in Carrollton is $63,026, with the highest median household income of $72,105 found in the 25 to 44 years age bracket for the primary householder. A total of 264 households (27.5%) fall into this category. Meanwhile, the 15 to 24 years age bracket for the primary householder has the lowest median household income of $0, with 37 households (3.8%) in this group.
| Income Bracket | # Households | Median Income |
| 15 to 24 Years | 37 (3.8%) | $0 |
| 25 to 44 Years | 264 (27.5%) | $72,105 |
| 45 to 64 Years | 311 (32.4%) | $70,625 |
| 65+ Years | 348 (36.2%) | $32,900 |
| Total | 960 (100.0%) | $63,026 |
Poverty in Carrollton
Income Below Poverty by Sex and Age in Carrollton
With 7.6% poverty level for males and 9.5% for females among the residents of Carrollton, 16 and 17 year old males and 12 to 14 year old females are the most vulnerable to poverty, with 26 males (100.0%) and 9 females (34.6%) in their respective age groups living below the poverty level.
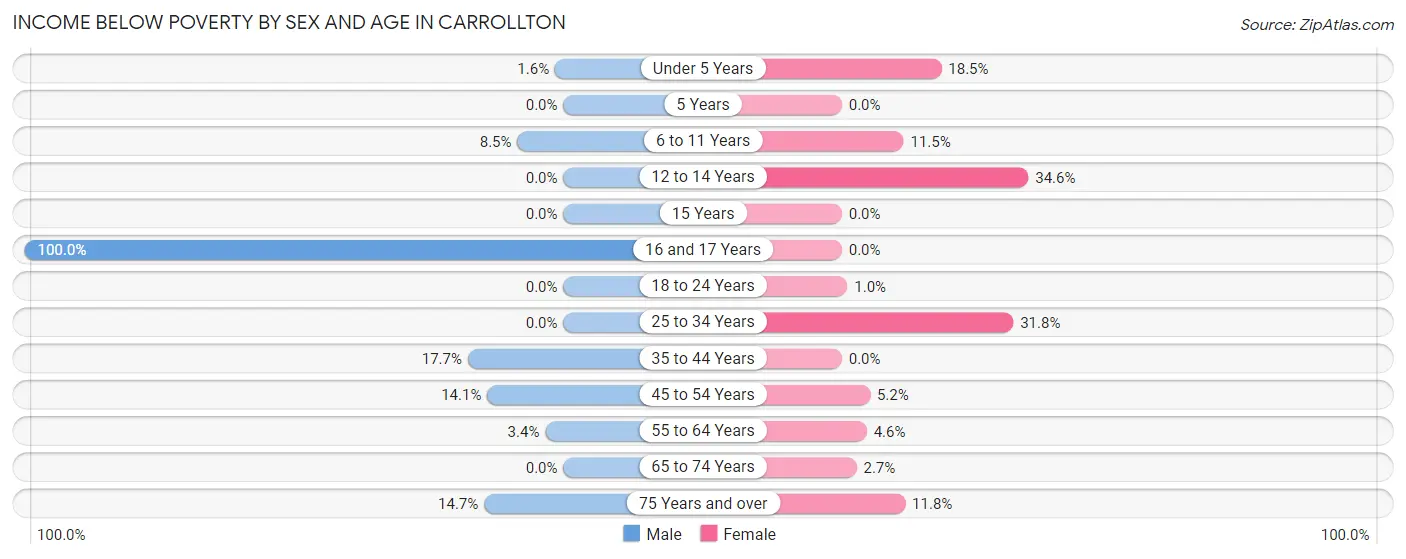
| Age Bracket | Male | Female |
| Under 5 Years | 2 (1.5%) | 17 (18.5%) |
| 5 Years | 0 (0.0%) | 0 (0.0%) |
| 6 to 11 Years | 7 (8.5%) | 11 (11.5%) |
| 12 to 14 Years | 0 (0.0%) | 9 (34.6%) |
| 15 Years | 0 (0.0%) | 0 (0.0%) |
| 16 and 17 Years | 26 (100.0%) | 0 (0.0%) |
| 18 to 24 Years | 0 (0.0%) | 1 (1.0%) |
| 25 to 34 Years | 0 (0.0%) | 42 (31.8%) |
| 35 to 44 Years | 22 (17.7%) | 0 (0.0%) |
| 45 to 54 Years | 26 (14.1%) | 8 (5.2%) |
| 55 to 64 Years | 5 (3.4%) | 5 (4.6%) |
| 65 to 74 Years | 0 (0.0%) | 4 (2.7%) |
| 75 Years and over | 10 (14.7%) | 18 (11.8%) |
| Total | 98 (7.6%) | 115 (9.5%) |
Income Above Poverty by Sex and Age in Carrollton
According to the poverty statistics in Carrollton, males aged 5 years and females aged 15 years are the age groups that are most secure financially, with 100.0% of males and 100.0% of females in these age groups living above the poverty line.
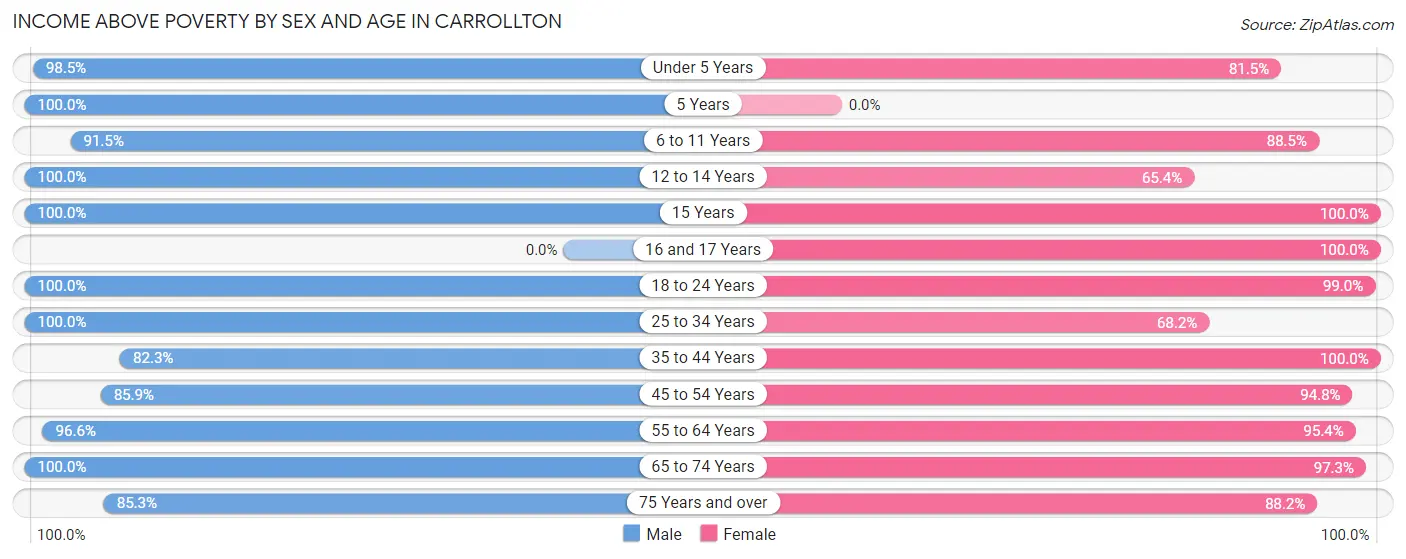
| Age Bracket | Male | Female |
| Under 5 Years | 127 (98.5%) | 75 (81.5%) |
| 5 Years | 12 (100.0%) | 0 (0.0%) |
| 6 to 11 Years | 75 (91.5%) | 85 (88.5%) |
| 12 to 14 Years | 91 (100.0%) | 17 (65.4%) |
| 15 Years | 12 (100.0%) | 24 (100.0%) |
| 16 and 17 Years | 0 (0.0%) | 34 (100.0%) |
| 18 to 24 Years | 144 (100.0%) | 96 (99.0%) |
| 25 to 34 Years | 128 (100.0%) | 90 (68.2%) |
| 35 to 44 Years | 102 (82.3%) | 144 (100.0%) |
| 45 to 54 Years | 158 (85.9%) | 145 (94.8%) |
| 55 to 64 Years | 144 (96.6%) | 103 (95.4%) |
| 65 to 74 Years | 135 (100.0%) | 142 (97.3%) |
| 75 Years and over | 58 (85.3%) | 135 (88.2%) |
| Total | 1,186 (92.4%) | 1,090 (90.5%) |
Income Below Poverty Among Married-Couple Families in Carrollton
The poverty statistics for married-couple families in Carrollton show that 1.1% or 4 of the total 375 families live below the poverty line. Families with 1 or 2 children have the highest poverty rate of 7.0%, comprising of 4 families. On the other hand, families with no children have the lowest poverty rate of 0.0%, which includes 0 families.
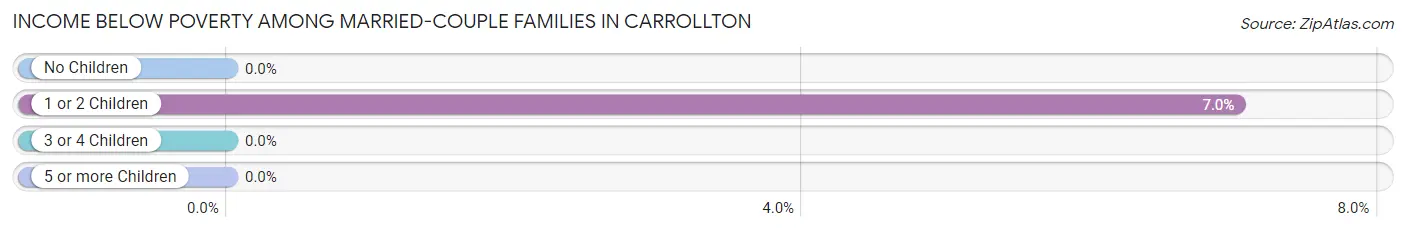
| Children | Above Poverty | Below Poverty |
| No Children | 253 (100.0%) | 0 (0.0%) |
| 1 or 2 Children | 53 (93.0%) | 4 (7.0%) |
| 3 or 4 Children | 59 (100.0%) | 0 (0.0%) |
| 5 or more Children | 6 (100.0%) | 0 (0.0%) |
| Total | 371 (98.9%) | 4 (1.1%) |
Income Below Poverty Among Single-Parent Households in Carrollton
According to the poverty data in Carrollton, 51.9% or 27 single-father households and 12.0% or 17 single-mother households are living below the poverty line. Among single-father households, those with 3 or 4 children have the highest poverty rate, with 4 households (100.0%) experiencing poverty. Likewise, among single-mother households, those with 1 or 2 children have the highest poverty rate, with 17 households (19.8%) falling below the poverty line.
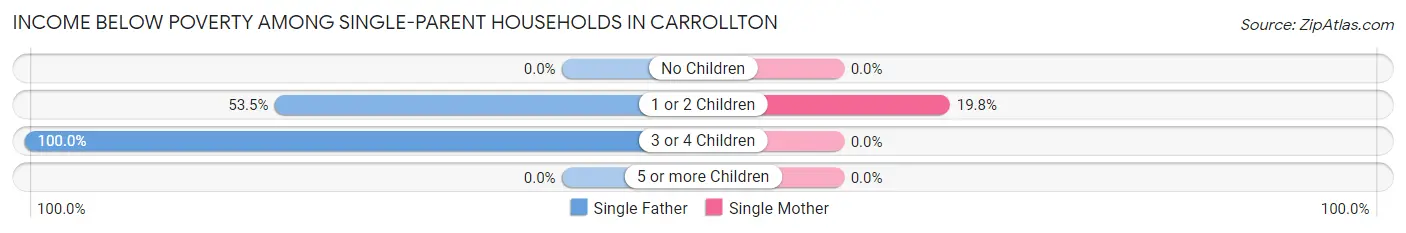
| Children | Single Father | Single Mother |
| No Children | 0 (0.0%) | 0 (0.0%) |
| 1 or 2 Children | 23 (53.5%) | 17 (19.8%) |
| 3 or 4 Children | 4 (100.0%) | 0 (0.0%) |
| 5 or more Children | 0 (0.0%) | 0 (0.0%) |
| Total | 27 (51.9%) | 17 (12.0%) |
Income Below Poverty Among Married-Couple vs Single-Parent Households in Carrollton
The poverty data for Carrollton shows that 4 of the married-couple family households (1.1%) and 44 of the single-parent households (22.7%) are living below the poverty level. Within the married-couple family households, those with 1 or 2 children have the highest poverty rate, with 4 households (7.0%) falling below the poverty line. Among the single-parent households, those with 3 or 4 children have the highest poverty rate, with 4 household (44.4%) living below poverty.
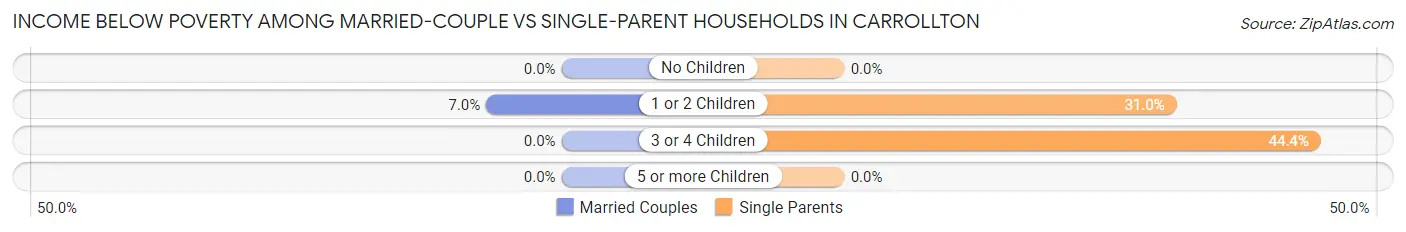
| Children | Married-Couple Families | Single-Parent Households |
| No Children | 0 (0.0%) | 0 (0.0%) |
| 1 or 2 Children | 4 (7.0%) | 40 (31.0%) |
| 3 or 4 Children | 0 (0.0%) | 4 (44.4%) |
| 5 or more Children | 0 (0.0%) | 0 (0.0%) |
| Total | 4 (1.1%) | 44 (22.7%) |
Race in Carrollton
The most populous races in Carrollton are White / Caucasian (2,440 | 95.8%), Hispanic or Latino (54 | 2.1%), and Two or more Races (40 | 1.6%).
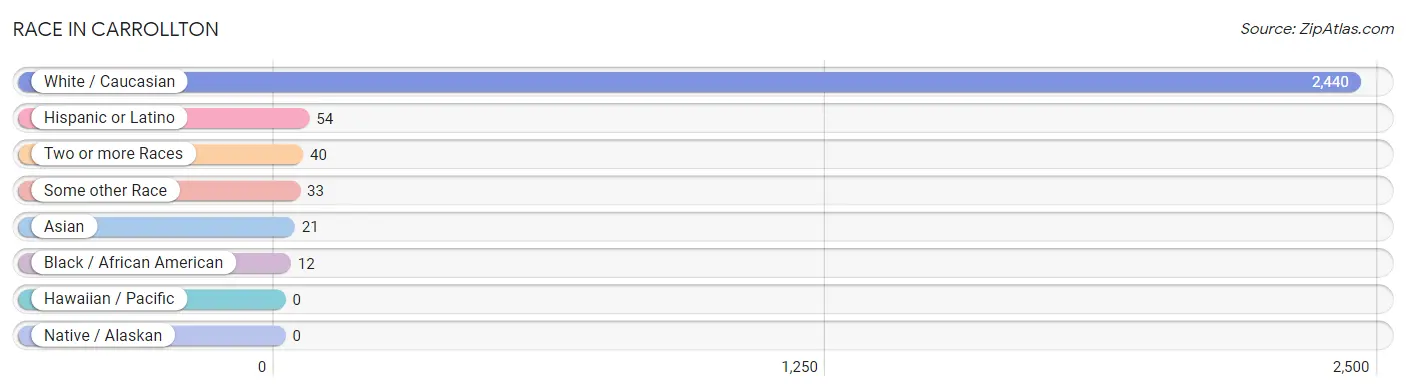
| Race | # Population | % Population |
| Asian | 21 | 0.8% |
| Black / African American | 12 | 0.5% |
| Hawaiian / Pacific | 0 | 0.0% |
| Hispanic or Latino | 54 | 2.1% |
| Native / Alaskan | 0 | 0.0% |
| White / Caucasian | 2,440 | 95.8% |
| Two or more Races | 40 | 1.6% |
| Some other Race | 33 | 1.3% |
| Total | 2,546 | 100.0% |
Ancestry in Carrollton
The most populous ancestries reported in Carrollton are German (695 | 27.3%), Irish (305 | 12.0%), American (195 | 7.7%), English (160 | 6.3%), and European (87 | 3.4%), together accounting for 56.6% of all Carrollton residents.
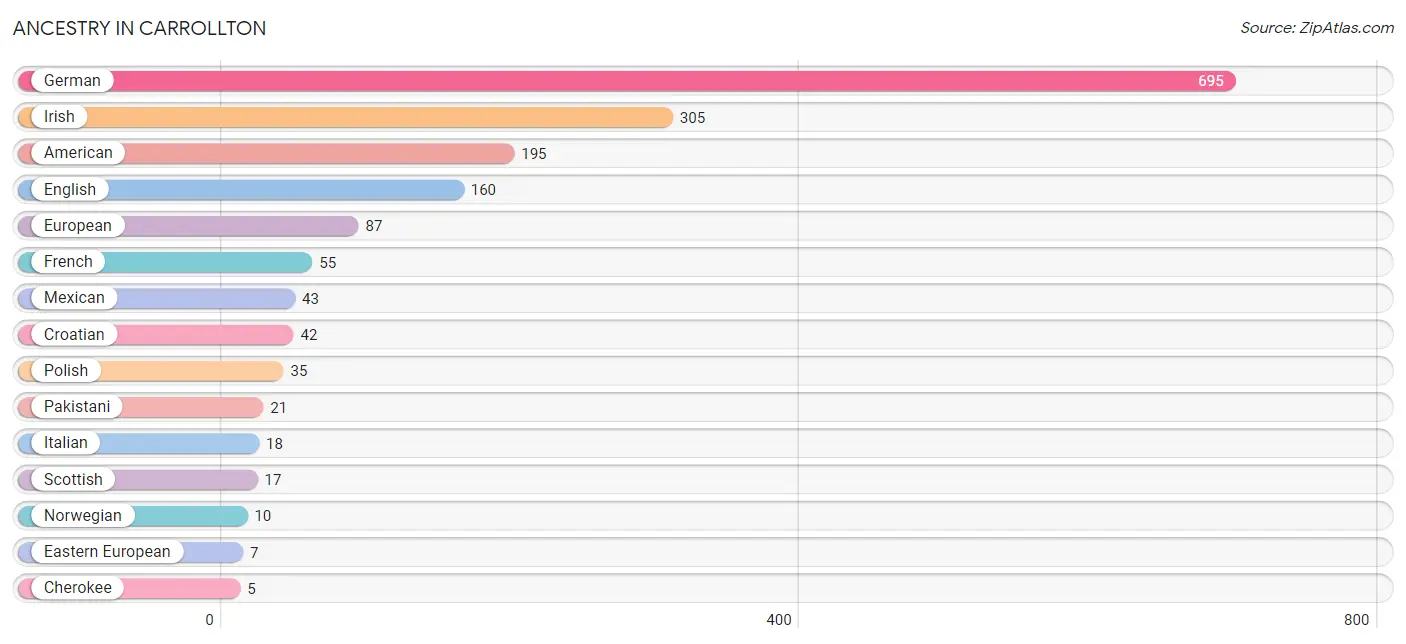
| Ancestry | # Population | % Population |
| American | 195 | 7.7% |
| Central American | 1 | 0.0% |
| Cherokee | 5 | 0.2% |
| Croatian | 42 | 1.7% |
| Eastern European | 7 | 0.3% |
| English | 160 | 6.3% |
| European | 87 | 3.4% |
| French | 55 | 2.2% |
| French Canadian | 3 | 0.1% |
| German | 695 | 27.3% |
| Greek | 1 | 0.0% |
| Irish | 305 | 12.0% |
| Italian | 18 | 0.7% |
| Mexican | 43 | 1.7% |
| Native Hawaiian | 3 | 0.1% |
| Norwegian | 10 | 0.4% |
| Pakistani | 21 | 0.8% |
| Polish | 35 | 1.4% |
| Puerto Rican | 1 | 0.0% |
| Salvadoran | 1 | 0.0% |
| Scotch-Irish | 5 | 0.2% |
| Scottish | 17 | 0.7% |
| Spaniard | 1 | 0.0% |
| Swedish | 2 | 0.1% | View All 24 Rows |
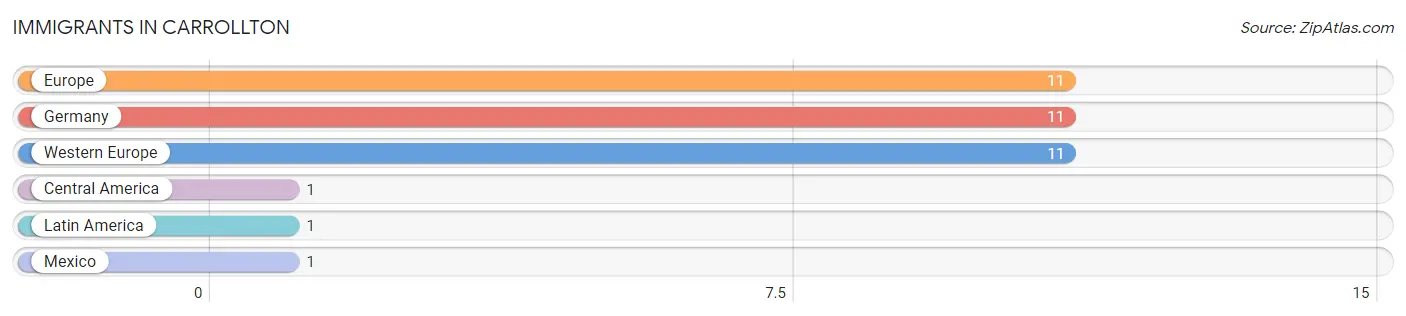
Immigrants in Carrollton
The most numerous immigrant groups reported in Carrollton came from Europe (11 | 0.4%), Germany (11 | 0.4%), Western Europe (11 | 0.4%), Central America (1 | 0.0%), and Latin America (1 | 0.0%), together accounting for 1.4% of all Carrollton residents.
| Immigration Origin | # Population | % Population |
| Central America | 1 | 0.0% |
| Europe | 11 | 0.4% |
| Germany | 11 | 0.4% |
| Latin America | 1 | 0.0% |
| Mexico | 1 | 0.0% |
| Western Europe | 11 | 0.4% | View All 6 Rows |
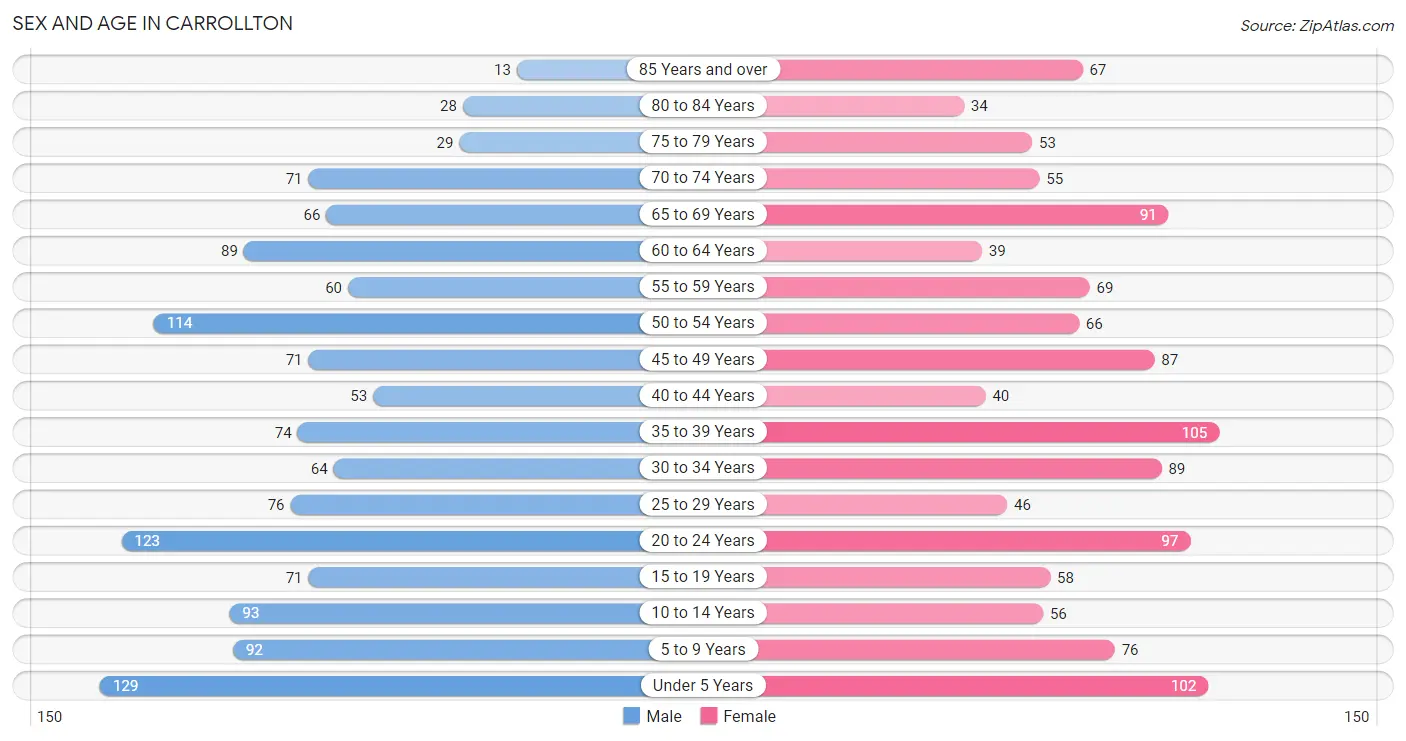
Sex and Age in Carrollton
Sex and Age in Carrollton
The most populous age groups in Carrollton are Under 5 Years (129 | 9.8%) for men and 35 to 39 Years (105 | 8.5%) for women.
| Age Bracket | Male | Female |
| Under 5 Years | 129 (9.8%) | 102 (8.3%) |
| 5 to 9 Years | 92 (7.0%) | 76 (6.2%) |
| 10 to 14 Years | 93 (7.1%) | 56 (4.5%) |
| 15 to 19 Years | 71 (5.4%) | 58 (4.7%) |
| 20 to 24 Years | 123 (9.3%) | 97 (7.9%) |
| 25 to 29 Years | 76 (5.8%) | 46 (3.7%) |
| 30 to 34 Years | 64 (4.9%) | 89 (7.2%) |
| 35 to 39 Years | 74 (5.6%) | 105 (8.5%) |
| 40 to 44 Years | 53 (4.0%) | 40 (3.3%) |
| 45 to 49 Years | 71 (5.4%) | 87 (7.1%) |
| 50 to 54 Years | 114 (8.7%) | 66 (5.4%) |
| 55 to 59 Years | 60 (4.6%) | 69 (5.6%) |
| 60 to 64 Years | 89 (6.8%) | 39 (3.2%) |
| 65 to 69 Years | 66 (5.0%) | 91 (7.4%) |
| 70 to 74 Years | 71 (5.4%) | 55 (4.5%) |
| 75 to 79 Years | 29 (2.2%) | 53 (4.3%) |
| 80 to 84 Years | 28 (2.1%) | 34 (2.8%) |
| 85 Years and over | 13 (1.0%) | 67 (5.4%) |
| Total | 1,316 (100.0%) | 1,230 (100.0%) |
Families and Households in Carrollton
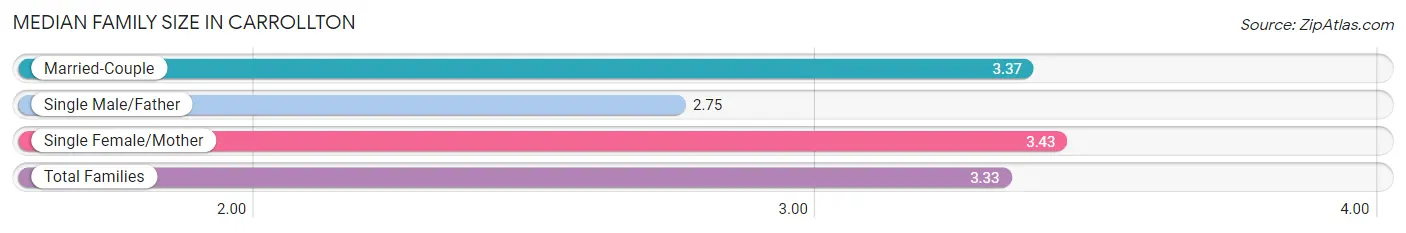
Median Family Size in Carrollton
The median family size in Carrollton is 3.33 persons per family, with single female/mother families (142 | 25.0%) accounting for the largest median family size of 3.43 persons per family. On the other hand, single male/father families (52 | 9.1%) represent the smallest median family size with 2.75 persons per family.
| Family Type | # Families | Family Size |
| Married-Couple | 375 (65.9%) | 3.37 |
| Single Male/Father | 52 (9.1%) | 2.75 |
| Single Female/Mother | 142 (25.0%) | 3.43 |
| Total Families | 569 (100.0%) | 3.33 |
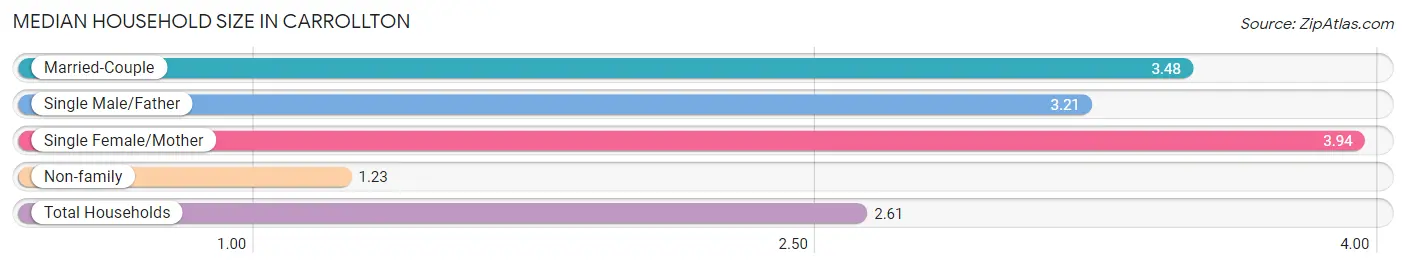
Median Household Size in Carrollton
The median household size in Carrollton is 2.61 persons per household, with single female/mother households (142 | 14.8%) accounting for the largest median household size of 3.94 persons per household. non-family households (391 | 40.7%) represent the smallest median household size with 1.23 persons per household.
| Household Type | # Households | Household Size |
| Married-Couple | 375 (39.1%) | 3.48 |
| Single Male/Father | 52 (5.4%) | 3.21 |
| Single Female/Mother | 142 (14.8%) | 3.94 |
| Non-family | 391 (40.7%) | 1.23 |
| Total Households | 960 (100.0%) | 2.61 |
Household Size by Marriage Status in Carrollton
Out of a total of 960 households in Carrollton, 569 (59.3%) are family households, while 391 (40.7%) are nonfamily households. The most numerous type of family households are 2-person households, comprising 284, and the most common type of nonfamily households are 1-person households, comprising 325.
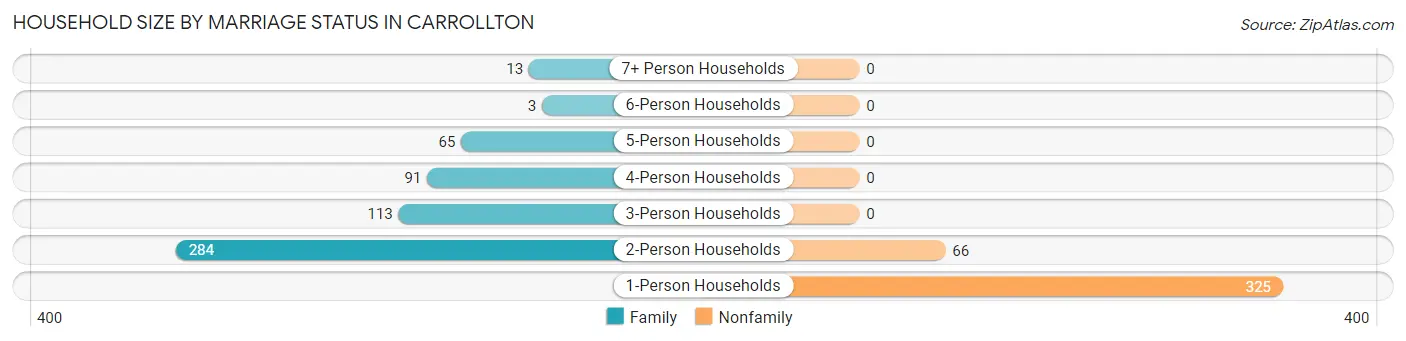
| Household Size | Family Households | Nonfamily Households |
| 1-Person Households | - | 325 (33.9%) |
| 2-Person Households | 284 (29.6%) | 66 (6.9%) |
| 3-Person Households | 113 (11.8%) | 0 (0.0%) |
| 4-Person Households | 91 (9.5%) | 0 (0.0%) |
| 5-Person Households | 65 (6.8%) | 0 (0.0%) |
| 6-Person Households | 3 (0.3%) | 0 (0.0%) |
| 7+ Person Households | 13 (1.3%) | 0 (0.0%) |
| Total | 569 (59.3%) | 391 (40.7%) |
Female Fertility in Carrollton
Fertility by Age in Carrollton
Average fertility rate in Carrollton is 61.0 births per 1,000 women. Women in the age bracket of 20 to 34 years have the highest fertility rate with 138.0 births per 1,000 women. Women in the age bracket of 20 to 34 years acount for 100.0% of all women with births.
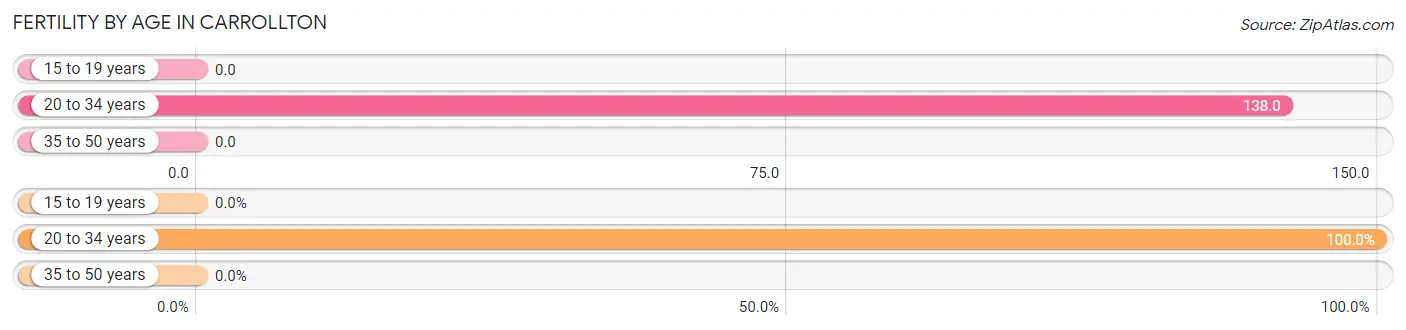
| Age Bracket | Women with Births | Births / 1,000 Women |
| 15 to 19 years | 0 (0.0%) | 0.0 |
| 20 to 34 years | 32 (100.0%) | 138.0 |
| 35 to 50 years | 0 (0.0%) | 0.0 |
| Total | 32 (100.0%) | 61.0 |
Fertility by Age by Marriage Status in Carrollton
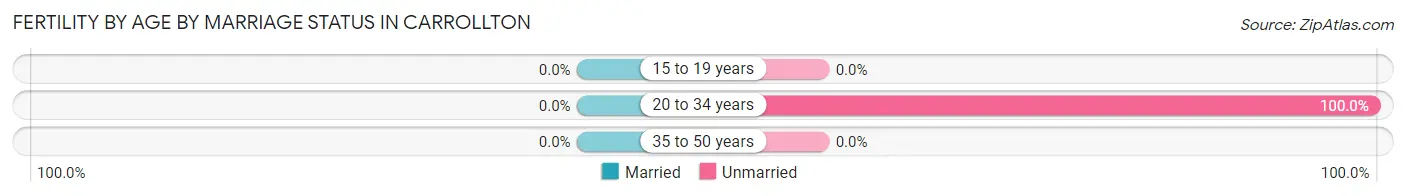
| Age Bracket | Married | Unmarried |
| 15 to 19 years | 0 (0.0%) | 0 (0.0%) |
| 20 to 34 years | 0 (0.0%) | 32 (100.0%) |
| 35 to 50 years | 0 (0.0%) | 0 (0.0%) |
| Total | 0 (0.0%) | 32 (100.0%) |
Fertility by Education in Carrollton
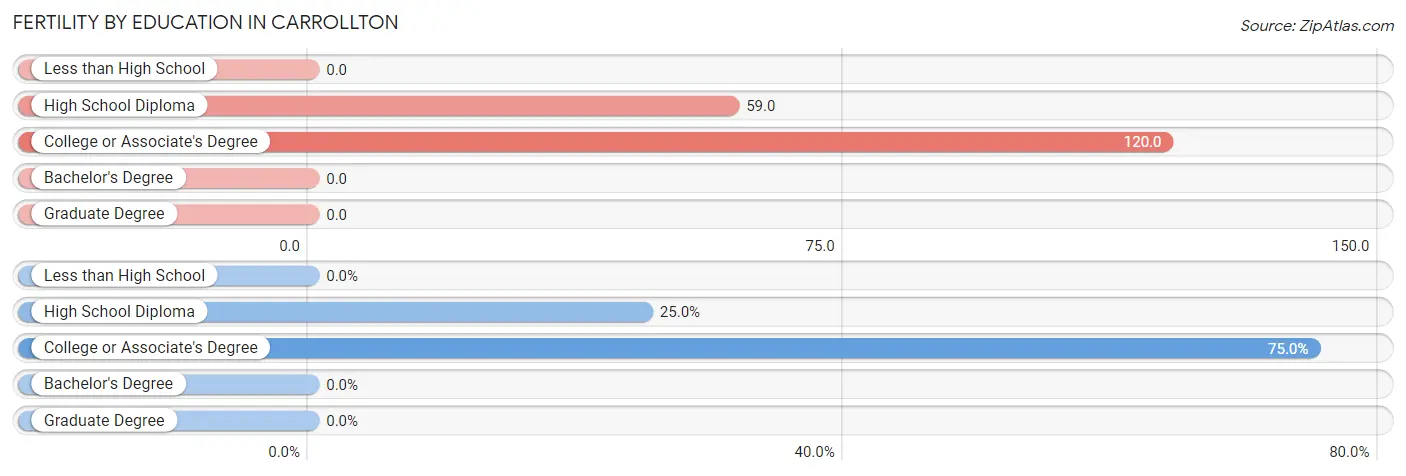
| Educational Attainment | Women with Births | Births / 1,000 Women |
| Less than High School | 0 (0.0%) | 0.0 |
| High School Diploma | 8 (25.0%) | 59.0 |
| College or Associate's Degree | 24 (75.0%) | 120.0 |
| Bachelor's Degree | 0 (0.0%) | 0.0 |
| Graduate Degree | 0 (0.0%) | 0.0 |
| Total | 32 (100.0%) | 61.0 |
Fertility by Education by Marriage Status in Carrollton
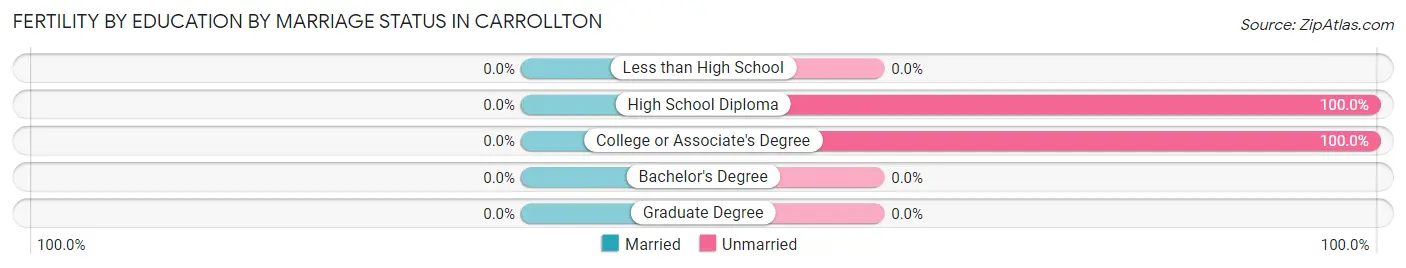
| Educational Attainment | Married | Unmarried |
| Less than High School | 0 (0.0%) | 0 (0.0%) |
| High School Diploma | 0 (0.0%) | 8 (100.0%) |
| College or Associate's Degree | 0 (0.0%) | 24 (100.0%) |
| Bachelor's Degree | 0 (0.0%) | 0 (0.0%) |
| Graduate Degree | 0 (0.0%) | 0 (0.0%) |
| Total | 0 (0.0%) | 32 (100.0%) |
Employment Characteristics in Carrollton
Employment by Class of Employer in Carrollton
Among the 1,210 employed individuals in Carrollton, private company employees (743 | 61.4%), not-for-profit organizations (183 | 15.1%), and self-employed (not incorporated) (80 | 6.6%) make up the most common classes of employment.
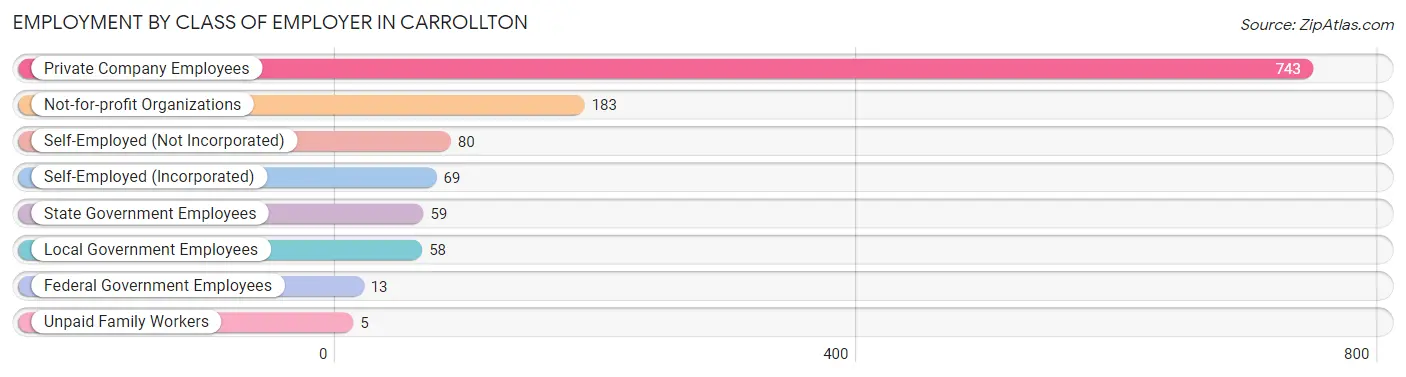
| Employer Class | # Employees | % Employees |
| Private Company Employees | 743 | 61.4% |
| Self-Employed (Incorporated) | 69 | 5.7% |
| Self-Employed (Not Incorporated) | 80 | 6.6% |
| Not-for-profit Organizations | 183 | 15.1% |
| Local Government Employees | 58 | 4.8% |
| State Government Employees | 59 | 4.9% |
| Federal Government Employees | 13 | 1.1% |
| Unpaid Family Workers | 5 | 0.4% |
| Total | 1,210 | 100.0% |
Employment Status by Age in Carrollton
According to the labor force statistics for Carrollton, out of the total population over 16 years of age (1,962), 65.2% or 1,279 individuals are in the labor force, with 1.7% or 22 of them unemployed. The age group with the highest labor force participation rate is 25 to 29 years, with 92.6% or 113 individuals in the labor force. Within the labor force, the 35 to 44 years age range has the highest percentage of unemployed individuals, with 12.4% or 22 of them being unemployed.
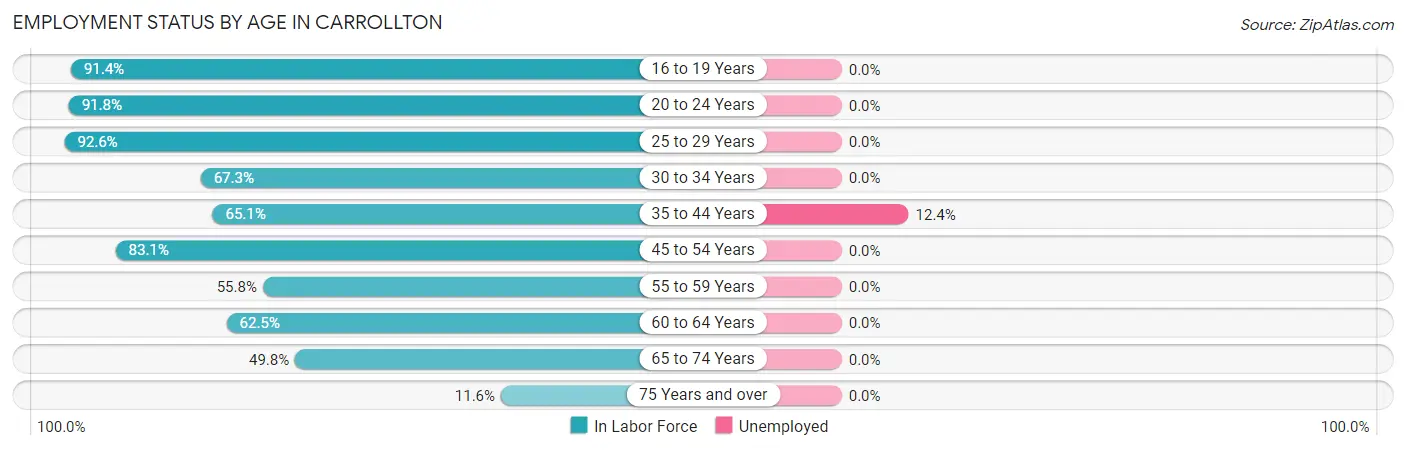
| Age Bracket | In Labor Force | Unemployed |
| 16 to 19 Years | 85 (91.4%) | 0 (0.0%) |
| 20 to 24 Years | 202 (91.8%) | 0 (0.0%) |
| 25 to 29 Years | 113 (92.6%) | 0 (0.0%) |
| 30 to 34 Years | 103 (67.3%) | 0 (0.0%) |
| 35 to 44 Years | 177 (65.1%) | 22 (12.4%) |
| 45 to 54 Years | 281 (83.1%) | 0 (0.0%) |
| 55 to 59 Years | 72 (55.8%) | 0 (0.0%) |
| 60 to 64 Years | 80 (62.5%) | 0 (0.0%) |
| 65 to 74 Years | 141 (49.8%) | 0 (0.0%) |
| 75 Years and over | 26 (11.6%) | 0 (0.0%) |
| Total | 1,279 (65.2%) | 22 (1.7%) |
Employment Status by Educational Attainment in Carrollton
According to labor force statistics for Carrollton, 72.3% of individuals (826) out of the total population between 25 and 64 years of age (1,142) are in the labor force, with 2.7% or 22 of them being unemployed. The group with the highest labor force participation rate are those with the educational attainment of bachelor's degree or higher, with 87.7% or 185 individuals in the labor force. Within the labor force, individuals with less than high school education have the highest percentage of unemployment, with 29.4% or 15 of them being unemployed.
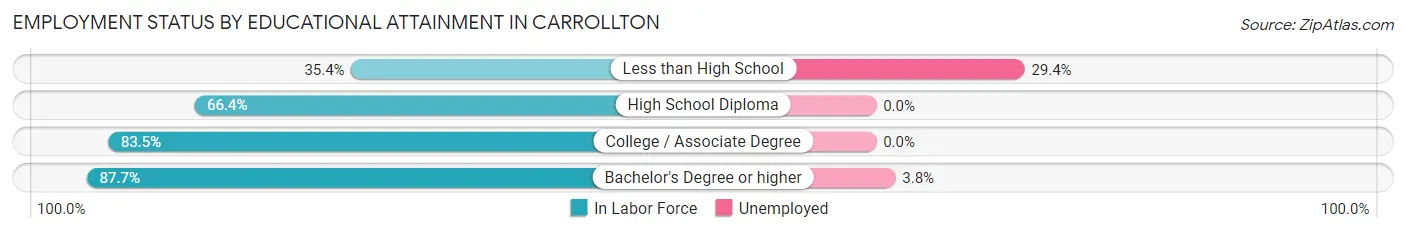
| Educational Attainment | In Labor Force | Unemployed |
| Less than High School | 51 (35.4%) | 42 (29.4%) |
| High School Diploma | 261 (66.4%) | 0 (0.0%) |
| College / Associate Degree | 329 (83.5%) | 0 (0.0%) |
| Bachelor's Degree or higher | 185 (87.7%) | 8 (3.8%) |
| Total | 826 (72.3%) | 31 (2.7%) |
Employment Occupations by Sex in Carrollton
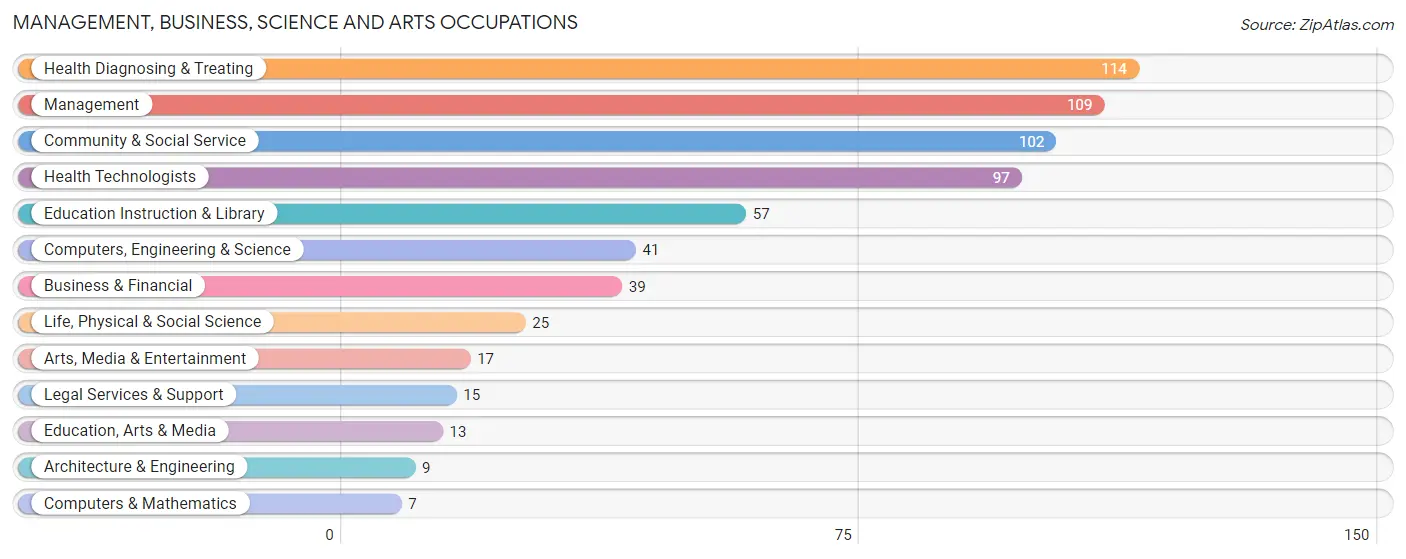
Management, Business, Science and Arts Occupations
The most common Management, Business, Science and Arts occupations in Carrollton are Health Diagnosing & Treating (114 | 9.1%), Management (109 | 8.7%), Community & Social Service (102 | 8.1%), Health Technologists (97 | 7.7%), and Education Instruction & Library (57 | 4.5%).
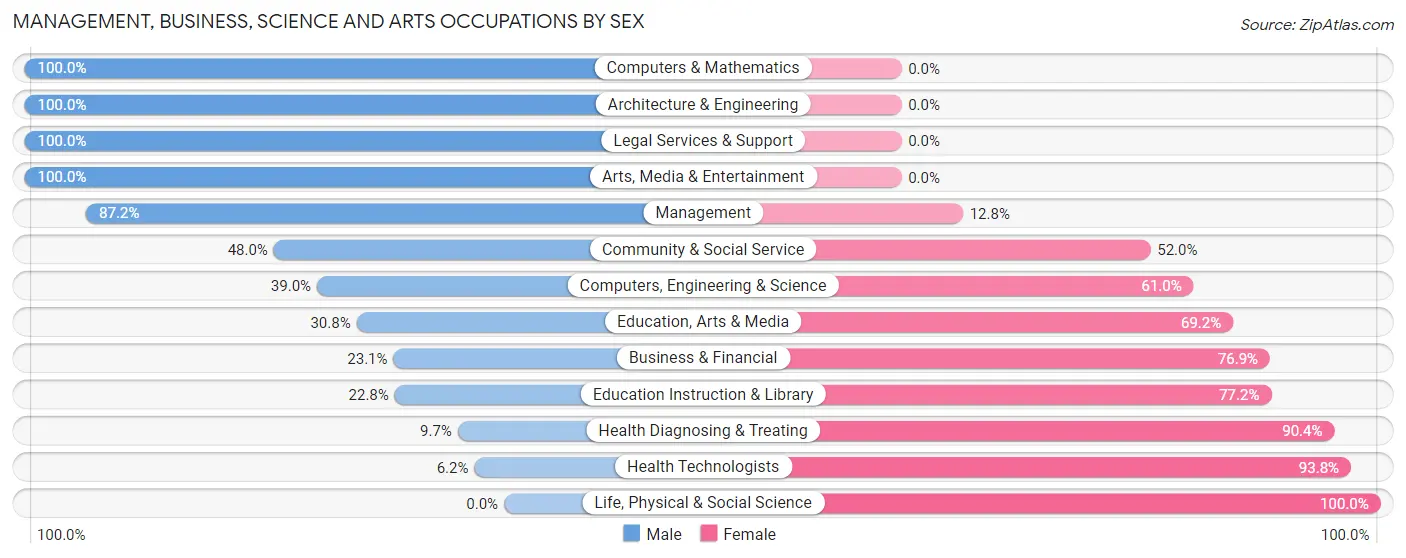
Management, Business, Science and Arts Occupations by Sex
Within the Management, Business, Science and Arts occupations in Carrollton, the most male-oriented occupations are Computers & Mathematics (100.0%), Architecture & Engineering (100.0%), and Legal Services & Support (100.0%), while the most female-oriented occupations are Life, Physical & Social Science (100.0%), Health Technologists (93.8%), and Health Diagnosing & Treating (90.3%).
| Occupation | Male | Female |
| Management | 95 (87.2%) | 14 (12.8%) |
| Business & Financial | 9 (23.1%) | 30 (76.9%) |
| Computers, Engineering & Science | 16 (39.0%) | 25 (61.0%) |
| Computers & Mathematics | 7 (100.0%) | 0 (0.0%) |
| Architecture & Engineering | 9 (100.0%) | 0 (0.0%) |
| Life, Physical & Social Science | 0 (0.0%) | 25 (100.0%) |
| Community & Social Service | 49 (48.0%) | 53 (52.0%) |
| Education, Arts & Media | 4 (30.8%) | 9 (69.2%) |
| Legal Services & Support | 15 (100.0%) | 0 (0.0%) |
| Education Instruction & Library | 13 (22.8%) | 44 (77.2%) |
| Arts, Media & Entertainment | 17 (100.0%) | 0 (0.0%) |
| Health Diagnosing & Treating | 11 (9.7%) | 103 (90.3%) |
| Health Technologists | 6 (6.2%) | 91 (93.8%) |
| Total (Category) | 180 (44.4%) | 225 (55.6%) |
| Total (Overall) | 678 (53.9%) | 580 (46.1%) |
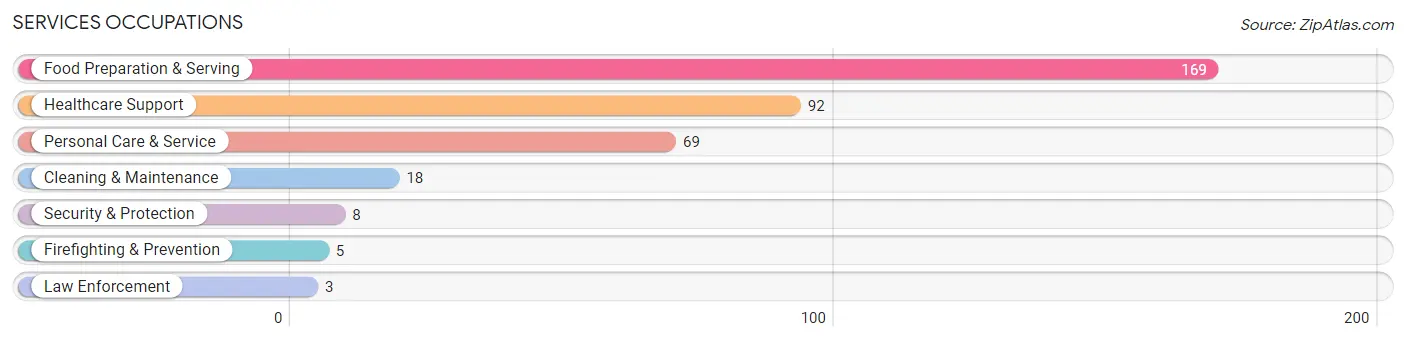
Services Occupations
The most common Services occupations in Carrollton are Food Preparation & Serving (169 | 13.4%), Healthcare Support (92 | 7.3%), Personal Care & Service (69 | 5.5%), Cleaning & Maintenance (18 | 1.4%), and Security & Protection (8 | 0.6%).
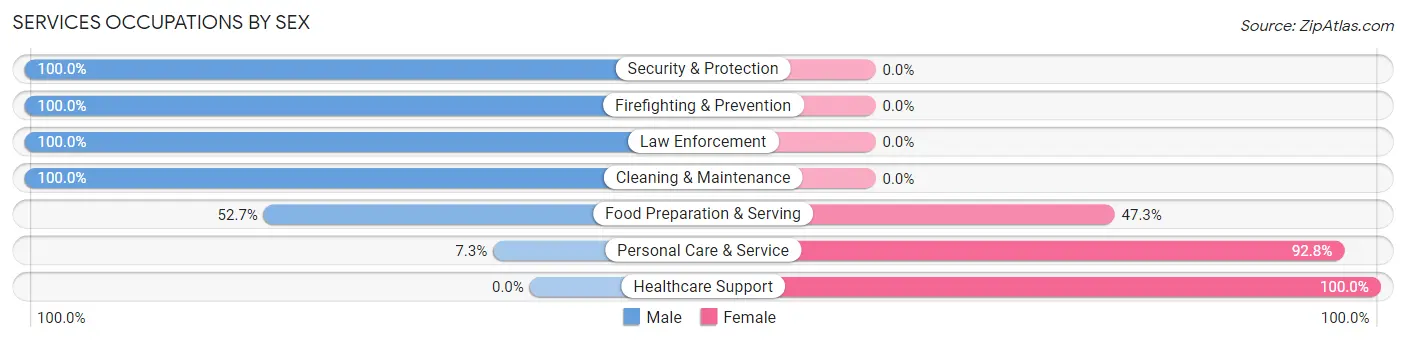
Services Occupations by Sex
Within the Services occupations in Carrollton, the most male-oriented occupations are Security & Protection (100.0%), Firefighting & Prevention (100.0%), and Law Enforcement (100.0%), while the most female-oriented occupations are Healthcare Support (100.0%), Personal Care & Service (92.7%), and Food Preparation & Serving (47.3%).
| Occupation | Male | Female |
| Healthcare Support | 0 (0.0%) | 92 (100.0%) |
| Security & Protection | 8 (100.0%) | 0 (0.0%) |
| Firefighting & Prevention | 5 (100.0%) | 0 (0.0%) |
| Law Enforcement | 3 (100.0%) | 0 (0.0%) |
| Food Preparation & Serving | 89 (52.7%) | 80 (47.3%) |
| Cleaning & Maintenance | 18 (100.0%) | 0 (0.0%) |
| Personal Care & Service | 5 (7.2%) | 64 (92.7%) |
| Total (Category) | 120 (33.7%) | 236 (66.3%) |
| Total (Overall) | 678 (53.9%) | 580 (46.1%) |
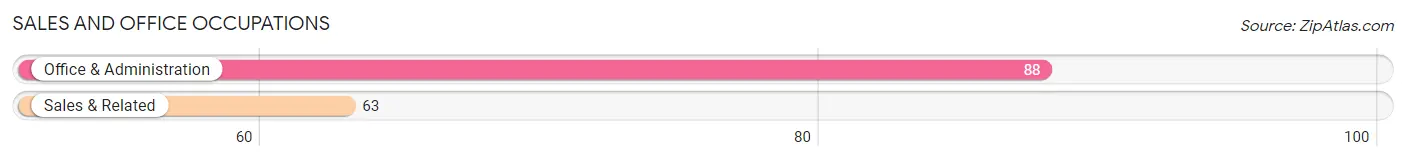
Sales and Office Occupations
The most common Sales and Office occupations in Carrollton are Office & Administration (88 | 7.0%), and Sales & Related (63 | 5.0%).
Sales and Office Occupations by Sex
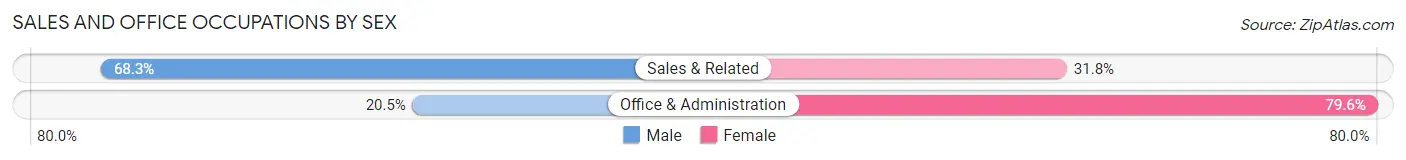
| Occupation | Male | Female |
| Sales & Related | 43 (68.2%) | 20 (31.8%) |
| Office & Administration | 18 (20.4%) | 70 (79.5%) |
| Total (Category) | 61 (40.4%) | 90 (59.6%) |
| Total (Overall) | 678 (53.9%) | 580 (46.1%) |
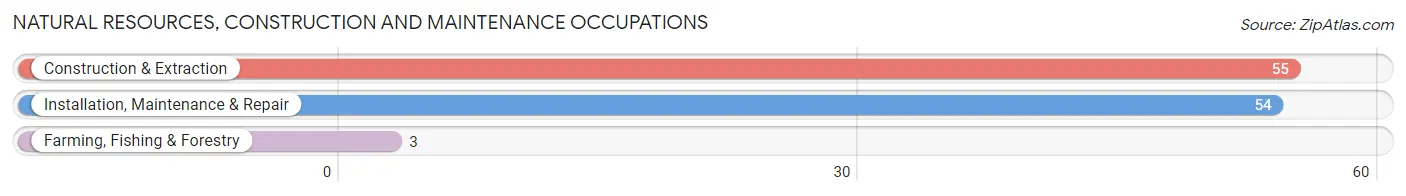
Natural Resources, Construction and Maintenance Occupations
The most common Natural Resources, Construction and Maintenance occupations in Carrollton are Construction & Extraction (55 | 4.4%), Installation, Maintenance & Repair (54 | 4.3%), and Farming, Fishing & Forestry (3 | 0.2%).
Natural Resources, Construction and Maintenance Occupations by Sex
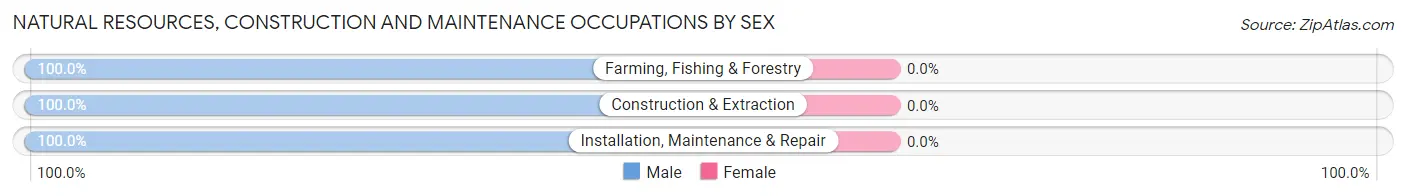
| Occupation | Male | Female |
| Farming, Fishing & Forestry | 3 (100.0%) | 0 (0.0%) |
| Construction & Extraction | 55 (100.0%) | 0 (0.0%) |
| Installation, Maintenance & Repair | 54 (100.0%) | 0 (0.0%) |
| Total (Category) | 112 (100.0%) | 0 (0.0%) |
| Total (Overall) | 678 (53.9%) | 580 (46.1%) |
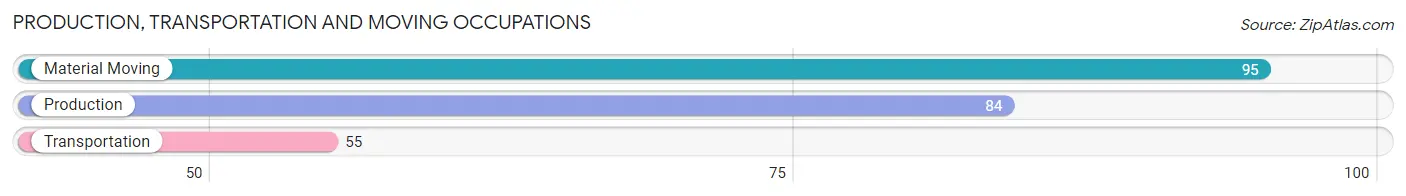
Production, Transportation and Moving Occupations
The most common Production, Transportation and Moving occupations in Carrollton are Material Moving (95 | 7.5%), Production (84 | 6.7%), and Transportation (55 | 4.4%).
Production, Transportation and Moving Occupations by Sex
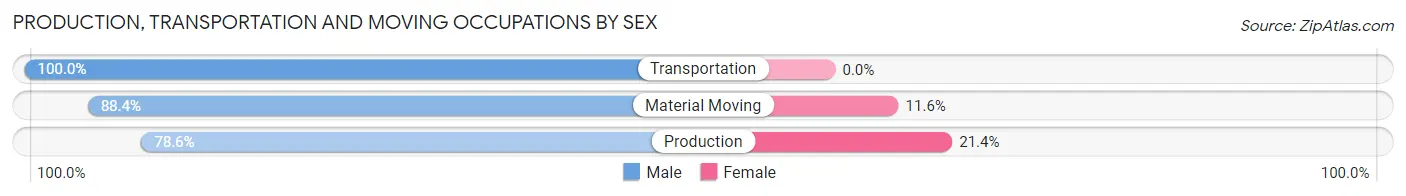
| Occupation | Male | Female |
| Production | 66 (78.6%) | 18 (21.4%) |
| Transportation | 55 (100.0%) | 0 (0.0%) |
| Material Moving | 84 (88.4%) | 11 (11.6%) |
| Total (Category) | 205 (87.6%) | 29 (12.4%) |
| Total (Overall) | 678 (53.9%) | 580 (46.1%) |
Employment Industries by Sex in Carrollton
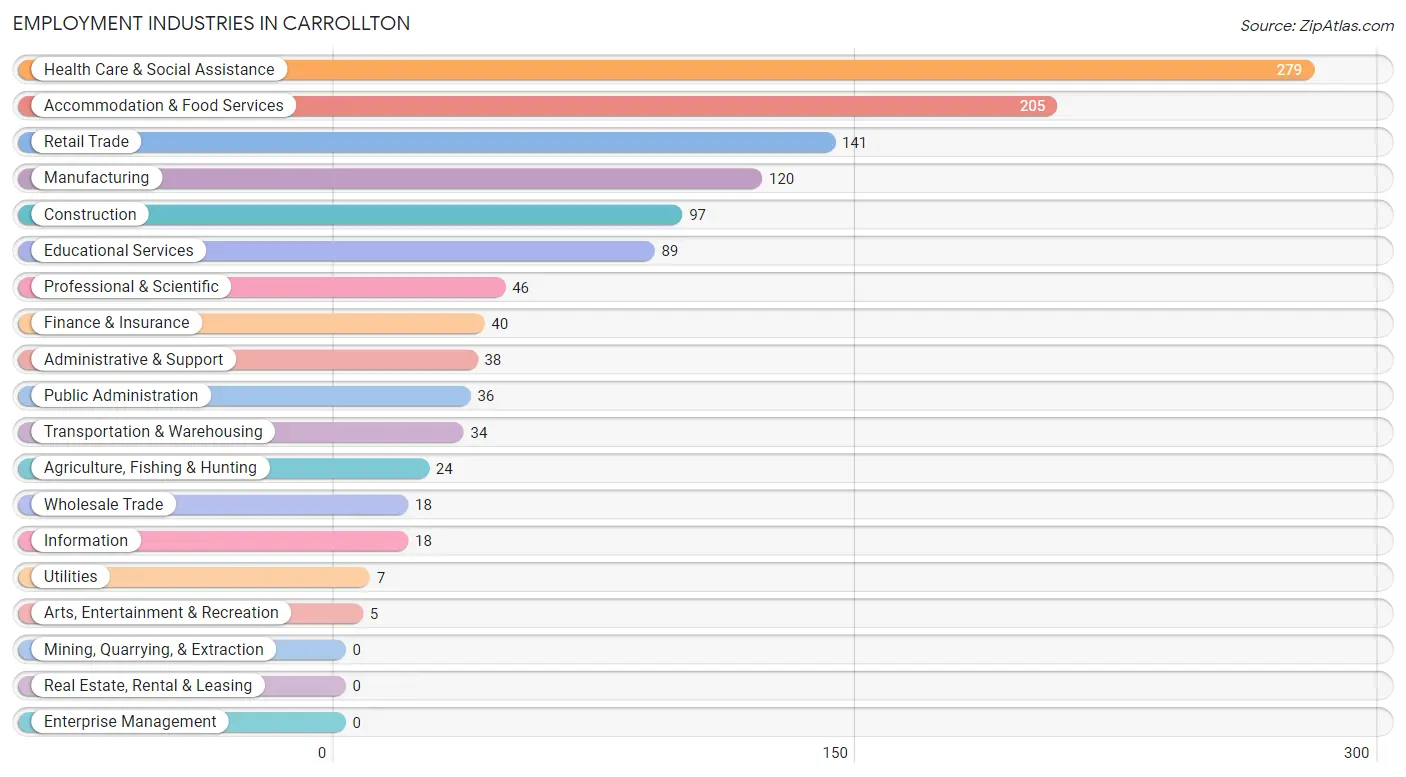
Employment Industries in Carrollton
The major employment industries in Carrollton include Health Care & Social Assistance (279 | 22.2%), Accommodation & Food Services (205 | 16.3%), Retail Trade (141 | 11.2%), Manufacturing (120 | 9.5%), and Construction (97 | 7.7%).
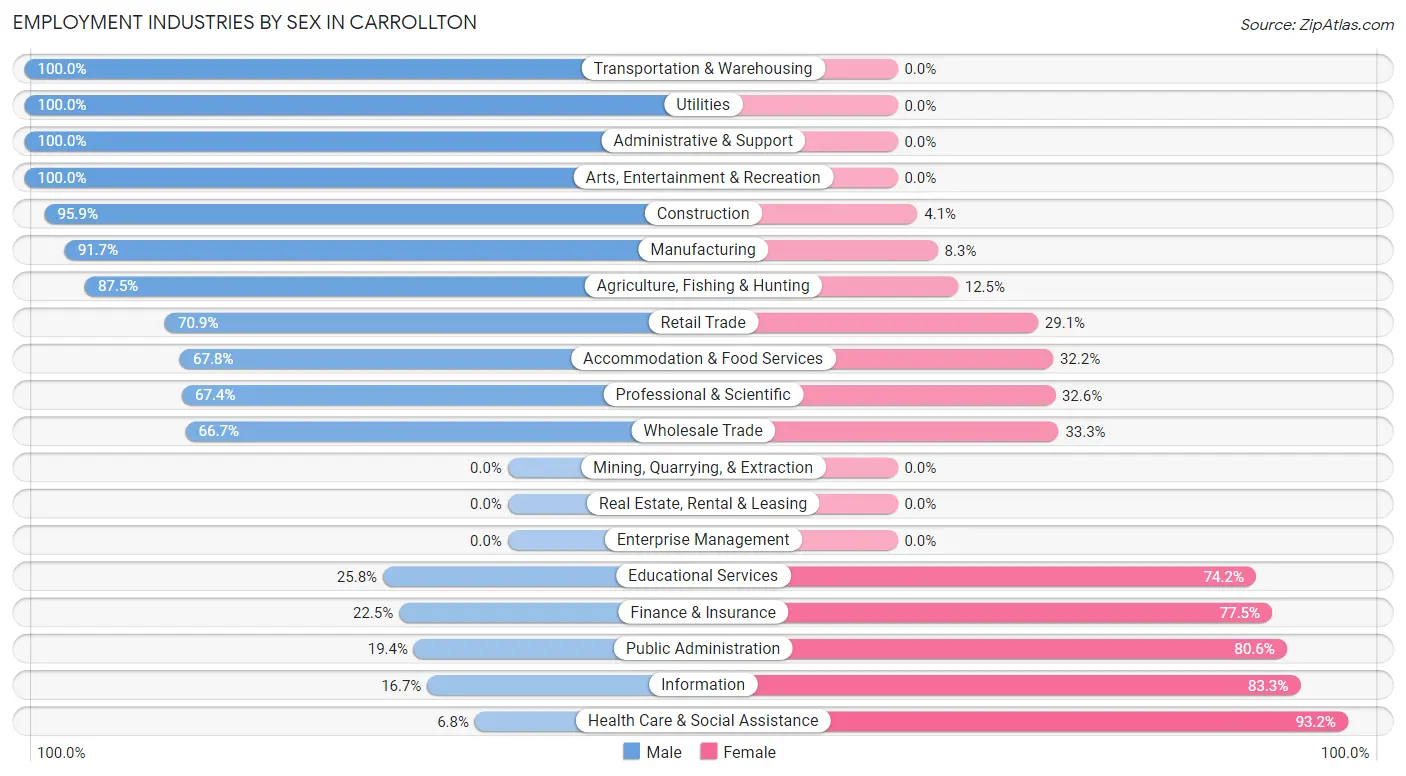
Employment Industries by Sex in Carrollton
The Carrollton industries that see more men than women are Transportation & Warehousing (100.0%), Utilities (100.0%), and Administrative & Support (100.0%), whereas the industries that tend to have a higher number of women are Health Care & Social Assistance (93.2%), Information (83.3%), and Public Administration (80.6%).
| Industry | Male | Female |
| Agriculture, Fishing & Hunting | 21 (87.5%) | 3 (12.5%) |
| Mining, Quarrying, & Extraction | 0 (0.0%) | 0 (0.0%) |
| Construction | 93 (95.9%) | 4 (4.1%) |
| Manufacturing | 110 (91.7%) | 10 (8.3%) |
| Wholesale Trade | 12 (66.7%) | 6 (33.3%) |
| Retail Trade | 100 (70.9%) | 41 (29.1%) |
| Transportation & Warehousing | 34 (100.0%) | 0 (0.0%) |
| Utilities | 7 (100.0%) | 0 (0.0%) |
| Information | 3 (16.7%) | 15 (83.3%) |
| Finance & Insurance | 9 (22.5%) | 31 (77.5%) |
| Real Estate, Rental & Leasing | 0 (0.0%) | 0 (0.0%) |
| Professional & Scientific | 31 (67.4%) | 15 (32.6%) |
| Enterprise Management | 0 (0.0%) | 0 (0.0%) |
| Administrative & Support | 38 (100.0%) | 0 (0.0%) |
| Educational Services | 23 (25.8%) | 66 (74.2%) |
| Health Care & Social Assistance | 19 (6.8%) | 260 (93.2%) |
| Arts, Entertainment & Recreation | 5 (100.0%) | 0 (0.0%) |
| Accommodation & Food Services | 139 (67.8%) | 66 (32.2%) |
| Public Administration | 7 (19.4%) | 29 (80.6%) |
| Total | 678 (53.9%) | 580 (46.1%) |
Education in Carrollton
School Enrollment in Carrollton
The most common levels of schooling among the 605 students in Carrollton are high school (166 | 27.4%), elementary school (133 | 22.0%), and nursery / preschool (114 | 18.8%).
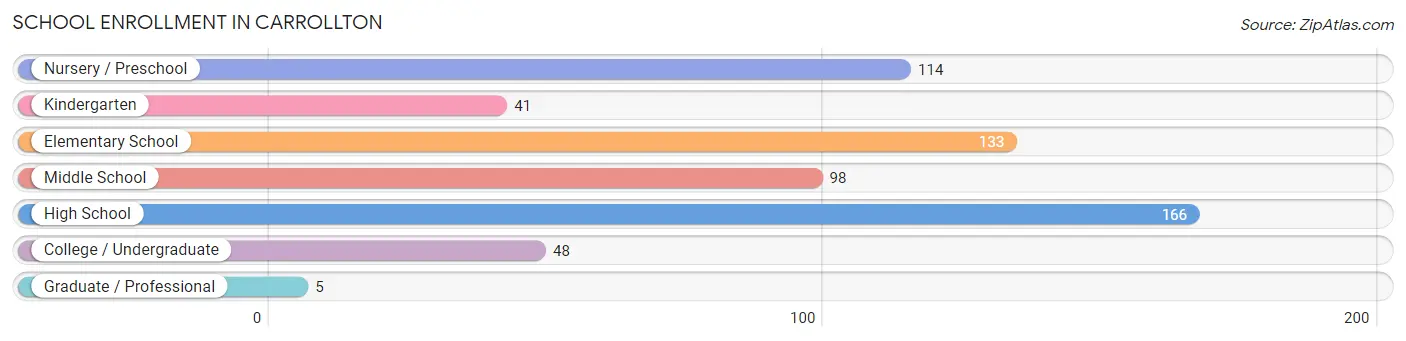
| School Level | # Students | % Students |
| Nursery / Preschool | 114 | 18.8% |
| Kindergarten | 41 | 6.8% |
| Elementary School | 133 | 22.0% |
| Middle School | 98 | 16.2% |
| High School | 166 | 27.4% |
| College / Undergraduate | 48 | 7.9% |
| Graduate / Professional | 5 | 0.8% |
| Total | 605 | 100.0% |
School Enrollment by Age by Funding Source in Carrollton
Out of a total of 605 students who are enrolled in schools in Carrollton, 190 (31.4%) attend a private institution, while the remaining 415 (68.6%) are enrolled in public schools. The age group of 5 to 9 year old has the highest likelihood of being enrolled in private schools, with 103 (61.3% in the age bracket) enrolled. Conversely, the age group of 15 to 17 year olds has the lowest likelihood of being enrolled in a private school, with 96 (100.0% in the age bracket) attending a public institution.
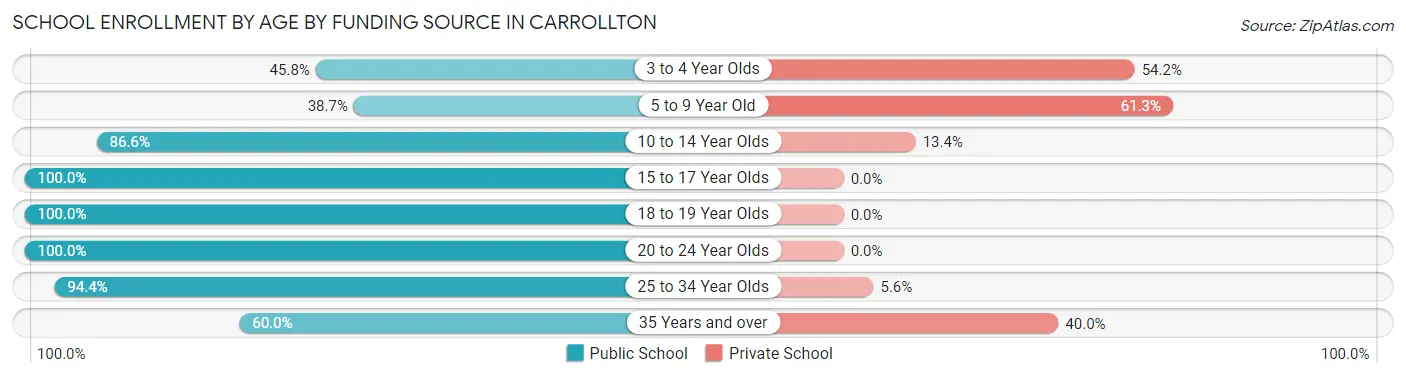
| Age Bracket | Public School | Private School |
| 3 to 4 Year Olds | 49 (45.8%) | 58 (54.2%) |
| 5 to 9 Year Old | 65 (38.7%) | 103 (61.3%) |
| 10 to 14 Year Olds | 129 (86.6%) | 20 (13.4%) |
| 15 to 17 Year Olds | 96 (100.0%) | 0 (0.0%) |
| 18 to 19 Year Olds | 32 (100.0%) | 0 (0.0%) |
| 20 to 24 Year Olds | 15 (100.0%) | 0 (0.0%) |
| 25 to 34 Year Olds | 17 (94.4%) | 1 (5.6%) |
| 35 Years and over | 12 (60.0%) | 8 (40.0%) |
| Total | 415 (68.6%) | 190 (31.4%) |
Educational Attainment by Field of Study in Carrollton
Education (67 | 23.0%), business (65 | 22.3%), science & technology (55 | 18.8%), social sciences (23 | 7.9%), and arts & humanities (20 | 6.9%) are the most common fields of study among 292 individuals in Carrollton who have obtained a bachelor's degree or higher.
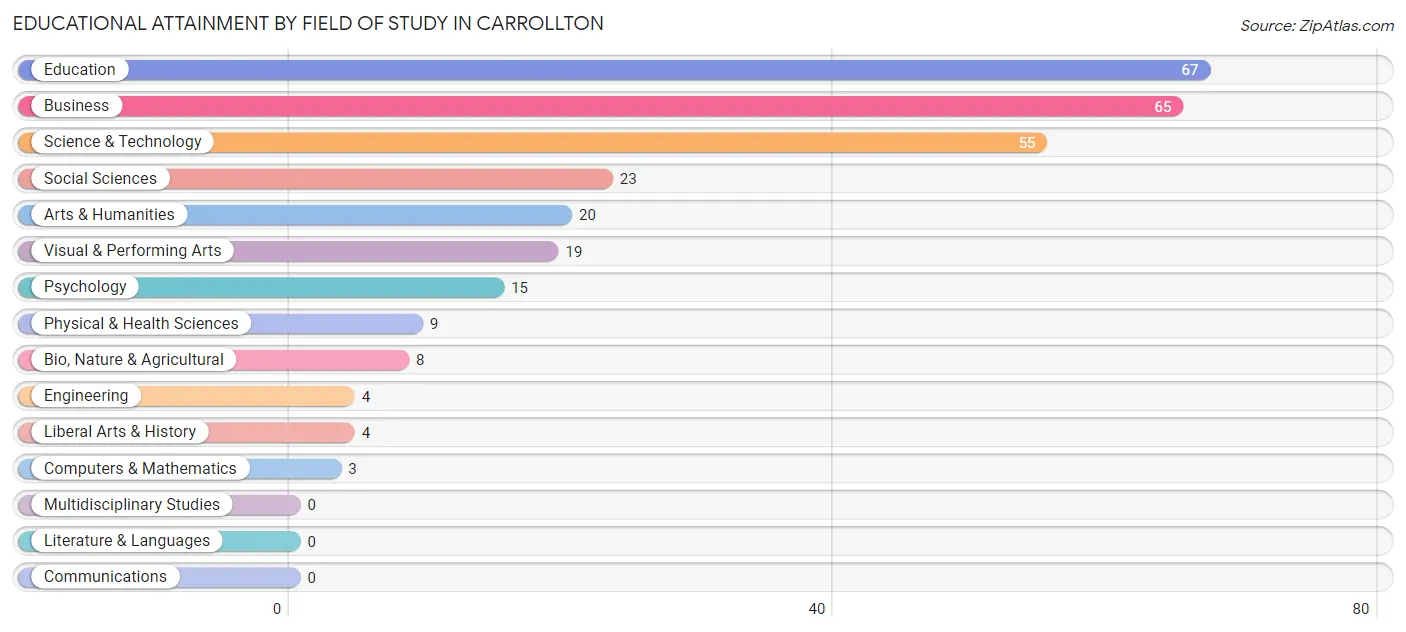
| Field of Study | # Graduates | % Graduates |
| Computers & Mathematics | 3 | 1.0% |
| Bio, Nature & Agricultural | 8 | 2.7% |
| Physical & Health Sciences | 9 | 3.1% |
| Psychology | 15 | 5.1% |
| Social Sciences | 23 | 7.9% |
| Engineering | 4 | 1.4% |
| Multidisciplinary Studies | 0 | 0.0% |
| Science & Technology | 55 | 18.8% |
| Business | 65 | 22.3% |
| Education | 67 | 23.0% |
| Literature & Languages | 0 | 0.0% |
| Liberal Arts & History | 4 | 1.4% |
| Visual & Performing Arts | 19 | 6.5% |
| Communications | 0 | 0.0% |
| Arts & Humanities | 20 | 6.9% |
| Total | 292 | 100.0% |
Transportation & Commute in Carrollton
Vehicle Availability by Sex in Carrollton
The most prevalent vehicle ownership categories in Carrollton are males with 2 vehicles (232, accounting for 34.5%) and females with 2 vehicles (193, making up 43.2%).
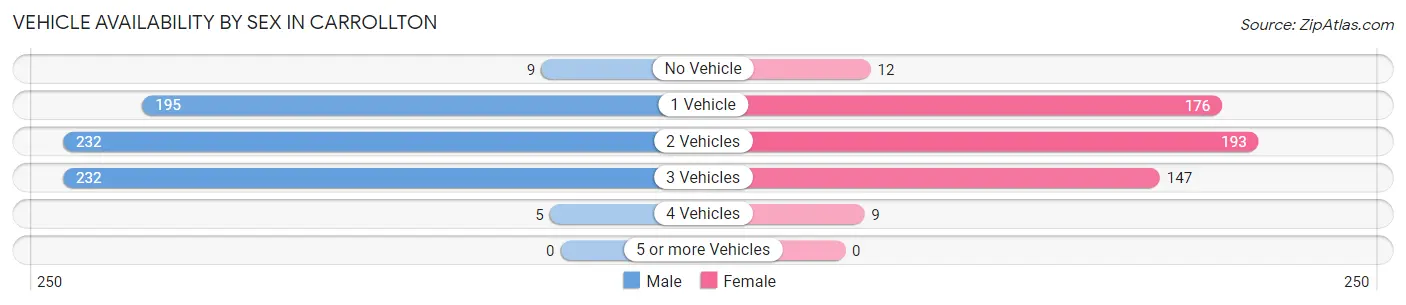
| Vehicles Available | Male | Female |
| No Vehicle | 9 (1.3%) | 12 (2.2%) |
| 1 Vehicle | 195 (29.0%) | 176 (32.8%) |
| 2 Vehicles | 232 (34.5%) | 193 (35.9%) |
| 3 Vehicles | 232 (34.5%) | 147 (27.4%) |
| 4 Vehicles | 5 (0.7%) | 9 (1.7%) |
| 5 or more Vehicles | 0 (0.0%) | 0 (0.0%) |
| Total | 673 (100.0%) | 537 (100.0%) |
Commute Time in Carrollton
The most frequently occuring commute durations in Carrollton are less than 5 minutes (221 commuters, 20.4%), 5 to 9 minutes (179 commuters, 16.5%), and 60 to 89 minutes (140 commuters, 12.9%).
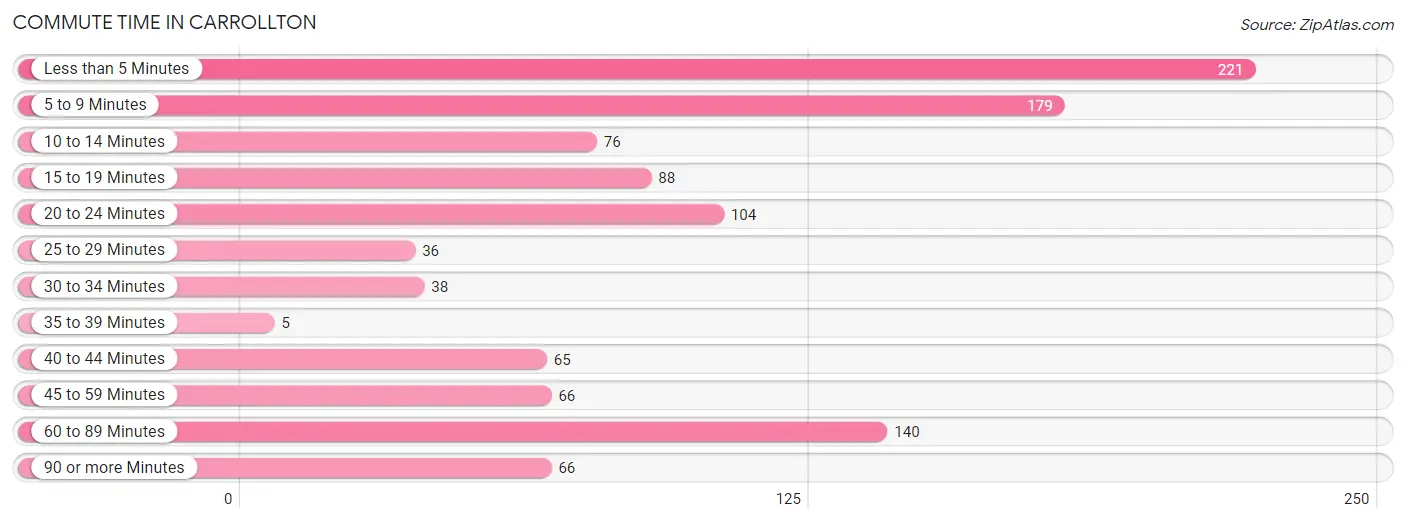
| Commute Time | # Commuters | % Commuters |
| Less than 5 Minutes | 221 | 20.4% |
| 5 to 9 Minutes | 179 | 16.5% |
| 10 to 14 Minutes | 76 | 7.0% |
| 15 to 19 Minutes | 88 | 8.1% |
| 20 to 24 Minutes | 104 | 9.6% |
| 25 to 29 Minutes | 36 | 3.3% |
| 30 to 34 Minutes | 38 | 3.5% |
| 35 to 39 Minutes | 5 | 0.5% |
| 40 to 44 Minutes | 65 | 6.0% |
| 45 to 59 Minutes | 66 | 6.1% |
| 60 to 89 Minutes | 140 | 12.9% |
| 90 or more Minutes | 66 | 6.1% |
Commute Time by Sex in Carrollton
The most common commute times in Carrollton are less than 5 minutes (119 commuters, 19.1%) for males and 5 to 9 minutes (110 commuters, 23.9%) for females.
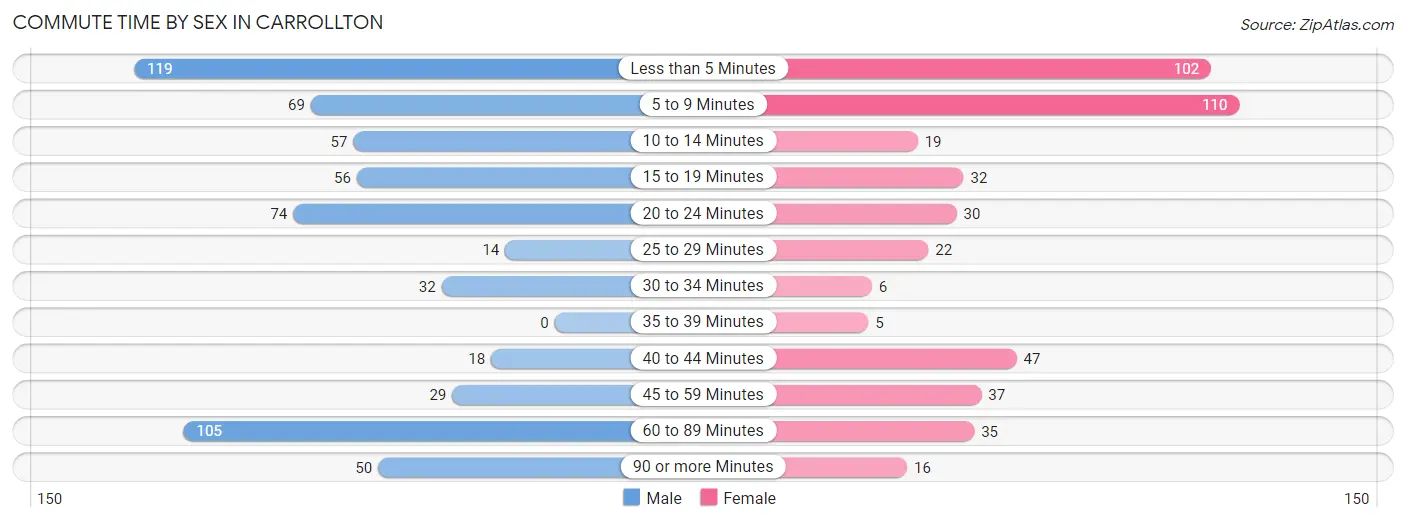
| Commute Time | Male | Female |
| Less than 5 Minutes | 119 (19.1%) | 102 (22.1%) |
| 5 to 9 Minutes | 69 (11.1%) | 110 (23.9%) |
| 10 to 14 Minutes | 57 (9.1%) | 19 (4.1%) |
| 15 to 19 Minutes | 56 (9.0%) | 32 (6.9%) |
| 20 to 24 Minutes | 74 (11.9%) | 30 (6.5%) |
| 25 to 29 Minutes | 14 (2.2%) | 22 (4.8%) |
| 30 to 34 Minutes | 32 (5.1%) | 6 (1.3%) |
| 35 to 39 Minutes | 0 (0.0%) | 5 (1.1%) |
| 40 to 44 Minutes | 18 (2.9%) | 47 (10.2%) |
| 45 to 59 Minutes | 29 (4.6%) | 37 (8.0%) |
| 60 to 89 Minutes | 105 (16.9%) | 35 (7.6%) |
| 90 or more Minutes | 50 (8.0%) | 16 (3.5%) |
Time of Departure to Work by Sex in Carrollton
The most frequent times of departure to work in Carrollton are 7:00 AM to 7:29 AM (152, 24.4%) for males and 6:30 AM to 6:59 AM (74, 16.1%) for females.
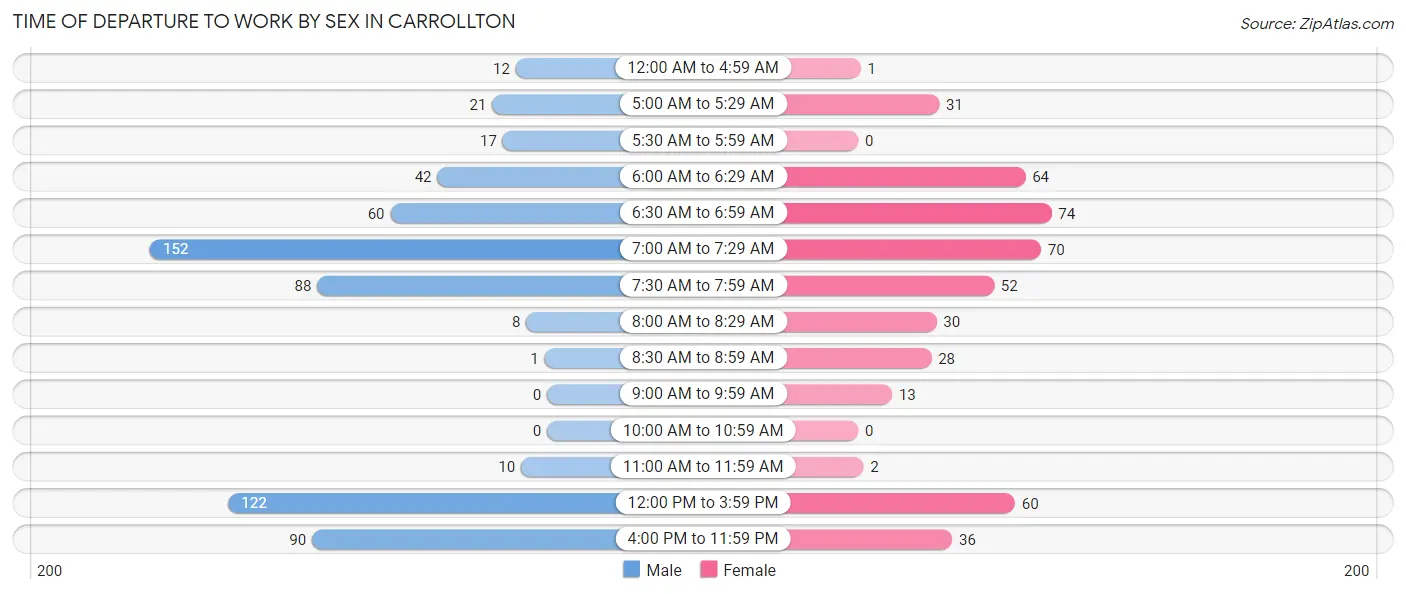
| Time of Departure | Male | Female |
| 12:00 AM to 4:59 AM | 12 (1.9%) | 1 (0.2%) |
| 5:00 AM to 5:29 AM | 21 (3.4%) | 31 (6.7%) |
| 5:30 AM to 5:59 AM | 17 (2.7%) | 0 (0.0%) |
| 6:00 AM to 6:29 AM | 42 (6.7%) | 64 (13.9%) |
| 6:30 AM to 6:59 AM | 60 (9.6%) | 74 (16.1%) |
| 7:00 AM to 7:29 AM | 152 (24.4%) | 70 (15.2%) |
| 7:30 AM to 7:59 AM | 88 (14.1%) | 52 (11.3%) |
| 8:00 AM to 8:29 AM | 8 (1.3%) | 30 (6.5%) |
| 8:30 AM to 8:59 AM | 1 (0.2%) | 28 (6.1%) |
| 9:00 AM to 9:59 AM | 0 (0.0%) | 13 (2.8%) |
| 10:00 AM to 10:59 AM | 0 (0.0%) | 0 (0.0%) |
| 11:00 AM to 11:59 AM | 10 (1.6%) | 2 (0.4%) |
| 12:00 PM to 3:59 PM | 122 (19.6%) | 60 (13.0%) |
| 4:00 PM to 11:59 PM | 90 (14.4%) | 36 (7.8%) |
| Total | 623 (100.0%) | 461 (100.0%) |
Housing Occupancy in Carrollton
Occupancy by Ownership in Carrollton
Of the total 960 dwellings in Carrollton, owner-occupied units account for 650 (67.7%), while renter-occupied units make up 310 (32.3%).
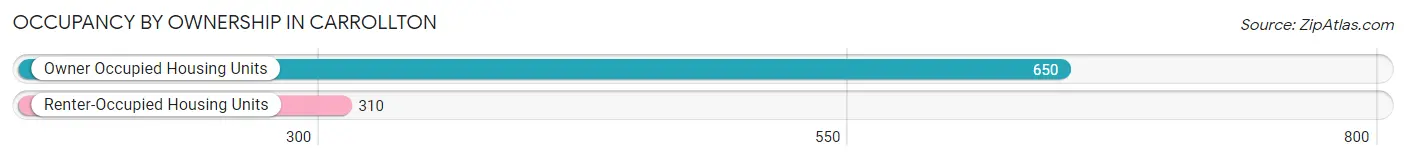
| Occupancy | # Housing Units | % Housing Units |
| Owner Occupied Housing Units | 650 | 67.7% |
| Renter-Occupied Housing Units | 310 | 32.3% |
| Total Occupied Housing Units | 960 | 100.0% |
Occupancy by Household Size in Carrollton
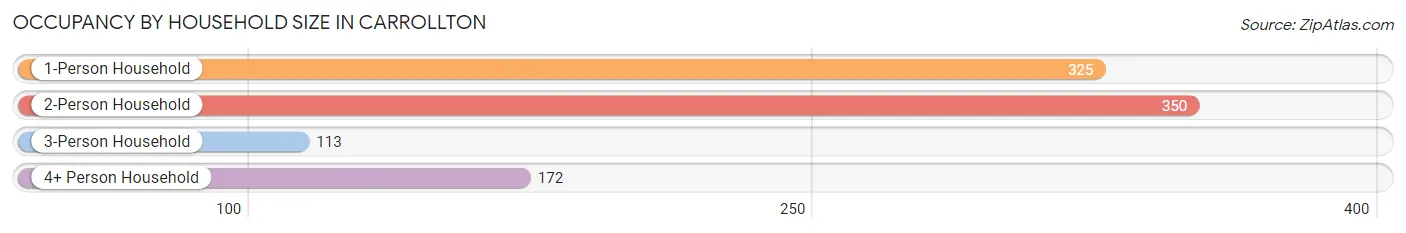
| Household Size | # Housing Units | % Housing Units |
| 1-Person Household | 325 | 33.9% |
| 2-Person Household | 350 | 36.5% |
| 3-Person Household | 113 | 11.8% |
| 4+ Person Household | 172 | 17.9% |
| Total Housing Units | 960 | 100.0% |
Occupancy by Ownership by Household Size in Carrollton
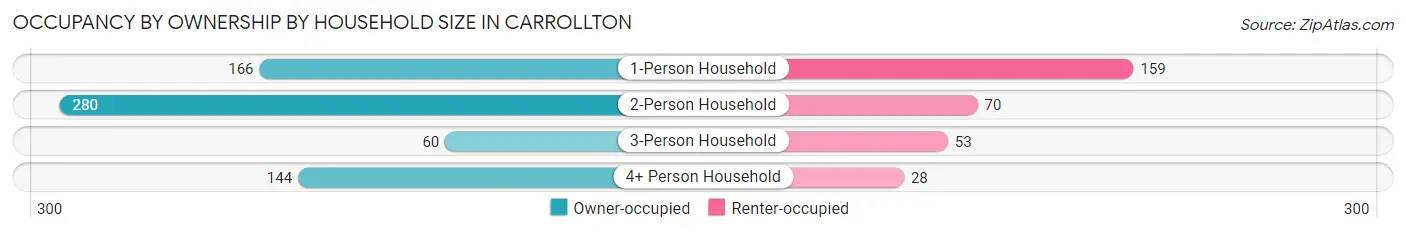
| Household Size | Owner-occupied | Renter-occupied |
| 1-Person Household | 166 (51.1%) | 159 (48.9%) |
| 2-Person Household | 280 (80.0%) | 70 (20.0%) |
| 3-Person Household | 60 (53.1%) | 53 (46.9%) |
| 4+ Person Household | 144 (83.7%) | 28 (16.3%) |
| Total Housing Units | 650 (67.7%) | 310 (32.3%) |
Occupancy by Educational Attainment in Carrollton
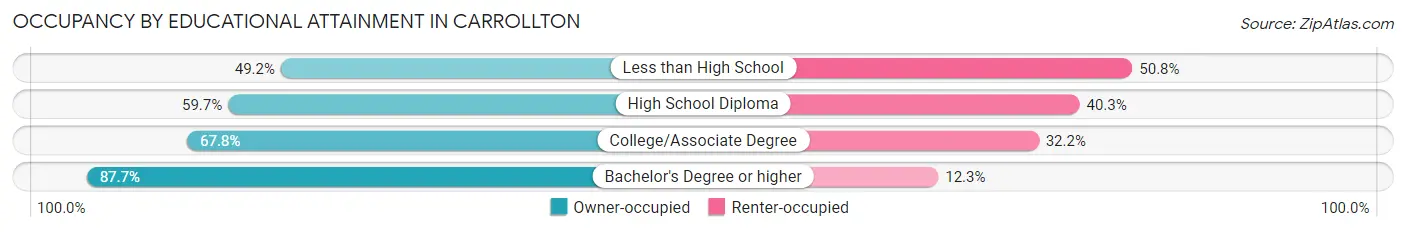
| Household Size | Owner-occupied | Renter-occupied |
| Less than High School | 31 (49.2%) | 32 (50.8%) |
| High School Diploma | 216 (59.7%) | 146 (40.3%) |
| College/Associate Degree | 225 (67.8%) | 107 (32.2%) |
| Bachelor's Degree or higher | 178 (87.7%) | 25 (12.3%) |
Occupancy by Age of Householder in Carrollton
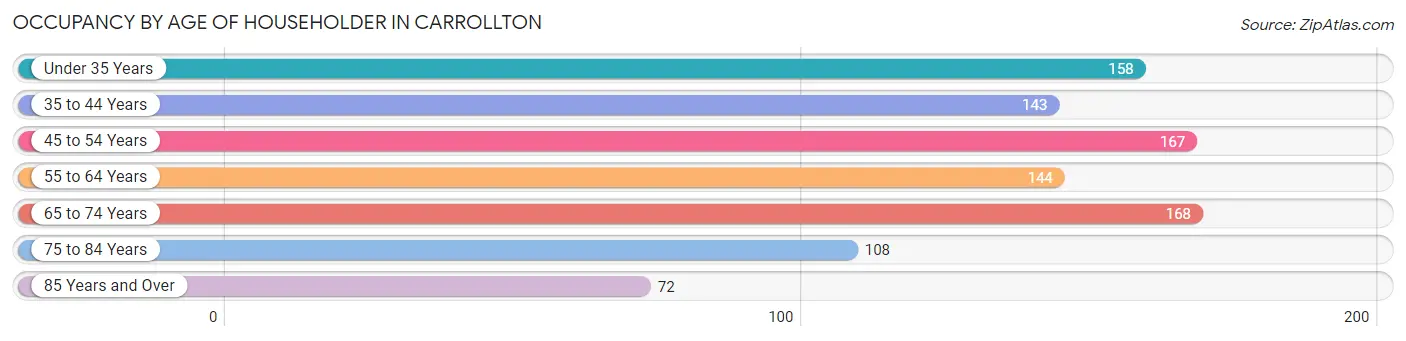
| Age Bracket | # Households | % Households |
| Under 35 Years | 158 | 16.5% |
| 35 to 44 Years | 143 | 14.9% |
| 45 to 54 Years | 167 | 17.4% |
| 55 to 64 Years | 144 | 15.0% |
| 65 to 74 Years | 168 | 17.5% |
| 75 to 84 Years | 108 | 11.3% |
| 85 Years and Over | 72 | 7.5% |
| Total | 960 | 100.0% |
Housing Finances in Carrollton
Median Income by Occupancy in Carrollton
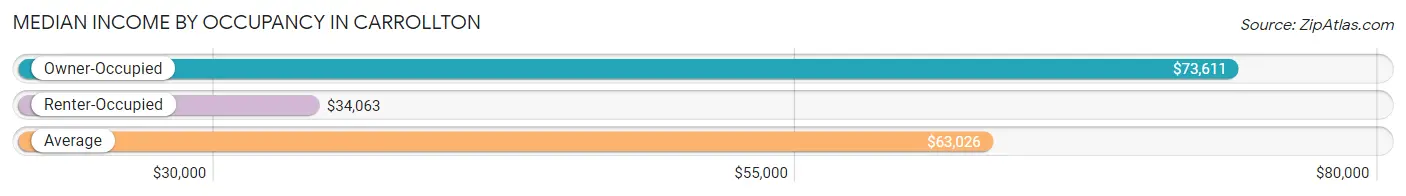
| Occupancy Type | # Households | Median Income |
| Owner-Occupied | 650 (67.7%) | $73,611 |
| Renter-Occupied | 310 (32.3%) | $34,063 |
| Average | 960 (100.0%) | $63,026 |
Occupancy by Householder Income Bracket in Carrollton
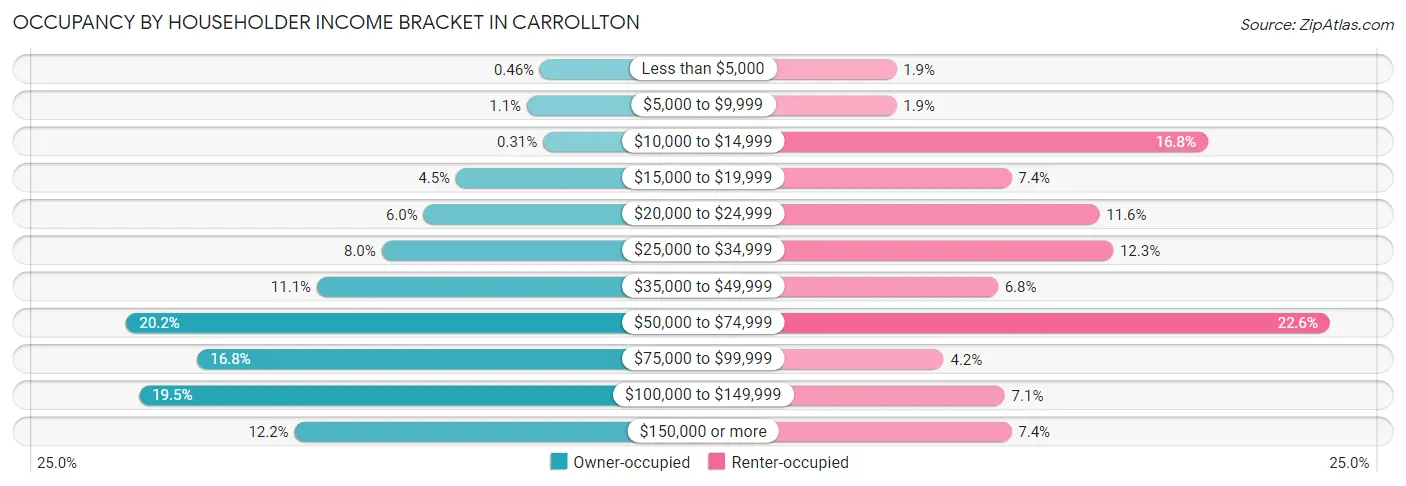
| Income Bracket | Owner-occupied | Renter-occupied |
| Less than $5,000 | 3 (0.5%) | 6 (1.9%) |
| $5,000 to $9,999 | 7 (1.1%) | 6 (1.9%) |
| $10,000 to $14,999 | 2 (0.3%) | 52 (16.8%) |
| $15,000 to $19,999 | 29 (4.5%) | 23 (7.4%) |
| $20,000 to $24,999 | 39 (6.0%) | 36 (11.6%) |
| $25,000 to $34,999 | 52 (8.0%) | 38 (12.3%) |
| $35,000 to $49,999 | 72 (11.1%) | 21 (6.8%) |
| $50,000 to $74,999 | 131 (20.2%) | 70 (22.6%) |
| $75,000 to $99,999 | 109 (16.8%) | 13 (4.2%) |
| $100,000 to $149,999 | 127 (19.5%) | 22 (7.1%) |
| $150,000 or more | 79 (12.1%) | 23 (7.4%) |
| Total | 650 (100.0%) | 310 (100.0%) |
Monthly Housing Cost Tiers in Carrollton
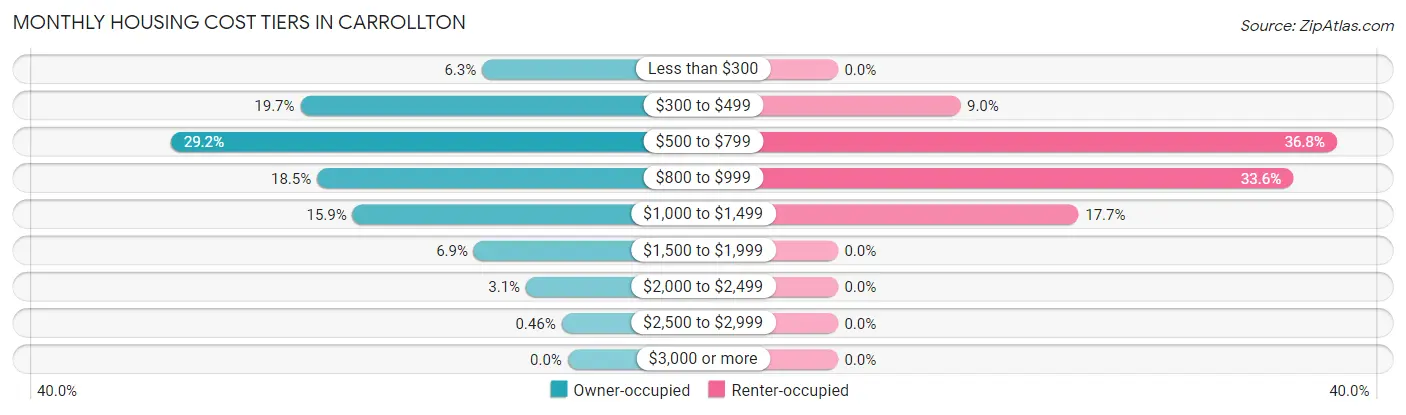
| Monthly Cost | Owner-occupied | Renter-occupied |
| Less than $300 | 41 (6.3%) | 0 (0.0%) |
| $300 to $499 | 128 (19.7%) | 28 (9.0%) |
| $500 to $799 | 190 (29.2%) | 114 (36.8%) |
| $800 to $999 | 120 (18.5%) | 104 (33.6%) |
| $1,000 to $1,499 | 103 (15.9%) | 55 (17.7%) |
| $1,500 to $1,999 | 45 (6.9%) | 0 (0.0%) |
| $2,000 to $2,499 | 20 (3.1%) | 0 (0.0%) |
| $2,500 to $2,999 | 3 (0.5%) | 0 (0.0%) |
| $3,000 or more | 0 (0.0%) | 0 (0.0%) |
| Total | 650 (100.0%) | 310 (100.0%) |
Physical Housing Characteristics in Carrollton
Housing Structures in Carrollton
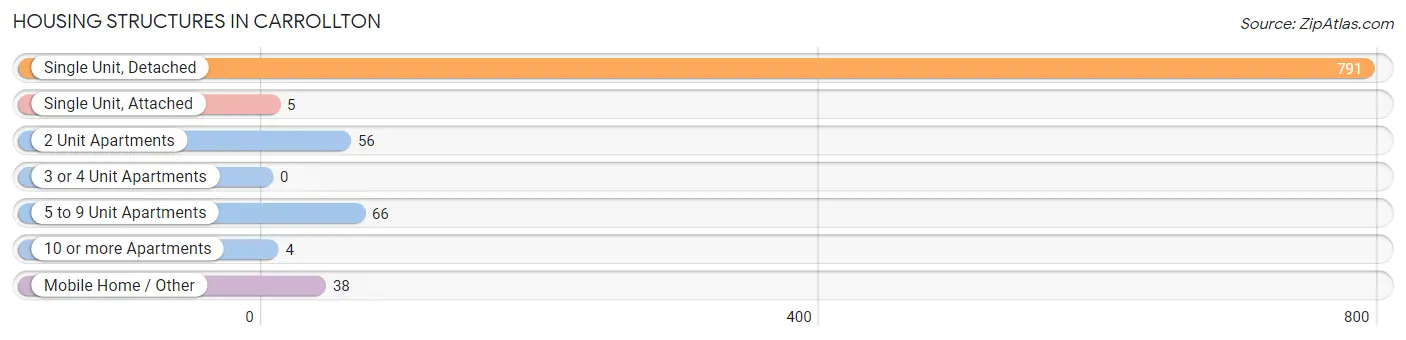
| Structure Type | # Housing Units | % Housing Units |
| Single Unit, Detached | 791 | 82.4% |
| Single Unit, Attached | 5 | 0.5% |
| 2 Unit Apartments | 56 | 5.8% |
| 3 or 4 Unit Apartments | 0 | 0.0% |
| 5 to 9 Unit Apartments | 66 | 6.9% |
| 10 or more Apartments | 4 | 0.4% |
| Mobile Home / Other | 38 | 4.0% |
| Total | 960 | 100.0% |
Housing Structures by Occupancy in Carrollton
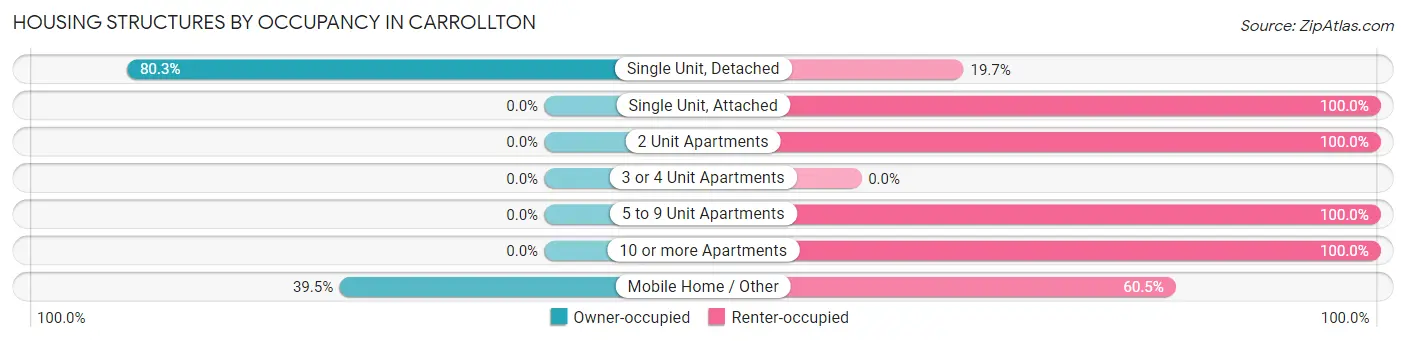
| Structure Type | Owner-occupied | Renter-occupied |
| Single Unit, Detached | 635 (80.3%) | 156 (19.7%) |
| Single Unit, Attached | 0 (0.0%) | 5 (100.0%) |
| 2 Unit Apartments | 0 (0.0%) | 56 (100.0%) |
| 3 or 4 Unit Apartments | 0 (0.0%) | 0 (0.0%) |
| 5 to 9 Unit Apartments | 0 (0.0%) | 66 (100.0%) |
| 10 or more Apartments | 0 (0.0%) | 4 (100.0%) |
| Mobile Home / Other | 15 (39.5%) | 23 (60.5%) |
| Total | 650 (67.7%) | 310 (32.3%) |
Housing Structures by Number of Rooms in Carrollton
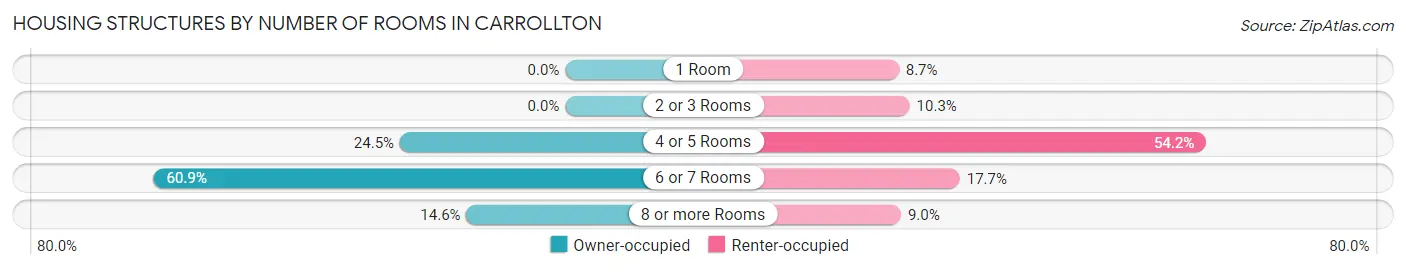
| Number of Rooms | Owner-occupied | Renter-occupied |
| 1 Room | 0 (0.0%) | 27 (8.7%) |
| 2 or 3 Rooms | 0 (0.0%) | 32 (10.3%) |
| 4 or 5 Rooms | 159 (24.5%) | 168 (54.2%) |
| 6 or 7 Rooms | 396 (60.9%) | 55 (17.7%) |
| 8 or more Rooms | 95 (14.6%) | 28 (9.0%) |
| Total | 650 (100.0%) | 310 (100.0%) |
Housing Structure by Heating Type in Carrollton
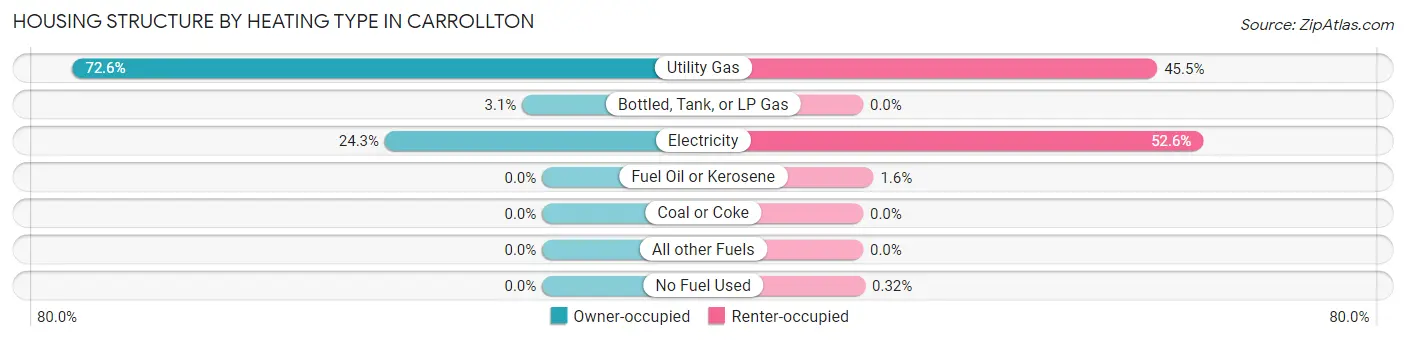
| Heating Type | Owner-occupied | Renter-occupied |
| Utility Gas | 472 (72.6%) | 141 (45.5%) |
| Bottled, Tank, or LP Gas | 20 (3.1%) | 0 (0.0%) |
| Electricity | 158 (24.3%) | 163 (52.6%) |
| Fuel Oil or Kerosene | 0 (0.0%) | 5 (1.6%) |
| Coal or Coke | 0 (0.0%) | 0 (0.0%) |
| All other Fuels | 0 (0.0%) | 0 (0.0%) |
| No Fuel Used | 0 (0.0%) | 1 (0.3%) |
| Total | 650 (100.0%) | 310 (100.0%) |
Household Vehicle Usage in Carrollton
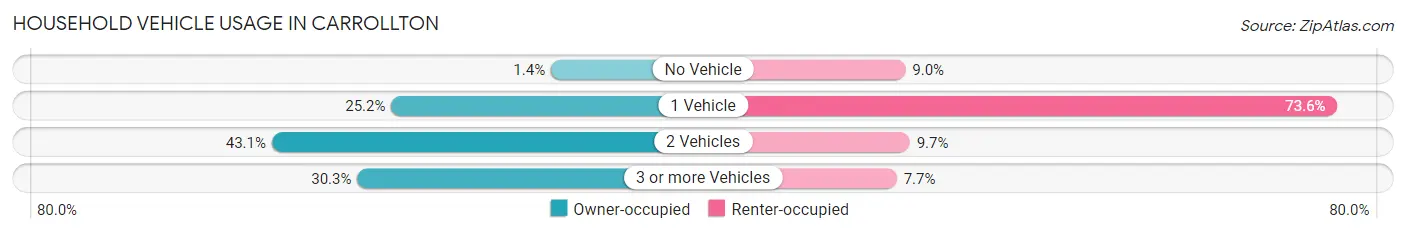
| Vehicles per Household | Owner-occupied | Renter-occupied |
| No Vehicle | 9 (1.4%) | 28 (9.0%) |
| 1 Vehicle | 164 (25.2%) | 228 (73.6%) |
| 2 Vehicles | 280 (43.1%) | 30 (9.7%) |
| 3 or more Vehicles | 197 (30.3%) | 24 (7.7%) |
| Total | 650 (100.0%) | 310 (100.0%) |
Real Estate & Mortgages in Carrollton
Real Estate and Mortgage Overview in Carrollton
| Characteristic | Without Mortgage | With Mortgage |
| Housing Units | 358 | 292 |
| Median Property Value | $111,100 | $105,100 |
| Median Household Income | $60,938 | $62 |
| Monthly Housing Costs | $508 | $0 |
| Real Estate Taxes | $1,558 | $7 |
Property Value by Mortgage Status in Carrollton
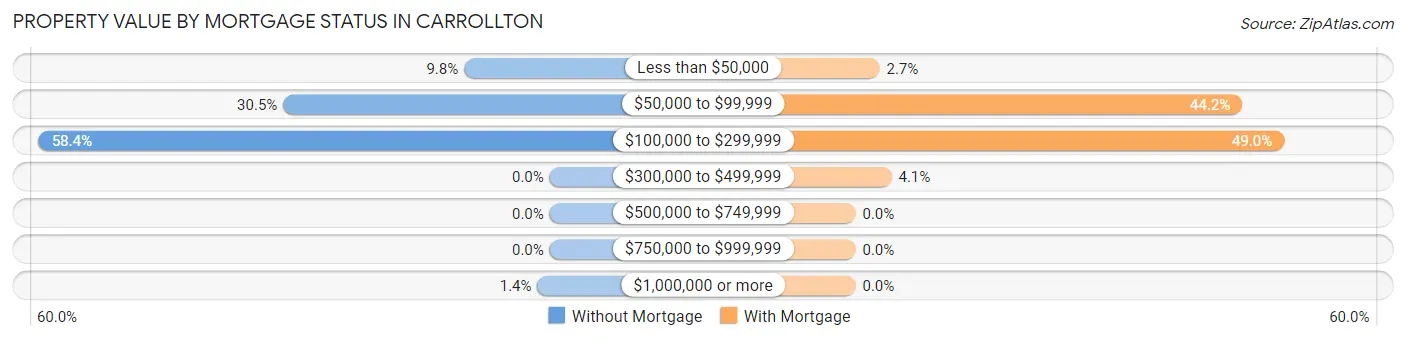
| Property Value | Without Mortgage | With Mortgage |
| Less than $50,000 | 35 (9.8%) | 8 (2.7%) |
| $50,000 to $99,999 | 109 (30.4%) | 129 (44.2%) |
| $100,000 to $299,999 | 209 (58.4%) | 143 (49.0%) |
| $300,000 to $499,999 | 0 (0.0%) | 12 (4.1%) |
| $500,000 to $749,999 | 0 (0.0%) | 0 (0.0%) |
| $750,000 to $999,999 | 0 (0.0%) | 0 (0.0%) |
| $1,000,000 or more | 5 (1.4%) | 0 (0.0%) |
| Total | 358 (100.0%) | 292 (100.0%) |
Household Income by Mortgage Status in Carrollton
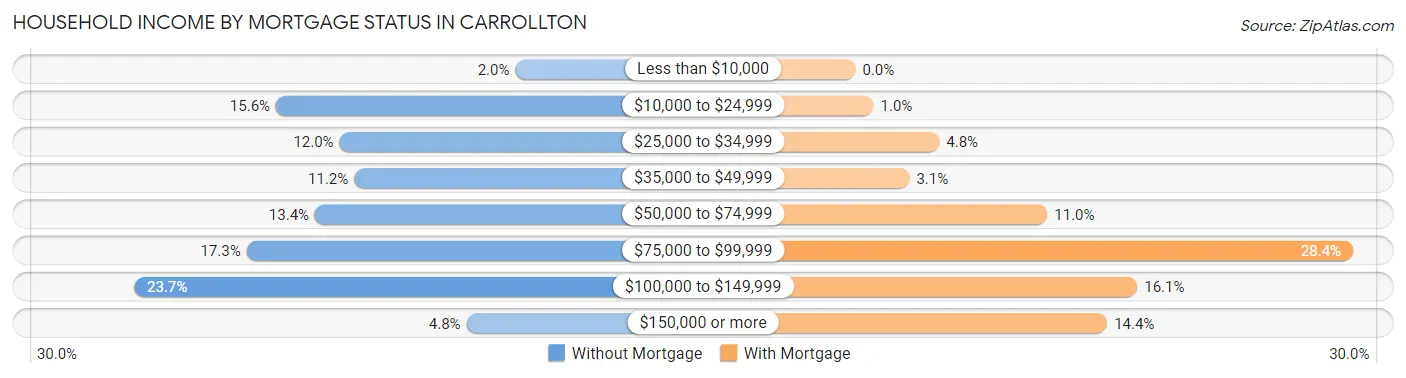
| Household Income | Without Mortgage | With Mortgage |
| Less than $10,000 | 7 (2.0%) | 0 (0.0%) |
| $10,000 to $24,999 | 56 (15.6%) | 3 (1.0%) |
| $25,000 to $34,999 | 43 (12.0%) | 14 (4.8%) |
| $35,000 to $49,999 | 40 (11.2%) | 9 (3.1%) |
| $50,000 to $74,999 | 48 (13.4%) | 32 (11.0%) |
| $75,000 to $99,999 | 62 (17.3%) | 83 (28.4%) |
| $100,000 to $149,999 | 85 (23.7%) | 47 (16.1%) |
| $150,000 or more | 17 (4.8%) | 42 (14.4%) |
| Total | 358 (100.0%) | 292 (100.0%) |
Property Value to Household Income Ratio in Carrollton
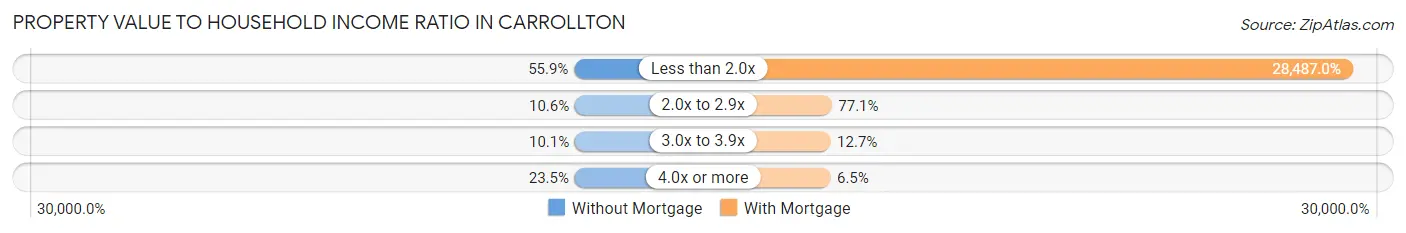
| Value-to-Income Ratio | Without Mortgage | With Mortgage |
| Less than 2.0x | 200 (55.9%) | 83,182 (28,487.0%) |
| 2.0x to 2.9x | 38 (10.6%) | 225 (77.0%) |
| 3.0x to 3.9x | 36 (10.1%) | 37 (12.7%) |
| 4.0x or more | 84 (23.5%) | 19 (6.5%) |
| Total | 358 (100.0%) | 292 (100.0%) |
Real Estate Taxes by Mortgage Status in Carrollton
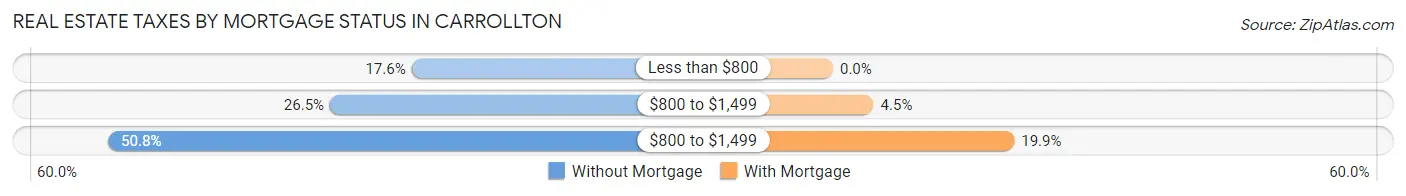
| Property Taxes | Without Mortgage | With Mortgage |
| Less than $800 | 63 (17.6%) | 0 (0.0%) |
| $800 to $1,499 | 95 (26.5%) | 13 (4.4%) |
| $800 to $1,499 | 182 (50.8%) | 58 (19.9%) |
| Total | 358 (100.0%) | 292 (100.0%) |
Health & Disability in Carrollton
Health Insurance Coverage by Age in Carrollton
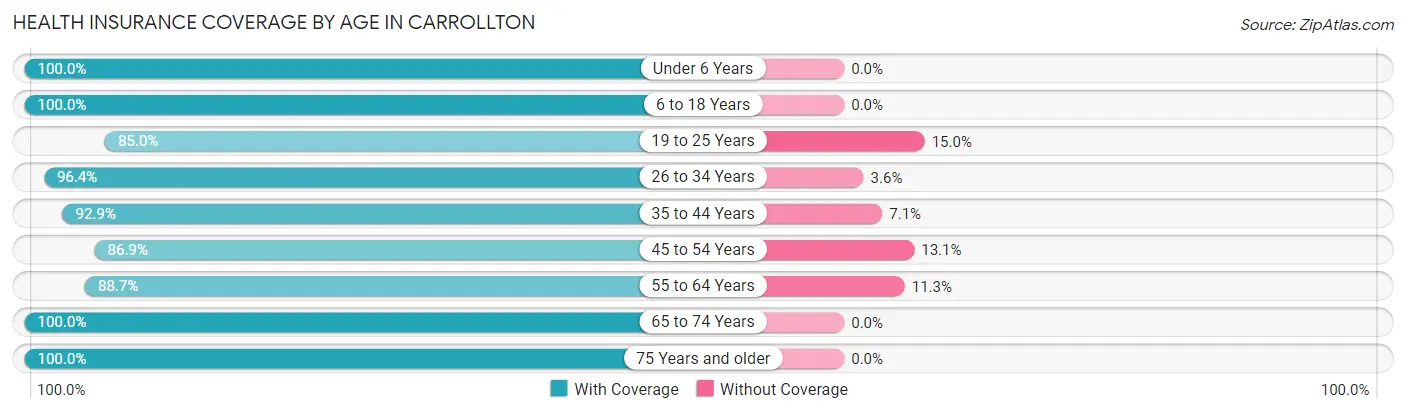
| Age Bracket | With Coverage | Without Coverage |
| Under 6 Years | 243 (100.0%) | 0 (0.0%) |
| 6 to 18 Years | 433 (100.0%) | 0 (0.0%) |
| 19 to 25 Years | 187 (85.0%) | 33 (15.0%) |
| 26 to 34 Years | 240 (96.4%) | 9 (3.6%) |
| 35 to 44 Years | 249 (92.9%) | 19 (7.1%) |
| 45 to 54 Years | 293 (86.9%) | 44 (13.1%) |
| 55 to 64 Years | 228 (88.7%) | 29 (11.3%) |
| 65 to 74 Years | 281 (100.0%) | 0 (0.0%) |
| 75 Years and older | 221 (100.0%) | 0 (0.0%) |
| Total | 2,375 (94.7%) | 134 (5.3%) |
Health Insurance Coverage by Citizenship Status in Carrollton
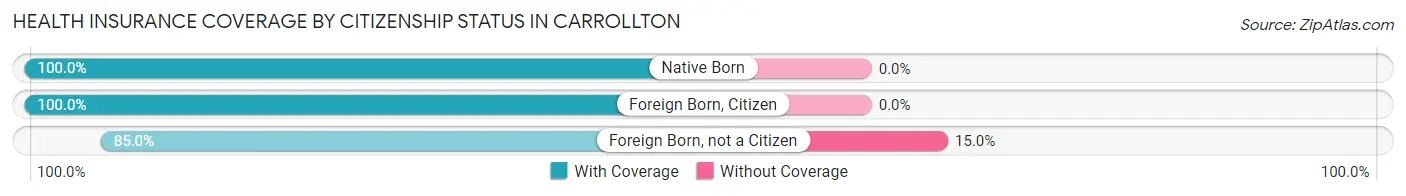
| Citizenship Status | With Coverage | Without Coverage |
| Native Born | 243 (100.0%) | 0 (0.0%) |
| Foreign Born, Citizen | 433 (100.0%) | 0 (0.0%) |
| Foreign Born, not a Citizen | 187 (85.0%) | 33 (15.0%) |
Health Insurance Coverage by Household Income in Carrollton
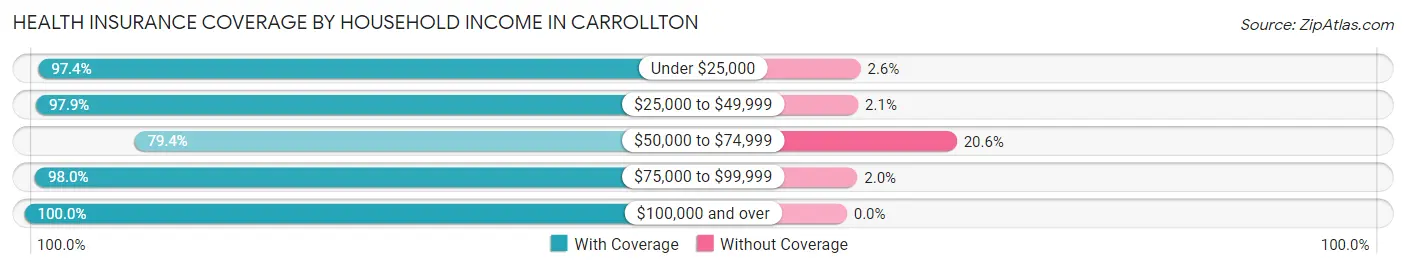
| Household Income | With Coverage | Without Coverage |
| Under $25,000 | 265 (97.4%) | 7 (2.6%) |
| $25,000 to $49,999 | 322 (97.9%) | 7 (2.1%) |
| $50,000 to $74,999 | 428 (79.4%) | 111 (20.6%) |
| $75,000 to $99,999 | 446 (98.0%) | 9 (2.0%) |
| $100,000 and over | 914 (100.0%) | 0 (0.0%) |
Public vs Private Health Insurance Coverage by Age in Carrollton
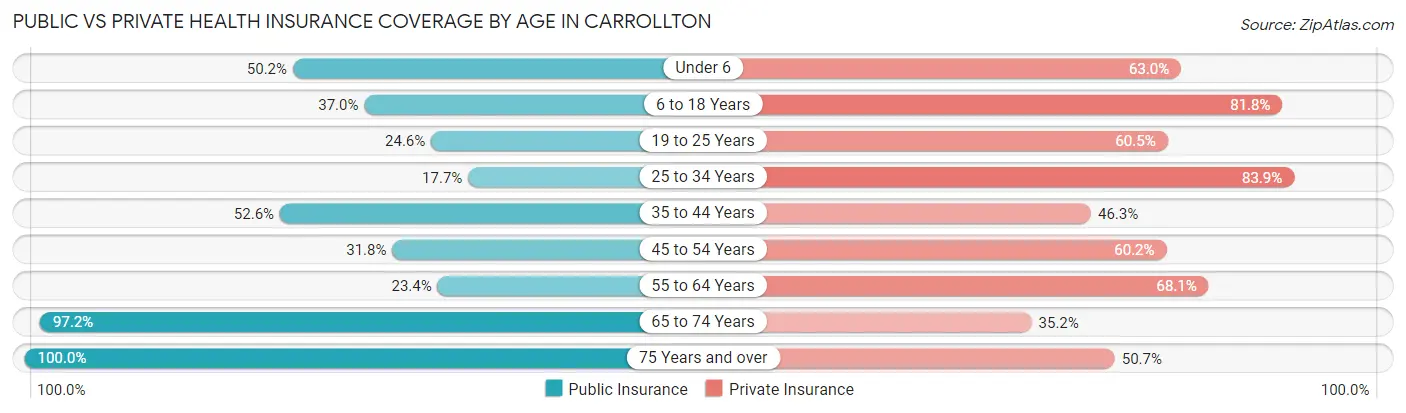
| Age Bracket | Public Insurance | Private Insurance |
| Under 6 | 122 (50.2%) | 153 (63.0%) |
| 6 to 18 Years | 160 (36.9%) | 354 (81.8%) |
| 19 to 25 Years | 54 (24.5%) | 133 (60.5%) |
| 25 to 34 Years | 44 (17.7%) | 209 (83.9%) |
| 35 to 44 Years | 141 (52.6%) | 124 (46.3%) |
| 45 to 54 Years | 107 (31.8%) | 203 (60.2%) |
| 55 to 64 Years | 60 (23.4%) | 175 (68.1%) |
| 65 to 74 Years | 273 (97.2%) | 99 (35.2%) |
| 75 Years and over | 221 (100.0%) | 112 (50.7%) |
| Total | 1,182 (47.1%) | 1,562 (62.3%) |
Disability Status by Sex by Age in Carrollton
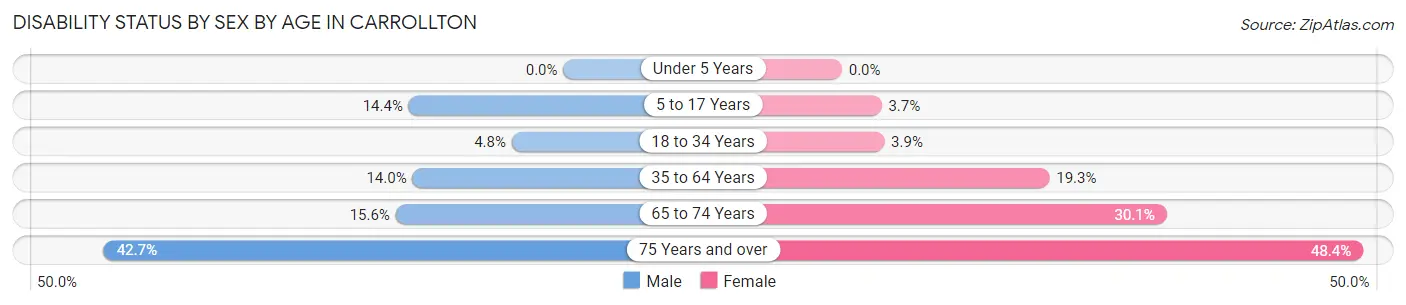
| Age Bracket | Male | Female |
| Under 5 Years | 0 (0.0%) | 0 (0.0%) |
| 5 to 17 Years | 32 (14.3%) | 7 (3.7%) |
| 18 to 34 Years | 13 (4.8%) | 9 (3.9%) |
| 35 to 64 Years | 64 (14.0%) | 78 (19.3%) |
| 65 to 74 Years | 21 (15.6%) | 44 (30.1%) |
| 75 Years and over | 29 (42.6%) | 74 (48.4%) |
Disability Class by Sex by Age in Carrollton
Disability Class: Hearing Difficulty
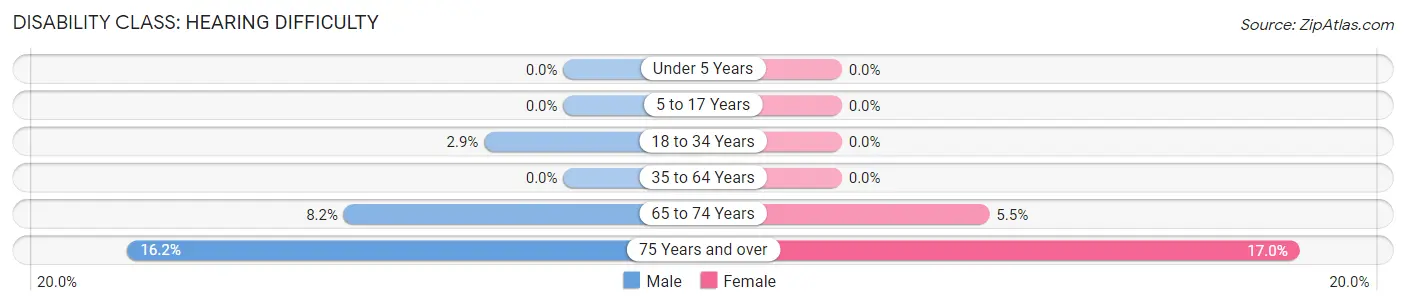
| Age Bracket | Male | Female |
| Under 5 Years | 0 (0.0%) | 0 (0.0%) |
| 5 to 17 Years | 0 (0.0%) | 0 (0.0%) |
| 18 to 34 Years | 8 (2.9%) | 0 (0.0%) |
| 35 to 64 Years | 0 (0.0%) | 0 (0.0%) |
| 65 to 74 Years | 11 (8.2%) | 8 (5.5%) |
| 75 Years and over | 11 (16.2%) | 26 (17.0%) |
Disability Class: Vision Difficulty
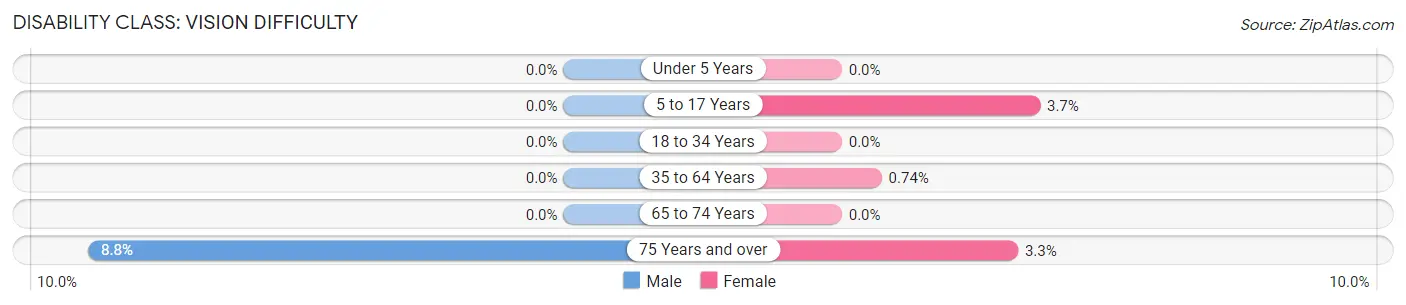
| Age Bracket | Male | Female |
| Under 5 Years | 0 (0.0%) | 0 (0.0%) |
| 5 to 17 Years | 0 (0.0%) | 7 (3.7%) |
| 18 to 34 Years | 0 (0.0%) | 0 (0.0%) |
| 35 to 64 Years | 0 (0.0%) | 3 (0.7%) |
| 65 to 74 Years | 0 (0.0%) | 0 (0.0%) |
| 75 Years and over | 6 (8.8%) | 5 (3.3%) |
Disability Class: Cognitive Difficulty
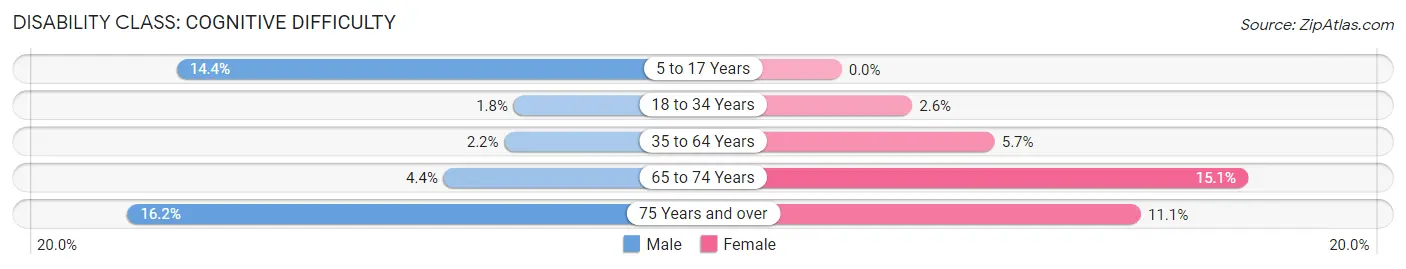
| Age Bracket | Male | Female |
| 5 to 17 Years | 32 (14.3%) | 0 (0.0%) |
| 18 to 34 Years | 5 (1.8%) | 6 (2.6%) |
| 35 to 64 Years | 10 (2.2%) | 23 (5.7%) |
| 65 to 74 Years | 6 (4.4%) | 22 (15.1%) |
| 75 Years and over | 11 (16.2%) | 17 (11.1%) |
Disability Class: Ambulatory Difficulty
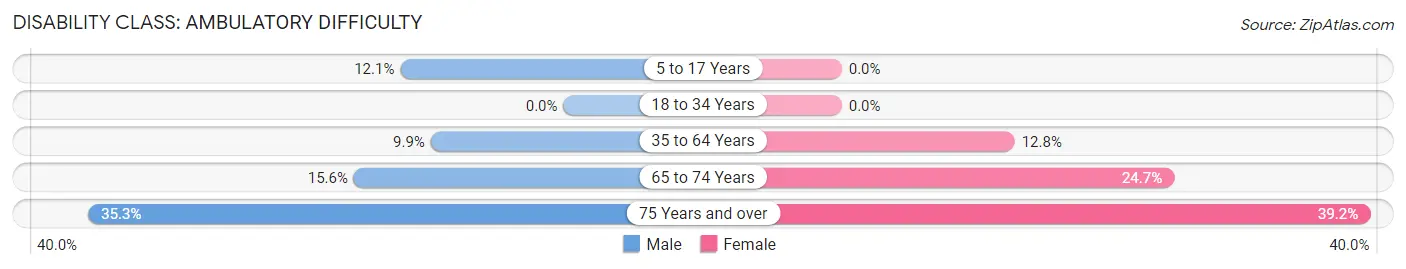
| Age Bracket | Male | Female |
| 5 to 17 Years | 27 (12.1%) | 0 (0.0%) |
| 18 to 34 Years | 0 (0.0%) | 0 (0.0%) |
| 35 to 64 Years | 45 (9.9%) | 52 (12.8%) |
| 65 to 74 Years | 21 (15.6%) | 36 (24.7%) |
| 75 Years and over | 24 (35.3%) | 60 (39.2%) |
Disability Class: Self-Care Difficulty
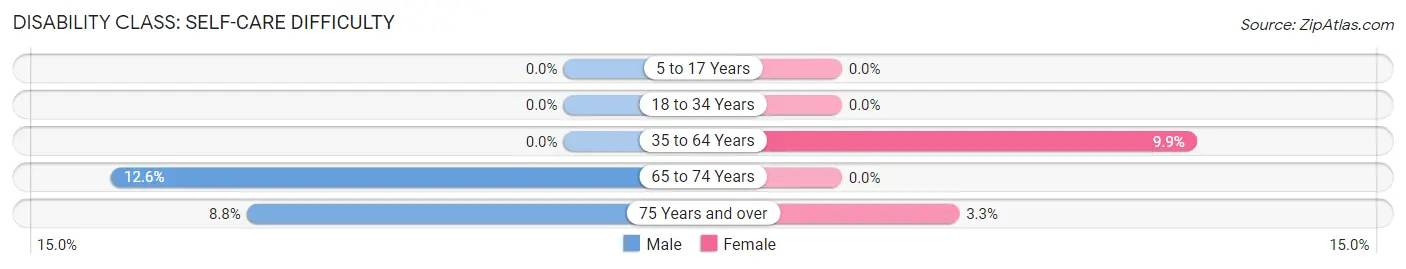
| Age Bracket | Male | Female |
| 5 to 17 Years | 0 (0.0%) | 0 (0.0%) |
| 18 to 34 Years | 0 (0.0%) | 0 (0.0%) |
| 35 to 64 Years | 0 (0.0%) | 40 (9.9%) |
| 65 to 74 Years | 17 (12.6%) | 0 (0.0%) |
| 75 Years and over | 6 (8.8%) | 5 (3.3%) |
Technology Access in Carrollton
Computing Device Access in Carrollton
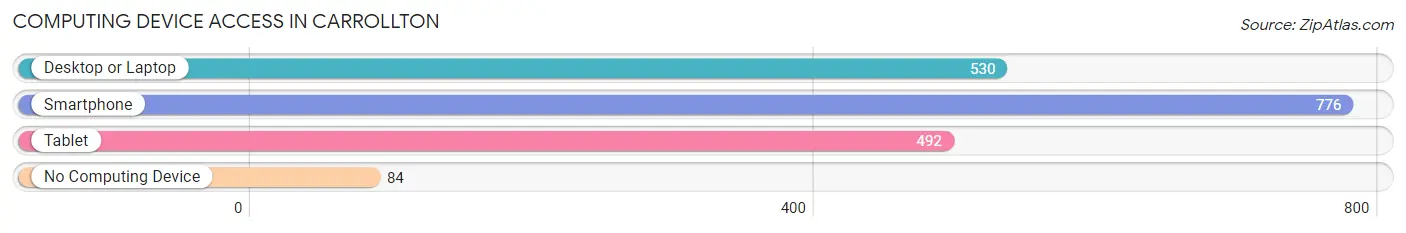
| Device Type | # Households | % Households |
| Desktop or Laptop | 530 | 55.2% |
| Smartphone | 776 | 80.8% |
| Tablet | 492 | 51.2% |
| No Computing Device | 84 | 8.7% |
| Total | 960 | 100.0% |
Internet Access in Carrollton
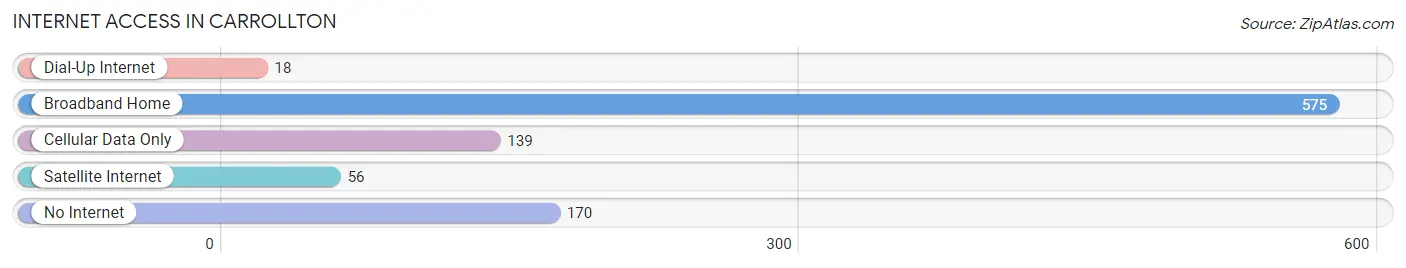
| Internet Type | # Households | % Households |
| Dial-Up Internet | 18 | 1.9% |
| Broadband Home | 575 | 59.9% |
| Cellular Data Only | 139 | 14.5% |
| Satellite Internet | 56 | 5.8% |
| No Internet | 170 | 17.7% |
| Total | 960 | 100.0% |
Carrollton Summary
Carrollton, Illinois is a small city located in Greene County, in the western part of the state. It is situated along the Illinois River, and is the county seat of Greene County. The city has a population of approximately 3,000 people, and is part of the Jacksonville-Rochester-Carrollton Metropolitan Statistical Area.
History
Carrollton was founded in 1825 by William Carroll, a settler from Kentucky. The city was named after him, and was incorporated in 1837. The city was an important stop on the Underground Railroad, and was a major center of abolitionist activity in the state.
In the late 19th century, Carrollton was a major center of the coal mining industry. The city was home to several coal mines, and the industry provided employment for many of the city's residents. The coal industry declined in the early 20th century, and the city's economy shifted to agriculture and manufacturing.
Geography
Carrollton is located in western Illinois, in Greene County. It is situated along the Illinois River, and is approximately 40 miles west of Springfield. The city has a total area of 2.2 square miles, all of which is land.
The city has a humid continental climate, with hot, humid summers and cold, snowy winters. The average annual temperature is 54 degrees Fahrenheit, and the average annual precipitation is 40 inches.
Economy
The economy of Carrollton is largely based on agriculture and manufacturing. The city is home to several large farms, and the agricultural industry is a major employer in the area. The city is also home to several manufacturing companies, including a plastics manufacturer and a metal fabrication company.
The city is also home to several retail stores, restaurants, and other businesses. The city is served by the Carrollton Public Library, and is home to several parks and recreational facilities.
Demographics
As of the 2010 census, the population of Carrollton was 3,037. The racial makeup of the city was 97.2% White, 0.7% African American, 0.3% Native American, 0.3% Asian, 0.2% from other races, and 1.5% from two or more races. Hispanic or Latino of any race were 1.2% of the population.
The median household income in Carrollton was $41,944, and the median family income was $50,938. The per capita income in the city was $20,845. About 11.2% of the population was below the poverty line.
Carrollton is served by the Carrollton Community Unit School District 1, which includes two elementary schools, one middle school, and one high school. The city is also home to several churches, and is served by the Carrollton Public Library.
Common Questions
What is Per Capita Income in Carrollton?
Per Capita income in Carrollton is $30,407.
What is the Median Family Income in Carrollton?
Median Family Income in Carrollton is $71,033.
What is the Median Household income in Carrollton?
Median Household Income in Carrollton is $63,026.
What is Income or Wage Gap in Carrollton?
Income or Wage Gap in Carrollton is 51.4%.
Women in Carrollton earn 48.6 cents for every dollar earned by a man.
What is Inequality or Gini Index in Carrollton?
Inequality or Gini Index in Carrollton is 0.41.
What is the Total Population of Carrollton?
Total Population of Carrollton is 2,546.
What is the Total Male Population of Carrollton?
Total Male Population of Carrollton is 1,316.
What is the Total Female Population of Carrollton?
Total Female Population of Carrollton is 1,230.
What is the Ratio of Males per 100 Females in Carrollton?
There are 106.99 Males per 100 Females in Carrollton.
What is the Ratio of Females per 100 Males in Carrollton?
There are 93.47 Females per 100 Males in Carrollton.
What is the Median Population Age in Carrollton?
Median Population Age in Carrollton is 38.7 Years.
What is the Average Family Size in Carrollton
Average Family Size in Carrollton is 3.3 People.
What is the Average Household Size in Carrollton
Average Household Size in Carrollton is 2.6 People.
How Large is the Labor Force in Carrollton?
There are 1,279 People in the Labor Forcein in Carrollton.
What is the Percentage of People in the Labor Force in Carrollton?
65.2% of People are in the Labor Force in Carrollton.
What is the Unemployment Rate in Carrollton?
Unemployment Rate in Carrollton is 1.7%.