Cantrall, IL Map & Demographics
Cantrall Map
Cantrall Overview
$41,394
PER CAPITA INCOME
$118,125
AVG FAMILY INCOME
$81,875
AVG HOUSEHOLD INCOME
9.1%
WAGE / INCOME GAP [ % ]
90.9¢/ $1
WAGE / INCOME GAP [ $ ]
0.36
INEQUALITY / GINI INDEX
139
TOTAL POPULATION
67
MALE POPULATION
72
FEMALE POPULATION
93.06
MALES / 100 FEMALES
107.46
FEMALES / 100 MALES
43.8
MEDIAN AGE
3.4
AVG FAMILY SIZE
2.5
AVG HOUSEHOLD SIZE
89
LABOR FORCE [ PEOPLE ]
69.0%
PERCENT IN LABOR FORCE
2.4%
UNEMPLOYMENT RATE
Cantrall Zip Codes
Cantrall Area Codes
Income in Cantrall
Income Overview in Cantrall
Per Capita Income in Cantrall is $41,394, while median incomes of families and households are $118,125 and $81,875 respectively.
| Characteristic | Number | Measure |
| Per Capita Income | 139 | $41,394 |
| Median Family Income | 31 | $118,125 |
| Mean Family Income | 31 | $119,819 |
| Median Household Income | 56 | $81,875 |
| Mean Household Income | 56 | $96,855 |
| Income Deficit | 31 | $0 |
| Wage / Income Gap (%) | 139 | 9.12% |
| Wage / Income Gap ($) | 139 | 90.88¢ per $1 |
| Gini / Inequality Index | 139 | 0.36 |
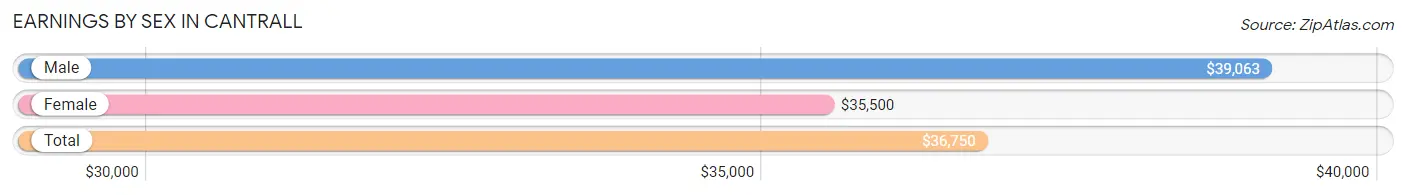
Earnings by Sex in Cantrall
Average Earnings in Cantrall are $36,750, $39,063 for men and $35,500 for women, a difference of 9.1%.
| Sex | Number | Average Earnings |
| Male | 49 (50.5%) | $39,063 |
| Female | 48 (49.5%) | $35,500 |
| Total | 97 (100.0%) | $36,750 |
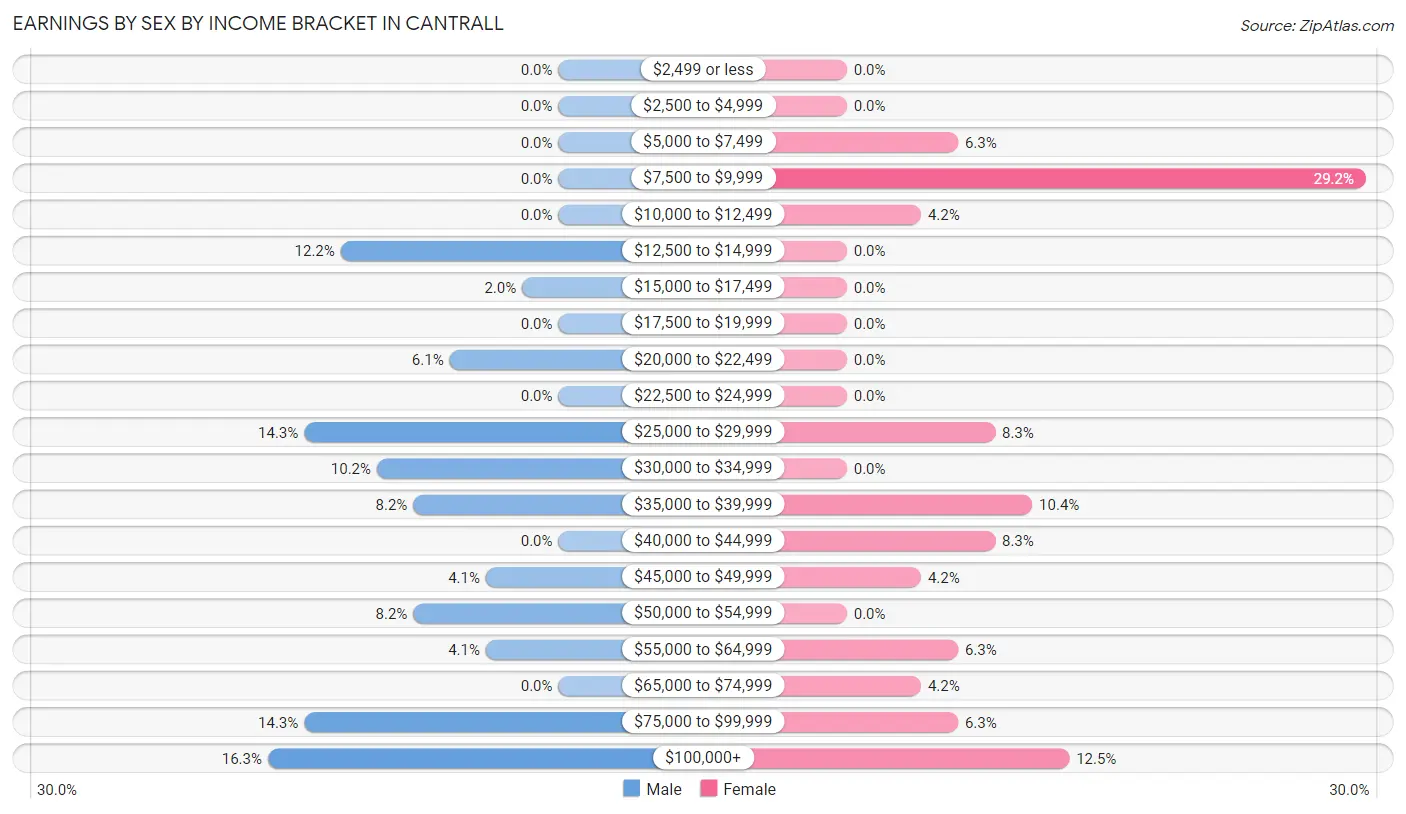
Earnings by Sex by Income Bracket in Cantrall
The most common earnings brackets in Cantrall are $100,000+ for men (8 | 16.3%) and $7,500 to $9,999 for women (14 | 29.2%).
| Income | Male | Female |
| $2,499 or less | 0 (0.0%) | 0 (0.0%) |
| $2,500 to $4,999 | 0 (0.0%) | 0 (0.0%) |
| $5,000 to $7,499 | 0 (0.0%) | 3 (6.2%) |
| $7,500 to $9,999 | 0 (0.0%) | 14 (29.2%) |
| $10,000 to $12,499 | 0 (0.0%) | 2 (4.2%) |
| $12,500 to $14,999 | 6 (12.2%) | 0 (0.0%) |
| $15,000 to $17,499 | 1 (2.0%) | 0 (0.0%) |
| $17,500 to $19,999 | 0 (0.0%) | 0 (0.0%) |
| $20,000 to $22,499 | 3 (6.1%) | 0 (0.0%) |
| $22,500 to $24,999 | 0 (0.0%) | 0 (0.0%) |
| $25,000 to $29,999 | 7 (14.3%) | 4 (8.3%) |
| $30,000 to $34,999 | 5 (10.2%) | 0 (0.0%) |
| $35,000 to $39,999 | 4 (8.2%) | 5 (10.4%) |
| $40,000 to $44,999 | 0 (0.0%) | 4 (8.3%) |
| $45,000 to $49,999 | 2 (4.1%) | 2 (4.2%) |
| $50,000 to $54,999 | 4 (8.2%) | 0 (0.0%) |
| $55,000 to $64,999 | 2 (4.1%) | 3 (6.2%) |
| $65,000 to $74,999 | 0 (0.0%) | 2 (4.2%) |
| $75,000 to $99,999 | 7 (14.3%) | 3 (6.2%) |
| $100,000+ | 8 (16.3%) | 6 (12.5%) |
| Total | 49 (100.0%) | 48 (100.0%) |
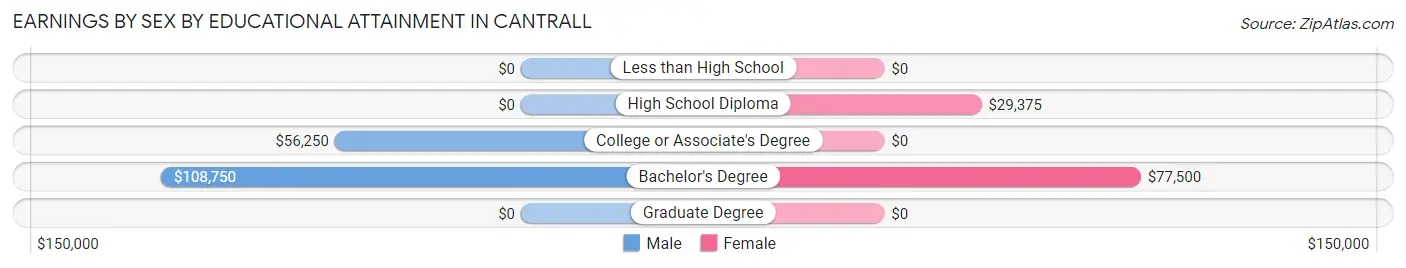
Earnings by Sex by Educational Attainment in Cantrall
Average earnings in Cantrall are $56,250 for men and $42,188 for women, a difference of 25.0%. Men with an educational attainment of bachelor's degree enjoy the highest average annual earnings of $108,750, while those with college or associate's degree education earn the least with $56,250. Women with an educational attainment of bachelor's degree earn the most with the average annual earnings of $77,500, while those with high school diploma education have the smallest earnings of $29,375.
| Educational Attainment | Male Income | Female Income |
| Less than High School | - | - |
| High School Diploma | - | - |
| College or Associate's Degree | $56,250 | $0 |
| Bachelor's Degree | $108,750 | $77,500 |
| Graduate Degree | - | - |
| Total | $56,250 | $42,188 |
Family Income in Cantrall
Family Income Brackets in Cantrall
According to the Cantrall family income data, there are 11 families falling into the $100,000 to $149,999 income range, which is the most common income bracket and makes up 35.5% of all families.
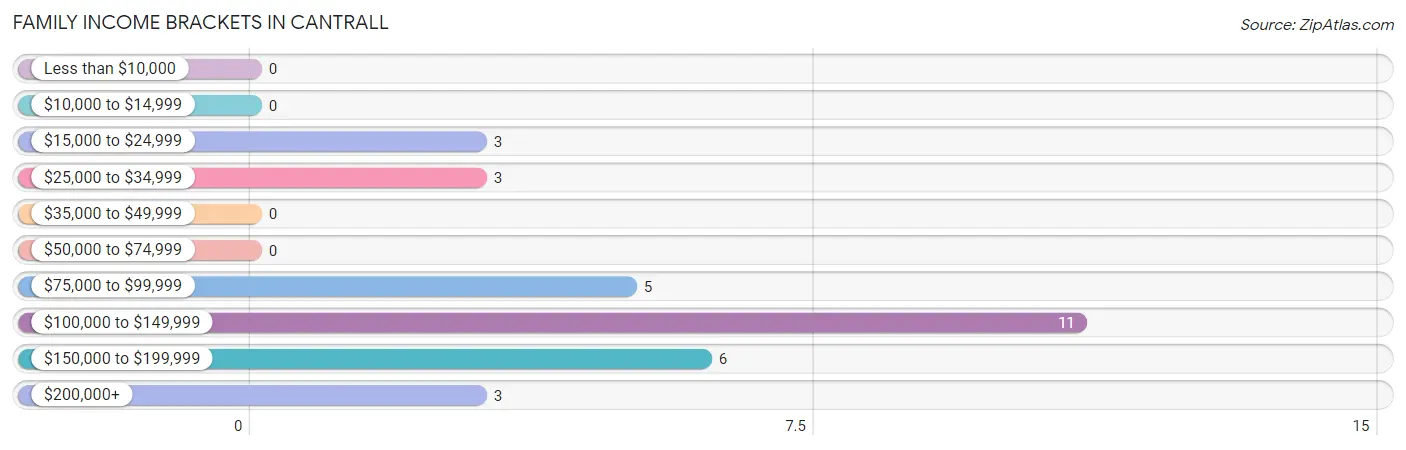
| Income Bracket | # Families | % Families |
| Less than $10,000 | 0 | 0.0% |
| $10,000 to $14,999 | 0 | 0.0% |
| $15,000 to $24,999 | 3 | 9.7% |
| $25,000 to $34,999 | 3 | 9.7% |
| $35,000 to $49,999 | 0 | 0.0% |
| $50,000 to $74,999 | 0 | 0.0% |
| $75,000 to $99,999 | 5 | 16.1% |
| $100,000 to $149,999 | 11 | 35.5% |
| $150,000 to $199,999 | 6 | 19.4% |
| $200,000+ | 3 | 9.7% |
Family Income by Famaliy Size in Cantrall
3-person families (8 | 25.8%) account for the highest median family income in Cantrall with $132,500 per family, while 2-person families (16 | 51.6%) have the highest median income of $45,000 per family member.
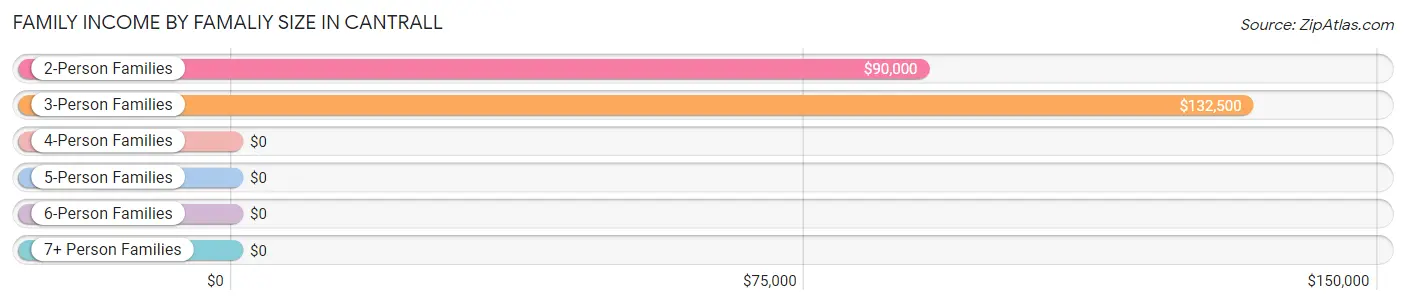
| Income Bracket | # Families | Median Income |
| 2-Person Families | 16 (51.6%) | $90,000 |
| 3-Person Families | 8 (25.8%) | $132,500 |
| 4-Person Families | 3 (9.7%) | $0 |
| 5-Person Families | 4 (12.9%) | $0 |
| 6-Person Families | 0 (0.0%) | $0 |
| 7+ Person Families | 0 (0.0%) | $0 |
| Total | 31 (100.0%) | $118,125 |
Family Income by Number of Earners in Cantrall
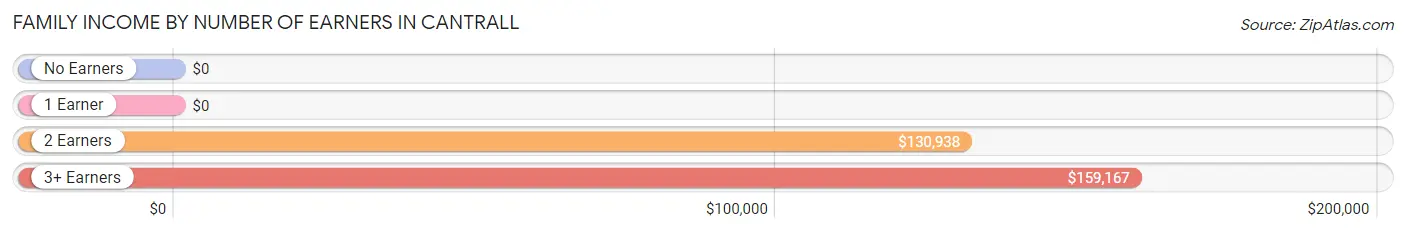
| Number of Earners | # Families | Median Income |
| No Earners | 2 (6.5%) | $0 |
| 1 Earner | 10 (32.3%) | $0 |
| 2 Earners | 9 (29.0%) | $130,938 |
| 3+ Earners | 10 (32.3%) | $159,167 |
| Total | 31 (100.0%) | $118,125 |
Household Income in Cantrall
Household Income Brackets in Cantrall
With 13 households falling in the category, the $75,000 to $99,999 income range is the most frequent in Cantrall, accounting for 23.2% of all households.
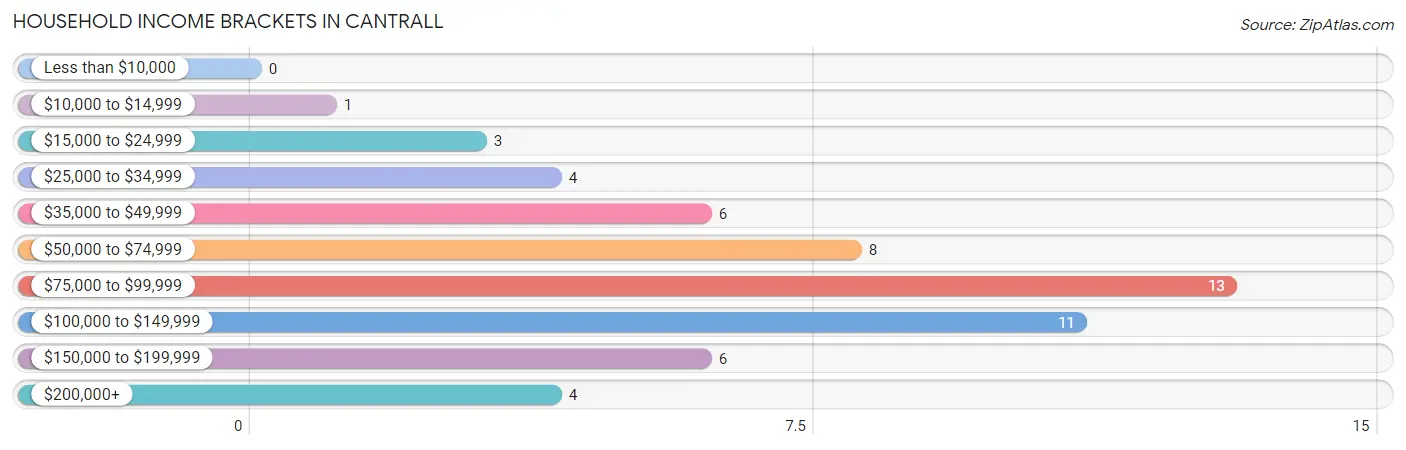
| Income Bracket | # Households | % Households |
| Less than $10,000 | 0 | 0.0% |
| $10,000 to $14,999 | 1 | 1.8% |
| $15,000 to $24,999 | 3 | 5.4% |
| $25,000 to $34,999 | 4 | 7.1% |
| $35,000 to $49,999 | 6 | 10.7% |
| $50,000 to $74,999 | 8 | 14.3% |
| $75,000 to $99,999 | 13 | 23.2% |
| $100,000 to $149,999 | 11 | 19.6% |
| $150,000 to $199,999 | 6 | 10.7% |
| $200,000+ | 4 | 7.1% |
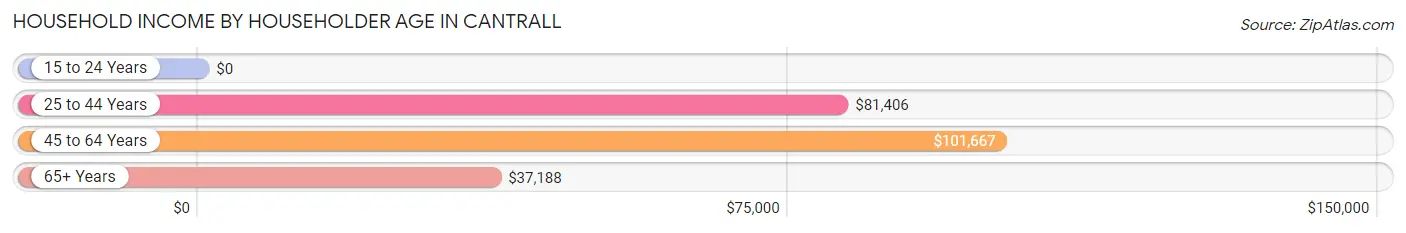
Household Income by Householder Age in Cantrall
The median household income in Cantrall is $81,875, with the highest median household income of $101,667 found in the 45 to 64 years age bracket for the primary householder. A total of 32 households (57.1%) fall into this category.
| Income Bracket | # Households | Median Income |
| 15 to 24 Years | 0 (0.0%) | $0 |
| 25 to 44 Years | 13 (23.2%) | $81,406 |
| 45 to 64 Years | 32 (57.1%) | $101,667 |
| 65+ Years | 11 (19.6%) | $37,188 |
| Total | 56 (100.0%) | $81,875 |
Poverty in Cantrall
Income Below Poverty by Sex and Age in Cantrall
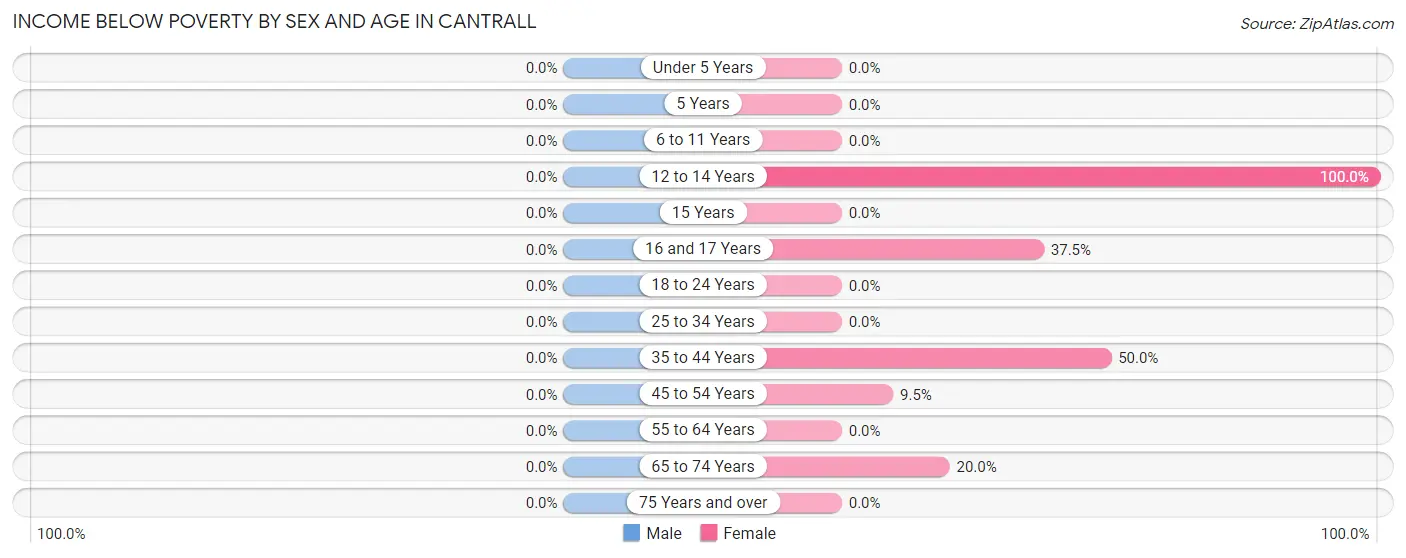
| Age Bracket | Male | Female |
| Under 5 Years | 0 (0.0%) | 0 (0.0%) |
| 5 Years | 0 (0.0%) | 0 (0.0%) |
| 6 to 11 Years | 0 (0.0%) | 0 (0.0%) |
| 12 to 14 Years | 0 (0.0%) | 4 (100.0%) |
| 15 Years | 0 (0.0%) | 0 (0.0%) |
| 16 and 17 Years | 0 (0.0%) | 3 (37.5%) |
| 18 to 24 Years | 0 (0.0%) | 0 (0.0%) |
| 25 to 34 Years | 0 (0.0%) | 0 (0.0%) |
| 35 to 44 Years | 0 (0.0%) | 2 (50.0%) |
| 45 to 54 Years | 0 (0.0%) | 2 (9.5%) |
| 55 to 64 Years | 0 (0.0%) | 0 (0.0%) |
| 65 to 74 Years | 0 (0.0%) | 1 (20.0%) |
| 75 Years and over | 0 (0.0%) | 0 (0.0%) |
| Total | 0 (0.0%) | 12 (16.7%) |
Income Above Poverty by Sex and Age in Cantrall
According to the poverty statistics in Cantrall, males aged under 5 years and females aged under 5 years are the age groups that are most secure financially, with 100.0% of males and 100.0% of females in these age groups living above the poverty line.
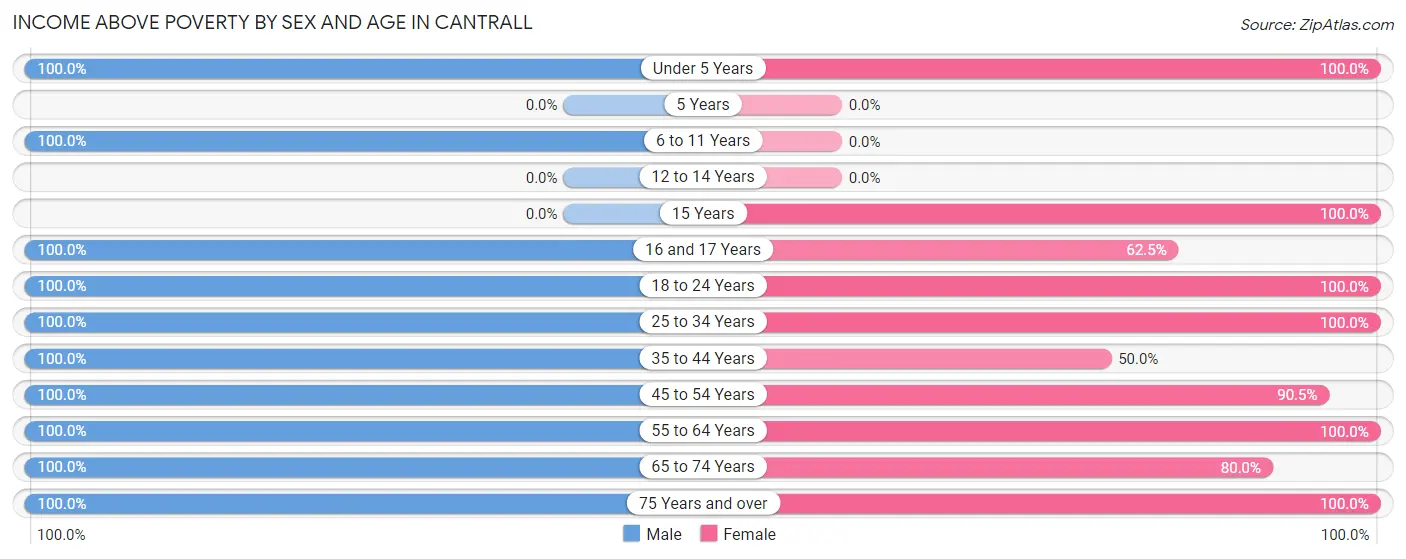
| Age Bracket | Male | Female |
| Under 5 Years | 1 (100.0%) | 1 (100.0%) |
| 5 Years | 0 (0.0%) | 0 (0.0%) |
| 6 to 11 Years | 3 (100.0%) | 0 (0.0%) |
| 12 to 14 Years | 0 (0.0%) | 0 (0.0%) |
| 15 Years | 0 (0.0%) | 1 (100.0%) |
| 16 and 17 Years | 3 (100.0%) | 5 (62.5%) |
| 18 to 24 Years | 15 (100.0%) | 15 (100.0%) |
| 25 to 34 Years | 5 (100.0%) | 5 (100.0%) |
| 35 to 44 Years | 6 (100.0%) | 2 (50.0%) |
| 45 to 54 Years | 13 (100.0%) | 19 (90.5%) |
| 55 to 64 Years | 12 (100.0%) | 6 (100.0%) |
| 65 to 74 Years | 5 (100.0%) | 4 (80.0%) |
| 75 Years and over | 4 (100.0%) | 2 (100.0%) |
| Total | 67 (100.0%) | 60 (83.3%) |
Income Below Poverty Among Married-Couple Families in Cantrall
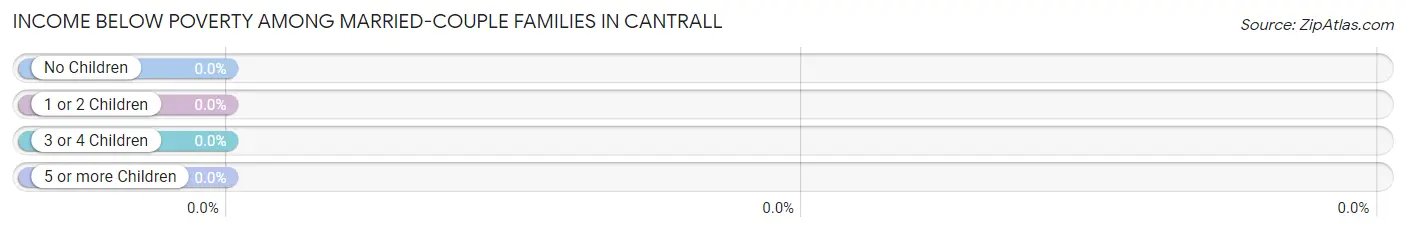
| Children | Above Poverty | Below Poverty |
| No Children | 13 (100.0%) | 0 (0.0%) |
| 1 or 2 Children | 5 (100.0%) | 0 (0.0%) |
| 3 or 4 Children | 1 (100.0%) | 0 (0.0%) |
| 5 or more Children | 0 (0.0%) | 0 (0.0%) |
| Total | 19 (100.0%) | 0 (0.0%) |
Income Below Poverty Among Single-Parent Households in Cantrall
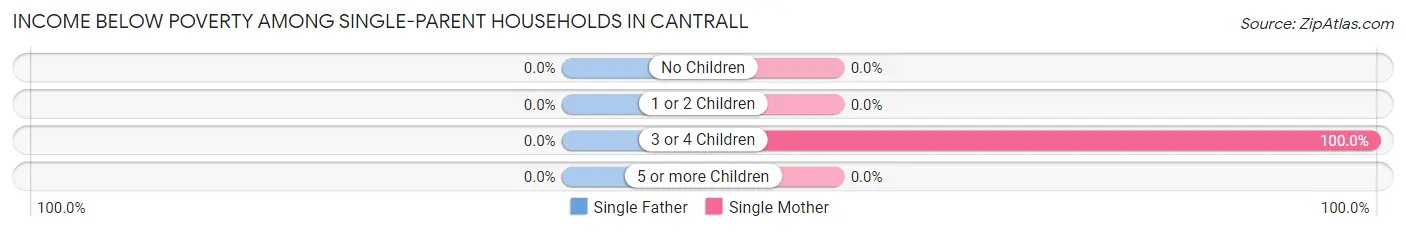
| Children | Single Father | Single Mother |
| No Children | 0 (0.0%) | 0 (0.0%) |
| 1 or 2 Children | 0 (0.0%) | 0 (0.0%) |
| 3 or 4 Children | 0 (0.0%) | 2 (100.0%) |
| 5 or more Children | 0 (0.0%) | 0 (0.0%) |
| Total | 0 (0.0%) | 2 (16.7%) |
Income Below Poverty Among Married-Couple vs Single-Parent Households in Cantrall
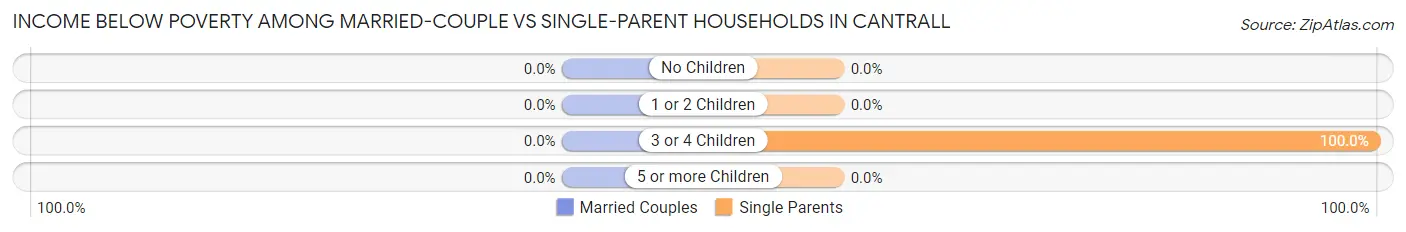
| Children | Married-Couple Families | Single-Parent Households |
| No Children | 0 (0.0%) | 0 (0.0%) |
| 1 or 2 Children | 0 (0.0%) | 0 (0.0%) |
| 3 or 4 Children | 0 (0.0%) | 2 (100.0%) |
| 5 or more Children | 0 (0.0%) | 0 (0.0%) |
| Total | 0 (0.0%) | 2 (16.7%) |
Race in Cantrall
The most populous races in Cantrall are White / Caucasian (130 | 93.5%), Two or more Races (6 | 4.3%), and Some other Race (3 | 2.2%).
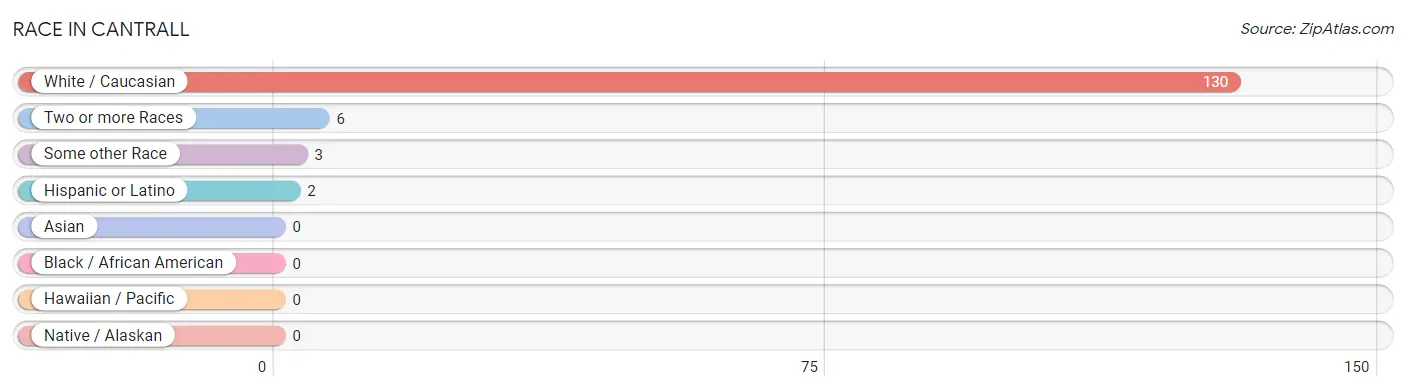
| Race | # Population | % Population |
| Asian | 0 | 0.0% |
| Black / African American | 0 | 0.0% |
| Hawaiian / Pacific | 0 | 0.0% |
| Hispanic or Latino | 2 | 1.4% |
| Native / Alaskan | 0 | 0.0% |
| White / Caucasian | 130 | 93.5% |
| Two or more Races | 6 | 4.3% |
| Some other Race | 3 | 2.2% |
| Total | 139 | 100.0% |
Ancestry in Cantrall
The most populous ancestries reported in Cantrall are German (27 | 19.4%), English (26 | 18.7%), French (17 | 12.2%), Welsh (17 | 12.2%), and Irish (11 | 7.9%), together accounting for 70.5% of all Cantrall residents.
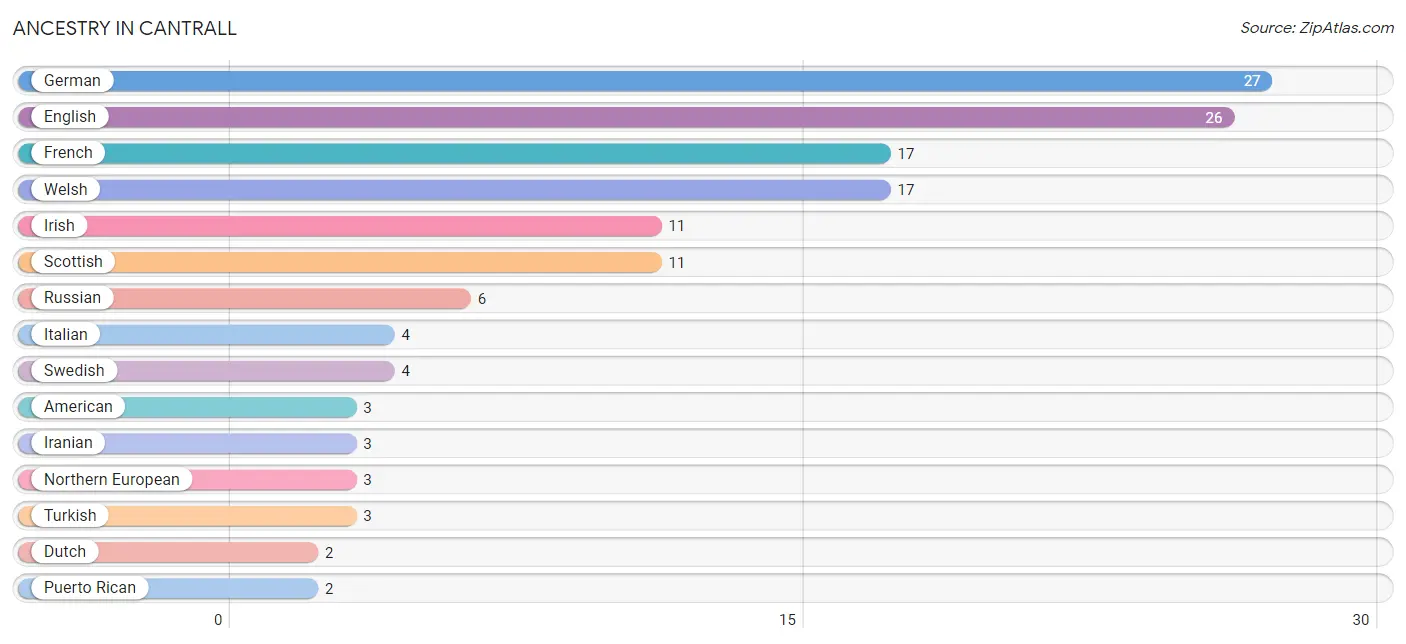
| Ancestry | # Population | % Population |
| American | 3 | 2.2% |
| Austrian | 1 | 0.7% |
| Dutch | 2 | 1.4% |
| English | 26 | 18.7% |
| French | 17 | 12.2% |
| German | 27 | 19.4% |
| Iranian | 3 | 2.2% |
| Irish | 11 | 7.9% |
| Italian | 4 | 2.9% |
| Northern European | 3 | 2.2% |
| Puerto Rican | 2 | 1.4% |
| Russian | 6 | 4.3% |
| Scottish | 11 | 7.9% |
| Swedish | 4 | 2.9% |
| Turkish | 3 | 2.2% |
| Welsh | 17 | 12.2% | View All 16 Rows |
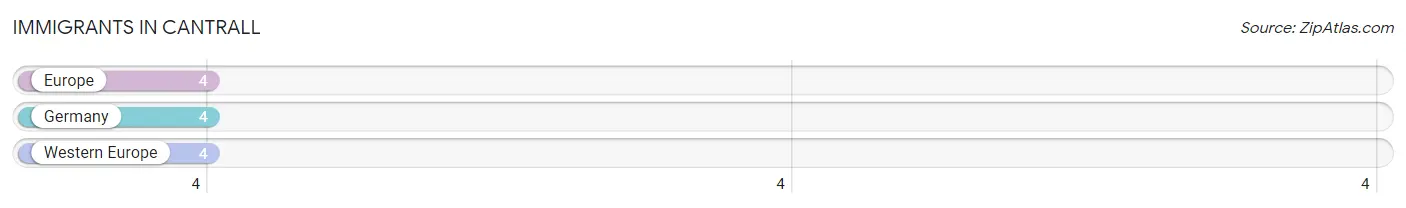
Immigrants in Cantrall
The most numerous immigrant groups reported in Cantrall came from Europe (4 | 2.9%), Germany (4 | 2.9%), and Western Europe (4 | 2.9%), together accounting for 8.6% of all Cantrall residents.
| Immigration Origin | # Population | % Population |
| Europe | 4 | 2.9% |
| Germany | 4 | 2.9% |
| Western Europe | 4 | 2.9% | View All 3 Rows |
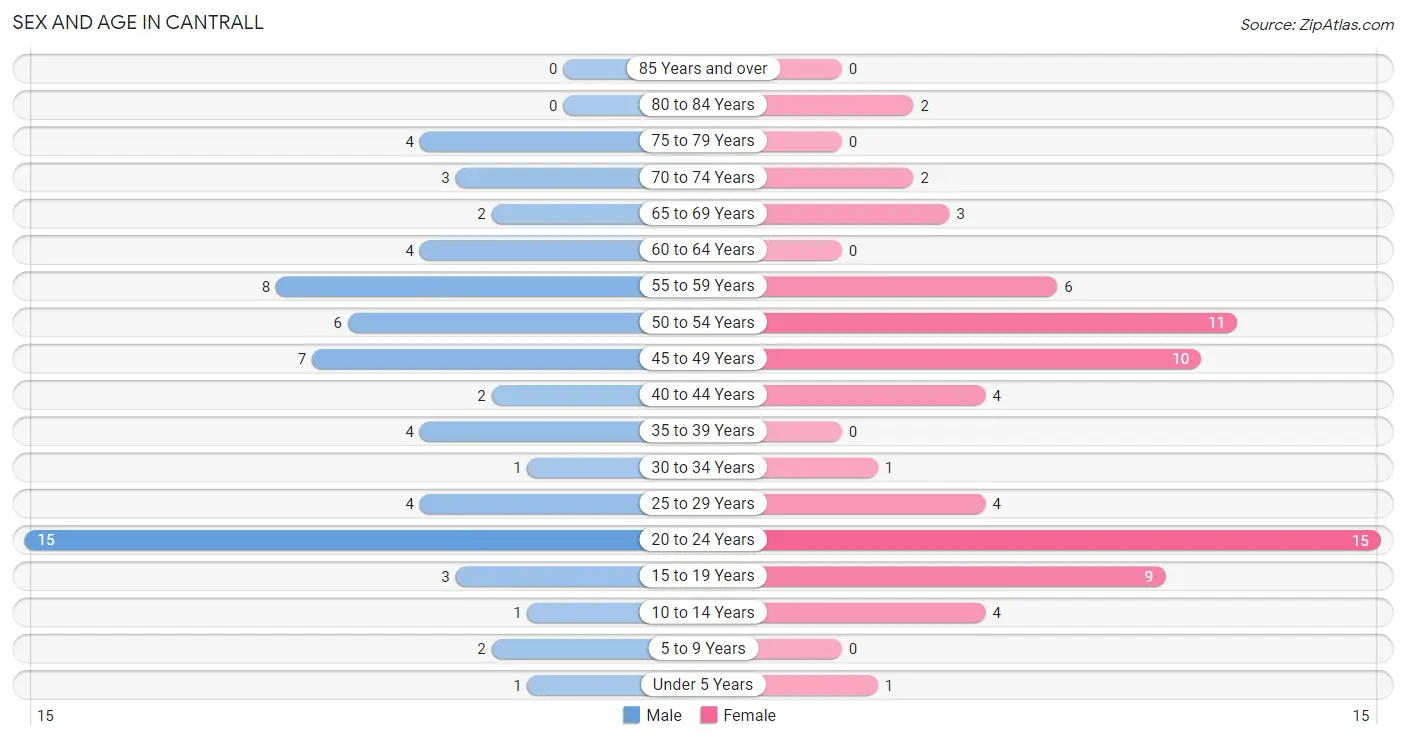
Sex and Age in Cantrall
Sex and Age in Cantrall
The most populous age groups in Cantrall are 20 to 24 Years (15 | 22.4%) for men and 20 to 24 Years (15 | 20.8%) for women.
| Age Bracket | Male | Female |
| Under 5 Years | 1 (1.5%) | 1 (1.4%) |
| 5 to 9 Years | 2 (3.0%) | 0 (0.0%) |
| 10 to 14 Years | 1 (1.5%) | 4 (5.6%) |
| 15 to 19 Years | 3 (4.5%) | 9 (12.5%) |
| 20 to 24 Years | 15 (22.4%) | 15 (20.8%) |
| 25 to 29 Years | 4 (6.0%) | 4 (5.6%) |
| 30 to 34 Years | 1 (1.5%) | 1 (1.4%) |
| 35 to 39 Years | 4 (6.0%) | 0 (0.0%) |
| 40 to 44 Years | 2 (3.0%) | 4 (5.6%) |
| 45 to 49 Years | 7 (10.4%) | 10 (13.9%) |
| 50 to 54 Years | 6 (9.0%) | 11 (15.3%) |
| 55 to 59 Years | 8 (11.9%) | 6 (8.3%) |
| 60 to 64 Years | 4 (6.0%) | 0 (0.0%) |
| 65 to 69 Years | 2 (3.0%) | 3 (4.2%) |
| 70 to 74 Years | 3 (4.5%) | 2 (2.8%) |
| 75 to 79 Years | 4 (6.0%) | 0 (0.0%) |
| 80 to 84 Years | 0 (0.0%) | 2 (2.8%) |
| 85 Years and over | 0 (0.0%) | 0 (0.0%) |
| Total | 67 (100.0%) | 72 (100.0%) |
Families and Households in Cantrall
Median Family Size in Cantrall
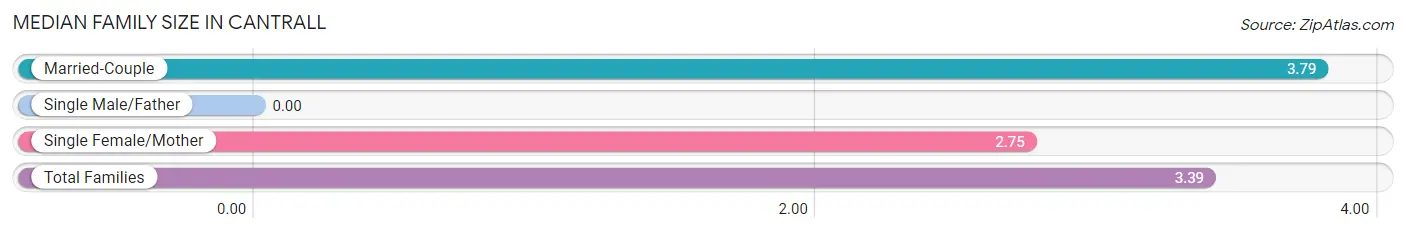
| Family Type | # Families | Family Size |
| Married-Couple | 19 (61.3%) | 3.79 |
| Single Male/Father | 0 (0.0%) | - |
| Single Female/Mother | 12 (38.7%) | 2.75 |
| Total Families | 31 (100.0%) | 3.39 |
Median Household Size in Cantrall
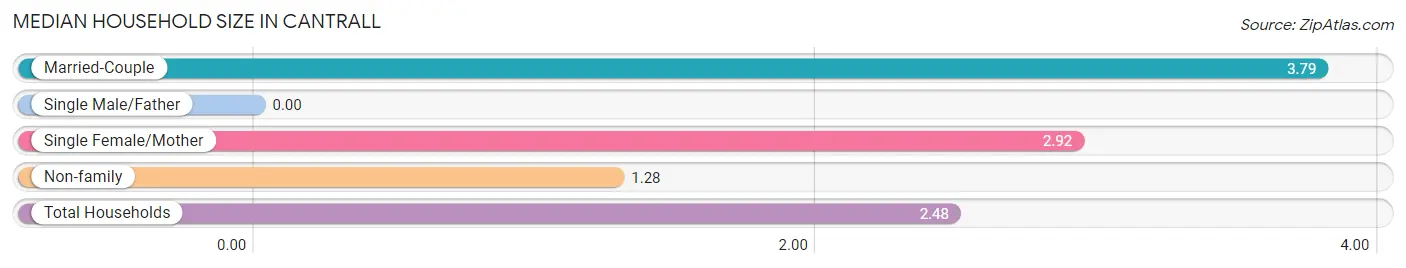
| Household Type | # Households | Household Size |
| Married-Couple | 19 (33.9%) | 3.79 |
| Single Male/Father | 0 (0.0%) | - |
| Single Female/Mother | 12 (21.4%) | 2.92 |
| Non-family | 25 (44.6%) | 1.28 |
| Total Households | 56 (100.0%) | 2.48 |
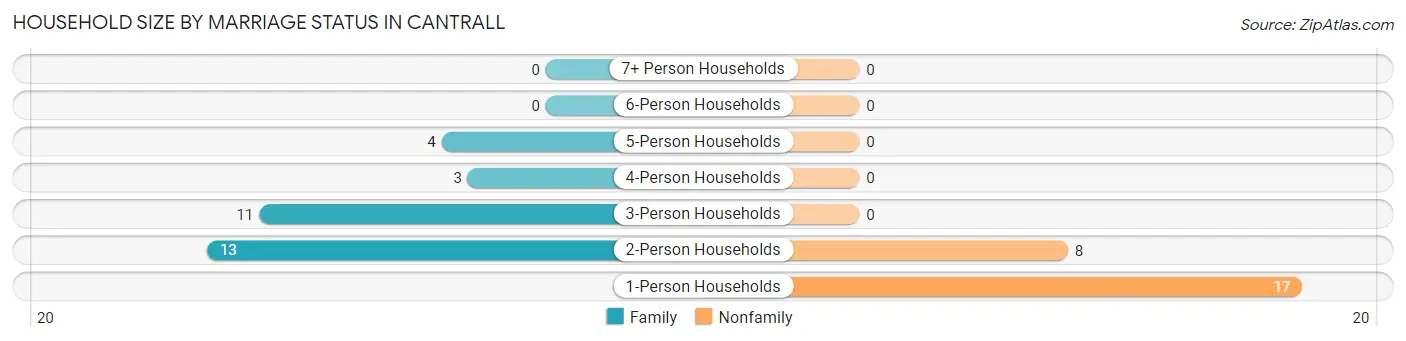
Household Size by Marriage Status in Cantrall
Out of a total of 56 households in Cantrall, 31 (55.4%) are family households, while 25 (44.6%) are nonfamily households. The most numerous type of family households are 2-person households, comprising 13, and the most common type of nonfamily households are 1-person households, comprising 17.
| Household Size | Family Households | Nonfamily Households |
| 1-Person Households | - | 17 (30.4%) |
| 2-Person Households | 13 (23.2%) | 8 (14.3%) |
| 3-Person Households | 11 (19.6%) | 0 (0.0%) |
| 4-Person Households | 3 (5.4%) | 0 (0.0%) |
| 5-Person Households | 4 (7.1%) | 0 (0.0%) |
| 6-Person Households | 0 (0.0%) | 0 (0.0%) |
| 7+ Person Households | 0 (0.0%) | 0 (0.0%) |
| Total | 31 (55.4%) | 25 (44.6%) |
Female Fertility in Cantrall
Fertility by Age in Cantrall
| Age Bracket | Women with Births | Births / 1,000 Women |
| 15 to 19 years | 0 (0.0%) | 0.0 |
| 20 to 34 years | 0 (0.0%) | 0.0 |
| 35 to 50 years | 0 (0.0%) | 0.0 |
| Total | 0 (0.0%) | 0.0 |
Fertility by Age by Marriage Status in Cantrall
| Age Bracket | Married | Unmarried |
| 15 to 19 years | 0 (0.0%) | 0 (0.0%) |
| 20 to 34 years | 0 (0.0%) | 0 (0.0%) |
| 35 to 50 years | 0 (0.0%) | 0 (0.0%) |
| Total | 0 (0.0%) | 0 (0.0%) |
Fertility by Education in Cantrall
| Educational Attainment | Women with Births | Births / 1,000 Women |
| Less than High School | 0 (0.0%) | 0.0 |
| High School Diploma | 0 (0.0%) | 0.0 |
| College or Associate's Degree | 0 (0.0%) | 0.0 |
| Bachelor's Degree | 0 (0.0%) | 0.0 |
| Graduate Degree | 0 (0.0%) | 0.0 |
| Total | 0 (0.0%) | 0.0 |
Fertility by Education by Marriage Status in Cantrall
| Educational Attainment | Married | Unmarried |
| Less than High School | 0 (0.0%) | 0 (0.0%) |
| High School Diploma | 0 (0.0%) | 0 (0.0%) |
| College or Associate's Degree | 0 (0.0%) | 0 (0.0%) |
| Bachelor's Degree | 0 (0.0%) | 0 (0.0%) |
| Graduate Degree | 0 (0.0%) | 0 (0.0%) |
| Total | 0 (0.0%) | 0 (0.0%) |
Employment Characteristics in Cantrall
Employment by Class of Employer in Cantrall
Among the 86 employed individuals in Cantrall, private company employees (48 | 55.8%), not-for-profit organizations (14 | 16.3%), and state government employees (12 | 14.0%) make up the most common classes of employment.
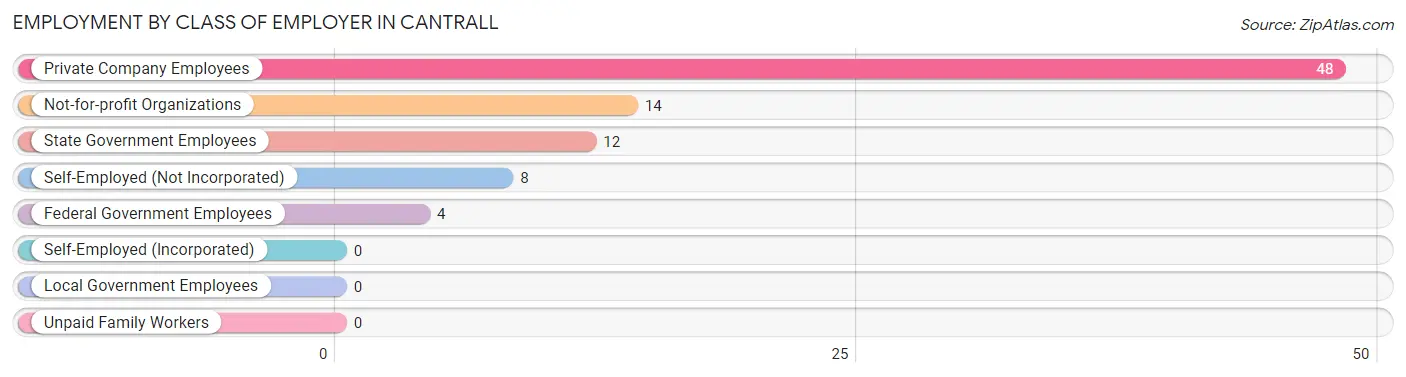
| Employer Class | # Employees | % Employees |
| Private Company Employees | 48 | 55.8% |
| Self-Employed (Incorporated) | 0 | 0.0% |
| Self-Employed (Not Incorporated) | 8 | 9.3% |
| Not-for-profit Organizations | 14 | 16.3% |
| Local Government Employees | 0 | 0.0% |
| State Government Employees | 12 | 14.0% |
| Federal Government Employees | 4 | 4.6% |
| Unpaid Family Workers | 0 | 0.0% |
| Total | 86 | 100.0% |
Employment Status by Age in Cantrall
According to the labor force statistics for Cantrall, out of the total population over 16 years of age (129), 69.0% or 89 individuals are in the labor force, with 2.4% or 2 of them unemployed. The age group with the highest labor force participation rate is 25 to 29 years, with 100.0% or 8 individuals in the labor force. Within the labor force, the 45 to 54 years age range has the highest percentage of unemployed individuals, with 6.9% or 2 of them being unemployed.
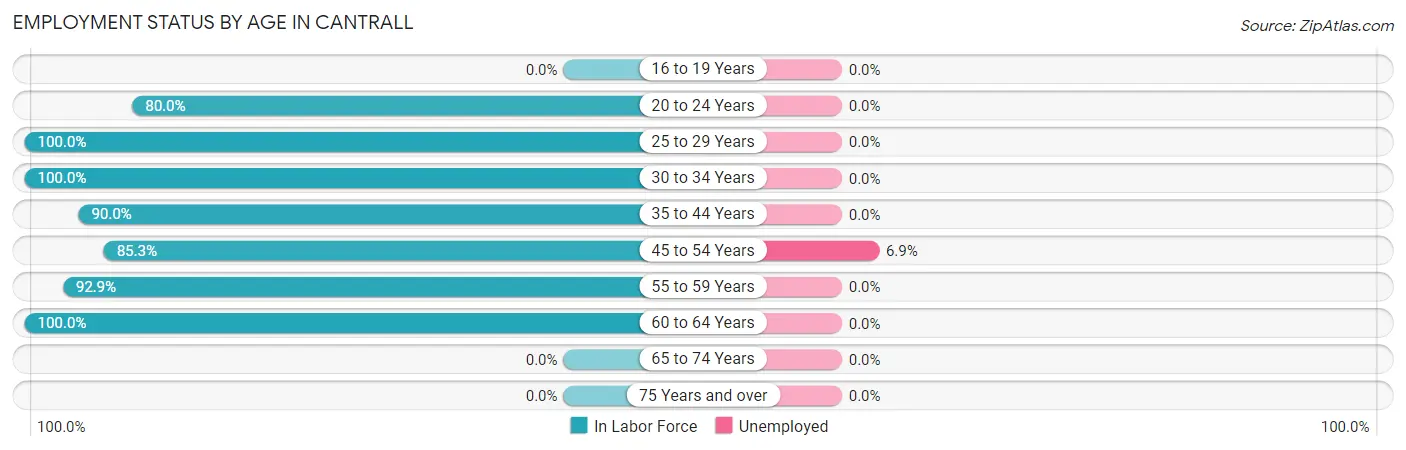
| Age Bracket | In Labor Force | Unemployed |
| 16 to 19 Years | 0 (0.0%) | 0 (0.0%) |
| 20 to 24 Years | 24 (80.0%) | 0 (0.0%) |
| 25 to 29 Years | 8 (100.0%) | 0 (0.0%) |
| 30 to 34 Years | 2 (100.0%) | 0 (0.0%) |
| 35 to 44 Years | 9 (90.0%) | 0 (0.0%) |
| 45 to 54 Years | 29 (85.3%) | 2 (6.9%) |
| 55 to 59 Years | 13 (92.9%) | 0 (0.0%) |
| 60 to 64 Years | 4 (100.0%) | 0 (0.0%) |
| 65 to 74 Years | 0 (0.0%) | 0 (0.0%) |
| 75 Years and over | 0 (0.0%) | 0 (0.0%) |
| Total | 89 (69.0%) | 2 (2.4%) |
Employment Status by Educational Attainment in Cantrall
According to labor force statistics for Cantrall, 90.3% of individuals (65) out of the total population between 25 and 64 years of age (72) are in the labor force, with 3.3% or 2 of them being unemployed. The group with the highest labor force participation rate are those with the educational attainment of bachelor's degree or higher, with 100.0% or 15 individuals in the labor force. Within the labor force, individuals with high school diploma education have the highest percentage of unemployment, with 9.1% or 2 of them being unemployed.
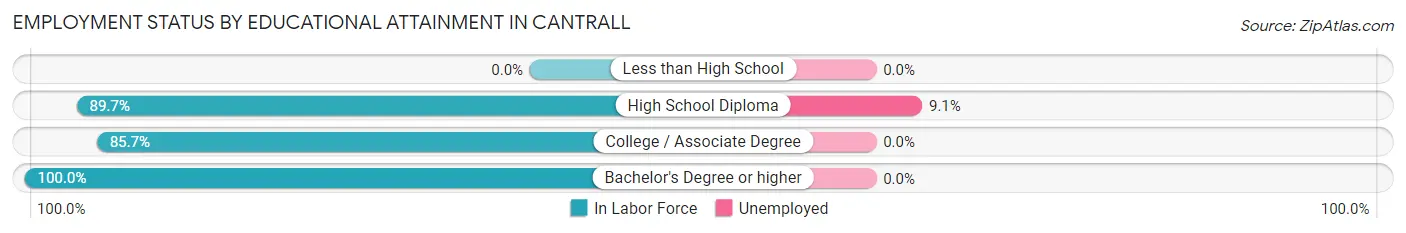
| Educational Attainment | In Labor Force | Unemployed |
| Less than High School | 0 (0.0%) | 0 (0.0%) |
| High School Diploma | 26 (89.7%) | 3 (9.1%) |
| College / Associate Degree | 24 (85.7%) | 0 (0.0%) |
| Bachelor's Degree or higher | 15 (100.0%) | 0 (0.0%) |
| Total | 65 (90.3%) | 2 (3.3%) |
Employment Occupations by Sex in Cantrall
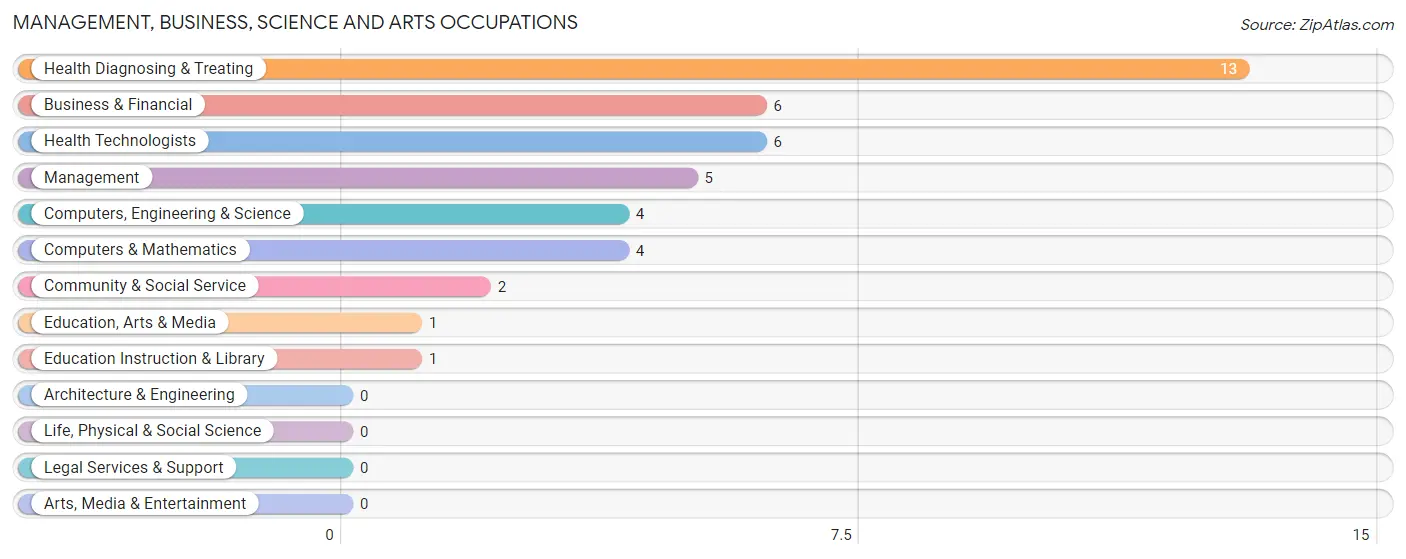
Management, Business, Science and Arts Occupations
The most common Management, Business, Science and Arts occupations in Cantrall are Health Diagnosing & Treating (13 | 15.7%), Business & Financial (6 | 7.2%), Health Technologists (6 | 7.2%), Management (5 | 6.0%), and Computers, Engineering & Science (4 | 4.8%).
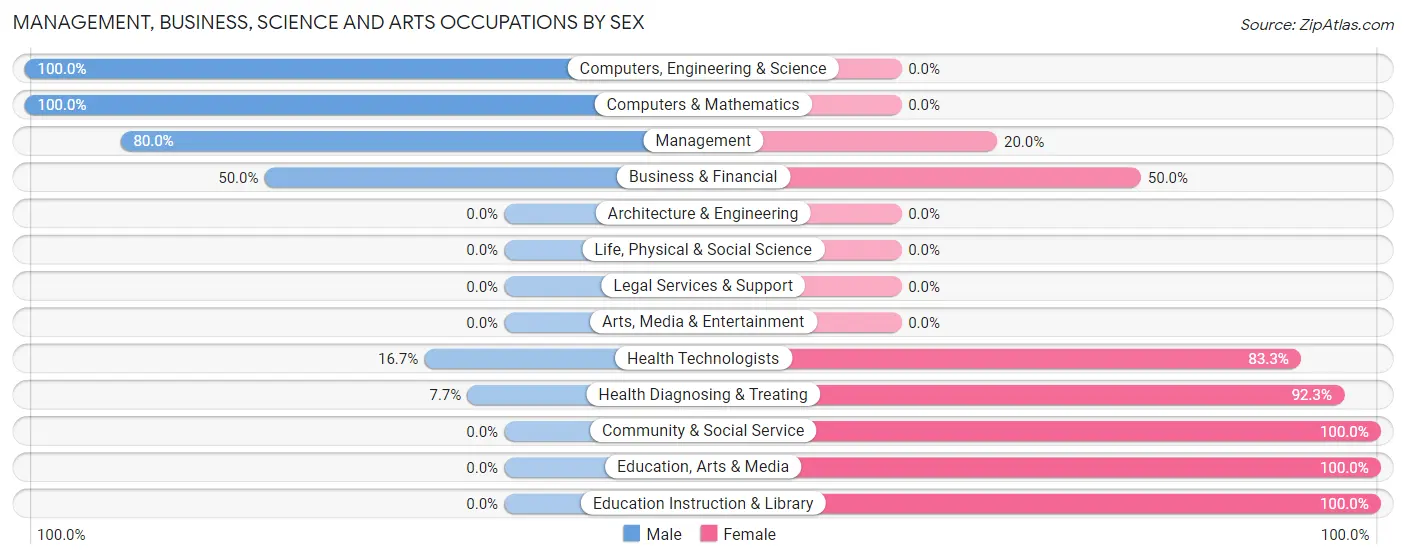
Management, Business, Science and Arts Occupations by Sex
Within the Management, Business, Science and Arts occupations in Cantrall, the most male-oriented occupations are Computers, Engineering & Science (100.0%), Computers & Mathematics (100.0%), and Management (80.0%), while the most female-oriented occupations are Community & Social Service (100.0%), Education, Arts & Media (100.0%), and Education Instruction & Library (100.0%).
| Occupation | Male | Female |
| Management | 4 (80.0%) | 1 (20.0%) |
| Business & Financial | 3 (50.0%) | 3 (50.0%) |
| Computers, Engineering & Science | 4 (100.0%) | 0 (0.0%) |
| Computers & Mathematics | 4 (100.0%) | 0 (0.0%) |
| Architecture & Engineering | 0 (0.0%) | 0 (0.0%) |
| Life, Physical & Social Science | 0 (0.0%) | 0 (0.0%) |
| Community & Social Service | 0 (0.0%) | 2 (100.0%) |
| Education, Arts & Media | 0 (0.0%) | 1 (100.0%) |
| Legal Services & Support | 0 (0.0%) | 0 (0.0%) |
| Education Instruction & Library | 0 (0.0%) | 1 (100.0%) |
| Arts, Media & Entertainment | 0 (0.0%) | 0 (0.0%) |
| Health Diagnosing & Treating | 1 (7.7%) | 12 (92.3%) |
| Health Technologists | 1 (16.7%) | 5 (83.3%) |
| Total (Category) | 12 (40.0%) | 18 (60.0%) |
| Total (Overall) | 44 (53.0%) | 39 (47.0%) |
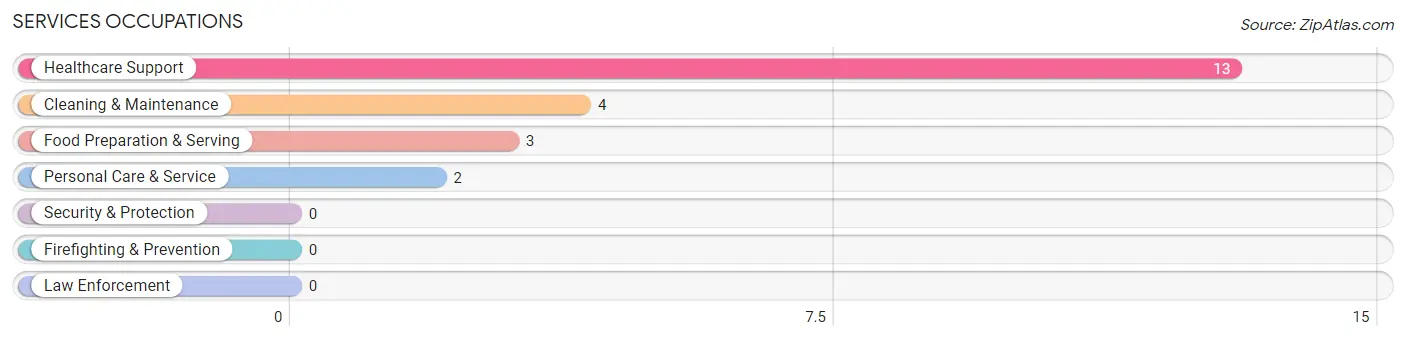
Services Occupations
The most common Services occupations in Cantrall are Healthcare Support (13 | 15.7%), Cleaning & Maintenance (4 | 4.8%), Food Preparation & Serving (3 | 3.6%), and Personal Care & Service (2 | 2.4%).
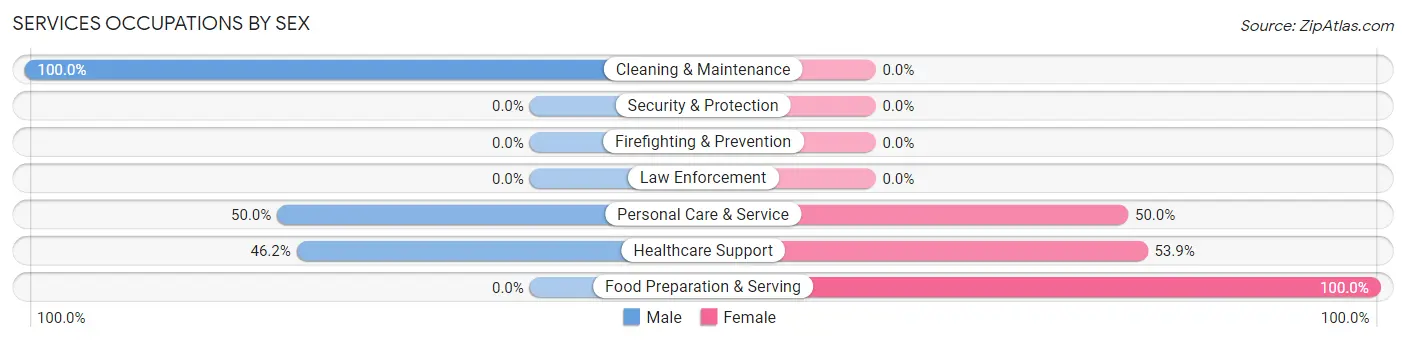
Services Occupations by Sex
Within the Services occupations in Cantrall, the most male-oriented occupations are Cleaning & Maintenance (100.0%), Personal Care & Service (50.0%), and Healthcare Support (46.2%), while the most female-oriented occupations are Food Preparation & Serving (100.0%), Healthcare Support (53.8%), and Personal Care & Service (50.0%).
| Occupation | Male | Female |
| Healthcare Support | 6 (46.2%) | 7 (53.8%) |
| Security & Protection | 0 (0.0%) | 0 (0.0%) |
| Firefighting & Prevention | 0 (0.0%) | 0 (0.0%) |
| Law Enforcement | 0 (0.0%) | 0 (0.0%) |
| Food Preparation & Serving | 0 (0.0%) | 3 (100.0%) |
| Cleaning & Maintenance | 4 (100.0%) | 0 (0.0%) |
| Personal Care & Service | 1 (50.0%) | 1 (50.0%) |
| Total (Category) | 11 (50.0%) | 11 (50.0%) |
| Total (Overall) | 44 (53.0%) | 39 (47.0%) |
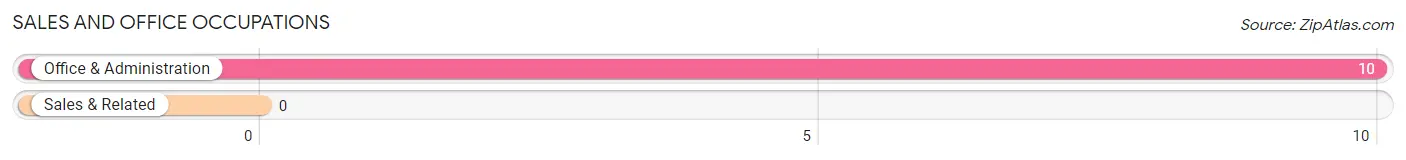
Sales and Office Occupations
The most common Sales and Office occupations in Cantrall are , and Office & Administration (10 | 12.0%).
Sales and Office Occupations by Sex
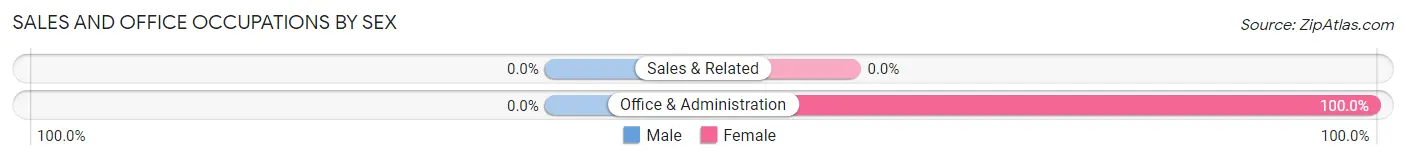
| Occupation | Male | Female |
| Sales & Related | 0 (0.0%) | 0 (0.0%) |
| Office & Administration | 0 (0.0%) | 10 (100.0%) |
| Total (Category) | 0 (0.0%) | 10 (100.0%) |
| Total (Overall) | 44 (53.0%) | 39 (47.0%) |
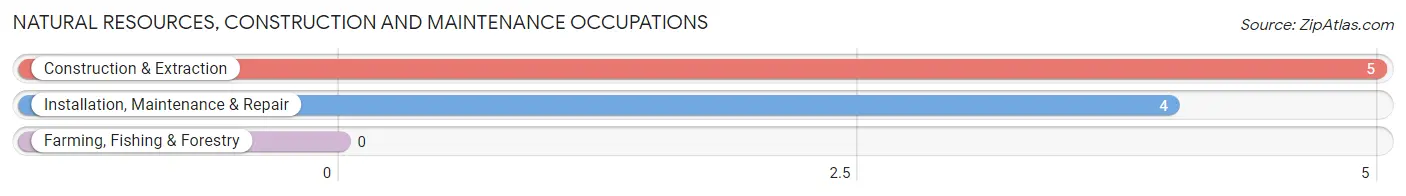
Natural Resources, Construction and Maintenance Occupations
The most common Natural Resources, Construction and Maintenance occupations in Cantrall are Construction & Extraction (5 | 6.0%), and Installation, Maintenance & Repair (4 | 4.8%).
Natural Resources, Construction and Maintenance Occupations by Sex
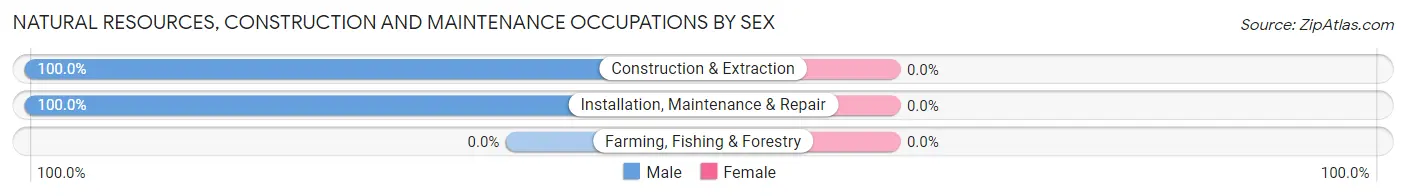
| Occupation | Male | Female |
| Farming, Fishing & Forestry | 0 (0.0%) | 0 (0.0%) |
| Construction & Extraction | 5 (100.0%) | 0 (0.0%) |
| Installation, Maintenance & Repair | 4 (100.0%) | 0 (0.0%) |
| Total (Category) | 9 (100.0%) | 0 (0.0%) |
| Total (Overall) | 44 (53.0%) | 39 (47.0%) |
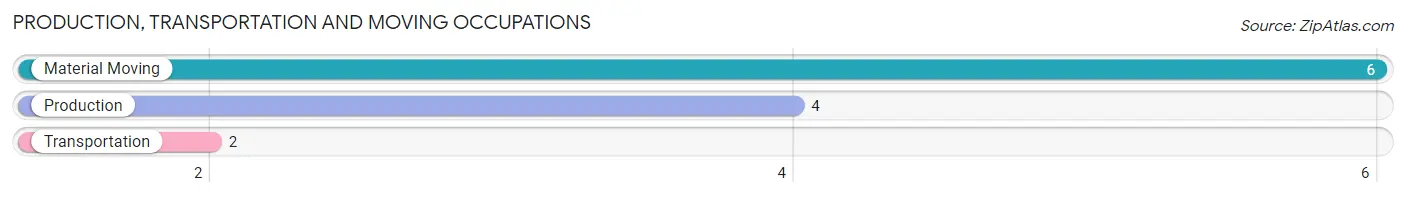
Production, Transportation and Moving Occupations
The most common Production, Transportation and Moving occupations in Cantrall are Material Moving (6 | 7.2%), Production (4 | 4.8%), and Transportation (2 | 2.4%).
Production, Transportation and Moving Occupations by Sex
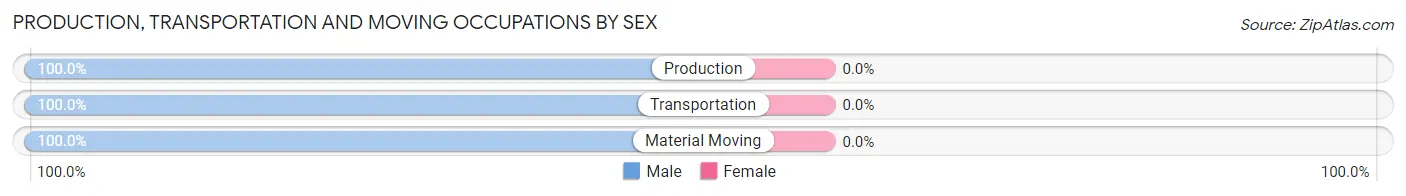
| Occupation | Male | Female |
| Production | 4 (100.0%) | 0 (0.0%) |
| Transportation | 2 (100.0%) | 0 (0.0%) |
| Material Moving | 6 (100.0%) | 0 (0.0%) |
| Total (Category) | 12 (100.0%) | 0 (0.0%) |
| Total (Overall) | 44 (53.0%) | 39 (47.0%) |
Employment Industries by Sex in Cantrall
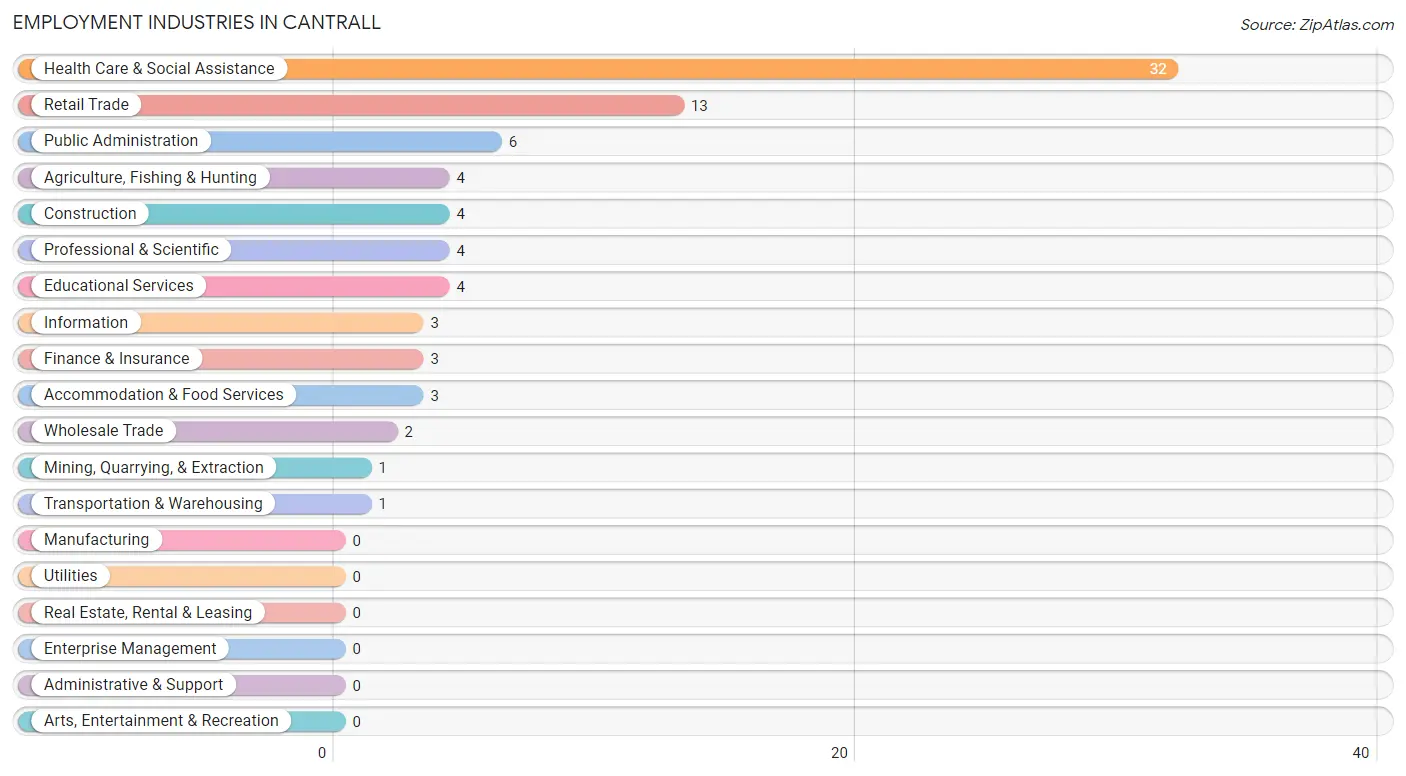
Employment Industries in Cantrall
The major employment industries in Cantrall include Health Care & Social Assistance (32 | 38.6%), Retail Trade (13 | 15.7%), Public Administration (6 | 7.2%), Agriculture, Fishing & Hunting (4 | 4.8%), and Construction (4 | 4.8%).
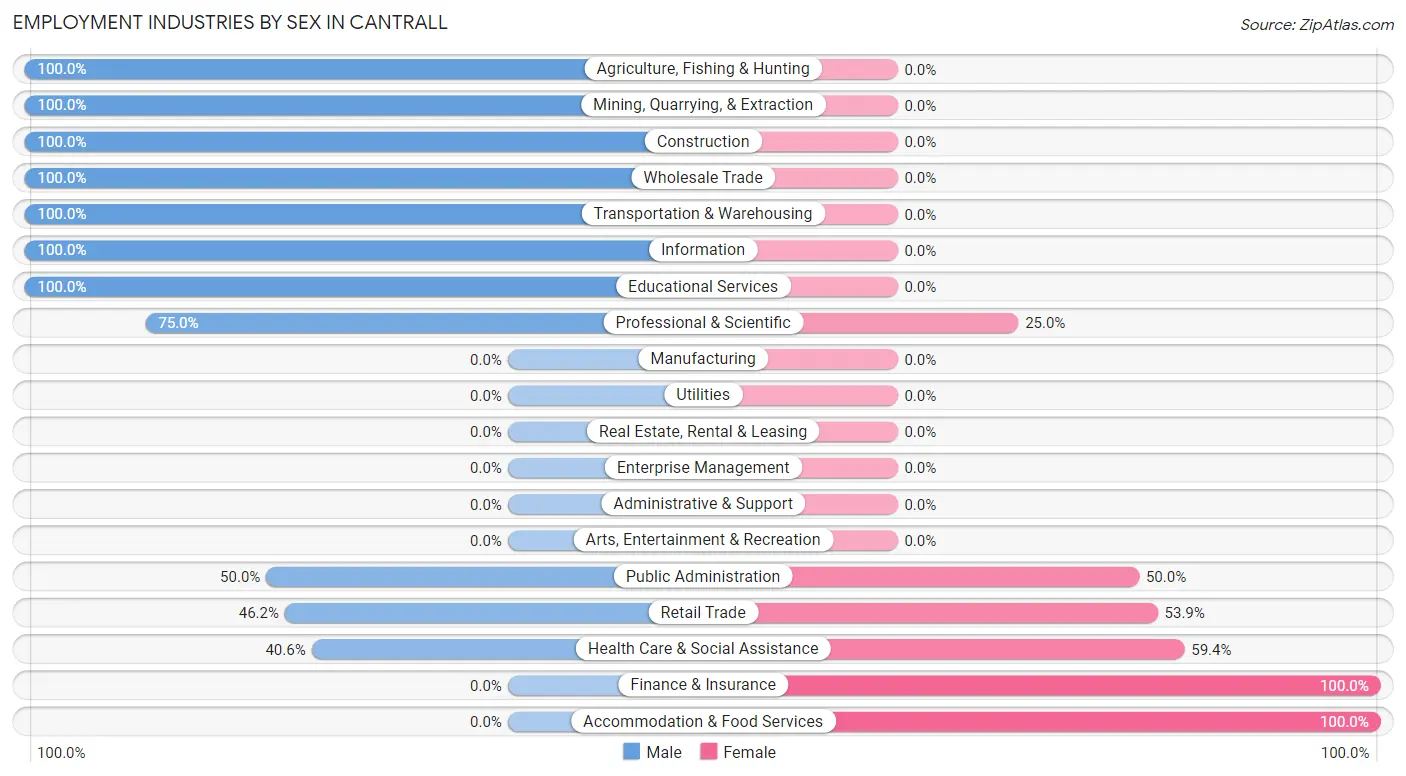
Employment Industries by Sex in Cantrall
The Cantrall industries that see more men than women are Agriculture, Fishing & Hunting (100.0%), Mining, Quarrying, & Extraction (100.0%), and Construction (100.0%), whereas the industries that tend to have a higher number of women are Finance & Insurance (100.0%), Accommodation & Food Services (100.0%), and Health Care & Social Assistance (59.4%).
| Industry | Male | Female |
| Agriculture, Fishing & Hunting | 4 (100.0%) | 0 (0.0%) |
| Mining, Quarrying, & Extraction | 1 (100.0%) | 0 (0.0%) |
| Construction | 4 (100.0%) | 0 (0.0%) |
| Manufacturing | 0 (0.0%) | 0 (0.0%) |
| Wholesale Trade | 2 (100.0%) | 0 (0.0%) |
| Retail Trade | 6 (46.2%) | 7 (53.8%) |
| Transportation & Warehousing | 1 (100.0%) | 0 (0.0%) |
| Utilities | 0 (0.0%) | 0 (0.0%) |
| Information | 3 (100.0%) | 0 (0.0%) |
| Finance & Insurance | 0 (0.0%) | 3 (100.0%) |
| Real Estate, Rental & Leasing | 0 (0.0%) | 0 (0.0%) |
| Professional & Scientific | 3 (75.0%) | 1 (25.0%) |
| Enterprise Management | 0 (0.0%) | 0 (0.0%) |
| Administrative & Support | 0 (0.0%) | 0 (0.0%) |
| Educational Services | 4 (100.0%) | 0 (0.0%) |
| Health Care & Social Assistance | 13 (40.6%) | 19 (59.4%) |
| Arts, Entertainment & Recreation | 0 (0.0%) | 0 (0.0%) |
| Accommodation & Food Services | 0 (0.0%) | 3 (100.0%) |
| Public Administration | 3 (50.0%) | 3 (50.0%) |
| Total | 44 (53.0%) | 39 (47.0%) |
Education in Cantrall
School Enrollment in Cantrall
The most common levels of schooling among the 32 students in Cantrall are high school (12 | 37.5%), college / undergraduate (12 | 37.5%), and middle school (4 | 12.5%).
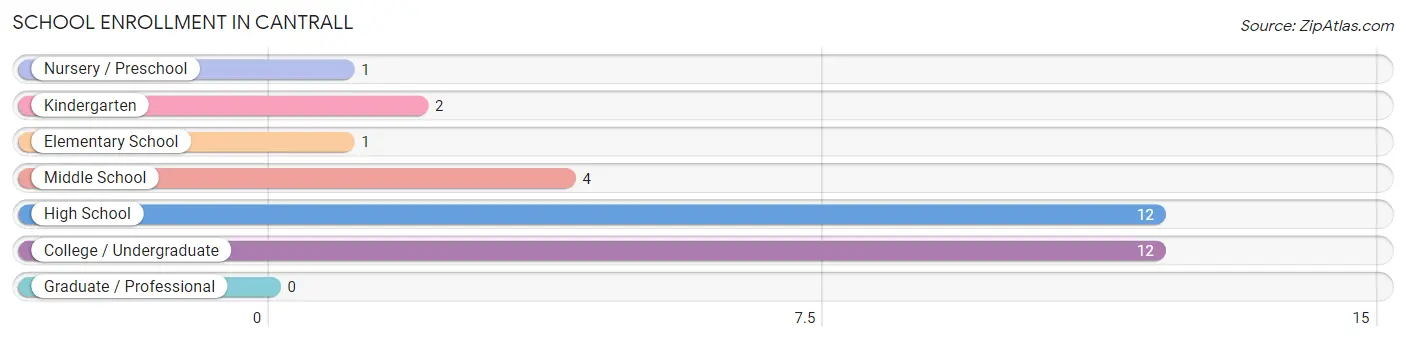
| School Level | # Students | % Students |
| Nursery / Preschool | 1 | 3.1% |
| Kindergarten | 2 | 6.2% |
| Elementary School | 1 | 3.1% |
| Middle School | 4 | 12.5% |
| High School | 12 | 37.5% |
| College / Undergraduate | 12 | 37.5% |
| Graduate / Professional | 0 | 0.0% |
| Total | 32 | 100.0% |
School Enrollment by Age by Funding Source in Cantrall
Out of a total of 32 students who are enrolled in schools in Cantrall, 1 (3.1%) attend a private institution, while the remaining 31 (96.9%) are enrolled in public schools. The age group of 20 to 24 year olds has the highest likelihood of being enrolled in private schools, with 1 (8.3% in the age bracket) enrolled. Conversely, the age group of 3 to 4 year olds has the lowest likelihood of being enrolled in a private school, with 1 (100.0% in the age bracket) attending a public institution.
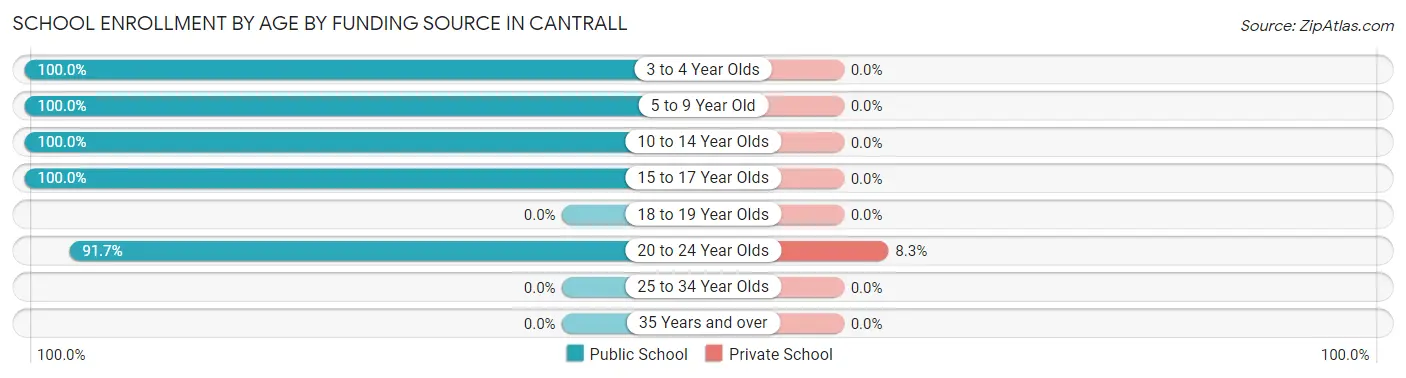
| Age Bracket | Public School | Private School |
| 3 to 4 Year Olds | 1 (100.0%) | 0 (0.0%) |
| 5 to 9 Year Old | 2 (100.0%) | 0 (0.0%) |
| 10 to 14 Year Olds | 5 (100.0%) | 0 (0.0%) |
| 15 to 17 Year Olds | 12 (100.0%) | 0 (0.0%) |
| 18 to 19 Year Olds | 0 (0.0%) | 0 (0.0%) |
| 20 to 24 Year Olds | 11 (91.7%) | 1 (8.3%) |
| 25 to 34 Year Olds | 0 (0.0%) | 0 (0.0%) |
| 35 Years and over | 0 (0.0%) | 0 (0.0%) |
| Total | 31 (96.9%) | 1 (3.1%) |
Educational Attainment by Field of Study in Cantrall
Psychology (4 | 21.0%), science & technology (4 | 21.0%), communications (4 | 21.0%), computers & mathematics (2 | 10.5%), and bio, nature & agricultural (2 | 10.5%) are the most common fields of study among 19 individuals in Cantrall who have obtained a bachelor's degree or higher.
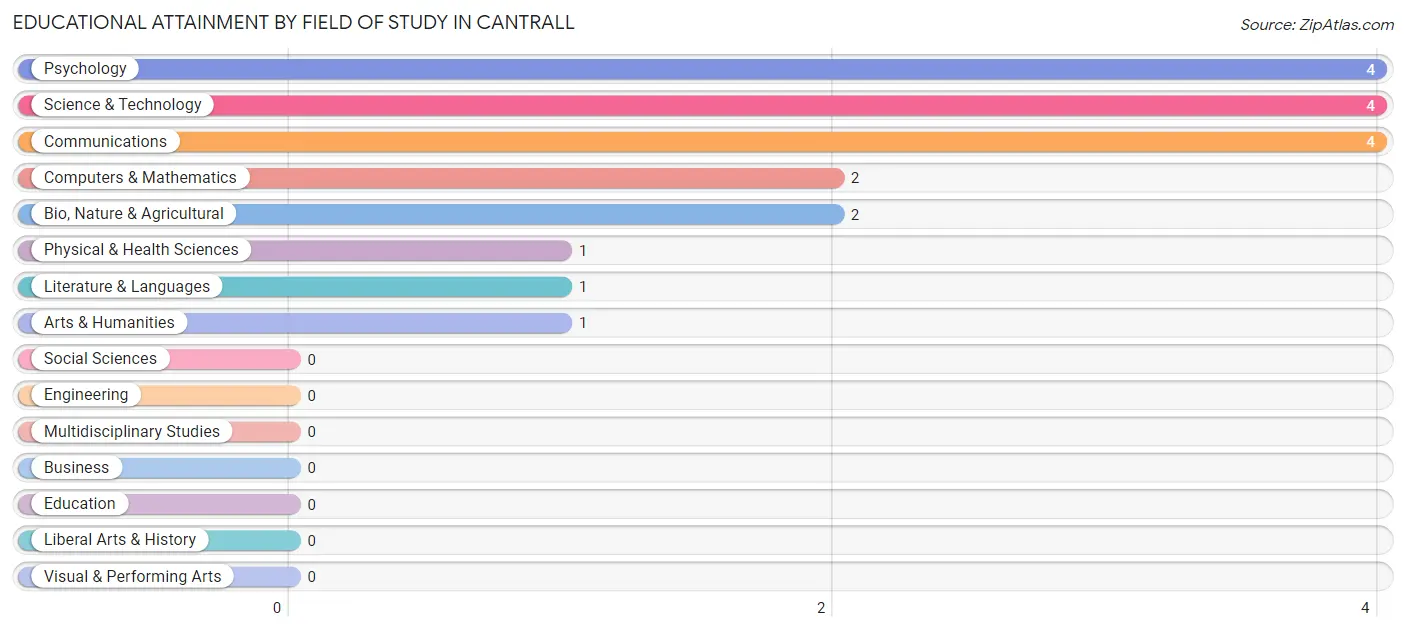
| Field of Study | # Graduates | % Graduates |
| Computers & Mathematics | 2 | 10.5% |
| Bio, Nature & Agricultural | 2 | 10.5% |
| Physical & Health Sciences | 1 | 5.3% |
| Psychology | 4 | 21.0% |
| Social Sciences | 0 | 0.0% |
| Engineering | 0 | 0.0% |
| Multidisciplinary Studies | 0 | 0.0% |
| Science & Technology | 4 | 21.0% |
| Business | 0 | 0.0% |
| Education | 0 | 0.0% |
| Literature & Languages | 1 | 5.3% |
| Liberal Arts & History | 0 | 0.0% |
| Visual & Performing Arts | 0 | 0.0% |
| Communications | 4 | 21.0% |
| Arts & Humanities | 1 | 5.3% |
| Total | 19 | 100.0% |
Transportation & Commute in Cantrall
Vehicle Availability by Sex in Cantrall
The most prevalent vehicle ownership categories in Cantrall are males with 3 vehicles (24, accounting for 50.0%) and females with 3 vehicles (12, making up 63.2%).
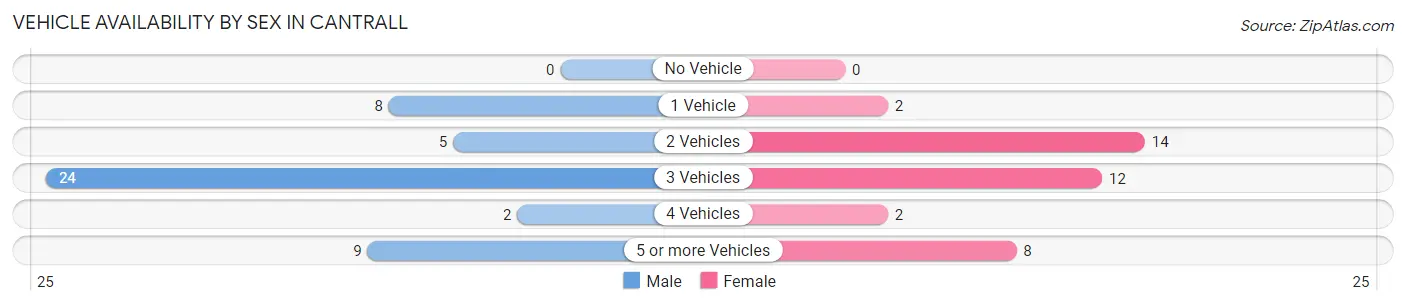
| Vehicles Available | Male | Female |
| No Vehicle | 0 (0.0%) | 0 (0.0%) |
| 1 Vehicle | 8 (16.7%) | 2 (5.3%) |
| 2 Vehicles | 5 (10.4%) | 14 (36.8%) |
| 3 Vehicles | 24 (50.0%) | 12 (31.6%) |
| 4 Vehicles | 2 (4.2%) | 2 (5.3%) |
| 5 or more Vehicles | 9 (18.8%) | 8 (21.0%) |
| Total | 48 (100.0%) | 38 (100.0%) |
Commute Time in Cantrall
The most frequently occuring commute durations in Cantrall are 20 to 24 minutes (42 commuters, 53.8%), 15 to 19 minutes (16 commuters, 20.5%), and 30 to 34 minutes (10 commuters, 12.8%).
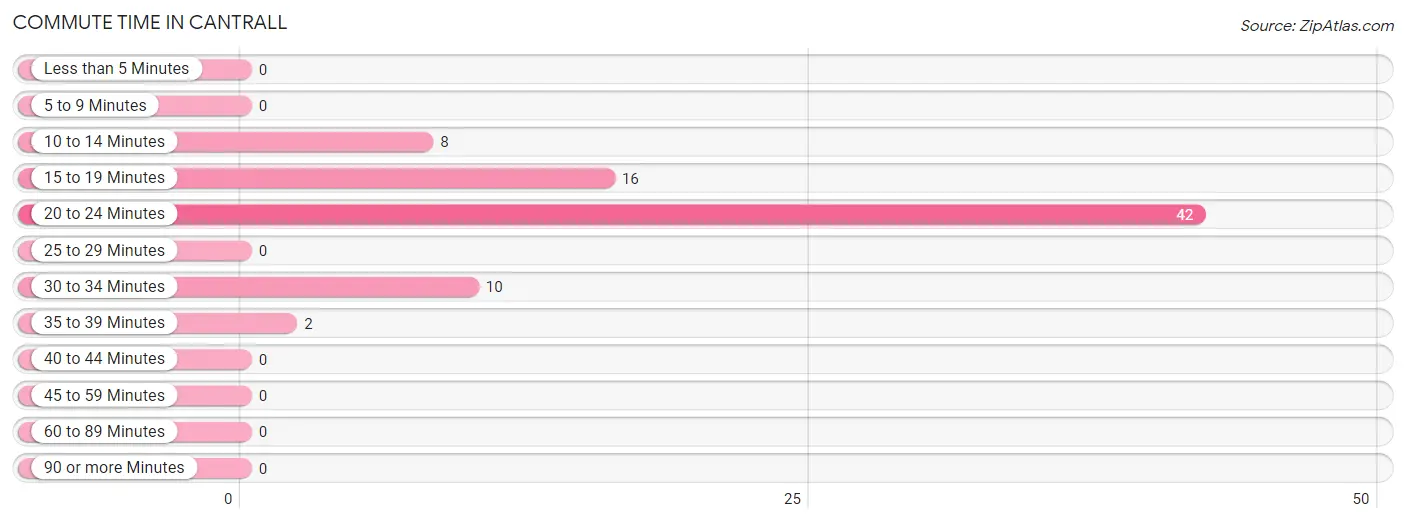
| Commute Time | # Commuters | % Commuters |
| Less than 5 Minutes | 0 | 0.0% |
| 5 to 9 Minutes | 0 | 0.0% |
| 10 to 14 Minutes | 8 | 10.3% |
| 15 to 19 Minutes | 16 | 20.5% |
| 20 to 24 Minutes | 42 | 53.8% |
| 25 to 29 Minutes | 0 | 0.0% |
| 30 to 34 Minutes | 10 | 12.8% |
| 35 to 39 Minutes | 2 | 2.6% |
| 40 to 44 Minutes | 0 | 0.0% |
| 45 to 59 Minutes | 0 | 0.0% |
| 60 to 89 Minutes | 0 | 0.0% |
| 90 or more Minutes | 0 | 0.0% |
Commute Time by Sex in Cantrall
The most common commute times in Cantrall are 20 to 24 minutes (17 commuters, 40.5%) for males and 20 to 24 minutes (25 commuters, 69.4%) for females.
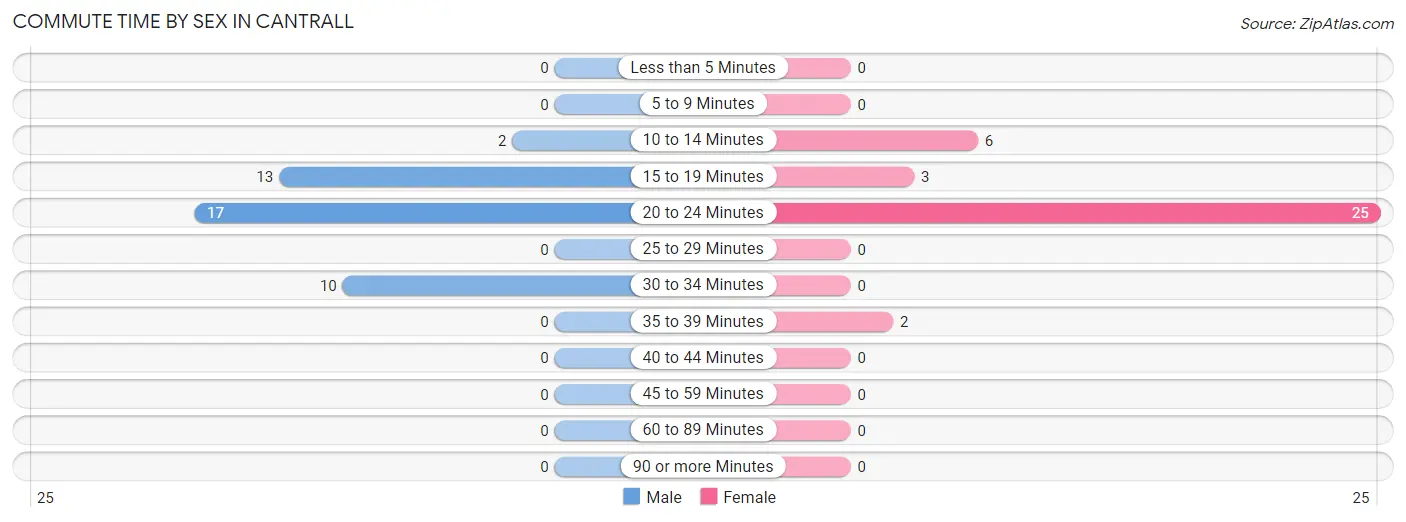
| Commute Time | Male | Female |
| Less than 5 Minutes | 0 (0.0%) | 0 (0.0%) |
| 5 to 9 Minutes | 0 (0.0%) | 0 (0.0%) |
| 10 to 14 Minutes | 2 (4.8%) | 6 (16.7%) |
| 15 to 19 Minutes | 13 (30.9%) | 3 (8.3%) |
| 20 to 24 Minutes | 17 (40.5%) | 25 (69.4%) |
| 25 to 29 Minutes | 0 (0.0%) | 0 (0.0%) |
| 30 to 34 Minutes | 10 (23.8%) | 0 (0.0%) |
| 35 to 39 Minutes | 0 (0.0%) | 2 (5.6%) |
| 40 to 44 Minutes | 0 (0.0%) | 0 (0.0%) |
| 45 to 59 Minutes | 0 (0.0%) | 0 (0.0%) |
| 60 to 89 Minutes | 0 (0.0%) | 0 (0.0%) |
| 90 or more Minutes | 0 (0.0%) | 0 (0.0%) |
Time of Departure to Work by Sex in Cantrall
The most frequent times of departure to work in Cantrall are 7:00 AM to 7:29 AM (14, 33.3%) for males and 8:00 AM to 8:29 AM (19, 52.8%) for females.
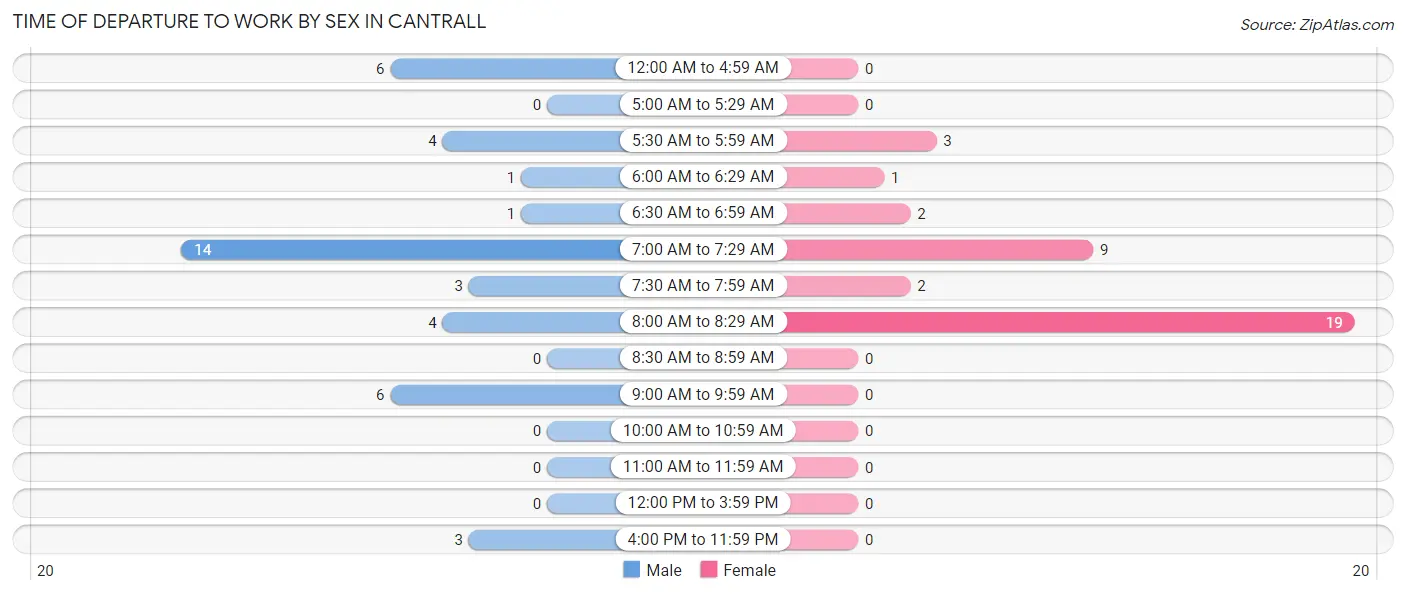
| Time of Departure | Male | Female |
| 12:00 AM to 4:59 AM | 6 (14.3%) | 0 (0.0%) |
| 5:00 AM to 5:29 AM | 0 (0.0%) | 0 (0.0%) |
| 5:30 AM to 5:59 AM | 4 (9.5%) | 3 (8.3%) |
| 6:00 AM to 6:29 AM | 1 (2.4%) | 1 (2.8%) |
| 6:30 AM to 6:59 AM | 1 (2.4%) | 2 (5.6%) |
| 7:00 AM to 7:29 AM | 14 (33.3%) | 9 (25.0%) |
| 7:30 AM to 7:59 AM | 3 (7.1%) | 2 (5.6%) |
| 8:00 AM to 8:29 AM | 4 (9.5%) | 19 (52.8%) |
| 8:30 AM to 8:59 AM | 0 (0.0%) | 0 (0.0%) |
| 9:00 AM to 9:59 AM | 6 (14.3%) | 0 (0.0%) |
| 10:00 AM to 10:59 AM | 0 (0.0%) | 0 (0.0%) |
| 11:00 AM to 11:59 AM | 0 (0.0%) | 0 (0.0%) |
| 12:00 PM to 3:59 PM | 0 (0.0%) | 0 (0.0%) |
| 4:00 PM to 11:59 PM | 3 (7.1%) | 0 (0.0%) |
| Total | 42 (100.0%) | 36 (100.0%) |
Housing Occupancy in Cantrall
Occupancy by Ownership in Cantrall
Of the total 56 dwellings in Cantrall, owner-occupied units account for 51 (91.1%), while renter-occupied units make up 5 (8.9%).
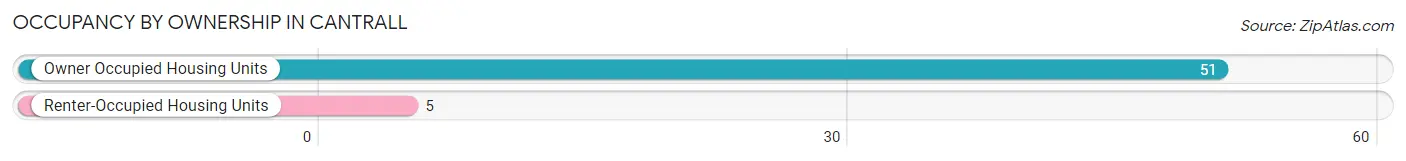
| Occupancy | # Housing Units | % Housing Units |
| Owner Occupied Housing Units | 51 | 91.1% |
| Renter-Occupied Housing Units | 5 | 8.9% |
| Total Occupied Housing Units | 56 | 100.0% |
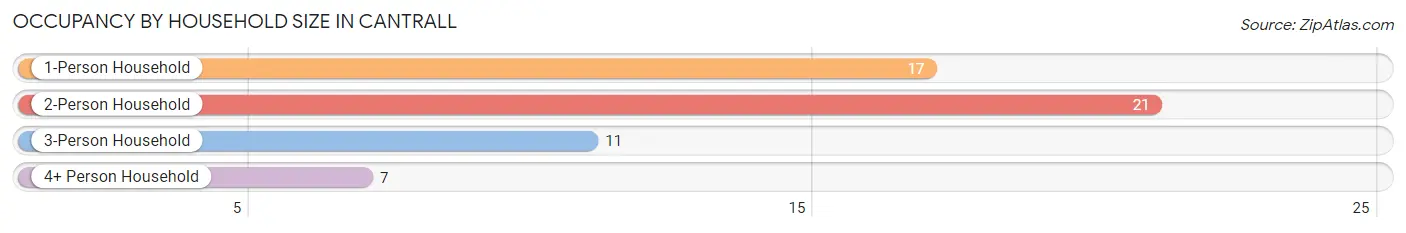
Occupancy by Household Size in Cantrall
| Household Size | # Housing Units | % Housing Units |
| 1-Person Household | 17 | 30.4% |
| 2-Person Household | 21 | 37.5% |
| 3-Person Household | 11 | 19.6% |
| 4+ Person Household | 7 | 12.5% |
| Total Housing Units | 56 | 100.0% |
Occupancy by Ownership by Household Size in Cantrall
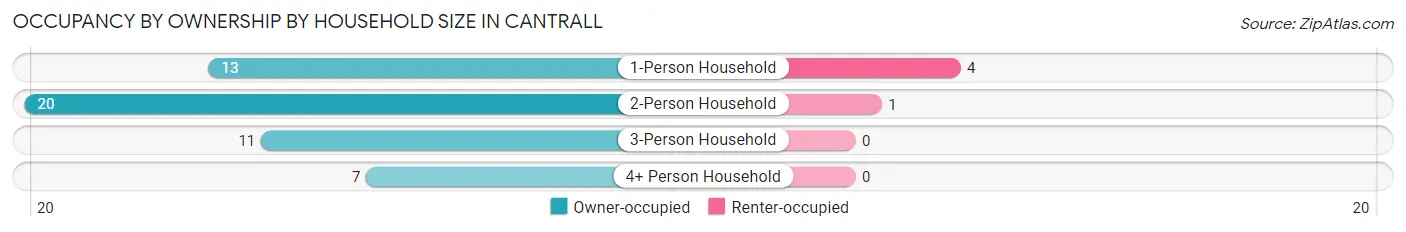
| Household Size | Owner-occupied | Renter-occupied |
| 1-Person Household | 13 (76.5%) | 4 (23.5%) |
| 2-Person Household | 20 (95.2%) | 1 (4.8%) |
| 3-Person Household | 11 (100.0%) | 0 (0.0%) |
| 4+ Person Household | 7 (100.0%) | 0 (0.0%) |
| Total Housing Units | 51 (91.1%) | 5 (8.9%) |
Occupancy by Educational Attainment in Cantrall
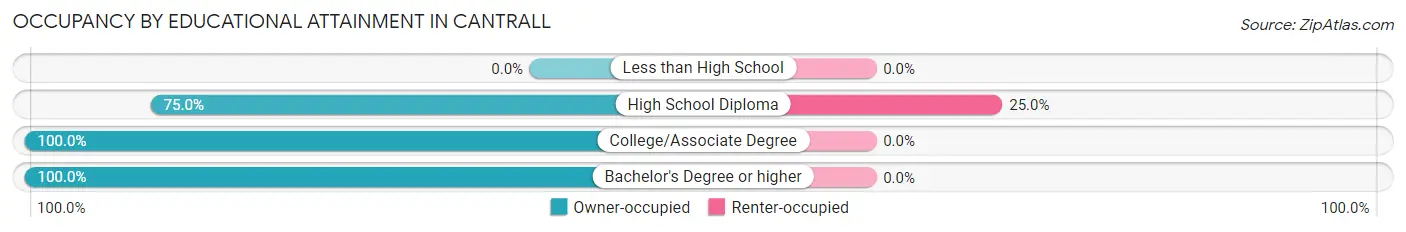
| Household Size | Owner-occupied | Renter-occupied |
| Less than High School | 0 (0.0%) | 0 (0.0%) |
| High School Diploma | 15 (75.0%) | 5 (25.0%) |
| College/Associate Degree | 24 (100.0%) | 0 (0.0%) |
| Bachelor's Degree or higher | 12 (100.0%) | 0 (0.0%) |
Occupancy by Age of Householder in Cantrall
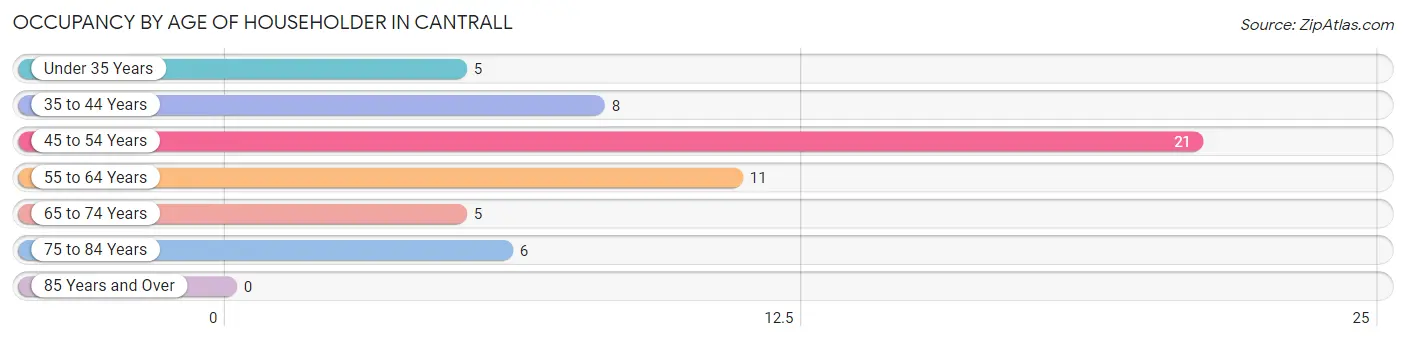
| Age Bracket | # Households | % Households |
| Under 35 Years | 5 | 8.9% |
| 35 to 44 Years | 8 | 14.3% |
| 45 to 54 Years | 21 | 37.5% |
| 55 to 64 Years | 11 | 19.6% |
| 65 to 74 Years | 5 | 8.9% |
| 75 to 84 Years | 6 | 10.7% |
| 85 Years and Over | 0 | 0.0% |
| Total | 56 | 100.0% |
Housing Finances in Cantrall
Median Income by Occupancy in Cantrall
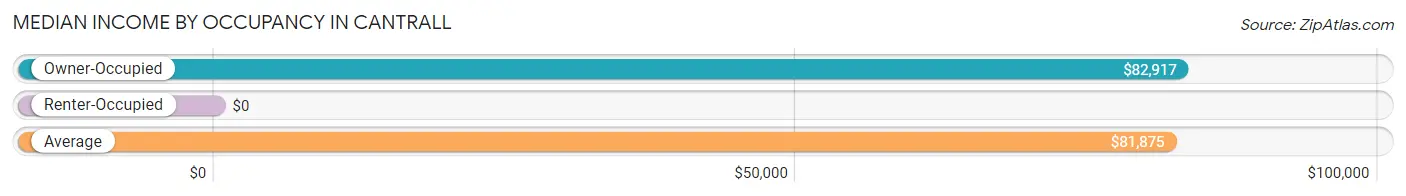
| Occupancy Type | # Households | Median Income |
| Owner-Occupied | 51 (91.1%) | $82,917 |
| Renter-Occupied | 5 (8.9%) | $0 |
| Average | 56 (100.0%) | $81,875 |
Occupancy by Householder Income Bracket in Cantrall
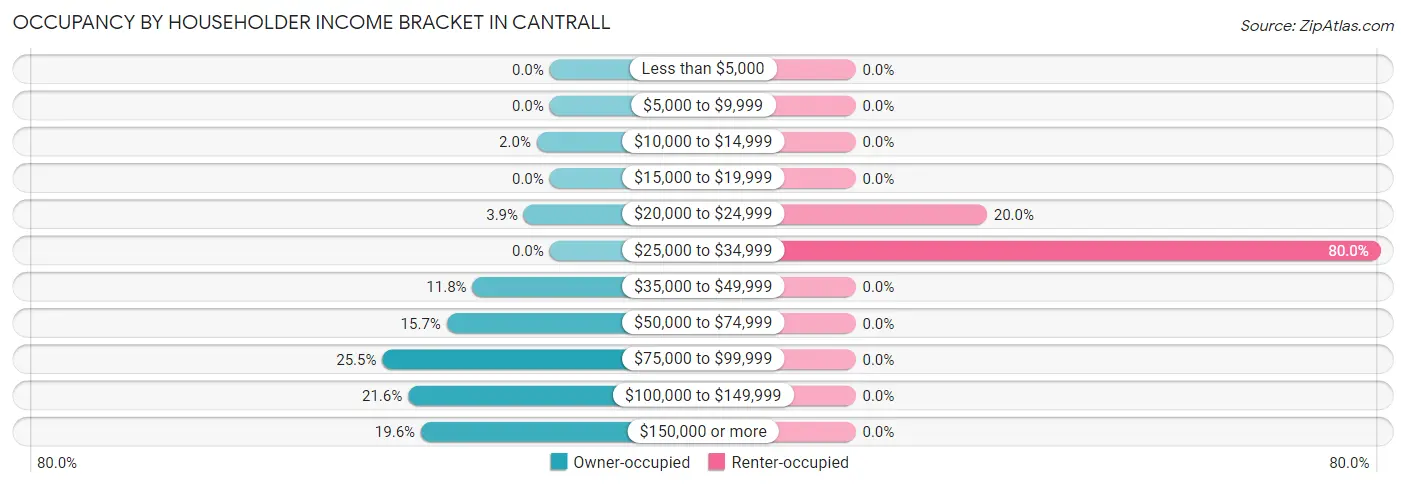
| Income Bracket | Owner-occupied | Renter-occupied |
| Less than $5,000 | 0 (0.0%) | 0 (0.0%) |
| $5,000 to $9,999 | 0 (0.0%) | 0 (0.0%) |
| $10,000 to $14,999 | 1 (2.0%) | 0 (0.0%) |
| $15,000 to $19,999 | 0 (0.0%) | 0 (0.0%) |
| $20,000 to $24,999 | 2 (3.9%) | 1 (20.0%) |
| $25,000 to $34,999 | 0 (0.0%) | 4 (80.0%) |
| $35,000 to $49,999 | 6 (11.8%) | 0 (0.0%) |
| $50,000 to $74,999 | 8 (15.7%) | 0 (0.0%) |
| $75,000 to $99,999 | 13 (25.5%) | 0 (0.0%) |
| $100,000 to $149,999 | 11 (21.6%) | 0 (0.0%) |
| $150,000 or more | 10 (19.6%) | 0 (0.0%) |
| Total | 51 (100.0%) | 5 (100.0%) |
Monthly Housing Cost Tiers in Cantrall
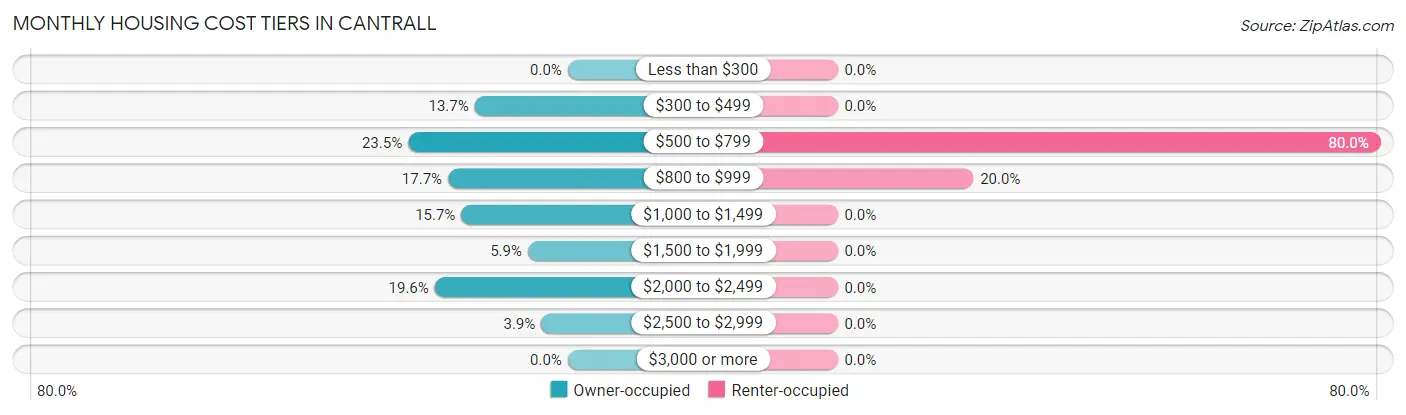
| Monthly Cost | Owner-occupied | Renter-occupied |
| Less than $300 | 0 (0.0%) | 0 (0.0%) |
| $300 to $499 | 7 (13.7%) | 0 (0.0%) |
| $500 to $799 | 12 (23.5%) | 4 (80.0%) |
| $800 to $999 | 9 (17.6%) | 1 (20.0%) |
| $1,000 to $1,499 | 8 (15.7%) | 0 (0.0%) |
| $1,500 to $1,999 | 3 (5.9%) | 0 (0.0%) |
| $2,000 to $2,499 | 10 (19.6%) | 0 (0.0%) |
| $2,500 to $2,999 | 2 (3.9%) | 0 (0.0%) |
| $3,000 or more | 0 (0.0%) | 0 (0.0%) |
| Total | 51 (100.0%) | 5 (100.0%) |
Physical Housing Characteristics in Cantrall
Housing Structures in Cantrall
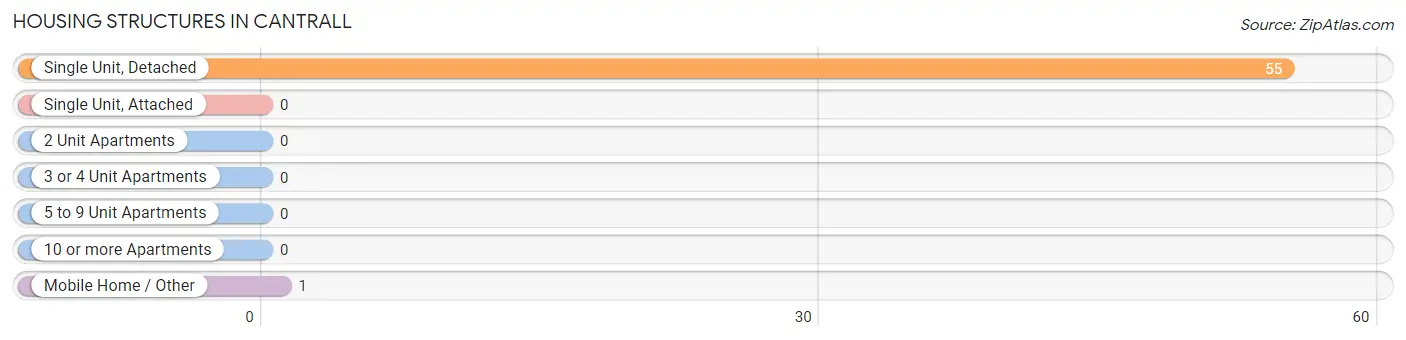
| Structure Type | # Housing Units | % Housing Units |
| Single Unit, Detached | 55 | 98.2% |
| Single Unit, Attached | 0 | 0.0% |
| 2 Unit Apartments | 0 | 0.0% |
| 3 or 4 Unit Apartments | 0 | 0.0% |
| 5 to 9 Unit Apartments | 0 | 0.0% |
| 10 or more Apartments | 0 | 0.0% |
| Mobile Home / Other | 1 | 1.8% |
| Total | 56 | 100.0% |
Housing Structures by Occupancy in Cantrall
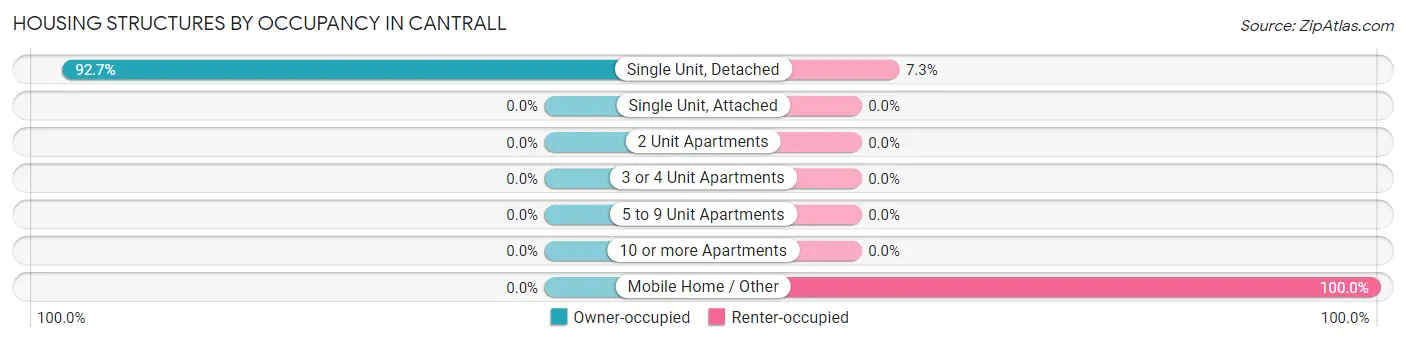
| Structure Type | Owner-occupied | Renter-occupied |
| Single Unit, Detached | 51 (92.7%) | 4 (7.3%) |
| Single Unit, Attached | 0 (0.0%) | 0 (0.0%) |
| 2 Unit Apartments | 0 (0.0%) | 0 (0.0%) |
| 3 or 4 Unit Apartments | 0 (0.0%) | 0 (0.0%) |
| 5 to 9 Unit Apartments | 0 (0.0%) | 0 (0.0%) |
| 10 or more Apartments | 0 (0.0%) | 0 (0.0%) |
| Mobile Home / Other | 0 (0.0%) | 1 (100.0%) |
| Total | 51 (91.1%) | 5 (8.9%) |
Housing Structures by Number of Rooms in Cantrall
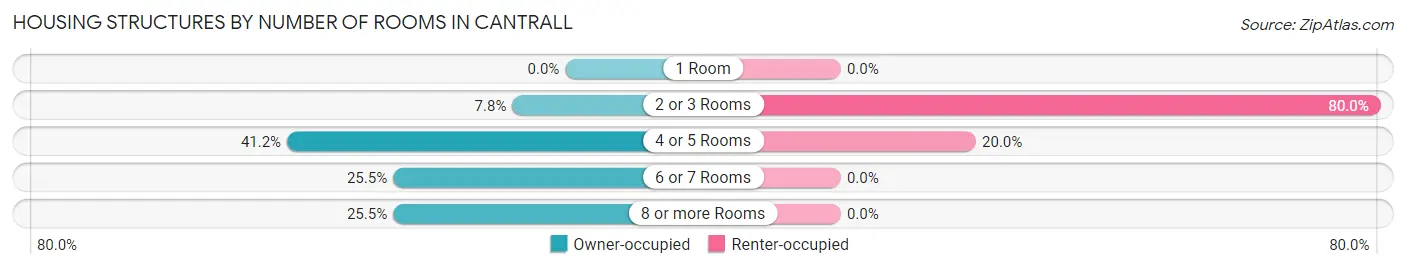
| Number of Rooms | Owner-occupied | Renter-occupied |
| 1 Room | 0 (0.0%) | 0 (0.0%) |
| 2 or 3 Rooms | 4 (7.8%) | 4 (80.0%) |
| 4 or 5 Rooms | 21 (41.2%) | 1 (20.0%) |
| 6 or 7 Rooms | 13 (25.5%) | 0 (0.0%) |
| 8 or more Rooms | 13 (25.5%) | 0 (0.0%) |
| Total | 51 (100.0%) | 5 (100.0%) |
Housing Structure by Heating Type in Cantrall
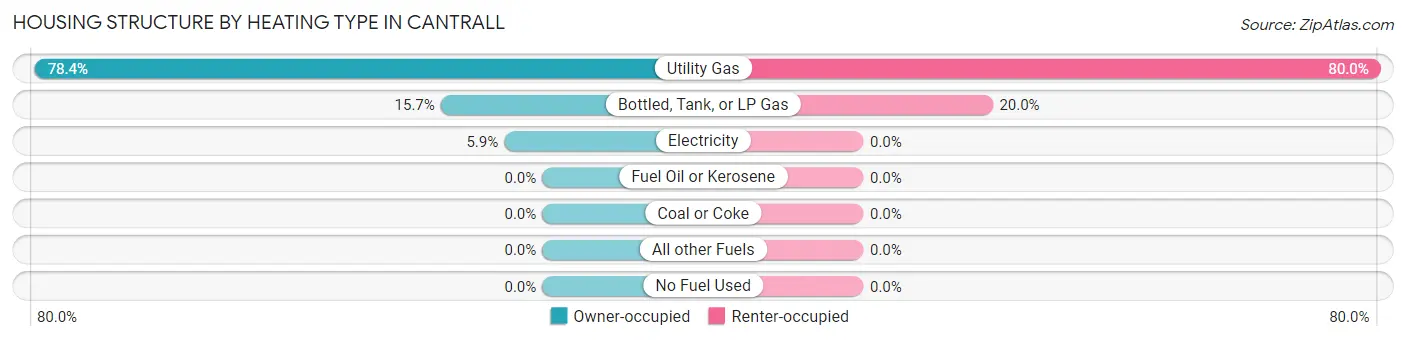
| Heating Type | Owner-occupied | Renter-occupied |
| Utility Gas | 40 (78.4%) | 4 (80.0%) |
| Bottled, Tank, or LP Gas | 8 (15.7%) | 1 (20.0%) |
| Electricity | 3 (5.9%) | 0 (0.0%) |
| Fuel Oil or Kerosene | 0 (0.0%) | 0 (0.0%) |
| Coal or Coke | 0 (0.0%) | 0 (0.0%) |
| All other Fuels | 0 (0.0%) | 0 (0.0%) |
| No Fuel Used | 0 (0.0%) | 0 (0.0%) |
| Total | 51 (100.0%) | 5 (100.0%) |
Household Vehicle Usage in Cantrall
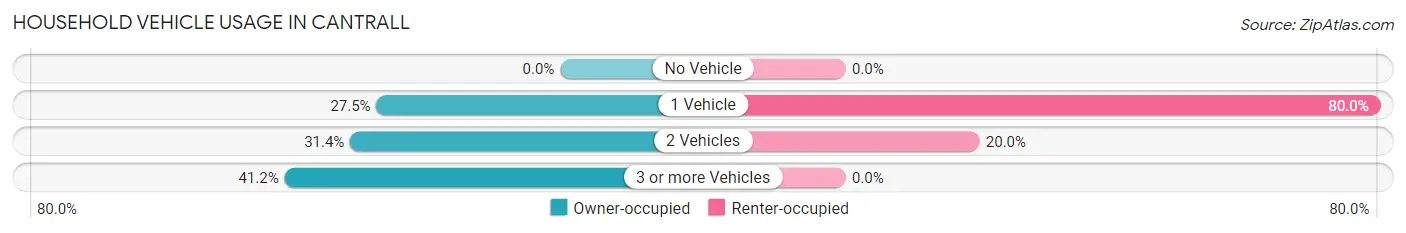
| Vehicles per Household | Owner-occupied | Renter-occupied |
| No Vehicle | 0 (0.0%) | 0 (0.0%) |
| 1 Vehicle | 14 (27.5%) | 4 (80.0%) |
| 2 Vehicles | 16 (31.4%) | 1 (20.0%) |
| 3 or more Vehicles | 21 (41.2%) | 0 (0.0%) |
| Total | 51 (100.0%) | 5 (100.0%) |
Real Estate & Mortgages in Cantrall
Real Estate and Mortgage Overview in Cantrall
| Characteristic | Without Mortgage | With Mortgage |
| Housing Units | 23 | 28 |
| Median Property Value | $116,100 | $200,000 |
| Median Household Income | $100,417 | $8 |
| Monthly Housing Costs | $710 | $0 |
| Real Estate Taxes | $2,917 | $0 |
Property Value by Mortgage Status in Cantrall
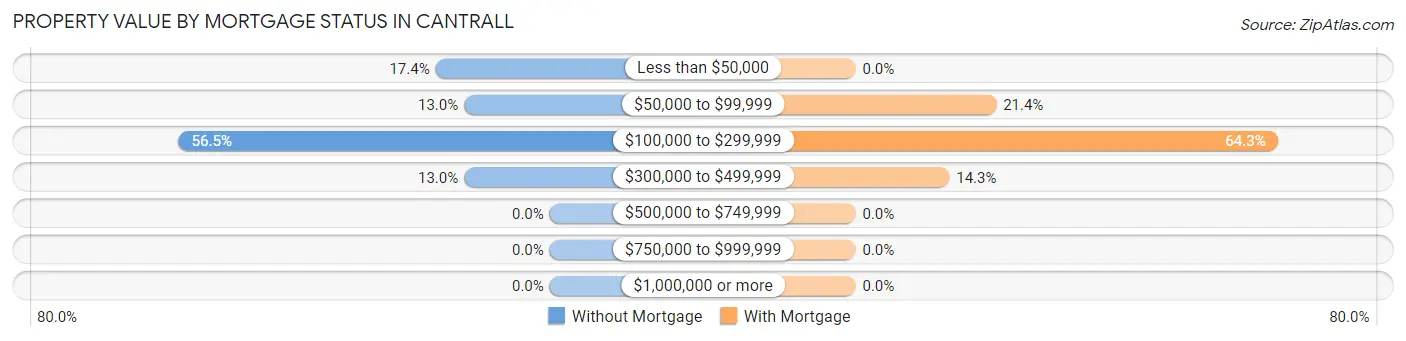
| Property Value | Without Mortgage | With Mortgage |
| Less than $50,000 | 4 (17.4%) | 0 (0.0%) |
| $50,000 to $99,999 | 3 (13.0%) | 6 (21.4%) |
| $100,000 to $299,999 | 13 (56.5%) | 18 (64.3%) |
| $300,000 to $499,999 | 3 (13.0%) | 4 (14.3%) |
| $500,000 to $749,999 | 0 (0.0%) | 0 (0.0%) |
| $750,000 to $999,999 | 0 (0.0%) | 0 (0.0%) |
| $1,000,000 or more | 0 (0.0%) | 0 (0.0%) |
| Total | 23 (100.0%) | 28 (100.0%) |
Household Income by Mortgage Status in Cantrall
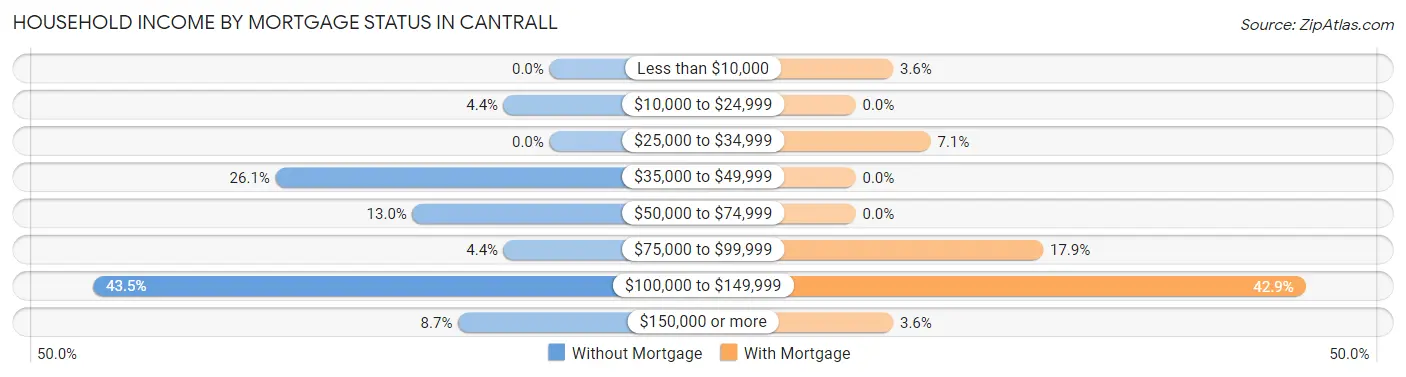
| Household Income | Without Mortgage | With Mortgage |
| Less than $10,000 | 0 (0.0%) | 1 (3.6%) |
| $10,000 to $24,999 | 1 (4.3%) | 0 (0.0%) |
| $25,000 to $34,999 | 0 (0.0%) | 2 (7.1%) |
| $35,000 to $49,999 | 6 (26.1%) | 0 (0.0%) |
| $50,000 to $74,999 | 3 (13.0%) | 0 (0.0%) |
| $75,000 to $99,999 | 1 (4.3%) | 5 (17.9%) |
| $100,000 to $149,999 | 10 (43.5%) | 12 (42.9%) |
| $150,000 or more | 2 (8.7%) | 1 (3.6%) |
| Total | 23 (100.0%) | 28 (100.0%) |
Property Value to Household Income Ratio in Cantrall
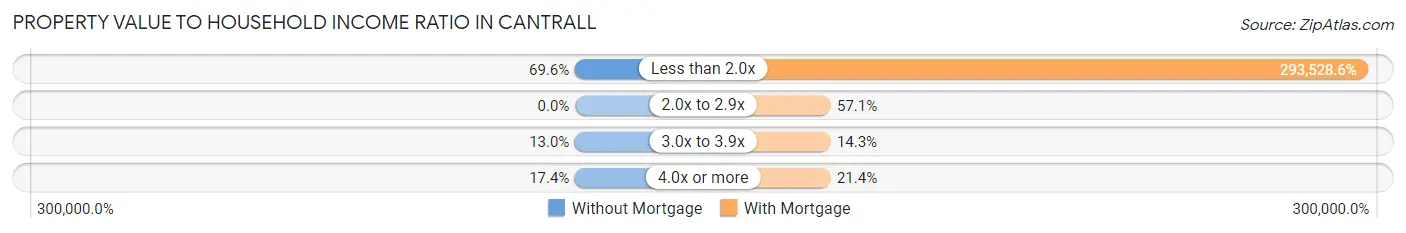
| Value-to-Income Ratio | Without Mortgage | With Mortgage |
| Less than 2.0x | 16 (69.6%) | 82,188 (293,528.6%) |
| 2.0x to 2.9x | 0 (0.0%) | 16 (57.1%) |
| 3.0x to 3.9x | 3 (13.0%) | 4 (14.3%) |
| 4.0x or more | 4 (17.4%) | 6 (21.4%) |
| Total | 23 (100.0%) | 28 (100.0%) |
Real Estate Taxes by Mortgage Status in Cantrall
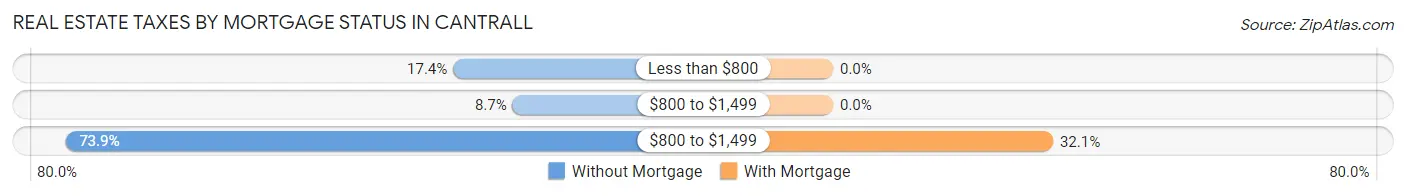
| Property Taxes | Without Mortgage | With Mortgage |
| Less than $800 | 4 (17.4%) | 0 (0.0%) |
| $800 to $1,499 | 2 (8.7%) | 0 (0.0%) |
| $800 to $1,499 | 17 (73.9%) | 9 (32.1%) |
| Total | 23 (100.0%) | 28 (100.0%) |
Health & Disability in Cantrall
Health Insurance Coverage by Age in Cantrall
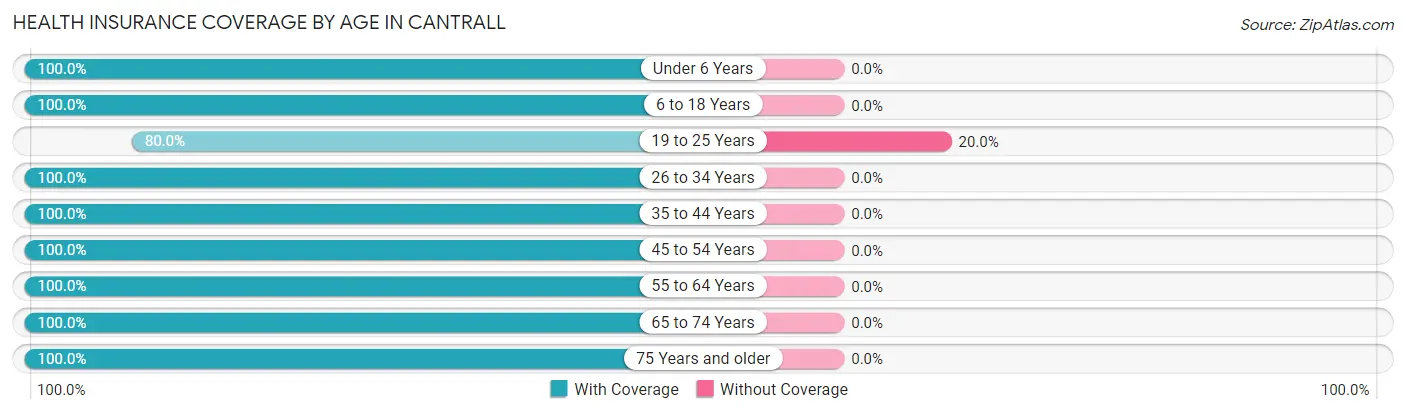
| Age Bracket | With Coverage | Without Coverage |
| Under 6 Years | 2 (100.0%) | 0 (0.0%) |
| 6 to 18 Years | 19 (100.0%) | 0 (0.0%) |
| 19 to 25 Years | 24 (80.0%) | 6 (20.0%) |
| 26 to 34 Years | 10 (100.0%) | 0 (0.0%) |
| 35 to 44 Years | 6 (100.0%) | 0 (0.0%) |
| 45 to 54 Years | 34 (100.0%) | 0 (0.0%) |
| 55 to 64 Years | 18 (100.0%) | 0 (0.0%) |
| 65 to 74 Years | 10 (100.0%) | 0 (0.0%) |
| 75 Years and older | 6 (100.0%) | 0 (0.0%) |
| Total | 129 (95.6%) | 6 (4.4%) |
Health Insurance Coverage by Citizenship Status in Cantrall
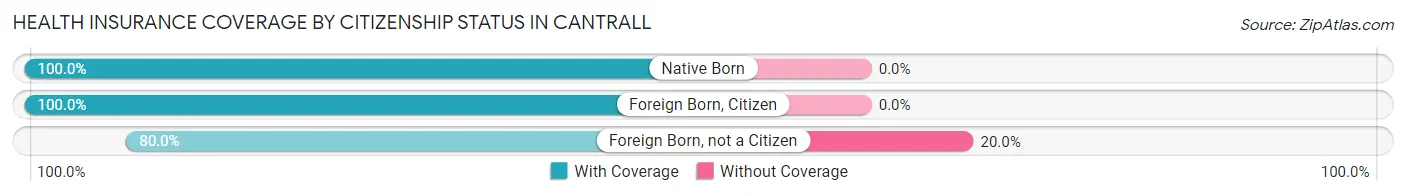
| Citizenship Status | With Coverage | Without Coverage |
| Native Born | 2 (100.0%) | 0 (0.0%) |
| Foreign Born, Citizen | 19 (100.0%) | 0 (0.0%) |
| Foreign Born, not a Citizen | 24 (80.0%) | 6 (20.0%) |
Health Insurance Coverage by Household Income in Cantrall
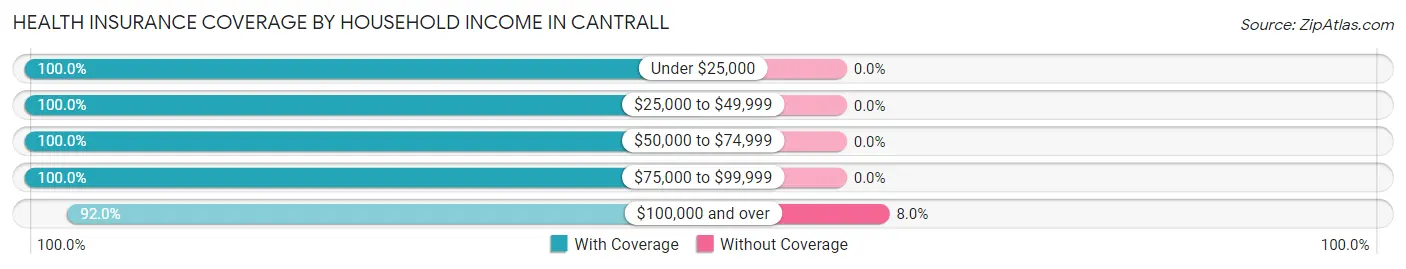
| Household Income | With Coverage | Without Coverage |
| Under $25,000 | 13 (100.0%) | 0 (0.0%) |
| $25,000 to $49,999 | 10 (100.0%) | 0 (0.0%) |
| $50,000 to $74,999 | 16 (100.0%) | 0 (0.0%) |
| $75,000 to $99,999 | 21 (100.0%) | 0 (0.0%) |
| $100,000 and over | 69 (92.0%) | 6 (8.0%) |
Public vs Private Health Insurance Coverage by Age in Cantrall
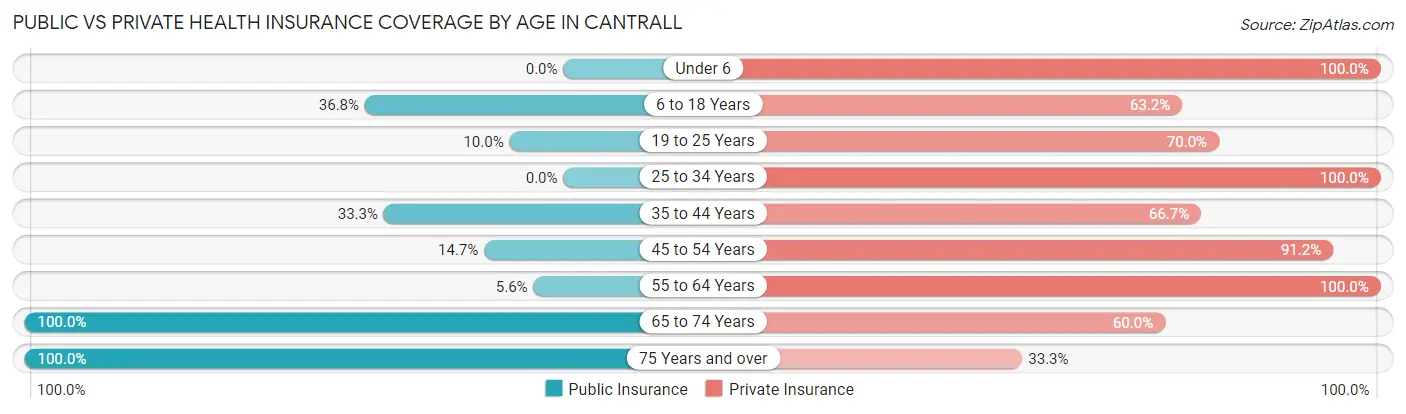
| Age Bracket | Public Insurance | Private Insurance |
| Under 6 | 0 (0.0%) | 2 (100.0%) |
| 6 to 18 Years | 7 (36.8%) | 12 (63.2%) |
| 19 to 25 Years | 3 (10.0%) | 21 (70.0%) |
| 25 to 34 Years | 0 (0.0%) | 10 (100.0%) |
| 35 to 44 Years | 2 (33.3%) | 4 (66.7%) |
| 45 to 54 Years | 5 (14.7%) | 31 (91.2%) |
| 55 to 64 Years | 1 (5.6%) | 18 (100.0%) |
| 65 to 74 Years | 10 (100.0%) | 6 (60.0%) |
| 75 Years and over | 6 (100.0%) | 2 (33.3%) |
| Total | 34 (25.2%) | 106 (78.5%) |
Disability Status by Sex by Age in Cantrall
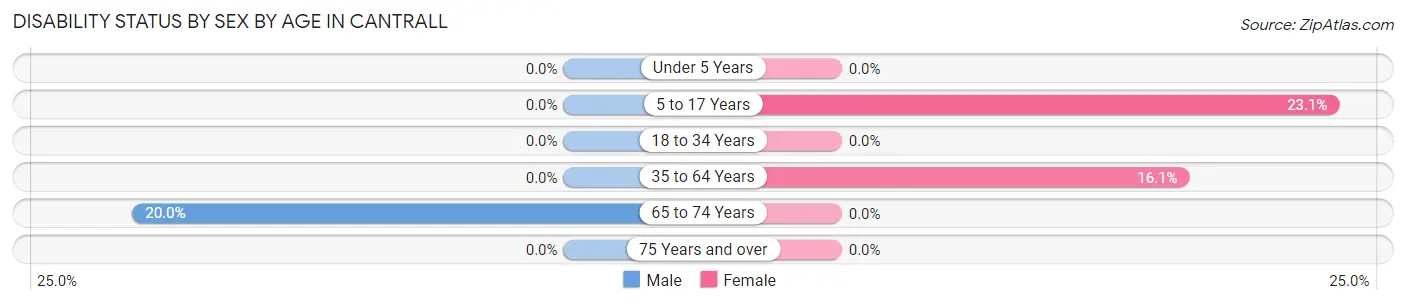
| Age Bracket | Male | Female |
| Under 5 Years | 0 (0.0%) | 0 (0.0%) |
| 5 to 17 Years | 0 (0.0%) | 3 (23.1%) |
| 18 to 34 Years | 0 (0.0%) | 0 (0.0%) |
| 35 to 64 Years | 0 (0.0%) | 5 (16.1%) |
| 65 to 74 Years | 1 (20.0%) | 0 (0.0%) |
| 75 Years and over | 0 (0.0%) | 0 (0.0%) |
Disability Class by Sex by Age in Cantrall
Disability Class: Hearing Difficulty
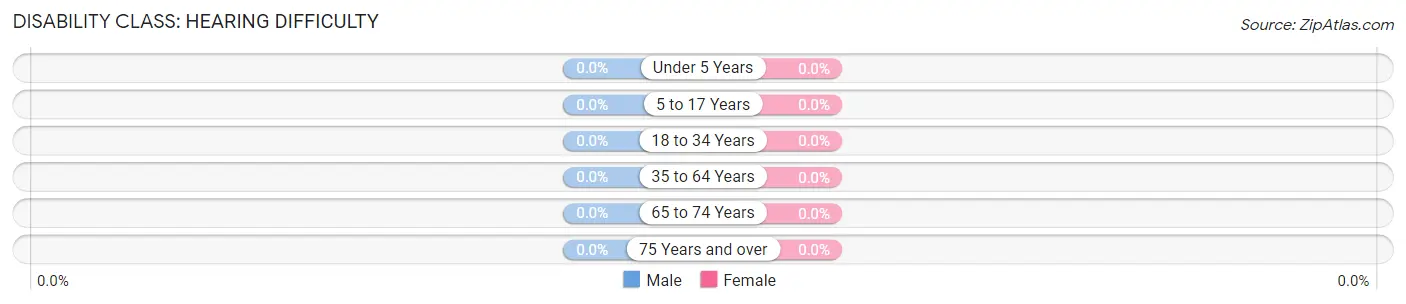
| Age Bracket | Male | Female |
| Under 5 Years | 0 (0.0%) | 0 (0.0%) |
| 5 to 17 Years | 0 (0.0%) | 0 (0.0%) |
| 18 to 34 Years | 0 (0.0%) | 0 (0.0%) |
| 35 to 64 Years | 0 (0.0%) | 0 (0.0%) |
| 65 to 74 Years | 0 (0.0%) | 0 (0.0%) |
| 75 Years and over | 0 (0.0%) | 0 (0.0%) |
Disability Class: Vision Difficulty
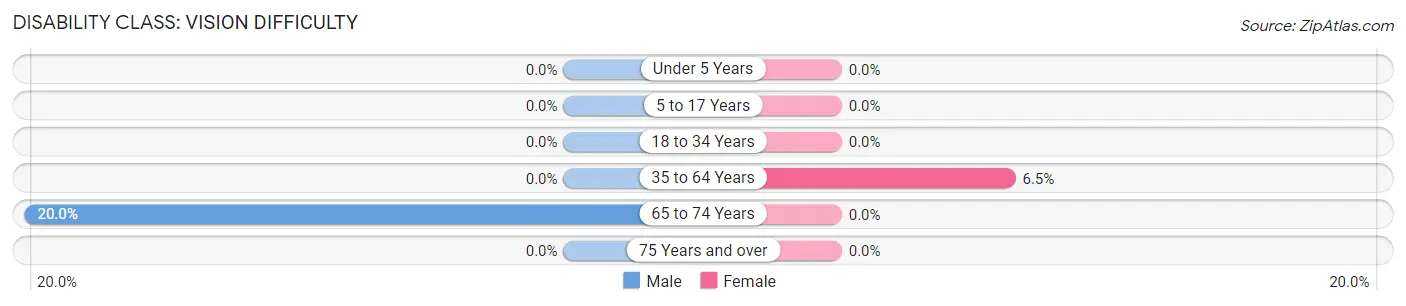
| Age Bracket | Male | Female |
| Under 5 Years | 0 (0.0%) | 0 (0.0%) |
| 5 to 17 Years | 0 (0.0%) | 0 (0.0%) |
| 18 to 34 Years | 0 (0.0%) | 0 (0.0%) |
| 35 to 64 Years | 0 (0.0%) | 2 (6.5%) |
| 65 to 74 Years | 1 (20.0%) | 0 (0.0%) |
| 75 Years and over | 0 (0.0%) | 0 (0.0%) |
Disability Class: Cognitive Difficulty
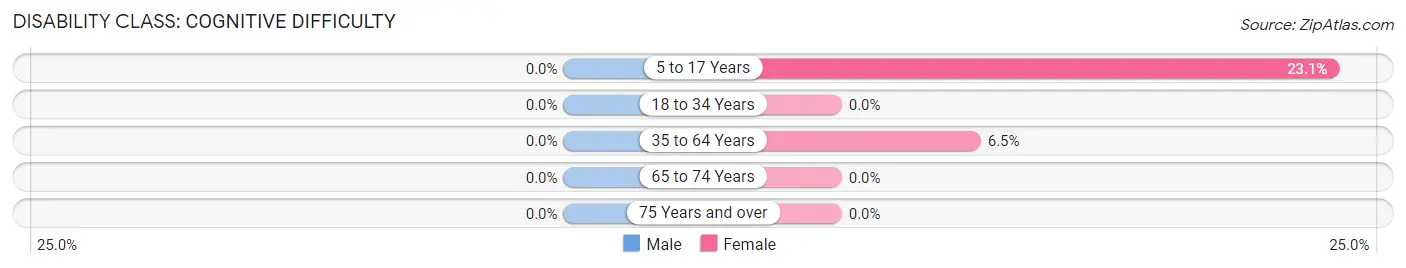
| Age Bracket | Male | Female |
| 5 to 17 Years | 0 (0.0%) | 3 (23.1%) |
| 18 to 34 Years | 0 (0.0%) | 0 (0.0%) |
| 35 to 64 Years | 0 (0.0%) | 2 (6.5%) |
| 65 to 74 Years | 0 (0.0%) | 0 (0.0%) |
| 75 Years and over | 0 (0.0%) | 0 (0.0%) |
Disability Class: Ambulatory Difficulty
| Age Bracket | Male | Female |
| 5 to 17 Years | 0 (0.0%) | 0 (0.0%) |
| 18 to 34 Years | 0 (0.0%) | 0 (0.0%) |
| 35 to 64 Years | 0 (0.0%) | 0 (0.0%) |
| 65 to 74 Years | 0 (0.0%) | 0 (0.0%) |
| 75 Years and over | 0 (0.0%) | 0 (0.0%) |
Disability Class: Self-Care Difficulty
| Age Bracket | Male | Female |
| 5 to 17 Years | 0 (0.0%) | 0 (0.0%) |
| 18 to 34 Years | 0 (0.0%) | 0 (0.0%) |
| 35 to 64 Years | 0 (0.0%) | 0 (0.0%) |
| 65 to 74 Years | 0 (0.0%) | 0 (0.0%) |
| 75 Years and over | 0 (0.0%) | 0 (0.0%) |
Technology Access in Cantrall
Computing Device Access in Cantrall
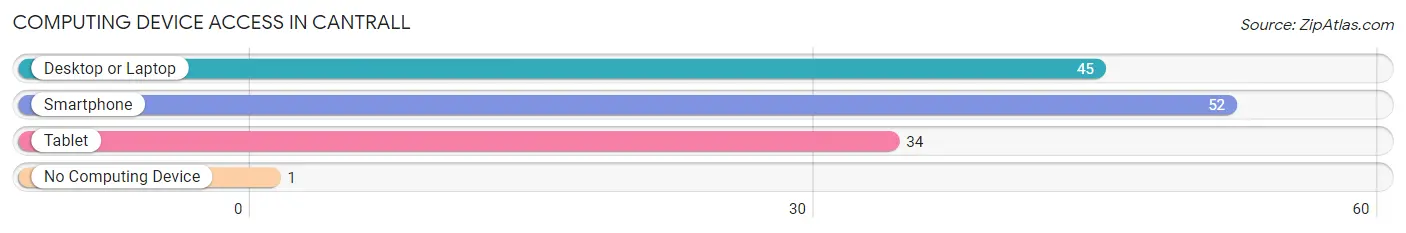
| Device Type | # Households | % Households |
| Desktop or Laptop | 45 | 80.4% |
| Smartphone | 52 | 92.9% |
| Tablet | 34 | 60.7% |
| No Computing Device | 1 | 1.8% |
| Total | 56 | 100.0% |
Internet Access in Cantrall
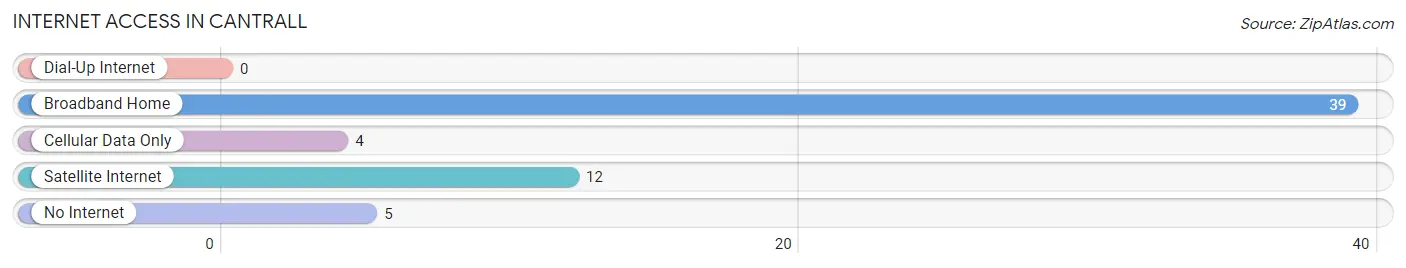
| Internet Type | # Households | % Households |
| Dial-Up Internet | 0 | 0.0% |
| Broadband Home | 39 | 69.6% |
| Cellular Data Only | 4 | 7.1% |
| Satellite Internet | 12 | 21.4% |
| No Internet | 5 | 8.9% |
| Total | 56 | 100.0% |
Cantrall Summary
Cantrall is a small village located in Sangamon County, Illinois. It is situated in the central part of the state, about 15 miles south of Springfield. The village has a population of approximately 500 people and covers an area of 0.6 square miles.
History
Cantrall was founded in 1836 by William Cantrall, a settler from Kentucky. He purchased the land from the federal government and established a small trading post. The village was originally known as Cantrall’s Station, but the name was changed to Cantrall in 1854.
The village grew slowly over the years, but it was not until the late 19th century that it began to experience significant growth. This was due to the arrival of the railroad, which connected Cantrall to the larger cities of Springfield and Decatur. The railroad also allowed for the shipment of goods and services to and from the village.
In the early 20th century, Cantrall experienced a period of rapid growth. This was due to the development of the coal mining industry in the area. The coal mines provided employment for many of the villagers and allowed for the growth of the village.
Geography
Cantrall is located in the central part of Illinois, about 15 miles south of Springfield. The village is situated in a rural area and is surrounded by farmland. The Sangamon River runs through the village and provides a source of water for the residents.
The village is located in a flat area and is surrounded by rolling hills. The climate in Cantrall is temperate, with hot summers and cold winters. The average temperature in the summer is around 80 degrees Fahrenheit and the average temperature in the winter is around 30 degrees Fahrenheit.
Economy
The economy of Cantrall is largely based on agriculture. The village is surrounded by farmland and many of the residents are employed in the agricultural industry. The village also has a few small businesses, such as a grocery store and a hardware store.
The coal mining industry was once a major employer in the village, but it has since declined. The village also has a few small manufacturing businesses, such as a furniture factory and a metal fabrication plant.
Demographics
As of the 2010 census, the population of Cantrall was 498. The racial makeup of the village was 97.6% White, 0.2% African American, 0.2% Native American, 0.4% Asian, and 1.6% from other races. The median household income was $45,000 and the median family income was $50,000.
The village is served by the Cantrall-Latham School District. The district consists of one elementary school, one middle school, and one high school. The village also has a public library and a post office.
Cantrall is a small village with a rich history and a strong agricultural economy. The village is surrounded by farmland and is home to a diverse population. The village is served by a school district and has a few small businesses. The village is a great place to live and work and is a great example of rural life in Illinois.
Common Questions
What is Per Capita Income in Cantrall?
Per Capita income in Cantrall is $41,394.
What is the Median Family Income in Cantrall?
Median Family Income in Cantrall is $118,125.
What is the Median Household income in Cantrall?
Median Household Income in Cantrall is $81,875.
What is Income or Wage Gap in Cantrall?
Income or Wage Gap in Cantrall is 9.1%.
Women in Cantrall earn 90.9 cents for every dollar earned by a man.
What is Inequality or Gini Index in Cantrall?
Inequality or Gini Index in Cantrall is 0.36.
What is the Total Population of Cantrall?
Total Population of Cantrall is 139.
What is the Total Male Population of Cantrall?
Total Male Population of Cantrall is 67.
What is the Total Female Population of Cantrall?
Total Female Population of Cantrall is 72.
What is the Ratio of Males per 100 Females in Cantrall?
There are 93.06 Males per 100 Females in Cantrall.
What is the Ratio of Females per 100 Males in Cantrall?
There are 107.46 Females per 100 Males in Cantrall.
What is the Median Population Age in Cantrall?
Median Population Age in Cantrall is 43.8 Years.
What is the Average Family Size in Cantrall
Average Family Size in Cantrall is 3.4 People.
What is the Average Household Size in Cantrall
Average Household Size in Cantrall is 2.5 People.
How Large is the Labor Force in Cantrall?
There are 89 People in the Labor Forcein in Cantrall.
What is the Percentage of People in the Labor Force in Cantrall?
69.0% of People are in the Labor Force in Cantrall.
What is the Unemployment Rate in Cantrall?
Unemployment Rate in Cantrall is 2.4%.