Beason, IL Map & Demographics
Beason Map
Beason Overview
$32,025
PER CAPITA INCOME
$66,786
AVG FAMILY INCOME
$52,981
AVG HOUSEHOLD INCOME
27.6%
WAGE / INCOME GAP [ % ]
72.4¢/ $1
WAGE / INCOME GAP [ $ ]
0.28
INEQUALITY / GINI INDEX
157
TOTAL POPULATION
90
MALE POPULATION
67
FEMALE POPULATION
134.33
MALES / 100 FEMALES
74.44
FEMALES / 100 MALES
47.5
MEDIAN AGE
2.2
AVG FAMILY SIZE
1.8
AVG HOUSEHOLD SIZE
112
LABOR FORCE [ PEOPLE ]
75.7%
PERCENT IN LABOR FORCE
Beason Zip Codes
Beason Area Codes
Income in Beason
Income Overview in Beason
Per Capita Income in Beason is $32,025, while median incomes of families and households are $66,786 and $52,981 respectively.
| Characteristic | Number | Measure |
| Per Capita Income | 157 | $32,025 |
| Median Family Income | 56 | $66,786 |
| Mean Family Income | 56 | $74,502 |
| Median Household Income | 87 | $52,981 |
| Mean Household Income | 87 | $58,923 |
| Income Deficit | 56 | $0 |
| Wage / Income Gap (%) | 157 | 27.60% |
| Wage / Income Gap ($) | 157 | 72.40¢ per $1 |
| Gini / Inequality Index | 157 | 0.28 |
Earnings by Sex in Beason
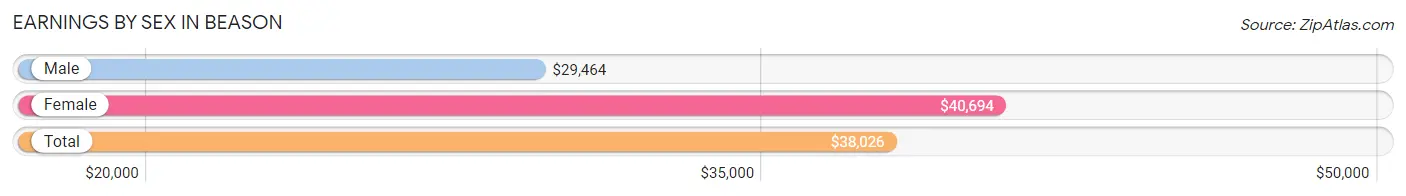
Average Earnings in Beason are $38,026, $29,464 for men and $40,694 for women, a difference of 27.6%.
| Sex | Number | Average Earnings |
| Male | 79 (68.1%) | $29,464 |
| Female | 37 (31.9%) | $40,694 |
| Total | 116 (100.0%) | $38,026 |
Earnings by Sex by Income Bracket in Beason
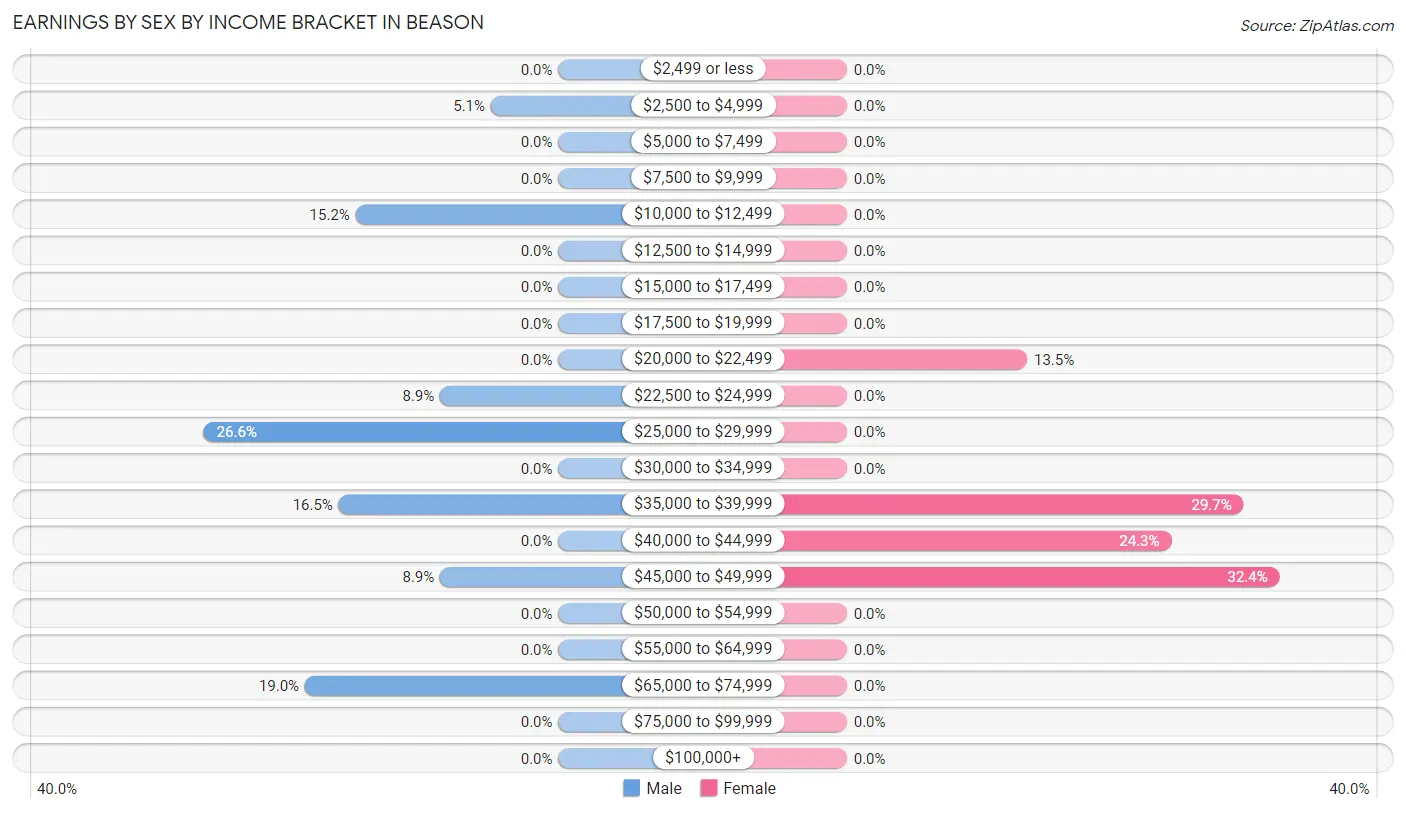
The most common earnings brackets in Beason are $25,000 to $29,999 for men (21 | 26.6%) and $45,000 to $49,999 for women (12 | 32.4%).
| Income | Male | Female |
| $2,499 or less | 0 (0.0%) | 0 (0.0%) |
| $2,500 to $4,999 | 4 (5.1%) | 0 (0.0%) |
| $5,000 to $7,499 | 0 (0.0%) | 0 (0.0%) |
| $7,500 to $9,999 | 0 (0.0%) | 0 (0.0%) |
| $10,000 to $12,499 | 12 (15.2%) | 0 (0.0%) |
| $12,500 to $14,999 | 0 (0.0%) | 0 (0.0%) |
| $15,000 to $17,499 | 0 (0.0%) | 0 (0.0%) |
| $17,500 to $19,999 | 0 (0.0%) | 0 (0.0%) |
| $20,000 to $22,499 | 0 (0.0%) | 5 (13.5%) |
| $22,500 to $24,999 | 7 (8.9%) | 0 (0.0%) |
| $25,000 to $29,999 | 21 (26.6%) | 0 (0.0%) |
| $30,000 to $34,999 | 0 (0.0%) | 0 (0.0%) |
| $35,000 to $39,999 | 13 (16.5%) | 11 (29.7%) |
| $40,000 to $44,999 | 0 (0.0%) | 9 (24.3%) |
| $45,000 to $49,999 | 7 (8.9%) | 12 (32.4%) |
| $50,000 to $54,999 | 0 (0.0%) | 0 (0.0%) |
| $55,000 to $64,999 | 0 (0.0%) | 0 (0.0%) |
| $65,000 to $74,999 | 15 (19.0%) | 0 (0.0%) |
| $75,000 to $99,999 | 0 (0.0%) | 0 (0.0%) |
| $100,000+ | 0 (0.0%) | 0 (0.0%) |
| Total | 79 (100.0%) | 37 (100.0%) |
Earnings by Sex by Educational Attainment in Beason
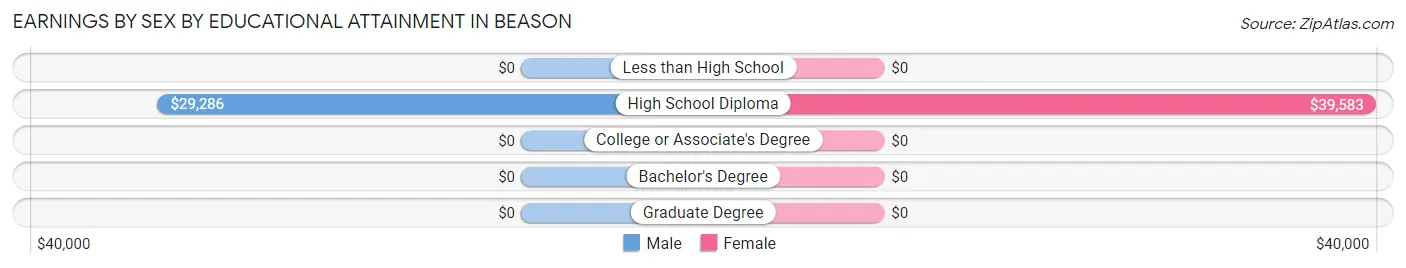
Average earnings in Beason are $37,788 for men and $40,694 for women, a difference of 7.1%. Men with an educational attainment of high school diploma enjoy the highest average annual earnings of $29,286, while those with high school diploma education earn the least with $29,286. Women with an educational attainment of high school diploma earn the most with the average annual earnings of $39,583, while those with high school diploma education have the smallest earnings of $39,583.
| Educational Attainment | Male Income | Female Income |
| Less than High School | - | - |
| High School Diploma | $29,286 | $39,583 |
| College or Associate's Degree | - | - |
| Bachelor's Degree | - | - |
| Graduate Degree | - | - |
| Total | $37,788 | $40,694 |
Family Income in Beason
Family Income Brackets in Beason
According to the Beason family income data, there are 31 families falling into the $50,000 to $74,999 income range, which is the most common income bracket and makes up 55.4% of all families.
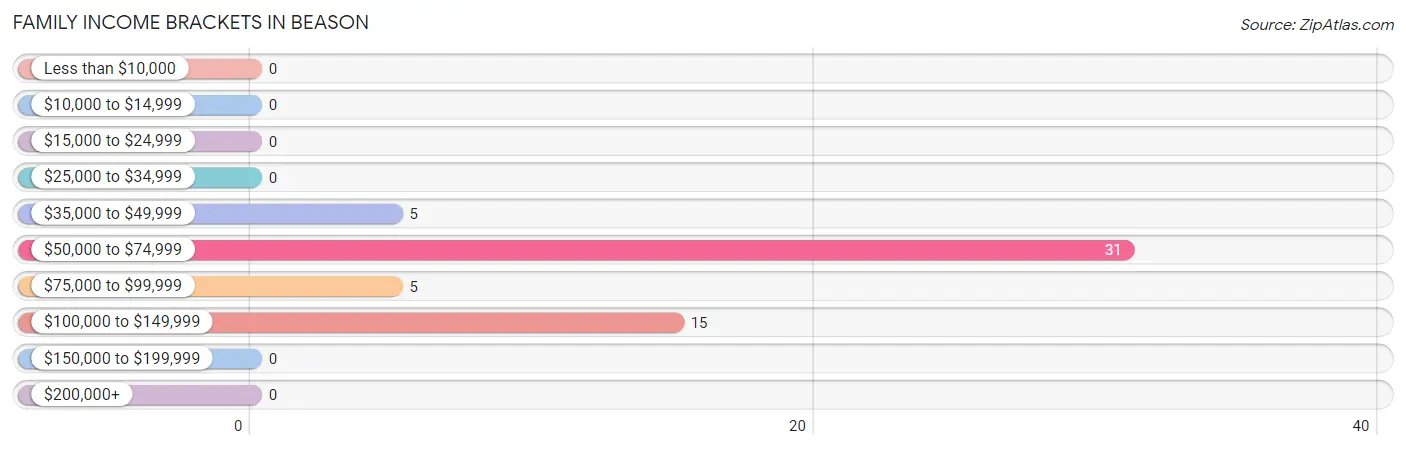
| Income Bracket | # Families | % Families |
| Less than $10,000 | 0 | 0.0% |
| $10,000 to $14,999 | 0 | 0.0% |
| $15,000 to $24,999 | 0 | 0.0% |
| $25,000 to $34,999 | 0 | 0.0% |
| $35,000 to $49,999 | 5 | 8.9% |
| $50,000 to $74,999 | 31 | 55.4% |
| $75,000 to $99,999 | 5 | 8.9% |
| $100,000 to $149,999 | 15 | 26.8% |
| $150,000 to $199,999 | 0 | 0.0% |
| $200,000+ | 0 | 0.0% |
Family Income by Famaliy Size in Beason
2-person families (36 | 64.3%) account for the highest median family income in Beason with $60,000 per family, while 2-person families (36 | 64.3%) have the highest median income of $30,000 per family member.
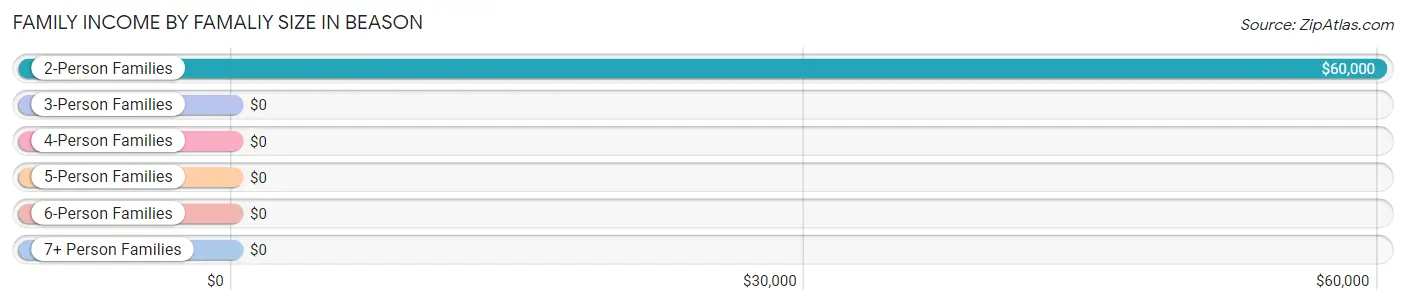
| Income Bracket | # Families | Median Income |
| 2-Person Families | 36 (64.3%) | $60,000 |
| 3-Person Families | 20 (35.7%) | $0 |
| 4-Person Families | 0 (0.0%) | $0 |
| 5-Person Families | 0 (0.0%) | $0 |
| 6-Person Families | 0 (0.0%) | $0 |
| 7+ Person Families | 0 (0.0%) | $0 |
| Total | 56 (100.0%) | $66,786 |
Family Income by Number of Earners in Beason
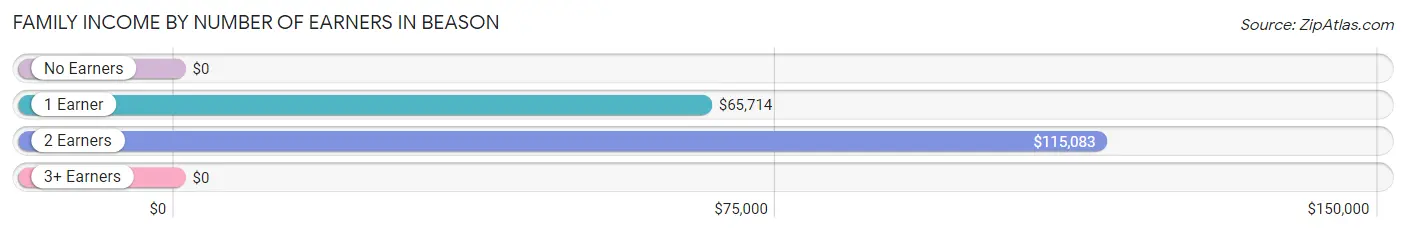
| Number of Earners | # Families | Median Income |
| No Earners | 0 (0.0%) | $0 |
| 1 Earner | 22 (39.3%) | $65,714 |
| 2 Earners | 29 (51.8%) | $115,083 |
| 3+ Earners | 5 (8.9%) | $0 |
| Total | 56 (100.0%) | $66,786 |
Household Income in Beason
Household Income Brackets in Beason
With 35 households falling in the category, the $50,000 to $74,999 income range is the most frequent in Beason, accounting for 40.2% of all households.
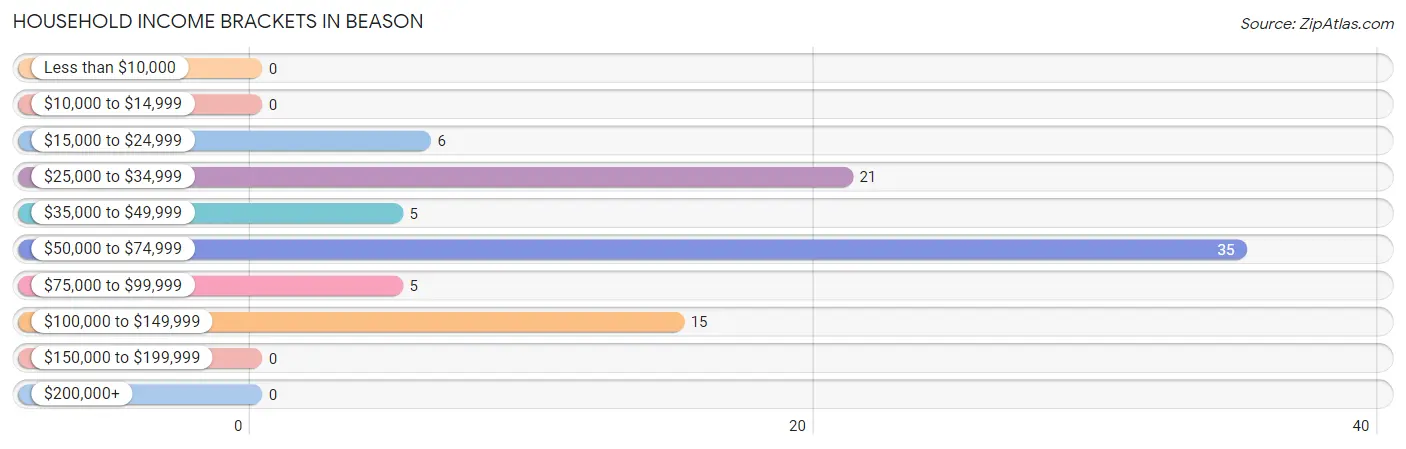
| Income Bracket | # Households | % Households |
| Less than $10,000 | 0 | 0.0% |
| $10,000 to $14,999 | 0 | 0.0% |
| $15,000 to $24,999 | 6 | 6.9% |
| $25,000 to $34,999 | 21 | 24.1% |
| $35,000 to $49,999 | 5 | 5.7% |
| $50,000 to $74,999 | 35 | 40.2% |
| $75,000 to $99,999 | 5 | 5.7% |
| $100,000 to $149,999 | 15 | 17.2% |
| $150,000 to $199,999 | 0 | 0.0% |
| $200,000+ | 0 | 0.0% |
Household Income by Householder Age in Beason
The median household income in Beason is $52,981, with the highest median household income of $71,042 found in the 45 to 64 years age bracket for the primary householder. A total of 47 households (54.0%) fall into this category.
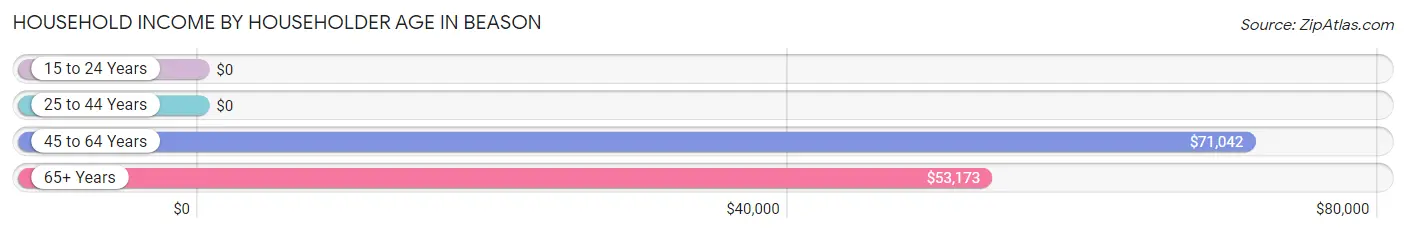
| Income Bracket | # Households | Median Income |
| 15 to 24 Years | 0 (0.0%) | $0 |
| 25 to 44 Years | 21 (24.1%) | $0 |
| 45 to 64 Years | 47 (54.0%) | $71,042 |
| 65+ Years | 19 (21.8%) | $53,173 |
| Total | 87 (100.0%) | $52,981 |
Poverty in Beason
Income Below Poverty by Sex and Age in Beason
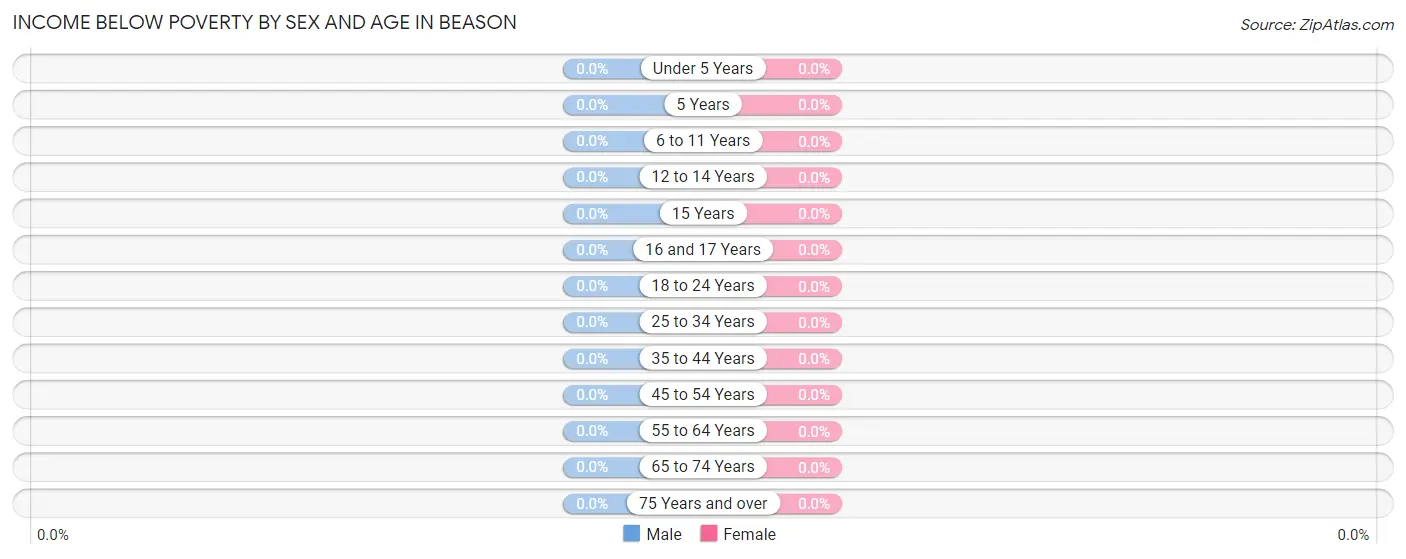
| Age Bracket | Male | Female |
| Under 5 Years | 0 (0.0%) | 0 (0.0%) |
| 5 Years | 0 (0.0%) | 0 (0.0%) |
| 6 to 11 Years | 0 (0.0%) | 0 (0.0%) |
| 12 to 14 Years | 0 (0.0%) | 0 (0.0%) |
| 15 Years | 0 (0.0%) | 0 (0.0%) |
| 16 and 17 Years | 0 (0.0%) | 0 (0.0%) |
| 18 to 24 Years | 0 (0.0%) | 0 (0.0%) |
| 25 to 34 Years | 0 (0.0%) | 0 (0.0%) |
| 35 to 44 Years | 0 (0.0%) | 0 (0.0%) |
| 45 to 54 Years | 0 (0.0%) | 0 (0.0%) |
| 55 to 64 Years | 0 (0.0%) | 0 (0.0%) |
| 65 to 74 Years | 0 (0.0%) | 0 (0.0%) |
| 75 Years and over | 0 (0.0%) | 0 (0.0%) |
| Total | 0 (0.0%) | 0 (0.0%) |
Income Above Poverty by Sex and Age in Beason
According to the poverty statistics in Beason, males aged 16 and 17 years and females aged under 5 years are the age groups that are most secure financially, with 100.0% of males and 100.0% of females in these age groups living above the poverty line.
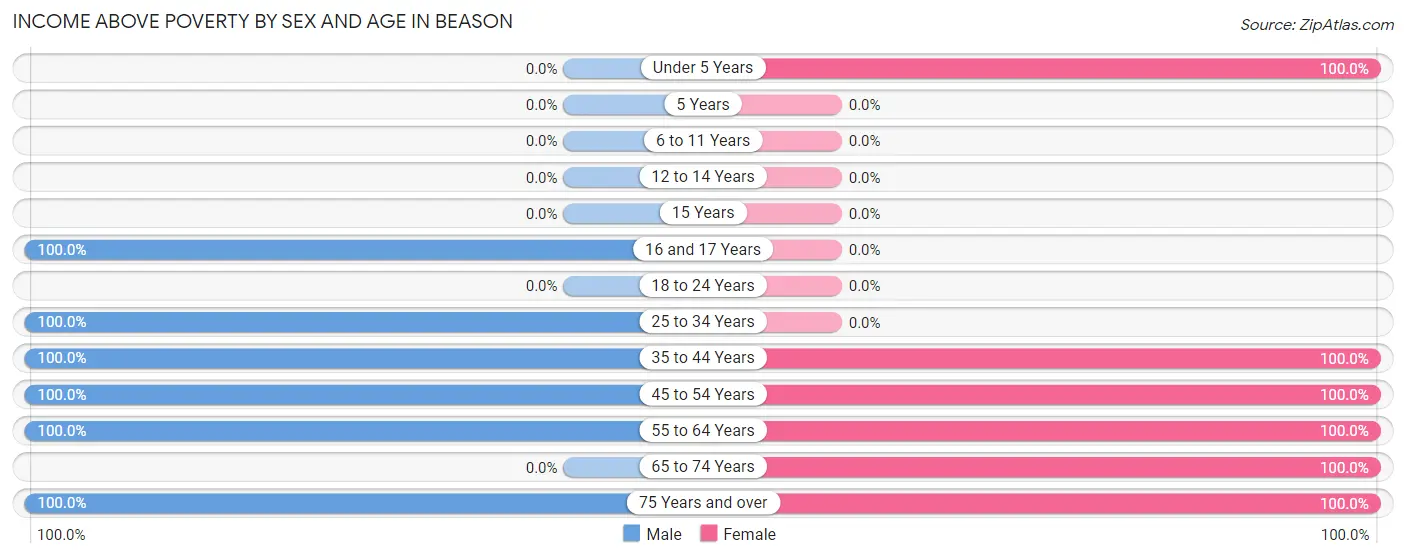
| Age Bracket | Male | Female |
| Under 5 Years | 0 (0.0%) | 9 (100.0%) |
| 5 Years | 0 (0.0%) | 0 (0.0%) |
| 6 to 11 Years | 0 (0.0%) | 0 (0.0%) |
| 12 to 14 Years | 0 (0.0%) | 0 (0.0%) |
| 15 Years | 0 (0.0%) | 0 (0.0%) |
| 16 and 17 Years | 12 (100.0%) | 0 (0.0%) |
| 18 to 24 Years | 0 (0.0%) | 0 (0.0%) |
| 25 to 34 Years | 32 (100.0%) | 0 (0.0%) |
| 35 to 44 Years | 6 (100.0%) | 12 (100.0%) |
| 45 to 54 Years | 15 (100.0%) | 20 (100.0%) |
| 55 to 64 Years | 21 (100.0%) | 11 (100.0%) |
| 65 to 74 Years | 0 (0.0%) | 9 (100.0%) |
| 75 Years and over | 4 (100.0%) | 6 (100.0%) |
| Total | 90 (100.0%) | 67 (100.0%) |
Income Below Poverty Among Married-Couple Families in Beason
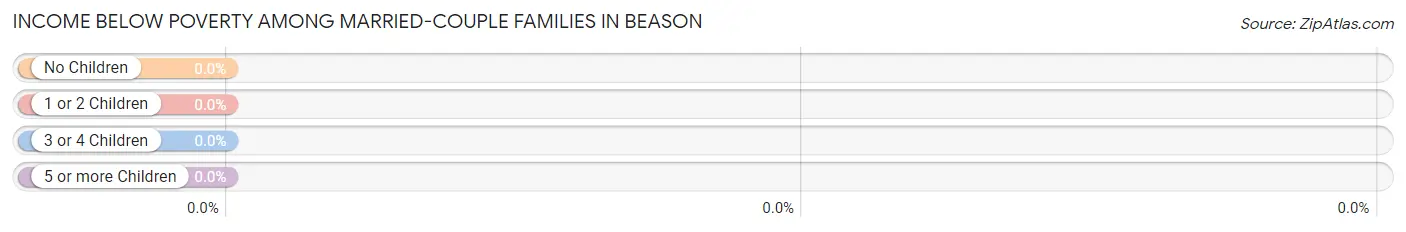
| Children | Above Poverty | Below Poverty |
| No Children | 23 (100.0%) | 0 (0.0%) |
| 1 or 2 Children | 15 (100.0%) | 0 (0.0%) |
| 3 or 4 Children | 0 (0.0%) | 0 (0.0%) |
| 5 or more Children | 0 (0.0%) | 0 (0.0%) |
| Total | 38 (100.0%) | 0 (0.0%) |
Income Below Poverty Among Single-Parent Households in Beason
| Children | Single Father | Single Mother |
| No Children | 0 (0.0%) | 0 (0.0%) |
| 1 or 2 Children | 0 (0.0%) | 0 (0.0%) |
| 3 or 4 Children | 0 (0.0%) | 0 (0.0%) |
| 5 or more Children | 0 (0.0%) | 0 (0.0%) |
| Total | 0 (0.0%) | 0 (0.0%) |
Income Below Poverty Among Married-Couple vs Single-Parent Households in Beason
| Children | Married-Couple Families | Single-Parent Households |
| No Children | 0 (0.0%) | 0 (0.0%) |
| 1 or 2 Children | 0 (0.0%) | 0 (0.0%) |
| 3 or 4 Children | 0 (0.0%) | 0 (0.0%) |
| 5 or more Children | 0 (0.0%) | 0 (0.0%) |
| Total | 0 (0.0%) | 0 (0.0%) |
Race in Beason
The most populous races in Beason are White / Caucasian (153 | 97.5%), and Black / African American (4 | 2.5%).
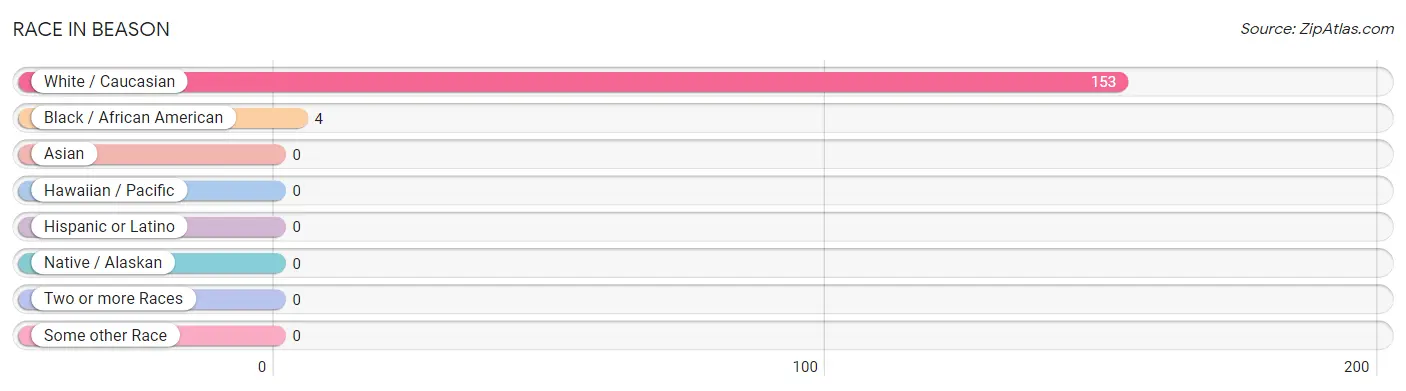
| Race | # Population | % Population |
| Asian | 0 | 0.0% |
| Black / African American | 4 | 2.5% |
| Hawaiian / Pacific | 0 | 0.0% |
| Hispanic or Latino | 0 | 0.0% |
| Native / Alaskan | 0 | 0.0% |
| White / Caucasian | 153 | 97.5% |
| Two or more Races | 0 | 0.0% |
| Some other Race | 0 | 0.0% |
| Total | 157 | 100.0% |
Ancestry in Beason
The most populous ancestries reported in Beason are Irish (48 | 30.6%), German (35 | 22.3%), Eastern European (6 | 3.8%), and English (5 | 3.2%), together accounting for 59.9% of all Beason residents.
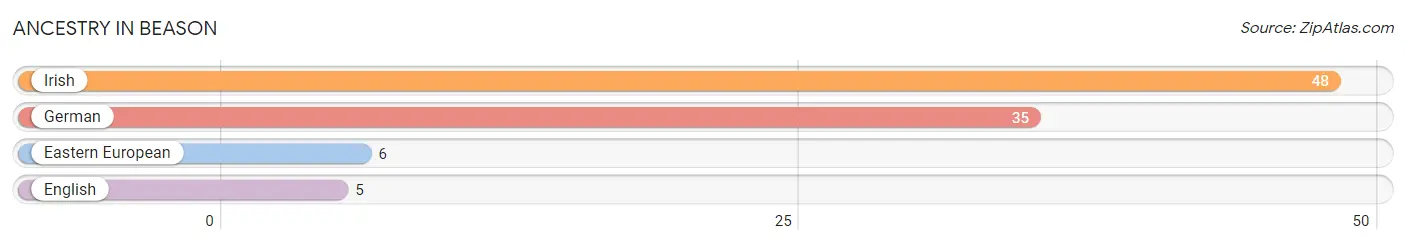
| Ancestry | # Population | % Population |
| Eastern European | 6 | 3.8% |
| English | 5 | 3.2% |
| German | 35 | 22.3% |
| Irish | 48 | 30.6% | View All 4 Rows |
Immigrants in Beason

| Immigration Origin | # Population | % Population | View All 0 Rows |
Sex and Age in Beason
Sex and Age in Beason
The most populous age groups in Beason are 25 to 29 Years (28 | 31.1%) for men and 50 to 54 Years (20 | 29.8%) for women.
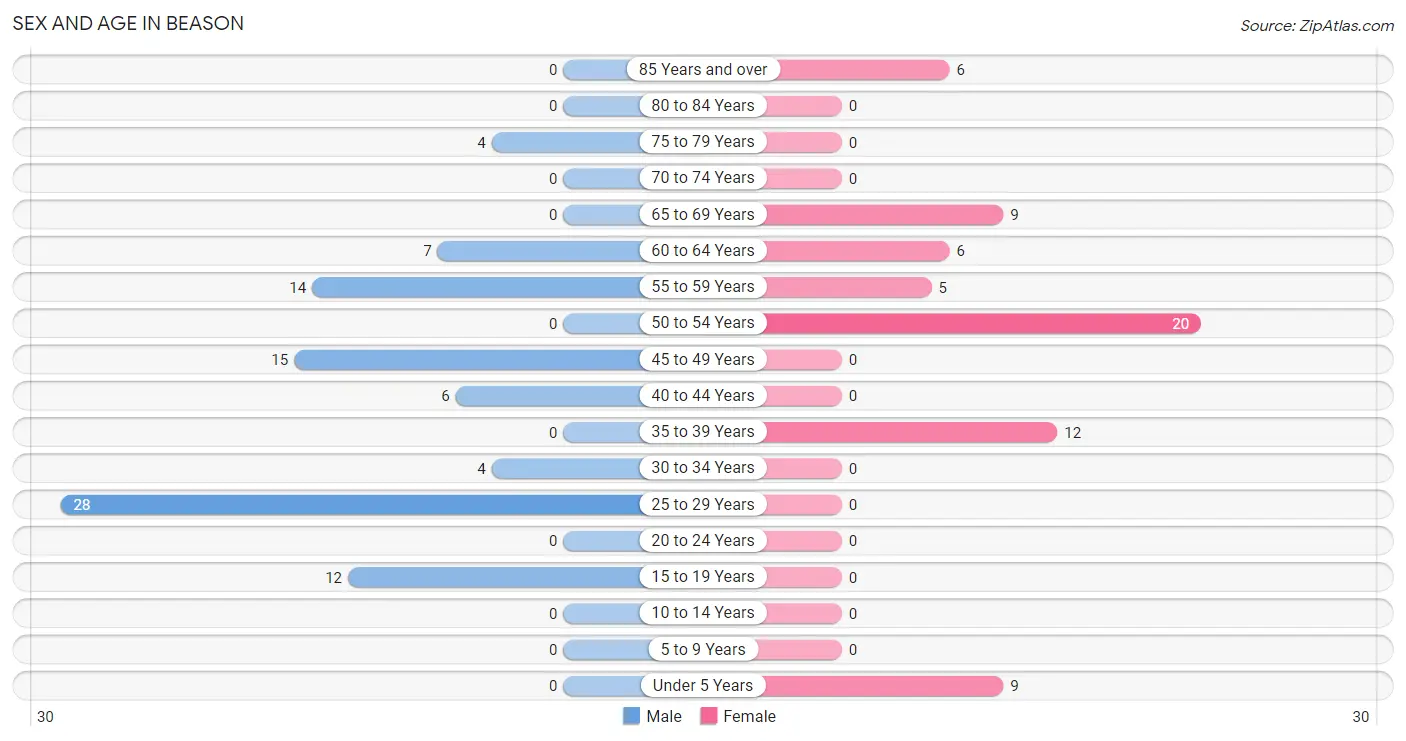
| Age Bracket | Male | Female |
| Under 5 Years | 0 (0.0%) | 9 (13.4%) |
| 5 to 9 Years | 0 (0.0%) | 0 (0.0%) |
| 10 to 14 Years | 0 (0.0%) | 0 (0.0%) |
| 15 to 19 Years | 12 (13.3%) | 0 (0.0%) |
| 20 to 24 Years | 0 (0.0%) | 0 (0.0%) |
| 25 to 29 Years | 28 (31.1%) | 0 (0.0%) |
| 30 to 34 Years | 4 (4.4%) | 0 (0.0%) |
| 35 to 39 Years | 0 (0.0%) | 12 (17.9%) |
| 40 to 44 Years | 6 (6.7%) | 0 (0.0%) |
| 45 to 49 Years | 15 (16.7%) | 0 (0.0%) |
| 50 to 54 Years | 0 (0.0%) | 20 (29.8%) |
| 55 to 59 Years | 14 (15.6%) | 5 (7.5%) |
| 60 to 64 Years | 7 (7.8%) | 6 (9.0%) |
| 65 to 69 Years | 0 (0.0%) | 9 (13.4%) |
| 70 to 74 Years | 0 (0.0%) | 0 (0.0%) |
| 75 to 79 Years | 4 (4.4%) | 0 (0.0%) |
| 80 to 84 Years | 0 (0.0%) | 0 (0.0%) |
| 85 Years and over | 0 (0.0%) | 6 (9.0%) |
| Total | 90 (100.0%) | 67 (100.0%) |
Families and Households in Beason
Median Family Size in Beason
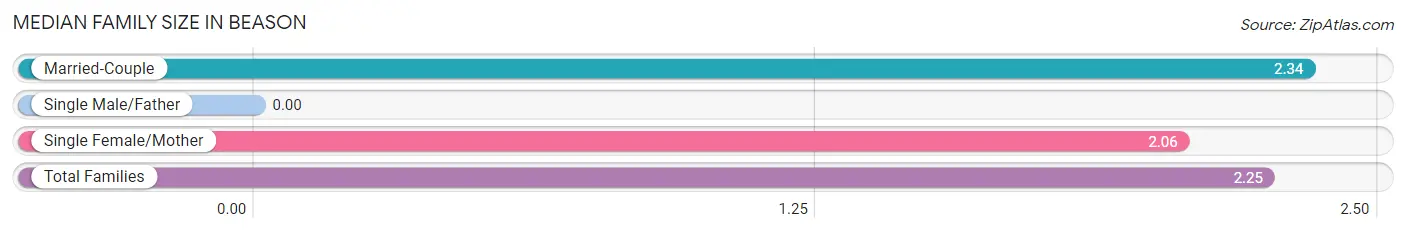
| Family Type | # Families | Family Size |
| Married-Couple | 38 (67.9%) | 2.34 |
| Single Male/Father | 0 (0.0%) | - |
| Single Female/Mother | 18 (32.1%) | 2.06 |
| Total Families | 56 (100.0%) | 2.25 |
Median Household Size in Beason
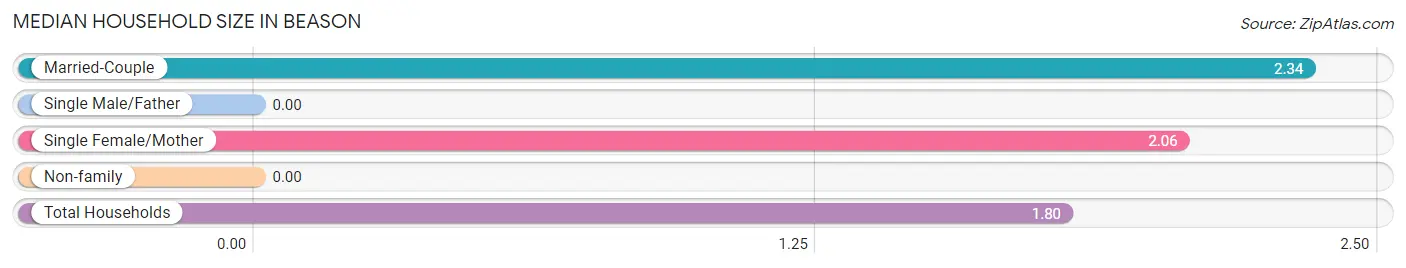
| Household Type | # Households | Household Size |
| Married-Couple | 38 (43.7%) | 2.34 |
| Single Male/Father | 0 (0.0%) | - |
| Single Female/Mother | 18 (20.7%) | 2.06 |
| Non-family | 31 (35.6%) | - |
| Total Households | 87 (100.0%) | 1.80 |
Household Size by Marriage Status in Beason
Out of a total of 87 households in Beason, 56 (64.4%) are family households, while 31 (35.6%) are nonfamily households. The most numerous type of family households are 2-person households, comprising 36, and the most common type of nonfamily households are 1-person households, comprising 31.
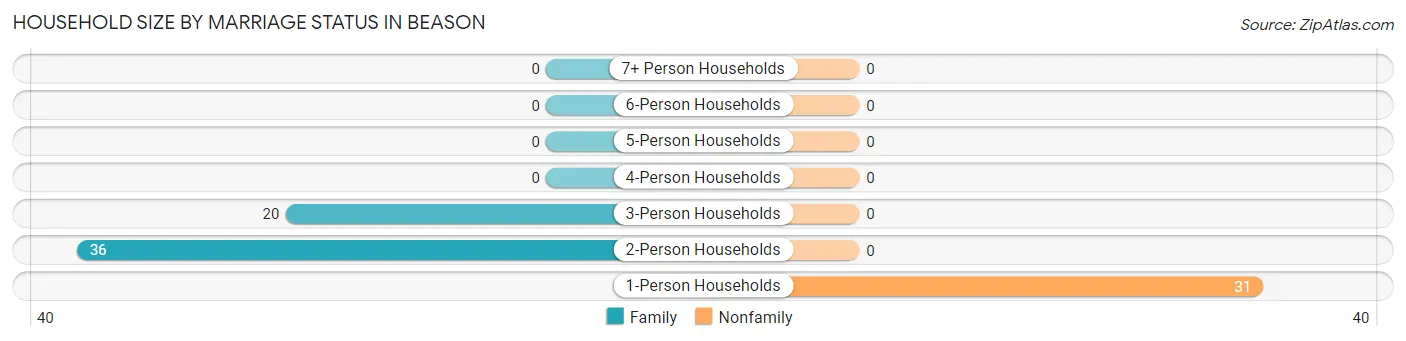
| Household Size | Family Households | Nonfamily Households |
| 1-Person Households | - | 31 (35.6%) |
| 2-Person Households | 36 (41.4%) | 0 (0.0%) |
| 3-Person Households | 20 (23.0%) | 0 (0.0%) |
| 4-Person Households | 0 (0.0%) | 0 (0.0%) |
| 5-Person Households | 0 (0.0%) | 0 (0.0%) |
| 6-Person Households | 0 (0.0%) | 0 (0.0%) |
| 7+ Person Households | 0 (0.0%) | 0 (0.0%) |
| Total | 56 (64.4%) | 31 (35.6%) |
Female Fertility in Beason
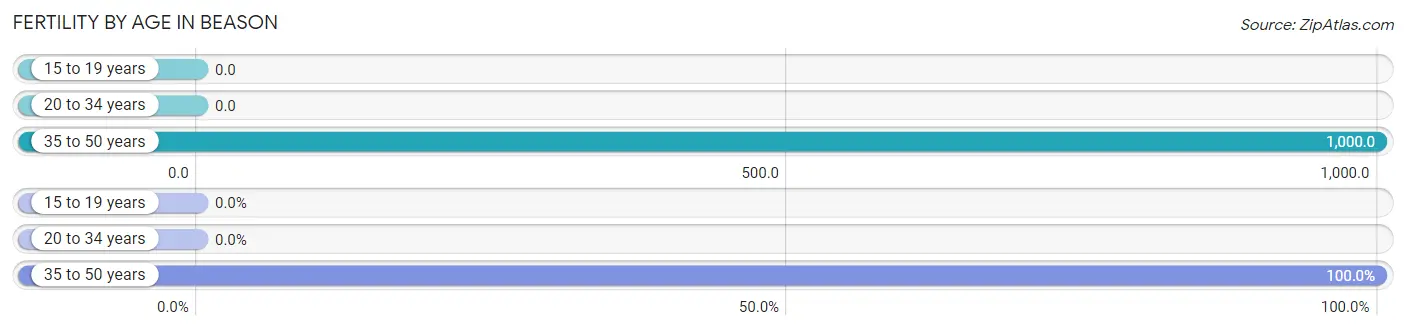
Fertility by Age in Beason
Average fertility rate in Beason is 1,000.0 births per 1,000 women. Women in the age bracket of 35 to 50 years have the highest fertility rate with 1,000.0 births per 1,000 women. Women in the age bracket of 35 to 50 years acount for 100.0% of all women with births.
| Age Bracket | Women with Births | Births / 1,000 Women |
| 15 to 19 years | 0 (0.0%) | 0.0 |
| 20 to 34 years | 0 (0.0%) | 0.0 |
| 35 to 50 years | 12 (100.0%) | 1,000.0 |
| Total | 12 (100.0%) | 1,000.0 |
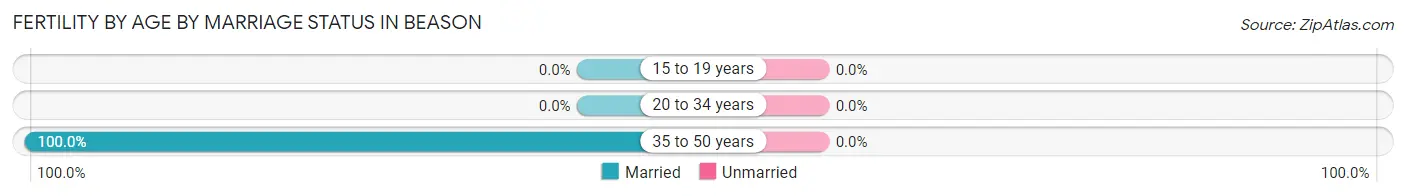
Fertility by Age by Marriage Status in Beason
| Age Bracket | Married | Unmarried |
| 15 to 19 years | 0 (0.0%) | 0 (0.0%) |
| 20 to 34 years | 0 (0.0%) | 0 (0.0%) |
| 35 to 50 years | 12 (100.0%) | 0 (0.0%) |
| Total | 12 (100.0%) | 0 (0.0%) |
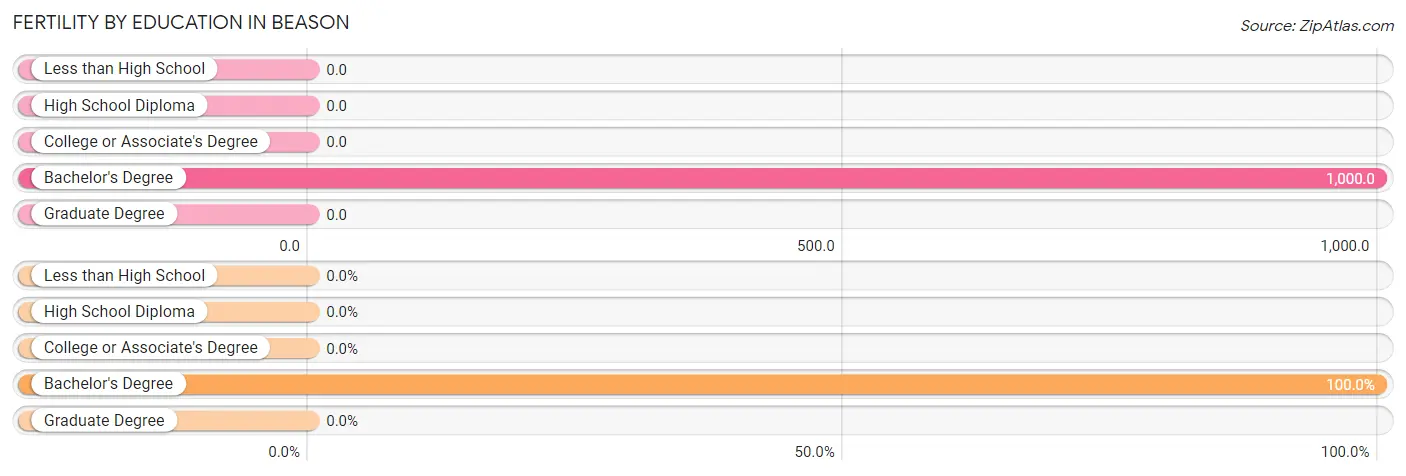
Fertility by Education in Beason
| Educational Attainment | Women with Births | Births / 1,000 Women |
| Less than High School | 0 (0.0%) | 0.0 |
| High School Diploma | 0 (0.0%) | 0.0 |
| College or Associate's Degree | 0 (0.0%) | 0.0 |
| Bachelor's Degree | 12 (100.0%) | 1,000.0 |
| Graduate Degree | 0 (0.0%) | 0.0 |
| Total | 12 (100.0%) | 1,000.0 |
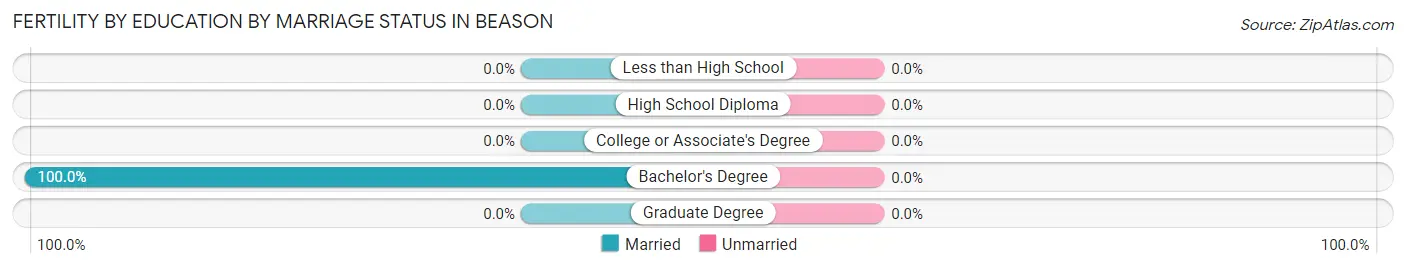
Fertility by Education by Marriage Status in Beason
| Educational Attainment | Married | Unmarried |
| Less than High School | 0 (0.0%) | 0 (0.0%) |
| High School Diploma | 0 (0.0%) | 0 (0.0%) |
| College or Associate's Degree | 0 (0.0%) | 0 (0.0%) |
| Bachelor's Degree | 12 (100.0%) | 0 (0.0%) |
| Graduate Degree | 0 (0.0%) | 0 (0.0%) |
| Total | 12 (100.0%) | 0 (0.0%) |
Employment Characteristics in Beason
Employment by Class of Employer in Beason
Among the 112 employed individuals in Beason, private company employees (91 | 81.2%), and local government employees (21 | 18.8%) make up the most common classes of employment.
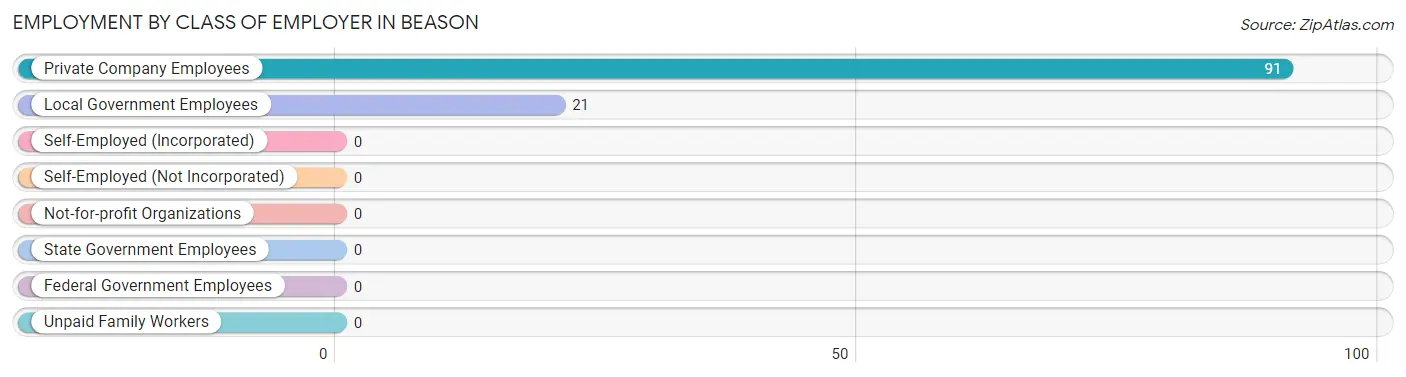
| Employer Class | # Employees | % Employees |
| Private Company Employees | 91 | 81.2% |
| Self-Employed (Incorporated) | 0 | 0.0% |
| Self-Employed (Not Incorporated) | 0 | 0.0% |
| Not-for-profit Organizations | 0 | 0.0% |
| Local Government Employees | 21 | 18.8% |
| State Government Employees | 0 | 0.0% |
| Federal Government Employees | 0 | 0.0% |
| Unpaid Family Workers | 0 | 0.0% |
| Total | 112 | 100.0% |
Employment Status by Age in Beason
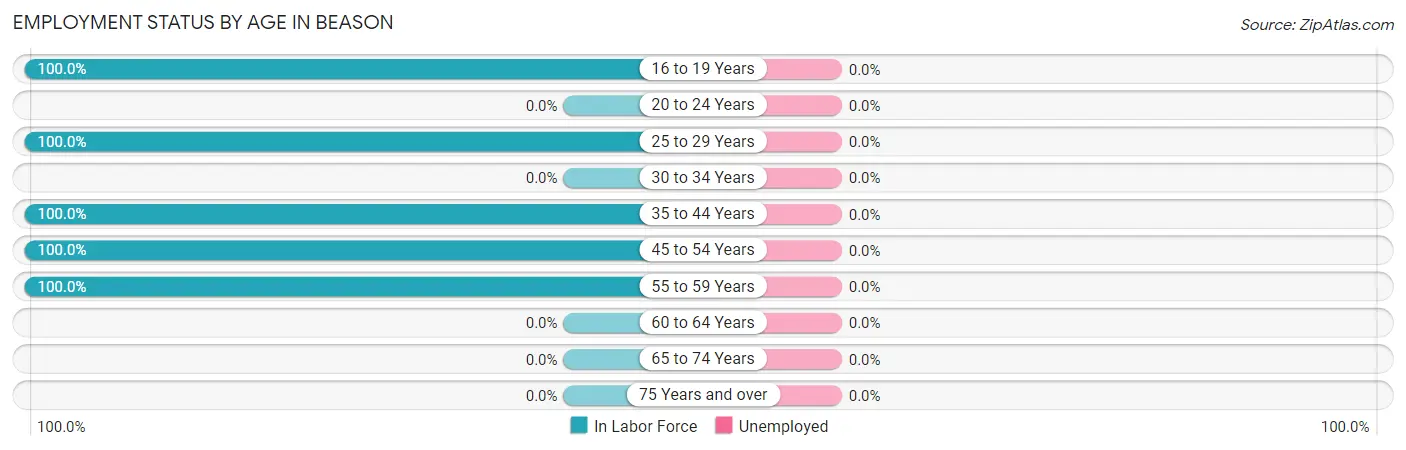
| Age Bracket | In Labor Force | Unemployed |
| 16 to 19 Years | 12 (100.0%) | 0 (0.0%) |
| 20 to 24 Years | 0 (0.0%) | 0 (0.0%) |
| 25 to 29 Years | 28 (100.0%) | 0 (0.0%) |
| 30 to 34 Years | 0 (0.0%) | 0 (0.0%) |
| 35 to 44 Years | 18 (100.0%) | 0 (0.0%) |
| 45 to 54 Years | 35 (100.0%) | 0 (0.0%) |
| 55 to 59 Years | 19 (100.0%) | 0 (0.0%) |
| 60 to 64 Years | 0 (0.0%) | 0 (0.0%) |
| 65 to 74 Years | 0 (0.0%) | 0 (0.0%) |
| 75 Years and over | 0 (0.0%) | 0 (0.0%) |
| Total | 112 (75.7%) | 0 (0.0%) |
Employment Status by Educational Attainment in Beason
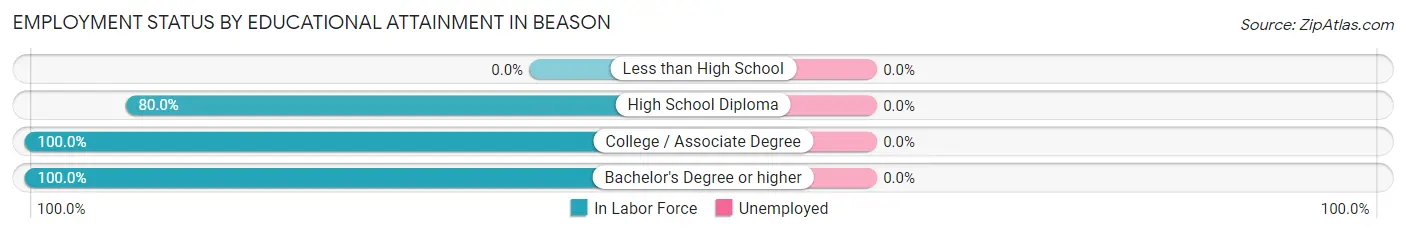
| Educational Attainment | In Labor Force | Unemployed |
| Less than High School | 0 (0.0%) | 0 (0.0%) |
| High School Diploma | 68 (80.0%) | 0 (0.0%) |
| College / Associate Degree | 15 (100.0%) | 0 (0.0%) |
| Bachelor's Degree or higher | 17 (100.0%) | 0 (0.0%) |
| Total | 100 (85.5%) | 0 (0.0%) |
Employment Occupations by Sex in Beason
Management, Business, Science and Arts Occupations
The most common Management, Business, Science and Arts occupations in Beason are Management (15 | 13.4%), Community & Social Service (12 | 10.7%), and Education Instruction & Library (12 | 10.7%).
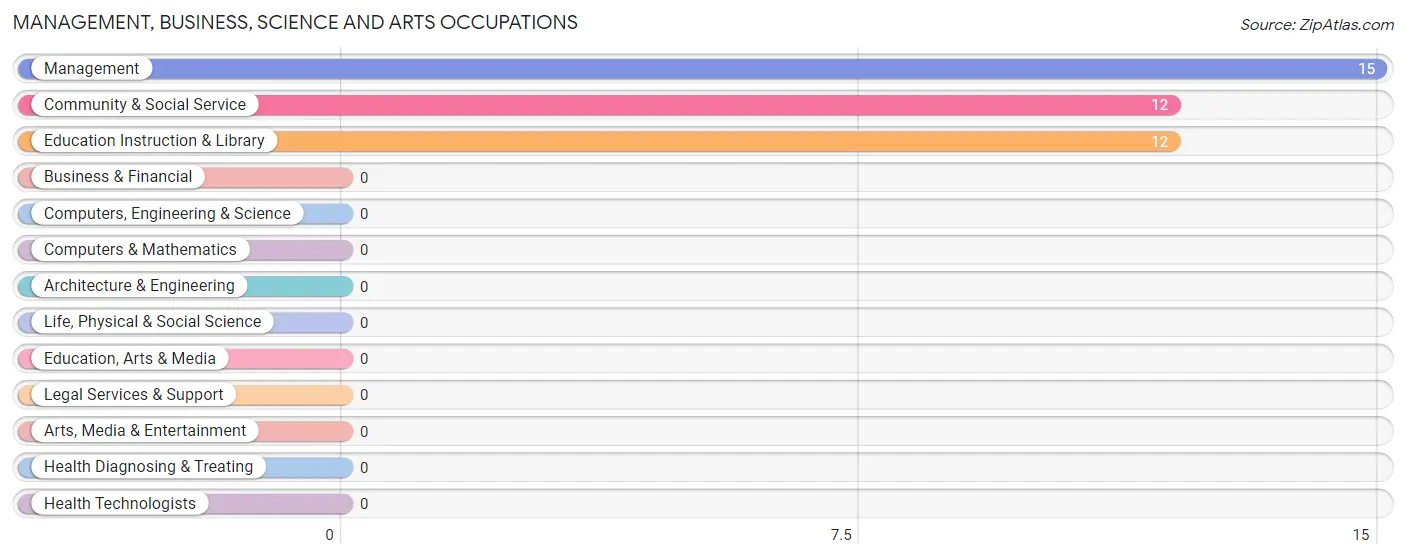
Management, Business, Science and Arts Occupations by Sex
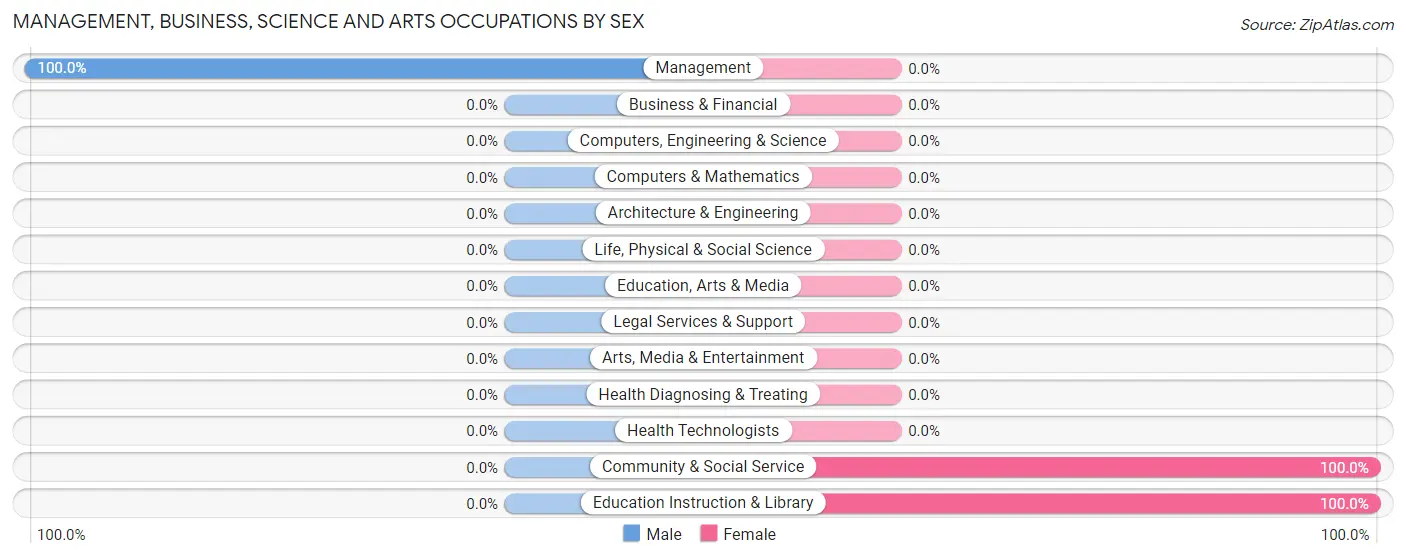
| Occupation | Male | Female |
| Management | 15 (100.0%) | 0 (0.0%) |
| Business & Financial | 0 (0.0%) | 0 (0.0%) |
| Computers, Engineering & Science | 0 (0.0%) | 0 (0.0%) |
| Computers & Mathematics | 0 (0.0%) | 0 (0.0%) |
| Architecture & Engineering | 0 (0.0%) | 0 (0.0%) |
| Life, Physical & Social Science | 0 (0.0%) | 0 (0.0%) |
| Community & Social Service | 0 (0.0%) | 12 (100.0%) |
| Education, Arts & Media | 0 (0.0%) | 0 (0.0%) |
| Legal Services & Support | 0 (0.0%) | 0 (0.0%) |
| Education Instruction & Library | 0 (0.0%) | 12 (100.0%) |
| Arts, Media & Entertainment | 0 (0.0%) | 0 (0.0%) |
| Health Diagnosing & Treating | 0 (0.0%) | 0 (0.0%) |
| Health Technologists | 0 (0.0%) | 0 (0.0%) |
| Total (Category) | 15 (55.6%) | 12 (44.4%) |
| Total (Overall) | 75 (67.0%) | 37 (33.0%) |
Services Occupations
The most common Services occupations in Beason are , and Healthcare Support (5 | 4.5%).
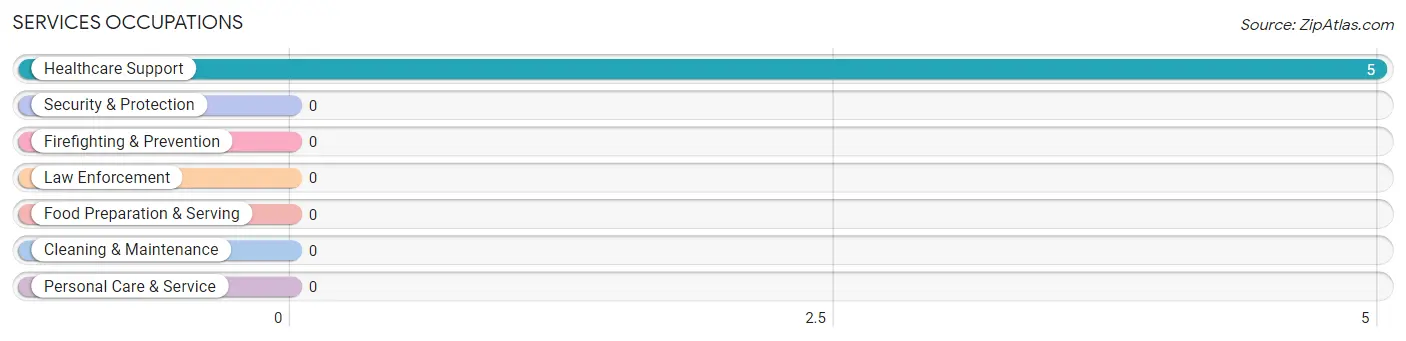
Services Occupations by Sex
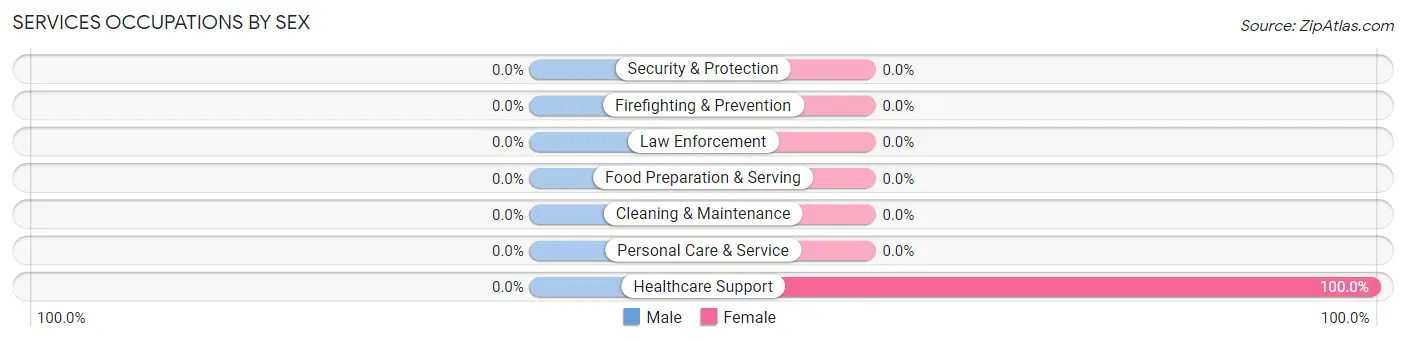
| Occupation | Male | Female |
| Healthcare Support | 0 (0.0%) | 5 (100.0%) |
| Security & Protection | 0 (0.0%) | 0 (0.0%) |
| Firefighting & Prevention | 0 (0.0%) | 0 (0.0%) |
| Law Enforcement | 0 (0.0%) | 0 (0.0%) |
| Food Preparation & Serving | 0 (0.0%) | 0 (0.0%) |
| Cleaning & Maintenance | 0 (0.0%) | 0 (0.0%) |
| Personal Care & Service | 0 (0.0%) | 0 (0.0%) |
| Total (Category) | 0 (0.0%) | 5 (100.0%) |
| Total (Overall) | 75 (67.0%) | 37 (33.0%) |
Sales and Office Occupations
The most common Sales and Office occupations in Beason are , and Office & Administration (6 | 5.4%).
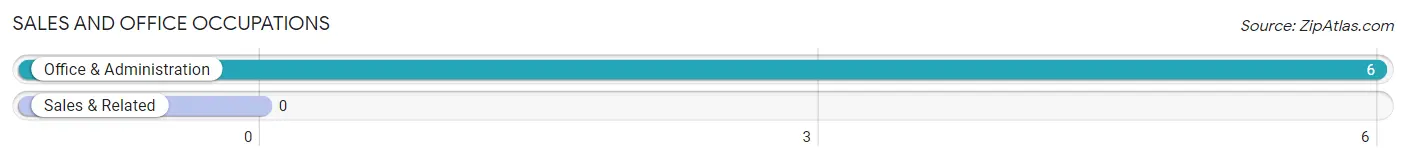
Sales and Office Occupations by Sex
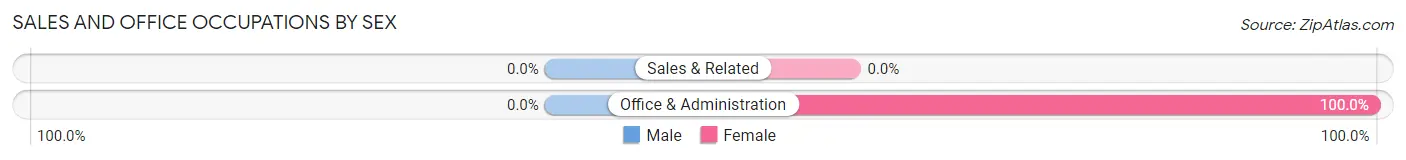
| Occupation | Male | Female |
| Sales & Related | 0 (0.0%) | 0 (0.0%) |
| Office & Administration | 0 (0.0%) | 6 (100.0%) |
| Total (Category) | 0 (0.0%) | 6 (100.0%) |
| Total (Overall) | 75 (67.0%) | 37 (33.0%) |
Natural Resources, Construction and Maintenance Occupations
The most common Natural Resources, Construction and Maintenance occupations in Beason are Farming, Fishing & Forestry (12 | 10.7%), and Installation, Maintenance & Repair (7 | 6.2%).
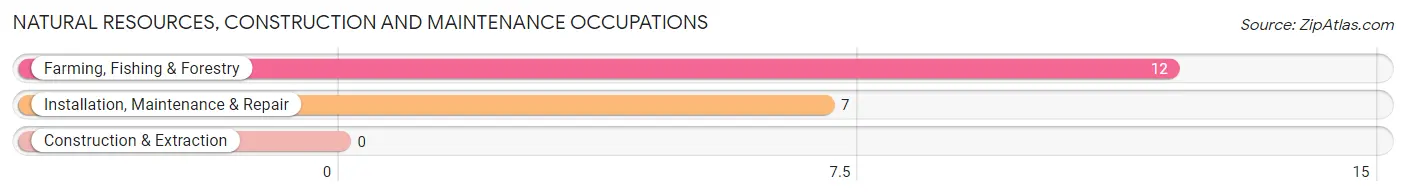
Natural Resources, Construction and Maintenance Occupations by Sex
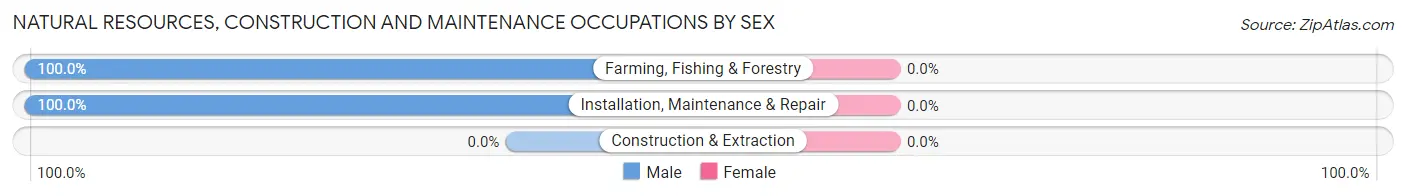
| Occupation | Male | Female |
| Farming, Fishing & Forestry | 12 (100.0%) | 0 (0.0%) |
| Construction & Extraction | 0 (0.0%) | 0 (0.0%) |
| Installation, Maintenance & Repair | 7 (100.0%) | 0 (0.0%) |
| Total (Category) | 19 (100.0%) | 0 (0.0%) |
| Total (Overall) | 75 (67.0%) | 37 (33.0%) |
Production, Transportation and Moving Occupations
The most common Production, Transportation and Moving occupations in Beason are Transportation (36 | 32.1%), Production (12 | 10.7%), and Material Moving (7 | 6.2%).
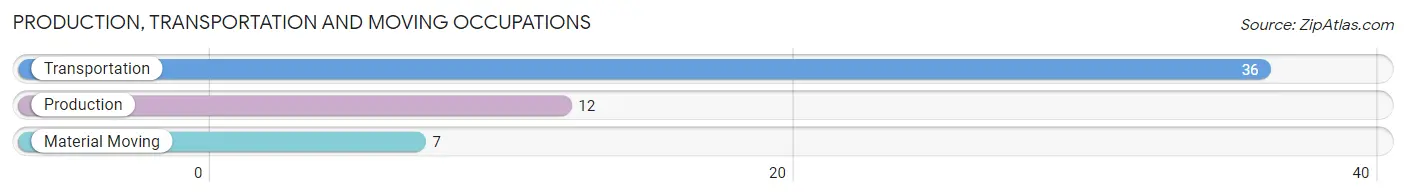
Production, Transportation and Moving Occupations by Sex
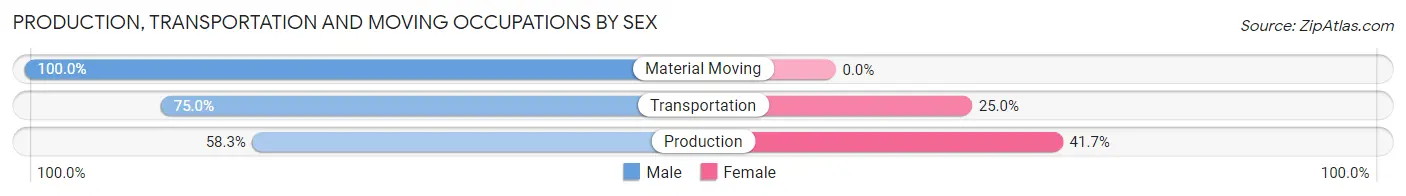
| Occupation | Male | Female |
| Production | 7 (58.3%) | 5 (41.7%) |
| Transportation | 27 (75.0%) | 9 (25.0%) |
| Material Moving | 7 (100.0%) | 0 (0.0%) |
| Total (Category) | 41 (74.6%) | 14 (25.5%) |
| Total (Overall) | 75 (67.0%) | 37 (33.0%) |
Employment Industries by Sex in Beason
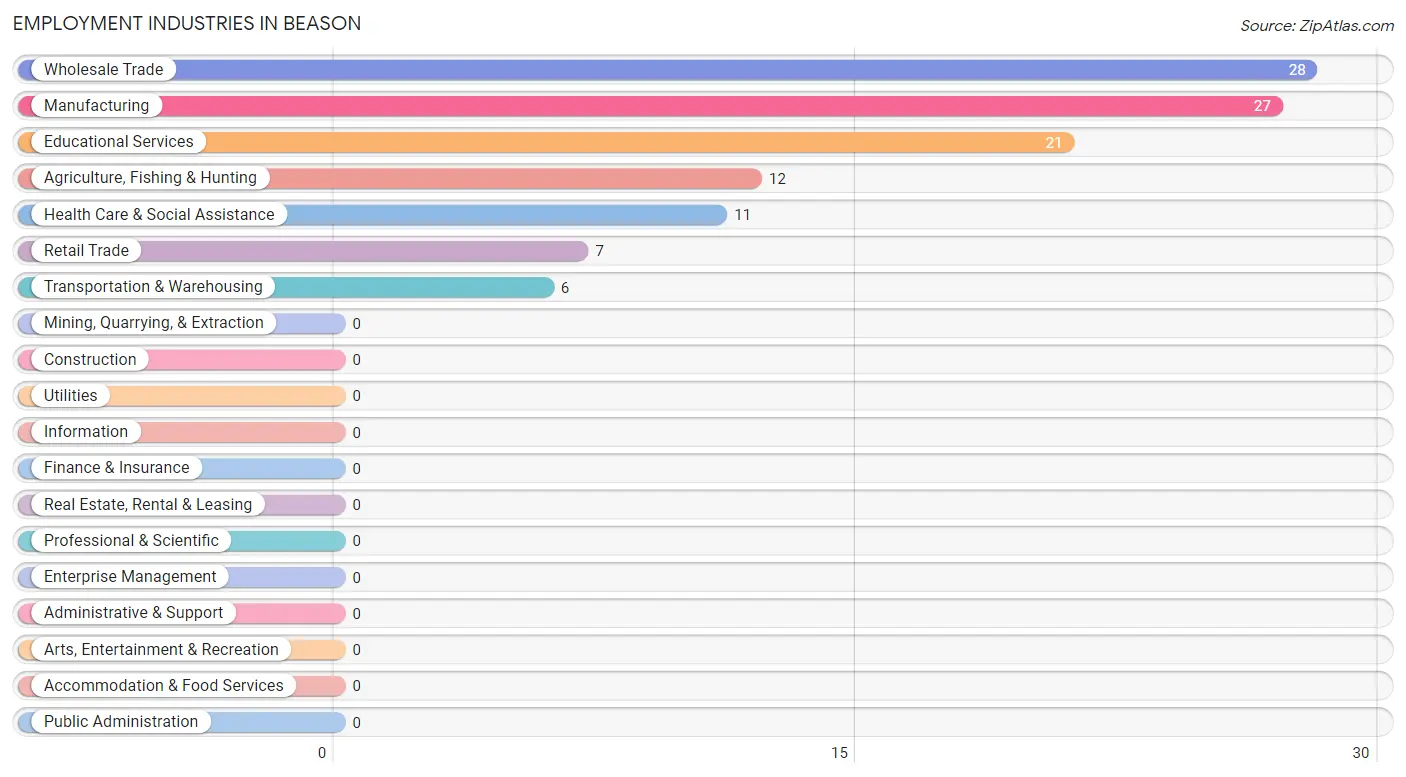
Employment Industries in Beason
The major employment industries in Beason include Wholesale Trade (28 | 25.0%), Manufacturing (27 | 24.1%), Educational Services (21 | 18.8%), Agriculture, Fishing & Hunting (12 | 10.7%), and Health Care & Social Assistance (11 | 9.8%).
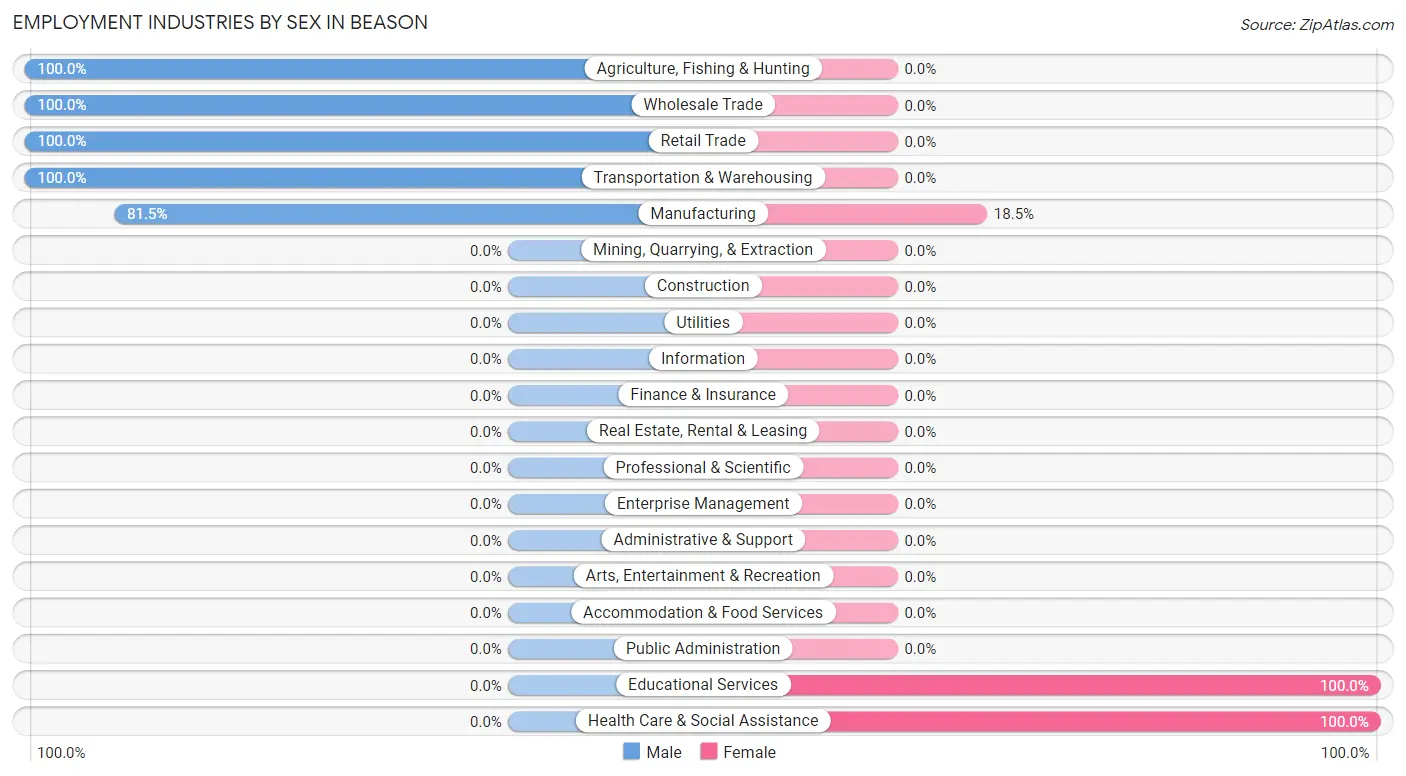
Employment Industries by Sex in Beason
The Beason industries that see more men than women are Agriculture, Fishing & Hunting (100.0%), Wholesale Trade (100.0%), and Retail Trade (100.0%), whereas the industries that tend to have a higher number of women are Educational Services (100.0%), Health Care & Social Assistance (100.0%), and Manufacturing (18.5%).
| Industry | Male | Female |
| Agriculture, Fishing & Hunting | 12 (100.0%) | 0 (0.0%) |
| Mining, Quarrying, & Extraction | 0 (0.0%) | 0 (0.0%) |
| Construction | 0 (0.0%) | 0 (0.0%) |
| Manufacturing | 22 (81.5%) | 5 (18.5%) |
| Wholesale Trade | 28 (100.0%) | 0 (0.0%) |
| Retail Trade | 7 (100.0%) | 0 (0.0%) |
| Transportation & Warehousing | 6 (100.0%) | 0 (0.0%) |
| Utilities | 0 (0.0%) | 0 (0.0%) |
| Information | 0 (0.0%) | 0 (0.0%) |
| Finance & Insurance | 0 (0.0%) | 0 (0.0%) |
| Real Estate, Rental & Leasing | 0 (0.0%) | 0 (0.0%) |
| Professional & Scientific | 0 (0.0%) | 0 (0.0%) |
| Enterprise Management | 0 (0.0%) | 0 (0.0%) |
| Administrative & Support | 0 (0.0%) | 0 (0.0%) |
| Educational Services | 0 (0.0%) | 21 (100.0%) |
| Health Care & Social Assistance | 0 (0.0%) | 11 (100.0%) |
| Arts, Entertainment & Recreation | 0 (0.0%) | 0 (0.0%) |
| Accommodation & Food Services | 0 (0.0%) | 0 (0.0%) |
| Public Administration | 0 (0.0%) | 0 (0.0%) |
| Total | 75 (67.0%) | 37 (33.0%) |
Education in Beason
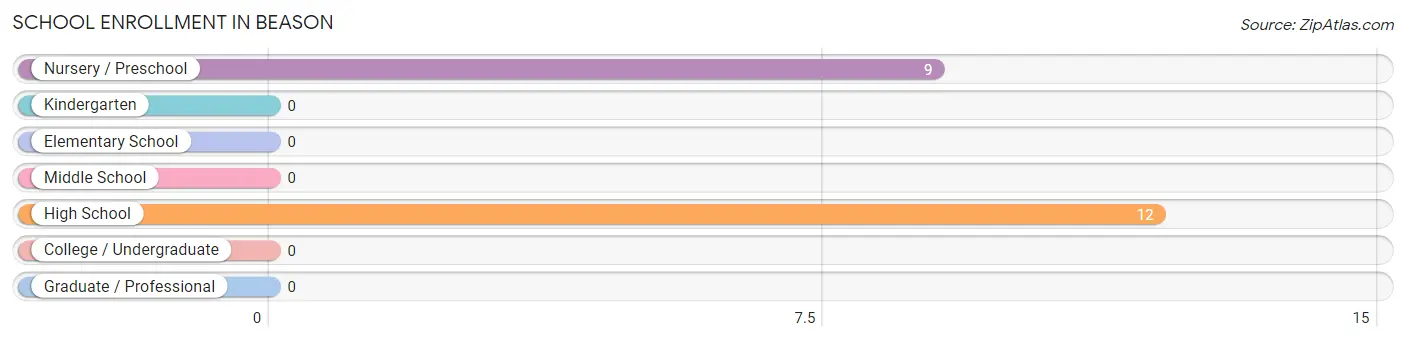
School Enrollment in Beason
The most common levels of schooling among the 21 students in Beason are high school (12 | 57.1%), and nursery / preschool (9 | 42.9%).
| School Level | # Students | % Students |
| Nursery / Preschool | 9 | 42.9% |
| Kindergarten | 0 | 0.0% |
| Elementary School | 0 | 0.0% |
| Middle School | 0 | 0.0% |
| High School | 12 | 57.1% |
| College / Undergraduate | 0 | 0.0% |
| Graduate / Professional | 0 | 0.0% |
| Total | 21 | 100.0% |
School Enrollment by Age by Funding Source in Beason
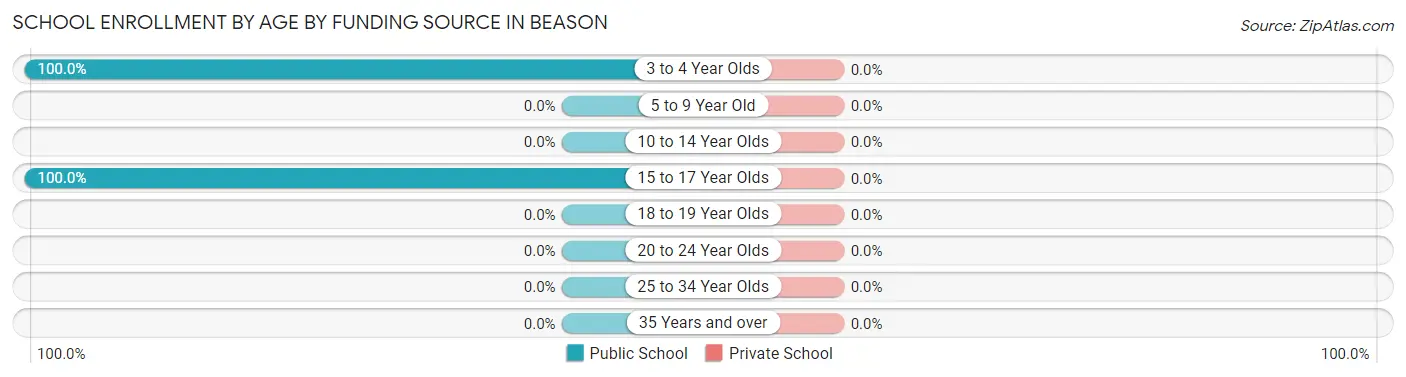
| Age Bracket | Public School | Private School |
| 3 to 4 Year Olds | 9 (100.0%) | 0 (0.0%) |
| 5 to 9 Year Old | 0 (0.0%) | 0 (0.0%) |
| 10 to 14 Year Olds | 0 (0.0%) | 0 (0.0%) |
| 15 to 17 Year Olds | 12 (100.0%) | 0 (0.0%) |
| 18 to 19 Year Olds | 0 (0.0%) | 0 (0.0%) |
| 20 to 24 Year Olds | 0 (0.0%) | 0 (0.0%) |
| 25 to 34 Year Olds | 0 (0.0%) | 0 (0.0%) |
| 35 Years and over | 0 (0.0%) | 0 (0.0%) |
| Total | 21 (100.0%) | 0 (0.0%) |
Educational Attainment by Field of Study in Beason
Education (12 | 70.6%), and physical & health sciences (5 | 29.4%) are the most common fields of study among 17 individuals in Beason who have obtained a bachelor's degree or higher.
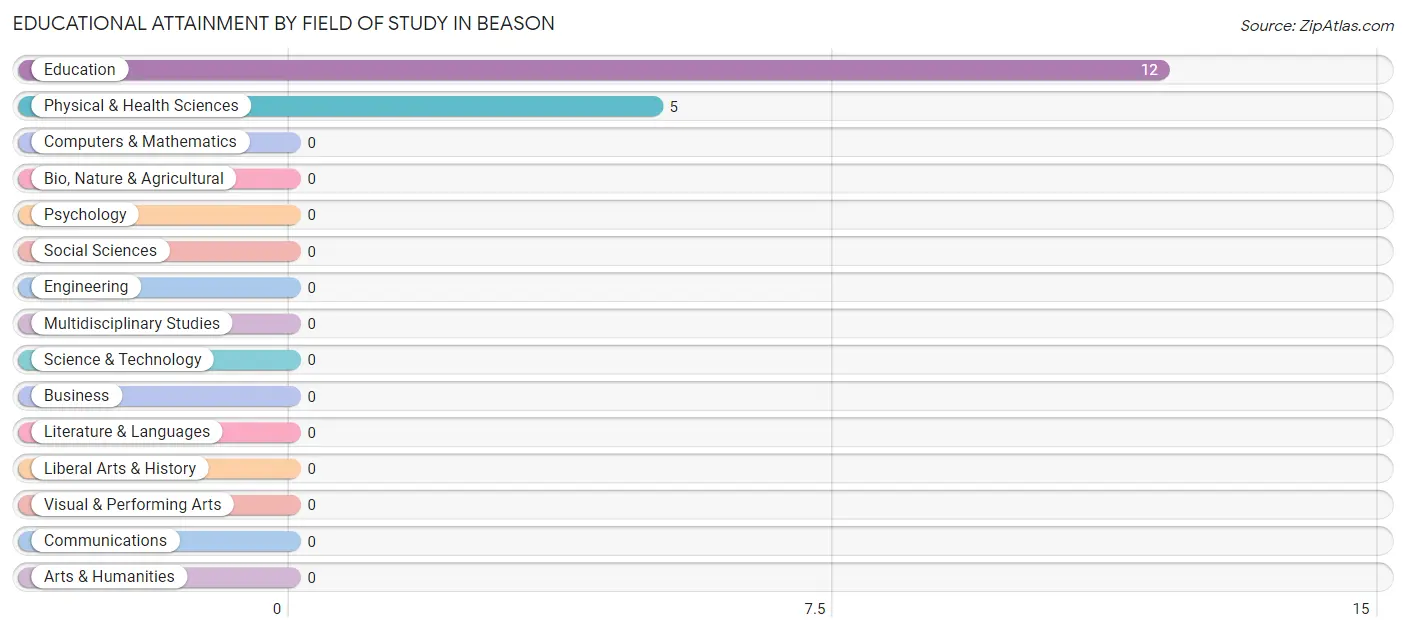
| Field of Study | # Graduates | % Graduates |
| Computers & Mathematics | 0 | 0.0% |
| Bio, Nature & Agricultural | 0 | 0.0% |
| Physical & Health Sciences | 5 | 29.4% |
| Psychology | 0 | 0.0% |
| Social Sciences | 0 | 0.0% |
| Engineering | 0 | 0.0% |
| Multidisciplinary Studies | 0 | 0.0% |
| Science & Technology | 0 | 0.0% |
| Business | 0 | 0.0% |
| Education | 12 | 70.6% |
| Literature & Languages | 0 | 0.0% |
| Liberal Arts & History | 0 | 0.0% |
| Visual & Performing Arts | 0 | 0.0% |
| Communications | 0 | 0.0% |
| Arts & Humanities | 0 | 0.0% |
| Total | 17 | 100.0% |
Transportation & Commute in Beason
Vehicle Availability by Sex in Beason
The most prevalent vehicle ownership categories in Beason are males with 2 vehicles (25, accounting for 33.3%) and females with 2 vehicles (25, making up 67.6%).
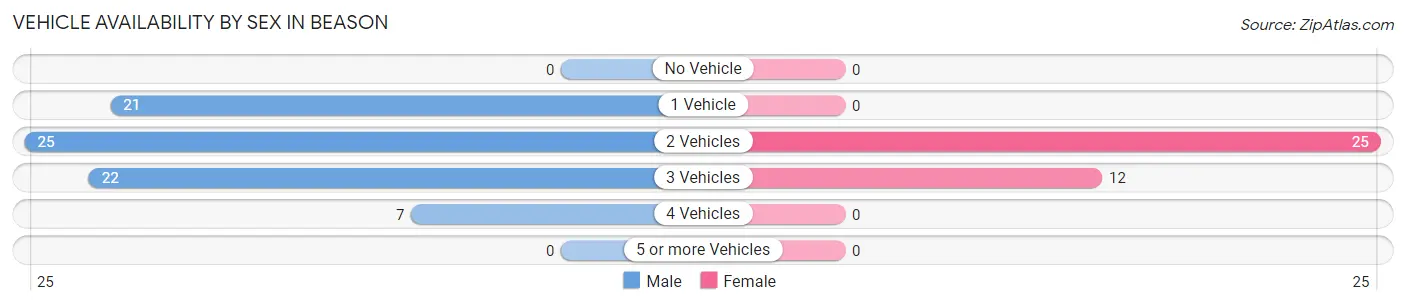
| Vehicles Available | Male | Female |
| No Vehicle | 0 (0.0%) | 0 (0.0%) |
| 1 Vehicle | 21 (28.0%) | 0 (0.0%) |
| 2 Vehicles | 25 (33.3%) | 25 (67.6%) |
| 3 Vehicles | 22 (29.3%) | 12 (32.4%) |
| 4 Vehicles | 7 (9.3%) | 0 (0.0%) |
| 5 or more Vehicles | 0 (0.0%) | 0 (0.0%) |
| Total | 75 (100.0%) | 37 (100.0%) |
Commute Time in Beason
The most frequently occuring commute durations in Beason are 15 to 19 minutes (45 commuters, 40.2%), 25 to 29 minutes (28 commuters, 25.0%), and 20 to 24 minutes (21 commuters, 18.8%).
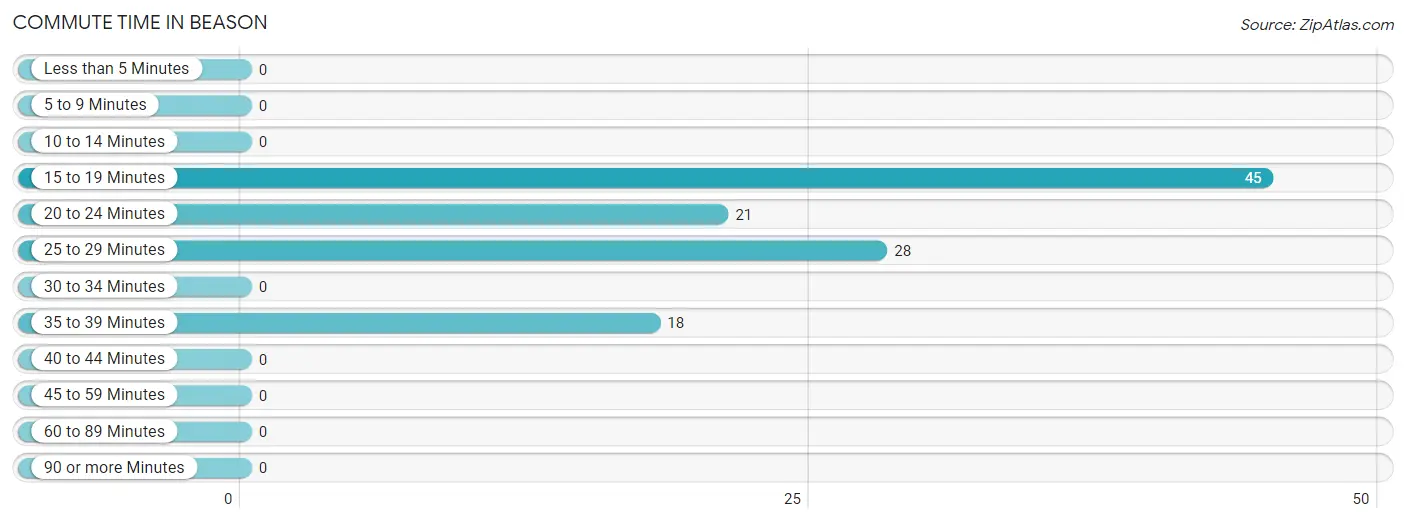
| Commute Time | # Commuters | % Commuters |
| Less than 5 Minutes | 0 | 0.0% |
| 5 to 9 Minutes | 0 | 0.0% |
| 10 to 14 Minutes | 0 | 0.0% |
| 15 to 19 Minutes | 45 | 40.2% |
| 20 to 24 Minutes | 21 | 18.8% |
| 25 to 29 Minutes | 28 | 25.0% |
| 30 to 34 Minutes | 0 | 0.0% |
| 35 to 39 Minutes | 18 | 16.1% |
| 40 to 44 Minutes | 0 | 0.0% |
| 45 to 59 Minutes | 0 | 0.0% |
| 60 to 89 Minutes | 0 | 0.0% |
| 90 or more Minutes | 0 | 0.0% |
Commute Time by Sex in Beason
The most common commute times in Beason are 15 to 19 minutes (22 commuters, 29.3%) for males and 15 to 19 minutes (23 commuters, 62.2%) for females.
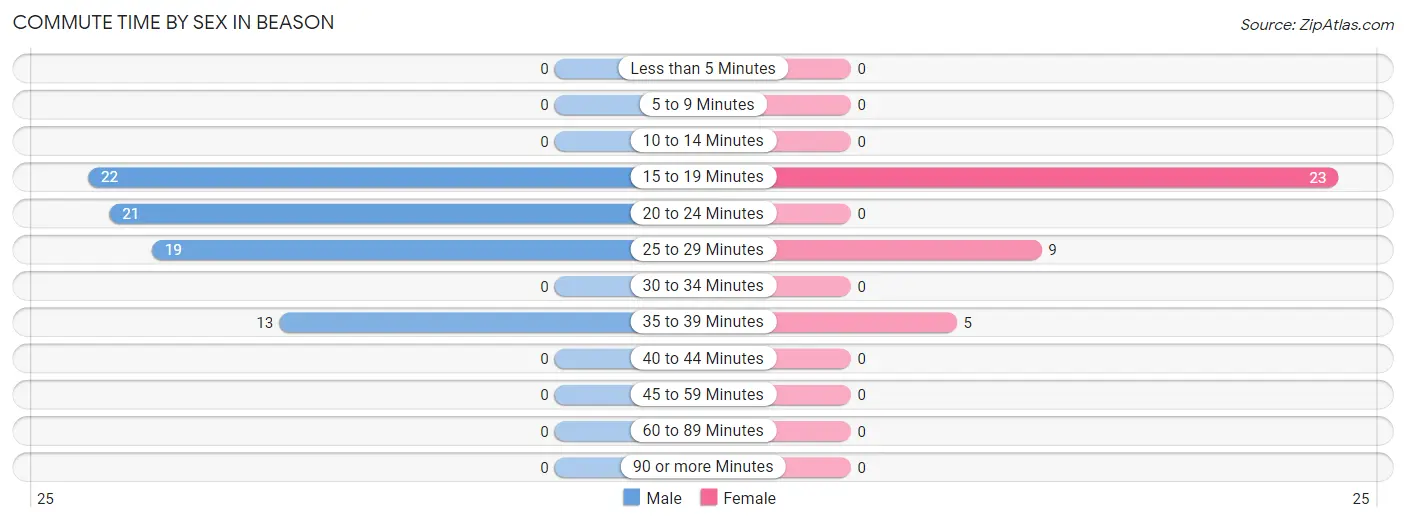
| Commute Time | Male | Female |
| Less than 5 Minutes | 0 (0.0%) | 0 (0.0%) |
| 5 to 9 Minutes | 0 (0.0%) | 0 (0.0%) |
| 10 to 14 Minutes | 0 (0.0%) | 0 (0.0%) |
| 15 to 19 Minutes | 22 (29.3%) | 23 (62.2%) |
| 20 to 24 Minutes | 21 (28.0%) | 0 (0.0%) |
| 25 to 29 Minutes | 19 (25.3%) | 9 (24.3%) |
| 30 to 34 Minutes | 0 (0.0%) | 0 (0.0%) |
| 35 to 39 Minutes | 13 (17.3%) | 5 (13.5%) |
| 40 to 44 Minutes | 0 (0.0%) | 0 (0.0%) |
| 45 to 59 Minutes | 0 (0.0%) | 0 (0.0%) |
| 60 to 89 Minutes | 0 (0.0%) | 0 (0.0%) |
| 90 or more Minutes | 0 (0.0%) | 0 (0.0%) |
Time of Departure to Work by Sex in Beason
The most frequent times of departure to work in Beason are 6:30 AM to 6:59 AM (28, 37.3%) for males and 6:30 AM to 6:59 AM (12, 32.4%) for females.
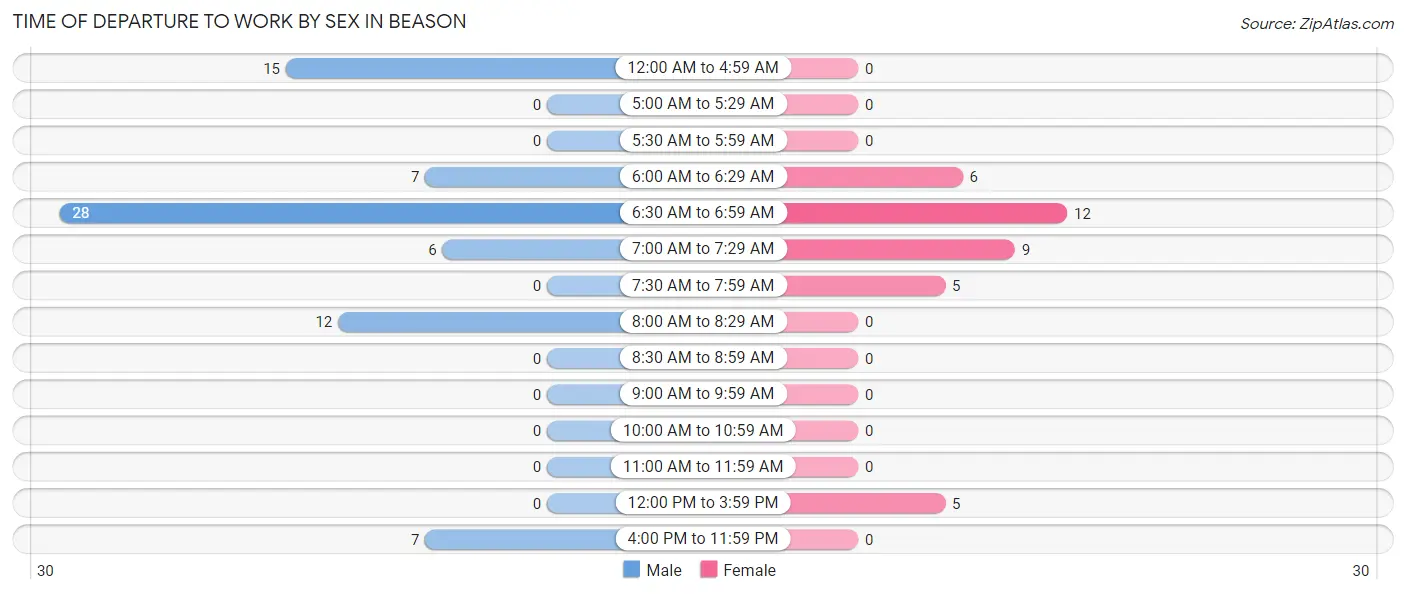
| Time of Departure | Male | Female |
| 12:00 AM to 4:59 AM | 15 (20.0%) | 0 (0.0%) |
| 5:00 AM to 5:29 AM | 0 (0.0%) | 0 (0.0%) |
| 5:30 AM to 5:59 AM | 0 (0.0%) | 0 (0.0%) |
| 6:00 AM to 6:29 AM | 7 (9.3%) | 6 (16.2%) |
| 6:30 AM to 6:59 AM | 28 (37.3%) | 12 (32.4%) |
| 7:00 AM to 7:29 AM | 6 (8.0%) | 9 (24.3%) |
| 7:30 AM to 7:59 AM | 0 (0.0%) | 5 (13.5%) |
| 8:00 AM to 8:29 AM | 12 (16.0%) | 0 (0.0%) |
| 8:30 AM to 8:59 AM | 0 (0.0%) | 0 (0.0%) |
| 9:00 AM to 9:59 AM | 0 (0.0%) | 0 (0.0%) |
| 10:00 AM to 10:59 AM | 0 (0.0%) | 0 (0.0%) |
| 11:00 AM to 11:59 AM | 0 (0.0%) | 0 (0.0%) |
| 12:00 PM to 3:59 PM | 0 (0.0%) | 5 (13.5%) |
| 4:00 PM to 11:59 PM | 7 (9.3%) | 0 (0.0%) |
| Total | 75 (100.0%) | 37 (100.0%) |
Housing Occupancy in Beason
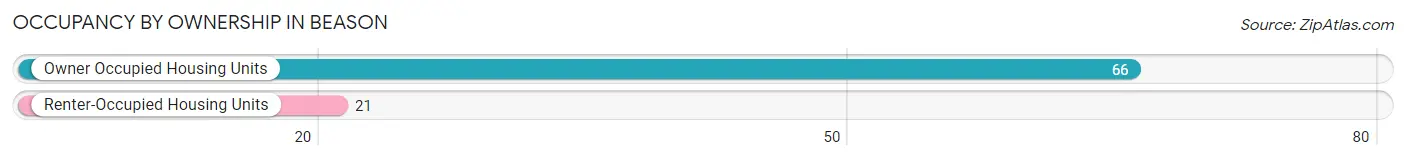
Occupancy by Ownership in Beason
Of the total 87 dwellings in Beason, owner-occupied units account for 66 (75.9%), while renter-occupied units make up 21 (24.1%).
| Occupancy | # Housing Units | % Housing Units |
| Owner Occupied Housing Units | 66 | 75.9% |
| Renter-Occupied Housing Units | 21 | 24.1% |
| Total Occupied Housing Units | 87 | 100.0% |
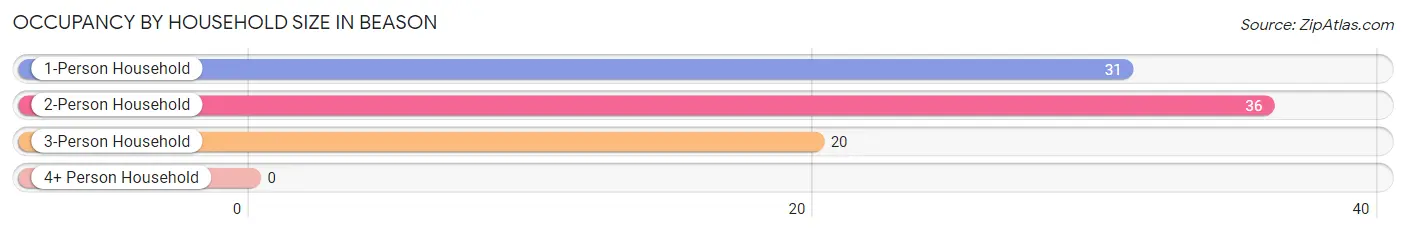
Occupancy by Household Size in Beason
| Household Size | # Housing Units | % Housing Units |
| 1-Person Household | 31 | 35.6% |
| 2-Person Household | 36 | 41.4% |
| 3-Person Household | 20 | 23.0% |
| 4+ Person Household | 0 | 0.0% |
| Total Housing Units | 87 | 100.0% |
Occupancy by Ownership by Household Size in Beason
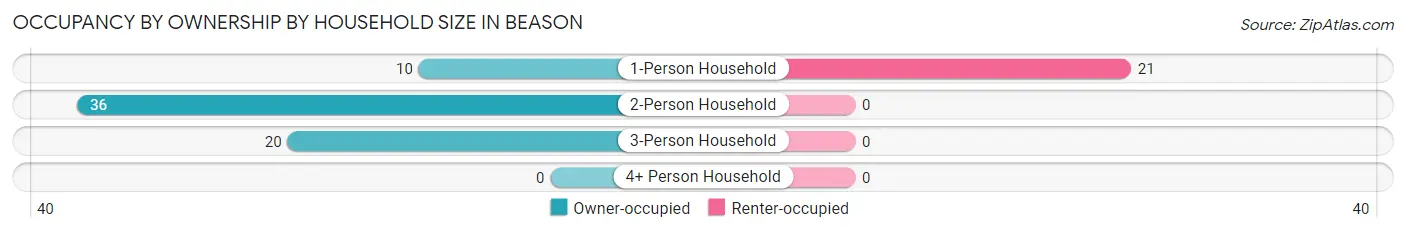
| Household Size | Owner-occupied | Renter-occupied |
| 1-Person Household | 10 (32.3%) | 21 (67.7%) |
| 2-Person Household | 36 (100.0%) | 0 (0.0%) |
| 3-Person Household | 20 (100.0%) | 0 (0.0%) |
| 4+ Person Household | 0 (0.0%) | 0 (0.0%) |
| Total Housing Units | 66 (75.9%) | 21 (24.1%) |
Occupancy by Educational Attainment in Beason
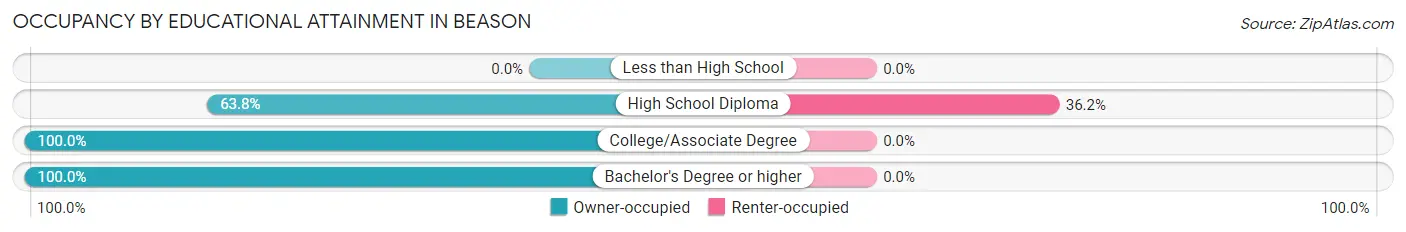
| Household Size | Owner-occupied | Renter-occupied |
| Less than High School | 0 (0.0%) | 0 (0.0%) |
| High School Diploma | 37 (63.8%) | 21 (36.2%) |
| College/Associate Degree | 24 (100.0%) | 0 (0.0%) |
| Bachelor's Degree or higher | 5 (100.0%) | 0 (0.0%) |
Occupancy by Age of Householder in Beason
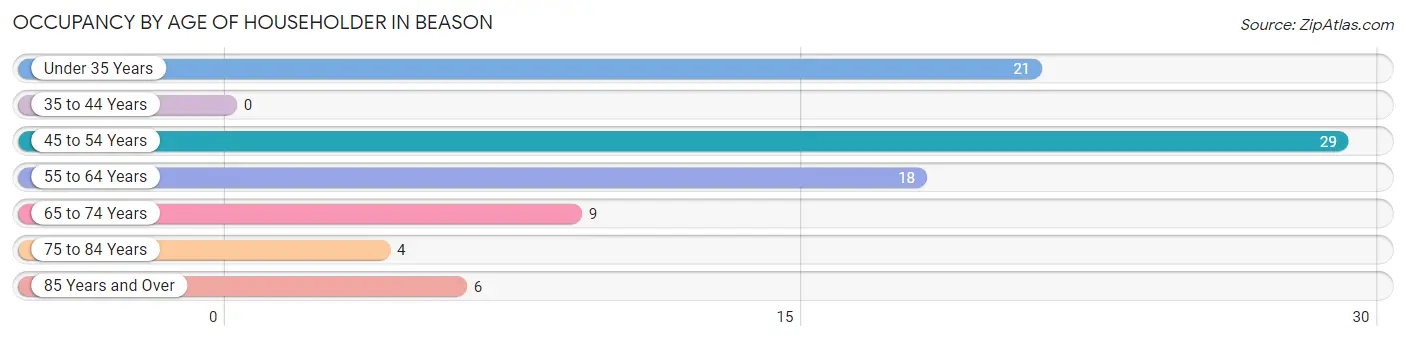
| Age Bracket | # Households | % Households |
| Under 35 Years | 21 | 24.1% |
| 35 to 44 Years | 0 | 0.0% |
| 45 to 54 Years | 29 | 33.3% |
| 55 to 64 Years | 18 | 20.7% |
| 65 to 74 Years | 9 | 10.3% |
| 75 to 84 Years | 4 | 4.6% |
| 85 Years and Over | 6 | 6.9% |
| Total | 87 | 100.0% |
Housing Finances in Beason
Median Income by Occupancy in Beason
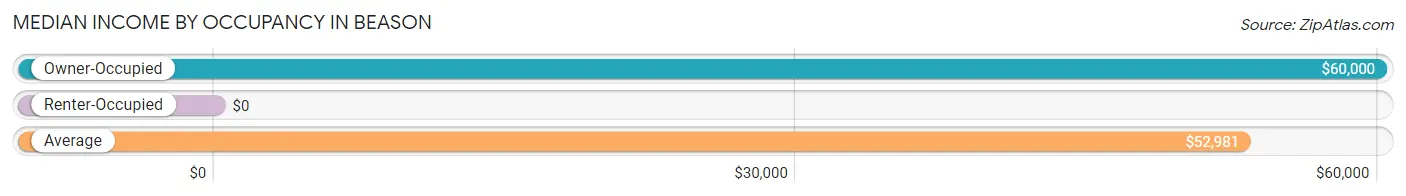
| Occupancy Type | # Households | Median Income |
| Owner-Occupied | 66 (75.9%) | $60,000 |
| Renter-Occupied | 21 (24.1%) | $0 |
| Average | 87 (100.0%) | $52,981 |
Occupancy by Householder Income Bracket in Beason
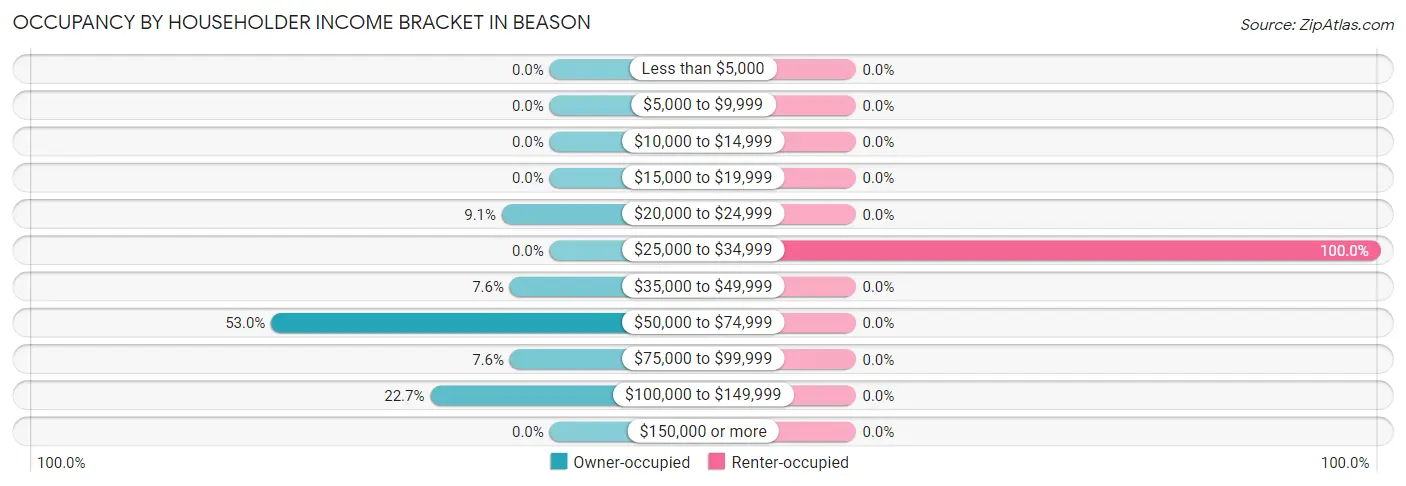
| Income Bracket | Owner-occupied | Renter-occupied |
| Less than $5,000 | 0 (0.0%) | 0 (0.0%) |
| $5,000 to $9,999 | 0 (0.0%) | 0 (0.0%) |
| $10,000 to $14,999 | 0 (0.0%) | 0 (0.0%) |
| $15,000 to $19,999 | 0 (0.0%) | 0 (0.0%) |
| $20,000 to $24,999 | 6 (9.1%) | 0 (0.0%) |
| $25,000 to $34,999 | 0 (0.0%) | 21 (100.0%) |
| $35,000 to $49,999 | 5 (7.6%) | 0 (0.0%) |
| $50,000 to $74,999 | 35 (53.0%) | 0 (0.0%) |
| $75,000 to $99,999 | 5 (7.6%) | 0 (0.0%) |
| $100,000 to $149,999 | 15 (22.7%) | 0 (0.0%) |
| $150,000 or more | 0 (0.0%) | 0 (0.0%) |
| Total | 66 (100.0%) | 21 (100.0%) |
Monthly Housing Cost Tiers in Beason
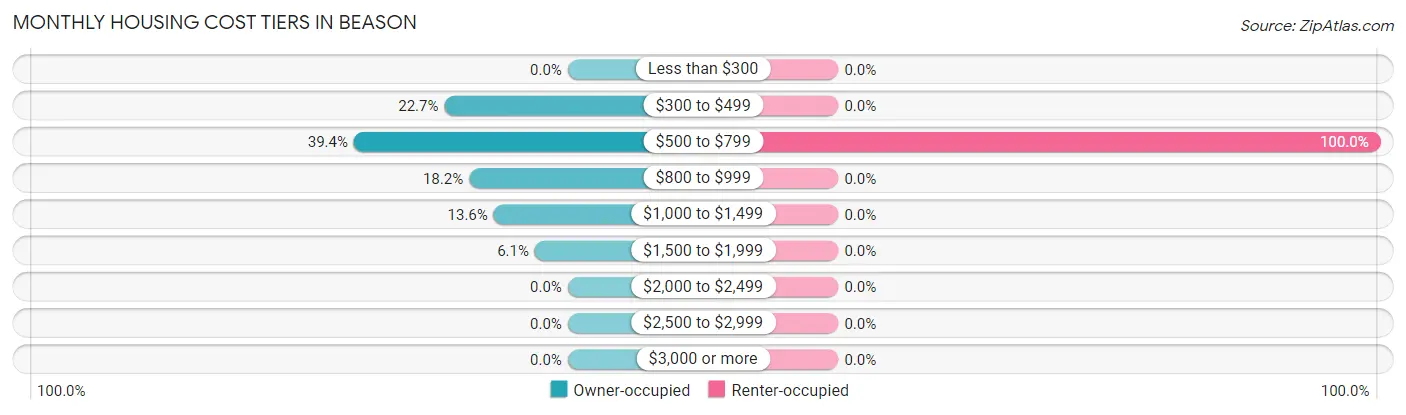
| Monthly Cost | Owner-occupied | Renter-occupied |
| Less than $300 | 0 (0.0%) | 0 (0.0%) |
| $300 to $499 | 15 (22.7%) | 0 (0.0%) |
| $500 to $799 | 26 (39.4%) | 21 (100.0%) |
| $800 to $999 | 12 (18.2%) | 0 (0.0%) |
| $1,000 to $1,499 | 9 (13.6%) | 0 (0.0%) |
| $1,500 to $1,999 | 4 (6.1%) | 0 (0.0%) |
| $2,000 to $2,499 | 0 (0.0%) | 0 (0.0%) |
| $2,500 to $2,999 | 0 (0.0%) | 0 (0.0%) |
| $3,000 or more | 0 (0.0%) | 0 (0.0%) |
| Total | 66 (100.0%) | 21 (100.0%) |
Physical Housing Characteristics in Beason
Housing Structures in Beason
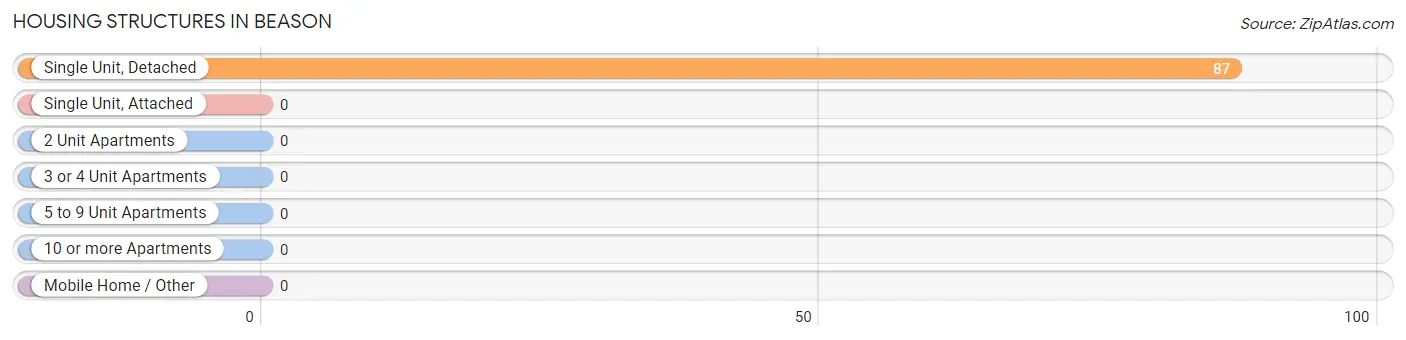
| Structure Type | # Housing Units | % Housing Units |
| Single Unit, Detached | 87 | 100.0% |
| Single Unit, Attached | 0 | 0.0% |
| 2 Unit Apartments | 0 | 0.0% |
| 3 or 4 Unit Apartments | 0 | 0.0% |
| 5 to 9 Unit Apartments | 0 | 0.0% |
| 10 or more Apartments | 0 | 0.0% |
| Mobile Home / Other | 0 | 0.0% |
| Total | 87 | 100.0% |
Housing Structures by Occupancy in Beason
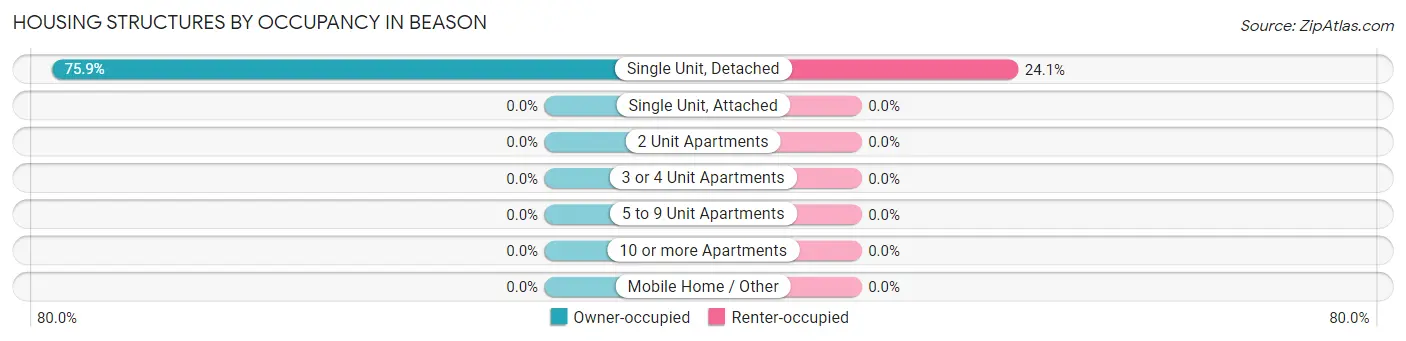
| Structure Type | Owner-occupied | Renter-occupied |
| Single Unit, Detached | 66 (75.9%) | 21 (24.1%) |
| Single Unit, Attached | 0 (0.0%) | 0 (0.0%) |
| 2 Unit Apartments | 0 (0.0%) | 0 (0.0%) |
| 3 or 4 Unit Apartments | 0 (0.0%) | 0 (0.0%) |
| 5 to 9 Unit Apartments | 0 (0.0%) | 0 (0.0%) |
| 10 or more Apartments | 0 (0.0%) | 0 (0.0%) |
| Mobile Home / Other | 0 (0.0%) | 0 (0.0%) |
| Total | 66 (75.9%) | 21 (24.1%) |
Housing Structures by Number of Rooms in Beason
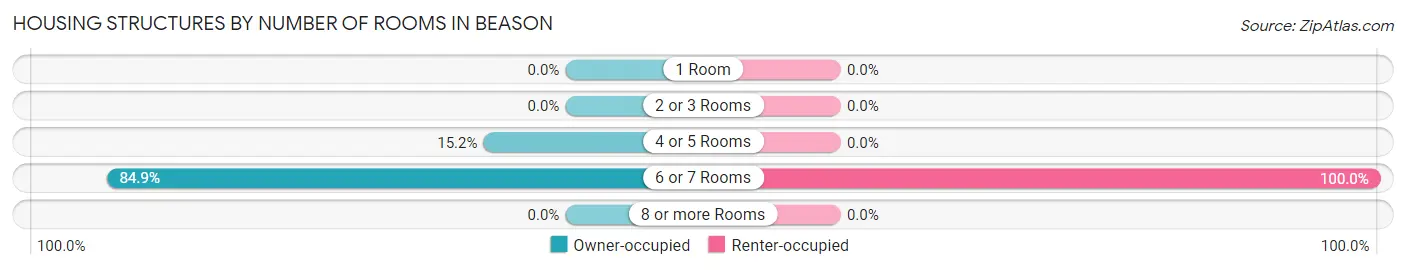
| Number of Rooms | Owner-occupied | Renter-occupied |
| 1 Room | 0 (0.0%) | 0 (0.0%) |
| 2 or 3 Rooms | 0 (0.0%) | 0 (0.0%) |
| 4 or 5 Rooms | 10 (15.1%) | 0 (0.0%) |
| 6 or 7 Rooms | 56 (84.9%) | 21 (100.0%) |
| 8 or more Rooms | 0 (0.0%) | 0 (0.0%) |
| Total | 66 (100.0%) | 21 (100.0%) |
Housing Structure by Heating Type in Beason
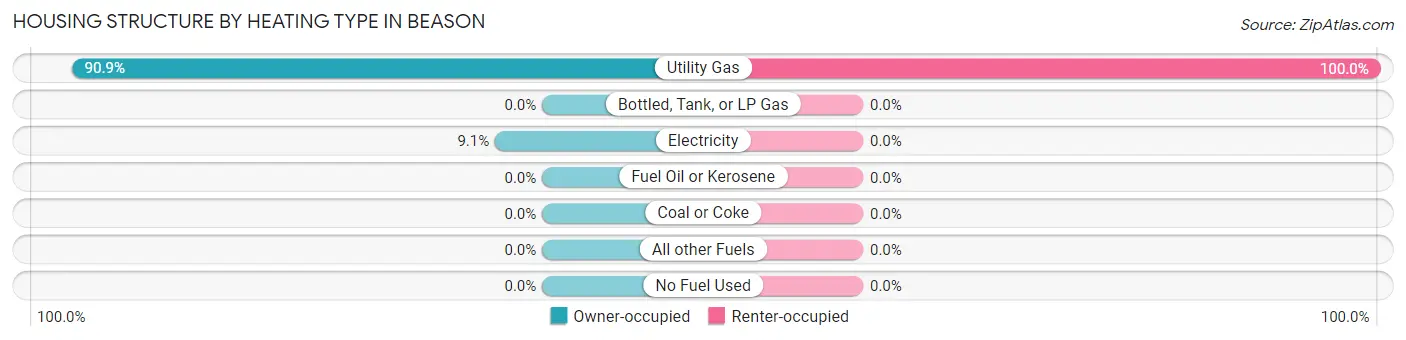
| Heating Type | Owner-occupied | Renter-occupied |
| Utility Gas | 60 (90.9%) | 21 (100.0%) |
| Bottled, Tank, or LP Gas | 0 (0.0%) | 0 (0.0%) |
| Electricity | 6 (9.1%) | 0 (0.0%) |
| Fuel Oil or Kerosene | 0 (0.0%) | 0 (0.0%) |
| Coal or Coke | 0 (0.0%) | 0 (0.0%) |
| All other Fuels | 0 (0.0%) | 0 (0.0%) |
| No Fuel Used | 0 (0.0%) | 0 (0.0%) |
| Total | 66 (100.0%) | 21 (100.0%) |
Household Vehicle Usage in Beason
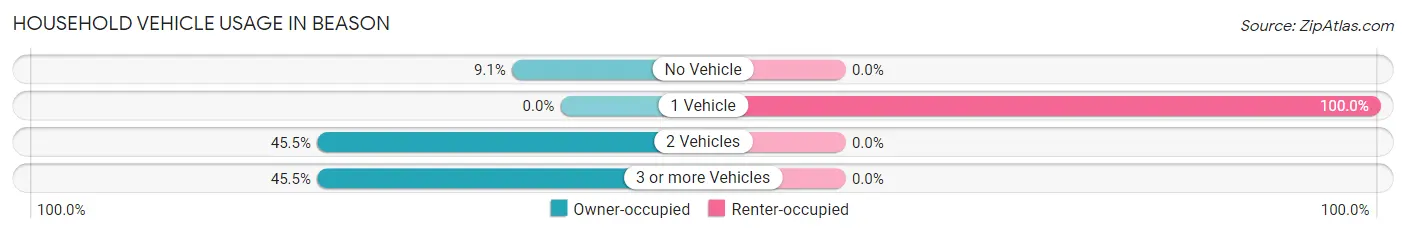
| Vehicles per Household | Owner-occupied | Renter-occupied |
| No Vehicle | 6 (9.1%) | 0 (0.0%) |
| 1 Vehicle | 0 (0.0%) | 21 (100.0%) |
| 2 Vehicles | 30 (45.5%) | 0 (0.0%) |
| 3 or more Vehicles | 30 (45.5%) | 0 (0.0%) |
| Total | 66 (100.0%) | 21 (100.0%) |
Real Estate & Mortgages in Beason
Real Estate and Mortgage Overview in Beason
| Characteristic | Without Mortgage | With Mortgage |
| Housing Units | 24 | 42 |
| Median Property Value | - | - |
| Median Household Income | - | - |
| Monthly Housing Costs | - | - |
| Real Estate Taxes | - | - |
Property Value by Mortgage Status in Beason
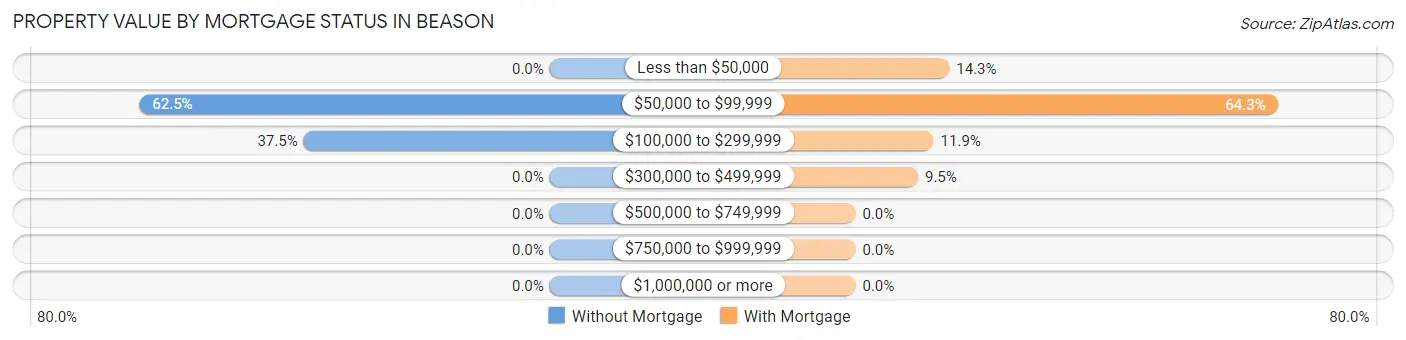
| Property Value | Without Mortgage | With Mortgage |
| Less than $50,000 | 0 (0.0%) | 6 (14.3%) |
| $50,000 to $99,999 | 15 (62.5%) | 27 (64.3%) |
| $100,000 to $299,999 | 9 (37.5%) | 5 (11.9%) |
| $300,000 to $499,999 | 0 (0.0%) | 4 (9.5%) |
| $500,000 to $749,999 | 0 (0.0%) | 0 (0.0%) |
| $750,000 to $999,999 | 0 (0.0%) | 0 (0.0%) |
| $1,000,000 or more | 0 (0.0%) | 0 (0.0%) |
| Total | 24 (100.0%) | 42 (100.0%) |
Household Income by Mortgage Status in Beason
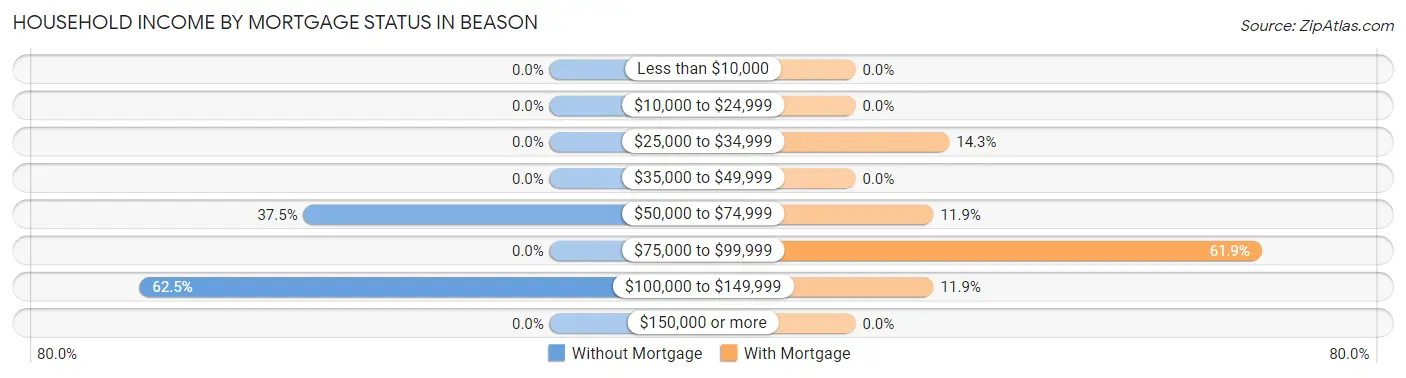
| Household Income | Without Mortgage | With Mortgage |
| Less than $10,000 | 0 (0.0%) | 0 (0.0%) |
| $10,000 to $24,999 | 0 (0.0%) | 0 (0.0%) |
| $25,000 to $34,999 | 0 (0.0%) | 6 (14.3%) |
| $35,000 to $49,999 | 0 (0.0%) | 0 (0.0%) |
| $50,000 to $74,999 | 9 (37.5%) | 5 (11.9%) |
| $75,000 to $99,999 | 0 (0.0%) | 26 (61.9%) |
| $100,000 to $149,999 | 15 (62.5%) | 5 (11.9%) |
| $150,000 or more | 0 (0.0%) | 0 (0.0%) |
| Total | 24 (100.0%) | 42 (100.0%) |
Property Value to Household Income Ratio in Beason
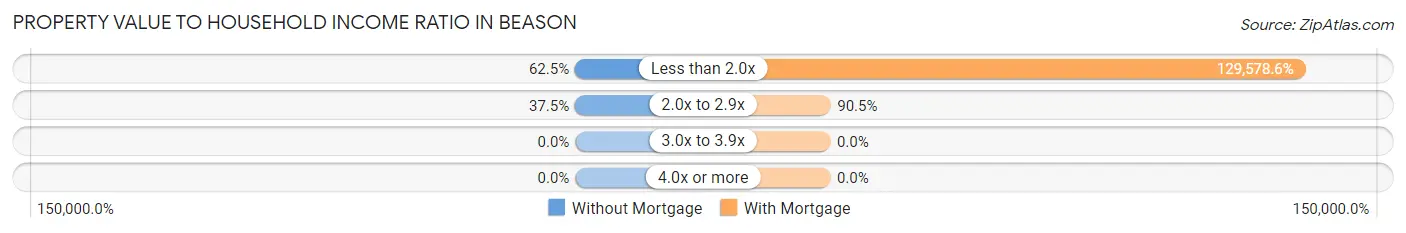
| Value-to-Income Ratio | Without Mortgage | With Mortgage |
| Less than 2.0x | 15 (62.5%) | 54,423 (129,578.6%) |
| 2.0x to 2.9x | 9 (37.5%) | 38 (90.5%) |
| 3.0x to 3.9x | 0 (0.0%) | 0 (0.0%) |
| 4.0x or more | 0 (0.0%) | 0 (0.0%) |
| Total | 24 (100.0%) | 42 (100.0%) |
Real Estate Taxes by Mortgage Status in Beason
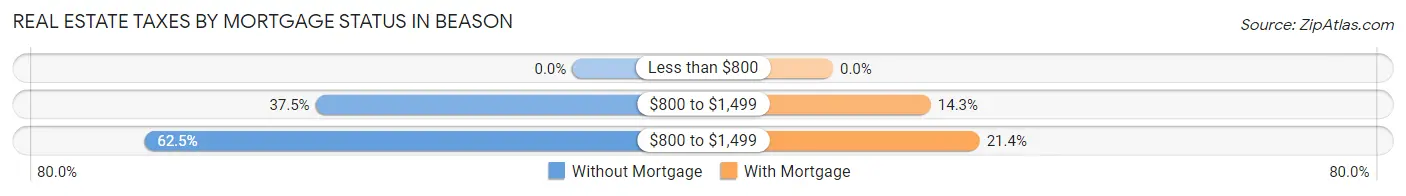
| Property Taxes | Without Mortgage | With Mortgage |
| Less than $800 | 0 (0.0%) | 0 (0.0%) |
| $800 to $1,499 | 9 (37.5%) | 6 (14.3%) |
| $800 to $1,499 | 15 (62.5%) | 9 (21.4%) |
| Total | 24 (100.0%) | 42 (100.0%) |
Health & Disability in Beason
Health Insurance Coverage by Age in Beason
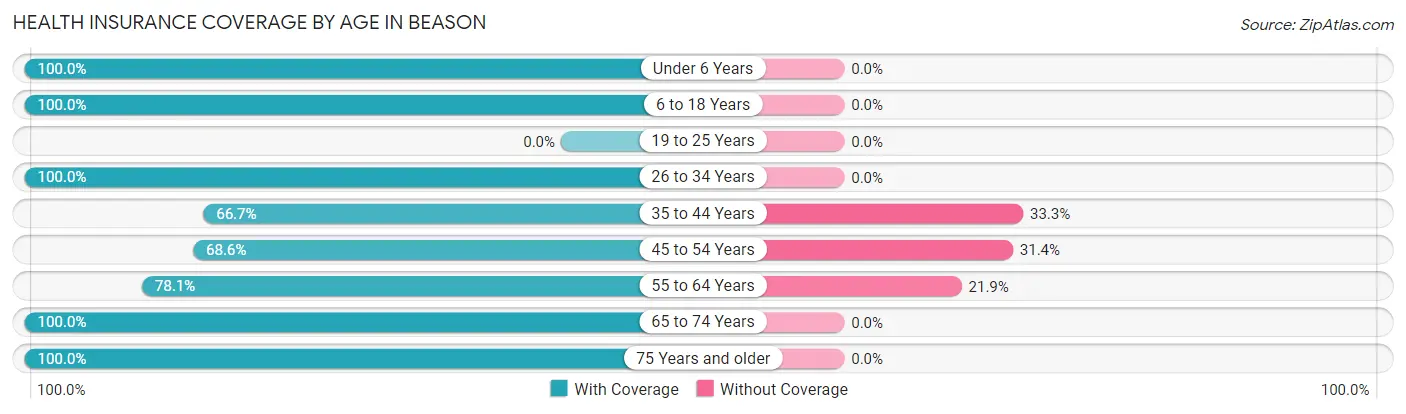
| Age Bracket | With Coverage | Without Coverage |
| Under 6 Years | 9 (100.0%) | 0 (0.0%) |
| 6 to 18 Years | 12 (100.0%) | 0 (0.0%) |
| 19 to 25 Years | 0 (0.0%) | 0 (0.0%) |
| 26 to 34 Years | 32 (100.0%) | 0 (0.0%) |
| 35 to 44 Years | 12 (66.7%) | 6 (33.3%) |
| 45 to 54 Years | 24 (68.6%) | 11 (31.4%) |
| 55 to 64 Years | 25 (78.1%) | 7 (21.9%) |
| 65 to 74 Years | 9 (100.0%) | 0 (0.0%) |
| 75 Years and older | 10 (100.0%) | 0 (0.0%) |
| Total | 133 (84.7%) | 24 (15.3%) |
Health Insurance Coverage by Citizenship Status in Beason
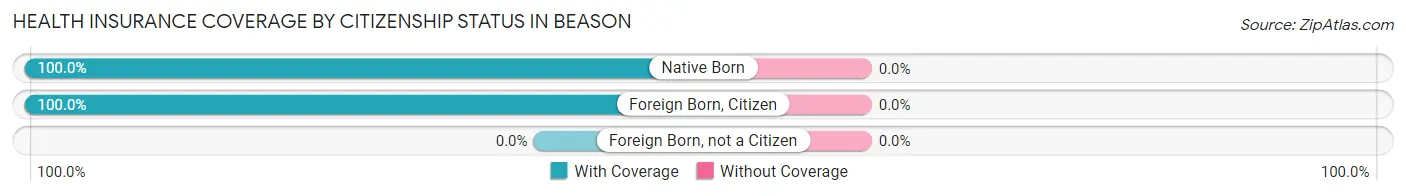
| Citizenship Status | With Coverage | Without Coverage |
| Native Born | 9 (100.0%) | 0 (0.0%) |
| Foreign Born, Citizen | 12 (100.0%) | 0 (0.0%) |
| Foreign Born, not a Citizen | 0 (0.0%) | 0 (0.0%) |
Health Insurance Coverage by Household Income in Beason
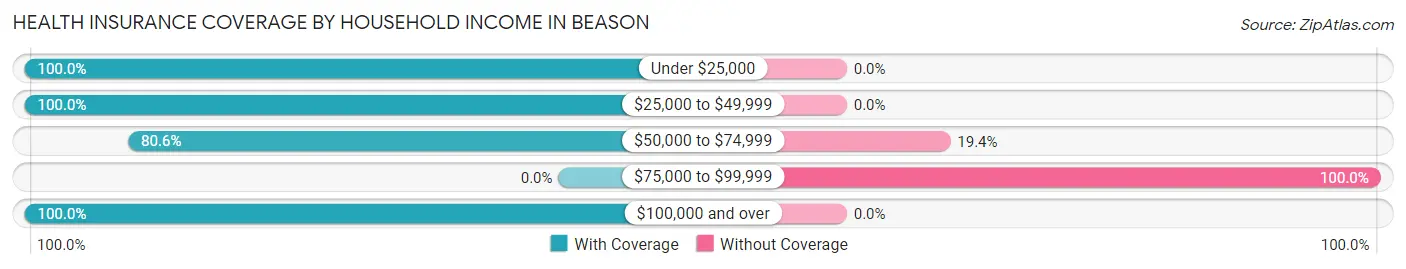
| Household Income | With Coverage | Without Coverage |
| Under $25,000 | 6 (100.0%) | 0 (0.0%) |
| $25,000 to $49,999 | 37 (100.0%) | 0 (0.0%) |
| $50,000 to $74,999 | 54 (80.6%) | 13 (19.4%) |
| $75,000 to $99,999 | 0 (0.0%) | 11 (100.0%) |
| $100,000 and over | 36 (100.0%) | 0 (0.0%) |
Public vs Private Health Insurance Coverage by Age in Beason
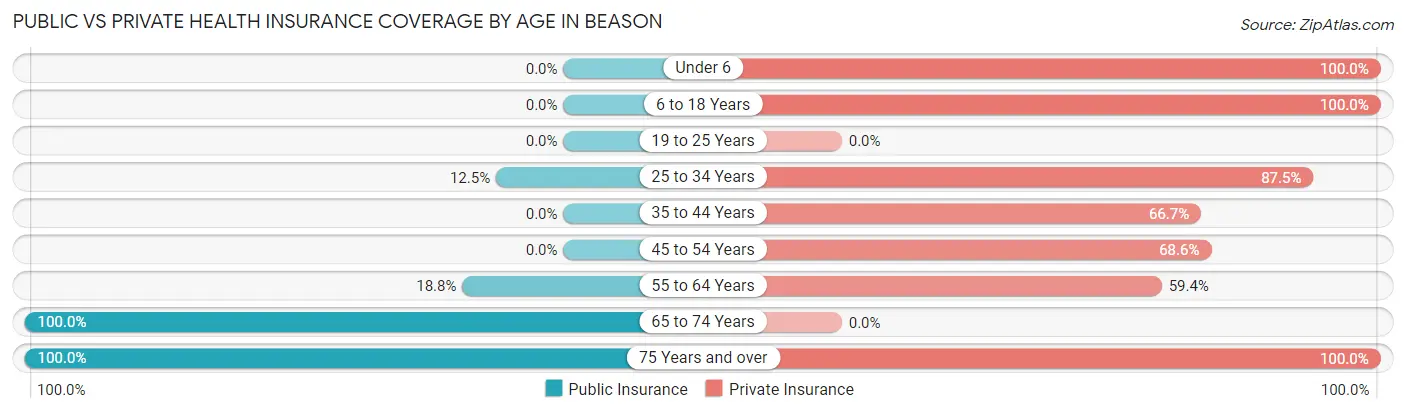
| Age Bracket | Public Insurance | Private Insurance |
| Under 6 | 0 (0.0%) | 9 (100.0%) |
| 6 to 18 Years | 0 (0.0%) | 12 (100.0%) |
| 19 to 25 Years | 0 (0.0%) | 0 (0.0%) |
| 25 to 34 Years | 4 (12.5%) | 28 (87.5%) |
| 35 to 44 Years | 0 (0.0%) | 12 (66.7%) |
| 45 to 54 Years | 0 (0.0%) | 24 (68.6%) |
| 55 to 64 Years | 6 (18.8%) | 19 (59.4%) |
| 65 to 74 Years | 9 (100.0%) | 0 (0.0%) |
| 75 Years and over | 10 (100.0%) | 10 (100.0%) |
| Total | 29 (18.5%) | 114 (72.6%) |
Disability Status by Sex by Age in Beason
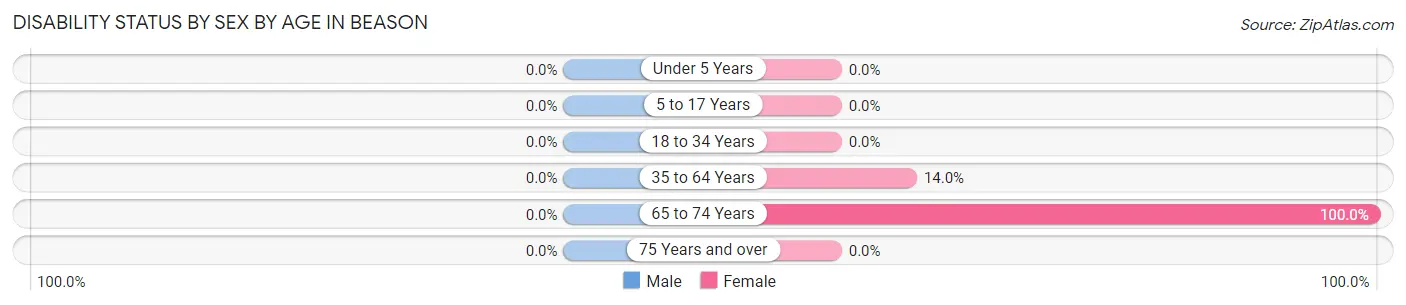
| Age Bracket | Male | Female |
| Under 5 Years | 0 (0.0%) | 0 (0.0%) |
| 5 to 17 Years | 0 (0.0%) | 0 (0.0%) |
| 18 to 34 Years | 0 (0.0%) | 0 (0.0%) |
| 35 to 64 Years | 0 (0.0%) | 6 (14.0%) |
| 65 to 74 Years | 0 (0.0%) | 9 (100.0%) |
| 75 Years and over | 0 (0.0%) | 0 (0.0%) |
Disability Class by Sex by Age in Beason
Disability Class: Hearing Difficulty
| Age Bracket | Male | Female |
| Under 5 Years | 0 (0.0%) | 0 (0.0%) |
| 5 to 17 Years | 0 (0.0%) | 0 (0.0%) |
| 18 to 34 Years | 0 (0.0%) | 0 (0.0%) |
| 35 to 64 Years | 0 (0.0%) | 0 (0.0%) |
| 65 to 74 Years | 0 (0.0%) | 0 (0.0%) |
| 75 Years and over | 0 (0.0%) | 0 (0.0%) |
Disability Class: Vision Difficulty
| Age Bracket | Male | Female |
| Under 5 Years | 0 (0.0%) | 0 (0.0%) |
| 5 to 17 Years | 0 (0.0%) | 0 (0.0%) |
| 18 to 34 Years | 0 (0.0%) | 0 (0.0%) |
| 35 to 64 Years | 0 (0.0%) | 0 (0.0%) |
| 65 to 74 Years | 0 (0.0%) | 0 (0.0%) |
| 75 Years and over | 0 (0.0%) | 0 (0.0%) |
Disability Class: Cognitive Difficulty
| Age Bracket | Male | Female |
| 5 to 17 Years | 0 (0.0%) | 0 (0.0%) |
| 18 to 34 Years | 0 (0.0%) | 0 (0.0%) |
| 35 to 64 Years | 0 (0.0%) | 0 (0.0%) |
| 65 to 74 Years | 0 (0.0%) | 0 (0.0%) |
| 75 Years and over | 0 (0.0%) | 0 (0.0%) |
Disability Class: Ambulatory Difficulty
| Age Bracket | Male | Female |
| 5 to 17 Years | 0 (0.0%) | 0 (0.0%) |
| 18 to 34 Years | 0 (0.0%) | 0 (0.0%) |
| 35 to 64 Years | 0 (0.0%) | 6 (14.0%) |
| 65 to 74 Years | 0 (0.0%) | 9 (100.0%) |
| 75 Years and over | 0 (0.0%) | 0 (0.0%) |
Disability Class: Self-Care Difficulty
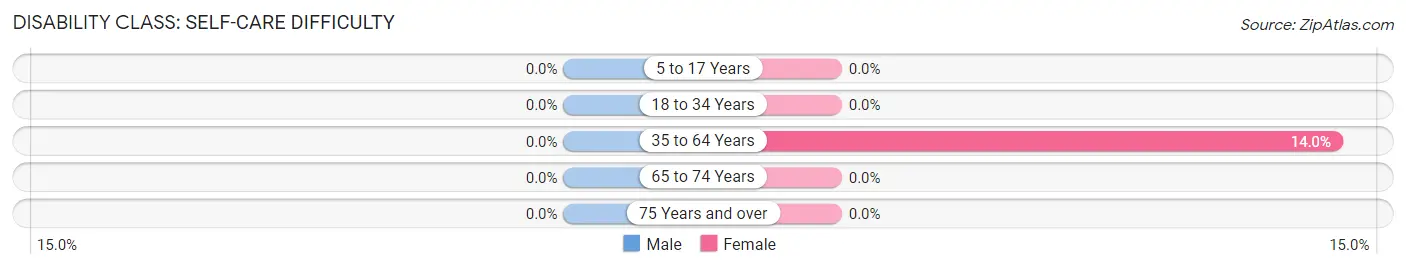
| Age Bracket | Male | Female |
| 5 to 17 Years | 0 (0.0%) | 0 (0.0%) |
| 18 to 34 Years | 0 (0.0%) | 0 (0.0%) |
| 35 to 64 Years | 0 (0.0%) | 6 (14.0%) |
| 65 to 74 Years | 0 (0.0%) | 0 (0.0%) |
| 75 Years and over | 0 (0.0%) | 0 (0.0%) |
Technology Access in Beason
Computing Device Access in Beason
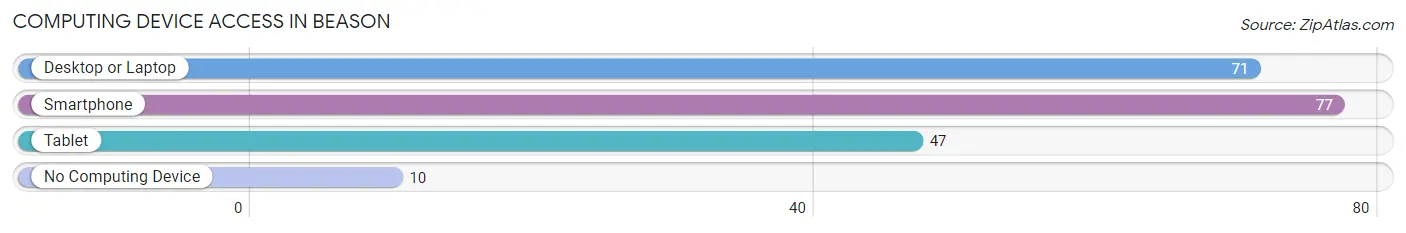
| Device Type | # Households | % Households |
| Desktop or Laptop | 71 | 81.6% |
| Smartphone | 77 | 88.5% |
| Tablet | 47 | 54.0% |
| No Computing Device | 10 | 11.5% |
| Total | 87 | 100.0% |
Internet Access in Beason
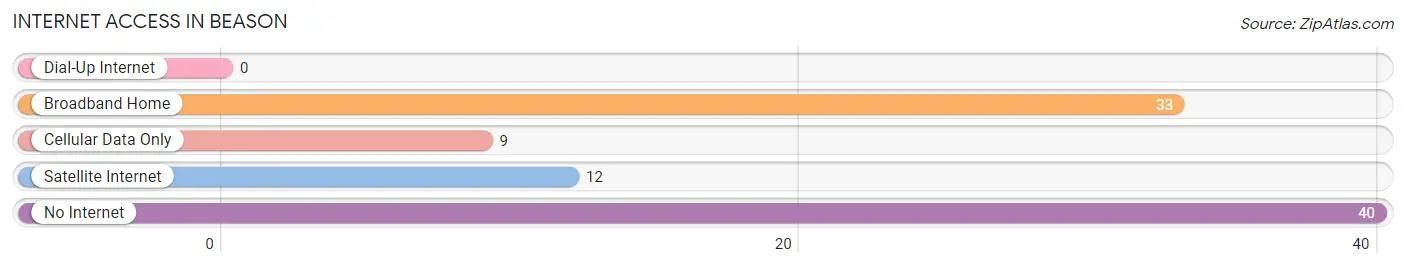
| Internet Type | # Households | % Households |
| Dial-Up Internet | 0 | 0.0% |
| Broadband Home | 33 | 37.9% |
| Cellular Data Only | 9 | 10.3% |
| Satellite Internet | 12 | 13.8% |
| No Internet | 40 | 46.0% |
| Total | 87 | 100.0% |
Beason Summary
Beason, Illinois is a small village located in Logan County, Illinois. It is situated about 10 miles east of Lincoln, the county seat. The village has a population of approximately 500 people and covers an area of 0.6 square miles.
Beason was founded in 1854 by a group of settlers from Ohio. The village was named after the Beason family, who were among the first settlers. The village was incorporated in 1872.
Geography
Beason is located in the central part of Logan County, Illinois. It is situated about 10 miles east of Lincoln, the county seat. The village is located on the Sangamon River, which flows through the village. The village is surrounded by farmland and is located in the heart of the Illinois prairie.
The village has a total area of 0.6 square miles, all of which is land. The village is located at an elevation of 690 feet above sea level.
Economy
The economy of Beason is largely based on agriculture. The village is surrounded by farmland and many of the residents are involved in farming. The village also has a few small businesses, including a grocery store, a hardware store, and a few restaurants.
Demographics
As of the 2010 census, Beason had a population of 500 people. The racial makeup of the village was 97.2% White, 0.6% African American, 0.2% Native American, 0.2% Asian, 0.2% from other races, and 1.8% from two or more races. Hispanic or Latino of any race were 0.8% of the population.
The median income for a household in Beason was $45,000, and the median income for a family was $50,000. The per capita income for the village was $20,000. About 8.2% of families and 10.2% of the population were below the poverty line, including 11.2% of those under age 18 and 8.2% of those age 65 or over.
Education
Beason is served by the Lincoln Community Unit School District 27. The district operates two elementary schools, one middle school, and one high school. The village also has a public library.
Conclusion
Beason, Illinois is a small village located in Logan County, Illinois. It is situated about 10 miles east of Lincoln, the county seat. The village has a population of approximately 500 people and covers an area of 0.6 square miles. The economy of Beason is largely based on agriculture, and the village is served by the Lincoln Community Unit School District 27. Beason is a small, rural village with a rich history and a strong sense of community.
Common Questions
What is Per Capita Income in Beason?
Per Capita income in Beason is $32,025.
What is the Median Family Income in Beason?
Median Family Income in Beason is $66,786.
What is the Median Household income in Beason?
Median Household Income in Beason is $52,981.
What is Income or Wage Gap in Beason?
Income or Wage Gap in Beason is 27.6%.
Women in Beason earn 72.4 cents for every dollar earned by a man.
What is Inequality or Gini Index in Beason?
Inequality or Gini Index in Beason is 0.28.
What is the Total Population of Beason?
Total Population of Beason is 157.
What is the Total Male Population of Beason?
Total Male Population of Beason is 90.
What is the Total Female Population of Beason?
Total Female Population of Beason is 67.
What is the Ratio of Males per 100 Females in Beason?
There are 134.33 Males per 100 Females in Beason.
What is the Ratio of Females per 100 Males in Beason?
There are 74.44 Females per 100 Males in Beason.
What is the Median Population Age in Beason?
Median Population Age in Beason is 47.5 Years.
What is the Average Family Size in Beason
Average Family Size in Beason is 2.2 People.
What is the Average Household Size in Beason
Average Household Size in Beason is 1.8 People.
How Large is the Labor Force in Beason?
There are 112 People in the Labor Forcein in Beason.
What is the Percentage of People in the Labor Force in Beason?
75.7% of People are in the Labor Force in Beason.