Athens, IL Map & Demographics
Athens Map
Athens Overview
$35,276
PER CAPITA INCOME
$83,125
AVG FAMILY INCOME
$78,542
AVG HOUSEHOLD INCOME
12.2%
WAGE / INCOME GAP [ % ]
87.8¢/ $1
WAGE / INCOME GAP [ $ ]
0.40
INEQUALITY / GINI INDEX
2,398
TOTAL POPULATION
1,066
MALE POPULATION
1,332
FEMALE POPULATION
80.03
MALES / 100 FEMALES
124.95
FEMALES / 100 MALES
33.7
MEDIAN AGE
3.0
AVG FAMILY SIZE
2.5
AVG HOUSEHOLD SIZE
1,311
LABOR FORCE [ PEOPLE ]
73.8%
PERCENT IN LABOR FORCE
7.1%
UNEMPLOYMENT RATE
Athens Zip Codes
Athens Area Codes
Income in Athens
Income Overview in Athens
Per Capita Income in Athens is $35,276, while median incomes of families and households are $83,125 and $78,542 respectively.
| Characteristic | Number | Measure |
| Per Capita Income | 2,398 | $35,276 |
| Median Family Income | 672 | $83,125 |
| Mean Family Income | 672 | $100,605 |
| Median Household Income | 940 | $78,542 |
| Mean Household Income | 940 | $89,913 |
| Income Deficit | 672 | $0 |
| Wage / Income Gap (%) | 2,398 | 12.15% |
| Wage / Income Gap ($) | 2,398 | 87.85¢ per $1 |
| Gini / Inequality Index | 2,398 | 0.40 |
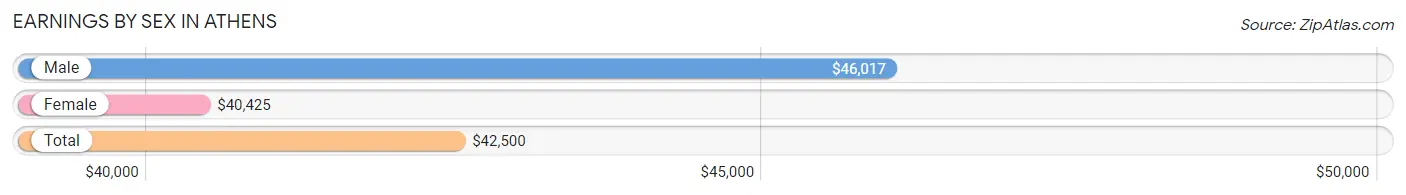
Earnings by Sex in Athens
Average Earnings in Athens are $42,500, $46,017 for men and $40,425 for women, a difference of 12.1%.
| Sex | Number | Average Earnings |
| Male | 610 (46.8%) | $46,017 |
| Female | 694 (53.2%) | $40,425 |
| Total | 1,304 (100.0%) | $42,500 |
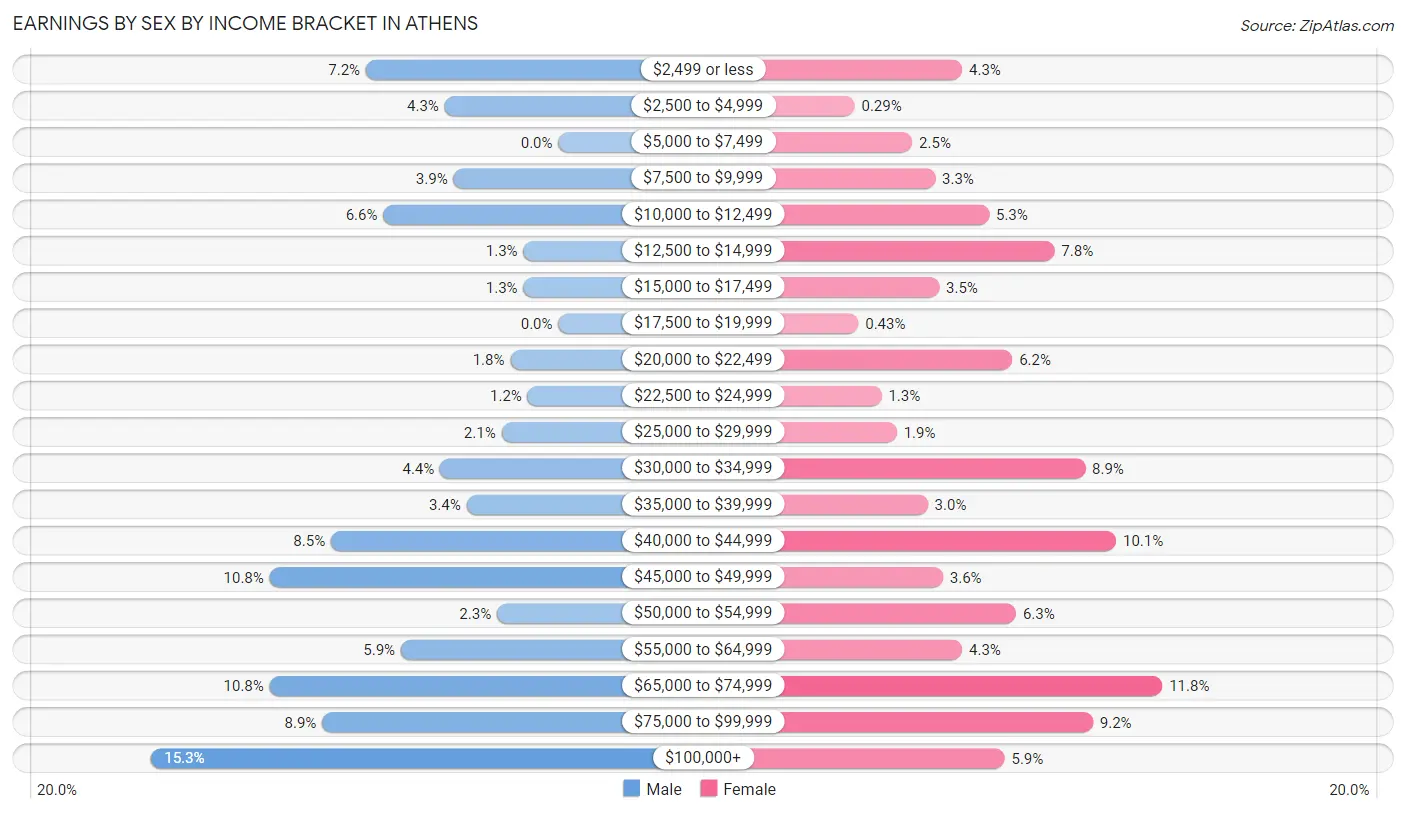
Earnings by Sex by Income Bracket in Athens
The most common earnings brackets in Athens are $100,000+ for men (93 | 15.2%) and $65,000 to $74,999 for women (82 | 11.8%).
| Income | Male | Female |
| $2,499 or less | 44 (7.2%) | 30 (4.3%) |
| $2,500 to $4,999 | 26 (4.3%) | 2 (0.3%) |
| $5,000 to $7,499 | 0 (0.0%) | 17 (2.5%) |
| $7,500 to $9,999 | 24 (3.9%) | 23 (3.3%) |
| $10,000 to $12,499 | 40 (6.6%) | 37 (5.3%) |
| $12,500 to $14,999 | 8 (1.3%) | 54 (7.8%) |
| $15,000 to $17,499 | 8 (1.3%) | 24 (3.5%) |
| $17,500 to $19,999 | 0 (0.0%) | 3 (0.4%) |
| $20,000 to $22,499 | 11 (1.8%) | 43 (6.2%) |
| $22,500 to $24,999 | 7 (1.1%) | 9 (1.3%) |
| $25,000 to $29,999 | 13 (2.1%) | 13 (1.9%) |
| $30,000 to $34,999 | 27 (4.4%) | 62 (8.9%) |
| $35,000 to $39,999 | 21 (3.4%) | 21 (3.0%) |
| $40,000 to $44,999 | 52 (8.5%) | 70 (10.1%) |
| $45,000 to $49,999 | 66 (10.8%) | 25 (3.6%) |
| $50,000 to $54,999 | 14 (2.3%) | 44 (6.3%) |
| $55,000 to $64,999 | 36 (5.9%) | 30 (4.3%) |
| $65,000 to $74,999 | 66 (10.8%) | 82 (11.8%) |
| $75,000 to $99,999 | 54 (8.8%) | 64 (9.2%) |
| $100,000+ | 93 (15.2%) | 41 (5.9%) |
| Total | 610 (100.0%) | 694 (100.0%) |
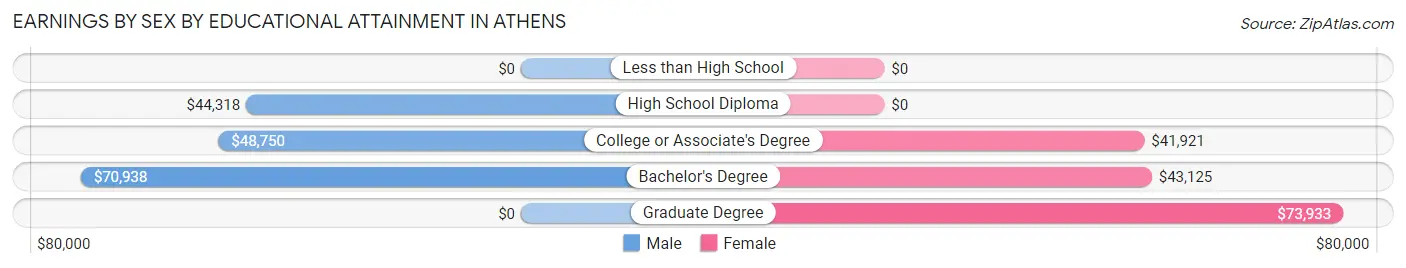
Earnings by Sex by Educational Attainment in Athens
Average earnings in Athens are $47,436 for men and $44,191 for women, a difference of 6.8%. Men with an educational attainment of bachelor's degree enjoy the highest average annual earnings of $70,938, while those with high school diploma education earn the least with $44,318. Women with an educational attainment of graduate degree earn the most with the average annual earnings of $73,933, while those with college or associate's degree education have the smallest earnings of $41,921.
| Educational Attainment | Male Income | Female Income |
| Less than High School | - | - |
| High School Diploma | $44,318 | $0 |
| College or Associate's Degree | $48,750 | $41,921 |
| Bachelor's Degree | $70,938 | $43,125 |
| Graduate Degree | - | - |
| Total | $47,436 | $44,191 |
Family Income in Athens
Family Income Brackets in Athens
According to the Athens family income data, there are 145 families falling into the $100,000 to $149,999 income range, which is the most common income bracket and makes up 21.6% of all families. Conversely, the $15,000 to $24,999 income bracket is the least frequent group with only 6 families (0.9%) belonging to this category.
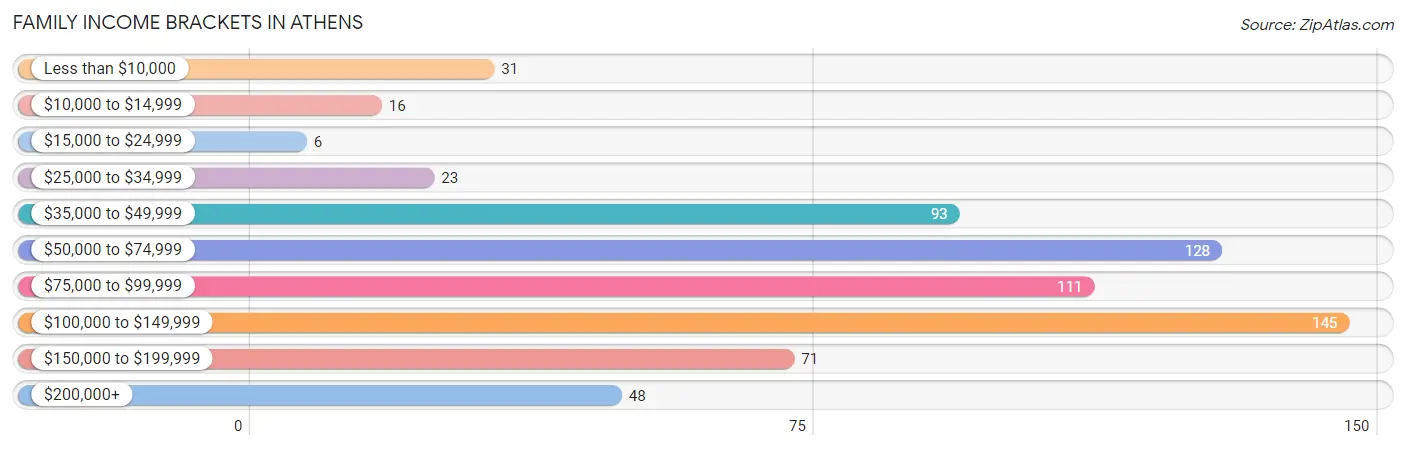
| Income Bracket | # Families | % Families |
| Less than $10,000 | 31 | 4.6% |
| $10,000 to $14,999 | 16 | 2.4% |
| $15,000 to $24,999 | 6 | 0.9% |
| $25,000 to $34,999 | 23 | 3.4% |
| $35,000 to $49,999 | 93 | 13.8% |
| $50,000 to $74,999 | 128 | 19.0% |
| $75,000 to $99,999 | 111 | 16.5% |
| $100,000 to $149,999 | 145 | 21.6% |
| $150,000 to $199,999 | 71 | 10.6% |
| $200,000+ | 48 | 7.1% |
Family Income by Famaliy Size in Athens
4-person families (94 | 14.0%) account for the highest median family income in Athens with $90,625 per family, while 2-person families (319 | 47.5%) have the highest median income of $43,990 per family member.
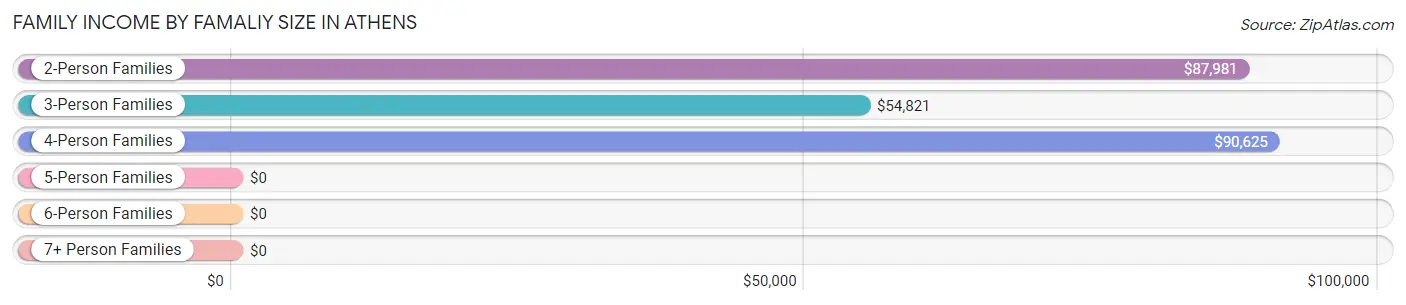
| Income Bracket | # Families | Median Income |
| 2-Person Families | 319 (47.5%) | $87,981 |
| 3-Person Families | 209 (31.1%) | $54,821 |
| 4-Person Families | 94 (14.0%) | $90,625 |
| 5-Person Families | 38 (5.7%) | $0 |
| 6-Person Families | 12 (1.8%) | $0 |
| 7+ Person Families | 0 (0.0%) | $0 |
| Total | 672 (100.0%) | $83,125 |
Family Income by Number of Earners in Athens
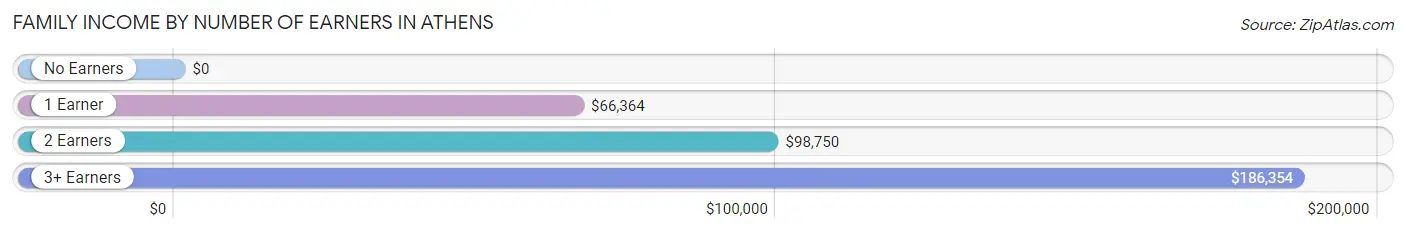
| Number of Earners | # Families | Median Income |
| No Earners | 54 (8.0%) | $0 |
| 1 Earner | 238 (35.4%) | $66,364 |
| 2 Earners | 345 (51.3%) | $98,750 |
| 3+ Earners | 35 (5.2%) | $186,354 |
| Total | 672 (100.0%) | $83,125 |
Household Income in Athens
Household Income Brackets in Athens
With 212 households falling in the category, the $100,000 to $149,999 income range is the most frequent in Athens, accounting for 22.6% of all households. In contrast, only 44 households (4.7%) fall into the less than $10,000 income bracket, making it the least populous group.
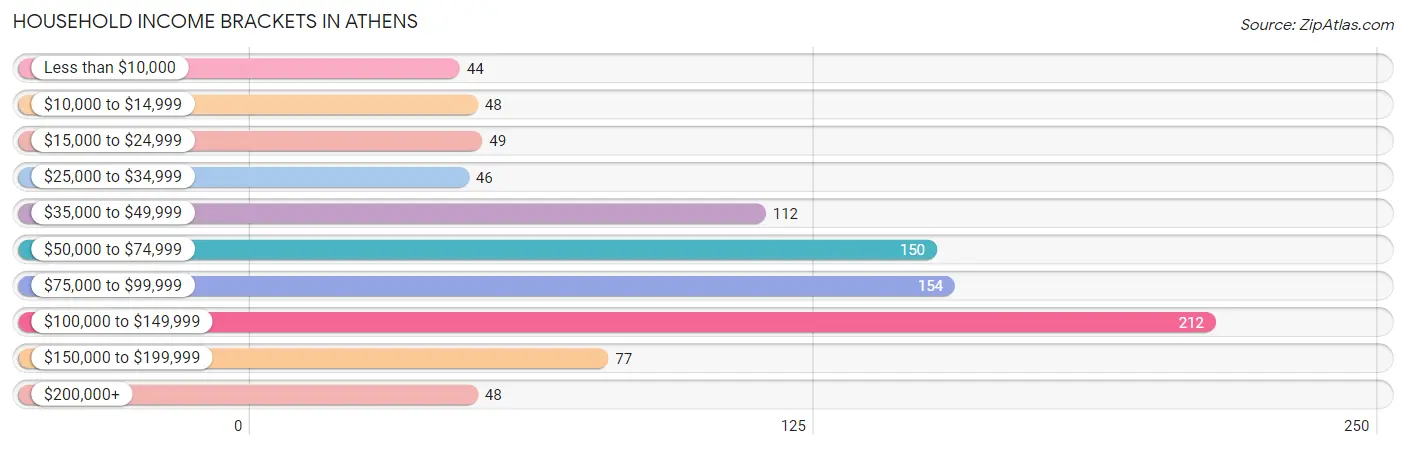
| Income Bracket | # Households | % Households |
| Less than $10,000 | 44 | 4.7% |
| $10,000 to $14,999 | 48 | 5.1% |
| $15,000 to $24,999 | 49 | 5.2% |
| $25,000 to $34,999 | 46 | 4.9% |
| $35,000 to $49,999 | 112 | 11.9% |
| $50,000 to $74,999 | 150 | 16.0% |
| $75,000 to $99,999 | 154 | 16.4% |
| $100,000 to $149,999 | 212 | 22.6% |
| $150,000 to $199,999 | 77 | 8.2% |
| $200,000+ | 48 | 5.1% |
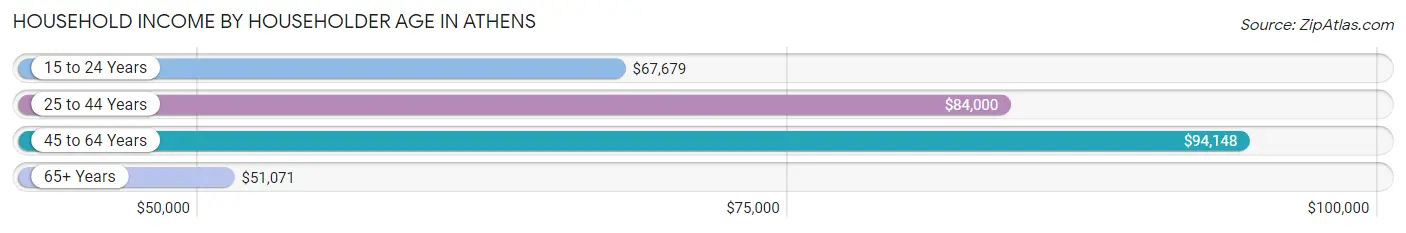
Household Income by Householder Age in Athens
The median household income in Athens is $78,542, with the highest median household income of $94,148 found in the 45 to 64 years age bracket for the primary householder. A total of 375 households (39.9%) fall into this category. Meanwhile, the 65+ years age bracket for the primary householder has the lowest median household income of $51,071, with 182 households (19.4%) in this group.
| Income Bracket | # Households | Median Income |
| 15 to 24 Years | 51 (5.4%) | $67,679 |
| 25 to 44 Years | 332 (35.3%) | $84,000 |
| 45 to 64 Years | 375 (39.9%) | $94,148 |
| 65+ Years | 182 (19.4%) | $51,071 |
| Total | 940 (100.0%) | $78,542 |
Poverty in Athens
Income Below Poverty by Sex and Age in Athens
With 12.6% poverty level for males and 9.2% for females among the residents of Athens, 16 and 17 year old males and 35 to 44 year old females are the most vulnerable to poverty, with 19 males (37.2%) and 35 females (22.2%) in their respective age groups living below the poverty level.
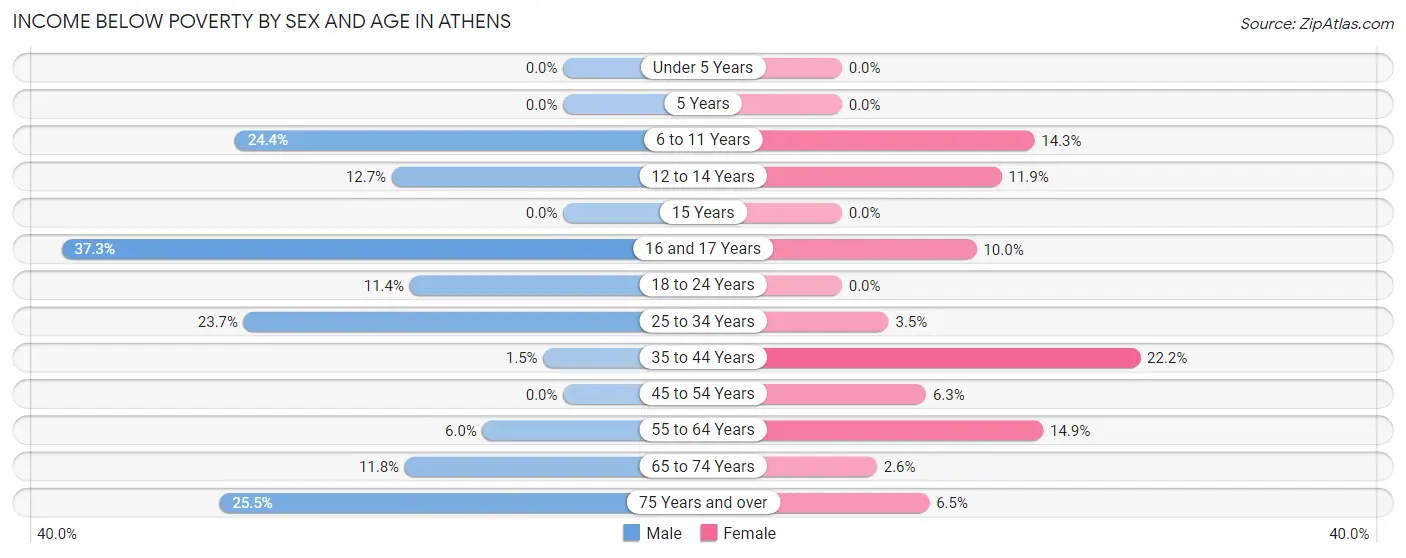
| Age Bracket | Male | Female |
| Under 5 Years | 0 (0.0%) | 0 (0.0%) |
| 5 Years | 0 (0.0%) | 0 (0.0%) |
| 6 to 11 Years | 30 (24.4%) | 12 (14.3%) |
| 12 to 14 Years | 7 (12.7%) | 14 (11.9%) |
| 15 Years | 0 (0.0%) | 0 (0.0%) |
| 16 and 17 Years | 19 (37.2%) | 4 (10.0%) |
| 18 to 24 Years | 13 (11.4%) | 0 (0.0%) |
| 25 to 34 Years | 37 (23.7%) | 5 (3.5%) |
| 35 to 44 Years | 2 (1.5%) | 35 (22.2%) |
| 45 to 54 Years | 0 (0.0%) | 9 (6.2%) |
| 55 to 64 Years | 10 (6.0%) | 36 (14.9%) |
| 65 to 74 Years | 4 (11.8%) | 2 (2.6%) |
| 75 Years and over | 12 (25.5%) | 5 (6.5%) |
| Total | 134 (12.6%) | 122 (9.2%) |
Income Above Poverty by Sex and Age in Athens
According to the poverty statistics in Athens, males aged under 5 years and females aged under 5 years are the age groups that are most secure financially, with 100.0% of males and 100.0% of females in these age groups living above the poverty line.
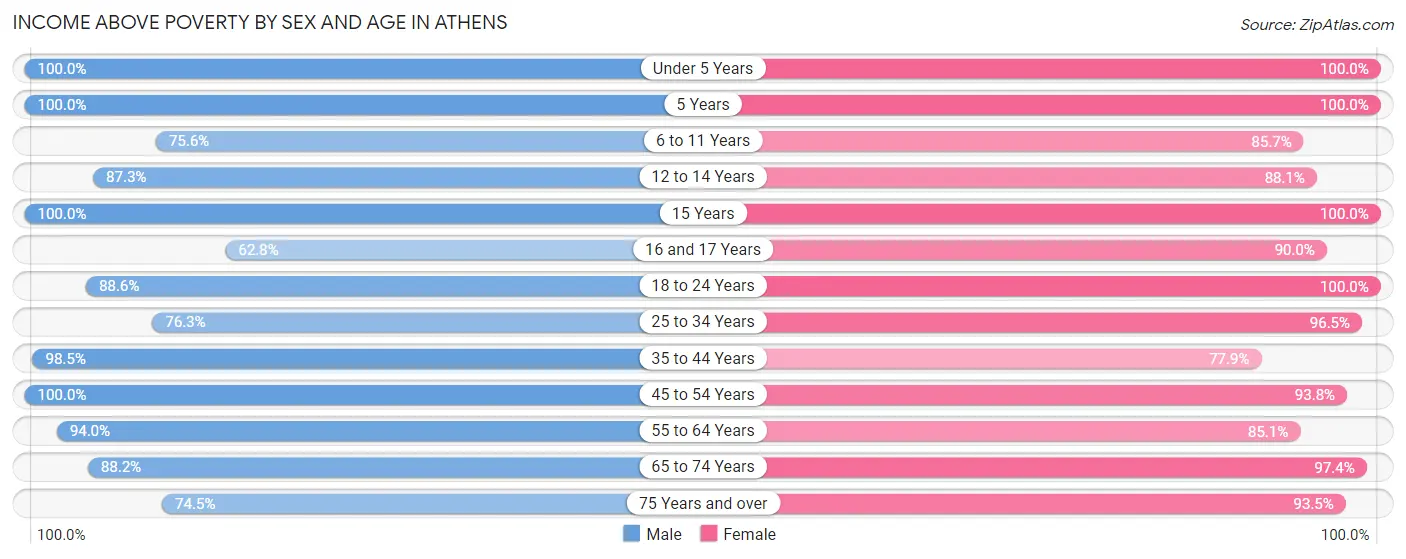
| Age Bracket | Male | Female |
| Under 5 Years | 32 (100.0%) | 76 (100.0%) |
| 5 Years | 51 (100.0%) | 12 (100.0%) |
| 6 to 11 Years | 93 (75.6%) | 72 (85.7%) |
| 12 to 14 Years | 48 (87.3%) | 104 (88.1%) |
| 15 Years | 18 (100.0%) | 40 (100.0%) |
| 16 and 17 Years | 32 (62.7%) | 36 (90.0%) |
| 18 to 24 Years | 101 (88.6%) | 109 (100.0%) |
| 25 to 34 Years | 119 (76.3%) | 139 (96.5%) |
| 35 to 44 Years | 133 (98.5%) | 123 (77.8%) |
| 45 to 54 Years | 83 (100.0%) | 135 (93.8%) |
| 55 to 64 Years | 157 (94.0%) | 205 (85.1%) |
| 65 to 74 Years | 30 (88.2%) | 75 (97.4%) |
| 75 Years and over | 35 (74.5%) | 72 (93.5%) |
| Total | 932 (87.4%) | 1,198 (90.8%) |
Income Below Poverty Among Married-Couple Families in Athens
The poverty statistics for married-couple families in Athens show that 2.3% or 10 of the total 441 families live below the poverty line. Families with 1 or 2 children have the highest poverty rate of 5.8%, comprising of 10 families. On the other hand, families with no children have the lowest poverty rate of 0.0%, which includes 0 families.
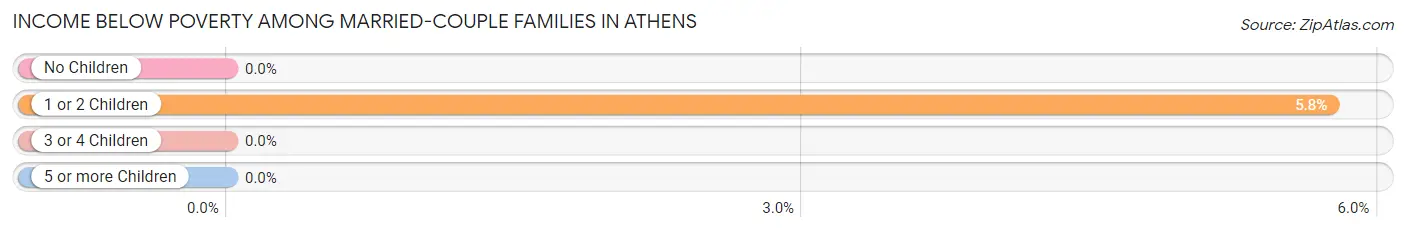
| Children | Above Poverty | Below Poverty |
| No Children | 239 (100.0%) | 0 (0.0%) |
| 1 or 2 Children | 164 (94.3%) | 10 (5.8%) |
| 3 or 4 Children | 28 (100.0%) | 0 (0.0%) |
| 5 or more Children | 0 (0.0%) | 0 (0.0%) |
| Total | 431 (97.7%) | 10 (2.3%) |
Income Below Poverty Among Single-Parent Households in Athens
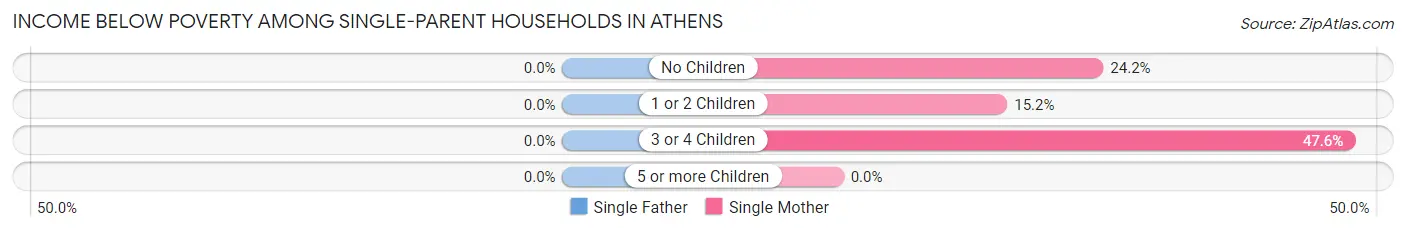
| Children | Single Father | Single Mother |
| No Children | 0 (0.0%) | 15 (24.2%) |
| 1 or 2 Children | 0 (0.0%) | 16 (15.2%) |
| 3 or 4 Children | 0 (0.0%) | 10 (47.6%) |
| 5 or more Children | 0 (0.0%) | 0 (0.0%) |
| Total | 0 (0.0%) | 41 (21.8%) |
Income Below Poverty Among Married-Couple vs Single-Parent Households in Athens
The poverty data for Athens shows that 10 of the married-couple family households (2.3%) and 41 of the single-parent households (17.7%) are living below the poverty level. Within the married-couple family households, those with 1 or 2 children have the highest poverty rate, with 10 households (5.8%) falling below the poverty line. Among the single-parent households, those with 3 or 4 children have the highest poverty rate, with 10 household (47.6%) living below poverty.
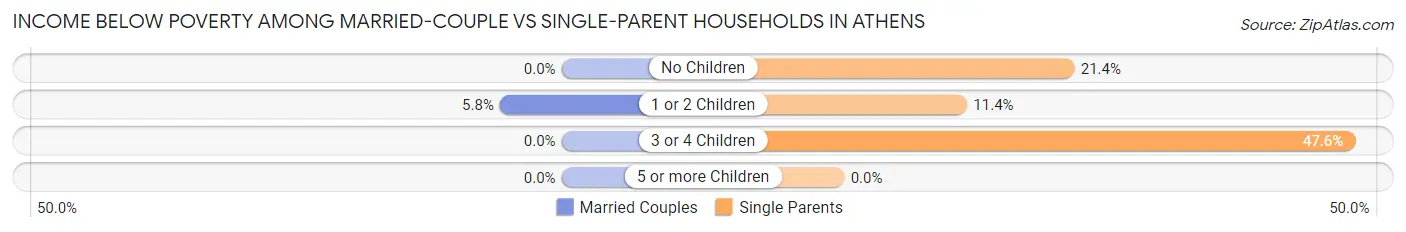
| Children | Married-Couple Families | Single-Parent Households |
| No Children | 0 (0.0%) | 15 (21.4%) |
| 1 or 2 Children | 10 (5.8%) | 16 (11.4%) |
| 3 or 4 Children | 0 (0.0%) | 10 (47.6%) |
| 5 or more Children | 0 (0.0%) | 0 (0.0%) |
| Total | 10 (2.3%) | 41 (17.7%) |
Race in Athens
The most populous races in Athens are White / Caucasian (2,135 | 89.0%), Two or more Races (131 | 5.5%), and Black / African American (101 | 4.2%).
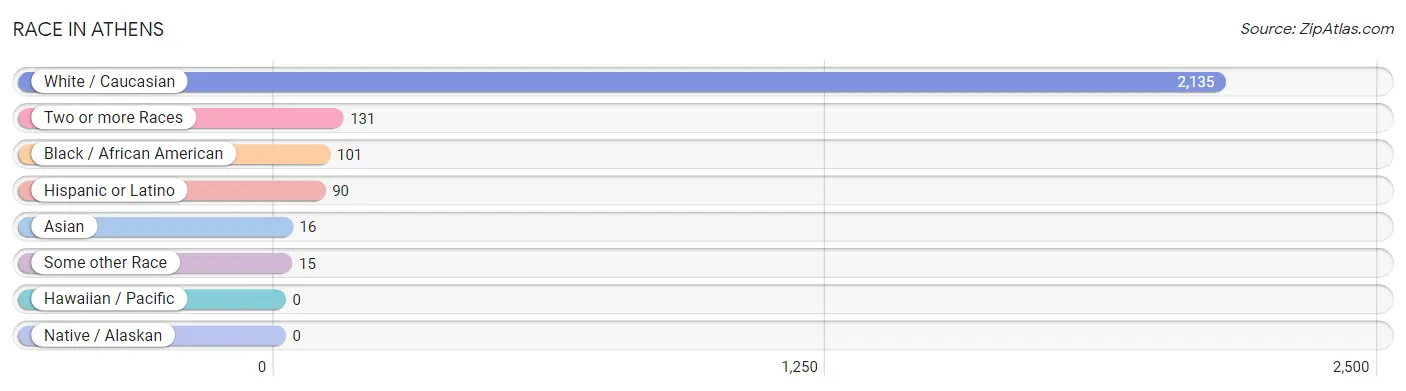
| Race | # Population | % Population |
| Asian | 16 | 0.7% |
| Black / African American | 101 | 4.2% |
| Hawaiian / Pacific | 0 | 0.0% |
| Hispanic or Latino | 90 | 3.7% |
| Native / Alaskan | 0 | 0.0% |
| White / Caucasian | 2,135 | 89.0% |
| Two or more Races | 131 | 5.5% |
| Some other Race | 15 | 0.6% |
| Total | 2,398 | 100.0% |
Ancestry in Athens
The most populous ancestries reported in Athens are German (555 | 23.1%), Irish (369 | 15.4%), English (235 | 9.8%), American (199 | 8.3%), and Italian (84 | 3.5%), together accounting for 60.1% of all Athens residents.
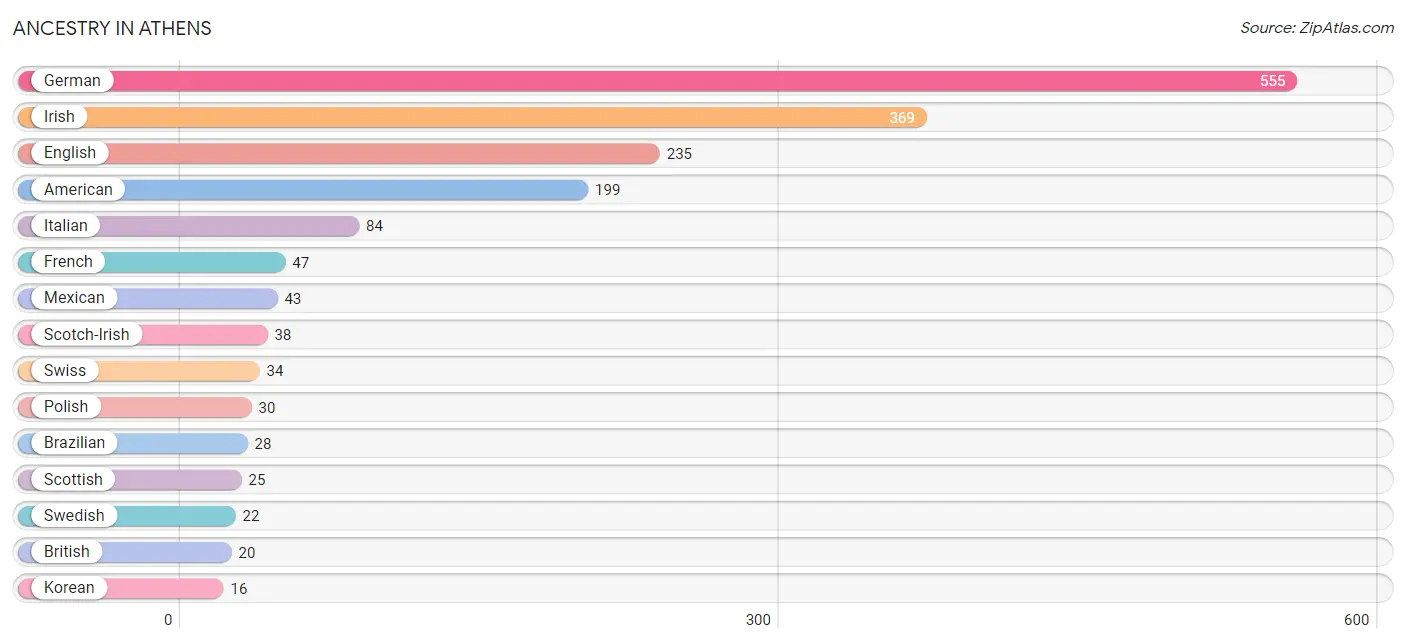
| Ancestry | # Population | % Population |
| American | 199 | 8.3% |
| Austrian | 4 | 0.2% |
| Bahamian | 3 | 0.1% |
| Brazilian | 28 | 1.2% |
| British | 20 | 0.8% |
| Czechoslovakian | 2 | 0.1% |
| Dutch | 4 | 0.2% |
| English | 235 | 9.8% |
| European | 3 | 0.1% |
| French | 47 | 2.0% |
| German | 555 | 23.1% |
| Hungarian | 2 | 0.1% |
| Irish | 369 | 15.4% |
| Italian | 84 | 3.5% |
| Korean | 16 | 0.7% |
| Lithuanian | 14 | 0.6% |
| Mexican | 43 | 1.8% |
| Norwegian | 11 | 0.5% |
| Polish | 30 | 1.3% |
| Russian | 5 | 0.2% |
| Scotch-Irish | 38 | 1.6% |
| Scottish | 25 | 1.0% |
| Slovak | 5 | 0.2% |
| Swedish | 22 | 0.9% |
| Swiss | 34 | 1.4% | View All 25 Rows |
Immigrants in Athens
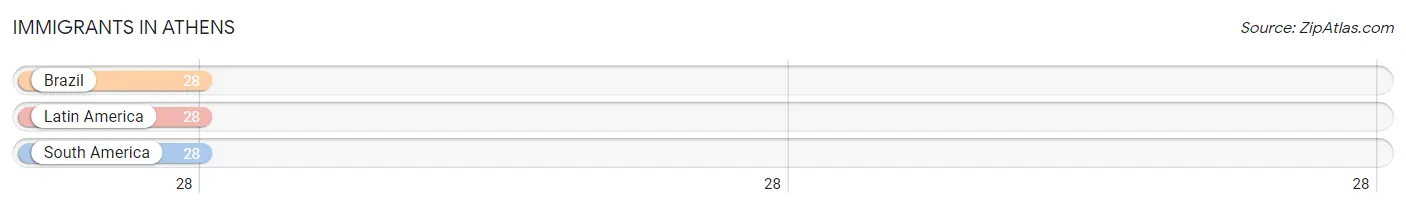
The most numerous immigrant groups reported in Athens came from Brazil (28 | 1.2%), Latin America (28 | 1.2%), and South America (28 | 1.2%), together accounting for 3.5% of all Athens residents.
| Immigration Origin | # Population | % Population |
| Brazil | 28 | 1.2% |
| Latin America | 28 | 1.2% |
| South America | 28 | 1.2% | View All 3 Rows |
Sex and Age in Athens
Sex and Age in Athens
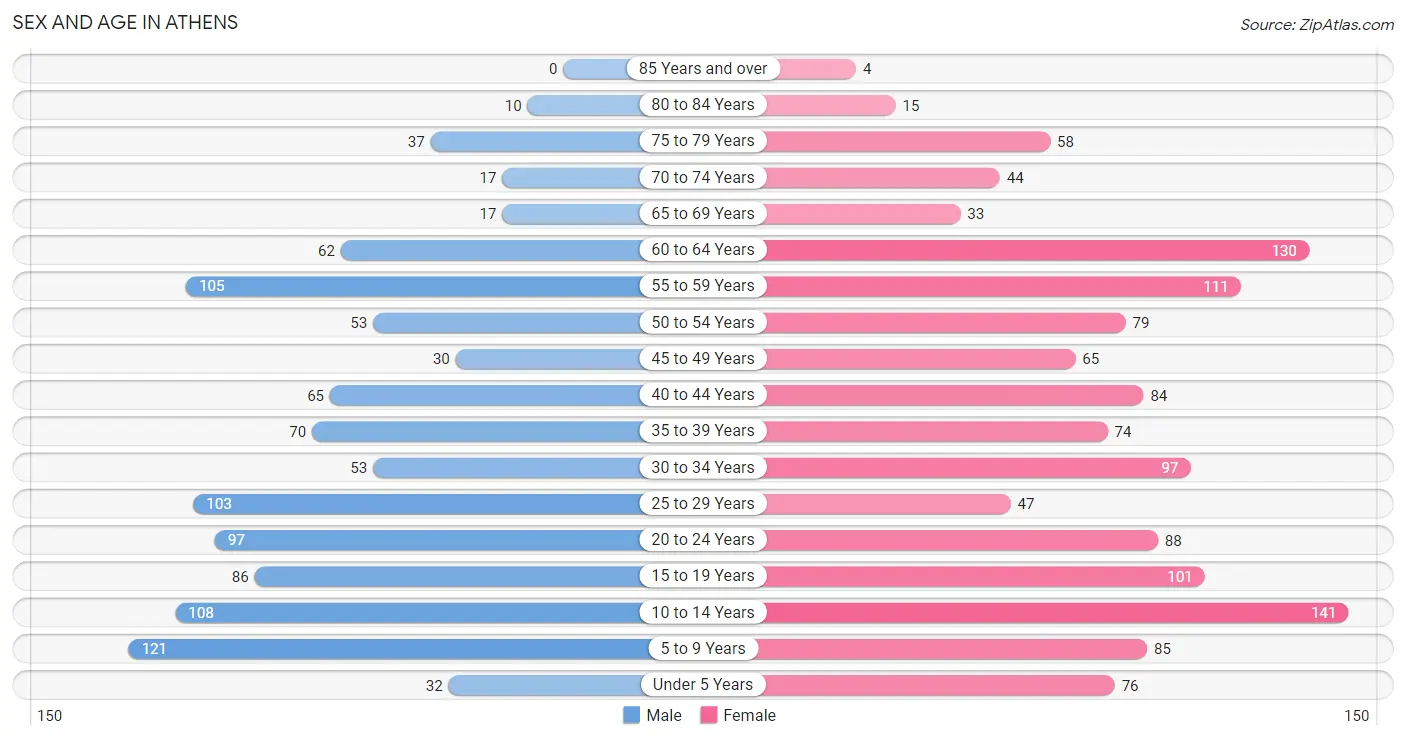
The most populous age groups in Athens are 5 to 9 Years (121 | 11.4%) for men and 10 to 14 Years (141 | 10.6%) for women.
| Age Bracket | Male | Female |
| Under 5 Years | 32 (3.0%) | 76 (5.7%) |
| 5 to 9 Years | 121 (11.4%) | 85 (6.4%) |
| 10 to 14 Years | 108 (10.1%) | 141 (10.6%) |
| 15 to 19 Years | 86 (8.1%) | 101 (7.6%) |
| 20 to 24 Years | 97 (9.1%) | 88 (6.6%) |
| 25 to 29 Years | 103 (9.7%) | 47 (3.5%) |
| 30 to 34 Years | 53 (5.0%) | 97 (7.3%) |
| 35 to 39 Years | 70 (6.6%) | 74 (5.6%) |
| 40 to 44 Years | 65 (6.1%) | 84 (6.3%) |
| 45 to 49 Years | 30 (2.8%) | 65 (4.9%) |
| 50 to 54 Years | 53 (5.0%) | 79 (5.9%) |
| 55 to 59 Years | 105 (9.9%) | 111 (8.3%) |
| 60 to 64 Years | 62 (5.8%) | 130 (9.8%) |
| 65 to 69 Years | 17 (1.6%) | 33 (2.5%) |
| 70 to 74 Years | 17 (1.6%) | 44 (3.3%) |
| 75 to 79 Years | 37 (3.5%) | 58 (4.3%) |
| 80 to 84 Years | 10 (0.9%) | 15 (1.1%) |
| 85 Years and over | 0 (0.0%) | 4 (0.3%) |
| Total | 1,066 (100.0%) | 1,332 (100.0%) |
Families and Households in Athens
Median Family Size in Athens
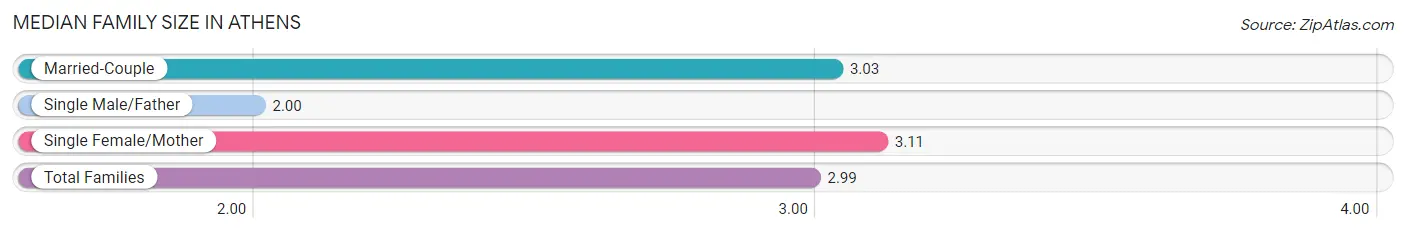
The median family size in Athens is 2.99 persons per family, with single female/mother families (188 | 28.0%) accounting for the largest median family size of 3.11 persons per family. On the other hand, single male/father families (43 | 6.4%) represent the smallest median family size with 2.00 persons per family.
| Family Type | # Families | Family Size |
| Married-Couple | 441 (65.6%) | 3.03 |
| Single Male/Father | 43 (6.4%) | 2.00 |
| Single Female/Mother | 188 (28.0%) | 3.11 |
| Total Families | 672 (100.0%) | 2.99 |
Median Household Size in Athens
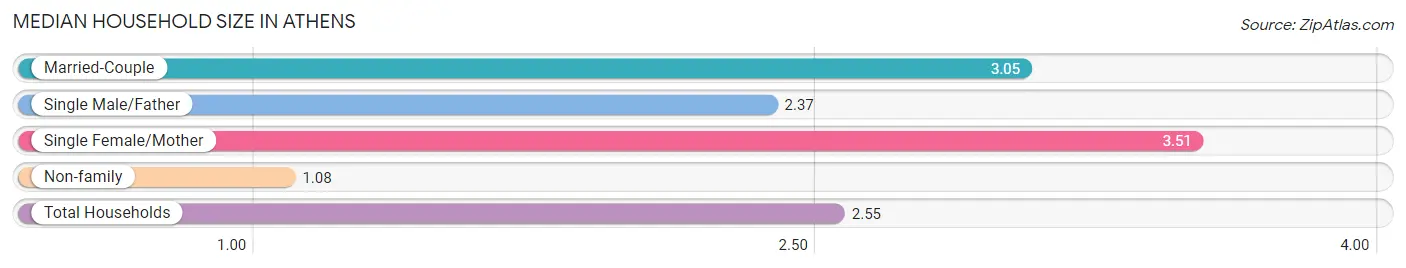
The median household size in Athens is 2.55 persons per household, with single female/mother households (188 | 20.0%) accounting for the largest median household size of 3.51 persons per household. non-family households (268 | 28.5%) represent the smallest median household size with 1.08 persons per household.
| Household Type | # Households | Household Size |
| Married-Couple | 441 (46.9%) | 3.05 |
| Single Male/Father | 43 (4.6%) | 2.37 |
| Single Female/Mother | 188 (20.0%) | 3.51 |
| Non-family | 268 (28.5%) | 1.08 |
| Total Households | 940 (100.0%) | 2.55 |
Household Size by Marriage Status in Athens
Out of a total of 940 households in Athens, 672 (71.5%) are family households, while 268 (28.5%) are nonfamily households. The most numerous type of family households are 2-person households, comprising 269, and the most common type of nonfamily households are 1-person households, comprising 244.
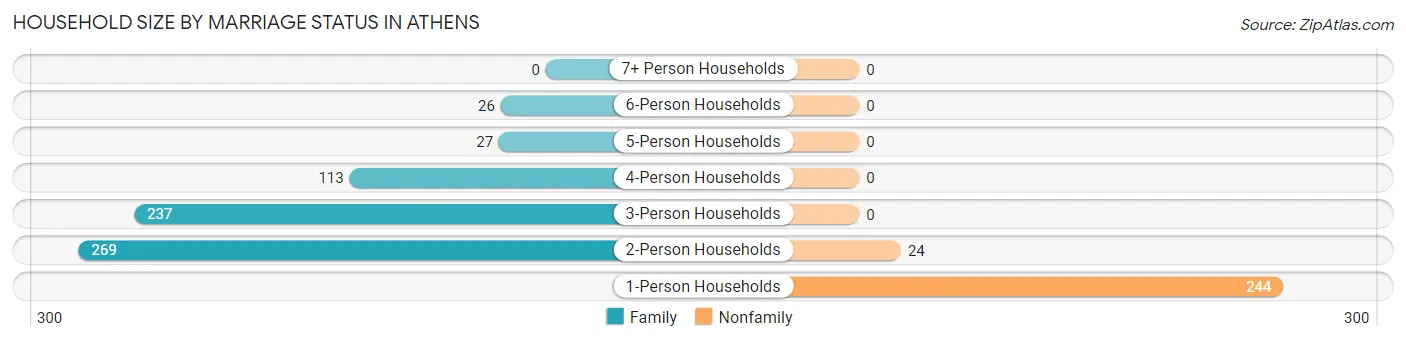
| Household Size | Family Households | Nonfamily Households |
| 1-Person Households | - | 244 (26.0%) |
| 2-Person Households | 269 (28.6%) | 24 (2.5%) |
| 3-Person Households | 237 (25.2%) | 0 (0.0%) |
| 4-Person Households | 113 (12.0%) | 0 (0.0%) |
| 5-Person Households | 27 (2.9%) | 0 (0.0%) |
| 6-Person Households | 26 (2.8%) | 0 (0.0%) |
| 7+ Person Households | 0 (0.0%) | 0 (0.0%) |
| Total | 672 (71.5%) | 268 (28.5%) |
Female Fertility in Athens
Fertility by Age in Athens
Average fertility rate in Athens is 36.0 births per 1,000 women. Women in the age bracket of 20 to 34 years have the highest fertility rate with 86.0 births per 1,000 women. Women in the age bracket of 20 to 34 years acount for 100.0% of all women with births.
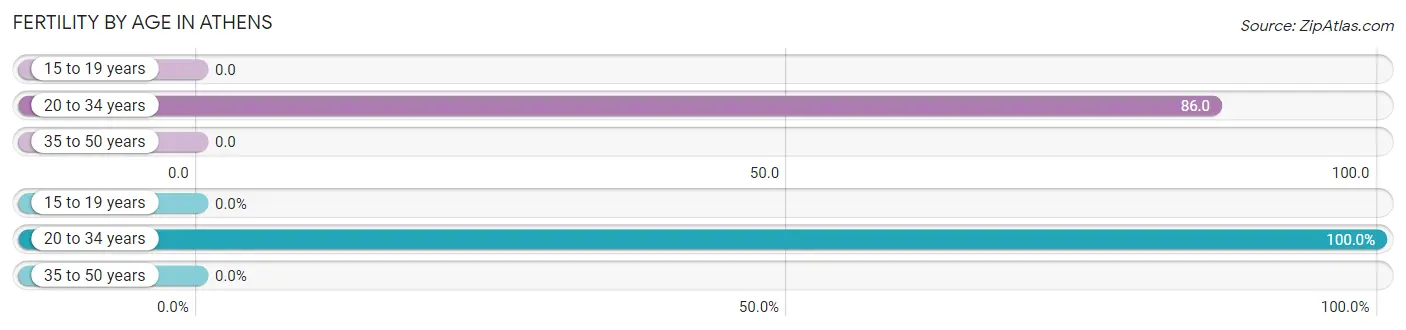
| Age Bracket | Women with Births | Births / 1,000 Women |
| 15 to 19 years | 0 (0.0%) | 0.0 |
| 20 to 34 years | 20 (100.0%) | 86.0 |
| 35 to 50 years | 0 (0.0%) | 0.0 |
| Total | 20 (100.0%) | 36.0 |
Fertility by Age by Marriage Status in Athens
80.0% of women with births (20) in Athens are married. The highest percentage of unmarried women with births falls into 20 to 34 years age bracket with 20.0% of them unmarried at the time of birth, while the lowest percentage of unmarried women with births belong to 20 to 34 years age bracket with 20.0% of them unmarried.
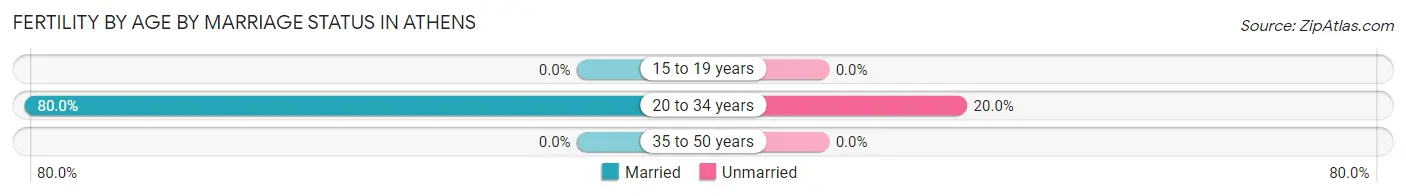
| Age Bracket | Married | Unmarried |
| 15 to 19 years | 0 (0.0%) | 0 (0.0%) |
| 20 to 34 years | 16 (80.0%) | 4 (20.0%) |
| 35 to 50 years | 0 (0.0%) | 0 (0.0%) |
| Total | 16 (80.0%) | 4 (20.0%) |
Fertility by Education in Athens
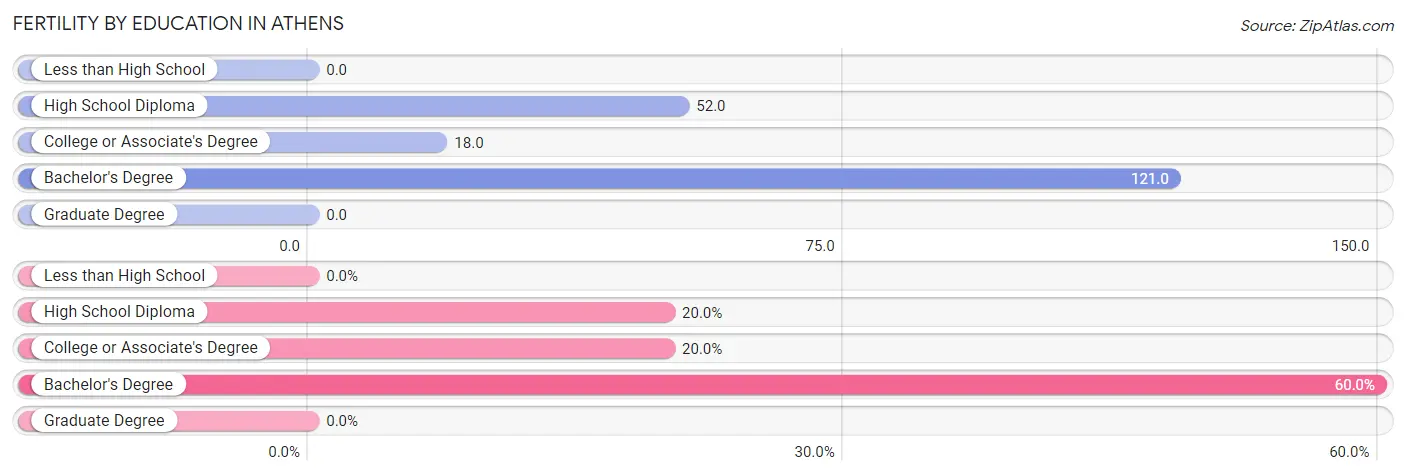
| Educational Attainment | Women with Births | Births / 1,000 Women |
| Less than High School | 0 (0.0%) | 0.0 |
| High School Diploma | 4 (20.0%) | 52.0 |
| College or Associate's Degree | 4 (20.0%) | 18.0 |
| Bachelor's Degree | 12 (60.0%) | 121.0 |
| Graduate Degree | 0 (0.0%) | 0.0 |
| Total | 20 (100.0%) | 36.0 |
Fertility by Education by Marriage Status in Athens
20.0% of women with births in Athens are unmarried. Women with the educational attainment of college or associate's degree are most likely to be married with 100.0% of them married at childbirth, while women with the educational attainment of high school diploma are least likely to be married with 100.0% of them unmarried at childbirth.
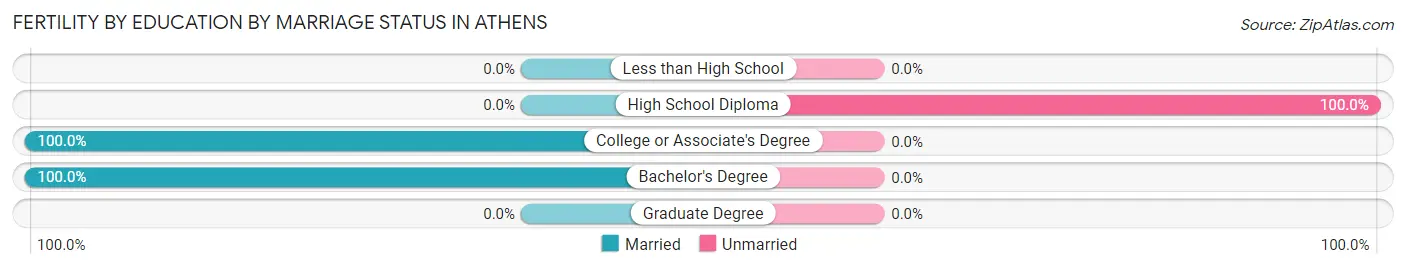
| Educational Attainment | Married | Unmarried |
| Less than High School | 0 (0.0%) | 0 (0.0%) |
| High School Diploma | 0 (0.0%) | 4 (100.0%) |
| College or Associate's Degree | 4 (100.0%) | 0 (0.0%) |
| Bachelor's Degree | 12 (100.0%) | 0 (0.0%) |
| Graduate Degree | 0 (0.0%) | 0 (0.0%) |
| Total | 16 (80.0%) | 4 (20.0%) |
Employment Characteristics in Athens
Employment by Class of Employer in Athens
Among the 1,201 employed individuals in Athens, private company employees (718 | 59.8%), state government employees (198 | 16.5%), and not-for-profit organizations (130 | 10.8%) make up the most common classes of employment.
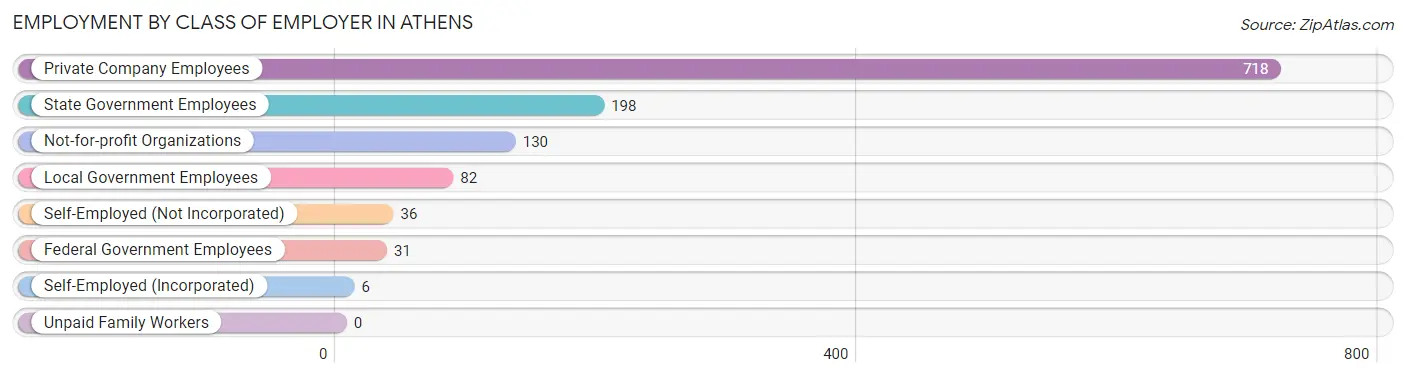
| Employer Class | # Employees | % Employees |
| Private Company Employees | 718 | 59.8% |
| Self-Employed (Incorporated) | 6 | 0.5% |
| Self-Employed (Not Incorporated) | 36 | 3.0% |
| Not-for-profit Organizations | 130 | 10.8% |
| Local Government Employees | 82 | 6.8% |
| State Government Employees | 198 | 16.5% |
| Federal Government Employees | 31 | 2.6% |
| Unpaid Family Workers | 0 | 0.0% |
| Total | 1,201 | 100.0% |
Employment Status by Age in Athens
According to the labor force statistics for Athens, out of the total population over 16 years of age (1,777), 73.8% or 1,311 individuals are in the labor force, with 7.1% or 93 of them unemployed. The age group with the highest labor force participation rate is 20 to 24 years, with 100.0% or 185 individuals in the labor force. Within the labor force, the 65 to 74 years age range has the highest percentage of unemployed individuals, with 19.0% or 8 of them being unemployed.
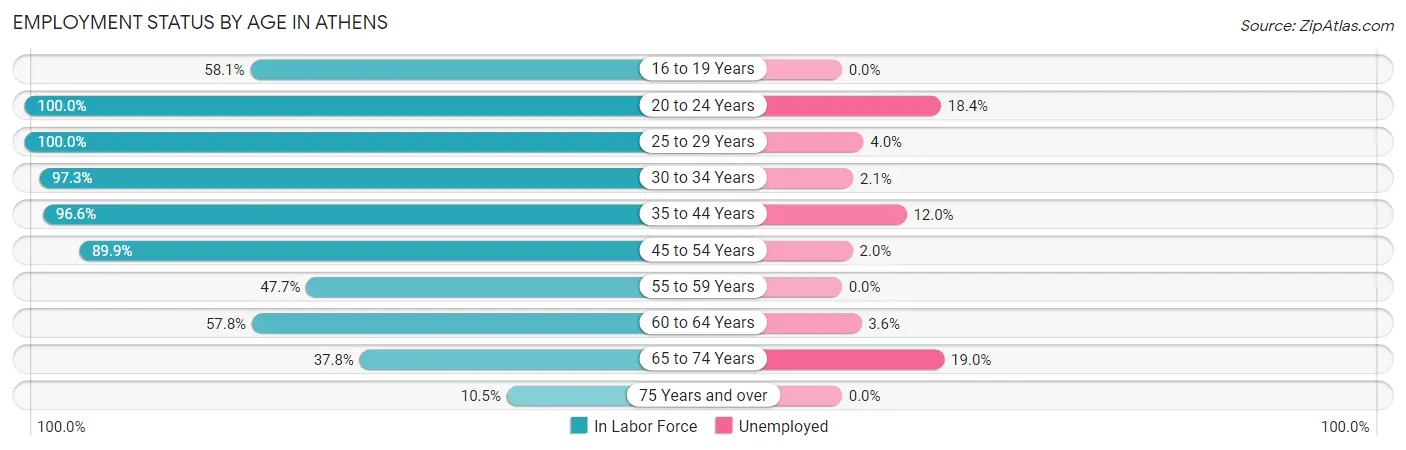
| Age Bracket | In Labor Force | Unemployed |
| 16 to 19 Years | 75 (58.1%) | 0 (0.0%) |
| 20 to 24 Years | 185 (100.0%) | 34 (18.4%) |
| 25 to 29 Years | 150 (100.0%) | 6 (4.0%) |
| 30 to 34 Years | 146 (97.3%) | 3 (2.1%) |
| 35 to 44 Years | 283 (96.6%) | 34 (12.0%) |
| 45 to 54 Years | 204 (89.9%) | 4 (2.0%) |
| 55 to 59 Years | 103 (47.7%) | 0 (0.0%) |
| 60 to 64 Years | 111 (57.8%) | 4 (3.6%) |
| 65 to 74 Years | 42 (37.8%) | 8 (19.0%) |
| 75 Years and over | 13 (10.5%) | 0 (0.0%) |
| Total | 1,311 (73.8%) | 93 (7.1%) |
Employment Status by Educational Attainment in Athens
According to labor force statistics for Athens, 81.2% of individuals (997) out of the total population between 25 and 64 years of age (1,228) are in the labor force, with 5.1% or 51 of them being unemployed. The group with the highest labor force participation rate are those with the educational attainment of bachelor's degree or higher, with 100.0% or 306 individuals in the labor force. Within the labor force, individuals with college / associate degree education have the highest percentage of unemployment, with 10.1% or 44 of them being unemployed.
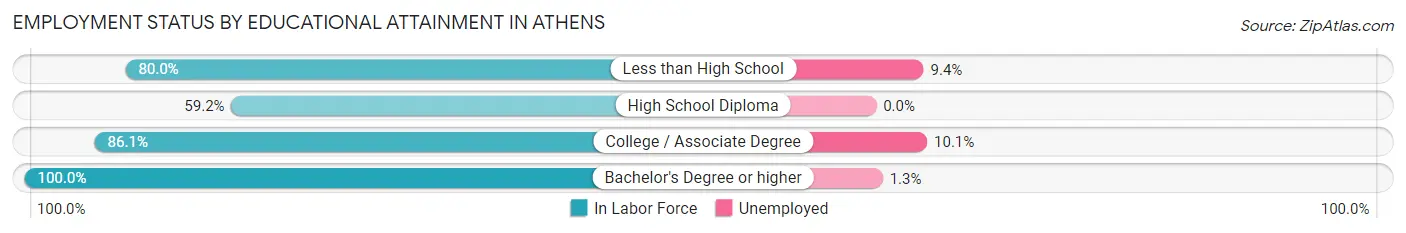
| Educational Attainment | In Labor Force | Unemployed |
| Less than High School | 32 (80.0%) | 4 (9.4%) |
| High School Diploma | 221 (59.2%) | 0 (0.0%) |
| College / Associate Degree | 438 (86.1%) | 51 (10.1%) |
| Bachelor's Degree or higher | 306 (100.0%) | 4 (1.3%) |
| Total | 997 (81.2%) | 63 (5.1%) |
Employment Occupations by Sex in Athens
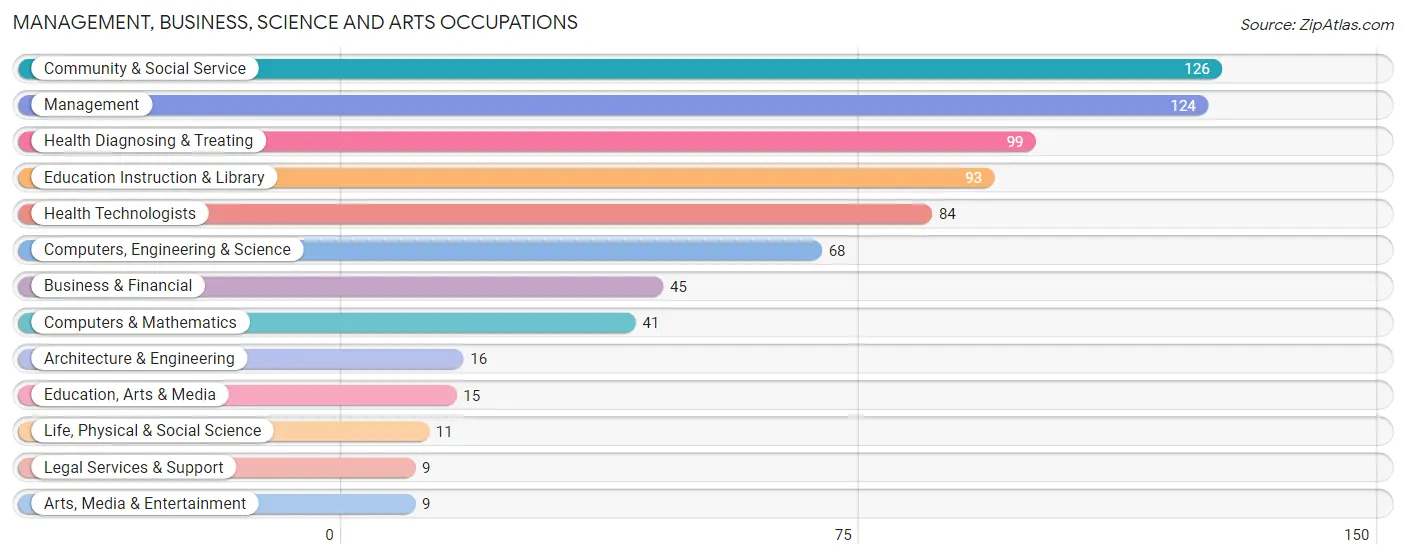
Management, Business, Science and Arts Occupations
The most common Management, Business, Science and Arts occupations in Athens are Community & Social Service (126 | 10.4%), Management (124 | 10.2%), Health Diagnosing & Treating (99 | 8.2%), Education Instruction & Library (93 | 7.6%), and Health Technologists (84 | 6.9%).
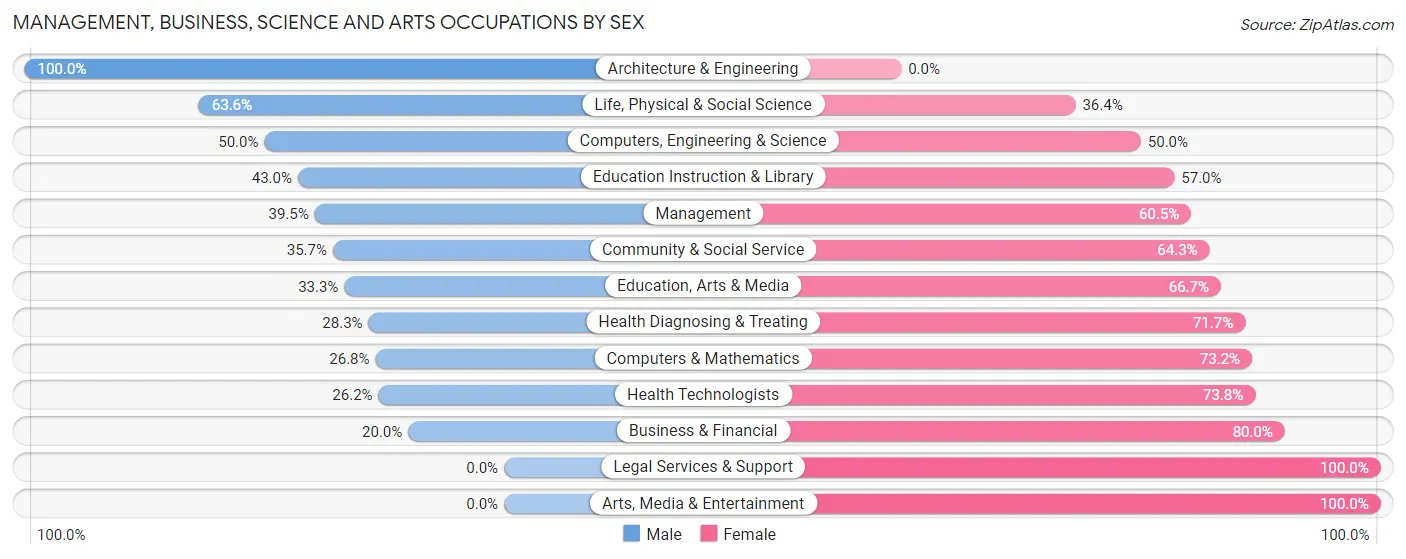
Management, Business, Science and Arts Occupations by Sex
Within the Management, Business, Science and Arts occupations in Athens, the most male-oriented occupations are Architecture & Engineering (100.0%), Life, Physical & Social Science (63.6%), and Computers, Engineering & Science (50.0%), while the most female-oriented occupations are Legal Services & Support (100.0%), Arts, Media & Entertainment (100.0%), and Business & Financial (80.0%).
| Occupation | Male | Female |
| Management | 49 (39.5%) | 75 (60.5%) |
| Business & Financial | 9 (20.0%) | 36 (80.0%) |
| Computers, Engineering & Science | 34 (50.0%) | 34 (50.0%) |
| Computers & Mathematics | 11 (26.8%) | 30 (73.2%) |
| Architecture & Engineering | 16 (100.0%) | 0 (0.0%) |
| Life, Physical & Social Science | 7 (63.6%) | 4 (36.4%) |
| Community & Social Service | 45 (35.7%) | 81 (64.3%) |
| Education, Arts & Media | 5 (33.3%) | 10 (66.7%) |
| Legal Services & Support | 0 (0.0%) | 9 (100.0%) |
| Education Instruction & Library | 40 (43.0%) | 53 (57.0%) |
| Arts, Media & Entertainment | 0 (0.0%) | 9 (100.0%) |
| Health Diagnosing & Treating | 28 (28.3%) | 71 (71.7%) |
| Health Technologists | 22 (26.2%) | 62 (73.8%) |
| Total (Category) | 165 (35.7%) | 297 (64.3%) |
| Total (Overall) | 553 (45.5%) | 662 (54.5%) |
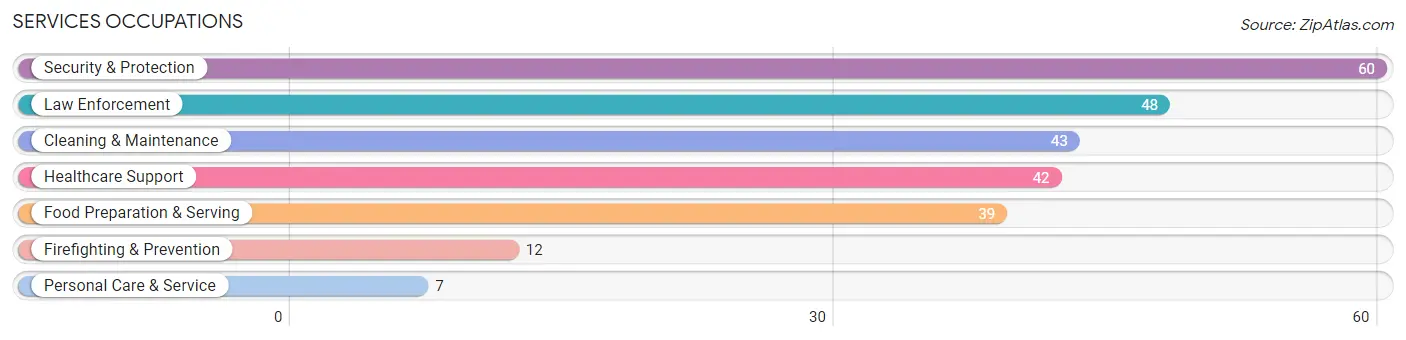
Services Occupations
The most common Services occupations in Athens are Security & Protection (60 | 4.9%), Law Enforcement (48 | 4.0%), Cleaning & Maintenance (43 | 3.5%), Healthcare Support (42 | 3.5%), and Food Preparation & Serving (39 | 3.2%).
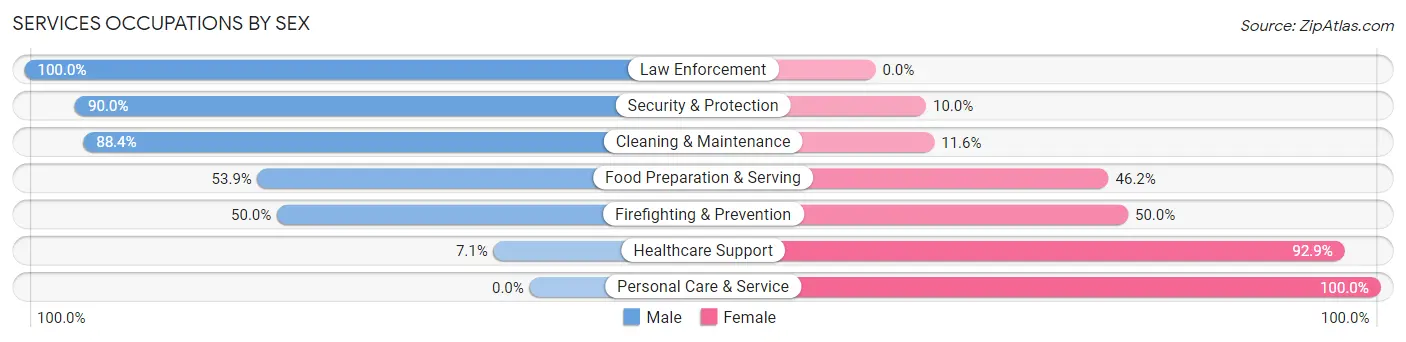
Services Occupations by Sex
Within the Services occupations in Athens, the most male-oriented occupations are Law Enforcement (100.0%), Security & Protection (90.0%), and Cleaning & Maintenance (88.4%), while the most female-oriented occupations are Personal Care & Service (100.0%), Healthcare Support (92.9%), and Firefighting & Prevention (50.0%).
| Occupation | Male | Female |
| Healthcare Support | 3 (7.1%) | 39 (92.9%) |
| Security & Protection | 54 (90.0%) | 6 (10.0%) |
| Firefighting & Prevention | 6 (50.0%) | 6 (50.0%) |
| Law Enforcement | 48 (100.0%) | 0 (0.0%) |
| Food Preparation & Serving | 21 (53.8%) | 18 (46.2%) |
| Cleaning & Maintenance | 38 (88.4%) | 5 (11.6%) |
| Personal Care & Service | 0 (0.0%) | 7 (100.0%) |
| Total (Category) | 116 (60.7%) | 75 (39.3%) |
| Total (Overall) | 553 (45.5%) | 662 (54.5%) |
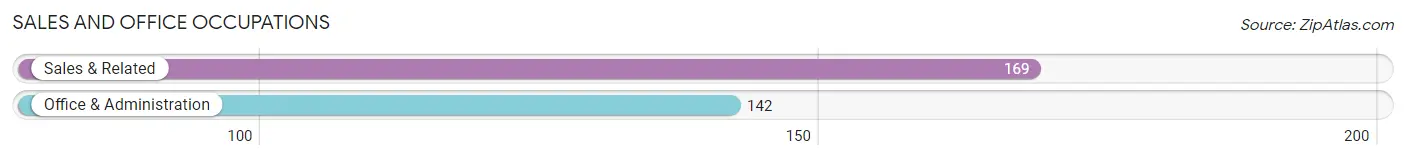
Sales and Office Occupations
The most common Sales and Office occupations in Athens are Sales & Related (169 | 13.9%), and Office & Administration (142 | 11.7%).
Sales and Office Occupations by Sex
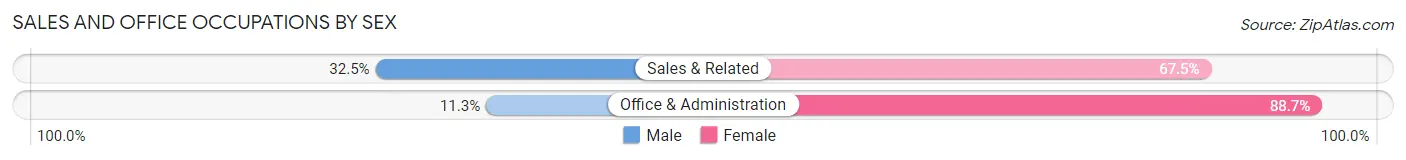
| Occupation | Male | Female |
| Sales & Related | 55 (32.5%) | 114 (67.5%) |
| Office & Administration | 16 (11.3%) | 126 (88.7%) |
| Total (Category) | 71 (22.8%) | 240 (77.2%) |
| Total (Overall) | 553 (45.5%) | 662 (54.5%) |
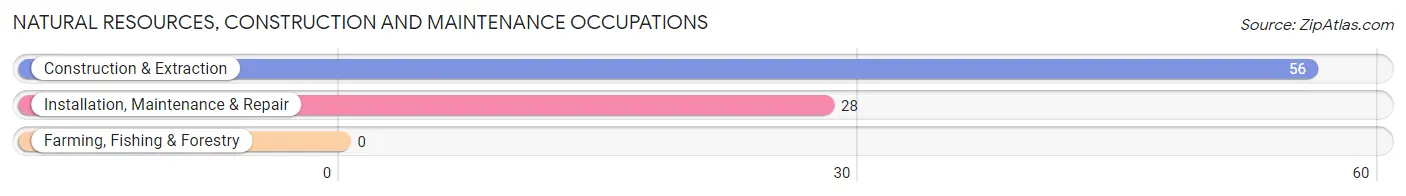
Natural Resources, Construction and Maintenance Occupations
The most common Natural Resources, Construction and Maintenance occupations in Athens are Construction & Extraction (56 | 4.6%), and Installation, Maintenance & Repair (28 | 2.3%).
Natural Resources, Construction and Maintenance Occupations by Sex
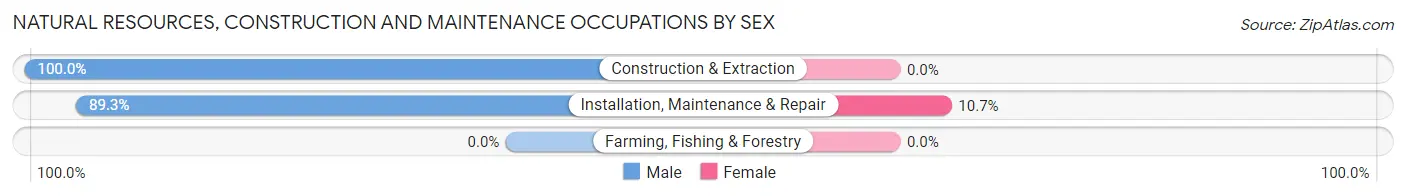
| Occupation | Male | Female |
| Farming, Fishing & Forestry | 0 (0.0%) | 0 (0.0%) |
| Construction & Extraction | 56 (100.0%) | 0 (0.0%) |
| Installation, Maintenance & Repair | 25 (89.3%) | 3 (10.7%) |
| Total (Category) | 81 (96.4%) | 3 (3.6%) |
| Total (Overall) | 553 (45.5%) | 662 (54.5%) |
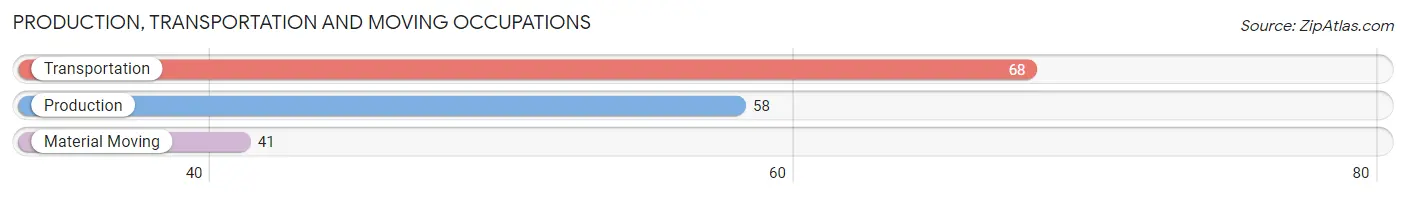
Production, Transportation and Moving Occupations
The most common Production, Transportation and Moving occupations in Athens are Transportation (68 | 5.6%), Production (58 | 4.8%), and Material Moving (41 | 3.4%).
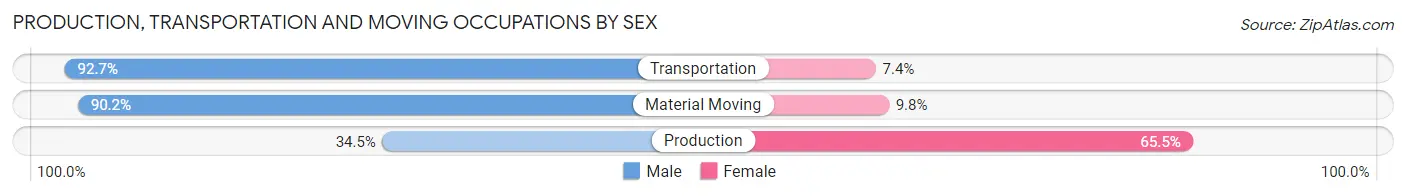
Production, Transportation and Moving Occupations by Sex
| Occupation | Male | Female |
| Production | 20 (34.5%) | 38 (65.5%) |
| Transportation | 63 (92.6%) | 5 (7.3%) |
| Material Moving | 37 (90.2%) | 4 (9.8%) |
| Total (Category) | 120 (71.9%) | 47 (28.1%) |
| Total (Overall) | 553 (45.5%) | 662 (54.5%) |
Employment Industries by Sex in Athens
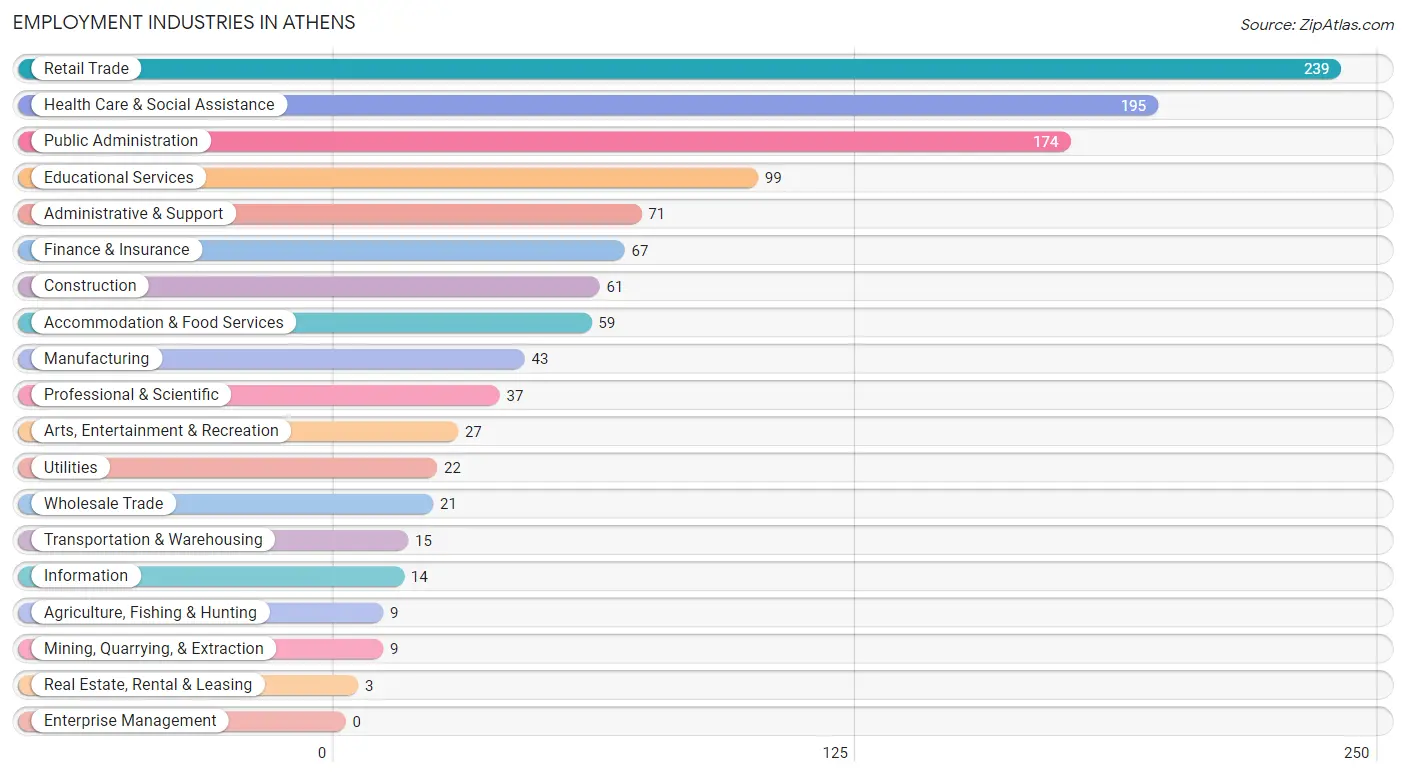
Employment Industries in Athens
The major employment industries in Athens include Retail Trade (239 | 19.7%), Health Care & Social Assistance (195 | 16.1%), Public Administration (174 | 14.3%), Educational Services (99 | 8.2%), and Administrative & Support (71 | 5.8%).
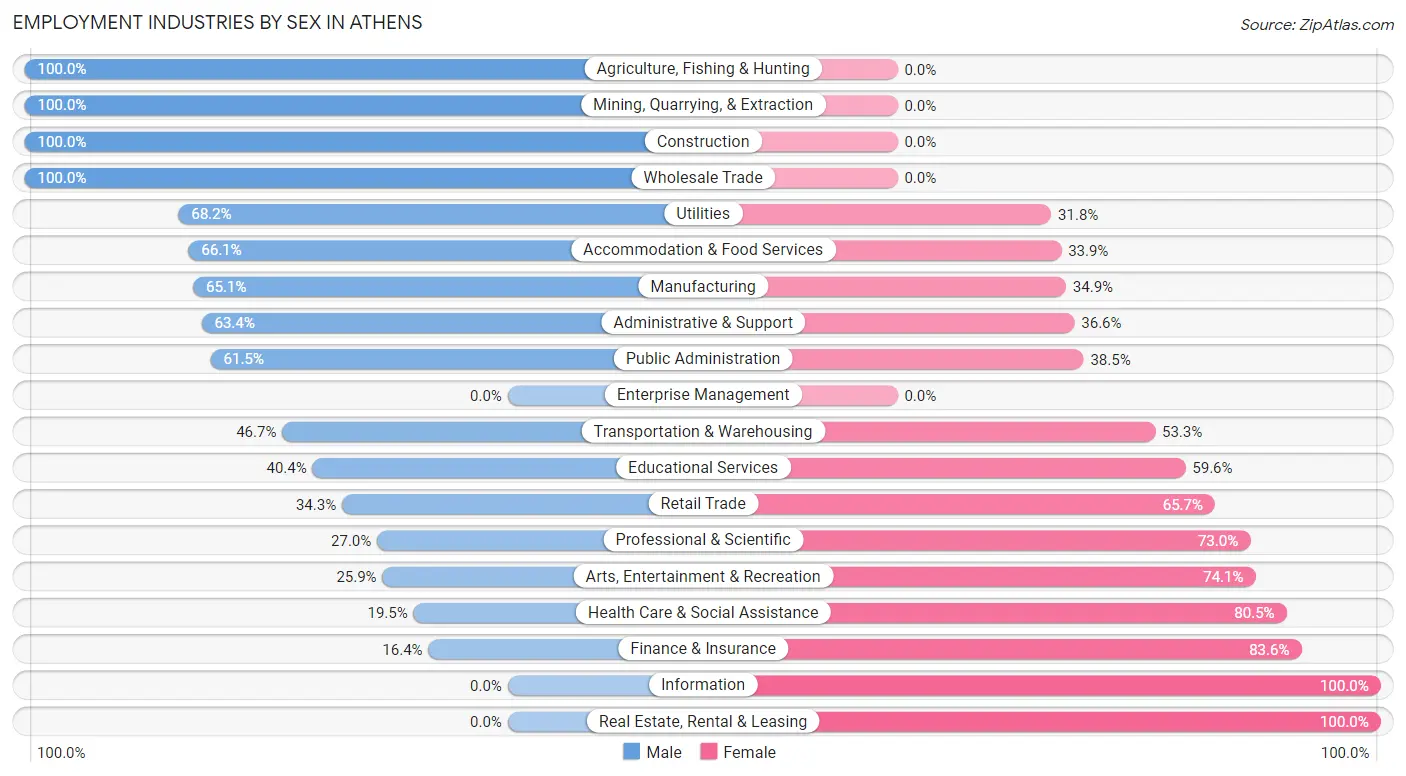
Employment Industries by Sex in Athens
The Athens industries that see more men than women are Agriculture, Fishing & Hunting (100.0%), Mining, Quarrying, & Extraction (100.0%), and Construction (100.0%), whereas the industries that tend to have a higher number of women are Information (100.0%), Real Estate, Rental & Leasing (100.0%), and Finance & Insurance (83.6%).
| Industry | Male | Female |
| Agriculture, Fishing & Hunting | 9 (100.0%) | 0 (0.0%) |
| Mining, Quarrying, & Extraction | 9 (100.0%) | 0 (0.0%) |
| Construction | 61 (100.0%) | 0 (0.0%) |
| Manufacturing | 28 (65.1%) | 15 (34.9%) |
| Wholesale Trade | 21 (100.0%) | 0 (0.0%) |
| Retail Trade | 82 (34.3%) | 157 (65.7%) |
| Transportation & Warehousing | 7 (46.7%) | 8 (53.3%) |
| Utilities | 15 (68.2%) | 7 (31.8%) |
| Information | 0 (0.0%) | 14 (100.0%) |
| Finance & Insurance | 11 (16.4%) | 56 (83.6%) |
| Real Estate, Rental & Leasing | 0 (0.0%) | 3 (100.0%) |
| Professional & Scientific | 10 (27.0%) | 27 (73.0%) |
| Enterprise Management | 0 (0.0%) | 0 (0.0%) |
| Administrative & Support | 45 (63.4%) | 26 (36.6%) |
| Educational Services | 40 (40.4%) | 59 (59.6%) |
| Health Care & Social Assistance | 38 (19.5%) | 157 (80.5%) |
| Arts, Entertainment & Recreation | 7 (25.9%) | 20 (74.1%) |
| Accommodation & Food Services | 39 (66.1%) | 20 (33.9%) |
| Public Administration | 107 (61.5%) | 67 (38.5%) |
| Total | 553 (45.5%) | 662 (54.5%) |
Education in Athens
School Enrollment in Athens
The most common levels of schooling among the 743 students in Athens are high school (191 | 25.7%), middle school (188 | 25.3%), and college / undergraduate (99 | 13.3%).
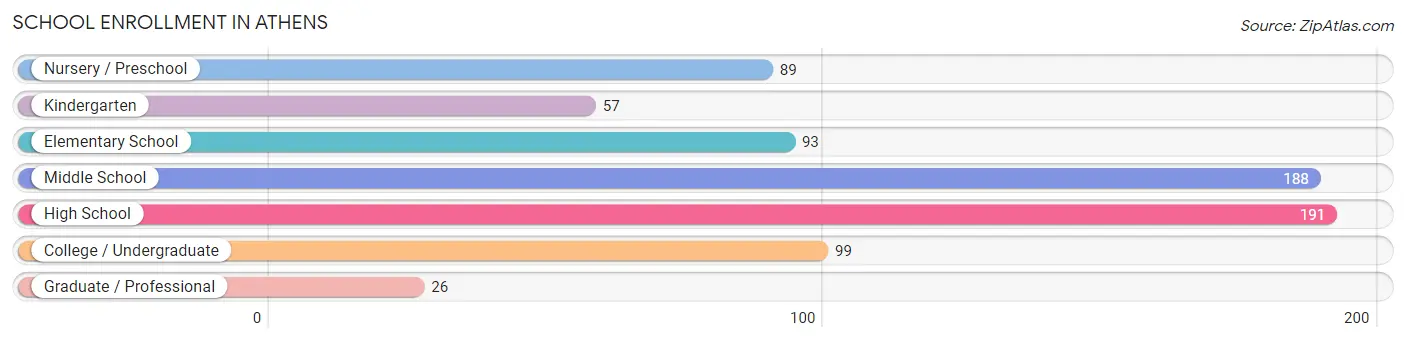
| School Level | # Students | % Students |
| Nursery / Preschool | 89 | 12.0% |
| Kindergarten | 57 | 7.7% |
| Elementary School | 93 | 12.5% |
| Middle School | 188 | 25.3% |
| High School | 191 | 25.7% |
| College / Undergraduate | 99 | 13.3% |
| Graduate / Professional | 26 | 3.5% |
| Total | 743 | 100.0% |
School Enrollment by Age by Funding Source in Athens
Out of a total of 743 students who are enrolled in schools in Athens, 74 (10.0%) attend a private institution, while the remaining 669 (90.0%) are enrolled in public schools. The age group of 35 years and over has the highest likelihood of being enrolled in private schools, with 6 (30.0% in the age bracket) enrolled. Conversely, the age group of 3 to 4 year olds has the lowest likelihood of being enrolled in a private school, with 26 (100.0% in the age bracket) attending a public institution.
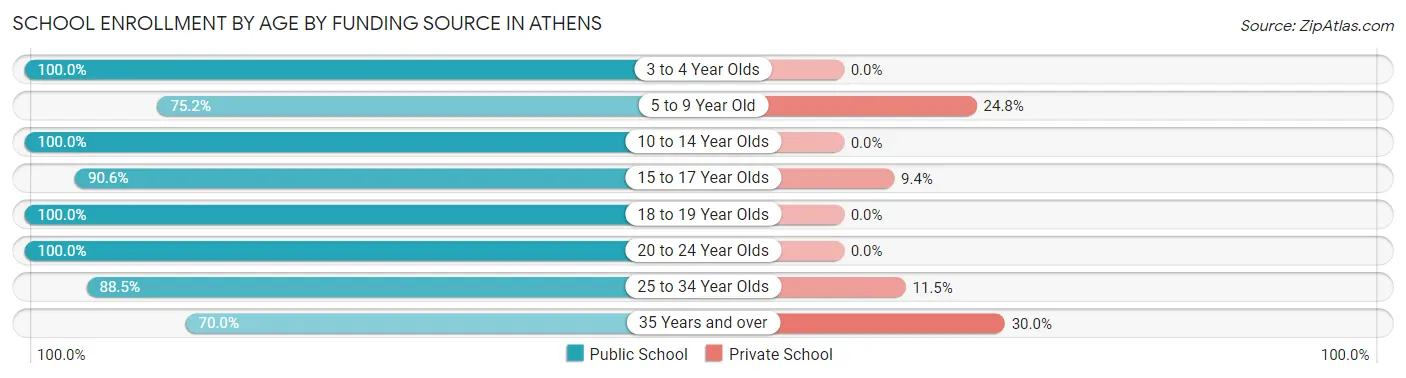
| Age Bracket | Public School | Private School |
| 3 to 4 Year Olds | 26 (100.0%) | 0 (0.0%) |
| 5 to 9 Year Old | 155 (75.2%) | 51 (24.8%) |
| 10 to 14 Year Olds | 231 (100.0%) | 0 (0.0%) |
| 15 to 17 Year Olds | 135 (90.6%) | 14 (9.4%) |
| 18 to 19 Year Olds | 25 (100.0%) | 0 (0.0%) |
| 20 to 24 Year Olds | 60 (100.0%) | 0 (0.0%) |
| 25 to 34 Year Olds | 23 (88.5%) | 3 (11.5%) |
| 35 Years and over | 14 (70.0%) | 6 (30.0%) |
| Total | 669 (90.0%) | 74 (10.0%) |
Educational Attainment by Field of Study in Athens
Business (83 | 21.6%), education (79 | 20.5%), science & technology (38 | 9.9%), arts & humanities (33 | 8.6%), and liberal arts & history (32 | 8.3%) are the most common fields of study among 385 individuals in Athens who have obtained a bachelor's degree or higher.
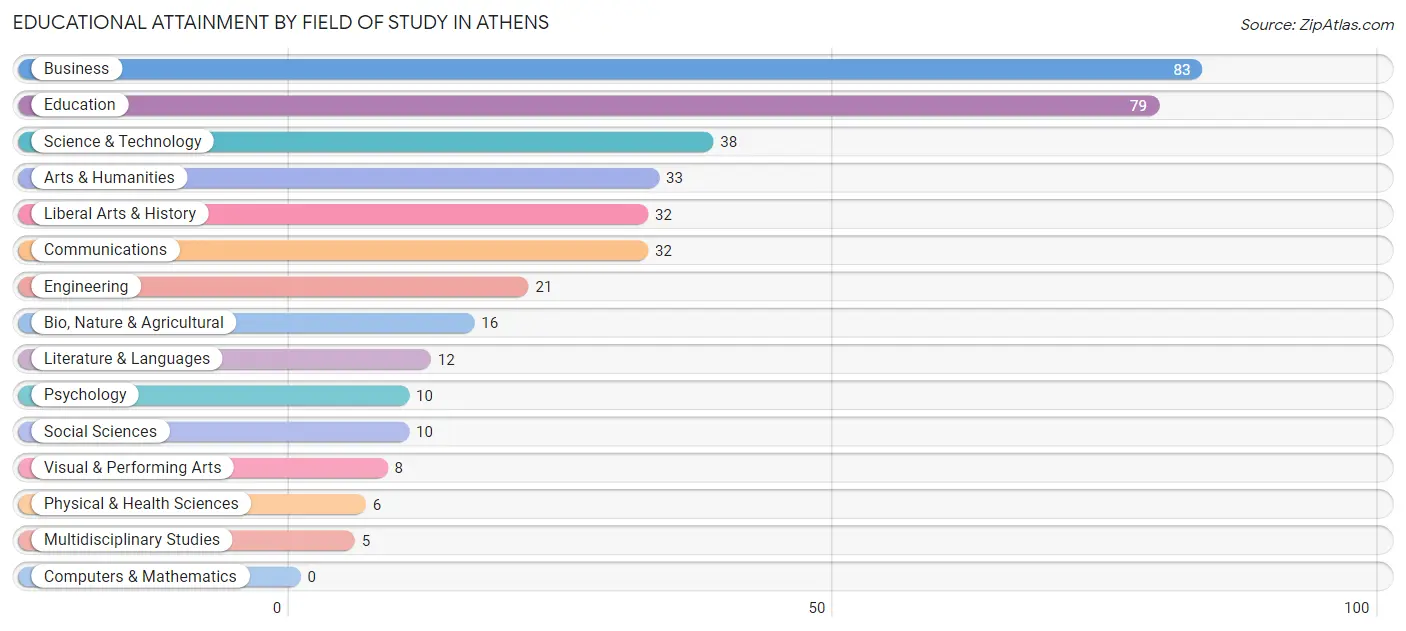
| Field of Study | # Graduates | % Graduates |
| Computers & Mathematics | 0 | 0.0% |
| Bio, Nature & Agricultural | 16 | 4.2% |
| Physical & Health Sciences | 6 | 1.6% |
| Psychology | 10 | 2.6% |
| Social Sciences | 10 | 2.6% |
| Engineering | 21 | 5.4% |
| Multidisciplinary Studies | 5 | 1.3% |
| Science & Technology | 38 | 9.9% |
| Business | 83 | 21.6% |
| Education | 79 | 20.5% |
| Literature & Languages | 12 | 3.1% |
| Liberal Arts & History | 32 | 8.3% |
| Visual & Performing Arts | 8 | 2.1% |
| Communications | 32 | 8.3% |
| Arts & Humanities | 33 | 8.6% |
| Total | 385 | 100.0% |
Transportation & Commute in Athens
Vehicle Availability by Sex in Athens
The most prevalent vehicle ownership categories in Athens are males with 2 vehicles (322, accounting for 58.4%) and females with 2 vehicles (346, making up 49.5%).
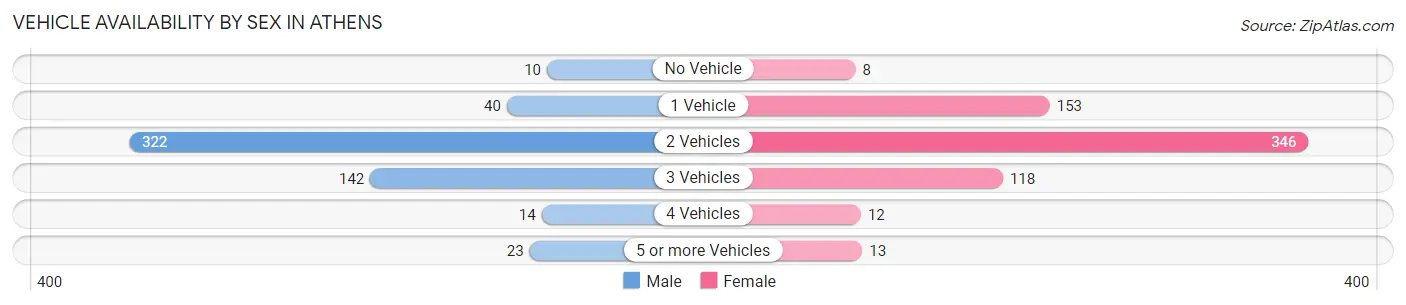
| Vehicles Available | Male | Female |
| No Vehicle | 10 (1.8%) | 8 (1.2%) |
| 1 Vehicle | 40 (7.3%) | 153 (23.5%) |
| 2 Vehicles | 322 (58.4%) | 346 (53.2%) |
| 3 Vehicles | 142 (25.8%) | 118 (18.1%) |
| 4 Vehicles | 14 (2.5%) | 12 (1.8%) |
| 5 or more Vehicles | 23 (4.2%) | 13 (2.0%) |
| Total | 551 (100.0%) | 650 (100.0%) |
Commute Time in Athens
The most frequently occuring commute durations in Athens are 30 to 34 minutes (295 commuters, 25.9%), 25 to 29 minutes (266 commuters, 23.4%), and 20 to 24 minutes (158 commuters, 13.9%).
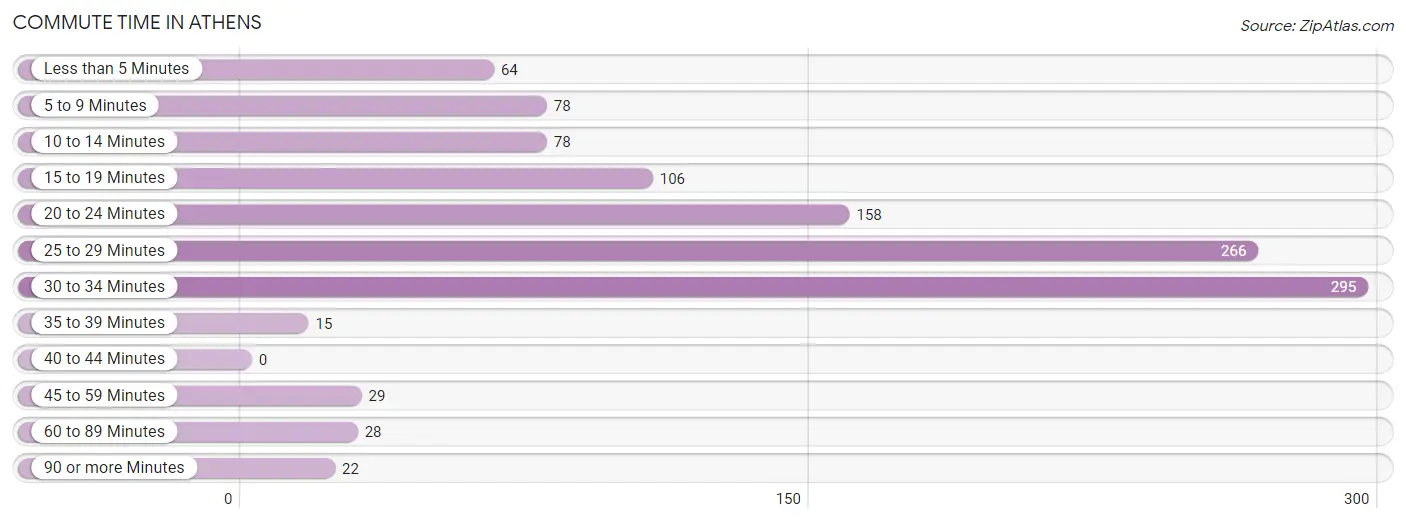
| Commute Time | # Commuters | % Commuters |
| Less than 5 Minutes | 64 | 5.6% |
| 5 to 9 Minutes | 78 | 6.9% |
| 10 to 14 Minutes | 78 | 6.9% |
| 15 to 19 Minutes | 106 | 9.3% |
| 20 to 24 Minutes | 158 | 13.9% |
| 25 to 29 Minutes | 266 | 23.4% |
| 30 to 34 Minutes | 295 | 25.9% |
| 35 to 39 Minutes | 15 | 1.3% |
| 40 to 44 Minutes | 0 | 0.0% |
| 45 to 59 Minutes | 29 | 2.5% |
| 60 to 89 Minutes | 28 | 2.5% |
| 90 or more Minutes | 22 | 1.9% |
Commute Time by Sex in Athens
The most common commute times in Athens are 30 to 34 minutes (142 commuters, 26.2%) for males and 25 to 29 minutes (162 commuters, 27.1%) for females.
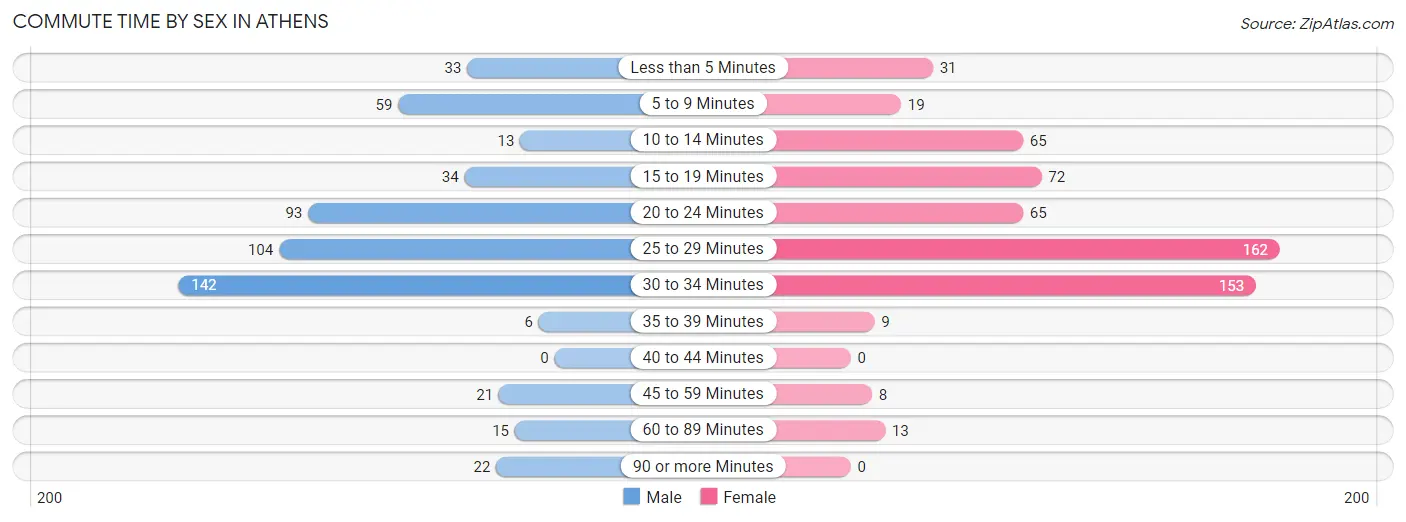
| Commute Time | Male | Female |
| Less than 5 Minutes | 33 (6.1%) | 31 (5.2%) |
| 5 to 9 Minutes | 59 (10.9%) | 19 (3.2%) |
| 10 to 14 Minutes | 13 (2.4%) | 65 (10.9%) |
| 15 to 19 Minutes | 34 (6.3%) | 72 (12.1%) |
| 20 to 24 Minutes | 93 (17.2%) | 65 (10.9%) |
| 25 to 29 Minutes | 104 (19.2%) | 162 (27.1%) |
| 30 to 34 Minutes | 142 (26.2%) | 153 (25.6%) |
| 35 to 39 Minutes | 6 (1.1%) | 9 (1.5%) |
| 40 to 44 Minutes | 0 (0.0%) | 0 (0.0%) |
| 45 to 59 Minutes | 21 (3.9%) | 8 (1.3%) |
| 60 to 89 Minutes | 15 (2.8%) | 13 (2.2%) |
| 90 or more Minutes | 22 (4.1%) | 0 (0.0%) |
Time of Departure to Work by Sex in Athens
The most frequent times of departure to work in Athens are 7:00 AM to 7:29 AM (82, 15.1%) for males and 7:00 AM to 7:29 AM (132, 22.1%) for females.
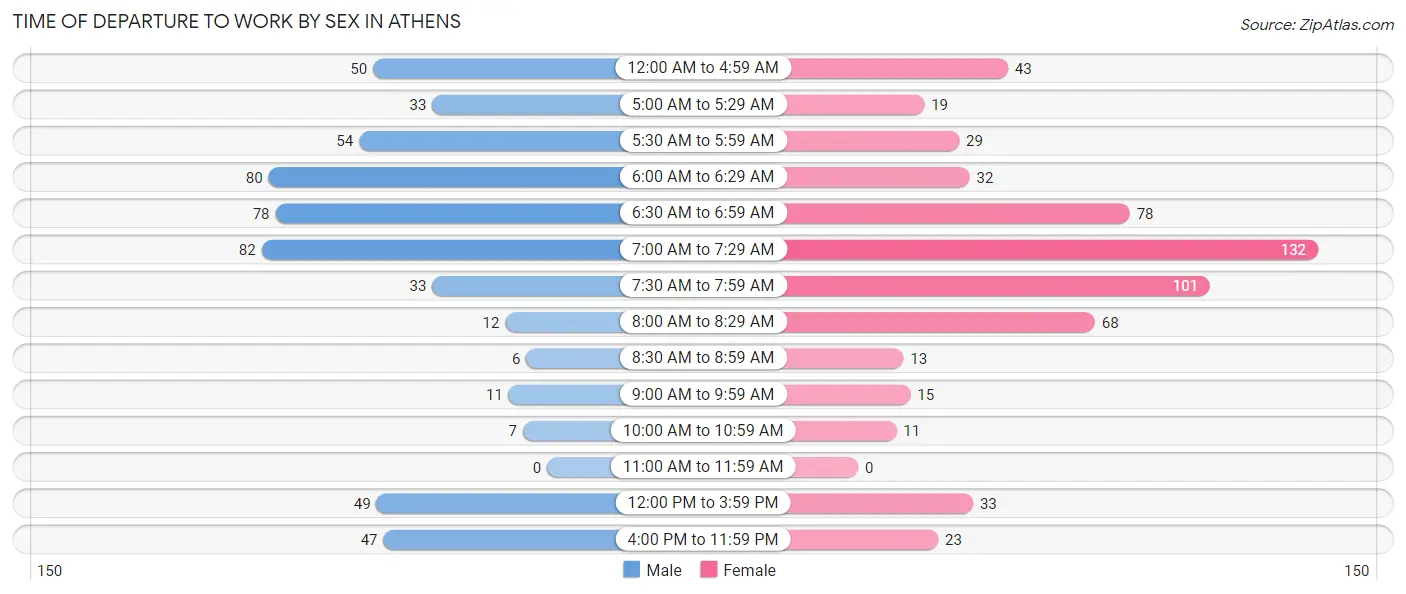
| Time of Departure | Male | Female |
| 12:00 AM to 4:59 AM | 50 (9.2%) | 43 (7.2%) |
| 5:00 AM to 5:29 AM | 33 (6.1%) | 19 (3.2%) |
| 5:30 AM to 5:59 AM | 54 (10.0%) | 29 (4.9%) |
| 6:00 AM to 6:29 AM | 80 (14.8%) | 32 (5.4%) |
| 6:30 AM to 6:59 AM | 78 (14.4%) | 78 (13.1%) |
| 7:00 AM to 7:29 AM | 82 (15.1%) | 132 (22.1%) |
| 7:30 AM to 7:59 AM | 33 (6.1%) | 101 (16.9%) |
| 8:00 AM to 8:29 AM | 12 (2.2%) | 68 (11.4%) |
| 8:30 AM to 8:59 AM | 6 (1.1%) | 13 (2.2%) |
| 9:00 AM to 9:59 AM | 11 (2.0%) | 15 (2.5%) |
| 10:00 AM to 10:59 AM | 7 (1.3%) | 11 (1.8%) |
| 11:00 AM to 11:59 AM | 0 (0.0%) | 0 (0.0%) |
| 12:00 PM to 3:59 PM | 49 (9.0%) | 33 (5.5%) |
| 4:00 PM to 11:59 PM | 47 (8.7%) | 23 (3.8%) |
| Total | 542 (100.0%) | 597 (100.0%) |
Housing Occupancy in Athens
Occupancy by Ownership in Athens
Of the total 940 dwellings in Athens, owner-occupied units account for 671 (71.4%), while renter-occupied units make up 269 (28.6%).
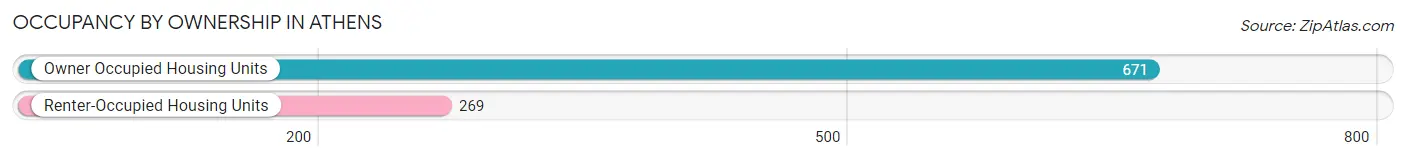
| Occupancy | # Housing Units | % Housing Units |
| Owner Occupied Housing Units | 671 | 71.4% |
| Renter-Occupied Housing Units | 269 | 28.6% |
| Total Occupied Housing Units | 940 | 100.0% |
Occupancy by Household Size in Athens
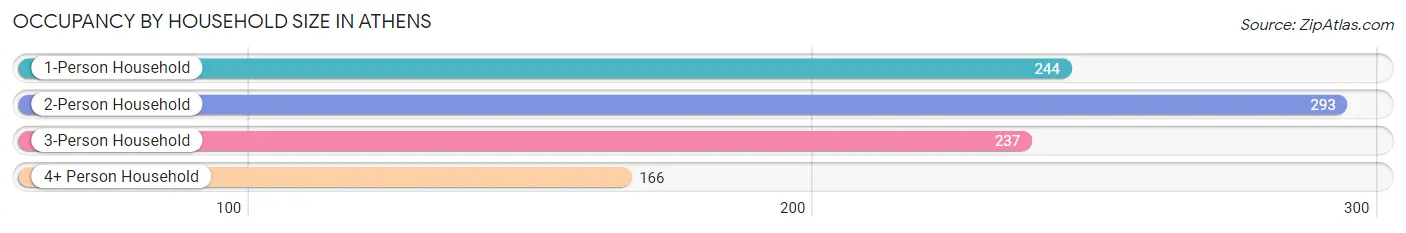
| Household Size | # Housing Units | % Housing Units |
| 1-Person Household | 244 | 26.0% |
| 2-Person Household | 293 | 31.2% |
| 3-Person Household | 237 | 25.2% |
| 4+ Person Household | 166 | 17.7% |
| Total Housing Units | 940 | 100.0% |
Occupancy by Ownership by Household Size in Athens
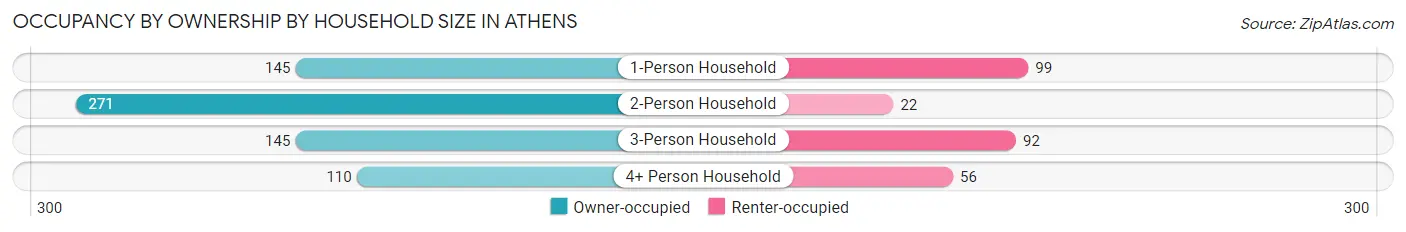
| Household Size | Owner-occupied | Renter-occupied |
| 1-Person Household | 145 (59.4%) | 99 (40.6%) |
| 2-Person Household | 271 (92.5%) | 22 (7.5%) |
| 3-Person Household | 145 (61.2%) | 92 (38.8%) |
| 4+ Person Household | 110 (66.3%) | 56 (33.7%) |
| Total Housing Units | 671 (71.4%) | 269 (28.6%) |
Occupancy by Educational Attainment in Athens
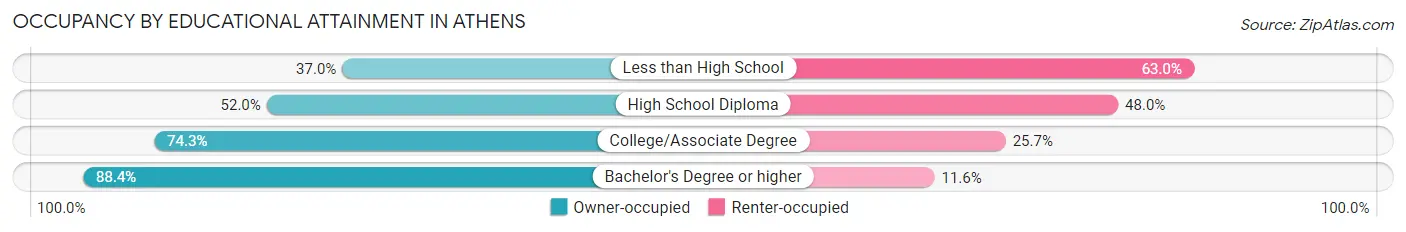
| Household Size | Owner-occupied | Renter-occupied |
| Less than High School | 10 (37.0%) | 17 (63.0%) |
| High School Diploma | 129 (52.0%) | 119 (48.0%) |
| College/Associate Degree | 295 (74.3%) | 102 (25.7%) |
| Bachelor's Degree or higher | 237 (88.4%) | 31 (11.6%) |
Occupancy by Age of Householder in Athens
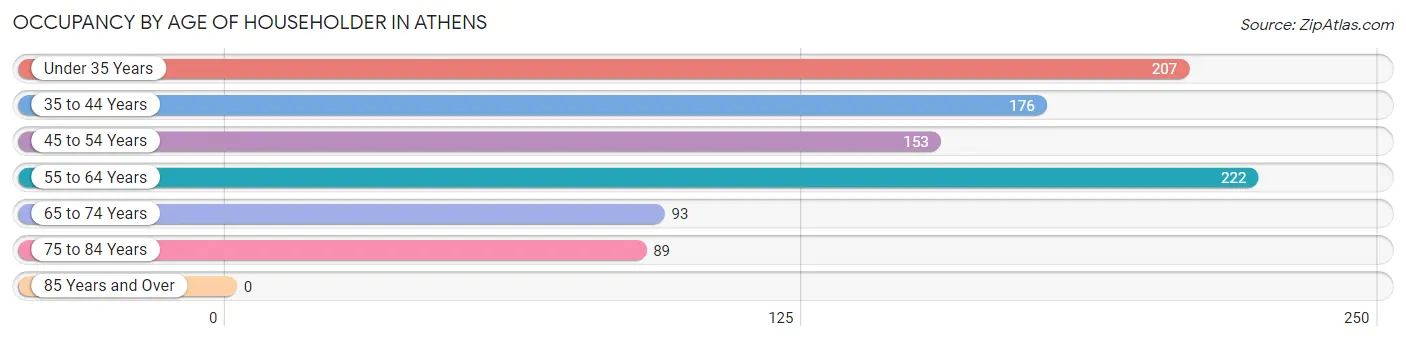
| Age Bracket | # Households | % Households |
| Under 35 Years | 207 | 22.0% |
| 35 to 44 Years | 176 | 18.7% |
| 45 to 54 Years | 153 | 16.3% |
| 55 to 64 Years | 222 | 23.6% |
| 65 to 74 Years | 93 | 9.9% |
| 75 to 84 Years | 89 | 9.5% |
| 85 Years and Over | 0 | 0.0% |
| Total | 940 | 100.0% |
Housing Finances in Athens
Median Income by Occupancy in Athens
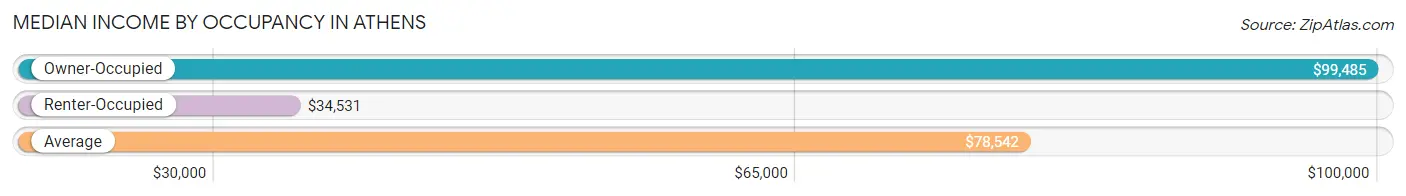
| Occupancy Type | # Households | Median Income |
| Owner-Occupied | 671 (71.4%) | $99,485 |
| Renter-Occupied | 269 (28.6%) | $34,531 |
| Average | 940 (100.0%) | $78,542 |
Occupancy by Householder Income Bracket in Athens
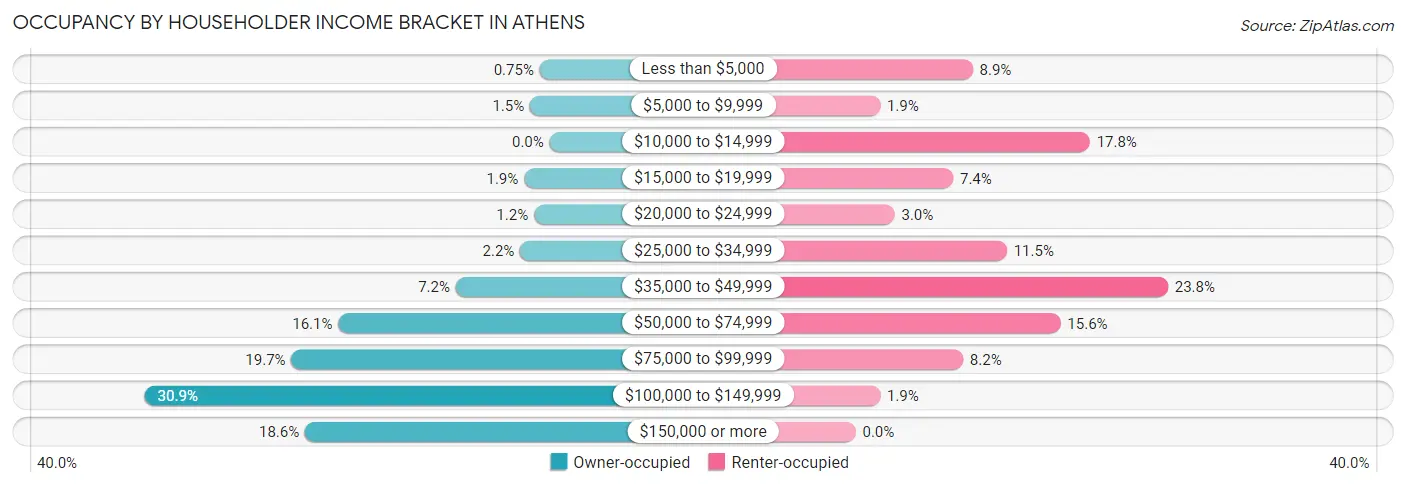
| Income Bracket | Owner-occupied | Renter-occupied |
| Less than $5,000 | 5 (0.7%) | 24 (8.9%) |
| $5,000 to $9,999 | 10 (1.5%) | 5 (1.9%) |
| $10,000 to $14,999 | 0 (0.0%) | 48 (17.8%) |
| $15,000 to $19,999 | 13 (1.9%) | 20 (7.4%) |
| $20,000 to $24,999 | 8 (1.2%) | 8 (3.0%) |
| $25,000 to $34,999 | 15 (2.2%) | 31 (11.5%) |
| $35,000 to $49,999 | 48 (7.1%) | 64 (23.8%) |
| $50,000 to $74,999 | 108 (16.1%) | 42 (15.6%) |
| $75,000 to $99,999 | 132 (19.7%) | 22 (8.2%) |
| $100,000 to $149,999 | 207 (30.8%) | 5 (1.9%) |
| $150,000 or more | 125 (18.6%) | 0 (0.0%) |
| Total | 671 (100.0%) | 269 (100.0%) |
Monthly Housing Cost Tiers in Athens
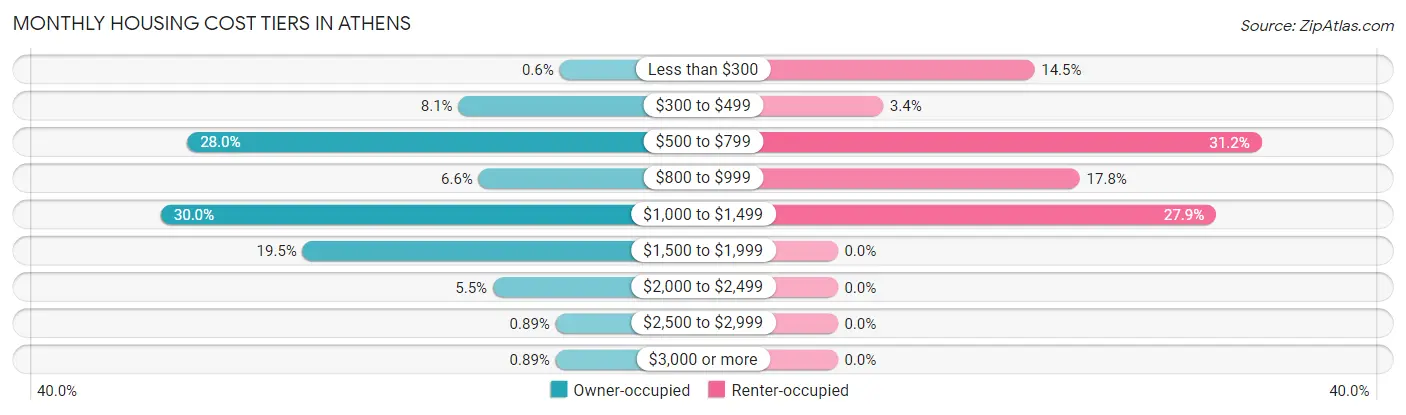
| Monthly Cost | Owner-occupied | Renter-occupied |
| Less than $300 | 4 (0.6%) | 39 (14.5%) |
| $300 to $499 | 54 (8.1%) | 9 (3.4%) |
| $500 to $799 | 188 (28.0%) | 84 (31.2%) |
| $800 to $999 | 44 (6.6%) | 48 (17.8%) |
| $1,000 to $1,499 | 201 (30.0%) | 75 (27.9%) |
| $1,500 to $1,999 | 131 (19.5%) | 0 (0.0%) |
| $2,000 to $2,499 | 37 (5.5%) | 0 (0.0%) |
| $2,500 to $2,999 | 6 (0.9%) | 0 (0.0%) |
| $3,000 or more | 6 (0.9%) | 0 (0.0%) |
| Total | 671 (100.0%) | 269 (100.0%) |
Physical Housing Characteristics in Athens
Housing Structures in Athens
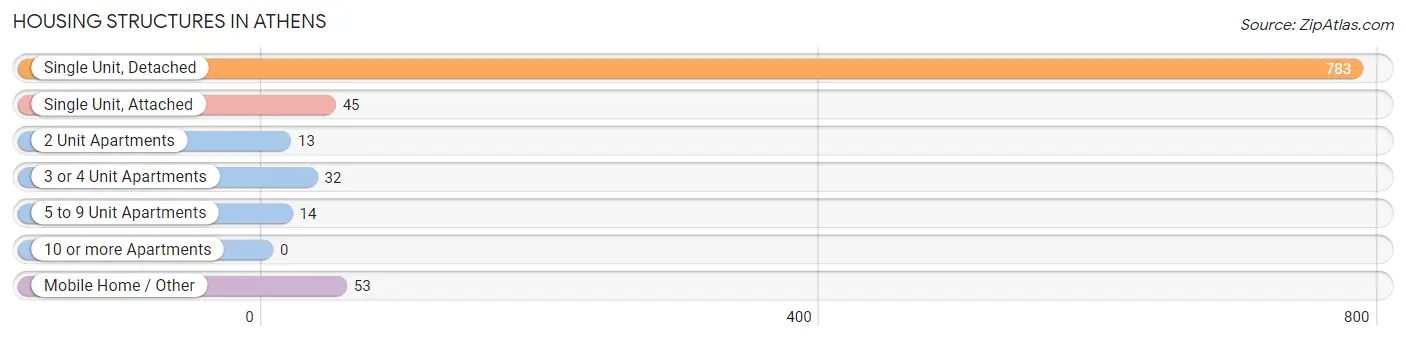
| Structure Type | # Housing Units | % Housing Units |
| Single Unit, Detached | 783 | 83.3% |
| Single Unit, Attached | 45 | 4.8% |
| 2 Unit Apartments | 13 | 1.4% |
| 3 or 4 Unit Apartments | 32 | 3.4% |
| 5 to 9 Unit Apartments | 14 | 1.5% |
| 10 or more Apartments | 0 | 0.0% |
| Mobile Home / Other | 53 | 5.6% |
| Total | 940 | 100.0% |
Housing Structures by Occupancy in Athens
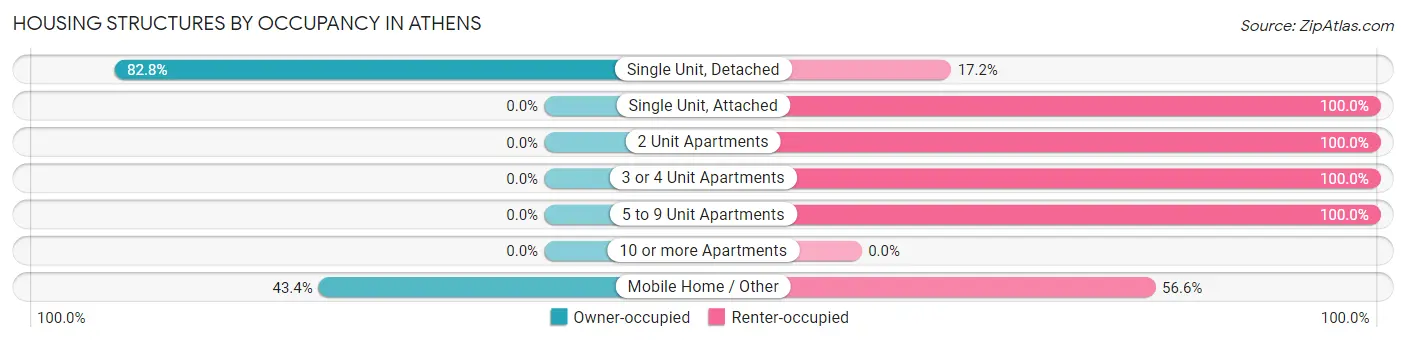
| Structure Type | Owner-occupied | Renter-occupied |
| Single Unit, Detached | 648 (82.8%) | 135 (17.2%) |
| Single Unit, Attached | 0 (0.0%) | 45 (100.0%) |
| 2 Unit Apartments | 0 (0.0%) | 13 (100.0%) |
| 3 or 4 Unit Apartments | 0 (0.0%) | 32 (100.0%) |
| 5 to 9 Unit Apartments | 0 (0.0%) | 14 (100.0%) |
| 10 or more Apartments | 0 (0.0%) | 0 (0.0%) |
| Mobile Home / Other | 23 (43.4%) | 30 (56.6%) |
| Total | 671 (71.4%) | 269 (28.6%) |
Housing Structures by Number of Rooms in Athens
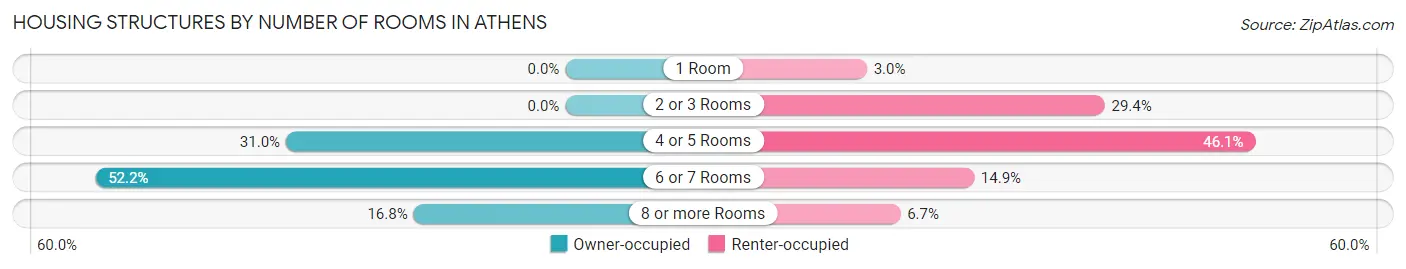
| Number of Rooms | Owner-occupied | Renter-occupied |
| 1 Room | 0 (0.0%) | 8 (3.0%) |
| 2 or 3 Rooms | 0 (0.0%) | 79 (29.4%) |
| 4 or 5 Rooms | 208 (31.0%) | 124 (46.1%) |
| 6 or 7 Rooms | 350 (52.2%) | 40 (14.9%) |
| 8 or more Rooms | 113 (16.8%) | 18 (6.7%) |
| Total | 671 (100.0%) | 269 (100.0%) |
Housing Structure by Heating Type in Athens
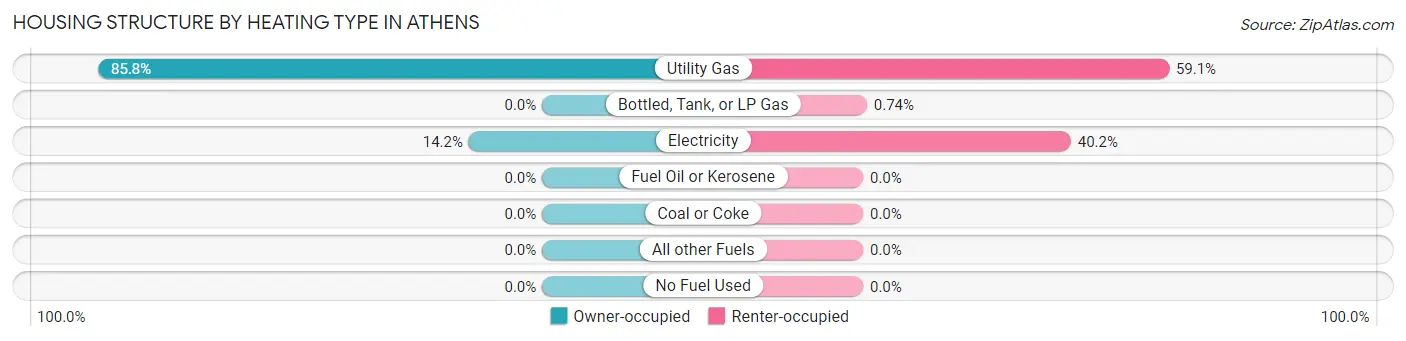
| Heating Type | Owner-occupied | Renter-occupied |
| Utility Gas | 576 (85.8%) | 159 (59.1%) |
| Bottled, Tank, or LP Gas | 0 (0.0%) | 2 (0.7%) |
| Electricity | 95 (14.2%) | 108 (40.2%) |
| Fuel Oil or Kerosene | 0 (0.0%) | 0 (0.0%) |
| Coal or Coke | 0 (0.0%) | 0 (0.0%) |
| All other Fuels | 0 (0.0%) | 0 (0.0%) |
| No Fuel Used | 0 (0.0%) | 0 (0.0%) |
| Total | 671 (100.0%) | 269 (100.0%) |
Household Vehicle Usage in Athens
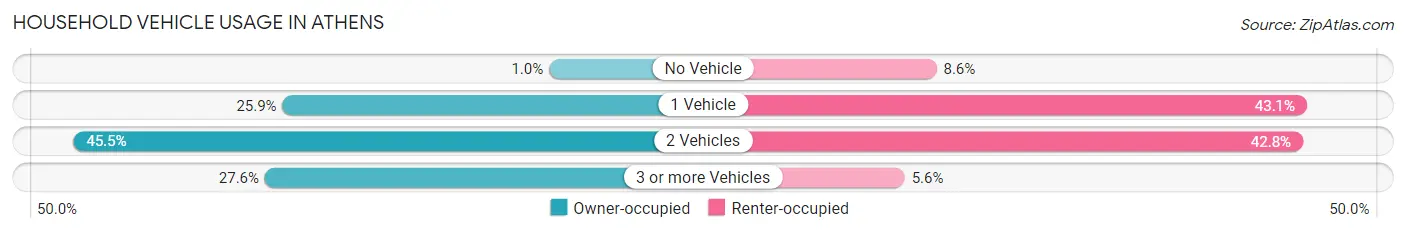
| Vehicles per Household | Owner-occupied | Renter-occupied |
| No Vehicle | 7 (1.0%) | 23 (8.6%) |
| 1 Vehicle | 174 (25.9%) | 116 (43.1%) |
| 2 Vehicles | 305 (45.5%) | 115 (42.7%) |
| 3 or more Vehicles | 185 (27.6%) | 15 (5.6%) |
| Total | 671 (100.0%) | 269 (100.0%) |
Real Estate & Mortgages in Athens
Real Estate and Mortgage Overview in Athens
| Characteristic | Without Mortgage | With Mortgage |
| Housing Units | 239 | 432 |
| Median Property Value | $154,300 | $163,300 |
| Median Household Income | $93,750 | $82 |
| Monthly Housing Costs | $570 | $6 |
| Real Estate Taxes | $2,665 | $0 |
Property Value by Mortgage Status in Athens
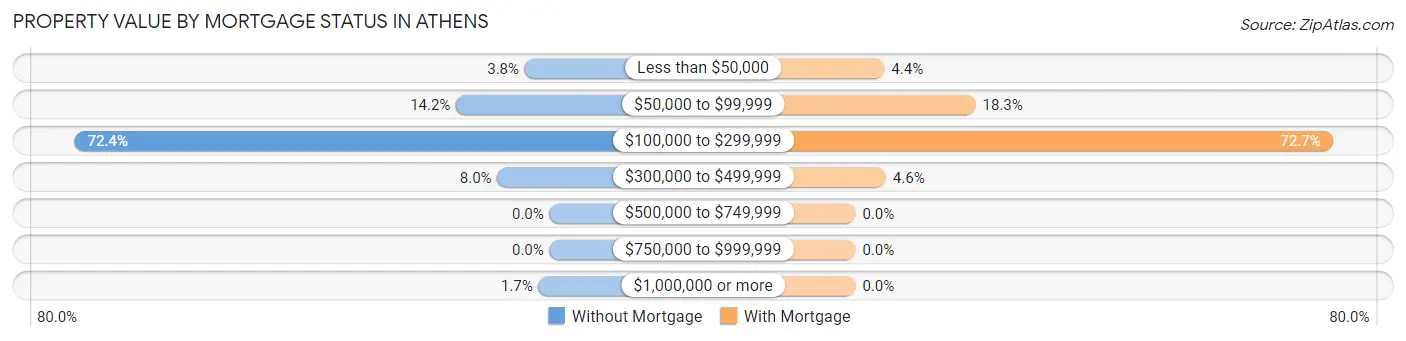
| Property Value | Without Mortgage | With Mortgage |
| Less than $50,000 | 9 (3.8%) | 19 (4.4%) |
| $50,000 to $99,999 | 34 (14.2%) | 79 (18.3%) |
| $100,000 to $299,999 | 173 (72.4%) | 314 (72.7%) |
| $300,000 to $499,999 | 19 (8.0%) | 20 (4.6%) |
| $500,000 to $749,999 | 0 (0.0%) | 0 (0.0%) |
| $750,000 to $999,999 | 0 (0.0%) | 0 (0.0%) |
| $1,000,000 or more | 4 (1.7%) | 0 (0.0%) |
| Total | 239 (100.0%) | 432 (100.0%) |
Household Income by Mortgage Status in Athens
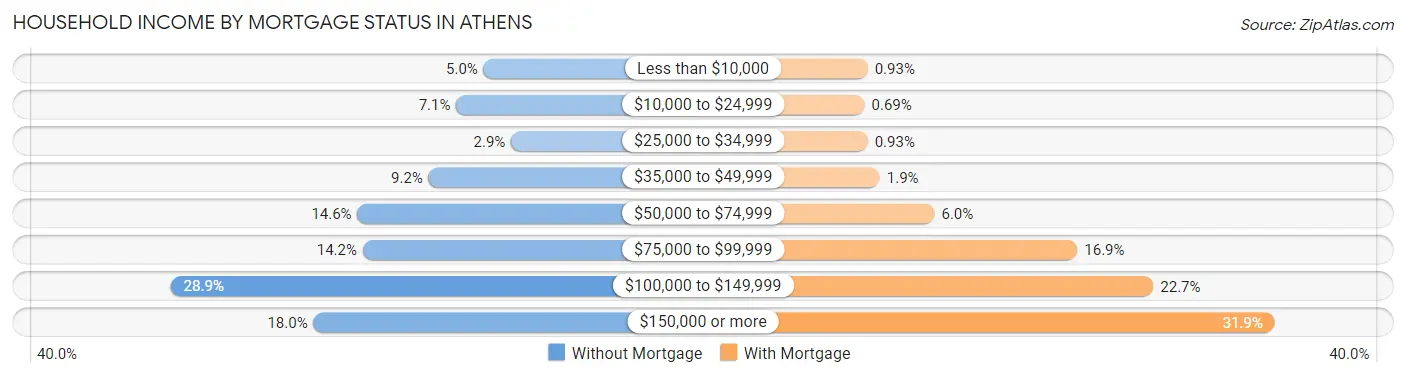
| Household Income | Without Mortgage | With Mortgage |
| Less than $10,000 | 12 (5.0%) | 4 (0.9%) |
| $10,000 to $24,999 | 17 (7.1%) | 3 (0.7%) |
| $25,000 to $34,999 | 7 (2.9%) | 4 (0.9%) |
| $35,000 to $49,999 | 22 (9.2%) | 8 (1.8%) |
| $50,000 to $74,999 | 35 (14.6%) | 26 (6.0%) |
| $75,000 to $99,999 | 34 (14.2%) | 73 (16.9%) |
| $100,000 to $149,999 | 69 (28.9%) | 98 (22.7%) |
| $150,000 or more | 43 (18.0%) | 138 (31.9%) |
| Total | 239 (100.0%) | 432 (100.0%) |
Property Value to Household Income Ratio in Athens
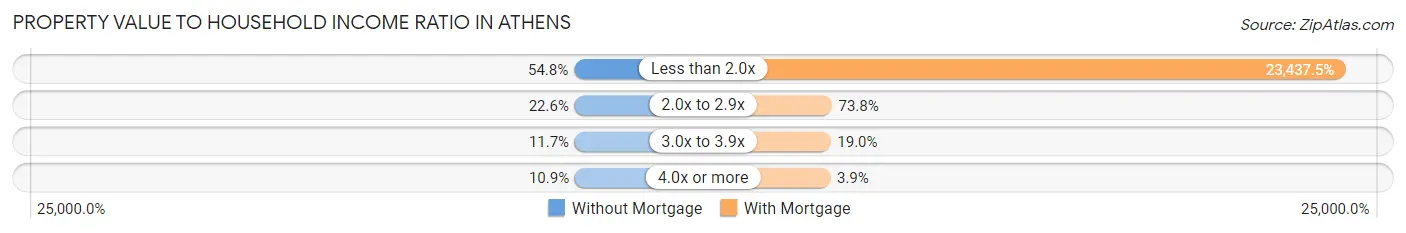
| Value-to-Income Ratio | Without Mortgage | With Mortgage |
| Less than 2.0x | 131 (54.8%) | 101,250 (23,437.5%) |
| 2.0x to 2.9x | 54 (22.6%) | 319 (73.8%) |
| 3.0x to 3.9x | 28 (11.7%) | 82 (19.0%) |
| 4.0x or more | 26 (10.9%) | 17 (3.9%) |
| Total | 239 (100.0%) | 432 (100.0%) |
Real Estate Taxes by Mortgage Status in Athens
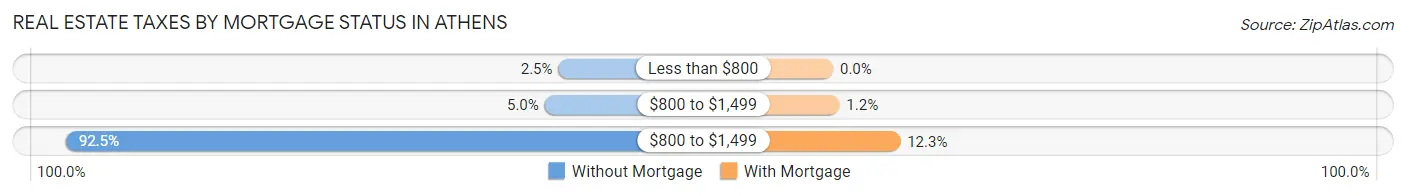
| Property Taxes | Without Mortgage | With Mortgage |
| Less than $800 | 6 (2.5%) | 0 (0.0%) |
| $800 to $1,499 | 12 (5.0%) | 5 (1.2%) |
| $800 to $1,499 | 221 (92.5%) | 53 (12.3%) |
| Total | 239 (100.0%) | 432 (100.0%) |
Health & Disability in Athens
Health Insurance Coverage by Age in Athens
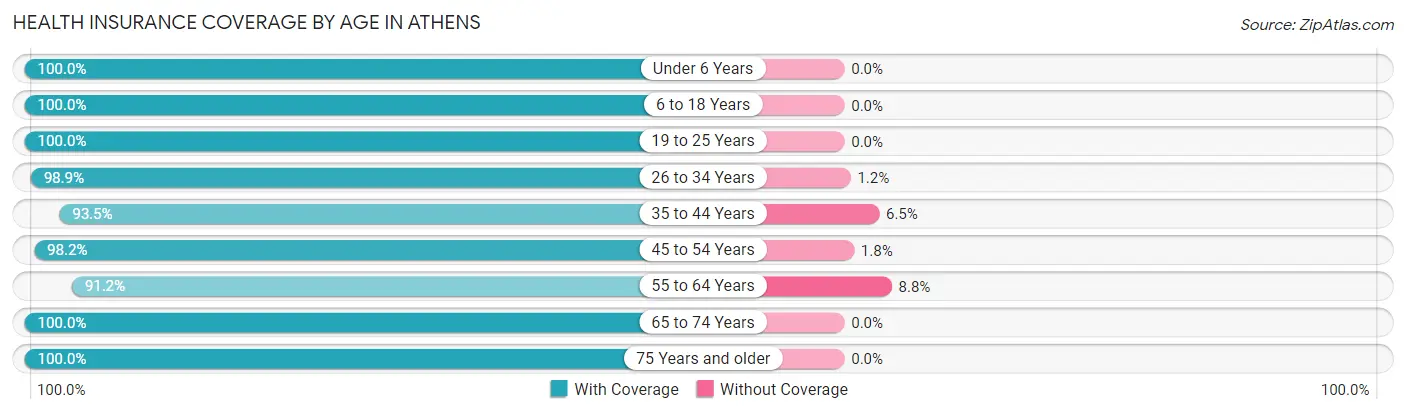
| Age Bracket | With Coverage | Without Coverage |
| Under 6 Years | 183 (100.0%) | 0 (0.0%) |
| 6 to 18 Years | 550 (100.0%) | 0 (0.0%) |
| 19 to 25 Years | 242 (100.0%) | 0 (0.0%) |
| 26 to 34 Years | 257 (98.9%) | 3 (1.1%) |
| 35 to 44 Years | 274 (93.5%) | 19 (6.5%) |
| 45 to 54 Years | 219 (98.2%) | 4 (1.8%) |
| 55 to 64 Years | 372 (91.2%) | 36 (8.8%) |
| 65 to 74 Years | 111 (100.0%) | 0 (0.0%) |
| 75 Years and older | 124 (100.0%) | 0 (0.0%) |
| Total | 2,332 (97.4%) | 62 (2.6%) |
Health Insurance Coverage by Citizenship Status in Athens
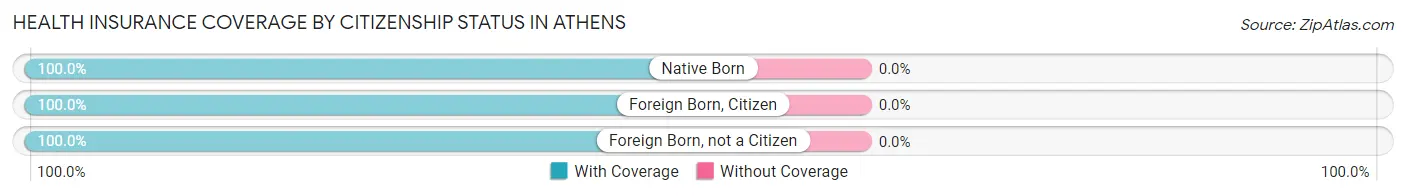
| Citizenship Status | With Coverage | Without Coverage |
| Native Born | 183 (100.0%) | 0 (0.0%) |
| Foreign Born, Citizen | 550 (100.0%) | 0 (0.0%) |
| Foreign Born, not a Citizen | 242 (100.0%) | 0 (0.0%) |
Health Insurance Coverage by Household Income in Athens
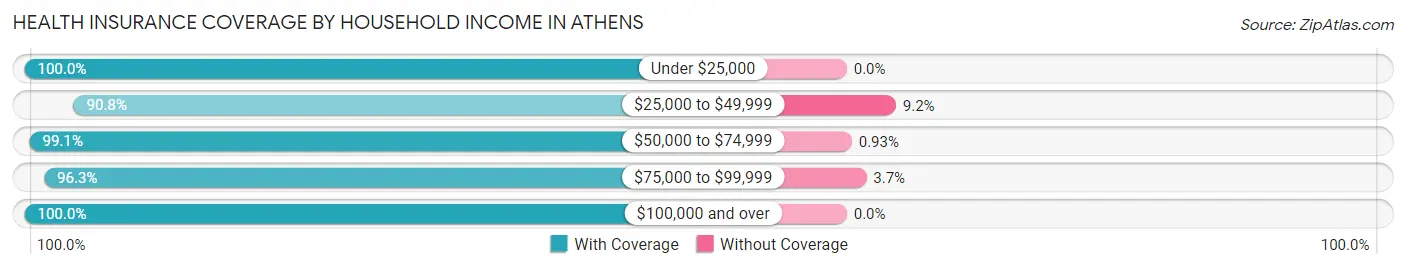
| Household Income | With Coverage | Without Coverage |
| Under $25,000 | 241 (100.0%) | 0 (0.0%) |
| $25,000 to $49,999 | 425 (90.8%) | 43 (9.2%) |
| $50,000 to $74,999 | 428 (99.1%) | 4 (0.9%) |
| $75,000 to $99,999 | 395 (96.3%) | 15 (3.7%) |
| $100,000 and over | 843 (100.0%) | 0 (0.0%) |
Public vs Private Health Insurance Coverage by Age in Athens
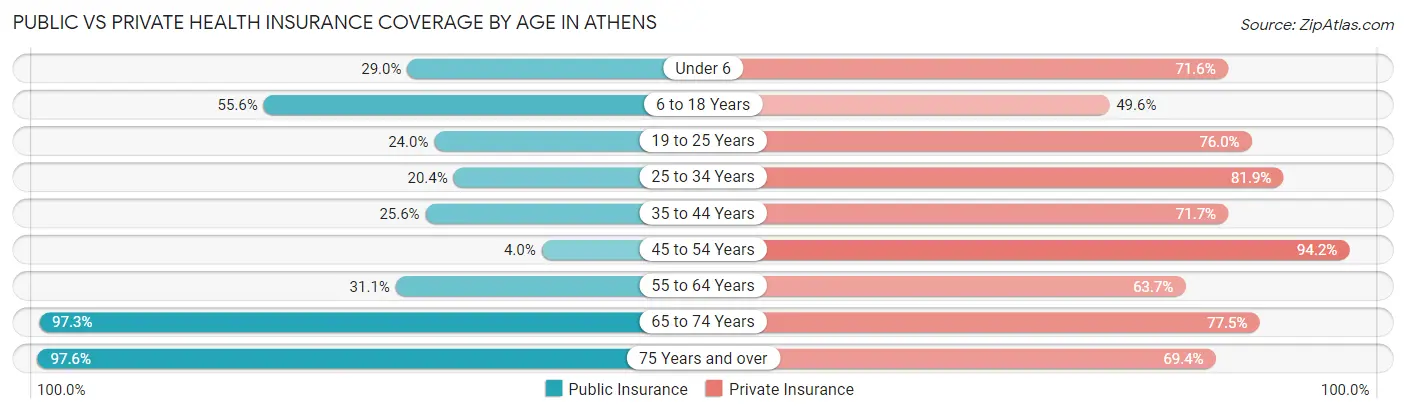
| Age Bracket | Public Insurance | Private Insurance |
| Under 6 | 53 (29.0%) | 131 (71.6%) |
| 6 to 18 Years | 306 (55.6%) | 273 (49.6%) |
| 19 to 25 Years | 58 (24.0%) | 184 (76.0%) |
| 25 to 34 Years | 53 (20.4%) | 213 (81.9%) |
| 35 to 44 Years | 75 (25.6%) | 210 (71.7%) |
| 45 to 54 Years | 9 (4.0%) | 210 (94.2%) |
| 55 to 64 Years | 127 (31.1%) | 260 (63.7%) |
| 65 to 74 Years | 108 (97.3%) | 86 (77.5%) |
| 75 Years and over | 121 (97.6%) | 86 (69.4%) |
| Total | 910 (38.0%) | 1,653 (69.1%) |
Disability Status by Sex by Age in Athens
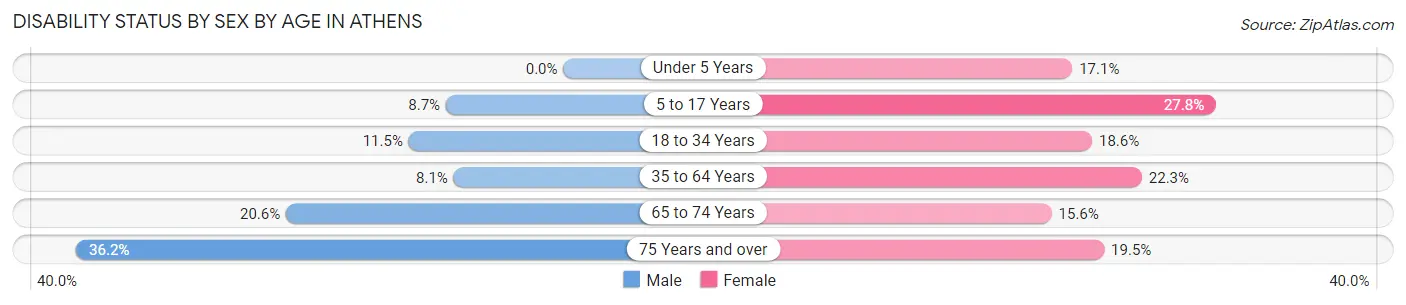
| Age Bracket | Male | Female |
| Under 5 Years | 0 (0.0%) | 13 (17.1%) |
| 5 to 17 Years | 26 (8.7%) | 85 (27.8%) |
| 18 to 34 Years | 31 (11.5%) | 47 (18.6%) |
| 35 to 64 Years | 31 (8.1%) | 121 (22.3%) |
| 65 to 74 Years | 7 (20.6%) | 12 (15.6%) |
| 75 Years and over | 17 (36.2%) | 15 (19.5%) |
Disability Class by Sex by Age in Athens
Disability Class: Hearing Difficulty
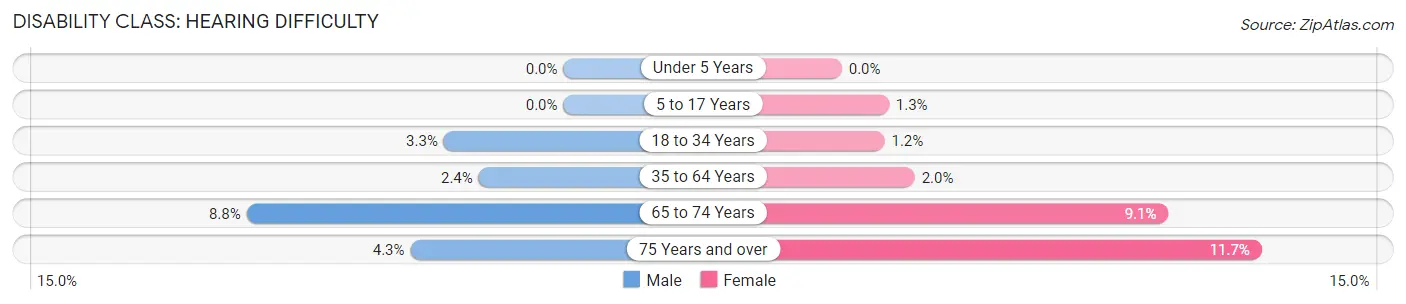
| Age Bracket | Male | Female |
| Under 5 Years | 0 (0.0%) | 0 (0.0%) |
| 5 to 17 Years | 0 (0.0%) | 4 (1.3%) |
| 18 to 34 Years | 9 (3.3%) | 3 (1.2%) |
| 35 to 64 Years | 9 (2.4%) | 11 (2.0%) |
| 65 to 74 Years | 3 (8.8%) | 7 (9.1%) |
| 75 Years and over | 2 (4.3%) | 9 (11.7%) |
Disability Class: Vision Difficulty
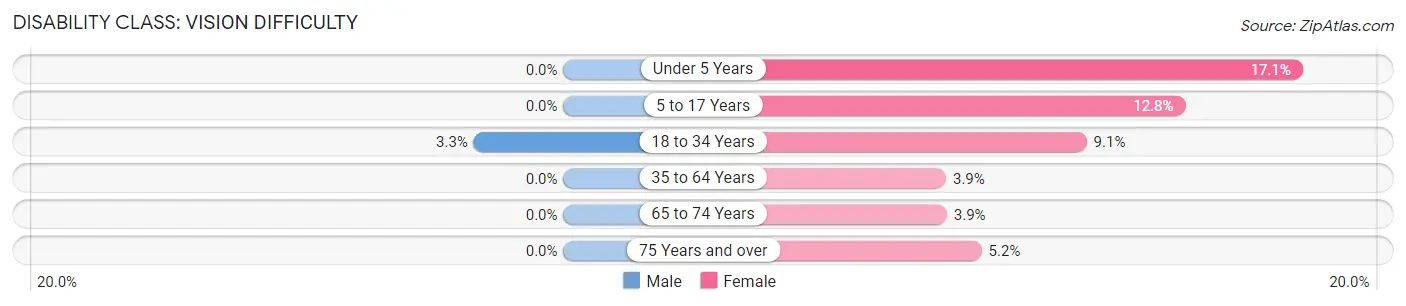
| Age Bracket | Male | Female |
| Under 5 Years | 0 (0.0%) | 13 (17.1%) |
| 5 to 17 Years | 0 (0.0%) | 39 (12.8%) |
| 18 to 34 Years | 9 (3.3%) | 23 (9.1%) |
| 35 to 64 Years | 0 (0.0%) | 21 (3.9%) |
| 65 to 74 Years | 0 (0.0%) | 3 (3.9%) |
| 75 Years and over | 0 (0.0%) | 4 (5.2%) |
Disability Class: Cognitive Difficulty
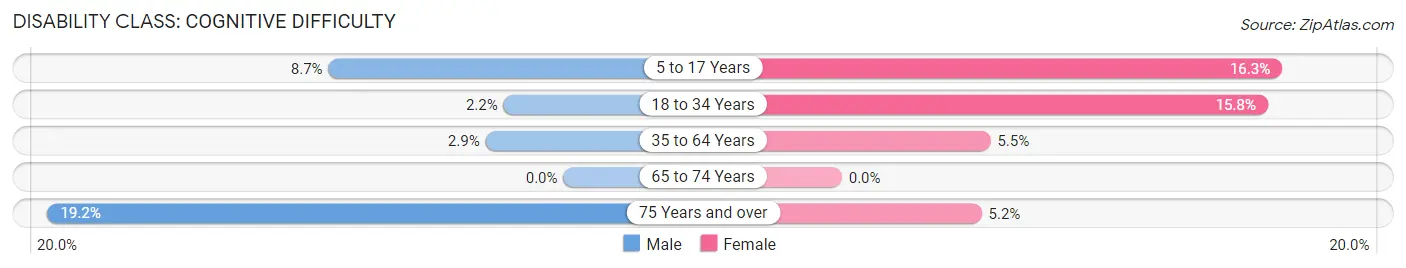
| Age Bracket | Male | Female |
| 5 to 17 Years | 26 (8.7%) | 50 (16.3%) |
| 18 to 34 Years | 6 (2.2%) | 40 (15.8%) |
| 35 to 64 Years | 11 (2.9%) | 30 (5.5%) |
| 65 to 74 Years | 0 (0.0%) | 0 (0.0%) |
| 75 Years and over | 9 (19.2%) | 4 (5.2%) |
Disability Class: Ambulatory Difficulty
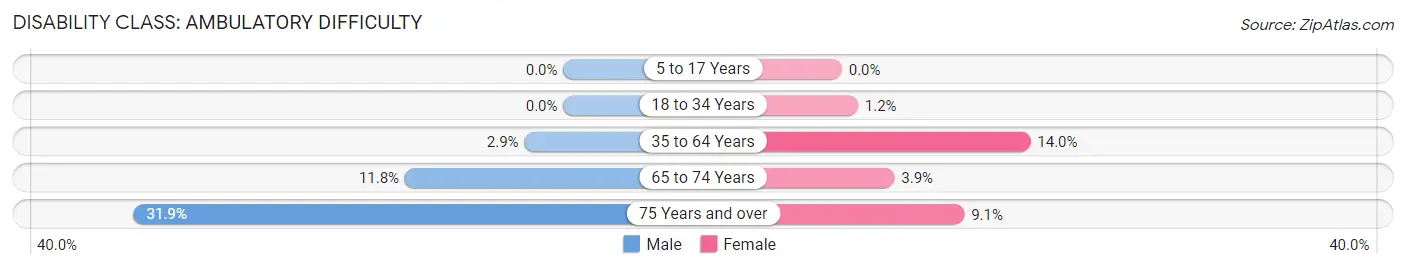
| Age Bracket | Male | Female |
| 5 to 17 Years | 0 (0.0%) | 0 (0.0%) |
| 18 to 34 Years | 0 (0.0%) | 3 (1.2%) |
| 35 to 64 Years | 11 (2.9%) | 76 (14.0%) |
| 65 to 74 Years | 4 (11.8%) | 3 (3.9%) |
| 75 Years and over | 15 (31.9%) | 7 (9.1%) |
Disability Class: Self-Care Difficulty
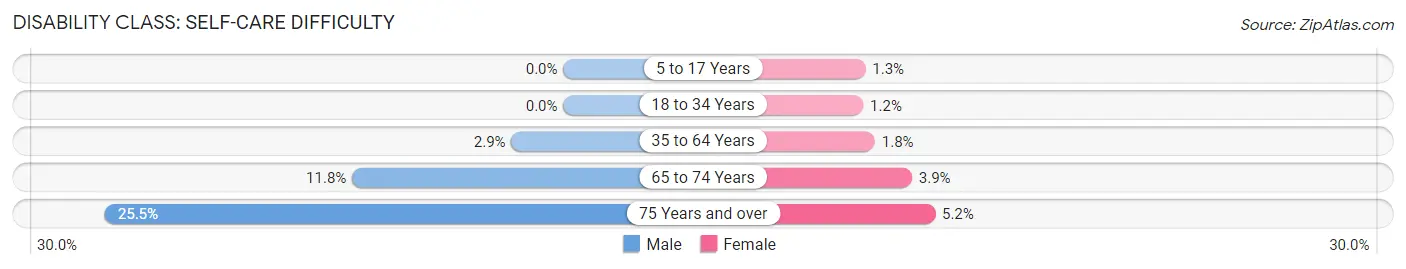
| Age Bracket | Male | Female |
| 5 to 17 Years | 0 (0.0%) | 4 (1.3%) |
| 18 to 34 Years | 0 (0.0%) | 3 (1.2%) |
| 35 to 64 Years | 11 (2.9%) | 10 (1.8%) |
| 65 to 74 Years | 4 (11.8%) | 3 (3.9%) |
| 75 Years and over | 12 (25.5%) | 4 (5.2%) |
Technology Access in Athens
Computing Device Access in Athens
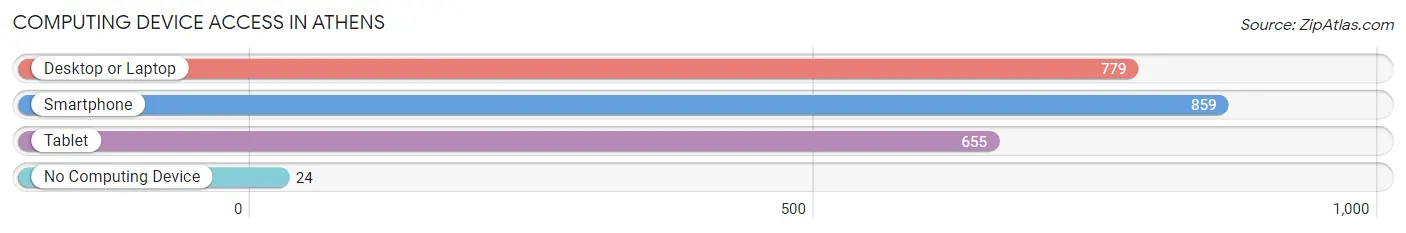
| Device Type | # Households | % Households |
| Desktop or Laptop | 779 | 82.9% |
| Smartphone | 859 | 91.4% |
| Tablet | 655 | 69.7% |
| No Computing Device | 24 | 2.5% |
| Total | 940 | 100.0% |
Internet Access in Athens
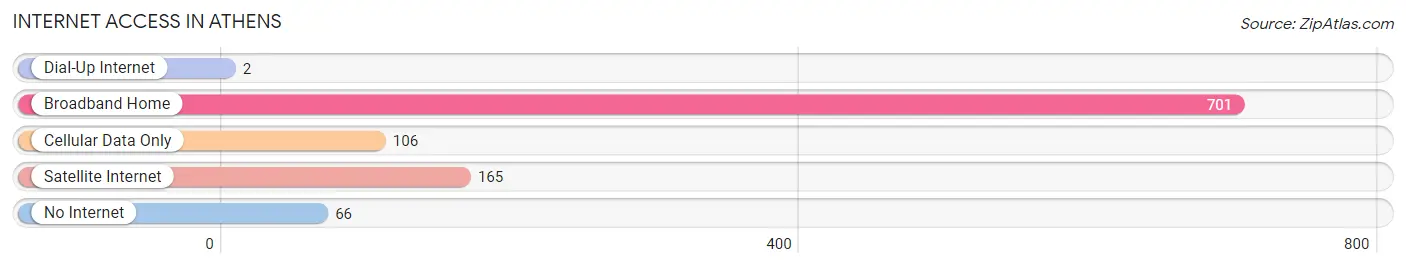
| Internet Type | # Households | % Households |
| Dial-Up Internet | 2 | 0.2% |
| Broadband Home | 701 | 74.6% |
| Cellular Data Only | 106 | 11.3% |
| Satellite Internet | 165 | 17.5% |
| No Internet | 66 | 7.0% |
| Total | 940 | 100.0% |
Athens Summary
Athens is a small city located in Menard County, Illinois, United States. It is situated along the Sangamon River, approximately 20 miles northwest of Springfield. The population was 2,087 at the 2010 census, down from 2,288 at the 2000 census.
History
Athens was founded in 1829 by William and Mary Ann Brown. The town was named after the ancient Greek city of Athens. The Browns built a log cabin on the banks of the Sangamon River and began to develop the town. The first post office was established in 1831 and the first school was built in 1832.
In 1837, the Illinois and Michigan Canal was completed, connecting the Great Lakes to the Mississippi River. This allowed for increased trade and commerce in the area, and Athens began to grow. By 1845, the town had a population of over 500 people.
In 1848, the first railroad line was built through Athens, connecting it to Springfield. This allowed for increased transportation of goods and people, and the town continued to grow. By 1860, the population had grown to 1,000 people.
Athens was incorporated as a city in 1867. The city continued to grow and by 1900, the population had grown to 1,845 people.
Geography
Athens is located at 39°51'45" North, 89°37'45" West (39.8624, -89.6291). According to the 2010 census, the city has a total area of 1.2 square miles (3.1 km2), all land.
The Sangamon River flows through the city, and there are several small creeks and streams in the area. The city is located in the Central Till Plains region of Illinois.
Economy
Athens is a small city with a limited economy. The main industries in the city are agriculture, manufacturing, and retail.
Agriculture is the main industry in the area, with corn, soybeans, and wheat being the main crops. There are also several livestock farms in the area.
Manufacturing is also an important part of the economy. The main industries are food processing, metal fabrication, and plastics.
Retail is also an important part of the economy. There are several small businesses in the city, including restaurants, grocery stores, and clothing stores.
Demographics
Athens is a small city with a population of 2,087 at the 2010 census. The population has decreased since the 2000 census, when it was 2,288.
The racial makeup of the city is 97.2% White, 0.7% African American, 0.3% Native American, 0.2% Asian, 0.1% Pacific Islander, 0.4% from other races, and 1.1% from two or more races. Hispanic or Latino of any race were 1.3% of the population.
The median household income in the city is $41,944, and the median family income is $50,000. The per capita income is $20,845. About 11.2% of the population is below the poverty line.
Common Questions
What is Per Capita Income in Athens?
Per Capita income in Athens is $35,276.
What is the Median Family Income in Athens?
Median Family Income in Athens is $83,125.
What is the Median Household income in Athens?
Median Household Income in Athens is $78,542.
What is Income or Wage Gap in Athens?
Income or Wage Gap in Athens is 12.2%.
Women in Athens earn 87.8 cents for every dollar earned by a man.
What is Inequality or Gini Index in Athens?
Inequality or Gini Index in Athens is 0.40.
What is the Total Population of Athens?
Total Population of Athens is 2,398.
What is the Total Male Population of Athens?
Total Male Population of Athens is 1,066.
What is the Total Female Population of Athens?
Total Female Population of Athens is 1,332.
What is the Ratio of Males per 100 Females in Athens?
There are 80.03 Males per 100 Females in Athens.
What is the Ratio of Females per 100 Males in Athens?
There are 124.95 Females per 100 Males in Athens.
What is the Median Population Age in Athens?
Median Population Age in Athens is 33.7 Years.
What is the Average Family Size in Athens
Average Family Size in Athens is 3.0 People.
What is the Average Household Size in Athens
Average Household Size in Athens is 2.5 People.
How Large is the Labor Force in Athens?
There are 1,311 People in the Labor Forcein in Athens.
What is the Percentage of People in the Labor Force in Athens?
73.8% of People are in the Labor Force in Athens.
What is the Unemployment Rate in Athens?
Unemployment Rate in Athens is 7.1%.