Amboy, IL Map & Demographics
Amboy Map
Amboy Overview
$34,323
PER CAPITA INCOME
$81,635
AVG FAMILY INCOME
$72,829
AVG HOUSEHOLD INCOME
43.9%
WAGE / INCOME GAP [ % ]
56.1¢/ $1
WAGE / INCOME GAP [ $ ]
0.40
INEQUALITY / GINI INDEX
2,413
TOTAL POPULATION
1,245
MALE POPULATION
1,168
FEMALE POPULATION
106.59
MALES / 100 FEMALES
93.82
FEMALES / 100 MALES
45.8
MEDIAN AGE
2.8
AVG FAMILY SIZE
2.4
AVG HOUSEHOLD SIZE
1,331
LABOR FORCE [ PEOPLE ]
67.3%
PERCENT IN LABOR FORCE
5.6%
UNEMPLOYMENT RATE
Amboy Zip Codes
Amboy Area Codes
Income in Amboy
Income Overview in Amboy
Per Capita Income in Amboy is $34,323, while median incomes of families and households are $81,635 and $72,829 respectively.
| Characteristic | Number | Measure |
| Per Capita Income | 2,413 | $34,323 |
| Median Family Income | 683 | $81,635 |
| Mean Family Income | 683 | $100,641 |
| Median Household Income | 980 | $72,829 |
| Mean Household Income | 980 | $84,241 |
| Income Deficit | 683 | $0 |
| Wage / Income Gap (%) | 2,413 | 43.92% |
| Wage / Income Gap ($) | 2,413 | 56.08¢ per $1 |
| Gini / Inequality Index | 2,413 | 0.40 |
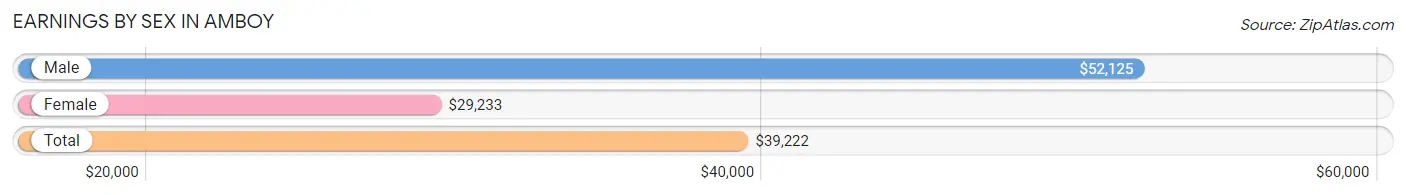
Earnings by Sex in Amboy
Average Earnings in Amboy are $39,222, $52,125 for men and $29,233 for women, a difference of 43.9%.
| Sex | Number | Average Earnings |
| Male | 723 (52.5%) | $52,125 |
| Female | 653 (47.5%) | $29,233 |
| Total | 1,376 (100.0%) | $39,222 |
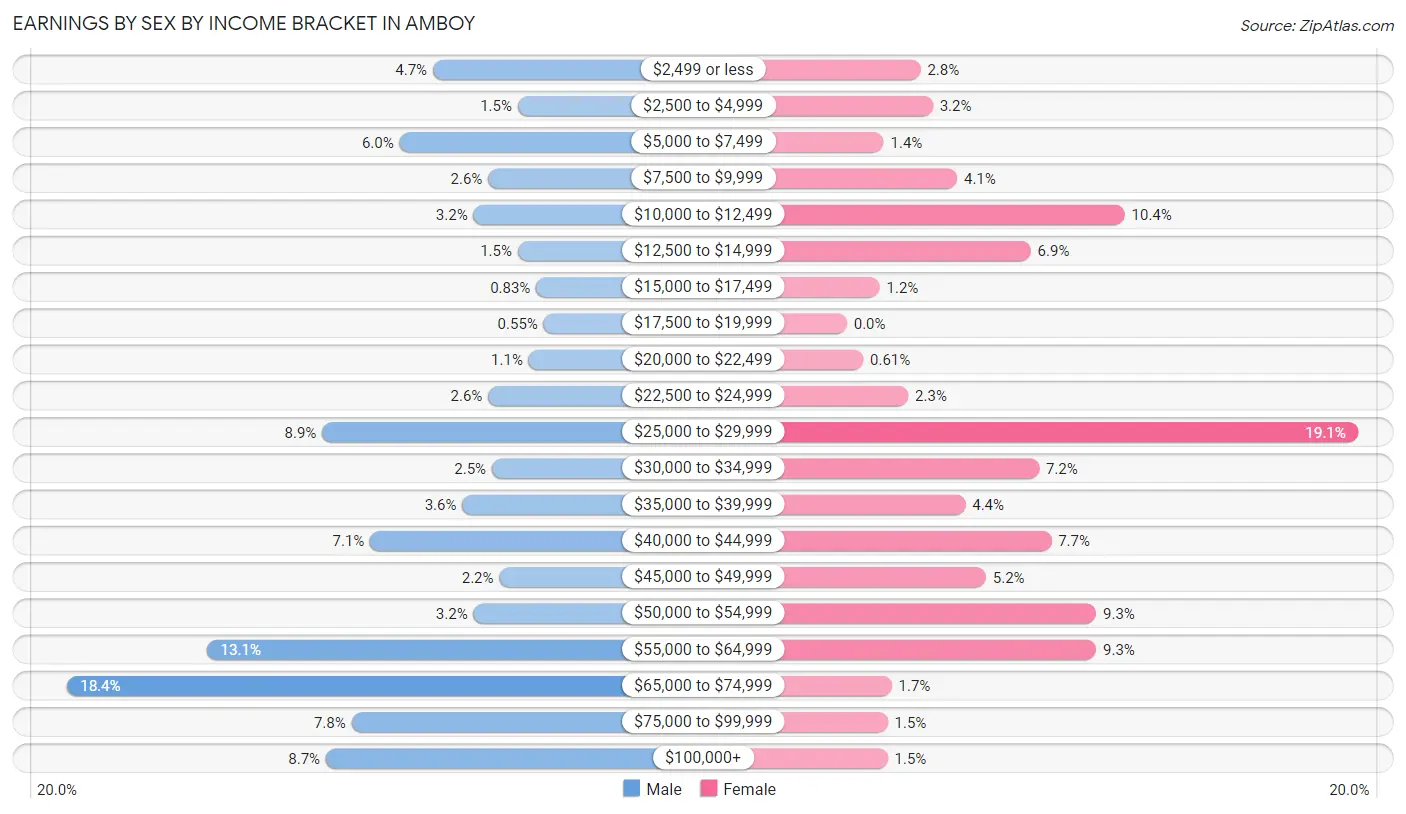
Earnings by Sex by Income Bracket in Amboy
The most common earnings brackets in Amboy are $65,000 to $74,999 for men (133 | 18.4%) and $25,000 to $29,999 for women (125 | 19.1%).
| Income | Male | Female |
| $2,499 or less | 34 (4.7%) | 18 (2.8%) |
| $2,500 to $4,999 | 11 (1.5%) | 21 (3.2%) |
| $5,000 to $7,499 | 43 (5.9%) | 9 (1.4%) |
| $7,500 to $9,999 | 19 (2.6%) | 27 (4.1%) |
| $10,000 to $12,499 | 23 (3.2%) | 68 (10.4%) |
| $12,500 to $14,999 | 11 (1.5%) | 45 (6.9%) |
| $15,000 to $17,499 | 6 (0.8%) | 8 (1.2%) |
| $17,500 to $19,999 | 4 (0.5%) | 0 (0.0%) |
| $20,000 to $22,499 | 8 (1.1%) | 4 (0.6%) |
| $22,500 to $24,999 | 19 (2.6%) | 15 (2.3%) |
| $25,000 to $29,999 | 64 (8.8%) | 125 (19.1%) |
| $30,000 to $34,999 | 18 (2.5%) | 47 (7.2%) |
| $35,000 to $39,999 | 26 (3.6%) | 29 (4.4%) |
| $40,000 to $44,999 | 51 (7.0%) | 50 (7.7%) |
| $45,000 to $49,999 | 16 (2.2%) | 34 (5.2%) |
| $50,000 to $54,999 | 23 (3.2%) | 61 (9.3%) |
| $55,000 to $64,999 | 95 (13.1%) | 61 (9.3%) |
| $65,000 to $74,999 | 133 (18.4%) | 11 (1.7%) |
| $75,000 to $99,999 | 56 (7.7%) | 10 (1.5%) |
| $100,000+ | 63 (8.7%) | 10 (1.5%) |
| Total | 723 (100.0%) | 653 (100.0%) |
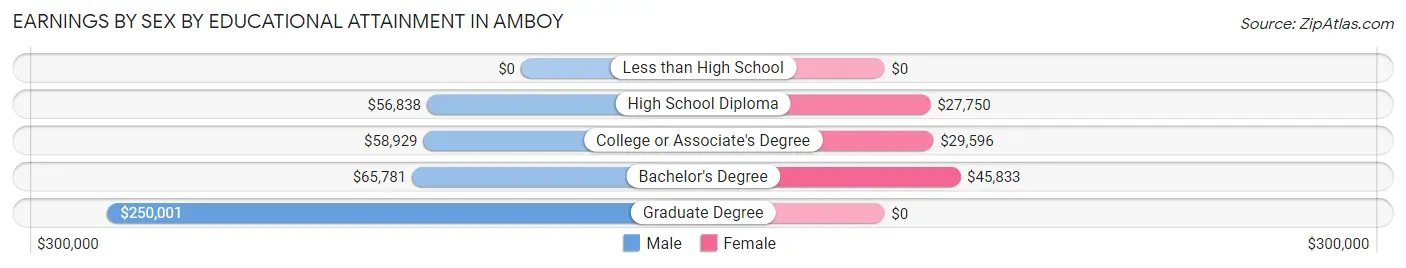
Earnings by Sex by Educational Attainment in Amboy
Average earnings in Amboy are $58,807 for men and $31,023 for women, a difference of 47.2%. Men with an educational attainment of graduate degree enjoy the highest average annual earnings of $250,001, while those with high school diploma education earn the least with $56,838. Women with an educational attainment of bachelor's degree earn the most with the average annual earnings of $45,833, while those with high school diploma education have the smallest earnings of $27,750.
| Educational Attainment | Male Income | Female Income |
| Less than High School | - | - |
| High School Diploma | $56,838 | $27,750 |
| College or Associate's Degree | $58,929 | $29,596 |
| Bachelor's Degree | $65,781 | $45,833 |
| Graduate Degree | $250,001 | $0 |
| Total | $58,807 | $31,023 |
Family Income in Amboy
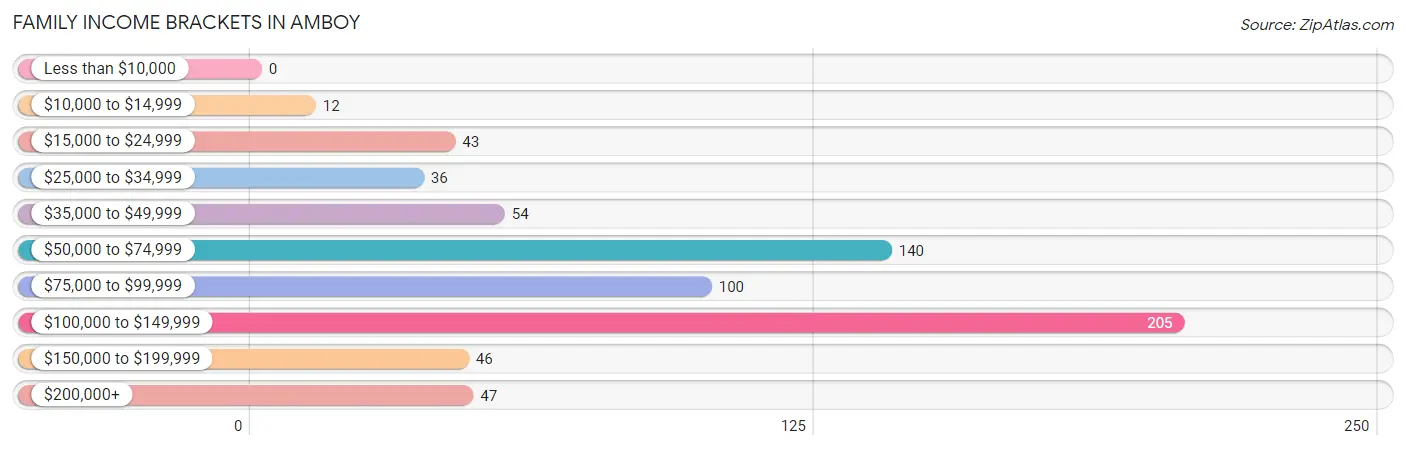
Family Income Brackets in Amboy
According to the Amboy family income data, there are 205 families falling into the $100,000 to $149,999 income range, which is the most common income bracket and makes up 30.0% of all families.
| Income Bracket | # Families | % Families |
| Less than $10,000 | 0 | 0.0% |
| $10,000 to $14,999 | 12 | 1.8% |
| $15,000 to $24,999 | 43 | 6.3% |
| $25,000 to $34,999 | 36 | 5.3% |
| $35,000 to $49,999 | 54 | 7.9% |
| $50,000 to $74,999 | 140 | 20.5% |
| $75,000 to $99,999 | 100 | 14.6% |
| $100,000 to $149,999 | 205 | 30.0% |
| $150,000 to $199,999 | 46 | 6.7% |
| $200,000+ | 47 | 6.9% |
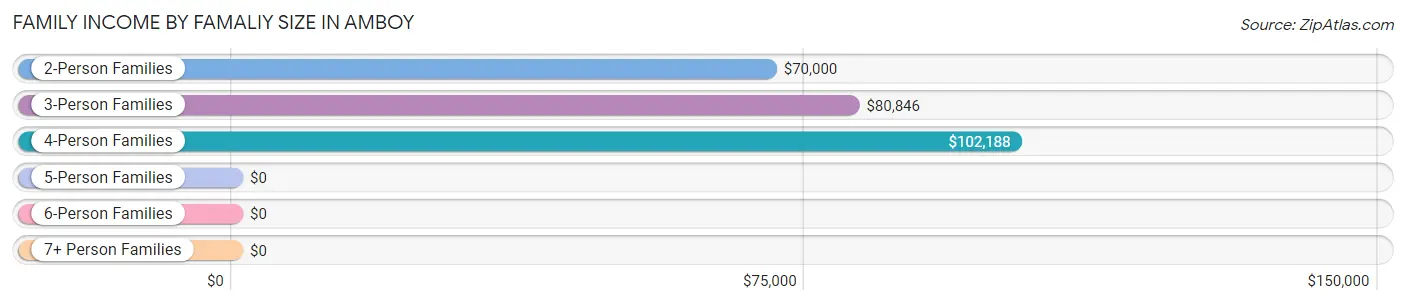
Family Income by Famaliy Size in Amboy
4-person families (116 | 17.0%) account for the highest median family income in Amboy with $102,188 per family, while 2-person families (392 | 57.4%) have the highest median income of $35,000 per family member.
| Income Bracket | # Families | Median Income |
| 2-Person Families | 392 (57.4%) | $70,000 |
| 3-Person Families | 139 (20.3%) | $80,846 |
| 4-Person Families | 116 (17.0%) | $102,188 |
| 5-Person Families | 3 (0.4%) | $0 |
| 6-Person Families | 15 (2.2%) | $0 |
| 7+ Person Families | 18 (2.6%) | $0 |
| Total | 683 (100.0%) | $81,635 |
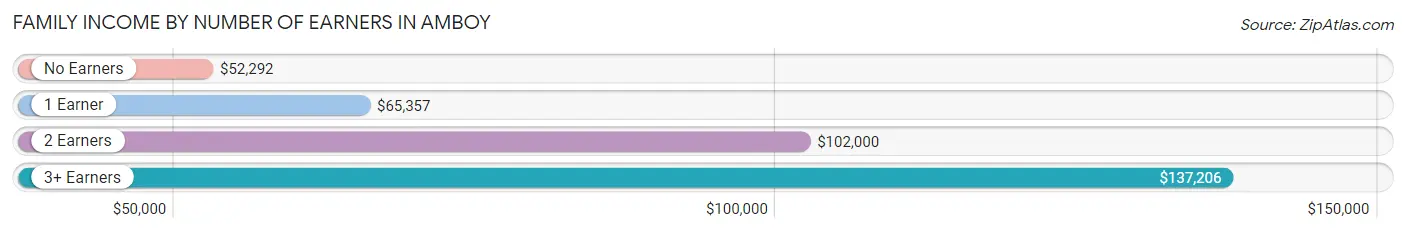
Family Income by Number of Earners in Amboy
The median family income in Amboy is $81,635, with families comprising 3+ earners (124) having the highest median family income of $137,206, while families with no earners (95) have the lowest median family income of $52,292, accounting for 18.2% and 13.9% of families, respectively.
| Number of Earners | # Families | Median Income |
| No Earners | 95 (13.9%) | $52,292 |
| 1 Earner | 222 (32.5%) | $65,357 |
| 2 Earners | 242 (35.4%) | $102,000 |
| 3+ Earners | 124 (18.2%) | $137,206 |
| Total | 683 (100.0%) | $81,635 |
Household Income in Amboy
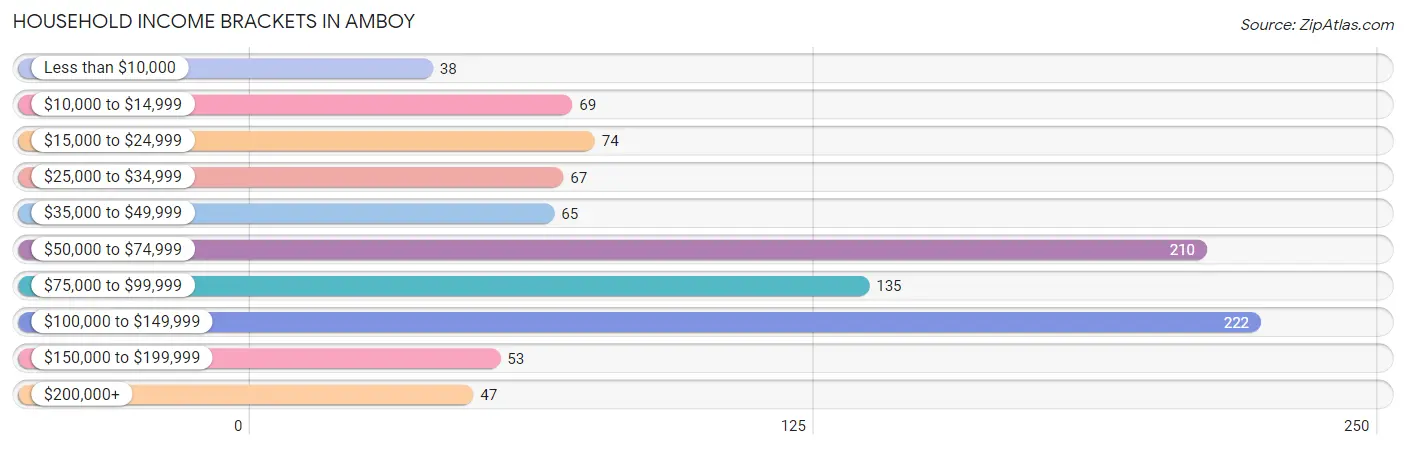
Household Income Brackets in Amboy
With 222 households falling in the category, the $100,000 to $149,999 income range is the most frequent in Amboy, accounting for 22.7% of all households. In contrast, only 38 households (3.9%) fall into the less than $10,000 income bracket, making it the least populous group.
| Income Bracket | # Households | % Households |
| Less than $10,000 | 38 | 3.9% |
| $10,000 to $14,999 | 69 | 7.0% |
| $15,000 to $24,999 | 74 | 7.6% |
| $25,000 to $34,999 | 67 | 6.8% |
| $35,000 to $49,999 | 65 | 6.6% |
| $50,000 to $74,999 | 210 | 21.4% |
| $75,000 to $99,999 | 135 | 13.8% |
| $100,000 to $149,999 | 222 | 22.7% |
| $150,000 to $199,999 | 53 | 5.4% |
| $200,000+ | 47 | 4.8% |
Household Income by Householder Age in Amboy
The median household income in Amboy is $72,829, with the highest median household income of $86,711 found in the 45 to 64 years age bracket for the primary householder. A total of 412 households (42.0%) fall into this category. Meanwhile, the 65+ years age bracket for the primary householder has the lowest median household income of $48,125, with 314 households (32.0%) in this group.
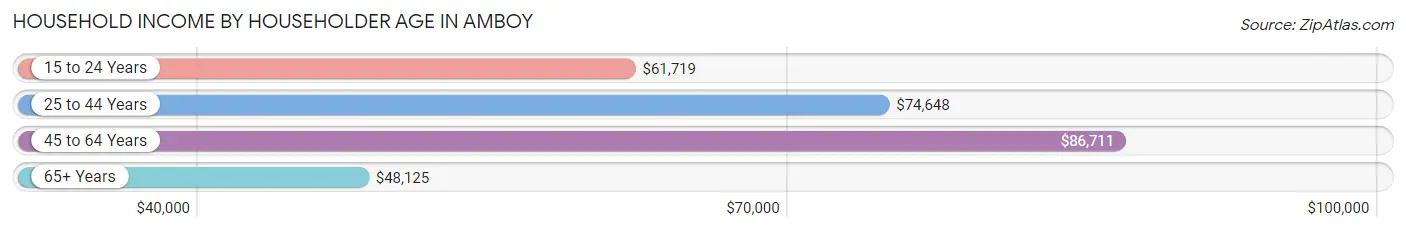
| Income Bracket | # Households | Median Income |
| 15 to 24 Years | 29 (3.0%) | $61,719 |
| 25 to 44 Years | 225 (23.0%) | $74,648 |
| 45 to 64 Years | 412 (42.0%) | $86,711 |
| 65+ Years | 314 (32.0%) | $48,125 |
| Total | 980 (100.0%) | $72,829 |
Poverty in Amboy
Income Below Poverty by Sex and Age in Amboy
With 9.3% poverty level for males and 10.9% for females among the residents of Amboy, 25 to 34 year old males and 18 to 24 year old females are the most vulnerable to poverty, with 38 males (22.0%) and 50 females (59.5%) in their respective age groups living below the poverty level.
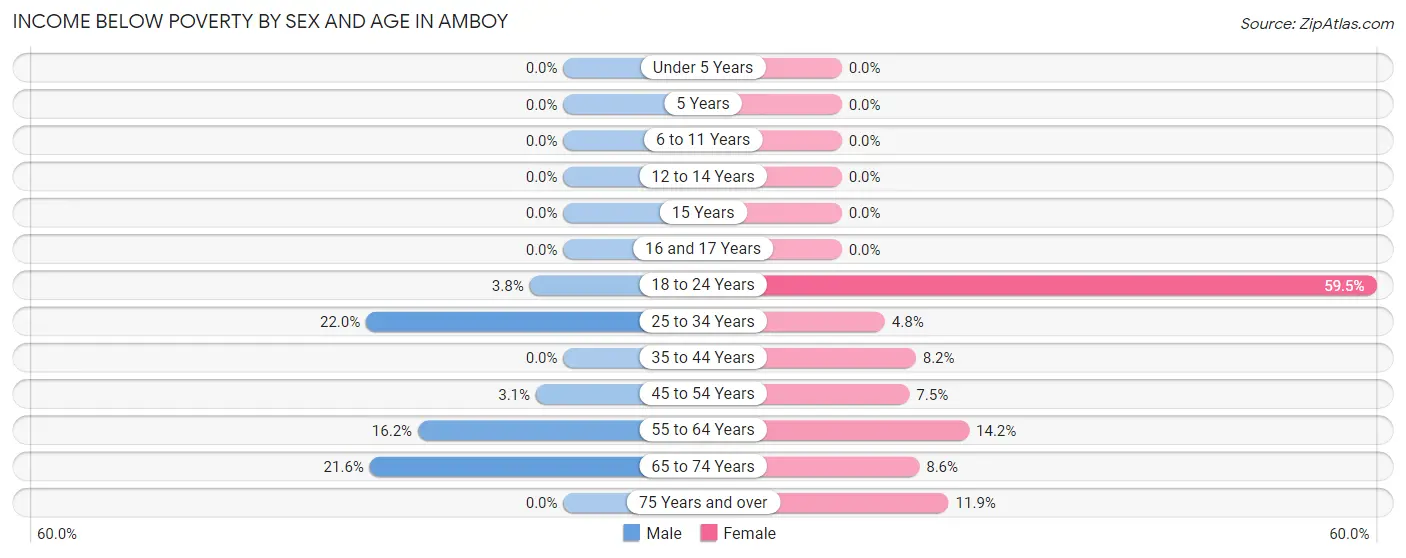
| Age Bracket | Male | Female |
| Under 5 Years | 0 (0.0%) | 0 (0.0%) |
| 5 Years | 0 (0.0%) | 0 (0.0%) |
| 6 to 11 Years | 0 (0.0%) | 0 (0.0%) |
| 12 to 14 Years | 0 (0.0%) | 0 (0.0%) |
| 15 Years | 0 (0.0%) | 0 (0.0%) |
| 16 and 17 Years | 0 (0.0%) | 0 (0.0%) |
| 18 to 24 Years | 4 (3.8%) | 50 (59.5%) |
| 25 to 34 Years | 38 (22.0%) | 6 (4.8%) |
| 35 to 44 Years | 0 (0.0%) | 7 (8.2%) |
| 45 to 54 Years | 6 (3.1%) | 18 (7.5%) |
| 55 to 64 Years | 23 (16.2%) | 20 (14.2%) |
| 65 to 74 Years | 44 (21.6%) | 12 (8.6%) |
| 75 Years and over | 0 (0.0%) | 10 (11.9%) |
| Total | 115 (9.3%) | 123 (10.9%) |
Income Above Poverty by Sex and Age in Amboy
According to the poverty statistics in Amboy, males aged under 5 years and females aged under 5 years are the age groups that are most secure financially, with 100.0% of males and 100.0% of females in these age groups living above the poverty line.
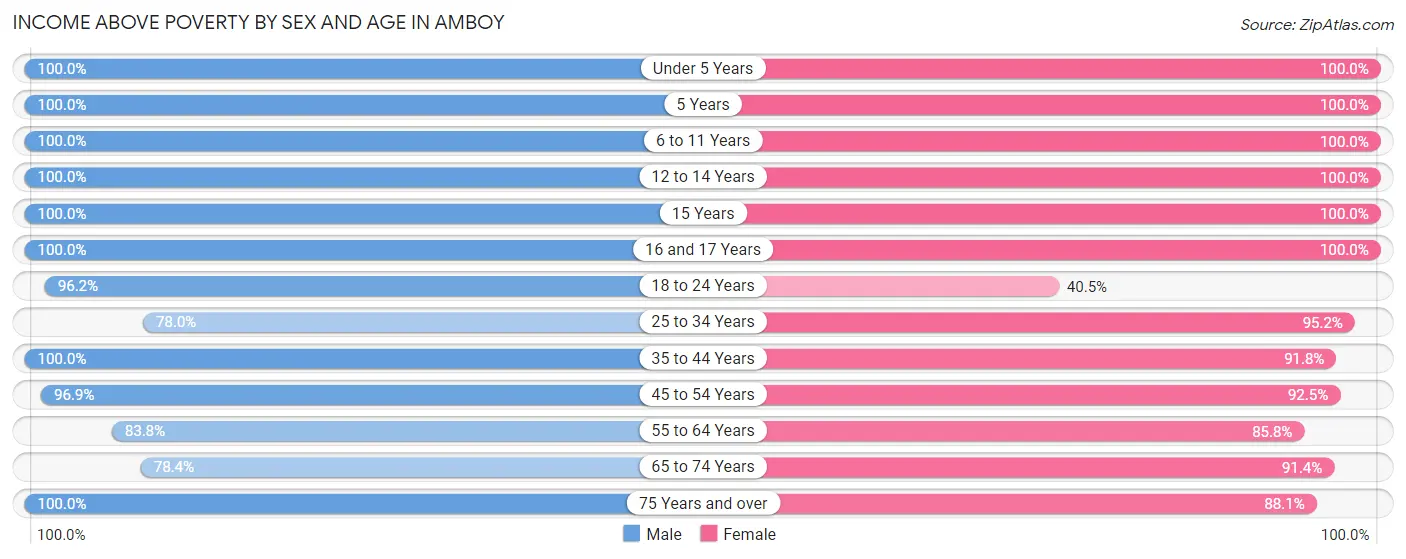
| Age Bracket | Male | Female |
| Under 5 Years | 69 (100.0%) | 70 (100.0%) |
| 5 Years | 7 (100.0%) | 26 (100.0%) |
| 6 to 11 Years | 119 (100.0%) | 68 (100.0%) |
| 12 to 14 Years | 17 (100.0%) | 30 (100.0%) |
| 15 Years | 17 (100.0%) | 6 (100.0%) |
| 16 and 17 Years | 8 (100.0%) | 36 (100.0%) |
| 18 to 24 Years | 102 (96.2%) | 34 (40.5%) |
| 25 to 34 Years | 135 (78.0%) | 119 (95.2%) |
| 35 to 44 Years | 138 (100.0%) | 78 (91.8%) |
| 45 to 54 Years | 190 (96.9%) | 221 (92.5%) |
| 55 to 64 Years | 119 (83.8%) | 121 (85.8%) |
| 65 to 74 Years | 160 (78.4%) | 127 (91.4%) |
| 75 Years and over | 44 (100.0%) | 74 (88.1%) |
| Total | 1,125 (90.7%) | 1,010 (89.1%) |
Income Below Poverty Among Married-Couple Families in Amboy
The poverty statistics for married-couple families in Amboy show that 2.5% or 12 of the total 488 families live below the poverty line. Families with no children have the highest poverty rate of 3.3%, comprising of 12 families. On the other hand, families with 1 or 2 children have the lowest poverty rate of 0.0%, which includes 0 families.
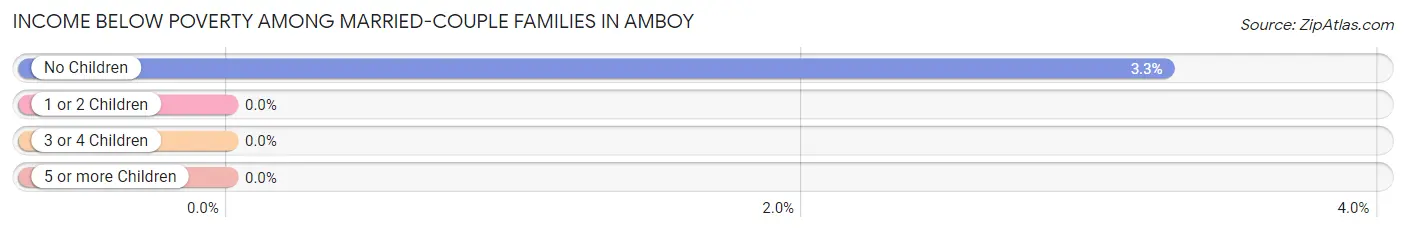
| Children | Above Poverty | Below Poverty |
| No Children | 356 (96.7%) | 12 (3.3%) |
| 1 or 2 Children | 102 (100.0%) | 0 (0.0%) |
| 3 or 4 Children | 18 (100.0%) | 0 (0.0%) |
| 5 or more Children | 0 (0.0%) | 0 (0.0%) |
| Total | 476 (97.5%) | 12 (2.5%) |
Income Below Poverty Among Single-Parent Households in Amboy
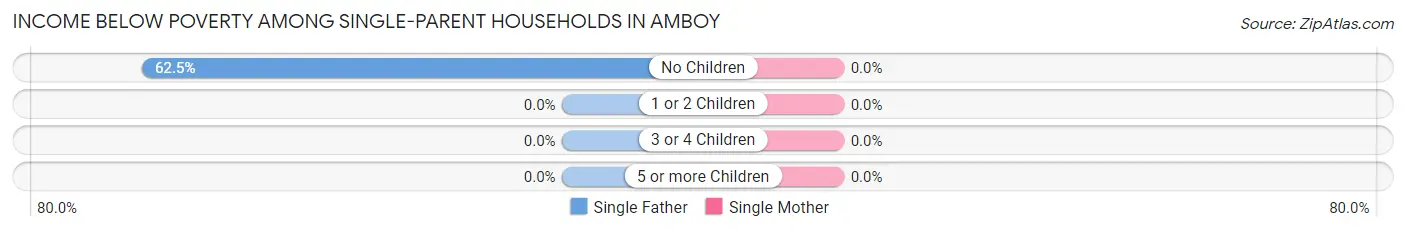
| Children | Single Father | Single Mother |
| No Children | 10 (62.5%) | 0 (0.0%) |
| 1 or 2 Children | 0 (0.0%) | 0 (0.0%) |
| 3 or 4 Children | 0 (0.0%) | 0 (0.0%) |
| 5 or more Children | 0 (0.0%) | 0 (0.0%) |
| Total | 10 (10.5%) | 0 (0.0%) |
Income Below Poverty Among Married-Couple vs Single-Parent Households in Amboy
The poverty data for Amboy shows that 12 of the married-couple family households (2.5%) and 10 of the single-parent households (5.1%) are living below the poverty level. Within the married-couple family households, those with no children have the highest poverty rate, with 12 households (3.3%) falling below the poverty line. Among the single-parent households, those with no children have the highest poverty rate, with 10 household (17.9%) living below poverty.
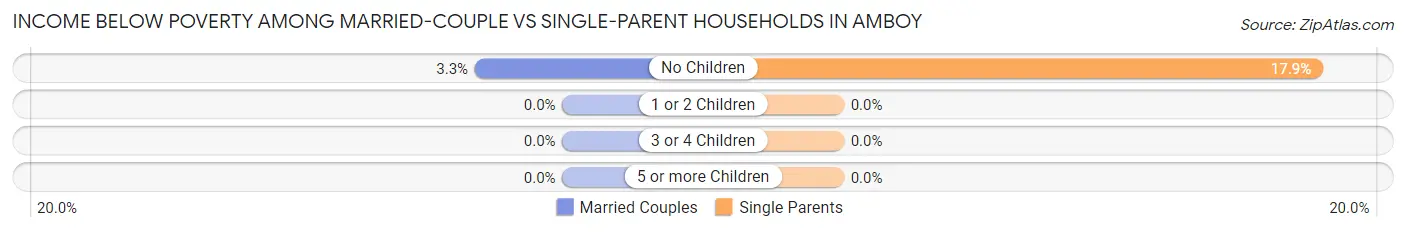
| Children | Married-Couple Families | Single-Parent Households |
| No Children | 12 (3.3%) | 10 (17.9%) |
| 1 or 2 Children | 0 (0.0%) | 0 (0.0%) |
| 3 or 4 Children | 0 (0.0%) | 0 (0.0%) |
| 5 or more Children | 0 (0.0%) | 0 (0.0%) |
| Total | 12 (2.5%) | 10 (5.1%) |
Race in Amboy
The most populous races in Amboy are White / Caucasian (2,303 | 95.4%), Hispanic or Latino (108 | 4.5%), and Two or more Races (94 | 3.9%).
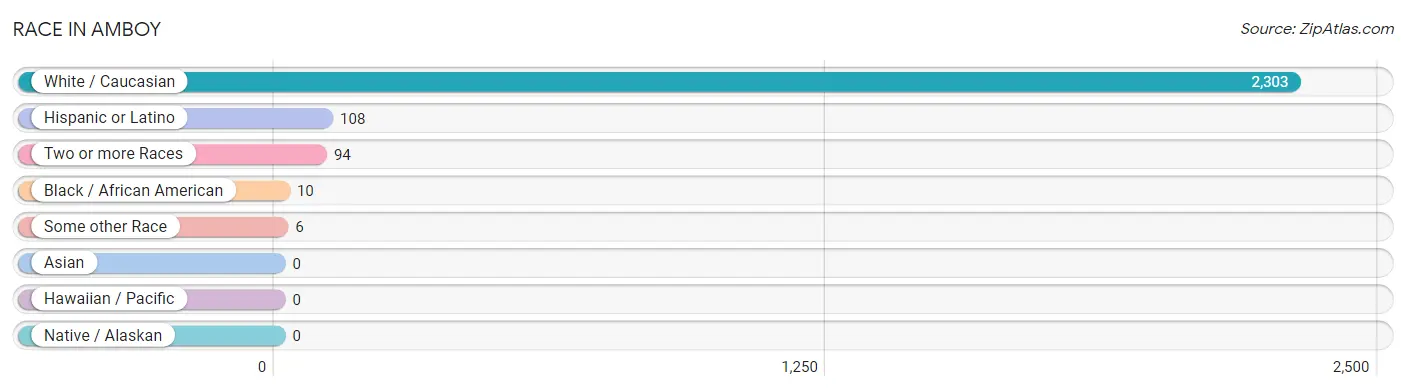
| Race | # Population | % Population |
| Asian | 0 | 0.0% |
| Black / African American | 10 | 0.4% |
| Hawaiian / Pacific | 0 | 0.0% |
| Hispanic or Latino | 108 | 4.5% |
| Native / Alaskan | 0 | 0.0% |
| White / Caucasian | 2,303 | 95.4% |
| Two or more Races | 94 | 3.9% |
| Some other Race | 6 | 0.3% |
| Total | 2,413 | 100.0% |
Ancestry in Amboy
The most populous ancestries reported in Amboy are German (826 | 34.2%), Irish (398 | 16.5%), Dutch (237 | 9.8%), English (209 | 8.7%), and American (103 | 4.3%), together accounting for 73.5% of all Amboy residents.
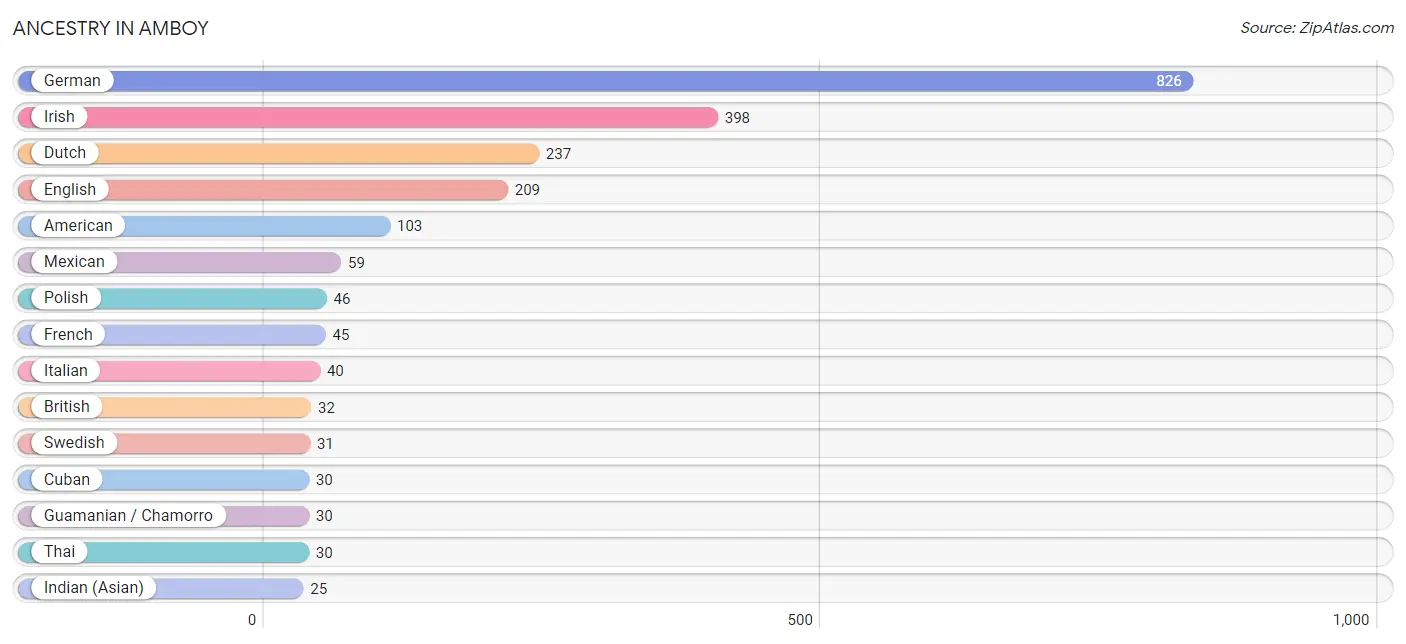
| Ancestry | # Population | % Population |
| American | 103 | 4.3% |
| British | 32 | 1.3% |
| Burmese | 1 | 0.0% |
| Cuban | 30 | 1.2% |
| Czech | 6 | 0.3% |
| Dutch | 237 | 9.8% |
| English | 209 | 8.7% |
| European | 22 | 0.9% |
| French | 45 | 1.9% |
| German | 826 | 34.2% |
| Greek | 17 | 0.7% |
| Guamanian / Chamorro | 30 | 1.2% |
| Indian (Asian) | 25 | 1.0% |
| Irish | 398 | 16.5% |
| Italian | 40 | 1.7% |
| Lithuanian | 6 | 0.3% |
| Mexican | 59 | 2.5% |
| Norwegian | 16 | 0.7% |
| Polish | 46 | 1.9% |
| Puerto Rican | 13 | 0.5% |
| Romanian | 8 | 0.3% |
| Russian | 19 | 0.8% |
| Samoan | 25 | 1.0% |
| Scotch-Irish | 11 | 0.5% |
| Scottish | 22 | 0.9% |
| Serbian | 4 | 0.2% |
| Swedish | 31 | 1.3% |
| Swiss | 5 | 0.2% |
| Thai | 30 | 1.2% | View All 29 Rows |
Immigrants in Amboy
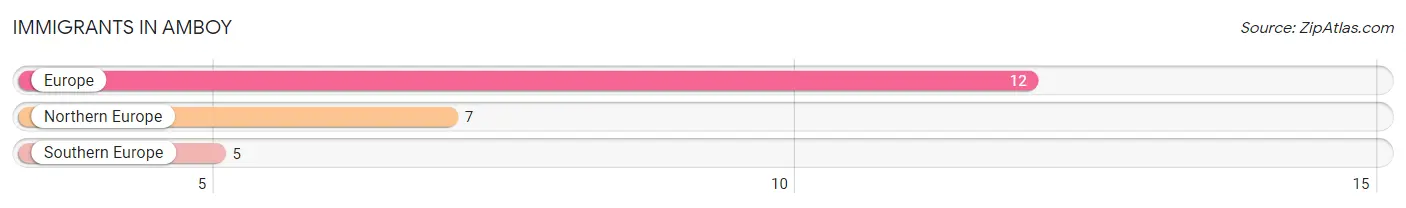
The most numerous immigrant groups reported in Amboy came from Europe (12 | 0.5%), Northern Europe (7 | 0.3%), and Southern Europe (5 | 0.2%), together accounting for 1.0% of all Amboy residents.
| Immigration Origin | # Population | % Population |
| Europe | 12 | 0.5% |
| Northern Europe | 7 | 0.3% |
| Southern Europe | 5 | 0.2% | View All 3 Rows |
Sex and Age in Amboy
Sex and Age in Amboy
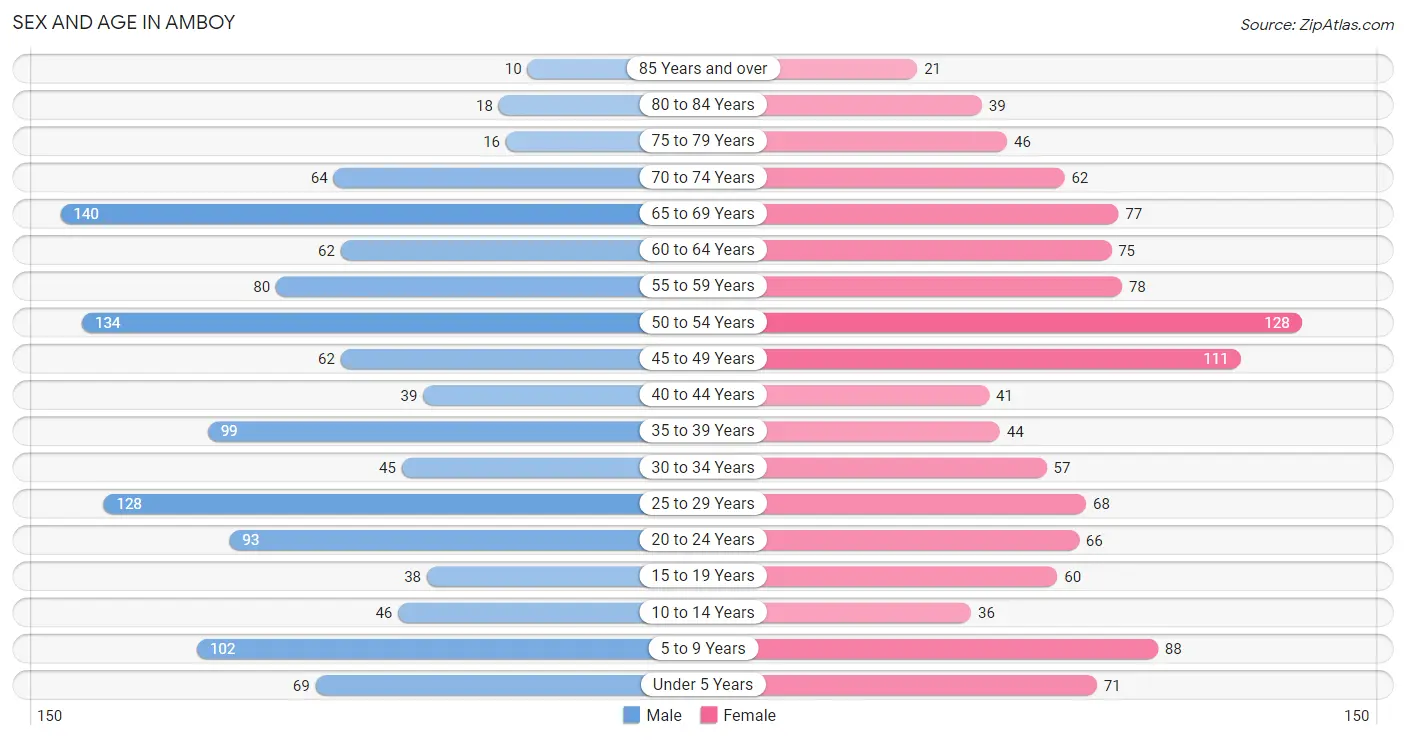
The most populous age groups in Amboy are 65 to 69 Years (140 | 11.2%) for men and 50 to 54 Years (128 | 11.0%) for women.
| Age Bracket | Male | Female |
| Under 5 Years | 69 (5.5%) | 71 (6.1%) |
| 5 to 9 Years | 102 (8.2%) | 88 (7.5%) |
| 10 to 14 Years | 46 (3.7%) | 36 (3.1%) |
| 15 to 19 Years | 38 (3.0%) | 60 (5.1%) |
| 20 to 24 Years | 93 (7.5%) | 66 (5.7%) |
| 25 to 29 Years | 128 (10.3%) | 68 (5.8%) |
| 30 to 34 Years | 45 (3.6%) | 57 (4.9%) |
| 35 to 39 Years | 99 (8.0%) | 44 (3.8%) |
| 40 to 44 Years | 39 (3.1%) | 41 (3.5%) |
| 45 to 49 Years | 62 (5.0%) | 111 (9.5%) |
| 50 to 54 Years | 134 (10.8%) | 128 (11.0%) |
| 55 to 59 Years | 80 (6.4%) | 78 (6.7%) |
| 60 to 64 Years | 62 (5.0%) | 75 (6.4%) |
| 65 to 69 Years | 140 (11.2%) | 77 (6.6%) |
| 70 to 74 Years | 64 (5.1%) | 62 (5.3%) |
| 75 to 79 Years | 16 (1.3%) | 46 (3.9%) |
| 80 to 84 Years | 18 (1.5%) | 39 (3.3%) |
| 85 Years and over | 10 (0.8%) | 21 (1.8%) |
| Total | 1,245 (100.0%) | 1,168 (100.0%) |
Families and Households in Amboy
Median Family Size in Amboy
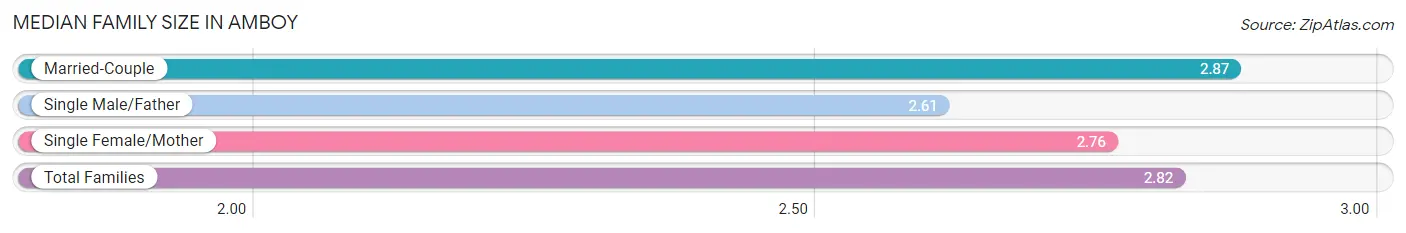
The median family size in Amboy is 2.82 persons per family, with married-couple families (488 | 71.5%) accounting for the largest median family size of 2.87 persons per family. On the other hand, single male/father families (95 | 13.9%) represent the smallest median family size with 2.61 persons per family.
| Family Type | # Families | Family Size |
| Married-Couple | 488 (71.5%) | 2.87 |
| Single Male/Father | 95 (13.9%) | 2.61 |
| Single Female/Mother | 100 (14.6%) | 2.76 |
| Total Families | 683 (100.0%) | 2.82 |
Median Household Size in Amboy
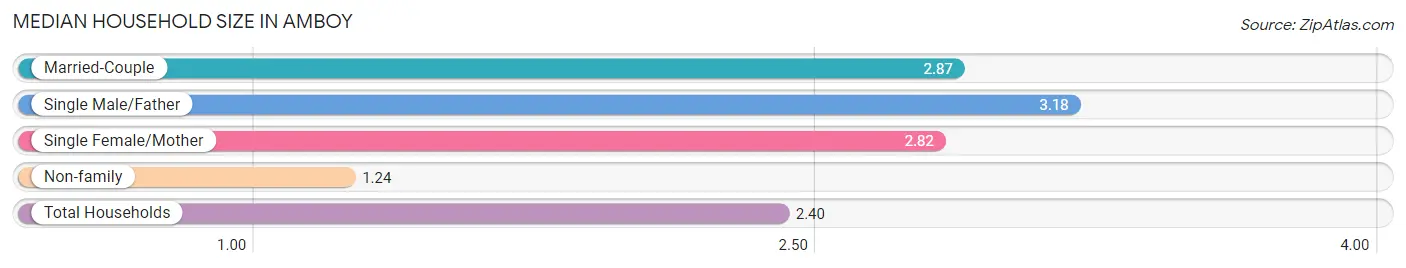
The median household size in Amboy is 2.40 persons per household, with single male/father households (95 | 9.7%) accounting for the largest median household size of 3.18 persons per household. non-family households (297 | 30.3%) represent the smallest median household size with 1.24 persons per household.
| Household Type | # Households | Household Size |
| Married-Couple | 488 (49.8%) | 2.87 |
| Single Male/Father | 95 (9.7%) | 3.18 |
| Single Female/Mother | 100 (10.2%) | 2.82 |
| Non-family | 297 (30.3%) | 1.24 |
| Total Households | 980 (100.0%) | 2.40 |
Household Size by Marriage Status in Amboy
Out of a total of 980 households in Amboy, 683 (69.7%) are family households, while 297 (30.3%) are nonfamily households. The most numerous type of family households are 2-person households, comprising 377, and the most common type of nonfamily households are 1-person households, comprising 256.
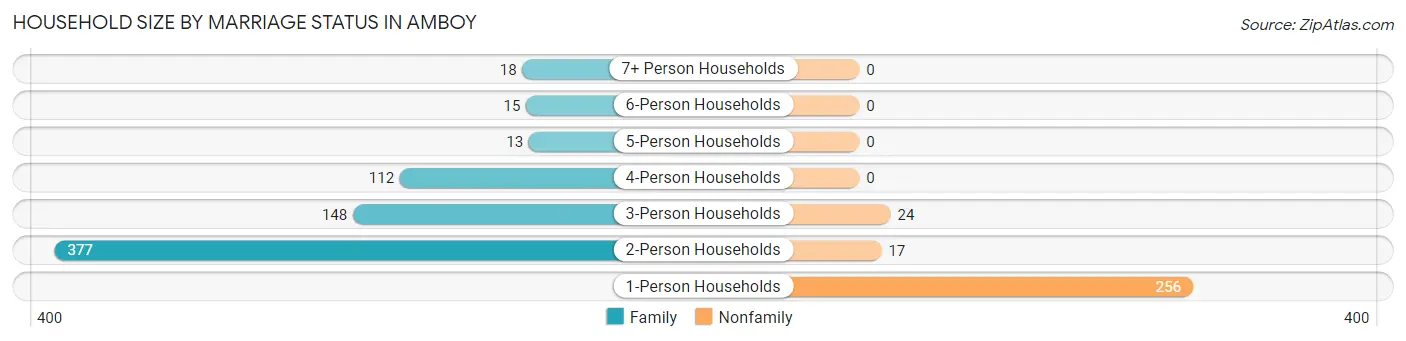
| Household Size | Family Households | Nonfamily Households |
| 1-Person Households | - | 256 (26.1%) |
| 2-Person Households | 377 (38.5%) | 17 (1.7%) |
| 3-Person Households | 148 (15.1%) | 24 (2.5%) |
| 4-Person Households | 112 (11.4%) | 0 (0.0%) |
| 5-Person Households | 13 (1.3%) | 0 (0.0%) |
| 6-Person Households | 15 (1.5%) | 0 (0.0%) |
| 7+ Person Households | 18 (1.8%) | 0 (0.0%) |
| Total | 683 (69.7%) | 297 (30.3%) |
Female Fertility in Amboy
Fertility by Age in Amboy
Average fertility rate in Amboy is 28.0 births per 1,000 women. Women in the age bracket of 20 to 34 years have the highest fertility rate with 47.0 births per 1,000 women. Women in the age bracket of 20 to 34 years acount for 69.2% of all women with births.
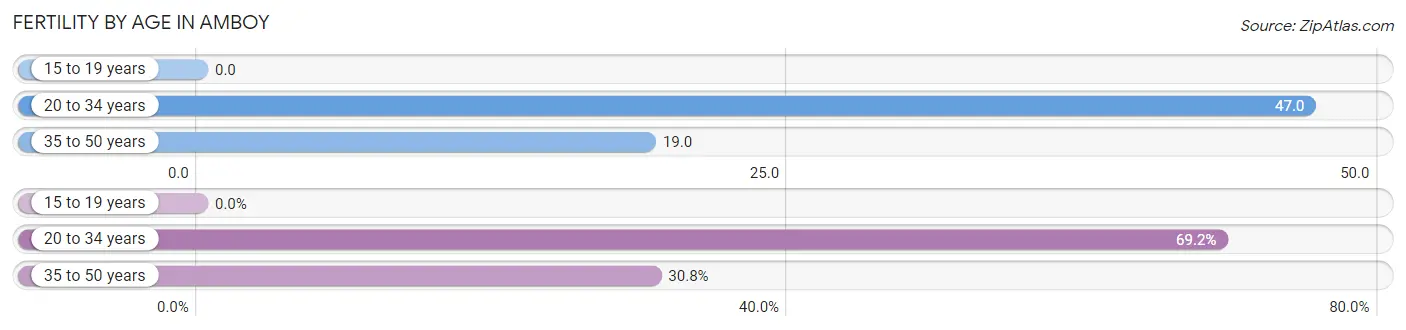
| Age Bracket | Women with Births | Births / 1,000 Women |
| 15 to 19 years | 0 (0.0%) | 0.0 |
| 20 to 34 years | 9 (69.2%) | 47.0 |
| 35 to 50 years | 4 (30.8%) | 19.0 |
| Total | 13 (100.0%) | 28.0 |
Fertility by Age by Marriage Status in Amboy
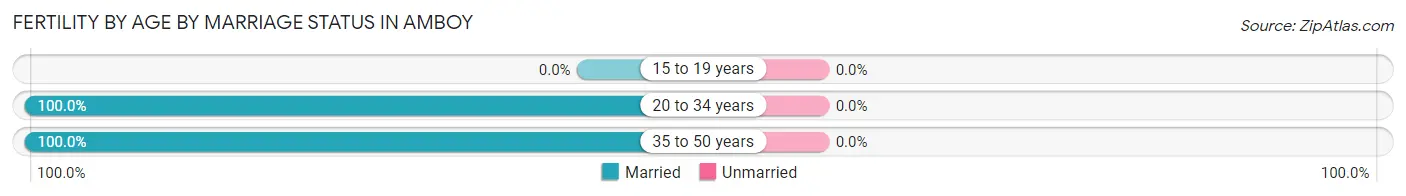
| Age Bracket | Married | Unmarried |
| 15 to 19 years | 0 (0.0%) | 0 (0.0%) |
| 20 to 34 years | 9 (100.0%) | 0 (0.0%) |
| 35 to 50 years | 4 (100.0%) | 0 (0.0%) |
| Total | 13 (100.0%) | 0 (0.0%) |
Fertility by Education in Amboy
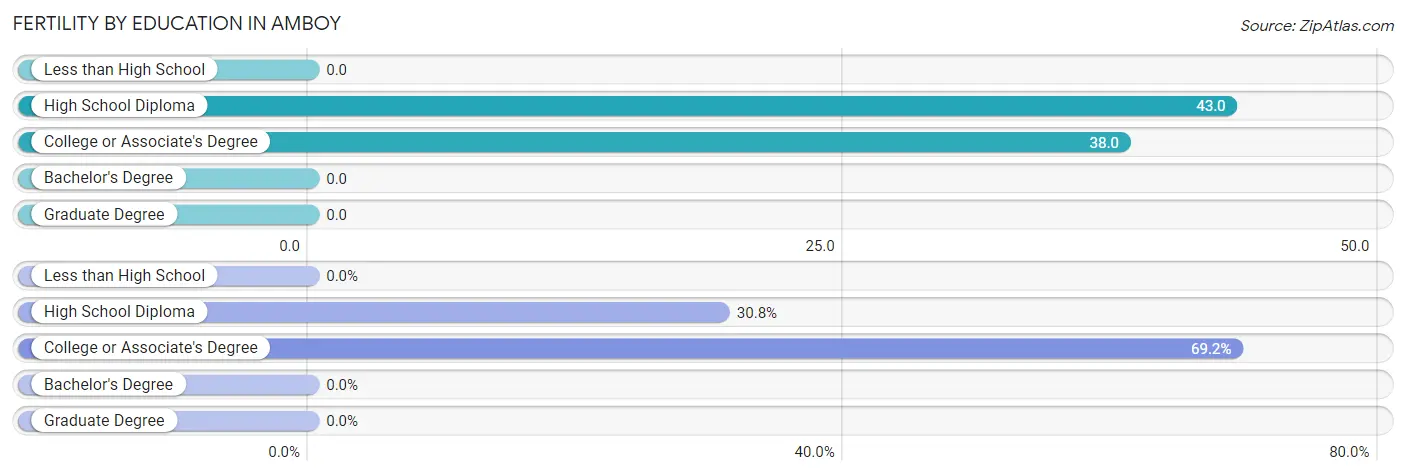
| Educational Attainment | Women with Births | Births / 1,000 Women |
| Less than High School | 0 (0.0%) | 0.0 |
| High School Diploma | 4 (30.8%) | 43.0 |
| College or Associate's Degree | 9 (69.2%) | 38.0 |
| Bachelor's Degree | 0 (0.0%) | 0.0 |
| Graduate Degree | 0 (0.0%) | 0.0 |
| Total | 13 (100.0%) | 28.0 |
Fertility by Education by Marriage Status in Amboy
| Educational Attainment | Married | Unmarried |
| Less than High School | 0 (0.0%) | 0 (0.0%) |
| High School Diploma | 4 (100.0%) | 0 (0.0%) |
| College or Associate's Degree | 9 (100.0%) | 0 (0.0%) |
| Bachelor's Degree | 0 (0.0%) | 0 (0.0%) |
| Graduate Degree | 0 (0.0%) | 0 (0.0%) |
| Total | 13 (100.0%) | 0 (0.0%) |
Employment Characteristics in Amboy
Employment by Class of Employer in Amboy
Among the 1,238 employed individuals in Amboy, private company employees (810 | 65.4%), not-for-profit organizations (158 | 12.8%), and local government employees (124 | 10.0%) make up the most common classes of employment.
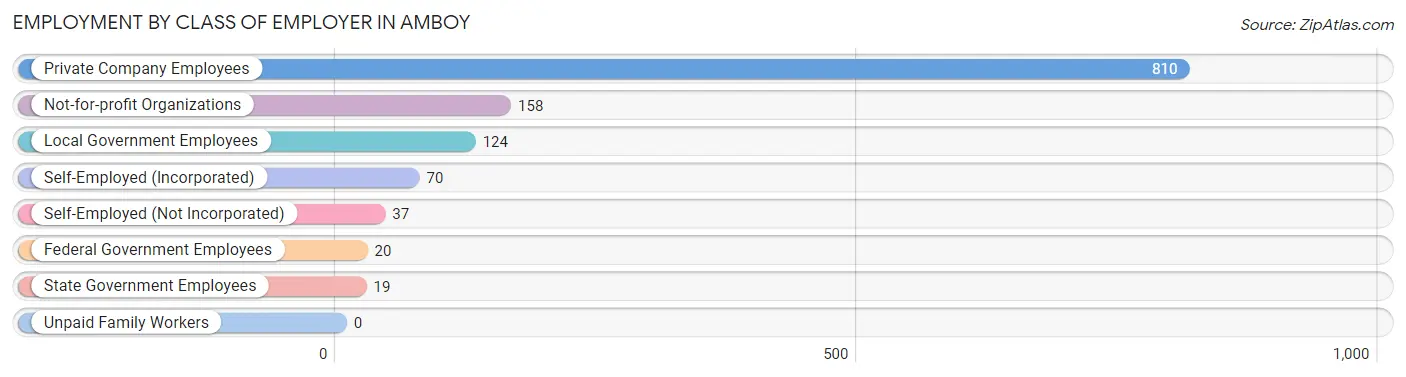
| Employer Class | # Employees | % Employees |
| Private Company Employees | 810 | 65.4% |
| Self-Employed (Incorporated) | 70 | 5.7% |
| Self-Employed (Not Incorporated) | 37 | 3.0% |
| Not-for-profit Organizations | 158 | 12.8% |
| Local Government Employees | 124 | 10.0% |
| State Government Employees | 19 | 1.5% |
| Federal Government Employees | 20 | 1.6% |
| Unpaid Family Workers | 0 | 0.0% |
| Total | 1,238 | 100.0% |
Employment Status by Age in Amboy
According to the labor force statistics for Amboy, out of the total population over 16 years of age (1,978), 67.3% or 1,331 individuals are in the labor force, with 5.6% or 75 of them unemployed. The age group with the highest labor force participation rate is 30 to 34 years, with 100.0% or 102 individuals in the labor force. Within the labor force, the 25 to 29 years age range has the highest percentage of unemployed individuals, with 14.9% or 24 of them being unemployed.
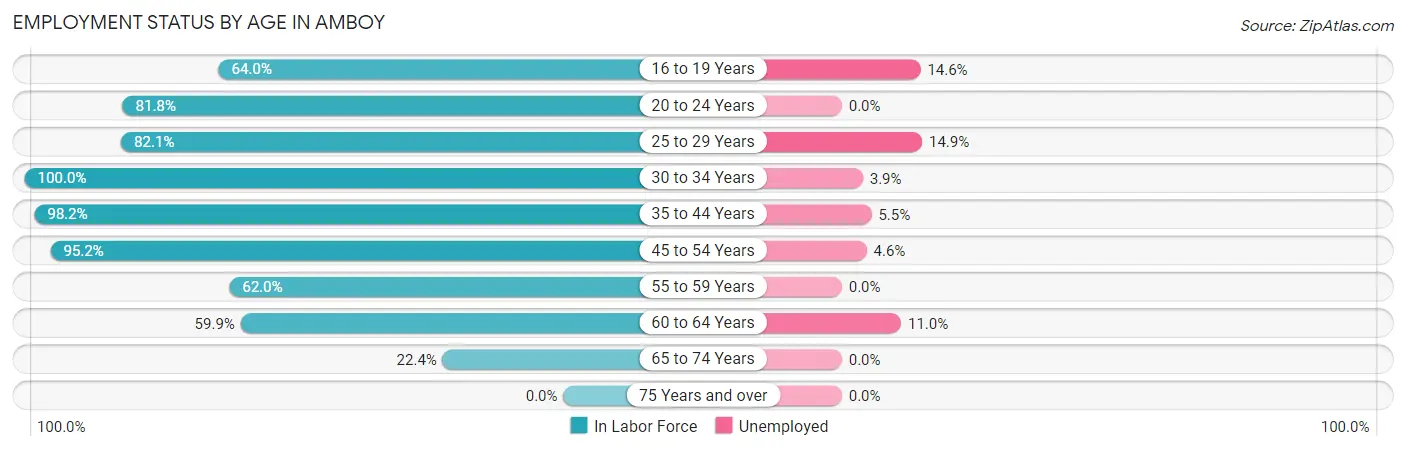
| Age Bracket | In Labor Force | Unemployed |
| 16 to 19 Years | 48 (64.0%) | 7 (14.6%) |
| 20 to 24 Years | 130 (81.8%) | 0 (0.0%) |
| 25 to 29 Years | 161 (82.1%) | 24 (14.9%) |
| 30 to 34 Years | 102 (100.0%) | 4 (3.9%) |
| 35 to 44 Years | 219 (98.2%) | 12 (5.5%) |
| 45 to 54 Years | 414 (95.2%) | 19 (4.6%) |
| 55 to 59 Years | 98 (62.0%) | 0 (0.0%) |
| 60 to 64 Years | 82 (59.9%) | 9 (11.0%) |
| 65 to 74 Years | 77 (22.4%) | 0 (0.0%) |
| 75 Years and over | 0 (0.0%) | 0 (0.0%) |
| Total | 1,331 (67.3%) | 75 (5.6%) |
Employment Status by Educational Attainment in Amboy
According to labor force statistics for Amboy, 86.0% of individuals (1,076) out of the total population between 25 and 64 years of age (1,251) are in the labor force, with 6.3% or 68 of them being unemployed. The group with the highest labor force participation rate are those with the educational attainment of bachelor's degree or higher, with 94.1% or 175 individuals in the labor force. Within the labor force, individuals with less than high school education have the highest percentage of unemployment, with 22.0% or 11 of them being unemployed.
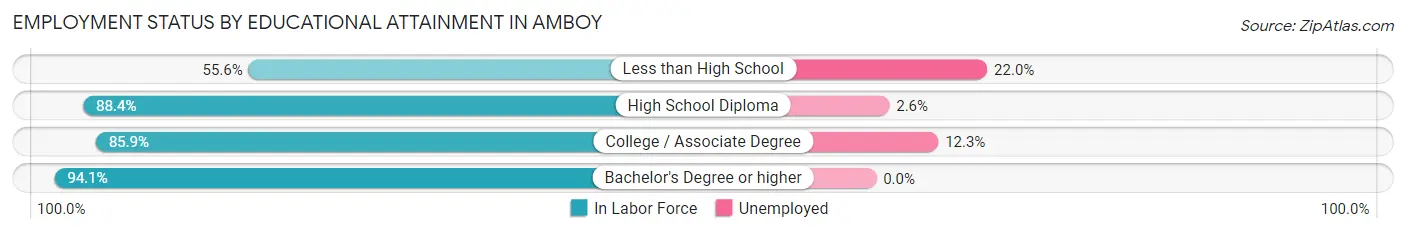
| Educational Attainment | In Labor Force | Unemployed |
| Less than High School | 50 (55.6%) | 20 (22.0%) |
| High School Diploma | 493 (88.4%) | 15 (2.6%) |
| College / Associate Degree | 358 (85.9%) | 51 (12.3%) |
| Bachelor's Degree or higher | 175 (94.1%) | 0 (0.0%) |
| Total | 1,076 (86.0%) | 79 (6.3%) |
Employment Occupations by Sex in Amboy
Management, Business, Science and Arts Occupations
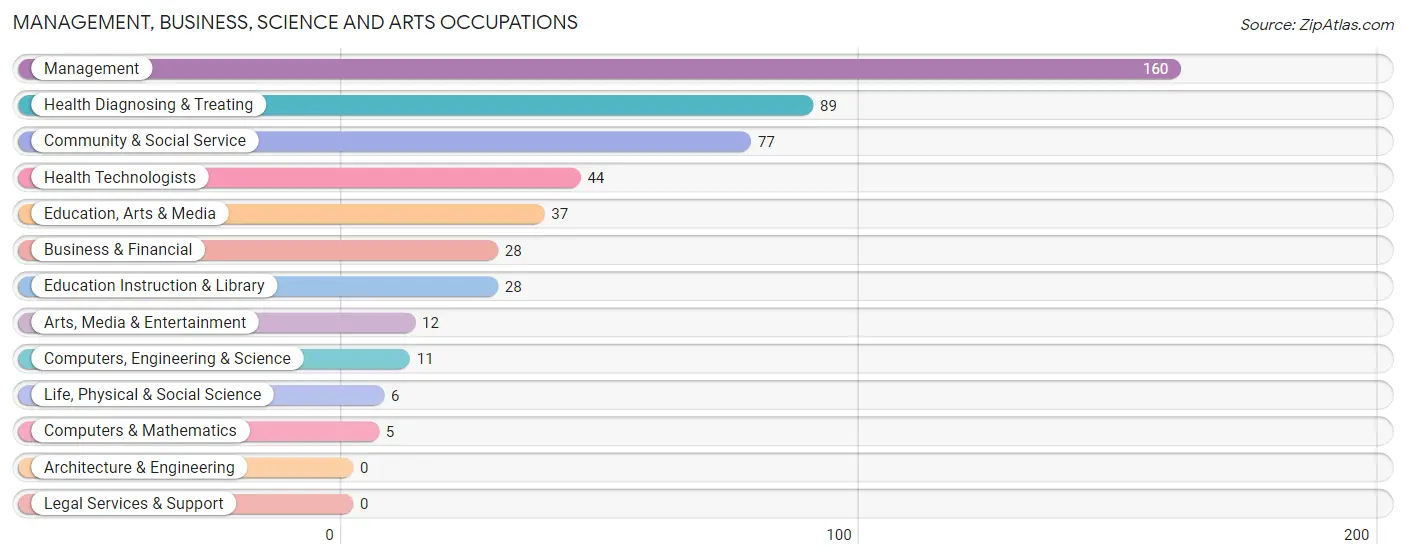
The most common Management, Business, Science and Arts occupations in Amboy are Management (160 | 12.7%), Health Diagnosing & Treating (89 | 7.1%), Community & Social Service (77 | 6.1%), Health Technologists (44 | 3.5%), and Education, Arts & Media (37 | 2.9%).
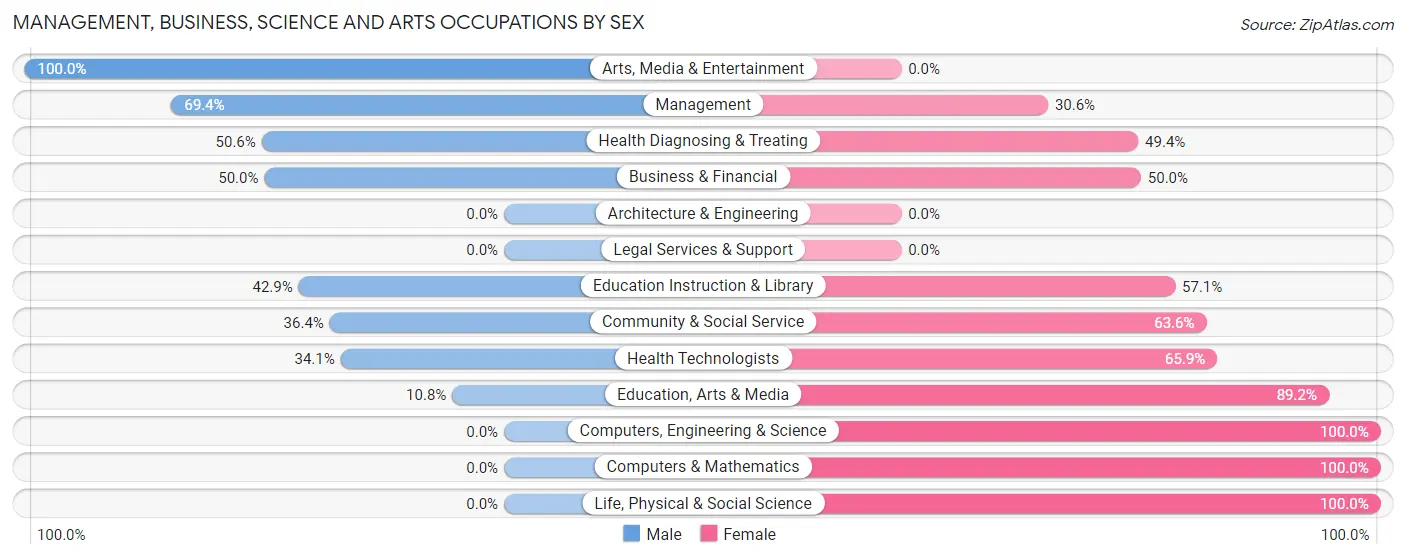
Management, Business, Science and Arts Occupations by Sex
Within the Management, Business, Science and Arts occupations in Amboy, the most male-oriented occupations are Arts, Media & Entertainment (100.0%), Management (69.4%), and Health Diagnosing & Treating (50.6%), while the most female-oriented occupations are Computers, Engineering & Science (100.0%), Computers & Mathematics (100.0%), and Life, Physical & Social Science (100.0%).
| Occupation | Male | Female |
| Management | 111 (69.4%) | 49 (30.6%) |
| Business & Financial | 14 (50.0%) | 14 (50.0%) |
| Computers, Engineering & Science | 0 (0.0%) | 11 (100.0%) |
| Computers & Mathematics | 0 (0.0%) | 5 (100.0%) |
| Architecture & Engineering | 0 (0.0%) | 0 (0.0%) |
| Life, Physical & Social Science | 0 (0.0%) | 6 (100.0%) |
| Community & Social Service | 28 (36.4%) | 49 (63.6%) |
| Education, Arts & Media | 4 (10.8%) | 33 (89.2%) |
| Legal Services & Support | 0 (0.0%) | 0 (0.0%) |
| Education Instruction & Library | 12 (42.9%) | 16 (57.1%) |
| Arts, Media & Entertainment | 12 (100.0%) | 0 (0.0%) |
| Health Diagnosing & Treating | 45 (50.6%) | 44 (49.4%) |
| Health Technologists | 15 (34.1%) | 29 (65.9%) |
| Total (Category) | 198 (54.2%) | 167 (45.8%) |
| Total (Overall) | 677 (53.9%) | 579 (46.1%) |
Services Occupations
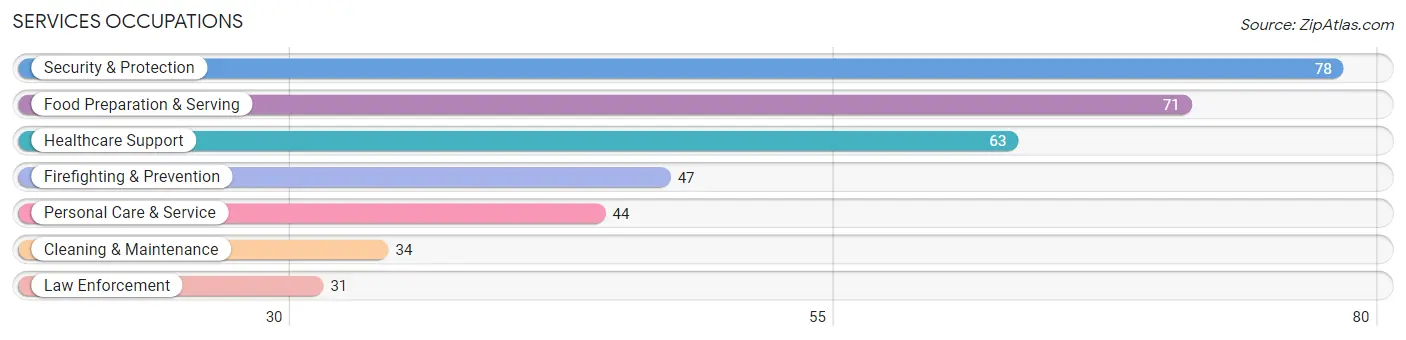
The most common Services occupations in Amboy are Security & Protection (78 | 6.2%), Food Preparation & Serving (71 | 5.7%), Healthcare Support (63 | 5.0%), Firefighting & Prevention (47 | 3.7%), and Personal Care & Service (44 | 3.5%).
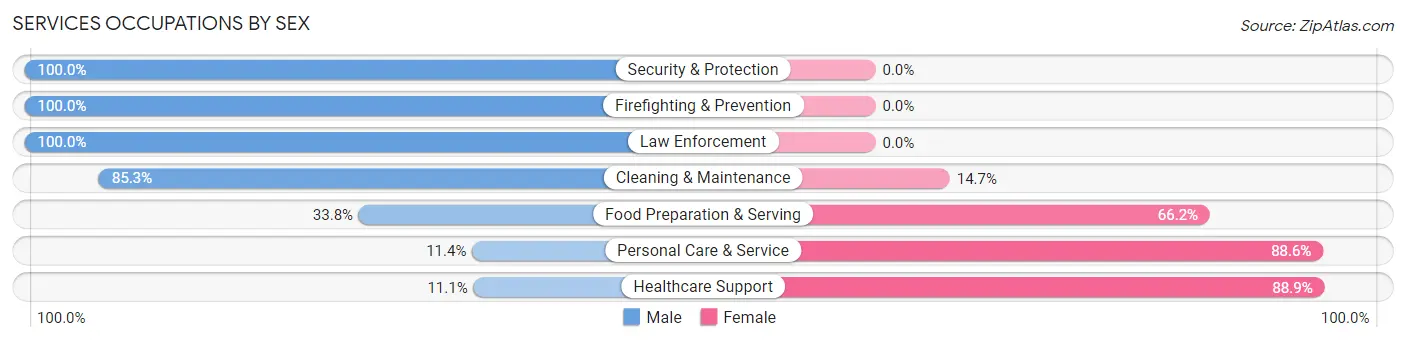
Services Occupations by Sex
Within the Services occupations in Amboy, the most male-oriented occupations are Security & Protection (100.0%), Firefighting & Prevention (100.0%), and Law Enforcement (100.0%), while the most female-oriented occupations are Healthcare Support (88.9%), Personal Care & Service (88.6%), and Food Preparation & Serving (66.2%).
| Occupation | Male | Female |
| Healthcare Support | 7 (11.1%) | 56 (88.9%) |
| Security & Protection | 78 (100.0%) | 0 (0.0%) |
| Firefighting & Prevention | 47 (100.0%) | 0 (0.0%) |
| Law Enforcement | 31 (100.0%) | 0 (0.0%) |
| Food Preparation & Serving | 24 (33.8%) | 47 (66.2%) |
| Cleaning & Maintenance | 29 (85.3%) | 5 (14.7%) |
| Personal Care & Service | 5 (11.4%) | 39 (88.6%) |
| Total (Category) | 143 (49.3%) | 147 (50.7%) |
| Total (Overall) | 677 (53.9%) | 579 (46.1%) |
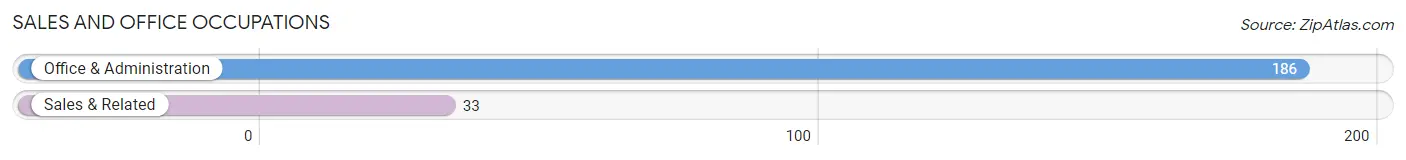
Sales and Office Occupations
The most common Sales and Office occupations in Amboy are Office & Administration (186 | 14.8%), and Sales & Related (33 | 2.6%).
Sales and Office Occupations by Sex
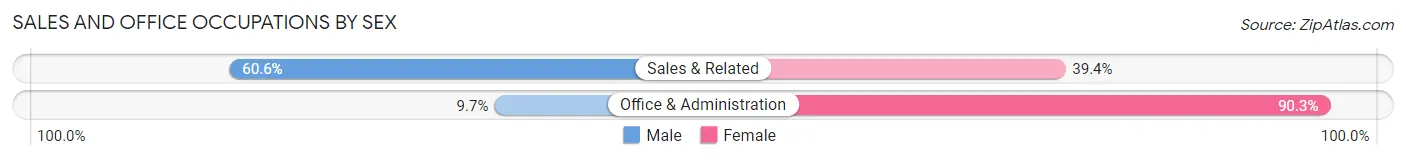
| Occupation | Male | Female |
| Sales & Related | 20 (60.6%) | 13 (39.4%) |
| Office & Administration | 18 (9.7%) | 168 (90.3%) |
| Total (Category) | 38 (17.3%) | 181 (82.7%) |
| Total (Overall) | 677 (53.9%) | 579 (46.1%) |
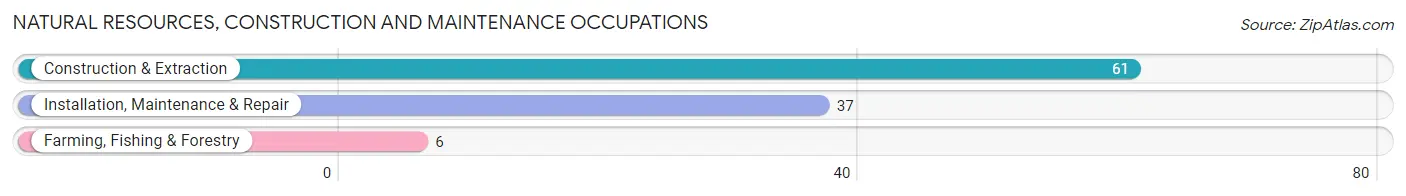
Natural Resources, Construction and Maintenance Occupations
The most common Natural Resources, Construction and Maintenance occupations in Amboy are Construction & Extraction (61 | 4.9%), Installation, Maintenance & Repair (37 | 2.9%), and Farming, Fishing & Forestry (6 | 0.5%).
Natural Resources, Construction and Maintenance Occupations by Sex
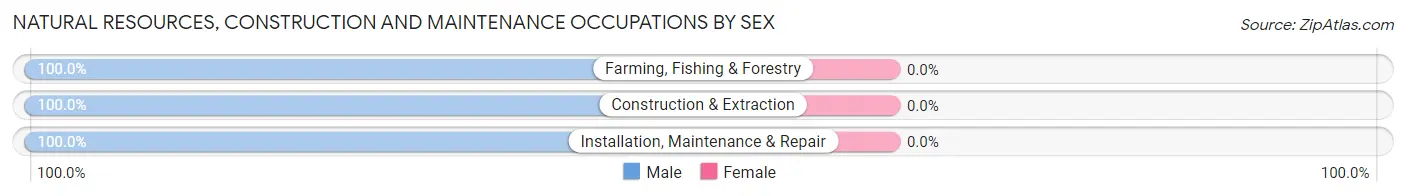
| Occupation | Male | Female |
| Farming, Fishing & Forestry | 6 (100.0%) | 0 (0.0%) |
| Construction & Extraction | 61 (100.0%) | 0 (0.0%) |
| Installation, Maintenance & Repair | 37 (100.0%) | 0 (0.0%) |
| Total (Category) | 104 (100.0%) | 0 (0.0%) |
| Total (Overall) | 677 (53.9%) | 579 (46.1%) |
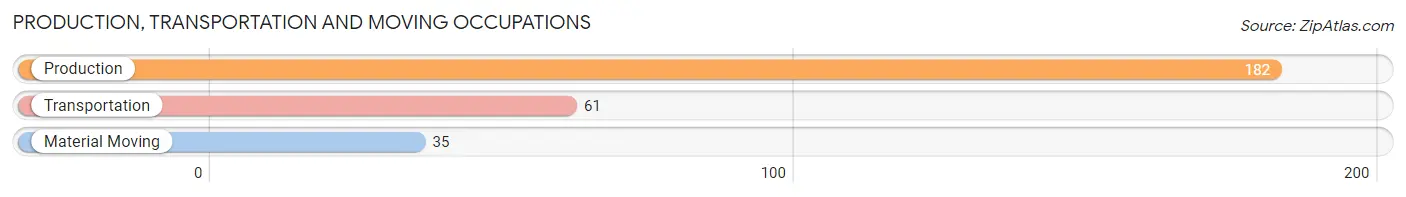
Production, Transportation and Moving Occupations
The most common Production, Transportation and Moving occupations in Amboy are Production (182 | 14.5%), Transportation (61 | 4.9%), and Material Moving (35 | 2.8%).
Production, Transportation and Moving Occupations by Sex
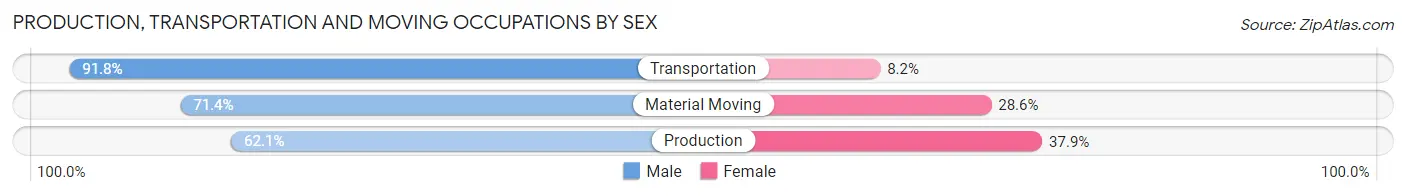
| Occupation | Male | Female |
| Production | 113 (62.1%) | 69 (37.9%) |
| Transportation | 56 (91.8%) | 5 (8.2%) |
| Material Moving | 25 (71.4%) | 10 (28.6%) |
| Total (Category) | 194 (69.8%) | 84 (30.2%) |
| Total (Overall) | 677 (53.9%) | 579 (46.1%) |
Employment Industries by Sex in Amboy
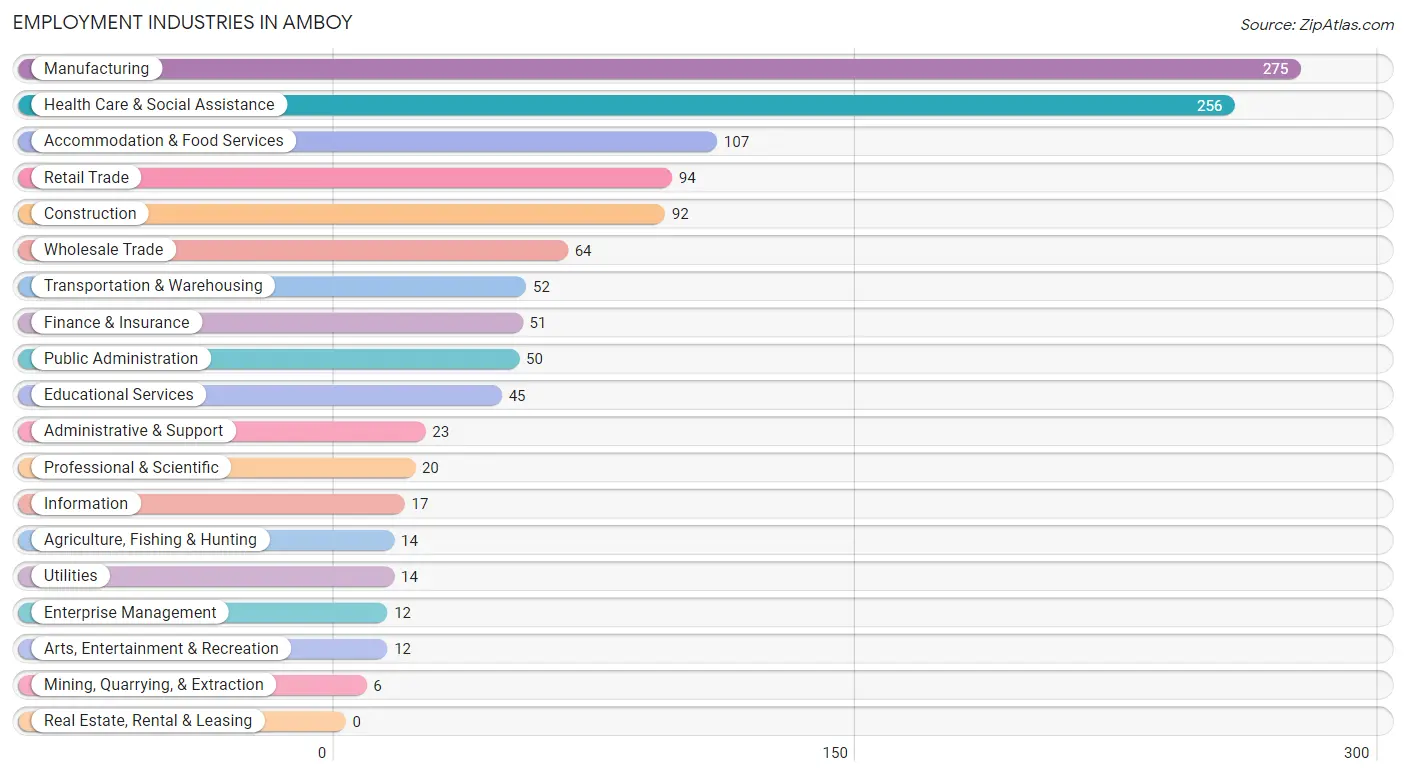
Employment Industries in Amboy
The major employment industries in Amboy include Manufacturing (275 | 21.9%), Health Care & Social Assistance (256 | 20.4%), Accommodation & Food Services (107 | 8.5%), Retail Trade (94 | 7.5%), and Construction (92 | 7.3%).
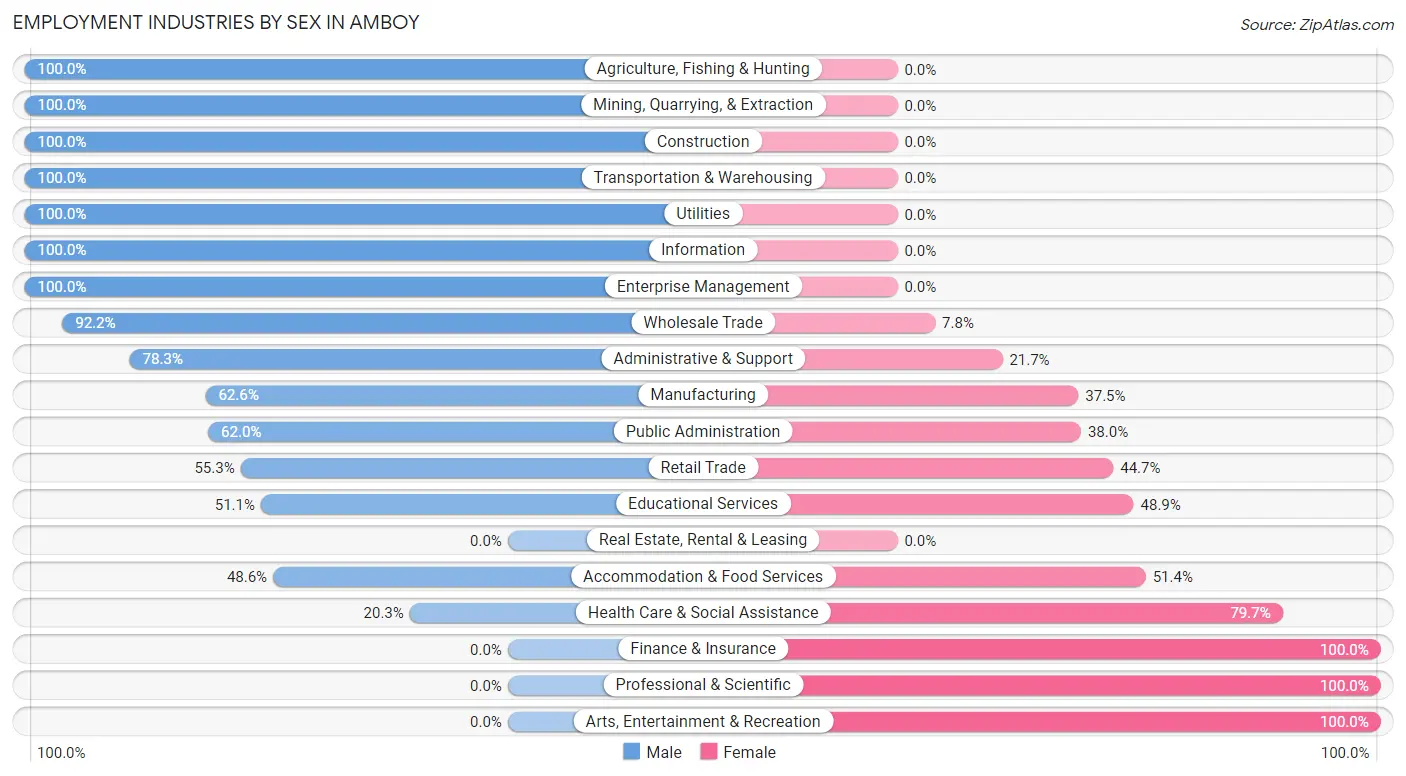
Employment Industries by Sex in Amboy
The Amboy industries that see more men than women are Agriculture, Fishing & Hunting (100.0%), Mining, Quarrying, & Extraction (100.0%), and Construction (100.0%), whereas the industries that tend to have a higher number of women are Finance & Insurance (100.0%), Professional & Scientific (100.0%), and Arts, Entertainment & Recreation (100.0%).
| Industry | Male | Female |
| Agriculture, Fishing & Hunting | 14 (100.0%) | 0 (0.0%) |
| Mining, Quarrying, & Extraction | 6 (100.0%) | 0 (0.0%) |
| Construction | 92 (100.0%) | 0 (0.0%) |
| Manufacturing | 172 (62.5%) | 103 (37.4%) |
| Wholesale Trade | 59 (92.2%) | 5 (7.8%) |
| Retail Trade | 52 (55.3%) | 42 (44.7%) |
| Transportation & Warehousing | 52 (100.0%) | 0 (0.0%) |
| Utilities | 14 (100.0%) | 0 (0.0%) |
| Information | 17 (100.0%) | 0 (0.0%) |
| Finance & Insurance | 0 (0.0%) | 51 (100.0%) |
| Real Estate, Rental & Leasing | 0 (0.0%) | 0 (0.0%) |
| Professional & Scientific | 0 (0.0%) | 20 (100.0%) |
| Enterprise Management | 12 (100.0%) | 0 (0.0%) |
| Administrative & Support | 18 (78.3%) | 5 (21.7%) |
| Educational Services | 23 (51.1%) | 22 (48.9%) |
| Health Care & Social Assistance | 52 (20.3%) | 204 (79.7%) |
| Arts, Entertainment & Recreation | 0 (0.0%) | 12 (100.0%) |
| Accommodation & Food Services | 52 (48.6%) | 55 (51.4%) |
| Public Administration | 31 (62.0%) | 19 (38.0%) |
| Total | 677 (53.9%) | 579 (46.1%) |
Education in Amboy
School Enrollment in Amboy
The most common levels of schooling among the 497 students in Amboy are elementary school (160 | 32.2%), college / undergraduate (123 | 24.7%), and high school (80 | 16.1%).
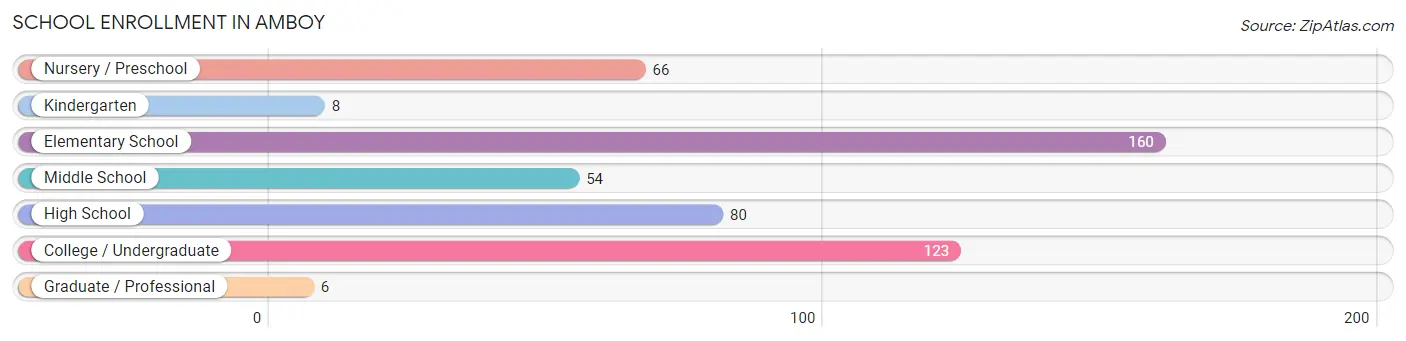
| School Level | # Students | % Students |
| Nursery / Preschool | 66 | 13.3% |
| Kindergarten | 8 | 1.6% |
| Elementary School | 160 | 32.2% |
| Middle School | 54 | 10.9% |
| High School | 80 | 16.1% |
| College / Undergraduate | 123 | 24.7% |
| Graduate / Professional | 6 | 1.2% |
| Total | 497 | 100.0% |
School Enrollment by Age by Funding Source in Amboy
Out of a total of 497 students who are enrolled in schools in Amboy, 38 (7.6%) attend a private institution, while the remaining 459 (92.4%) are enrolled in public schools. The age group of 35 years and over has the highest likelihood of being enrolled in private schools, with 6 (24.0% in the age bracket) enrolled. Conversely, the age group of 3 to 4 year olds has the lowest likelihood of being enrolled in a private school, with 40 (100.0% in the age bracket) attending a public institution.
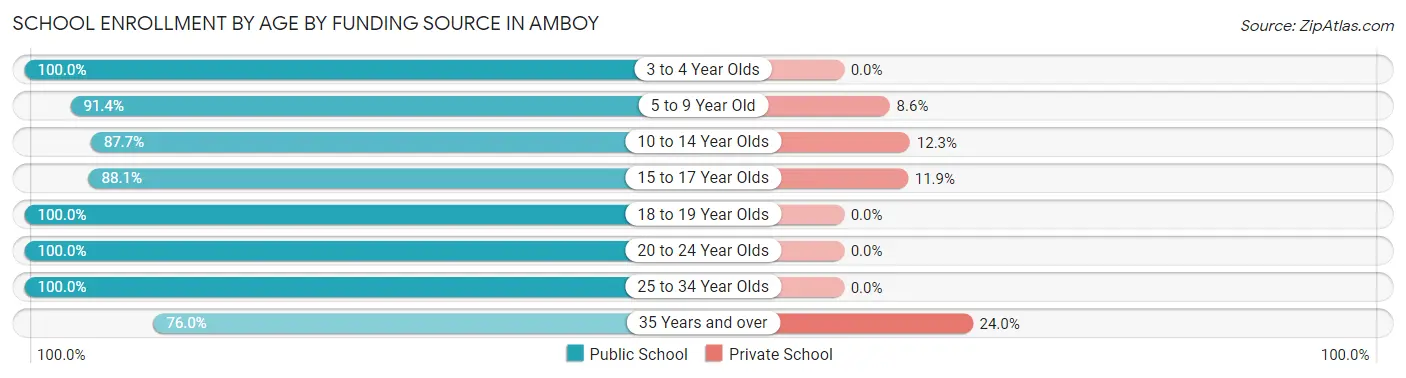
| Age Bracket | Public School | Private School |
| 3 to 4 Year Olds | 40 (100.0%) | 0 (0.0%) |
| 5 to 9 Year Old | 160 (91.4%) | 15 (8.6%) |
| 10 to 14 Year Olds | 64 (87.7%) | 9 (12.3%) |
| 15 to 17 Year Olds | 59 (88.1%) | 8 (11.9%) |
| 18 to 19 Year Olds | 19 (100.0%) | 0 (0.0%) |
| 20 to 24 Year Olds | 90 (100.0%) | 0 (0.0%) |
| 25 to 34 Year Olds | 8 (100.0%) | 0 (0.0%) |
| 35 Years and over | 19 (76.0%) | 6 (24.0%) |
| Total | 459 (92.4%) | 38 (7.6%) |
Educational Attainment by Field of Study in Amboy
Bio, nature & agricultural (84 | 34.6%), education (43 | 17.7%), arts & humanities (35 | 14.4%), psychology (24 | 9.9%), and social sciences (18 | 7.4%) are the most common fields of study among 243 individuals in Amboy who have obtained a bachelor's degree or higher.
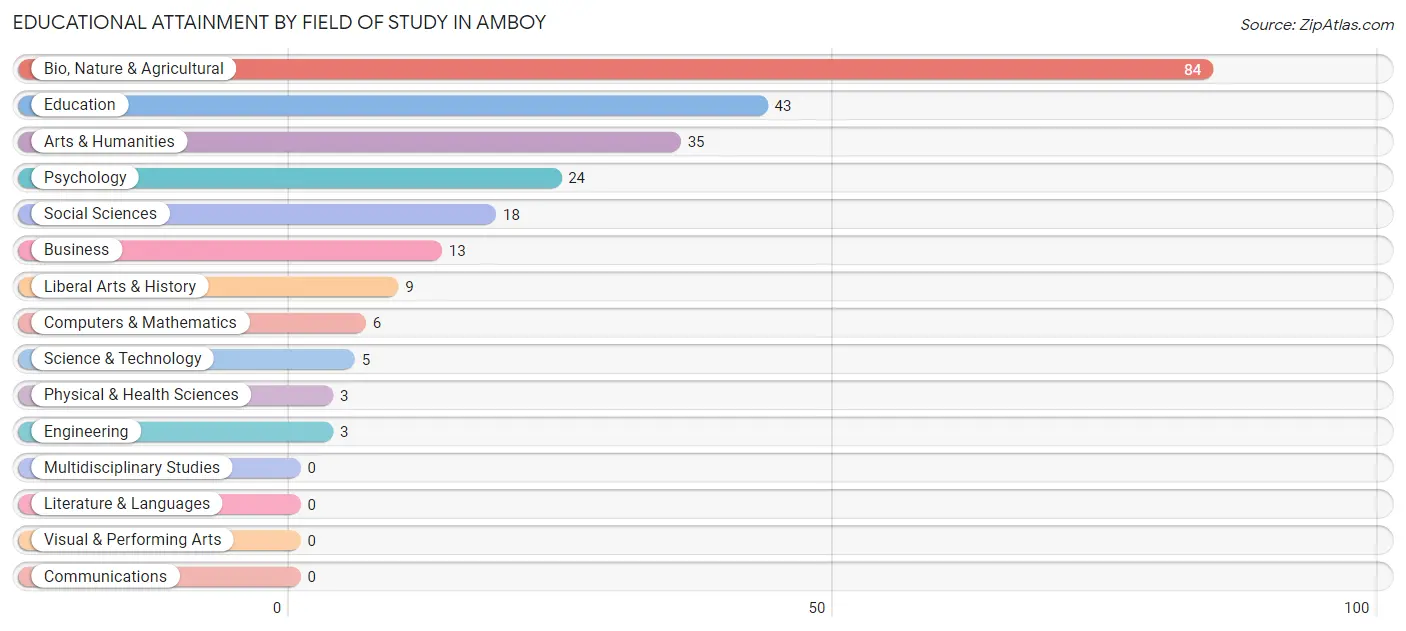
| Field of Study | # Graduates | % Graduates |
| Computers & Mathematics | 6 | 2.5% |
| Bio, Nature & Agricultural | 84 | 34.6% |
| Physical & Health Sciences | 3 | 1.2% |
| Psychology | 24 | 9.9% |
| Social Sciences | 18 | 7.4% |
| Engineering | 3 | 1.2% |
| Multidisciplinary Studies | 0 | 0.0% |
| Science & Technology | 5 | 2.1% |
| Business | 13 | 5.3% |
| Education | 43 | 17.7% |
| Literature & Languages | 0 | 0.0% |
| Liberal Arts & History | 9 | 3.7% |
| Visual & Performing Arts | 0 | 0.0% |
| Communications | 0 | 0.0% |
| Arts & Humanities | 35 | 14.4% |
| Total | 243 | 100.0% |
Transportation & Commute in Amboy
Vehicle Availability by Sex in Amboy
The most prevalent vehicle ownership categories in Amboy are males with 3 vehicles (241, accounting for 35.9%) and females with 3 vehicles (222, making up 42.9%).
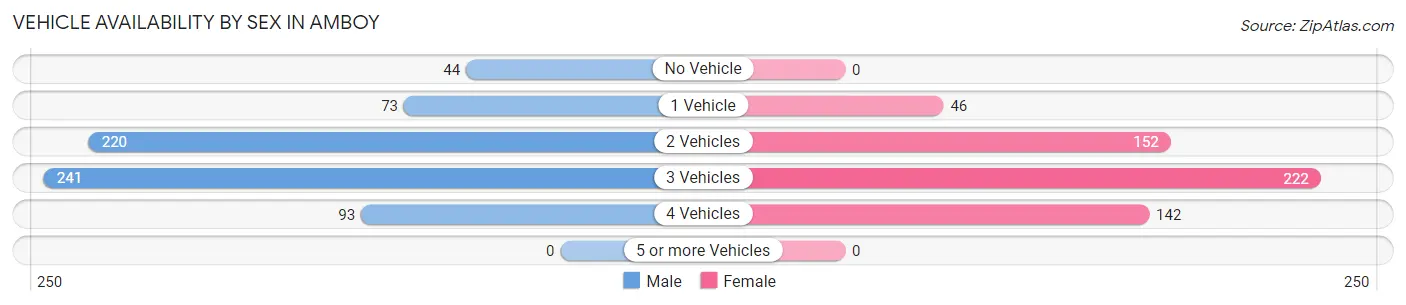
| Vehicles Available | Male | Female |
| No Vehicle | 44 (6.6%) | 0 (0.0%) |
| 1 Vehicle | 73 (10.9%) | 46 (8.2%) |
| 2 Vehicles | 220 (32.8%) | 152 (27.1%) |
| 3 Vehicles | 241 (35.9%) | 222 (39.5%) |
| 4 Vehicles | 93 (13.9%) | 142 (25.3%) |
| 5 or more Vehicles | 0 (0.0%) | 0 (0.0%) |
| Total | 671 (100.0%) | 562 (100.0%) |
Commute Time in Amboy
The most frequently occuring commute durations in Amboy are 20 to 24 minutes (212 commuters, 17.3%), less than 5 minutes (168 commuters, 13.7%), and 10 to 14 minutes (134 commuters, 11.0%).
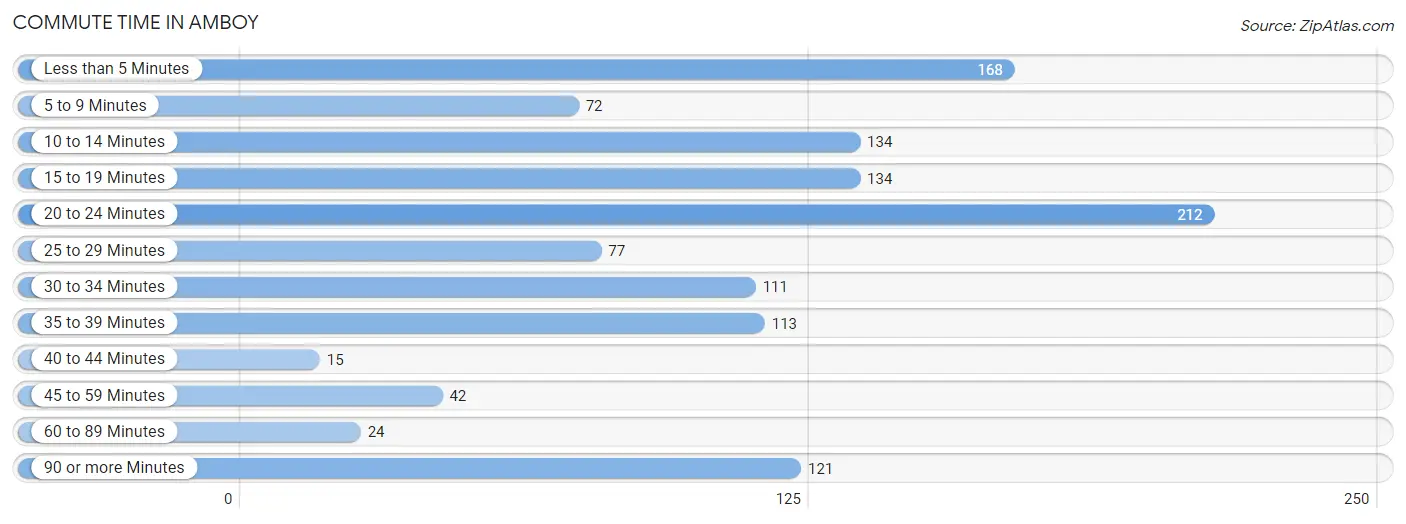
| Commute Time | # Commuters | % Commuters |
| Less than 5 Minutes | 168 | 13.7% |
| 5 to 9 Minutes | 72 | 5.9% |
| 10 to 14 Minutes | 134 | 11.0% |
| 15 to 19 Minutes | 134 | 11.0% |
| 20 to 24 Minutes | 212 | 17.3% |
| 25 to 29 Minutes | 77 | 6.3% |
| 30 to 34 Minutes | 111 | 9.1% |
| 35 to 39 Minutes | 113 | 9.2% |
| 40 to 44 Minutes | 15 | 1.2% |
| 45 to 59 Minutes | 42 | 3.4% |
| 60 to 89 Minutes | 24 | 2.0% |
| 90 or more Minutes | 121 | 9.9% |
Commute Time by Sex in Amboy
The most common commute times in Amboy are less than 5 minutes (113 commuters, 17.0%) for males and 20 to 24 minutes (149 commuters, 26.8%) for females.
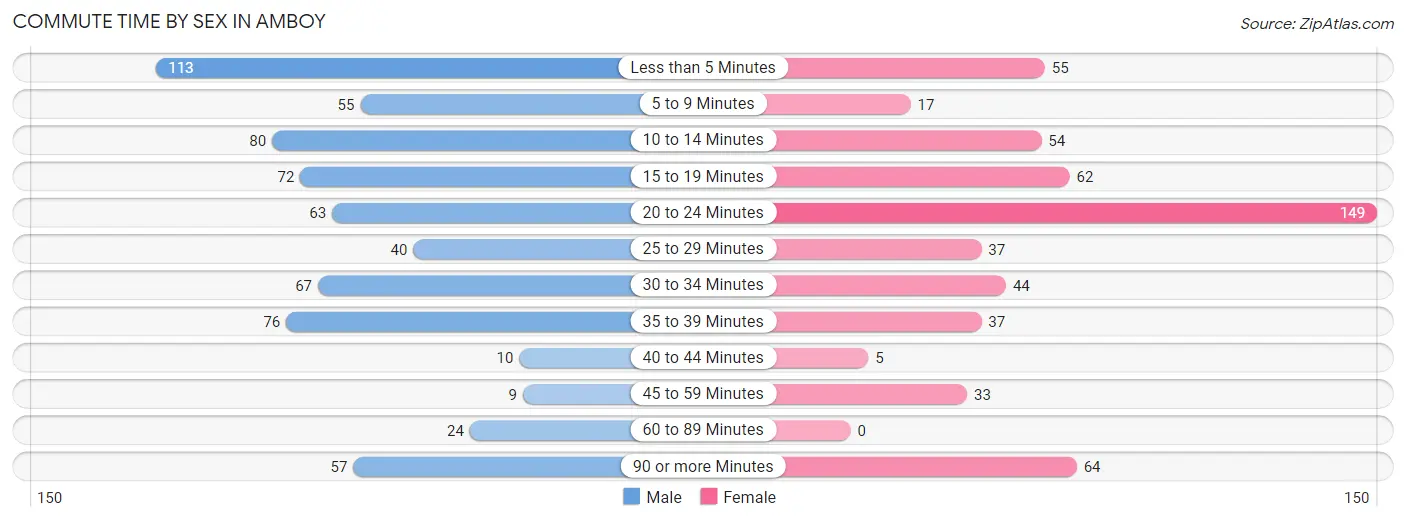
| Commute Time | Male | Female |
| Less than 5 Minutes | 113 (17.0%) | 55 (9.9%) |
| 5 to 9 Minutes | 55 (8.3%) | 17 (3.0%) |
| 10 to 14 Minutes | 80 (12.0%) | 54 (9.7%) |
| 15 to 19 Minutes | 72 (10.8%) | 62 (11.1%) |
| 20 to 24 Minutes | 63 (9.5%) | 149 (26.8%) |
| 25 to 29 Minutes | 40 (6.0%) | 37 (6.6%) |
| 30 to 34 Minutes | 67 (10.1%) | 44 (7.9%) |
| 35 to 39 Minutes | 76 (11.4%) | 37 (6.6%) |
| 40 to 44 Minutes | 10 (1.5%) | 5 (0.9%) |
| 45 to 59 Minutes | 9 (1.3%) | 33 (5.9%) |
| 60 to 89 Minutes | 24 (3.6%) | 0 (0.0%) |
| 90 or more Minutes | 57 (8.6%) | 64 (11.5%) |
Time of Departure to Work by Sex in Amboy
The most frequent times of departure to work in Amboy are 5:30 AM to 5:59 AM (162, 24.3%) for males and 7:00 AM to 7:29 AM (107, 19.2%) for females.
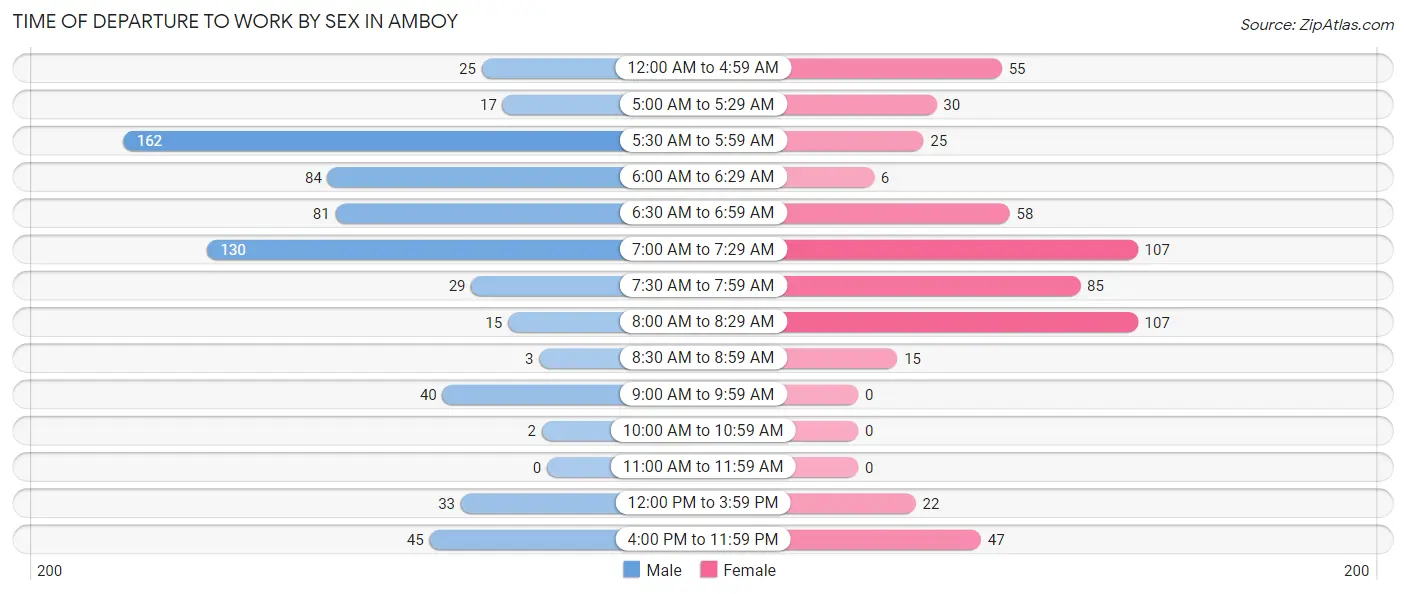
| Time of Departure | Male | Female |
| 12:00 AM to 4:59 AM | 25 (3.7%) | 55 (9.9%) |
| 5:00 AM to 5:29 AM | 17 (2.5%) | 30 (5.4%) |
| 5:30 AM to 5:59 AM | 162 (24.3%) | 25 (4.5%) |
| 6:00 AM to 6:29 AM | 84 (12.6%) | 6 (1.1%) |
| 6:30 AM to 6:59 AM | 81 (12.2%) | 58 (10.4%) |
| 7:00 AM to 7:29 AM | 130 (19.5%) | 107 (19.2%) |
| 7:30 AM to 7:59 AM | 29 (4.3%) | 85 (15.3%) |
| 8:00 AM to 8:29 AM | 15 (2.2%) | 107 (19.2%) |
| 8:30 AM to 8:59 AM | 3 (0.4%) | 15 (2.7%) |
| 9:00 AM to 9:59 AM | 40 (6.0%) | 0 (0.0%) |
| 10:00 AM to 10:59 AM | 2 (0.3%) | 0 (0.0%) |
| 11:00 AM to 11:59 AM | 0 (0.0%) | 0 (0.0%) |
| 12:00 PM to 3:59 PM | 33 (5.0%) | 22 (4.0%) |
| 4:00 PM to 11:59 PM | 45 (6.8%) | 47 (8.4%) |
| Total | 666 (100.0%) | 557 (100.0%) |
Housing Occupancy in Amboy
Occupancy by Ownership in Amboy
Of the total 980 dwellings in Amboy, owner-occupied units account for 704 (71.8%), while renter-occupied units make up 276 (28.2%).
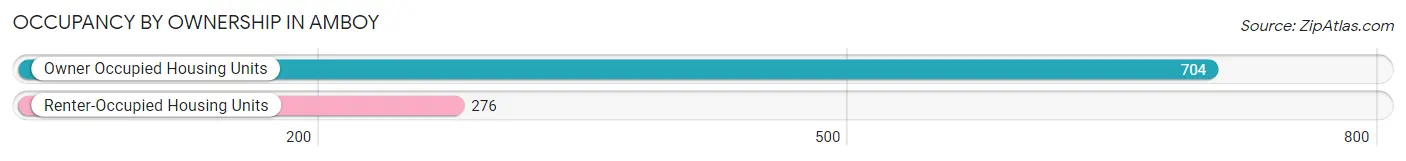
| Occupancy | # Housing Units | % Housing Units |
| Owner Occupied Housing Units | 704 | 71.8% |
| Renter-Occupied Housing Units | 276 | 28.2% |
| Total Occupied Housing Units | 980 | 100.0% |
Occupancy by Household Size in Amboy
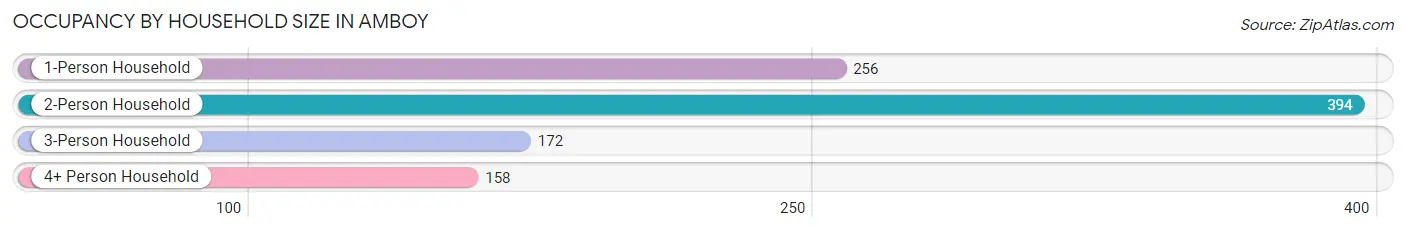
| Household Size | # Housing Units | % Housing Units |
| 1-Person Household | 256 | 26.1% |
| 2-Person Household | 394 | 40.2% |
| 3-Person Household | 172 | 17.5% |
| 4+ Person Household | 158 | 16.1% |
| Total Housing Units | 980 | 100.0% |
Occupancy by Ownership by Household Size in Amboy
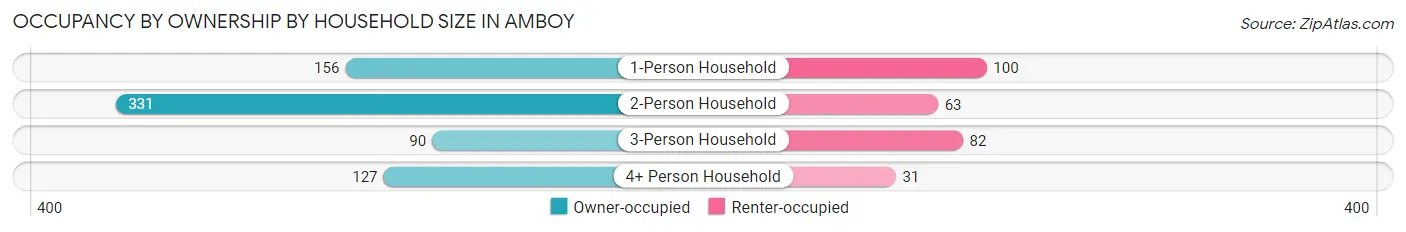
| Household Size | Owner-occupied | Renter-occupied |
| 1-Person Household | 156 (60.9%) | 100 (39.1%) |
| 2-Person Household | 331 (84.0%) | 63 (16.0%) |
| 3-Person Household | 90 (52.3%) | 82 (47.7%) |
| 4+ Person Household | 127 (80.4%) | 31 (19.6%) |
| Total Housing Units | 704 (71.8%) | 276 (28.2%) |
Occupancy by Educational Attainment in Amboy
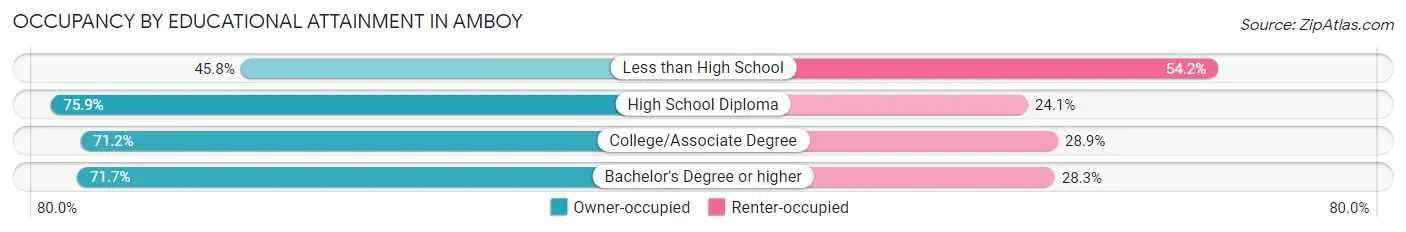
| Household Size | Owner-occupied | Renter-occupied |
| Less than High School | 27 (45.8%) | 32 (54.2%) |
| High School Diploma | 337 (75.9%) | 107 (24.1%) |
| College/Associate Degree | 254 (71.2%) | 103 (28.8%) |
| Bachelor's Degree or higher | 86 (71.7%) | 34 (28.3%) |
Occupancy by Age of Householder in Amboy
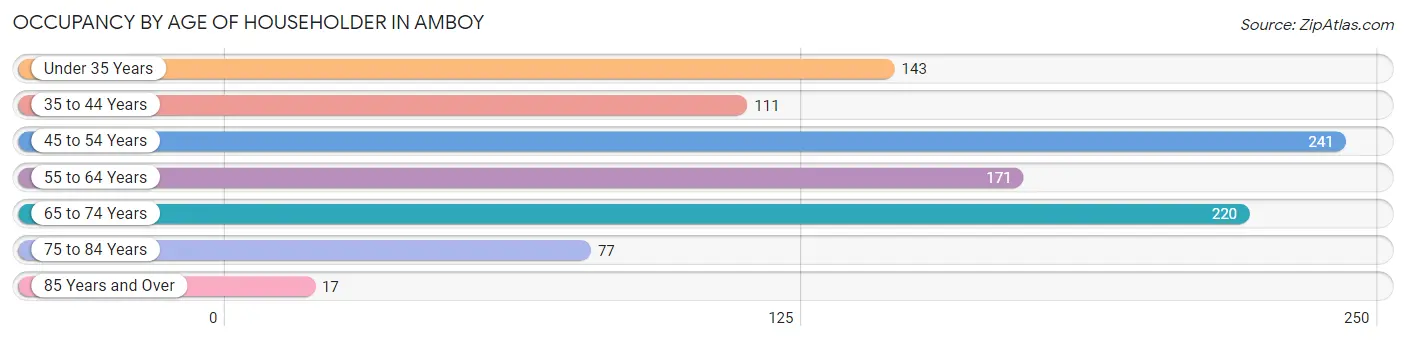
| Age Bracket | # Households | % Households |
| Under 35 Years | 143 | 14.6% |
| 35 to 44 Years | 111 | 11.3% |
| 45 to 54 Years | 241 | 24.6% |
| 55 to 64 Years | 171 | 17.4% |
| 65 to 74 Years | 220 | 22.5% |
| 75 to 84 Years | 77 | 7.9% |
| 85 Years and Over | 17 | 1.7% |
| Total | 980 | 100.0% |
Housing Finances in Amboy
Median Income by Occupancy in Amboy
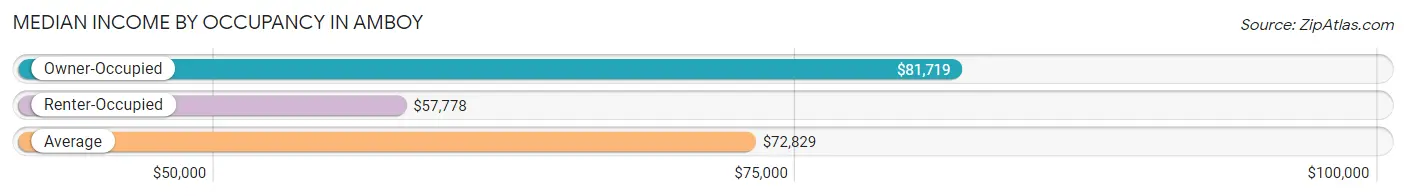
| Occupancy Type | # Households | Median Income |
| Owner-Occupied | 704 (71.8%) | $81,719 |
| Renter-Occupied | 276 (28.2%) | $57,778 |
| Average | 980 (100.0%) | $72,829 |
Occupancy by Householder Income Bracket in Amboy
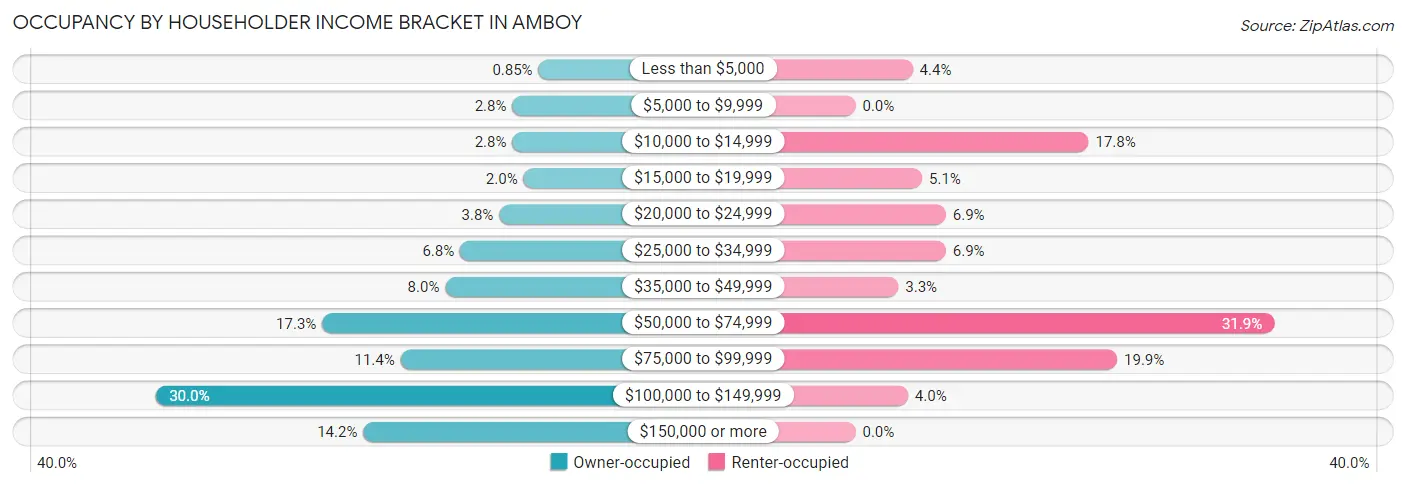
| Income Bracket | Owner-occupied | Renter-occupied |
| Less than $5,000 | 6 (0.9%) | 12 (4.3%) |
| $5,000 to $9,999 | 20 (2.8%) | 0 (0.0%) |
| $10,000 to $14,999 | 20 (2.8%) | 49 (17.7%) |
| $15,000 to $19,999 | 14 (2.0%) | 14 (5.1%) |
| $20,000 to $24,999 | 27 (3.8%) | 19 (6.9%) |
| $25,000 to $34,999 | 48 (6.8%) | 19 (6.9%) |
| $35,000 to $49,999 | 56 (8.0%) | 9 (3.3%) |
| $50,000 to $74,999 | 122 (17.3%) | 88 (31.9%) |
| $75,000 to $99,999 | 80 (11.4%) | 55 (19.9%) |
| $100,000 to $149,999 | 211 (30.0%) | 11 (4.0%) |
| $150,000 or more | 100 (14.2%) | 0 (0.0%) |
| Total | 704 (100.0%) | 276 (100.0%) |
Monthly Housing Cost Tiers in Amboy
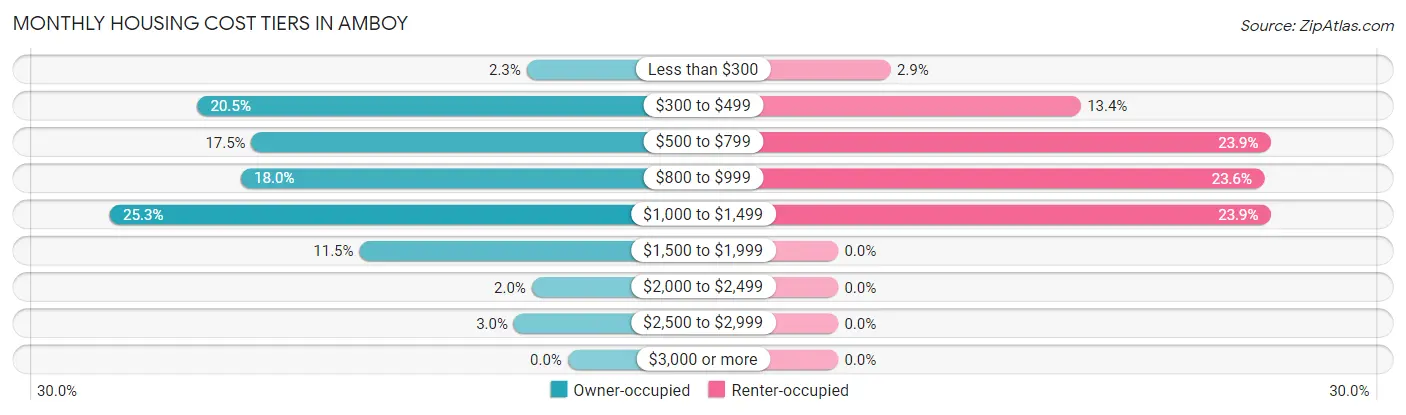
| Monthly Cost | Owner-occupied | Renter-occupied |
| Less than $300 | 16 (2.3%) | 8 (2.9%) |
| $300 to $499 | 144 (20.4%) | 37 (13.4%) |
| $500 to $799 | 123 (17.5%) | 66 (23.9%) |
| $800 to $999 | 127 (18.0%) | 65 (23.5%) |
| $1,000 to $1,499 | 178 (25.3%) | 66 (23.9%) |
| $1,500 to $1,999 | 81 (11.5%) | 0 (0.0%) |
| $2,000 to $2,499 | 14 (2.0%) | 0 (0.0%) |
| $2,500 to $2,999 | 21 (3.0%) | 0 (0.0%) |
| $3,000 or more | 0 (0.0%) | 0 (0.0%) |
| Total | 704 (100.0%) | 276 (100.0%) |
Physical Housing Characteristics in Amboy
Housing Structures in Amboy
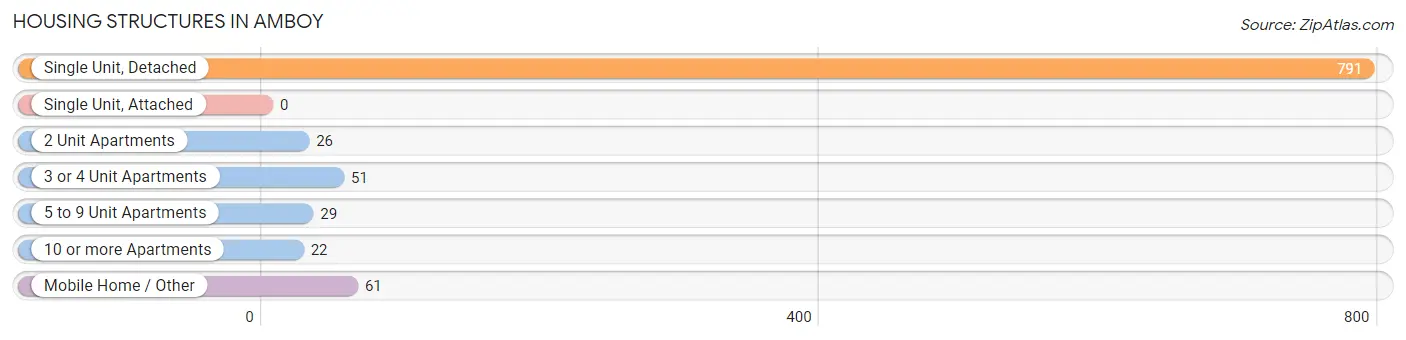
| Structure Type | # Housing Units | % Housing Units |
| Single Unit, Detached | 791 | 80.7% |
| Single Unit, Attached | 0 | 0.0% |
| 2 Unit Apartments | 26 | 2.6% |
| 3 or 4 Unit Apartments | 51 | 5.2% |
| 5 to 9 Unit Apartments | 29 | 3.0% |
| 10 or more Apartments | 22 | 2.2% |
| Mobile Home / Other | 61 | 6.2% |
| Total | 980 | 100.0% |
Housing Structures by Occupancy in Amboy
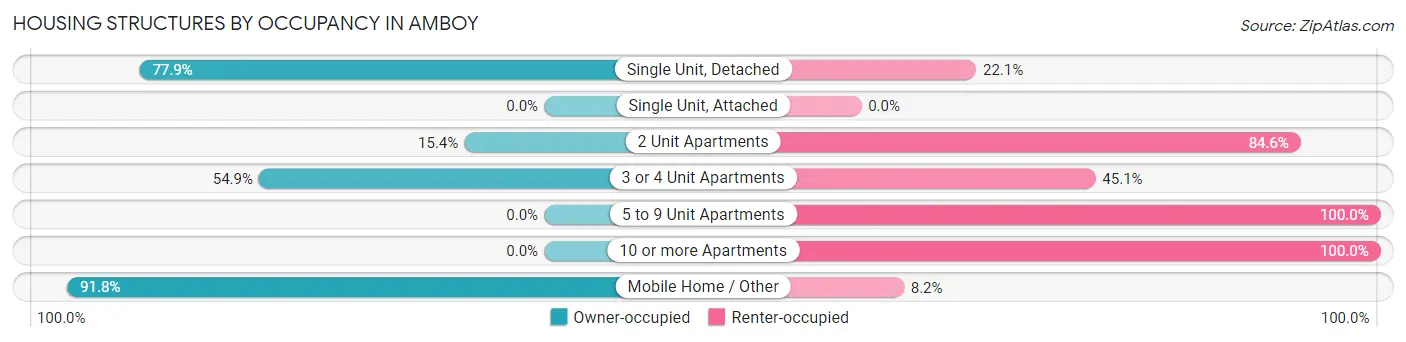
| Structure Type | Owner-occupied | Renter-occupied |
| Single Unit, Detached | 616 (77.9%) | 175 (22.1%) |
| Single Unit, Attached | 0 (0.0%) | 0 (0.0%) |
| 2 Unit Apartments | 4 (15.4%) | 22 (84.6%) |
| 3 or 4 Unit Apartments | 28 (54.9%) | 23 (45.1%) |
| 5 to 9 Unit Apartments | 0 (0.0%) | 29 (100.0%) |
| 10 or more Apartments | 0 (0.0%) | 22 (100.0%) |
| Mobile Home / Other | 56 (91.8%) | 5 (8.2%) |
| Total | 704 (71.8%) | 276 (28.2%) |
Housing Structures by Number of Rooms in Amboy
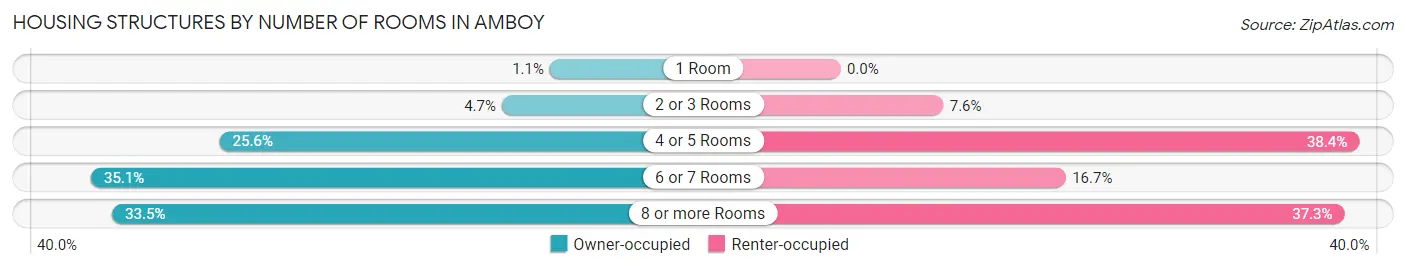
| Number of Rooms | Owner-occupied | Renter-occupied |
| 1 Room | 8 (1.1%) | 0 (0.0%) |
| 2 or 3 Rooms | 33 (4.7%) | 21 (7.6%) |
| 4 or 5 Rooms | 180 (25.6%) | 106 (38.4%) |
| 6 or 7 Rooms | 247 (35.1%) | 46 (16.7%) |
| 8 or more Rooms | 236 (33.5%) | 103 (37.3%) |
| Total | 704 (100.0%) | 276 (100.0%) |
Housing Structure by Heating Type in Amboy
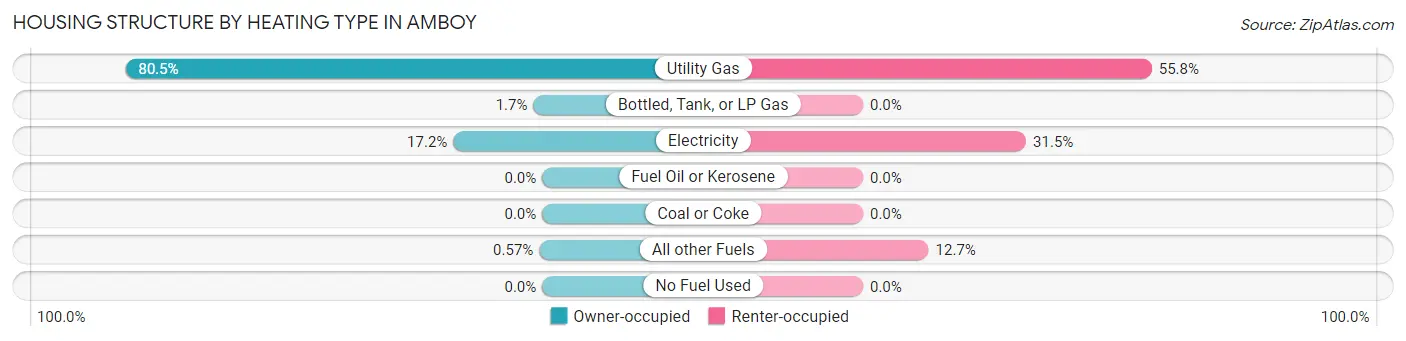
| Heating Type | Owner-occupied | Renter-occupied |
| Utility Gas | 567 (80.5%) | 154 (55.8%) |
| Bottled, Tank, or LP Gas | 12 (1.7%) | 0 (0.0%) |
| Electricity | 121 (17.2%) | 87 (31.5%) |
| Fuel Oil or Kerosene | 0 (0.0%) | 0 (0.0%) |
| Coal or Coke | 0 (0.0%) | 0 (0.0%) |
| All other Fuels | 4 (0.6%) | 35 (12.7%) |
| No Fuel Used | 0 (0.0%) | 0 (0.0%) |
| Total | 704 (100.0%) | 276 (100.0%) |
Household Vehicle Usage in Amboy
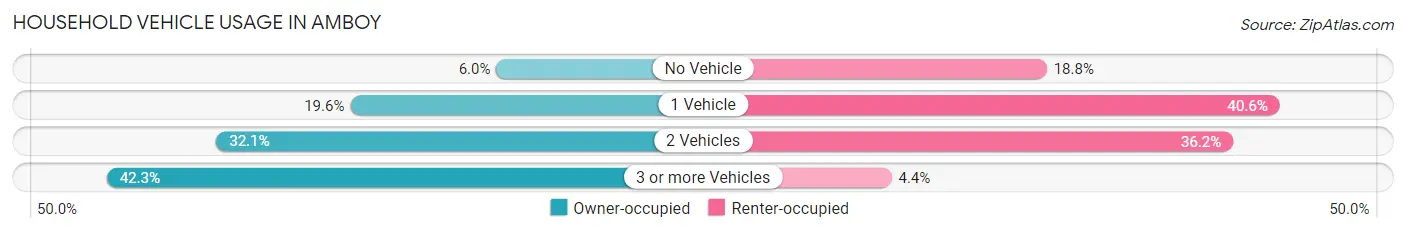
| Vehicles per Household | Owner-occupied | Renter-occupied |
| No Vehicle | 42 (6.0%) | 52 (18.8%) |
| 1 Vehicle | 138 (19.6%) | 112 (40.6%) |
| 2 Vehicles | 226 (32.1%) | 100 (36.2%) |
| 3 or more Vehicles | 298 (42.3%) | 12 (4.3%) |
| Total | 704 (100.0%) | 276 (100.0%) |
Real Estate & Mortgages in Amboy
Real Estate and Mortgage Overview in Amboy
| Characteristic | Without Mortgage | With Mortgage |
| Housing Units | 307 | 397 |
| Median Property Value | $95,600 | $133,600 |
| Median Household Income | $59,563 | $88 |
| Monthly Housing Costs | $494 | $0 |
| Real Estate Taxes | $1,995 | $3 |
Property Value by Mortgage Status in Amboy
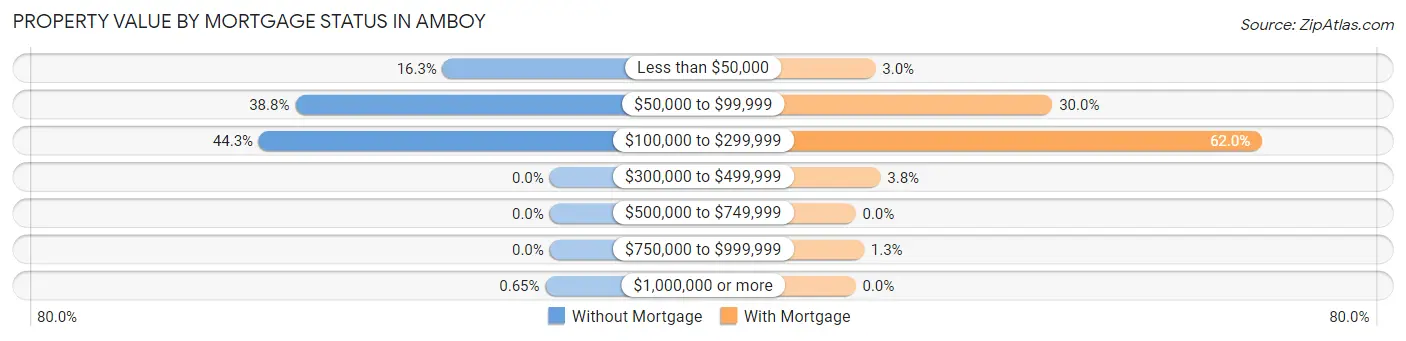
| Property Value | Without Mortgage | With Mortgage |
| Less than $50,000 | 50 (16.3%) | 12 (3.0%) |
| $50,000 to $99,999 | 119 (38.8%) | 119 (30.0%) |
| $100,000 to $299,999 | 136 (44.3%) | 246 (62.0%) |
| $300,000 to $499,999 | 0 (0.0%) | 15 (3.8%) |
| $500,000 to $749,999 | 0 (0.0%) | 0 (0.0%) |
| $750,000 to $999,999 | 0 (0.0%) | 5 (1.3%) |
| $1,000,000 or more | 2 (0.6%) | 0 (0.0%) |
| Total | 307 (100.0%) | 397 (100.0%) |
Household Income by Mortgage Status in Amboy
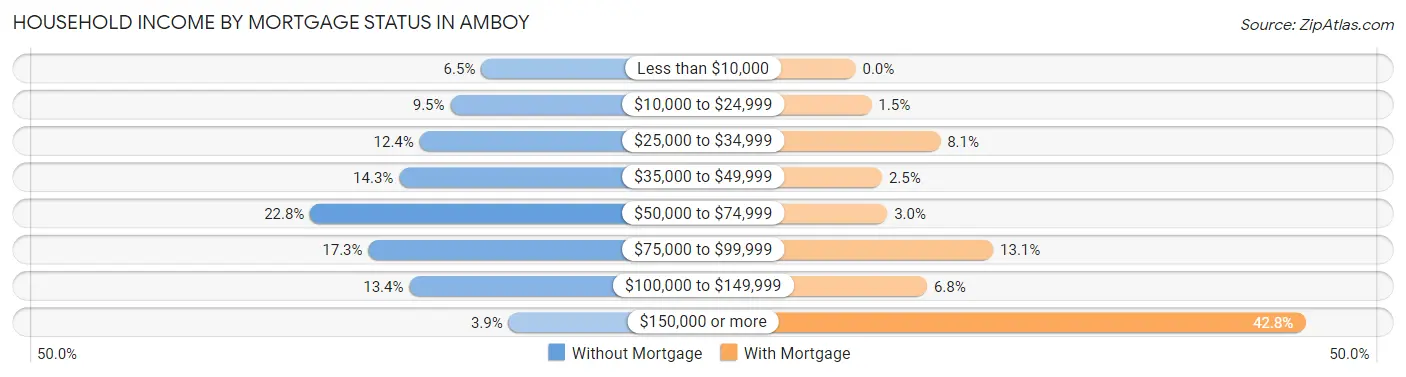
| Household Income | Without Mortgage | With Mortgage |
| Less than $10,000 | 20 (6.5%) | 0 (0.0%) |
| $10,000 to $24,999 | 29 (9.5%) | 6 (1.5%) |
| $25,000 to $34,999 | 38 (12.4%) | 32 (8.1%) |
| $35,000 to $49,999 | 44 (14.3%) | 10 (2.5%) |
| $50,000 to $74,999 | 70 (22.8%) | 12 (3.0%) |
| $75,000 to $99,999 | 53 (17.3%) | 52 (13.1%) |
| $100,000 to $149,999 | 41 (13.4%) | 27 (6.8%) |
| $150,000 or more | 12 (3.9%) | 170 (42.8%) |
| Total | 307 (100.0%) | 397 (100.0%) |
Property Value to Household Income Ratio in Amboy
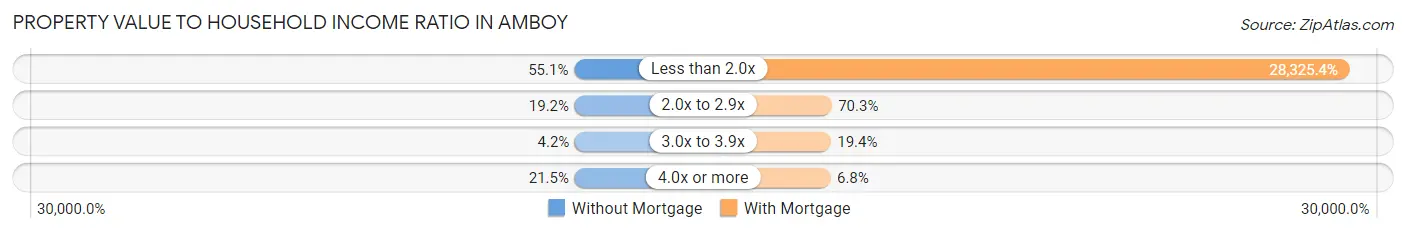
| Value-to-Income Ratio | Without Mortgage | With Mortgage |
| Less than 2.0x | 169 (55.0%) | 112,452 (28,325.4%) |
| 2.0x to 2.9x | 59 (19.2%) | 279 (70.3%) |
| 3.0x to 3.9x | 13 (4.2%) | 77 (19.4%) |
| 4.0x or more | 66 (21.5%) | 27 (6.8%) |
| Total | 307 (100.0%) | 397 (100.0%) |
Real Estate Taxes by Mortgage Status in Amboy
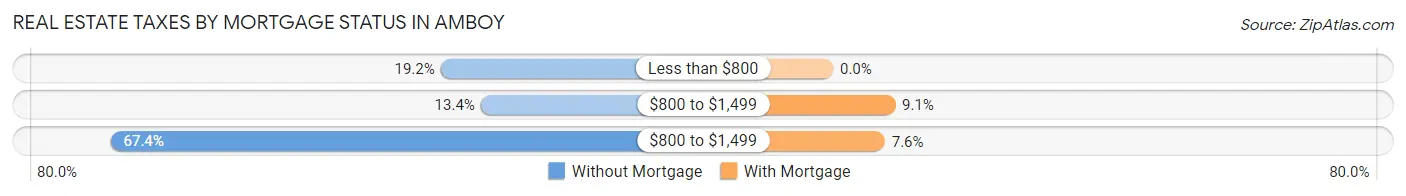
| Property Taxes | Without Mortgage | With Mortgage |
| Less than $800 | 59 (19.2%) | 0 (0.0%) |
| $800 to $1,499 | 41 (13.4%) | 36 (9.1%) |
| $800 to $1,499 | 207 (67.4%) | 30 (7.6%) |
| Total | 307 (100.0%) | 397 (100.0%) |
Health & Disability in Amboy
Health Insurance Coverage by Age in Amboy
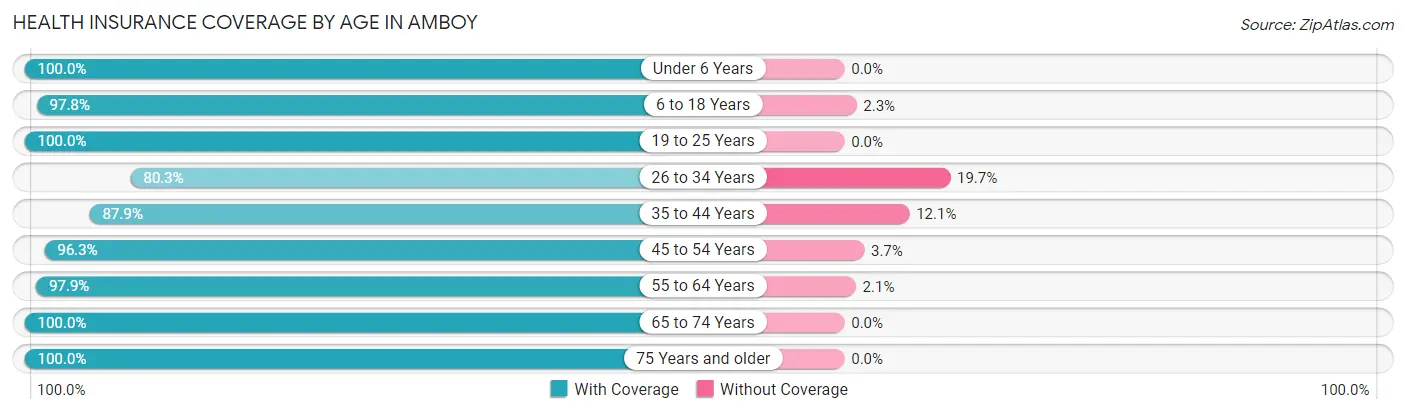
| Age Bracket | With Coverage | Without Coverage |
| Under 6 Years | 173 (100.0%) | 0 (0.0%) |
| 6 to 18 Years | 304 (97.8%) | 7 (2.2%) |
| 19 to 25 Years | 199 (100.0%) | 0 (0.0%) |
| 26 to 34 Years | 228 (80.3%) | 56 (19.7%) |
| 35 to 44 Years | 196 (87.9%) | 27 (12.1%) |
| 45 to 54 Years | 419 (96.3%) | 16 (3.7%) |
| 55 to 64 Years | 277 (97.9%) | 6 (2.1%) |
| 65 to 74 Years | 343 (100.0%) | 0 (0.0%) |
| 75 Years and older | 128 (100.0%) | 0 (0.0%) |
| Total | 2,267 (95.3%) | 112 (4.7%) |
Health Insurance Coverage by Citizenship Status in Amboy
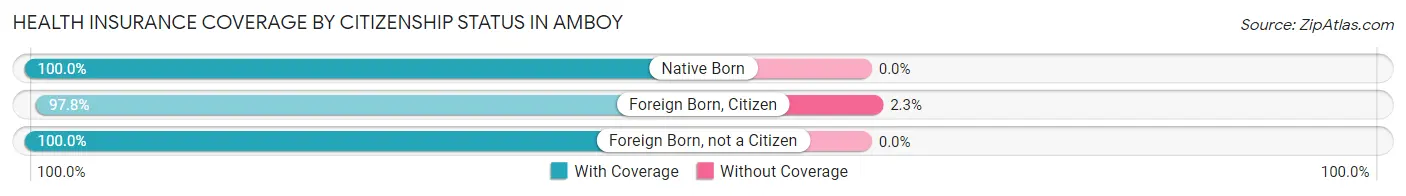
| Citizenship Status | With Coverage | Without Coverage |
| Native Born | 173 (100.0%) | 0 (0.0%) |
| Foreign Born, Citizen | 304 (97.8%) | 7 (2.2%) |
| Foreign Born, not a Citizen | 199 (100.0%) | 0 (0.0%) |
Health Insurance Coverage by Household Income in Amboy
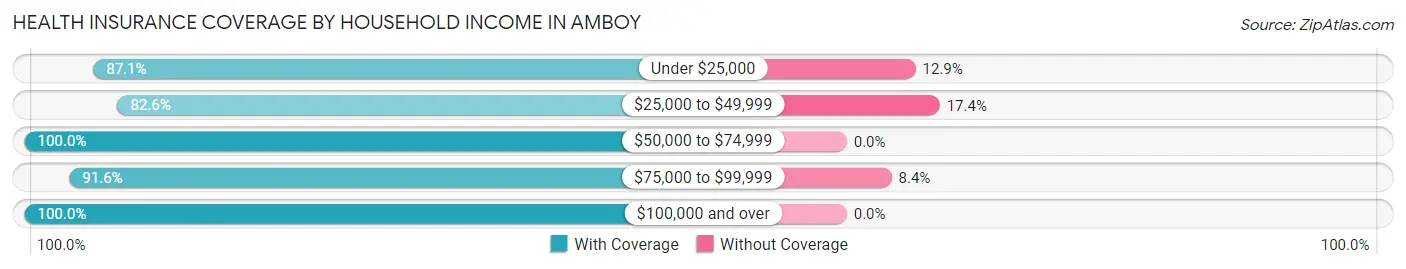
| Household Income | With Coverage | Without Coverage |
| Under $25,000 | 230 (87.1%) | 34 (12.9%) |
| $25,000 to $49,999 | 223 (82.6%) | 47 (17.4%) |
| $50,000 to $74,999 | 449 (100.0%) | 0 (0.0%) |
| $75,000 to $99,999 | 338 (91.6%) | 31 (8.4%) |
| $100,000 and over | 1,001 (100.0%) | 0 (0.0%) |
Public vs Private Health Insurance Coverage by Age in Amboy
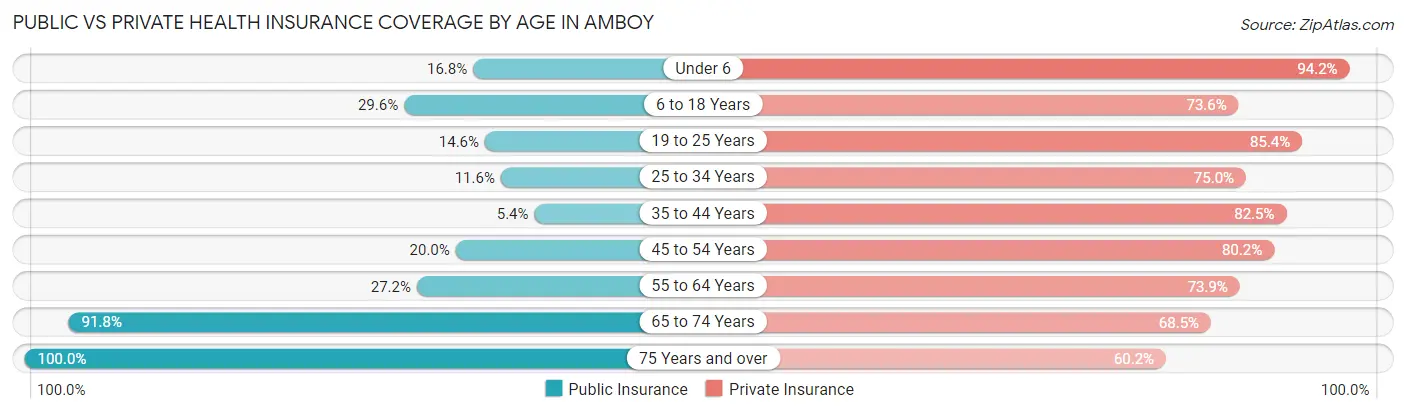
| Age Bracket | Public Insurance | Private Insurance |
| Under 6 | 29 (16.8%) | 163 (94.2%) |
| 6 to 18 Years | 92 (29.6%) | 229 (73.6%) |
| 19 to 25 Years | 29 (14.6%) | 170 (85.4%) |
| 25 to 34 Years | 33 (11.6%) | 213 (75.0%) |
| 35 to 44 Years | 12 (5.4%) | 184 (82.5%) |
| 45 to 54 Years | 87 (20.0%) | 349 (80.2%) |
| 55 to 64 Years | 77 (27.2%) | 209 (73.9%) |
| 65 to 74 Years | 315 (91.8%) | 235 (68.5%) |
| 75 Years and over | 128 (100.0%) | 77 (60.2%) |
| Total | 802 (33.7%) | 1,829 (76.9%) |
Disability Status by Sex by Age in Amboy
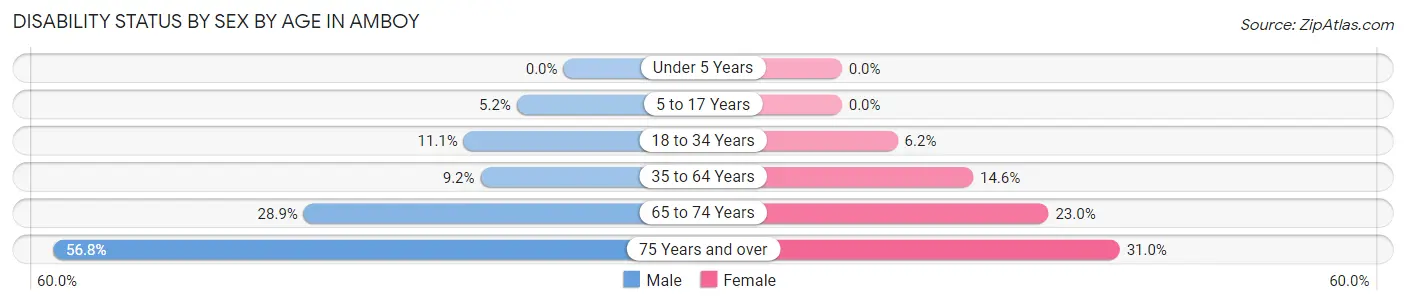
| Age Bracket | Male | Female |
| Under 5 Years | 0 (0.0%) | 0 (0.0%) |
| 5 to 17 Years | 9 (5.2%) | 0 (0.0%) |
| 18 to 34 Years | 31 (11.1%) | 13 (6.2%) |
| 35 to 64 Years | 44 (9.2%) | 68 (14.6%) |
| 65 to 74 Years | 59 (28.9%) | 32 (23.0%) |
| 75 Years and over | 25 (56.8%) | 26 (30.9%) |
Disability Class by Sex by Age in Amboy
Disability Class: Hearing Difficulty
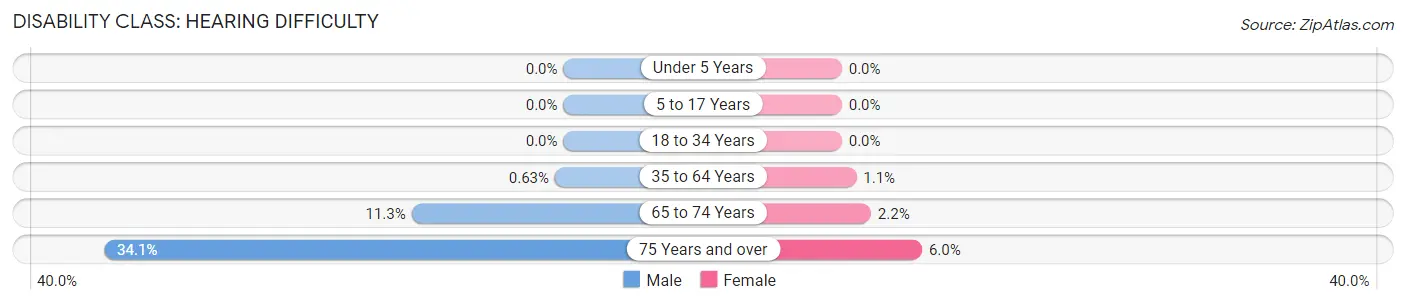
| Age Bracket | Male | Female |
| Under 5 Years | 0 (0.0%) | 0 (0.0%) |
| 5 to 17 Years | 0 (0.0%) | 0 (0.0%) |
| 18 to 34 Years | 0 (0.0%) | 0 (0.0%) |
| 35 to 64 Years | 3 (0.6%) | 5 (1.1%) |
| 65 to 74 Years | 23 (11.3%) | 3 (2.2%) |
| 75 Years and over | 15 (34.1%) | 5 (5.9%) |
Disability Class: Vision Difficulty
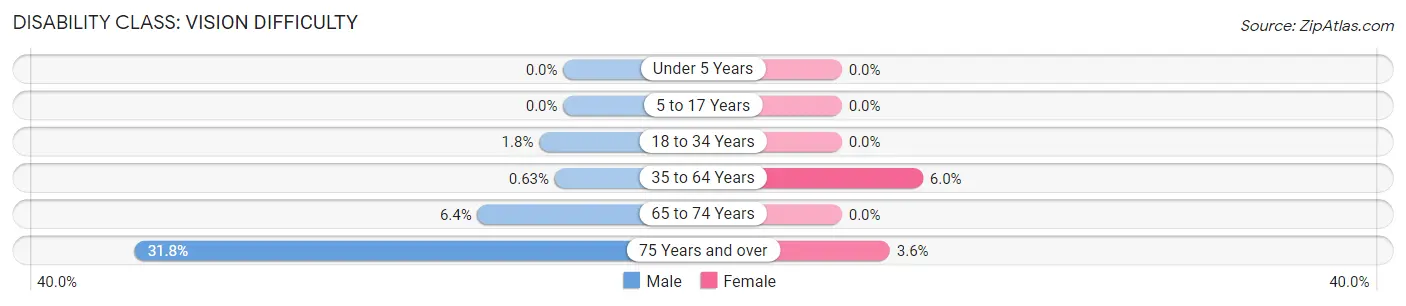
| Age Bracket | Male | Female |
| Under 5 Years | 0 (0.0%) | 0 (0.0%) |
| 5 to 17 Years | 0 (0.0%) | 0 (0.0%) |
| 18 to 34 Years | 5 (1.8%) | 0 (0.0%) |
| 35 to 64 Years | 3 (0.6%) | 28 (6.0%) |
| 65 to 74 Years | 13 (6.4%) | 0 (0.0%) |
| 75 Years and over | 14 (31.8%) | 3 (3.6%) |
Disability Class: Cognitive Difficulty
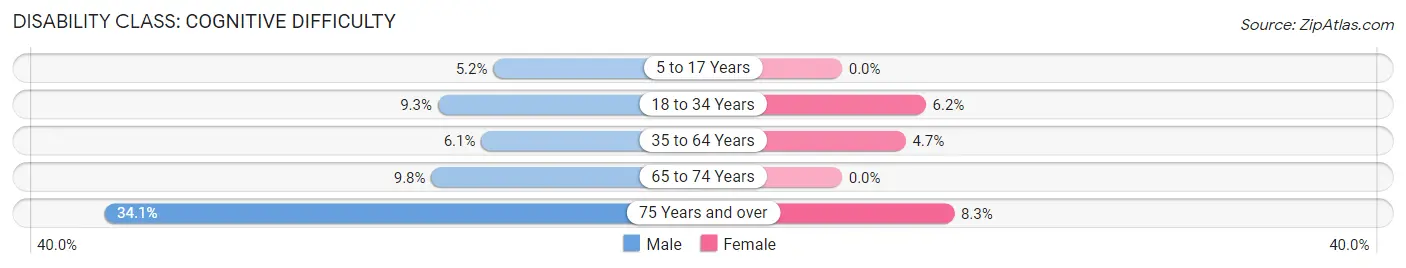
| Age Bracket | Male | Female |
| 5 to 17 Years | 9 (5.2%) | 0 (0.0%) |
| 18 to 34 Years | 26 (9.3%) | 13 (6.2%) |
| 35 to 64 Years | 29 (6.1%) | 22 (4.7%) |
| 65 to 74 Years | 20 (9.8%) | 0 (0.0%) |
| 75 Years and over | 15 (34.1%) | 7 (8.3%) |
Disability Class: Ambulatory Difficulty
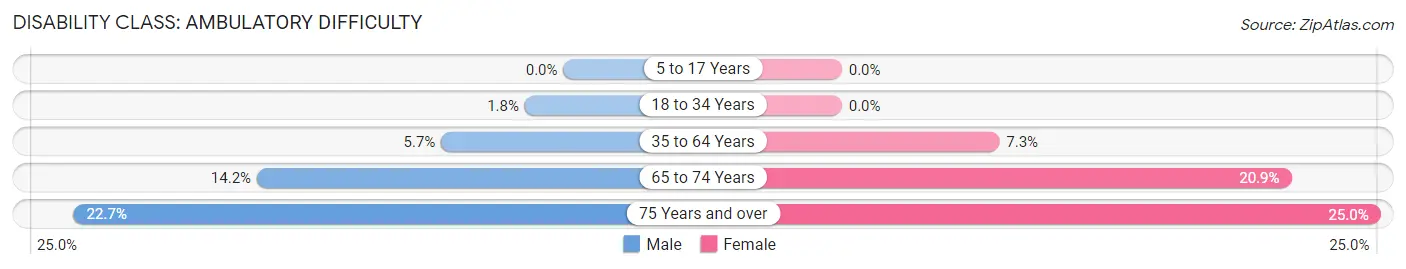
| Age Bracket | Male | Female |
| 5 to 17 Years | 0 (0.0%) | 0 (0.0%) |
| 18 to 34 Years | 5 (1.8%) | 0 (0.0%) |
| 35 to 64 Years | 27 (5.7%) | 34 (7.3%) |
| 65 to 74 Years | 29 (14.2%) | 29 (20.9%) |
| 75 Years and over | 10 (22.7%) | 21 (25.0%) |
Disability Class: Self-Care Difficulty
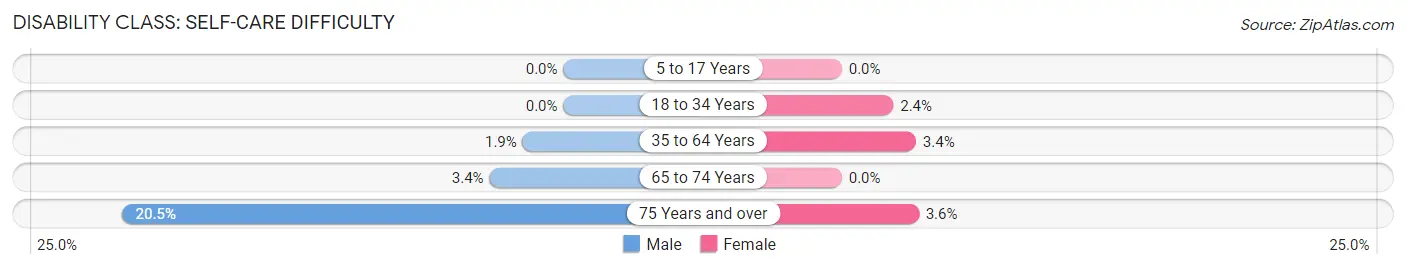
| Age Bracket | Male | Female |
| 5 to 17 Years | 0 (0.0%) | 0 (0.0%) |
| 18 to 34 Years | 0 (0.0%) | 5 (2.4%) |
| 35 to 64 Years | 9 (1.9%) | 16 (3.4%) |
| 65 to 74 Years | 7 (3.4%) | 0 (0.0%) |
| 75 Years and over | 9 (20.4%) | 3 (3.6%) |
Technology Access in Amboy
Computing Device Access in Amboy
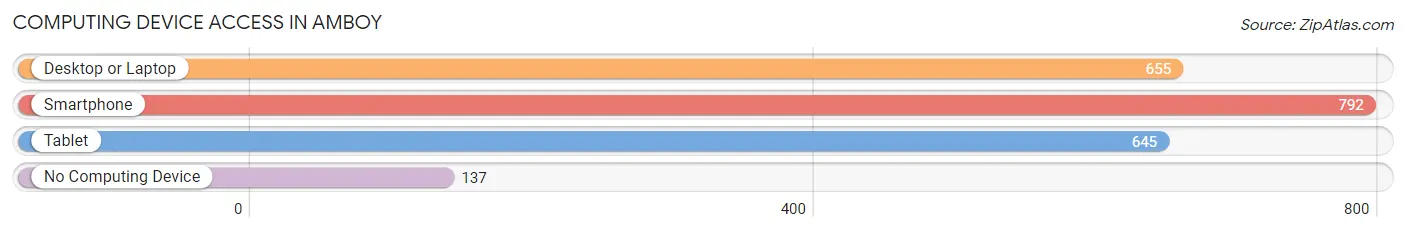
| Device Type | # Households | % Households |
| Desktop or Laptop | 655 | 66.8% |
| Smartphone | 792 | 80.8% |
| Tablet | 645 | 65.8% |
| No Computing Device | 137 | 14.0% |
| Total | 980 | 100.0% |
Internet Access in Amboy
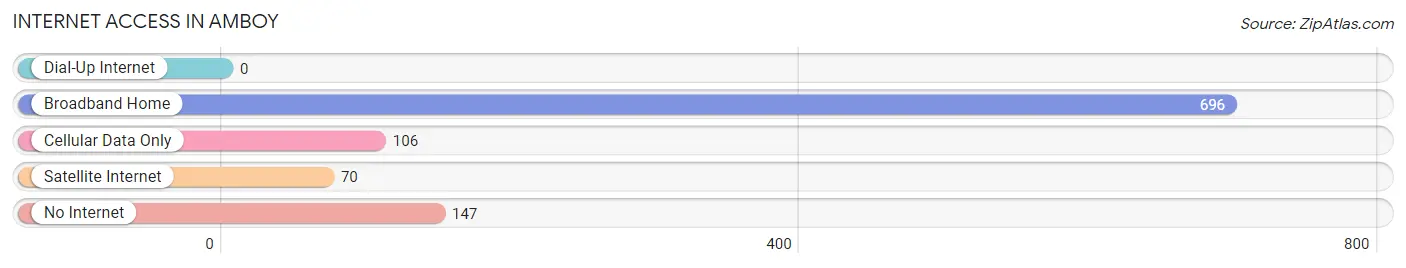
| Internet Type | # Households | % Households |
| Dial-Up Internet | 0 | 0.0% |
| Broadband Home | 696 | 71.0% |
| Cellular Data Only | 106 | 10.8% |
| Satellite Internet | 70 | 7.1% |
| No Internet | 147 | 15.0% |
| Total | 980 | 100.0% |
Amboy Summary
Amboy, Illinois is a small city located in Lee County, Illinois. It is situated on the banks of the Mississippi River, approximately 80 miles west of Chicago. The city has a population of 2,841 as of the 2010 census, making it the second-largest city in Lee County.
History
Amboy was founded in 1835 by William and Mary Ann Miller, who named the city after their hometown of Amboy, New York. The Millers were among the first settlers in the area, and the city quickly grew as a trading post and transportation hub. The first post office was established in 1837, and the first school was built in 1845.
In 1853, the Illinois Central Railroad arrived in Amboy, connecting the city to Chicago and other major cities. This allowed the city to become a major hub for the transportation of goods and people. The railroad also helped to spur the growth of the city, as it attracted new businesses and industries.
In 1867, Amboy was incorporated as a village, and in 1873 it was incorporated as a city. During this time, the city experienced a period of rapid growth, as new businesses and industries moved into the area. The city also became a popular tourist destination, as it was located on the Mississippi River and had a variety of attractions.
Geography
Amboy is located in the northwest corner of Lee County, Illinois. It is situated on the banks of the Mississippi River, approximately 80 miles west of Chicago. The city has a total area of 2.2 square miles, all of which is land.
The city is located in a flat, low-lying area, with an elevation of 645 feet above sea level. The climate is humid continental, with hot, humid summers and cold, snowy winters.
Economy
Amboy’s economy is largely based on agriculture and manufacturing. The city is home to several large farms, which produce a variety of crops, including corn, soybeans, and wheat. The city is also home to several manufacturing companies, which produce a variety of products, including furniture, clothing, and automotive parts.
The city is also home to several small businesses, including restaurants, retail stores, and service providers. The city is also home to a variety of tourist attractions, including the Amboy Depot Museum, the Amboy Historical Society, and the Amboy National Wildlife Refuge.
Demographics
As of the 2010 census, the population of Amboy was 2,841. The racial makeup of the city was 97.2% White, 0.7% African American, 0.2% Native American, 0.3% Asian, 0.1% Pacific Islander, 0.7% from other races, and 0.9% from two or more races. Hispanic or Latino of any race were 2.2% of the population.
The median household income in Amboy was $45,938, and the median family income was $51,938. The per capita income was $20,938. About 8.2% of families and 10.2% of the population were below the poverty line, including 14.2% of those under age 18 and 6.2% of those age 65 or over.
Common Questions
What is Per Capita Income in Amboy?
Per Capita income in Amboy is $34,323.
What is the Median Family Income in Amboy?
Median Family Income in Amboy is $81,635.
What is the Median Household income in Amboy?
Median Household Income in Amboy is $72,829.
What is Income or Wage Gap in Amboy?
Income or Wage Gap in Amboy is 43.9%.
Women in Amboy earn 56.1 cents for every dollar earned by a man.
What is Inequality or Gini Index in Amboy?
Inequality or Gini Index in Amboy is 0.40.
What is the Total Population of Amboy?
Total Population of Amboy is 2,413.
What is the Total Male Population of Amboy?
Total Male Population of Amboy is 1,245.
What is the Total Female Population of Amboy?
Total Female Population of Amboy is 1,168.
What is the Ratio of Males per 100 Females in Amboy?
There are 106.59 Males per 100 Females in Amboy.
What is the Ratio of Females per 100 Males in Amboy?
There are 93.82 Females per 100 Males in Amboy.
What is the Median Population Age in Amboy?
Median Population Age in Amboy is 45.8 Years.
What is the Average Family Size in Amboy
Average Family Size in Amboy is 2.8 People.
What is the Average Household Size in Amboy
Average Household Size in Amboy is 2.4 People.
How Large is the Labor Force in Amboy?
There are 1,331 People in the Labor Forcein in Amboy.
What is the Percentage of People in the Labor Force in Amboy?
67.3% of People are in the Labor Force in Amboy.
What is the Unemployment Rate in Amboy?
Unemployment Rate in Amboy is 5.6%.