Cities with the Highest Percentage of Population Taking Public Transit to Work in Iowa
RELATED REPORTS & OPTIONS
Public Transit
Iowa
Compare Cities
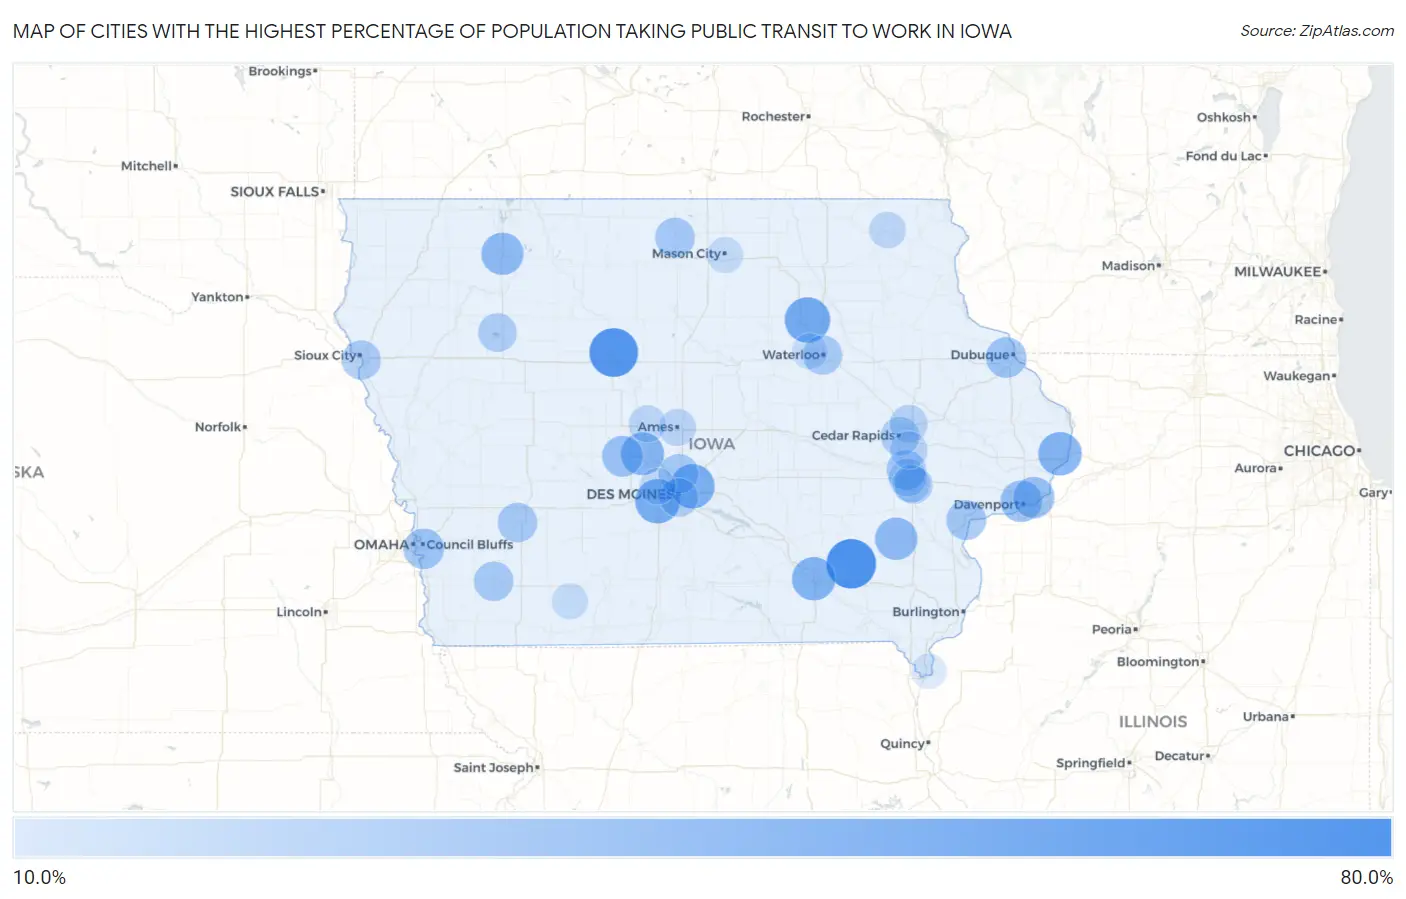
Map of Cities with the Highest Percentage of Population Taking Public Transit to Work in Iowa
0.0%
80.0%
Cities with the Highest Percentage of Population Taking Public Transit to Work in Iowa
| City | % Public Transit | vs State | vs National | |
| 1. | Packwood | 72.9% | 30.7%(+42.2)#1 | 38.5%(+34.4)#11 |
| 2. | Fort Dodge | 69.6% | 30.7%(+38.9)#2 | 38.5%(+31.1)#14 |
| 3. | Waverly | 57.3% | 30.7%(+26.6)#3 | 38.5%(+18.8)#297 |
| 4. | West Des Moines | 53.8% | 30.7%(+23.1)#4 | 38.5%(+15.3)#534 |
| 5. | Altoona | 52.9% | 30.7%(+22.2)#5 | 38.5%(+14.4)#614 |
| 6. | Ottumwa | 49.9% | 30.7%(+19.2)#6 | 38.5%(+11.4)#898 |
| 7. | Clinton | 49.7% | 30.7%(+19.0)#7 | 38.5%(+11.2)#916 |
| 8. | Woodward | 47.8% | 30.7%(+17.1)#8 | 38.5%(+9.30)#1,212 |
| 9. | Washington | 45.5% | 30.7%(+14.8)#9 | 38.5%(+7.00)#1,580 |
| 10. | Spencer | 45.2% | 30.7%(+14.5)#10 | 38.5%(+6.70)#1,636 |
| 11. | Davenport | 42.1% | 30.7%(+11.4)#11 | 38.5%(+3.60)#2,173 |
| 12. | Bettendorf | 41.8% | 30.7%(+11.1)#12 | 38.5%(+3.30)#2,215 |
| 13. | Perry | 39.8% | 30.7%(+9.10)#13 | 38.5%(+1.30)#2,584 |
| 14. | Council Bluffs | 38.8% | 30.7%(+8.10)#14 | 38.5%(+0.300)#2,734 |
| 15. | Dubuque | 38.8% | 30.7%(+8.10)#15 | 38.5%(+0.300)#2,735 |
| 16. | Muscatine | 36.3% | 30.7%(+5.60)#16 | 38.5%(-2.20)#3,129 |
| 17. | Forest City | 35.1% | 30.7%(+4.40)#17 | 38.5%(-3.40)#3,313 |
| 18. | Ankeny | 35.0% | 30.7%(+4.30)#18 | 38.5%(-3.50)#3,315 |
| 19. | Atlantic | 35.0% | 30.7%(+4.30)#19 | 38.5%(-3.50)#3,322 |
| 20. | North Liberty | 34.9% | 30.7%(+4.20)#20 | 38.5%(-3.60)#3,333 |
| 21. | Red Oak | 34.3% | 30.7%(+3.60)#21 | 38.5%(-4.20)#3,431 |
| 22. | Waterloo | 34.1% | 30.7%(+3.40)#22 | 38.5%(-4.40)#3,437 |
| 23. | Sioux City | 33.5% | 30.7%(+2.80)#23 | 38.5%(-5.00)#3,515 |
| 24. | Des Moines | 32.4% | 30.7%(+1.70)#24 | 38.5%(-6.10)#3,644 |
| 25. | Cedar Rapids | 32.4% | 30.7%(+1.70)#25 | 38.5%(-6.10)#3,645 |
| 26. | Storm Lake | 32.1% | 30.7%(+1.40)#26 | 38.5%(-6.40)#3,675 |
| 27. | Iowa City | 29.1% | 30.7%(-1.60)#27 | 38.5%(-9.40)#3,949 |
| 28. | Marion | 28.7% | 30.7%(-2.00)#28 | 38.5%(-9.80)#3,997 |
| 29. | Coralville | 28.7% | 30.7%(-2.00)#29 | 38.5%(-9.80)#4,000 |
| 30. | University Heights | 28.5% | 30.7%(-2.20)#30 | 38.5%(-10.0)#4,029 |
| 31. | Ely | 27.8% | 30.7%(-2.90)#31 | 38.5%(-10.7)#4,072 |
| 32. | Ames | 26.6% | 30.7%(-4.10)#32 | 38.5%(-11.9)#4,156 |
| 33. | Boone | 26.0% | 30.7%(-4.70)#33 | 38.5%(-12.5)#4,186 |
| 34. | Decorah | 24.8% | 30.7%(-5.90)#34 | 38.5%(-13.7)#4,262 |
| 35. | Urbandale | 23.9% | 30.7%(-6.80)#35 | 38.5%(-14.6)#4,302 |
| 36. | Lenox | 23.1% | 30.7%(-7.60)#36 | 38.5%(-15.4)#4,356 |
| 37. | Mason City | 22.8% | 30.7%(-7.90)#37 | 38.5%(-15.7)#4,376 |
| 38. | Cedar Falls | 22.2% | 30.7%(-8.50)#38 | 38.5%(-16.3)#4,413 |
| 39. | Keokuk | 19.5% | 30.7%(-11.2)#39 | 38.5%(-19.0)#4,512 |
Common Questions
What are the Top 10 Cities with the Highest Percentage of Population Taking Public Transit to Work in Iowa?
Top 10 Cities with the Highest Percentage of Population Taking Public Transit to Work in Iowa are:
#1
72.9%
#2
69.6%
#3
57.3%
#4
53.8%
#5
52.9%
#6
49.9%
#7
49.7%
#8
47.8%
#9
45.5%
#10
45.2%
What city has the Highest Percentage of Population Taking Public Transit to Work in Iowa?
Packwood has the Highest Percentage of Population Taking Public Transit to Work in Iowa with 72.9%.
What is the Percentage of Population Taking Public Transit to Work in the State of Iowa?
Percentage of Population Taking Public Transit to Work in Iowa is 30.7%.
What is the Percentage of Population Taking Public Transit to Work in the United States?
Percentage of Population Taking Public Transit to Work in the United States is 38.5%.