Boone, IA Map & Demographics
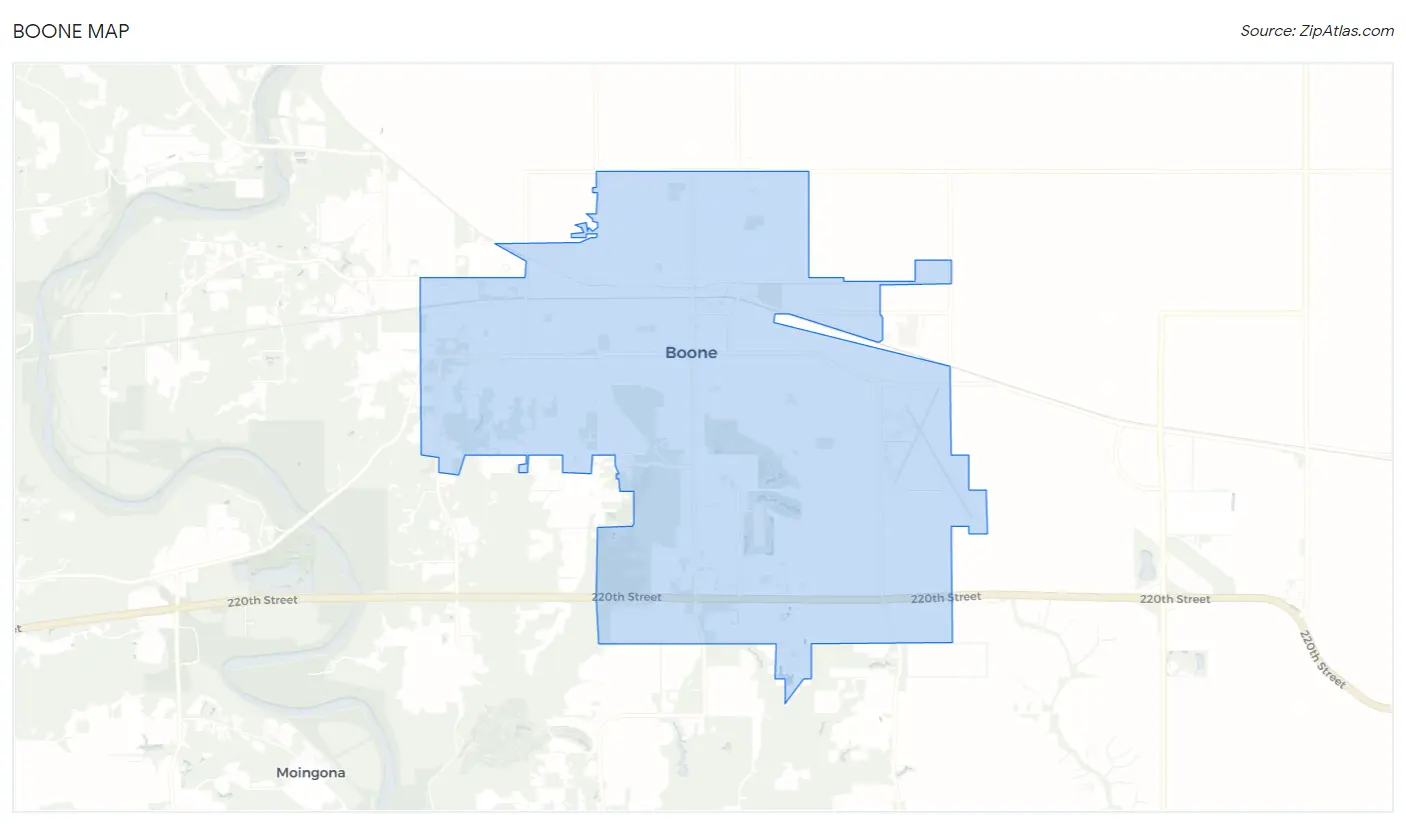
Boone Map
Boone Overview
$32,737
PER CAPITA INCOME
$90,934
AVG FAMILY INCOME
$64,192
AVG HOUSEHOLD INCOME
17.6%
WAGE / INCOME GAP [ % ]
82.4¢/ $1
WAGE / INCOME GAP [ $ ]
0.39
INEQUALITY / GINI INDEX
12,482
TOTAL POPULATION
6,225
MALE POPULATION
6,257
FEMALE POPULATION
99.49
MALES / 100 FEMALES
100.51
FEMALES / 100 MALES
38.5
MEDIAN AGE
3.0
AVG FAMILY SIZE
2.4
AVG HOUSEHOLD SIZE
7,017
LABOR FORCE [ PEOPLE ]
67.9%
PERCENT IN LABOR FORCE
0.8%
UNEMPLOYMENT RATE
Boone Zip Codes
Boone Area Codes
Income in Boone
Income Overview in Boone
Per Capita Income in Boone is $32,737, while median incomes of families and households are $90,934 and $64,192 respectively.
| Characteristic | Number | Measure |
| Per Capita Income | 12,482 | $32,737 |
| Median Family Income | 3,100 | $90,934 |
| Mean Family Income | 3,100 | $95,078 |
| Median Household Income | 5,135 | $64,192 |
| Mean Household Income | 5,135 | $76,420 |
| Income Deficit | 3,100 | $0 |
| Wage / Income Gap (%) | 12,482 | 17.57% |
| Wage / Income Gap ($) | 12,482 | 82.43¢ per $1 |
| Gini / Inequality Index | 12,482 | 0.39 |
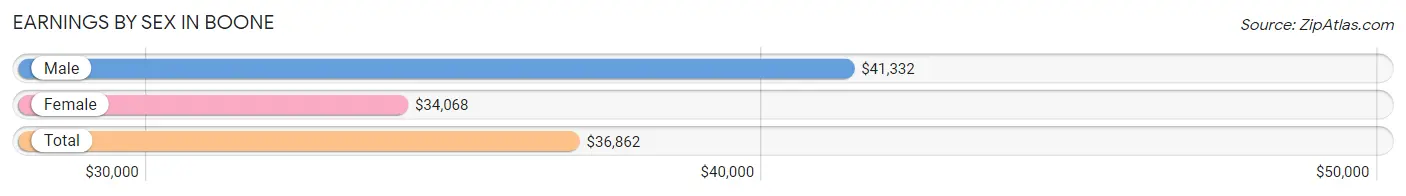
Earnings by Sex in Boone
Average Earnings in Boone are $36,862, $41,332 for men and $34,068 for women, a difference of 17.6%.
| Sex | Number | Average Earnings |
| Male | 3,984 (54.3%) | $41,332 |
| Female | 3,346 (45.7%) | $34,068 |
| Total | 7,330 (100.0%) | $36,862 |
Earnings by Sex by Income Bracket in Boone
The most common earnings brackets in Boone are $100,000+ for men (363 | 9.1%) and $30,000 to $34,999 for women (384 | 11.5%).
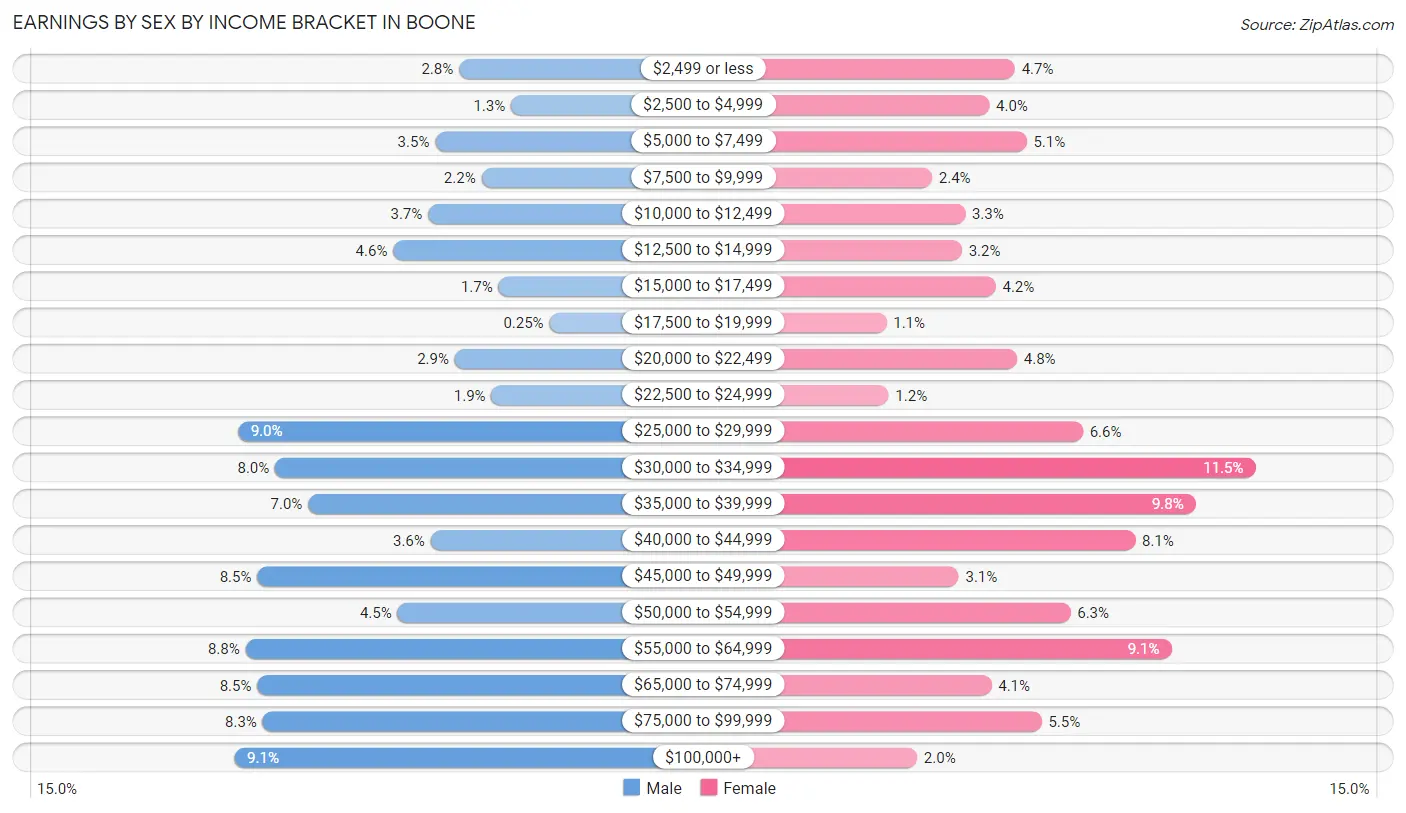
| Income | Male | Female |
| $2,499 or less | 111 (2.8%) | 158 (4.7%) |
| $2,500 to $4,999 | 53 (1.3%) | 134 (4.0%) |
| $5,000 to $7,499 | 138 (3.5%) | 169 (5.1%) |
| $7,500 to $9,999 | 86 (2.2%) | 80 (2.4%) |
| $10,000 to $12,499 | 146 (3.7%) | 111 (3.3%) |
| $12,500 to $14,999 | 185 (4.6%) | 108 (3.2%) |
| $15,000 to $17,499 | 67 (1.7%) | 140 (4.2%) |
| $17,500 to $19,999 | 10 (0.3%) | 37 (1.1%) |
| $20,000 to $22,499 | 116 (2.9%) | 160 (4.8%) |
| $22,500 to $24,999 | 75 (1.9%) | 39 (1.2%) |
| $25,000 to $29,999 | 359 (9.0%) | 222 (6.6%) |
| $30,000 to $34,999 | 317 (8.0%) | 384 (11.5%) |
| $35,000 to $39,999 | 280 (7.0%) | 328 (9.8%) |
| $40,000 to $44,999 | 143 (3.6%) | 271 (8.1%) |
| $45,000 to $49,999 | 337 (8.5%) | 105 (3.1%) |
| $50,000 to $54,999 | 180 (4.5%) | 210 (6.3%) |
| $55,000 to $64,999 | 350 (8.8%) | 305 (9.1%) |
| $65,000 to $74,999 | 337 (8.5%) | 136 (4.1%) |
| $75,000 to $99,999 | 331 (8.3%) | 183 (5.5%) |
| $100,000+ | 363 (9.1%) | 66 (2.0%) |
| Total | 3,984 (100.0%) | 3,346 (100.0%) |
Earnings by Sex by Educational Attainment in Boone
Average earnings in Boone are $49,538 for men and $36,489 for women, a difference of 26.3%. Men with an educational attainment of graduate degree enjoy the highest average annual earnings of $94,375, while those with less than high school education earn the least with $30,801. Women with an educational attainment of graduate degree earn the most with the average annual earnings of $61,827, while those with high school diploma education have the smallest earnings of $32,597.
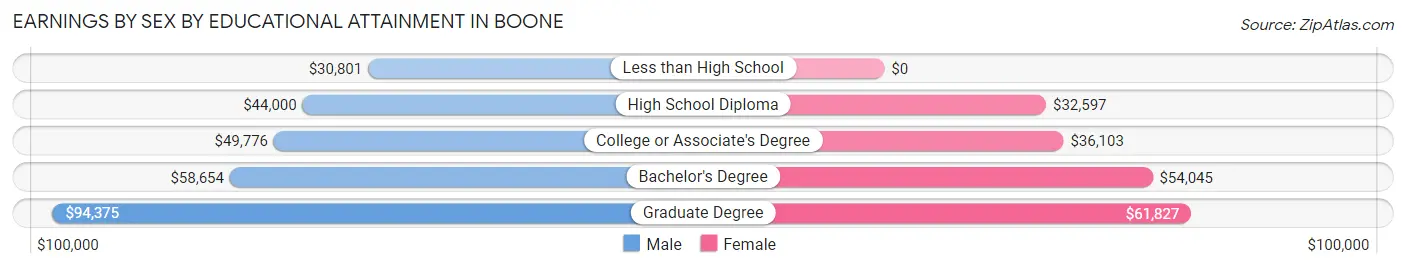
| Educational Attainment | Male Income | Female Income |
| Less than High School | $30,801 | $0 |
| High School Diploma | $44,000 | $32,597 |
| College or Associate's Degree | $49,776 | $36,103 |
| Bachelor's Degree | $58,654 | $54,045 |
| Graduate Degree | $94,375 | $61,827 |
| Total | $49,538 | $36,489 |
Family Income in Boone
Family Income Brackets in Boone
According to the Boone family income data, there are 828 families falling into the $100,000 to $149,999 income range, which is the most common income bracket and makes up 26.7% of all families.
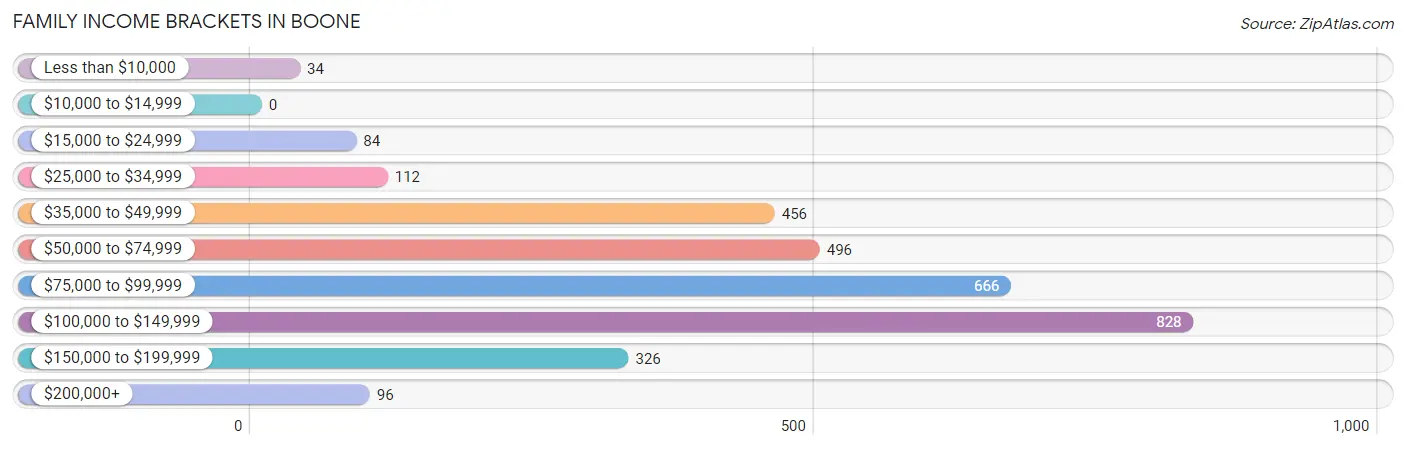
| Income Bracket | # Families | % Families |
| Less than $10,000 | 34 | 1.1% |
| $10,000 to $14,999 | 0 | 0.0% |
| $15,000 to $24,999 | 84 | 2.7% |
| $25,000 to $34,999 | 112 | 3.6% |
| $35,000 to $49,999 | 456 | 14.7% |
| $50,000 to $74,999 | 496 | 16.0% |
| $75,000 to $99,999 | 666 | 21.5% |
| $100,000 to $149,999 | 828 | 26.7% |
| $150,000 to $199,999 | 326 | 10.5% |
| $200,000+ | 96 | 3.1% |
Family Income by Famaliy Size in Boone
5-person families (335 | 10.8%) account for the highest median family income in Boone with $115,324 per family, while 2-person families (1,585 | 51.1%) have the highest median income of $40,856 per family member.
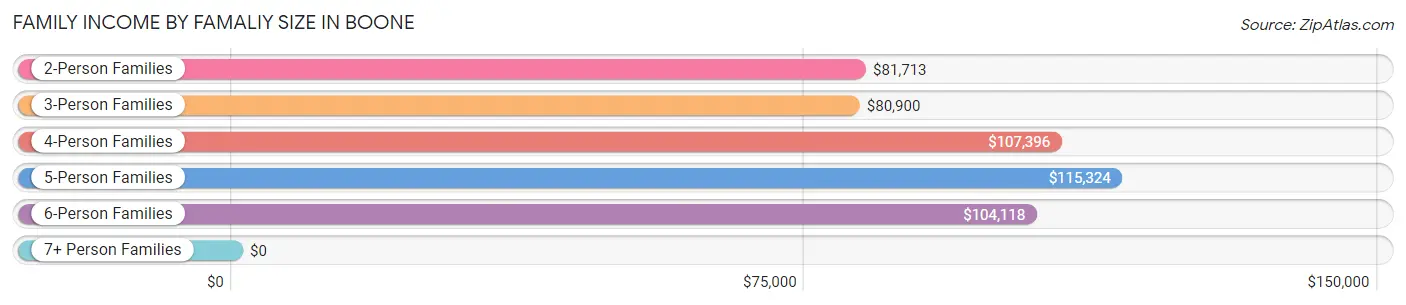
| Income Bracket | # Families | Median Income |
| 2-Person Families | 1,585 (51.1%) | $81,713 |
| 3-Person Families | 628 (20.3%) | $80,900 |
| 4-Person Families | 507 (16.4%) | $107,396 |
| 5-Person Families | 335 (10.8%) | $115,324 |
| 6-Person Families | 40 (1.3%) | $104,118 |
| 7+ Person Families | 5 (0.2%) | $0 |
| Total | 3,100 (100.0%) | $90,934 |
Family Income by Number of Earners in Boone
The median family income in Boone is $90,934, with families comprising 3+ earners (347) having the highest median family income of $142,824, while families with no earners (377) have the lowest median family income of $63,702, accounting for 11.2% and 12.2% of families, respectively.
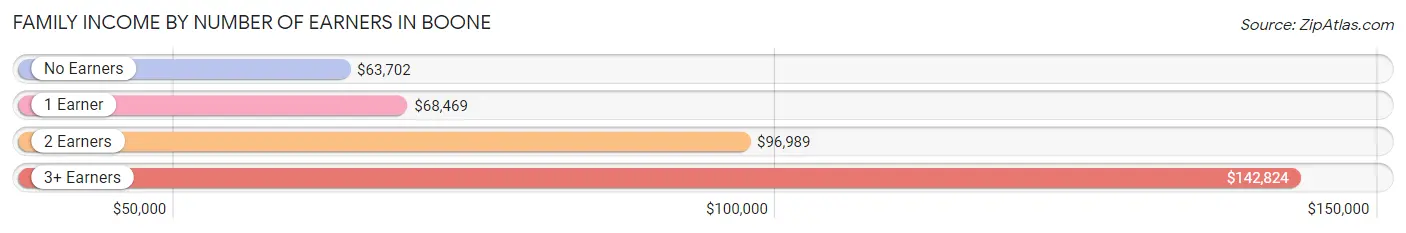
| Number of Earners | # Families | Median Income |
| No Earners | 377 (12.2%) | $63,702 |
| 1 Earner | 762 (24.6%) | $68,469 |
| 2 Earners | 1,614 (52.1%) | $96,989 |
| 3+ Earners | 347 (11.2%) | $142,824 |
| Total | 3,100 (100.0%) | $90,934 |
Household Income in Boone
Household Income Brackets in Boone
With 935 households falling in the category, the $100,000 to $149,999 income range is the most frequent in Boone, accounting for 18.2% of all households. In contrast, only 139 households (2.7%) fall into the $200,000+ income bracket, making it the least populous group.
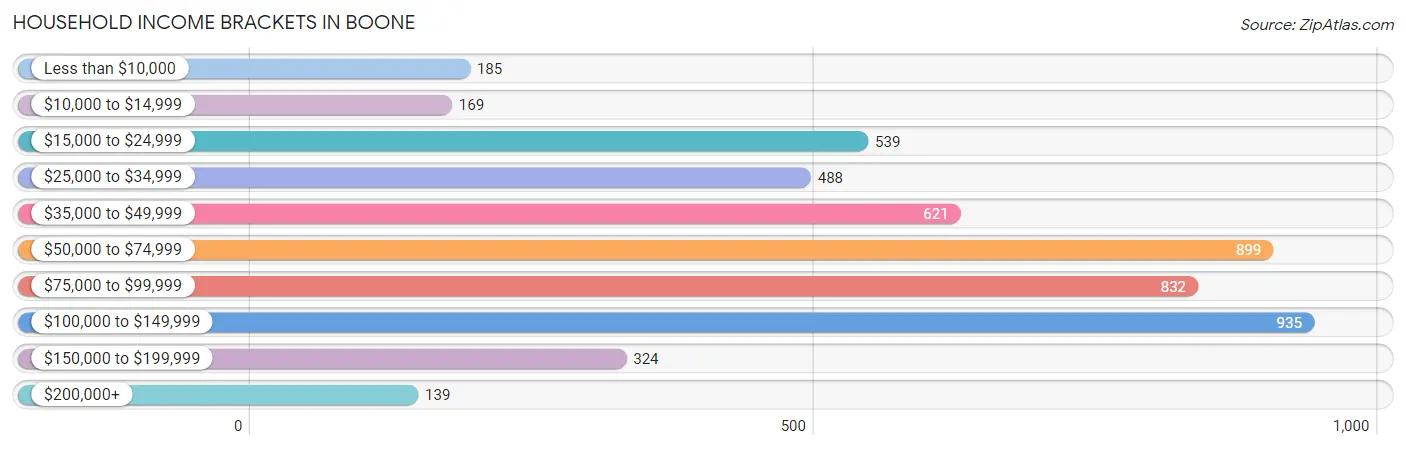
| Income Bracket | # Households | % Households |
| Less than $10,000 | 185 | 3.6% |
| $10,000 to $14,999 | 169 | 3.3% |
| $15,000 to $24,999 | 539 | 10.5% |
| $25,000 to $34,999 | 488 | 9.5% |
| $35,000 to $49,999 | 621 | 12.1% |
| $50,000 to $74,999 | 899 | 17.5% |
| $75,000 to $99,999 | 832 | 16.2% |
| $100,000 to $149,999 | 935 | 18.2% |
| $150,000 to $199,999 | 324 | 6.3% |
| $200,000+ | 139 | 2.7% |
Household Income by Householder Age in Boone
The median household income in Boone is $64,192, with the highest median household income of $79,450 found in the 45 to 64 years age bracket for the primary householder. A total of 1,857 households (36.2%) fall into this category. Meanwhile, the 15 to 24 years age bracket for the primary householder has the lowest median household income of $33,630, with 348 households (6.8%) in this group.
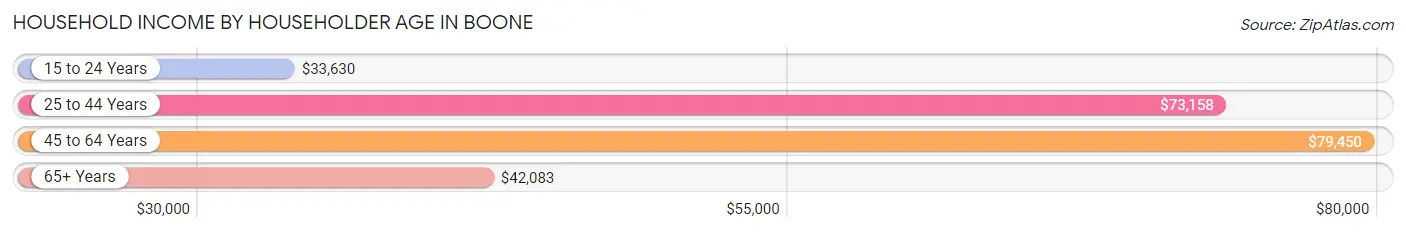
| Income Bracket | # Households | Median Income |
| 15 to 24 Years | 348 (6.8%) | $33,630 |
| 25 to 44 Years | 1,612 (31.4%) | $73,158 |
| 45 to 64 Years | 1,857 (36.2%) | $79,450 |
| 65+ Years | 1,318 (25.7%) | $42,083 |
| Total | 5,135 (100.0%) | $64,192 |
Poverty in Boone
Income Below Poverty by Sex and Age in Boone
With 8.6% poverty level for males and 7.8% for females among the residents of Boone, 15 year old males and 18 to 24 year old females are the most vulnerable to poverty, with 11 males (32.4%) and 126 females (22.3%) in their respective age groups living below the poverty level.
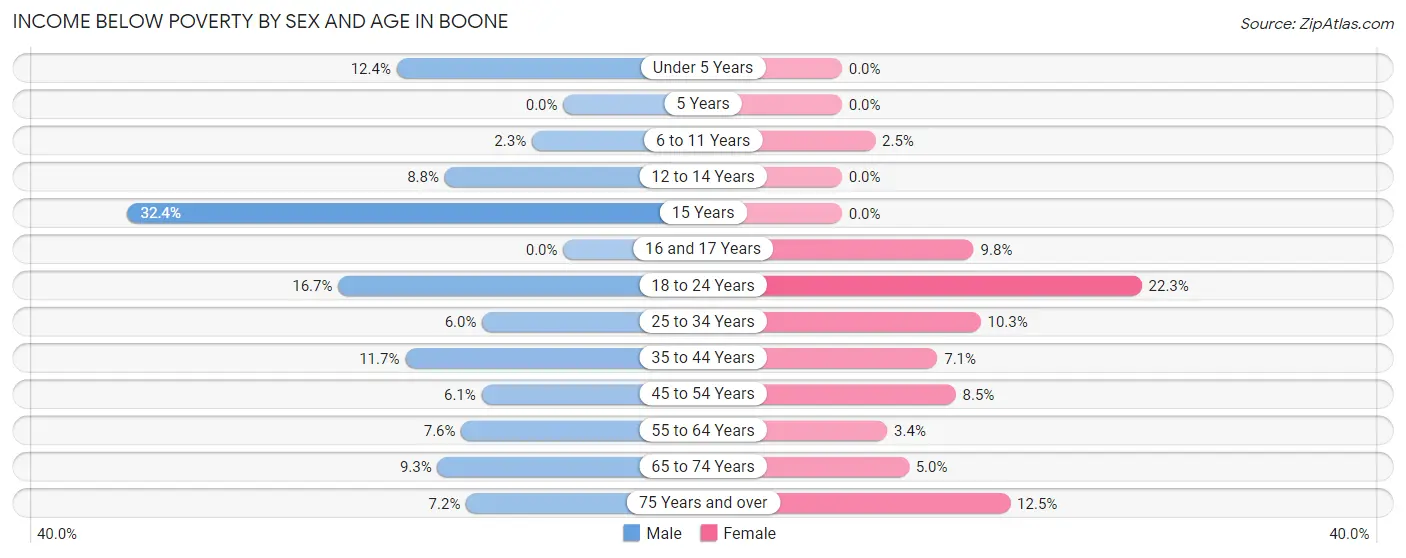
| Age Bracket | Male | Female |
| Under 5 Years | 48 (12.4%) | 0 (0.0%) |
| 5 Years | 0 (0.0%) | 0 (0.0%) |
| 6 to 11 Years | 10 (2.3%) | 9 (2.5%) |
| 12 to 14 Years | 11 (8.8%) | 0 (0.0%) |
| 15 Years | 11 (32.4%) | 0 (0.0%) |
| 16 and 17 Years | 0 (0.0%) | 14 (9.8%) |
| 18 to 24 Years | 116 (16.7%) | 126 (22.3%) |
| 25 to 34 Years | 57 (6.0%) | 99 (10.3%) |
| 35 to 44 Years | 103 (11.7%) | 53 (7.1%) |
| 45 to 54 Years | 46 (6.1%) | 54 (8.5%) |
| 55 to 64 Years | 54 (7.6%) | 30 (3.4%) |
| 65 to 74 Years | 51 (9.3%) | 32 (5.0%) |
| 75 Years and over | 22 (7.2%) | 58 (12.5%) |
| Total | 529 (8.6%) | 475 (7.8%) |
Income Above Poverty by Sex and Age in Boone
According to the poverty statistics in Boone, males aged 5 years and females aged under 5 years are the age groups that are most secure financially, with 100.0% of males and 100.0% of females in these age groups living above the poverty line.
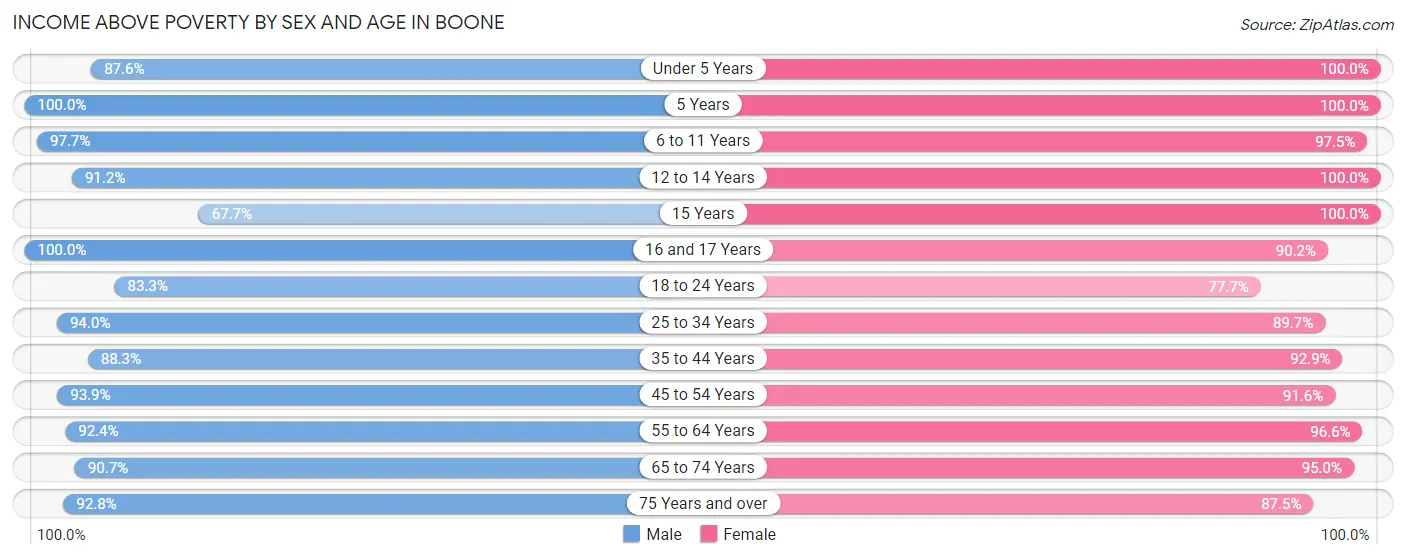
| Age Bracket | Male | Female |
| Under 5 Years | 340 (87.6%) | 364 (100.0%) |
| 5 Years | 107 (100.0%) | 38 (100.0%) |
| 6 to 11 Years | 419 (97.7%) | 356 (97.5%) |
| 12 to 14 Years | 114 (91.2%) | 240 (100.0%) |
| 15 Years | 23 (67.6%) | 28 (100.0%) |
| 16 and 17 Years | 224 (100.0%) | 129 (90.2%) |
| 18 to 24 Years | 578 (83.3%) | 440 (77.7%) |
| 25 to 34 Years | 890 (94.0%) | 862 (89.7%) |
| 35 to 44 Years | 774 (88.3%) | 695 (92.9%) |
| 45 to 54 Years | 712 (93.9%) | 585 (91.5%) |
| 55 to 64 Years | 659 (92.4%) | 860 (96.6%) |
| 65 to 74 Years | 495 (90.7%) | 612 (95.0%) |
| 75 Years and over | 283 (92.8%) | 406 (87.5%) |
| Total | 5,618 (91.4%) | 5,615 (92.2%) |
Income Below Poverty Among Married-Couple Families in Boone
The poverty statistics for married-couple families in Boone show that 2.0% or 47 of the total 2,395 families live below the poverty line. Families with 1 or 2 children have the highest poverty rate of 3.3%, comprising of 25 families. On the other hand, families with 3 or 4 children have the lowest poverty rate of 0.0%, which includes 0 families.
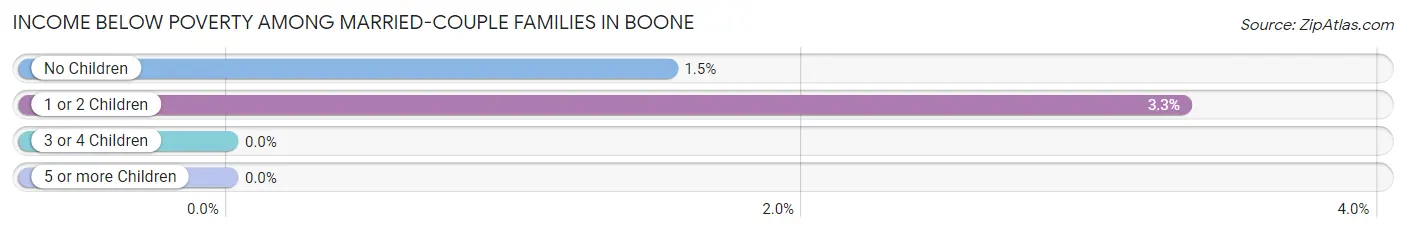
| Children | Above Poverty | Below Poverty |
| No Children | 1,412 (98.5%) | 22 (1.5%) |
| 1 or 2 Children | 727 (96.7%) | 25 (3.3%) |
| 3 or 4 Children | 209 (100.0%) | 0 (0.0%) |
| 5 or more Children | 0 (0.0%) | 0 (0.0%) |
| Total | 2,348 (98.0%) | 47 (2.0%) |
Income Below Poverty Among Single-Parent Households in Boone
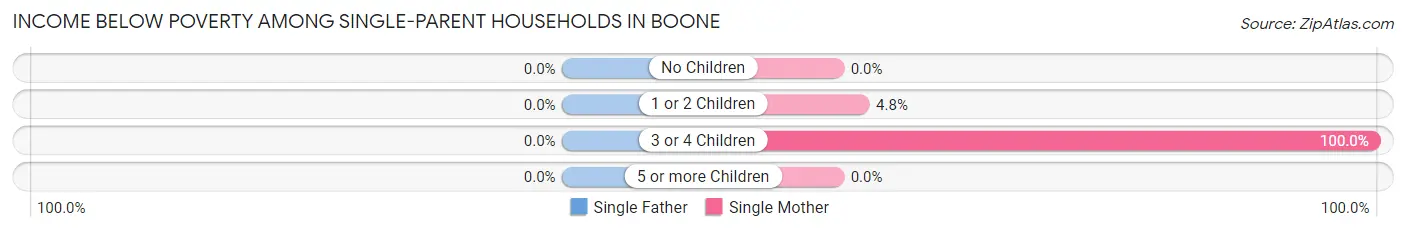
| Children | Single Father | Single Mother |
| No Children | 0 (0.0%) | 0 (0.0%) |
| 1 or 2 Children | 0 (0.0%) | 14 (4.8%) |
| 3 or 4 Children | 0 (0.0%) | 11 (100.0%) |
| 5 or more Children | 0 (0.0%) | 0 (0.0%) |
| Total | 0 (0.0%) | 25 (5.3%) |
Income Below Poverty Among Married-Couple vs Single-Parent Households in Boone
The poverty data for Boone shows that 47 of the married-couple family households (2.0%) and 25 of the single-parent households (3.5%) are living below the poverty level. Within the married-couple family households, those with 1 or 2 children have the highest poverty rate, with 25 households (3.3%) falling below the poverty line. Among the single-parent households, those with 3 or 4 children have the highest poverty rate, with 11 household (19.0%) living below poverty.
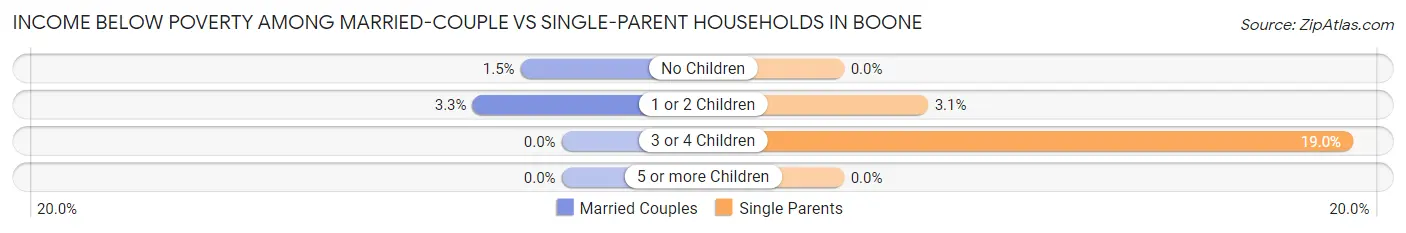
| Children | Married-Couple Families | Single-Parent Households |
| No Children | 22 (1.5%) | 0 (0.0%) |
| 1 or 2 Children | 25 (3.3%) | 14 (3.1%) |
| 3 or 4 Children | 0 (0.0%) | 11 (19.0%) |
| 5 or more Children | 0 (0.0%) | 0 (0.0%) |
| Total | 47 (2.0%) | 25 (3.5%) |
Race in Boone
The most populous races in Boone are White / Caucasian (11,574 | 92.7%), Two or more Races (526 | 4.2%), and Hispanic or Latino (459 | 3.7%).
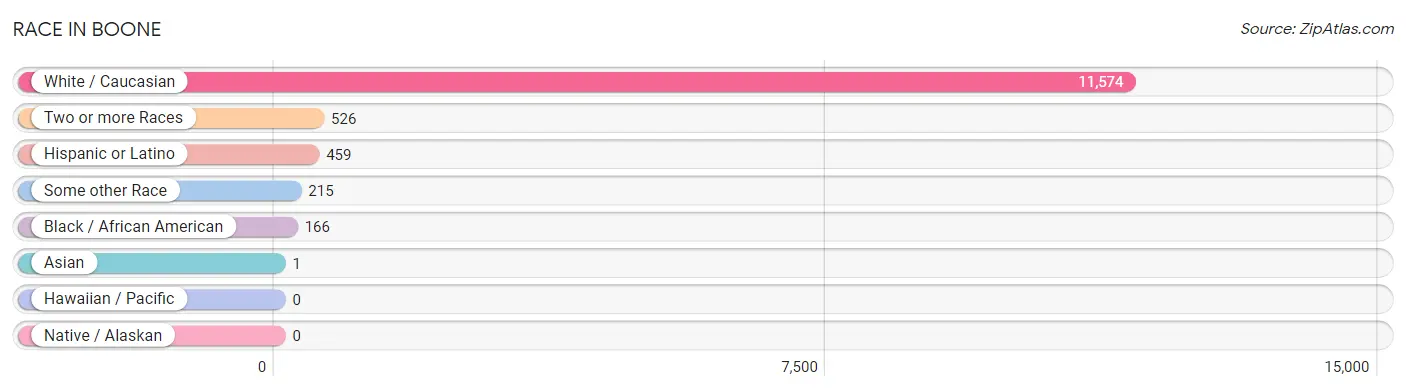
| Race | # Population | % Population |
| Asian | 1 | 0.0% |
| Black / African American | 166 | 1.3% |
| Hawaiian / Pacific | 0 | 0.0% |
| Hispanic or Latino | 459 | 3.7% |
| Native / Alaskan | 0 | 0.0% |
| White / Caucasian | 11,574 | 92.7% |
| Two or more Races | 526 | 4.2% |
| Some other Race | 215 | 1.7% |
| Total | 12,482 | 100.0% |
Ancestry in Boone
The most populous ancestries reported in Boone are German (4,324 | 34.6%), Irish (1,591 | 12.8%), English (1,300 | 10.4%), Norwegian (1,297 | 10.4%), and American (548 | 4.4%), together accounting for 72.6% of all Boone residents.
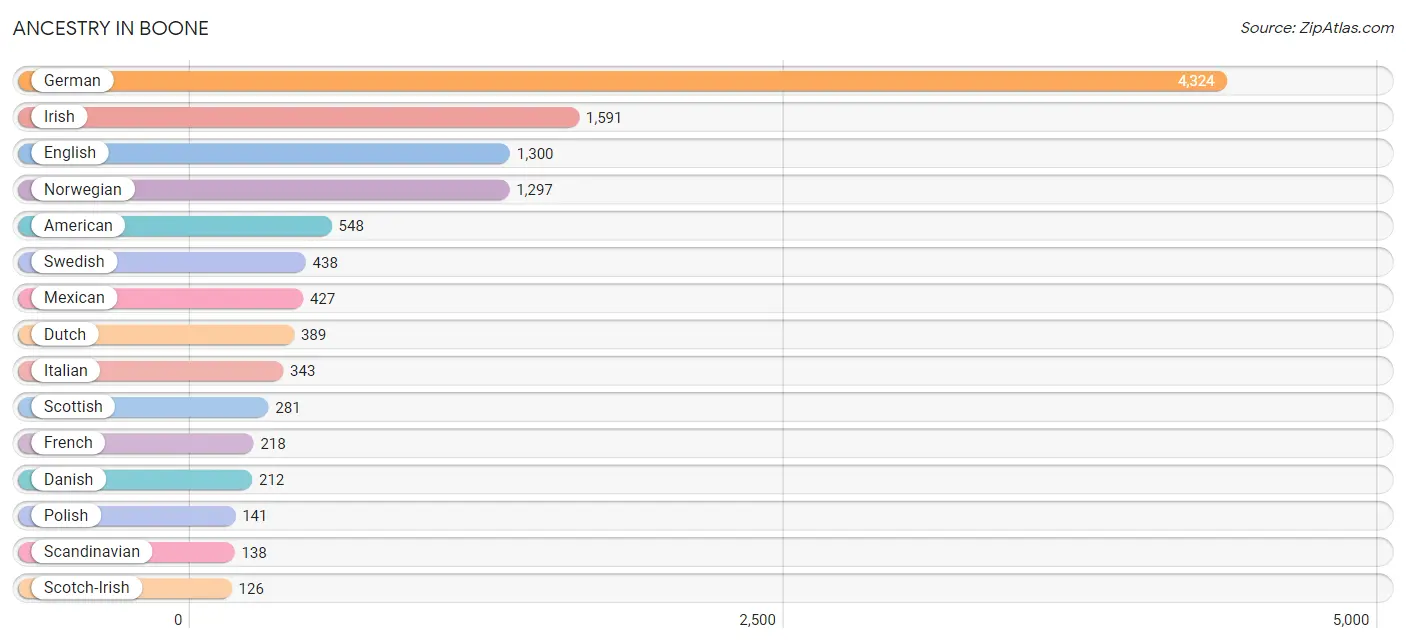
| Ancestry | # Population | % Population |
| American | 548 | 4.4% |
| Arab | 10 | 0.1% |
| Austrian | 6 | 0.1% |
| British | 72 | 0.6% |
| Cherokee | 22 | 0.2% |
| Chippewa | 12 | 0.1% |
| Colombian | 13 | 0.1% |
| Czech | 107 | 0.9% |
| Danish | 212 | 1.7% |
| Dominican | 11 | 0.1% |
| Dutch | 389 | 3.1% |
| Eastern European | 33 | 0.3% |
| English | 1,300 | 10.4% |
| European | 89 | 0.7% |
| French | 218 | 1.8% |
| French Canadian | 26 | 0.2% |
| German | 4,324 | 34.6% |
| Hungarian | 15 | 0.1% |
| Indonesian | 1 | 0.0% |
| Irish | 1,591 | 12.8% |
| Italian | 343 | 2.8% |
| Lebanese | 10 | 0.1% |
| Mexican | 427 | 3.4% |
| Northern European | 83 | 0.7% |
| Norwegian | 1,297 | 10.4% |
| Pennsylvania German | 6 | 0.1% |
| Polish | 141 | 1.1% |
| Puerto Rican | 7 | 0.1% |
| Romanian | 4 | 0.0% |
| Russian | 20 | 0.2% |
| Scandinavian | 138 | 1.1% |
| Scotch-Irish | 126 | 1.0% |
| Scottish | 281 | 2.2% |
| Serbian | 7 | 0.1% |
| Slovak | 25 | 0.2% |
| South American | 13 | 0.1% |
| Swedish | 438 | 3.5% |
| Swiss | 22 | 0.2% |
| Welsh | 71 | 0.6% |
| Yugoslavian | 6 | 0.1% | View All 40 Rows |
Immigrants in Boone
The most numerous immigrant groups reported in Boone came from Europe (40 | 0.3%), France (24 | 0.2%), Western Europe (24 | 0.2%), Central America (17 | 0.1%), and Latin America (17 | 0.1%), together accounting for 1.0% of all Boone residents.
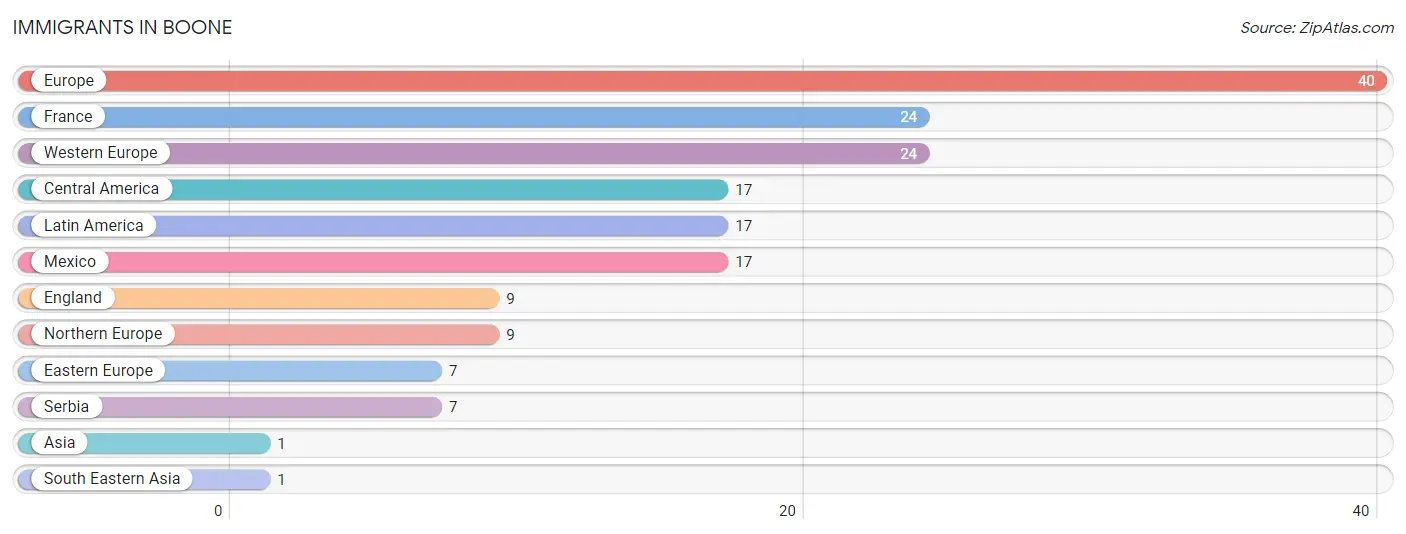
| Immigration Origin | # Population | % Population |
| Asia | 1 | 0.0% |
| Central America | 17 | 0.1% |
| Eastern Europe | 7 | 0.1% |
| England | 9 | 0.1% |
| Europe | 40 | 0.3% |
| France | 24 | 0.2% |
| Latin America | 17 | 0.1% |
| Mexico | 17 | 0.1% |
| Northern Europe | 9 | 0.1% |
| Serbia | 7 | 0.1% |
| South Eastern Asia | 1 | 0.0% |
| Western Europe | 24 | 0.2% | View All 12 Rows |
Sex and Age in Boone
Sex and Age in Boone
The most populous age groups in Boone are 30 to 34 Years (522 | 8.4%) for men and 30 to 34 Years (497 | 7.9%) for women.
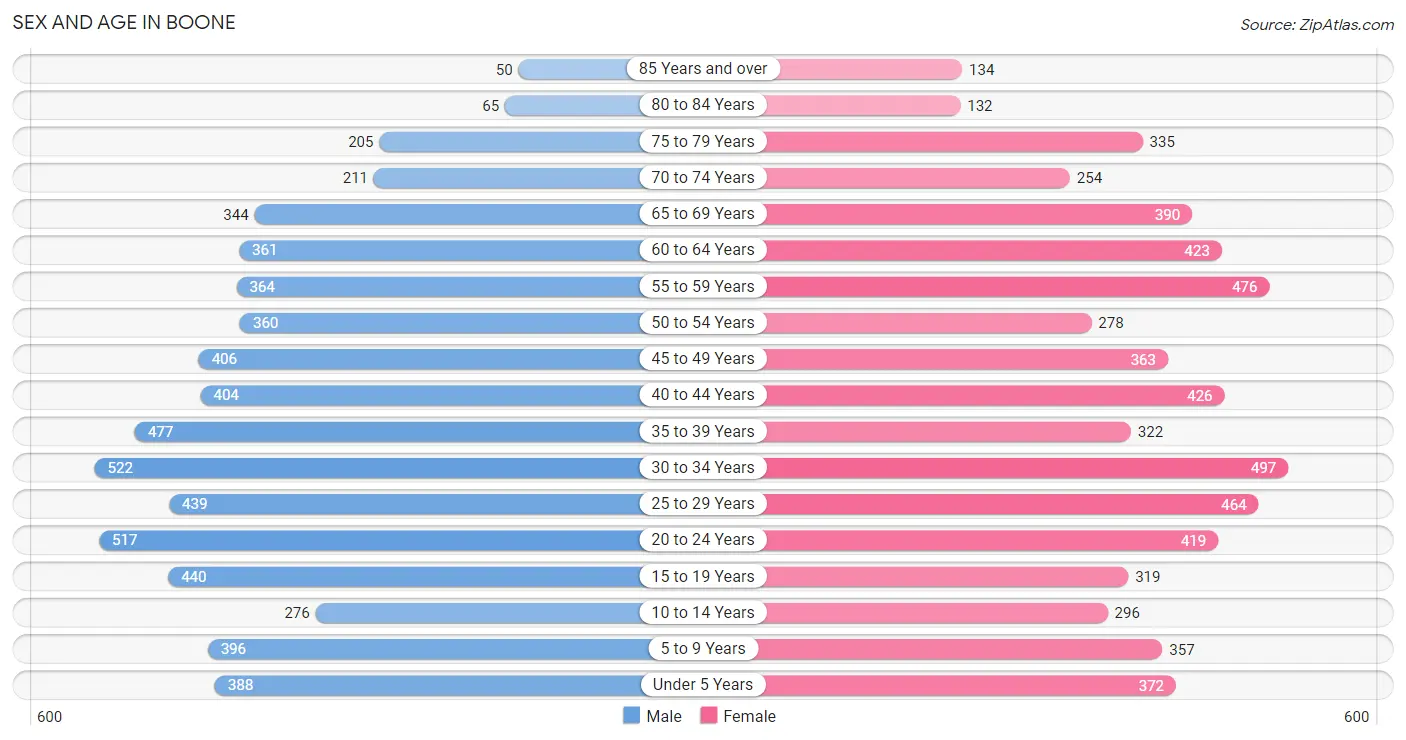
| Age Bracket | Male | Female |
| Under 5 Years | 388 (6.2%) | 372 (5.9%) |
| 5 to 9 Years | 396 (6.4%) | 357 (5.7%) |
| 10 to 14 Years | 276 (4.4%) | 296 (4.7%) |
| 15 to 19 Years | 440 (7.1%) | 319 (5.1%) |
| 20 to 24 Years | 517 (8.3%) | 419 (6.7%) |
| 25 to 29 Years | 439 (7.0%) | 464 (7.4%) |
| 30 to 34 Years | 522 (8.4%) | 497 (7.9%) |
| 35 to 39 Years | 477 (7.7%) | 322 (5.1%) |
| 40 to 44 Years | 404 (6.5%) | 426 (6.8%) |
| 45 to 49 Years | 406 (6.5%) | 363 (5.8%) |
| 50 to 54 Years | 360 (5.8%) | 278 (4.4%) |
| 55 to 59 Years | 364 (5.9%) | 476 (7.6%) |
| 60 to 64 Years | 361 (5.8%) | 423 (6.8%) |
| 65 to 69 Years | 344 (5.5%) | 390 (6.2%) |
| 70 to 74 Years | 211 (3.4%) | 254 (4.1%) |
| 75 to 79 Years | 205 (3.3%) | 335 (5.3%) |
| 80 to 84 Years | 65 (1.0%) | 132 (2.1%) |
| 85 Years and over | 50 (0.8%) | 134 (2.1%) |
| Total | 6,225 (100.0%) | 6,257 (100.0%) |
Families and Households in Boone
Median Family Size in Boone
The median family size in Boone is 3.04 persons per family, with single female/mother families (471 | 15.2%) accounting for the largest median family size of 3.15 persons per family. On the other hand, married-couple families (2,395 | 77.3%) represent the smallest median family size with 3.02 persons per family.
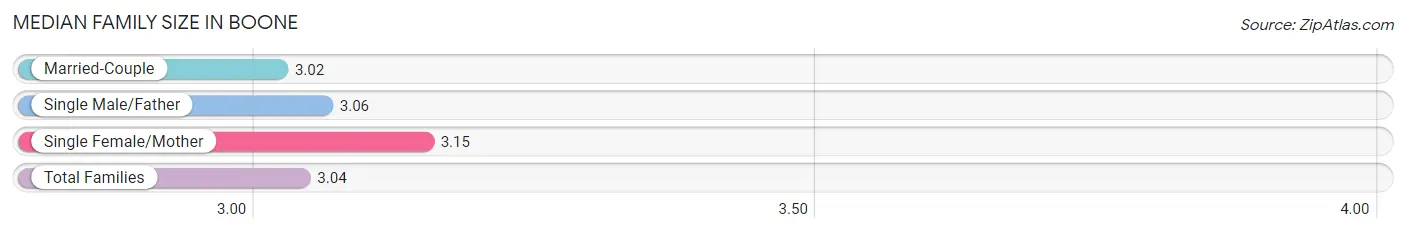
| Family Type | # Families | Family Size |
| Married-Couple | 2,395 (77.3%) | 3.02 |
| Single Male/Father | 234 (7.5%) | 3.06 |
| Single Female/Mother | 471 (15.2%) | 3.15 |
| Total Families | 3,100 (100.0%) | 3.04 |
Median Household Size in Boone
The median household size in Boone is 2.38 persons per household, with single male/father households (234 | 4.6%) accounting for the largest median household size of 3.5 persons per household. non-family households (2,035 | 39.6%) represent the smallest median household size with 1.28 persons per household.
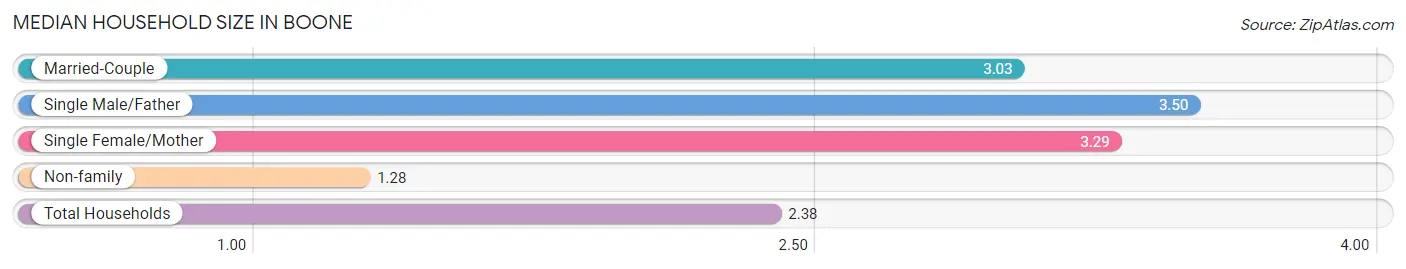
| Household Type | # Households | Household Size |
| Married-Couple | 2,395 (46.6%) | 3.03 |
| Single Male/Father | 234 (4.6%) | 3.50 |
| Single Female/Mother | 471 (9.2%) | 3.29 |
| Non-family | 2,035 (39.6%) | 1.28 |
| Total Households | 5,135 (100.0%) | 2.38 |
Household Size by Marriage Status in Boone
Out of a total of 5,135 households in Boone, 3,100 (60.4%) are family households, while 2,035 (39.6%) are nonfamily households. The most numerous type of family households are 2-person households, comprising 1,531, and the most common type of nonfamily households are 1-person households, comprising 1,641.
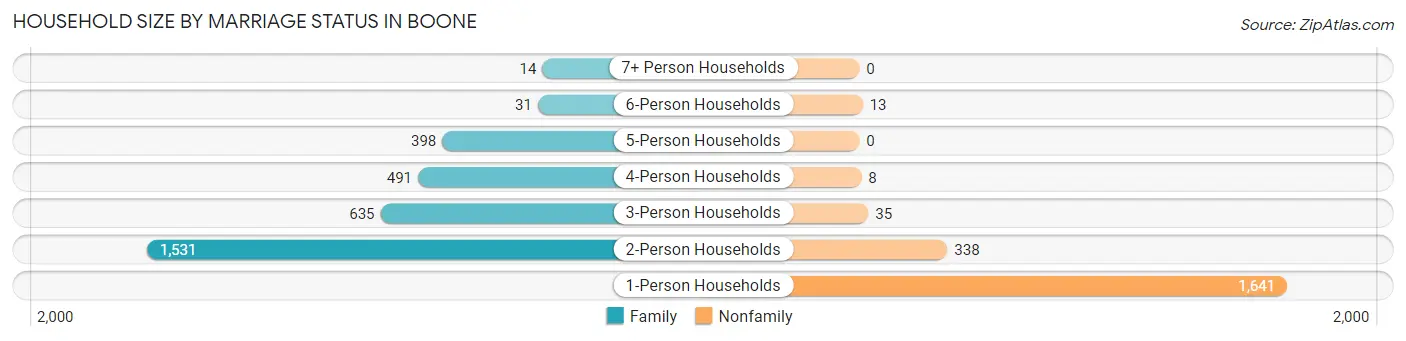
| Household Size | Family Households | Nonfamily Households |
| 1-Person Households | - | 1,641 (32.0%) |
| 2-Person Households | 1,531 (29.8%) | 338 (6.6%) |
| 3-Person Households | 635 (12.4%) | 35 (0.7%) |
| 4-Person Households | 491 (9.6%) | 8 (0.2%) |
| 5-Person Households | 398 (7.7%) | 0 (0.0%) |
| 6-Person Households | 31 (0.6%) | 13 (0.3%) |
| 7+ Person Households | 14 (0.3%) | 0 (0.0%) |
| Total | 3,100 (60.4%) | 2,035 (39.6%) |
Female Fertility in Boone
Fertility by Age in Boone
Average fertility rate in Boone is 54.0 births per 1,000 women. Women in the age bracket of 20 to 34 years have the highest fertility rate with 93.0 births per 1,000 women. Women in the age bracket of 20 to 34 years acount for 83.8% of all women with births.
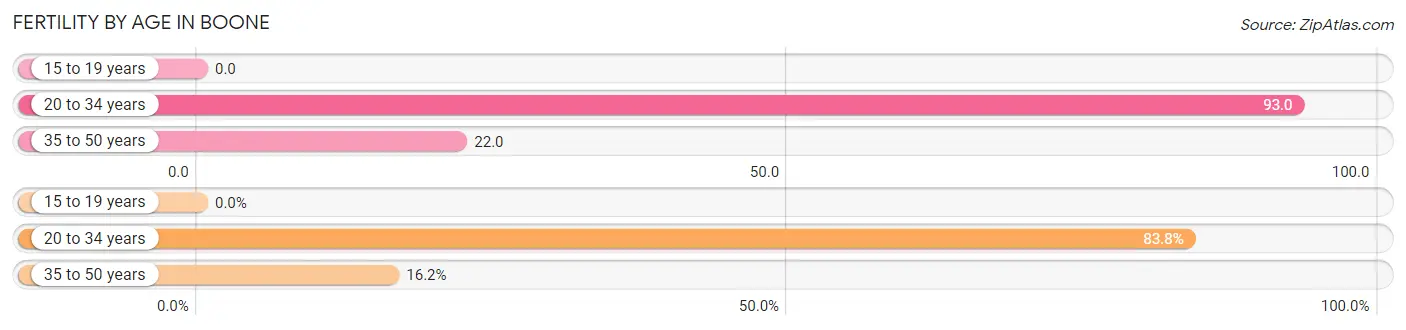
| Age Bracket | Women with Births | Births / 1,000 Women |
| 15 to 19 years | 0 (0.0%) | 0.0 |
| 20 to 34 years | 129 (83.8%) | 93.0 |
| 35 to 50 years | 25 (16.2%) | 22.0 |
| Total | 154 (100.0%) | 54.0 |
Fertility by Age by Marriage Status in Boone
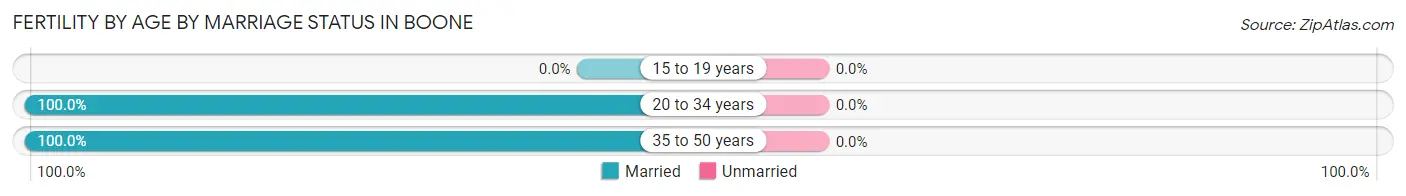
| Age Bracket | Married | Unmarried |
| 15 to 19 years | 0 (0.0%) | 0 (0.0%) |
| 20 to 34 years | 129 (100.0%) | 0 (0.0%) |
| 35 to 50 years | 25 (100.0%) | 0 (0.0%) |
| Total | 154 (100.0%) | 0 (0.0%) |
Fertility by Education in Boone
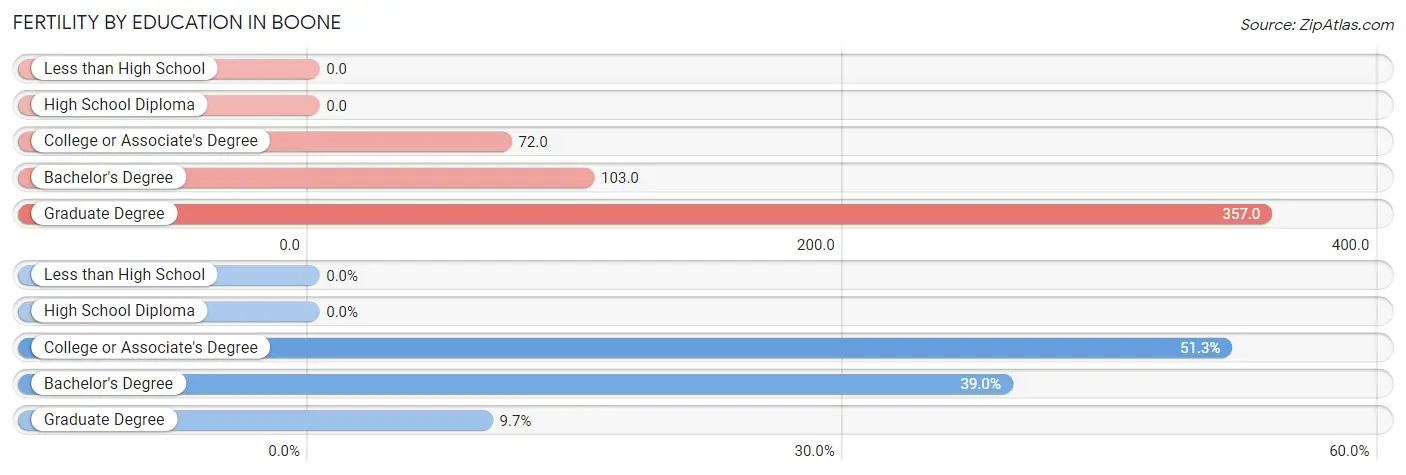
| Educational Attainment | Women with Births | Births / 1,000 Women |
| Less than High School | 0 (0.0%) | 0.0 |
| High School Diploma | 0 (0.0%) | 0.0 |
| College or Associate's Degree | 79 (51.3%) | 72.0 |
| Bachelor's Degree | 60 (39.0%) | 103.0 |
| Graduate Degree | 15 (9.7%) | 357.0 |
| Total | 154 (100.0%) | 54.0 |
Fertility by Education by Marriage Status in Boone
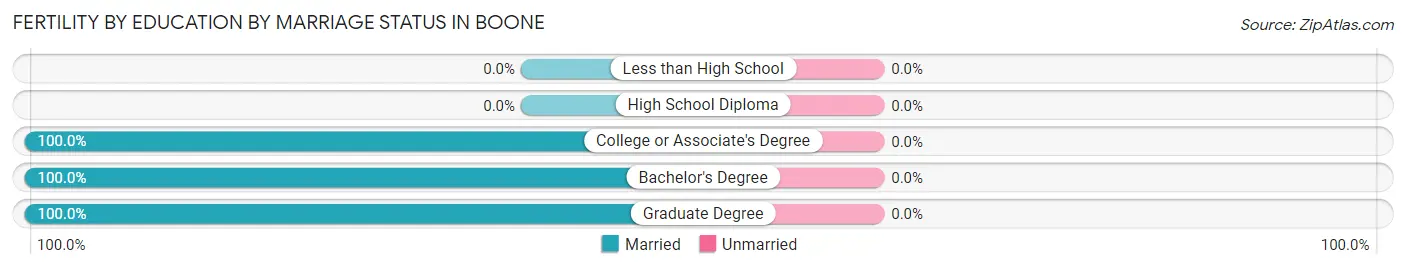
| Educational Attainment | Married | Unmarried |
| Less than High School | 0 (0.0%) | 0 (0.0%) |
| High School Diploma | 0 (0.0%) | 0 (0.0%) |
| College or Associate's Degree | 79 (100.0%) | 0 (0.0%) |
| Bachelor's Degree | 60 (100.0%) | 0 (0.0%) |
| Graduate Degree | 15 (100.0%) | 0 (0.0%) |
| Total | 154 (100.0%) | 0 (0.0%) |
Employment Characteristics in Boone
Employment by Class of Employer in Boone
Among the 6,843 employed individuals in Boone, private company employees (4,777 | 69.8%), not-for-profit organizations (540 | 7.9%), and state government employees (515 | 7.5%) make up the most common classes of employment.
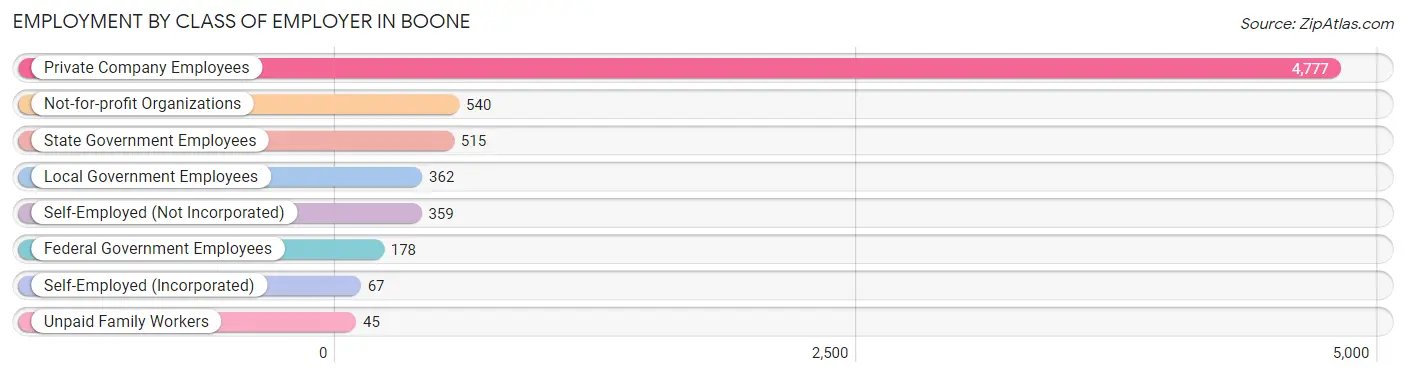
| Employer Class | # Employees | % Employees |
| Private Company Employees | 4,777 | 69.8% |
| Self-Employed (Incorporated) | 67 | 1.0% |
| Self-Employed (Not Incorporated) | 359 | 5.2% |
| Not-for-profit Organizations | 540 | 7.9% |
| Local Government Employees | 362 | 5.3% |
| State Government Employees | 515 | 7.5% |
| Federal Government Employees | 178 | 2.6% |
| Unpaid Family Workers | 45 | 0.7% |
| Total | 6,843 | 100.0% |
Employment Status by Age in Boone
According to the labor force statistics for Boone, out of the total population over 16 years of age (10,335), 67.9% or 7,017 individuals are in the labor force, with 0.8% or 56 of them unemployed. The age group with the highest labor force participation rate is 35 to 44 years, with 89.4% or 1,456 individuals in the labor force. Within the labor force, the 16 to 19 years age range has the highest percentage of unemployed individuals, with 5.9% or 28 of them being unemployed.
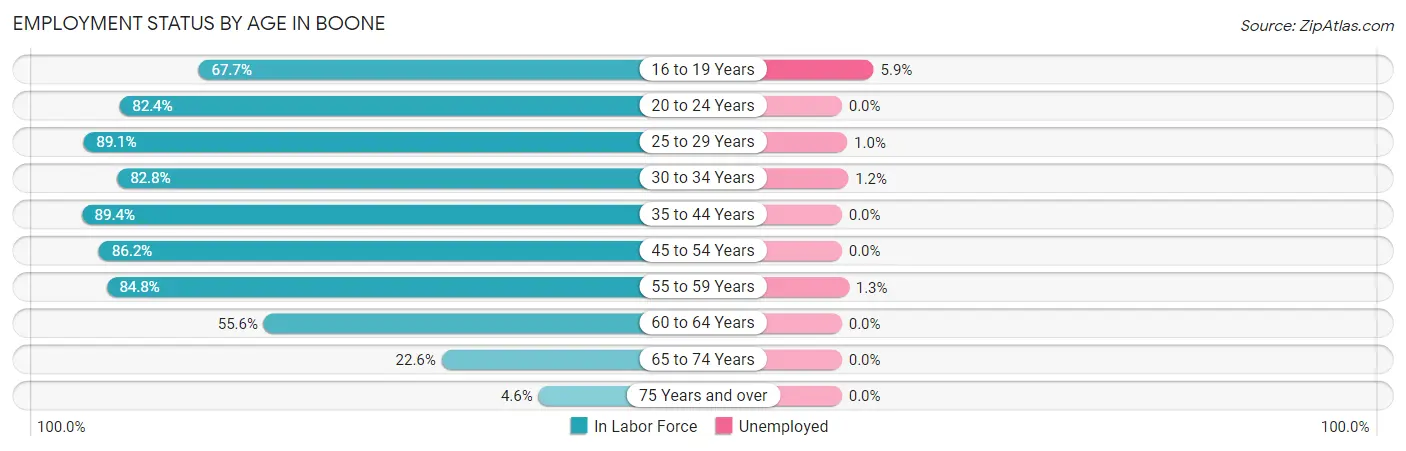
| Age Bracket | In Labor Force | Unemployed |
| 16 to 19 Years | 472 (67.7%) | 28 (5.9%) |
| 20 to 24 Years | 771 (82.4%) | 0 (0.0%) |
| 25 to 29 Years | 805 (89.1%) | 8 (1.0%) |
| 30 to 34 Years | 844 (82.8%) | 10 (1.2%) |
| 35 to 44 Years | 1,456 (89.4%) | 0 (0.0%) |
| 45 to 54 Years | 1,213 (86.2%) | 0 (0.0%) |
| 55 to 59 Years | 712 (84.8%) | 9 (1.3%) |
| 60 to 64 Years | 436 (55.6%) | 0 (0.0%) |
| 65 to 74 Years | 271 (22.6%) | 0 (0.0%) |
| 75 Years and over | 42 (4.6%) | 0 (0.0%) |
| Total | 7,017 (67.9%) | 56 (0.8%) |
Employment Status by Educational Attainment in Boone
According to labor force statistics for Boone, 83.0% of individuals (5,463) out of the total population between 25 and 64 years of age (6,582) are in the labor force, with 0.5% or 27 of them being unemployed. The group with the highest labor force participation rate are those with the educational attainment of bachelor's degree or higher, with 91.9% or 1,433 individuals in the labor force. Within the labor force, individuals with less than high school education have the highest percentage of unemployment, with 5.3% or 9 of them being unemployed.
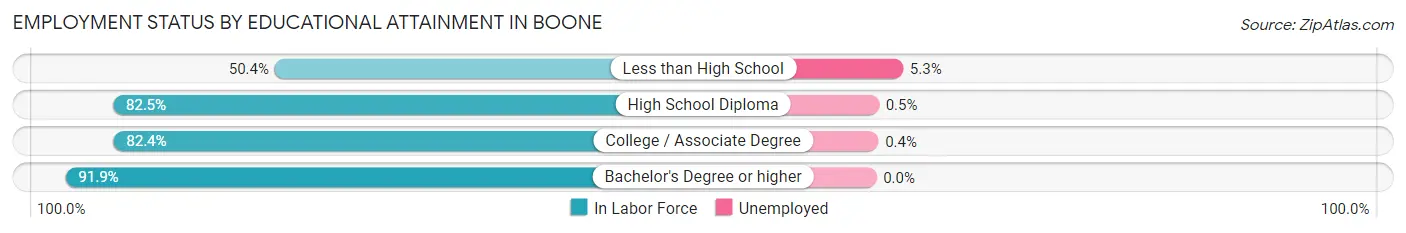
| Educational Attainment | In Labor Force | Unemployed |
| Less than High School | 169 (50.4%) | 18 (5.3%) |
| High School Diploma | 1,884 (82.5%) | 11 (0.5%) |
| College / Associate Degree | 1,981 (82.4%) | 10 (0.4%) |
| Bachelor's Degree or higher | 1,433 (91.9%) | 0 (0.0%) |
| Total | 5,463 (83.0%) | 33 (0.5%) |
Employment Occupations by Sex in Boone
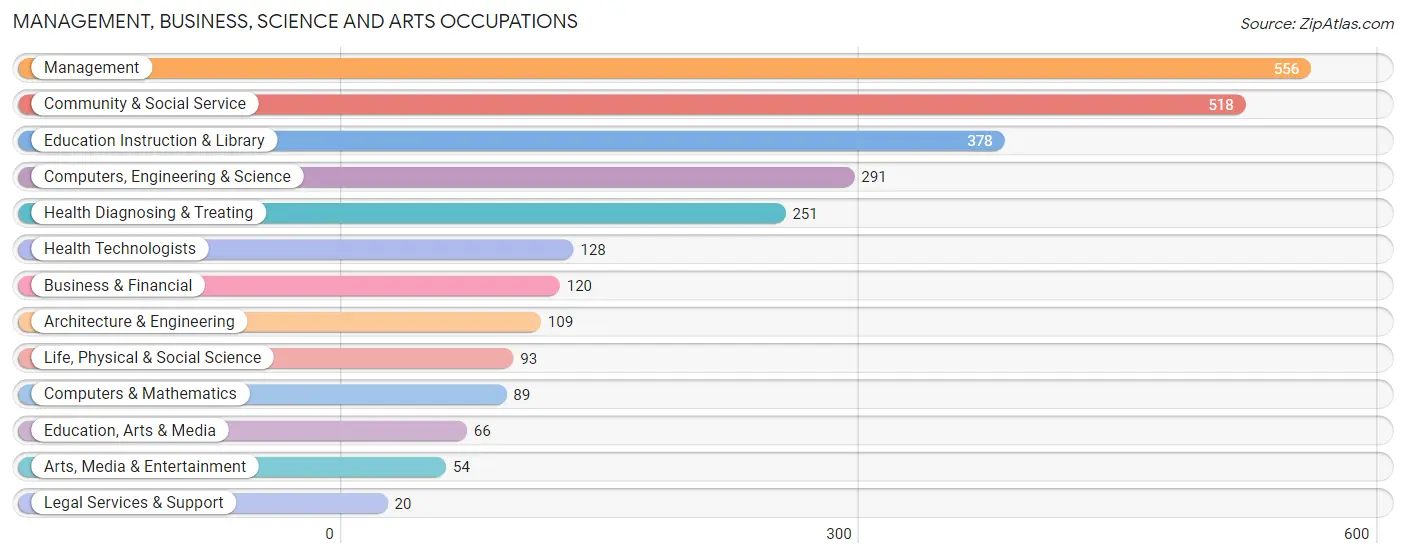
Management, Business, Science and Arts Occupations
The most common Management, Business, Science and Arts occupations in Boone are Management (556 | 8.0%), Community & Social Service (518 | 7.5%), Education Instruction & Library (378 | 5.4%), Computers, Engineering & Science (291 | 4.2%), and Health Diagnosing & Treating (251 | 3.6%).
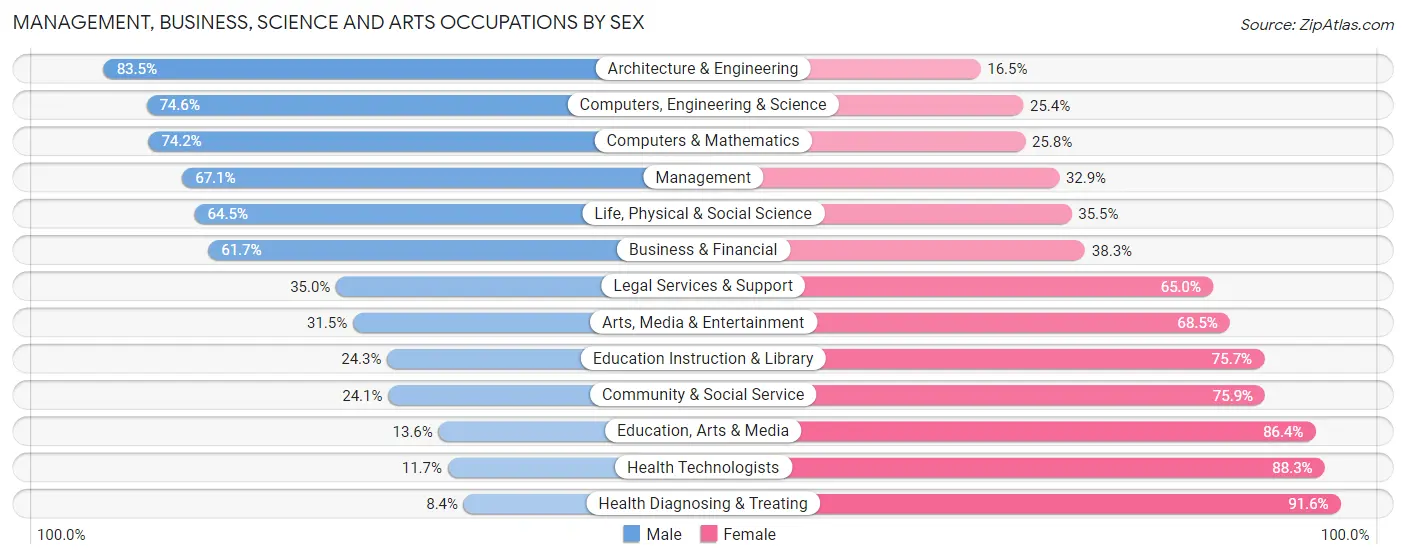
Management, Business, Science and Arts Occupations by Sex
Within the Management, Business, Science and Arts occupations in Boone, the most male-oriented occupations are Architecture & Engineering (83.5%), Computers, Engineering & Science (74.6%), and Computers & Mathematics (74.2%), while the most female-oriented occupations are Health Diagnosing & Treating (91.6%), Health Technologists (88.3%), and Education, Arts & Media (86.4%).
| Occupation | Male | Female |
| Management | 373 (67.1%) | 183 (32.9%) |
| Business & Financial | 74 (61.7%) | 46 (38.3%) |
| Computers, Engineering & Science | 217 (74.6%) | 74 (25.4%) |
| Computers & Mathematics | 66 (74.2%) | 23 (25.8%) |
| Architecture & Engineering | 91 (83.5%) | 18 (16.5%) |
| Life, Physical & Social Science | 60 (64.5%) | 33 (35.5%) |
| Community & Social Service | 125 (24.1%) | 393 (75.9%) |
| Education, Arts & Media | 9 (13.6%) | 57 (86.4%) |
| Legal Services & Support | 7 (35.0%) | 13 (65.0%) |
| Education Instruction & Library | 92 (24.3%) | 286 (75.7%) |
| Arts, Media & Entertainment | 17 (31.5%) | 37 (68.5%) |
| Health Diagnosing & Treating | 21 (8.4%) | 230 (91.6%) |
| Health Technologists | 15 (11.7%) | 113 (88.3%) |
| Total (Category) | 810 (46.7%) | 926 (53.3%) |
| Total (Overall) | 3,824 (55.1%) | 3,112 (44.9%) |
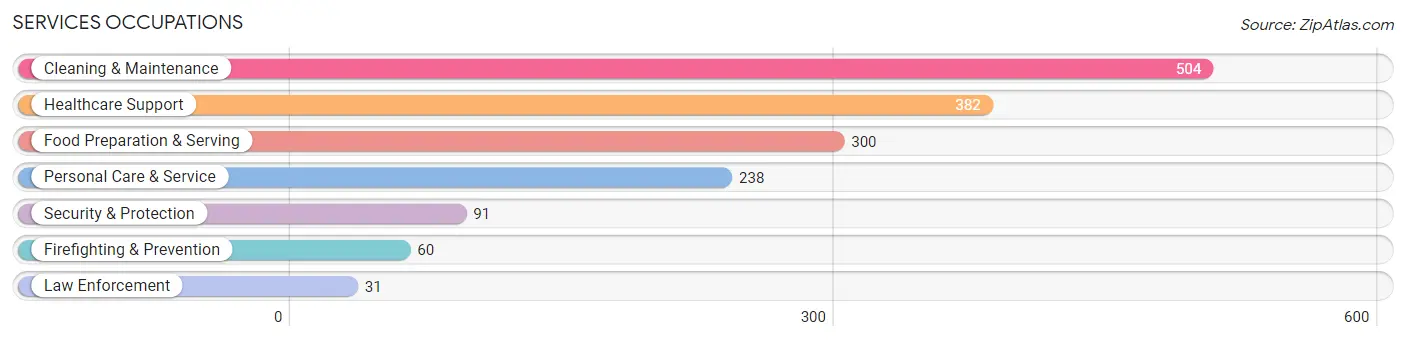
Services Occupations
The most common Services occupations in Boone are Cleaning & Maintenance (504 | 7.3%), Healthcare Support (382 | 5.5%), Food Preparation & Serving (300 | 4.3%), Personal Care & Service (238 | 3.4%), and Security & Protection (91 | 1.3%).
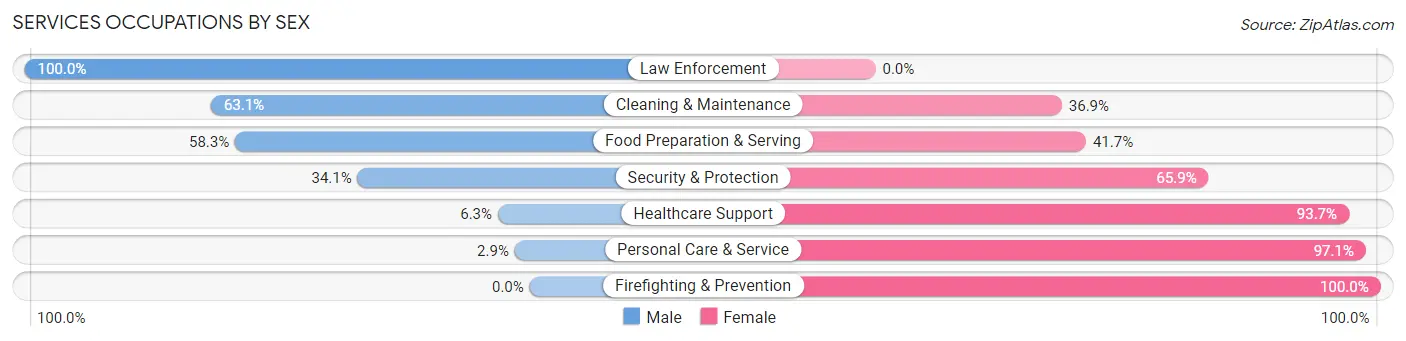
Services Occupations by Sex
Within the Services occupations in Boone, the most male-oriented occupations are Law Enforcement (100.0%), Cleaning & Maintenance (63.1%), and Food Preparation & Serving (58.3%), while the most female-oriented occupations are Firefighting & Prevention (100.0%), Personal Care & Service (97.1%), and Healthcare Support (93.7%).
| Occupation | Male | Female |
| Healthcare Support | 24 (6.3%) | 358 (93.7%) |
| Security & Protection | 31 (34.1%) | 60 (65.9%) |
| Firefighting & Prevention | 0 (0.0%) | 60 (100.0%) |
| Law Enforcement | 31 (100.0%) | 0 (0.0%) |
| Food Preparation & Serving | 175 (58.3%) | 125 (41.7%) |
| Cleaning & Maintenance | 318 (63.1%) | 186 (36.9%) |
| Personal Care & Service | 7 (2.9%) | 231 (97.1%) |
| Total (Category) | 555 (36.6%) | 960 (63.4%) |
| Total (Overall) | 3,824 (55.1%) | 3,112 (44.9%) |
Sales and Office Occupations
The most common Sales and Office occupations in Boone are Office & Administration (758 | 10.9%), and Sales & Related (525 | 7.6%).
Sales and Office Occupations by Sex
| Occupation | Male | Female |
| Sales & Related | 220 (41.9%) | 305 (58.1%) |
| Office & Administration | 269 (35.5%) | 489 (64.5%) |
| Total (Category) | 489 (38.1%) | 794 (61.9%) |
| Total (Overall) | 3,824 (55.1%) | 3,112 (44.9%) |
Natural Resources, Construction and Maintenance Occupations
The most common Natural Resources, Construction and Maintenance occupations in Boone are Installation, Maintenance & Repair (406 | 5.9%), Construction & Extraction (389 | 5.6%), and Farming, Fishing & Forestry (66 | 0.9%).
Natural Resources, Construction and Maintenance Occupations by Sex
| Occupation | Male | Female |
| Farming, Fishing & Forestry | 52 (78.8%) | 14 (21.2%) |
| Construction & Extraction | 374 (96.1%) | 15 (3.9%) |
| Installation, Maintenance & Repair | 406 (100.0%) | 0 (0.0%) |
| Total (Category) | 832 (96.6%) | 29 (3.4%) |
| Total (Overall) | 3,824 (55.1%) | 3,112 (44.9%) |
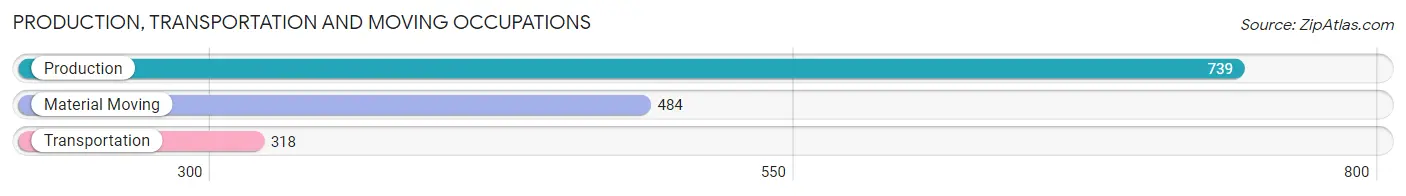
Production, Transportation and Moving Occupations
The most common Production, Transportation and Moving occupations in Boone are Production (739 | 10.6%), Material Moving (484 | 7.0%), and Transportation (318 | 4.6%).
Production, Transportation and Moving Occupations by Sex
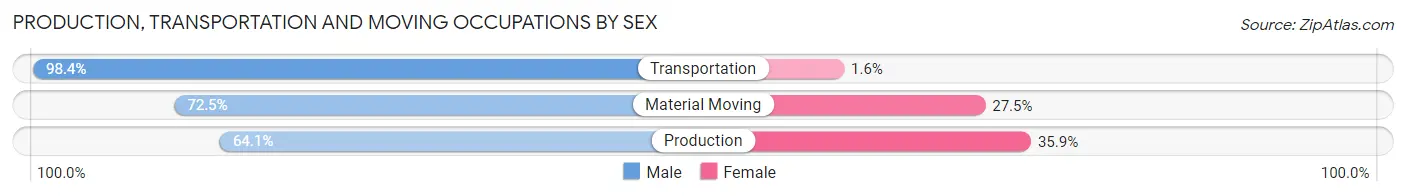
| Occupation | Male | Female |
| Production | 474 (64.1%) | 265 (35.9%) |
| Transportation | 313 (98.4%) | 5 (1.6%) |
| Material Moving | 351 (72.5%) | 133 (27.5%) |
| Total (Category) | 1,138 (73.9%) | 403 (26.2%) |
| Total (Overall) | 3,824 (55.1%) | 3,112 (44.9%) |
Employment Industries by Sex in Boone
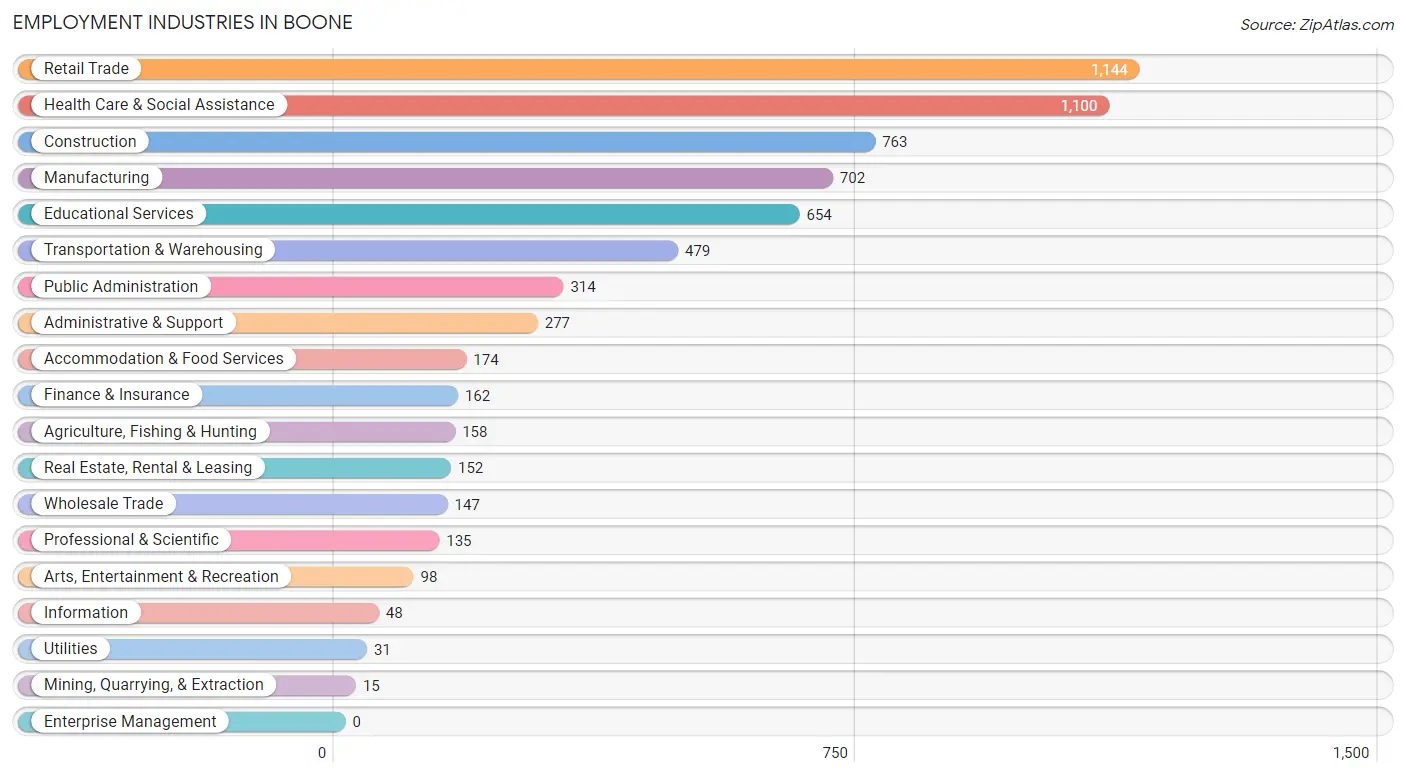
Employment Industries in Boone
The major employment industries in Boone include Retail Trade (1,144 | 16.5%), Health Care & Social Assistance (1,100 | 15.9%), Construction (763 | 11.0%), Manufacturing (702 | 10.1%), and Educational Services (654 | 9.4%).
Employment Industries by Sex in Boone
The Boone industries that see more men than women are Utilities (100.0%), Construction (95.4%), and Agriculture, Fishing & Hunting (91.1%), whereas the industries that tend to have a higher number of women are Mining, Quarrying, & Extraction (100.0%), Health Care & Social Assistance (83.1%), and Arts, Entertainment & Recreation (78.6%).
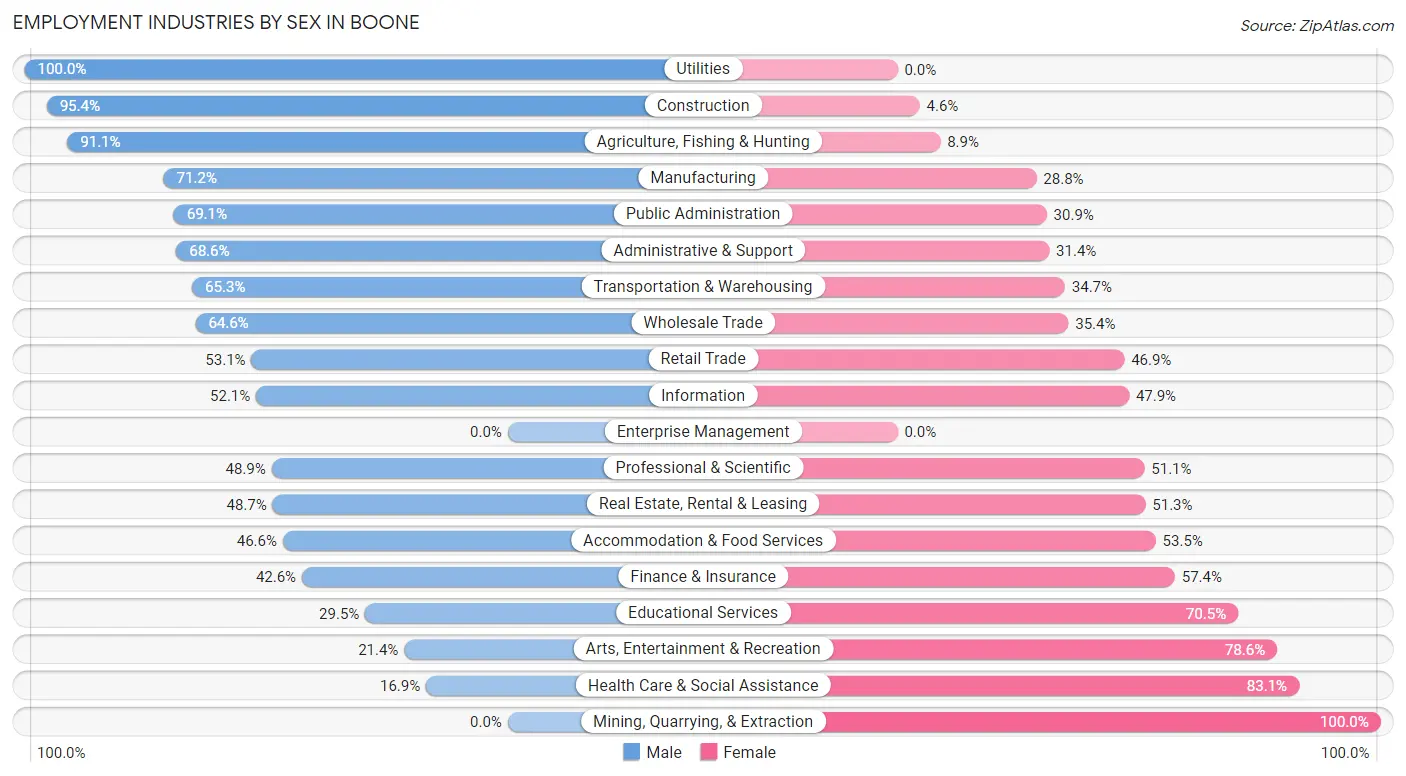
| Industry | Male | Female |
| Agriculture, Fishing & Hunting | 144 (91.1%) | 14 (8.9%) |
| Mining, Quarrying, & Extraction | 0 (0.0%) | 15 (100.0%) |
| Construction | 728 (95.4%) | 35 (4.6%) |
| Manufacturing | 500 (71.2%) | 202 (28.8%) |
| Wholesale Trade | 95 (64.6%) | 52 (35.4%) |
| Retail Trade | 607 (53.1%) | 537 (46.9%) |
| Transportation & Warehousing | 313 (65.3%) | 166 (34.7%) |
| Utilities | 31 (100.0%) | 0 (0.0%) |
| Information | 25 (52.1%) | 23 (47.9%) |
| Finance & Insurance | 69 (42.6%) | 93 (57.4%) |
| Real Estate, Rental & Leasing | 74 (48.7%) | 78 (51.3%) |
| Professional & Scientific | 66 (48.9%) | 69 (51.1%) |
| Enterprise Management | 0 (0.0%) | 0 (0.0%) |
| Administrative & Support | 190 (68.6%) | 87 (31.4%) |
| Educational Services | 193 (29.5%) | 461 (70.5%) |
| Health Care & Social Assistance | 186 (16.9%) | 914 (83.1%) |
| Arts, Entertainment & Recreation | 21 (21.4%) | 77 (78.6%) |
| Accommodation & Food Services | 81 (46.6%) | 93 (53.4%) |
| Public Administration | 217 (69.1%) | 97 (30.9%) |
| Total | 3,824 (55.1%) | 3,112 (44.9%) |
Education in Boone
School Enrollment in Boone
The most common levels of schooling among the 2,393 students in Boone are high school (615 | 25.7%), college / undergraduate (468 | 19.6%), and middle school (420 | 17.5%).
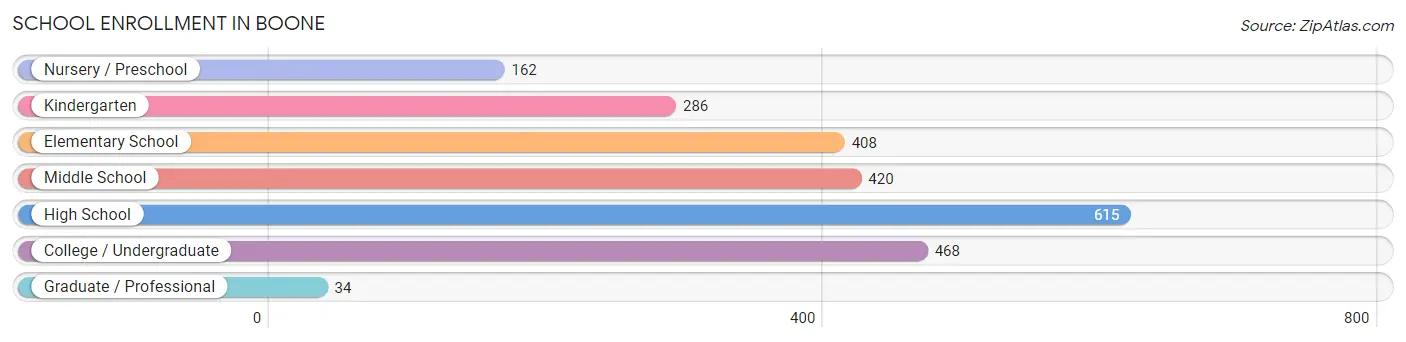
| School Level | # Students | % Students |
| Nursery / Preschool | 162 | 6.8% |
| Kindergarten | 286 | 11.9% |
| Elementary School | 408 | 17.1% |
| Middle School | 420 | 17.5% |
| High School | 615 | 25.7% |
| College / Undergraduate | 468 | 19.6% |
| Graduate / Professional | 34 | 1.4% |
| Total | 2,393 | 100.0% |
School Enrollment by Age by Funding Source in Boone
Out of a total of 2,393 students who are enrolled in schools in Boone, 371 (15.5%) attend a private institution, while the remaining 2,022 (84.5%) are enrolled in public schools. The age group of 3 to 4 year olds has the highest likelihood of being enrolled in private schools, with 68 (78.2% in the age bracket) enrolled. Conversely, the age group of 15 to 17 year olds has the lowest likelihood of being enrolled in a private school, with 427 (99.3% in the age bracket) attending a public institution.
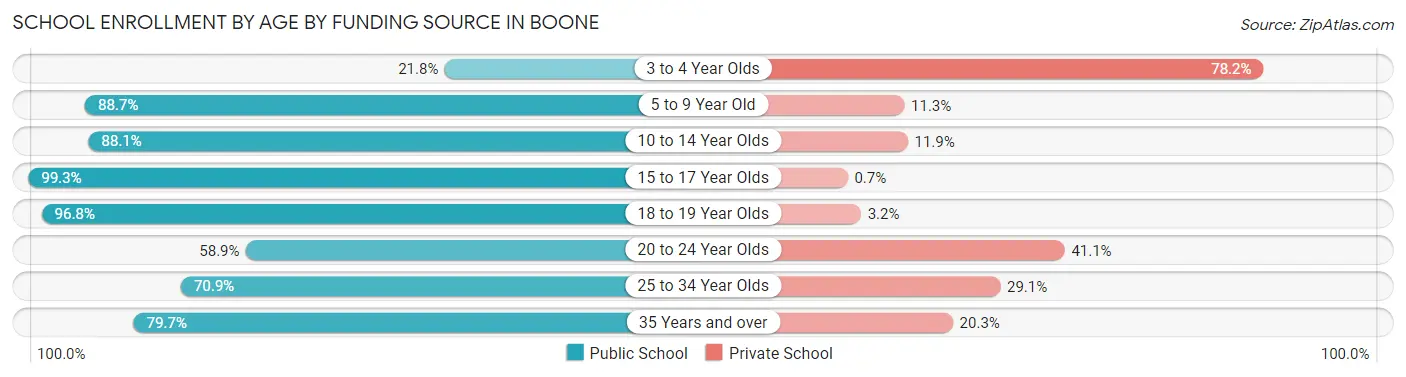
| Age Bracket | Public School | Private School |
| 3 to 4 Year Olds | 19 (21.8%) | 68 (78.2%) |
| 5 to 9 Year Old | 646 (88.7%) | 82 (11.3%) |
| 10 to 14 Year Olds | 504 (88.1%) | 68 (11.9%) |
| 15 to 17 Year Olds | 427 (99.3%) | 3 (0.7%) |
| 18 to 19 Year Olds | 122 (96.8%) | 4 (3.2%) |
| 20 to 24 Year Olds | 126 (58.9%) | 88 (41.1%) |
| 25 to 34 Year Olds | 73 (70.9%) | 30 (29.1%) |
| 35 Years and over | 106 (79.7%) | 27 (20.3%) |
| Total | 2,022 (84.5%) | 371 (15.5%) |
Educational Attainment by Field of Study in Boone
Business (453 | 21.4%), education (425 | 20.1%), science & technology (240 | 11.4%), arts & humanities (236 | 11.2%), and bio, nature & agricultural (151 | 7.1%) are the most common fields of study among 2,112 individuals in Boone who have obtained a bachelor's degree or higher.
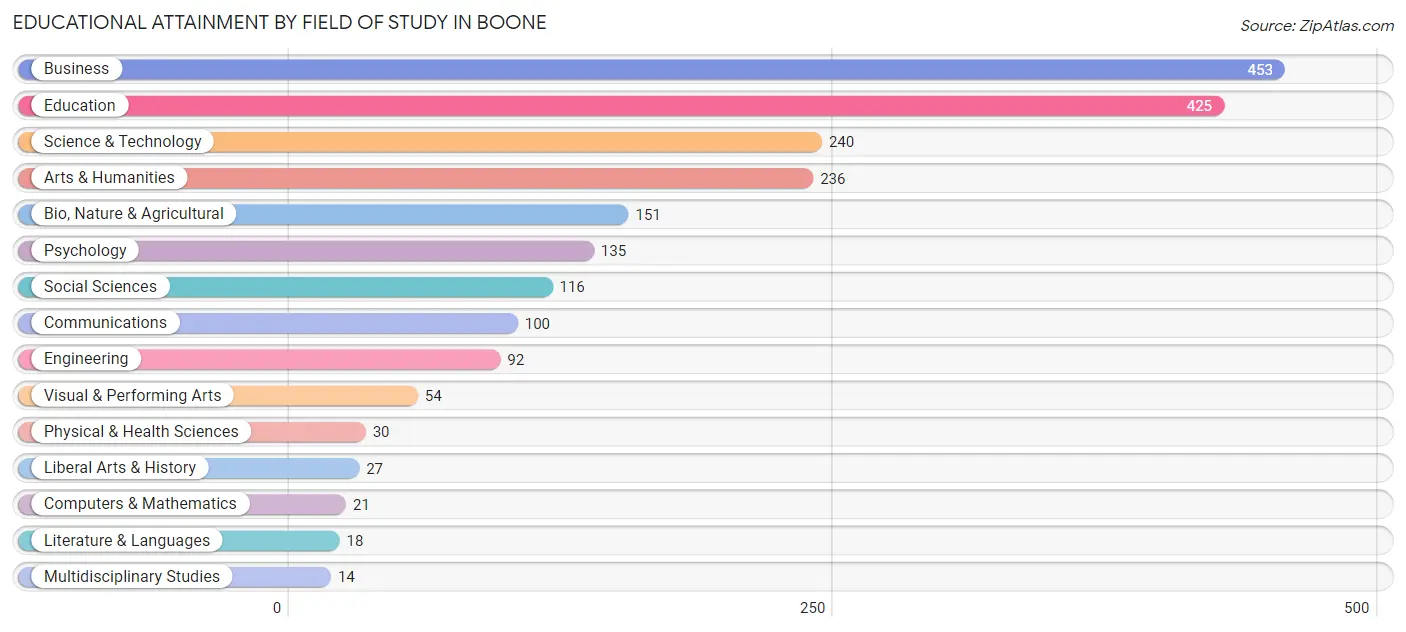
| Field of Study | # Graduates | % Graduates |
| Computers & Mathematics | 21 | 1.0% |
| Bio, Nature & Agricultural | 151 | 7.1% |
| Physical & Health Sciences | 30 | 1.4% |
| Psychology | 135 | 6.4% |
| Social Sciences | 116 | 5.5% |
| Engineering | 92 | 4.4% |
| Multidisciplinary Studies | 14 | 0.7% |
| Science & Technology | 240 | 11.4% |
| Business | 453 | 21.4% |
| Education | 425 | 20.1% |
| Literature & Languages | 18 | 0.9% |
| Liberal Arts & History | 27 | 1.3% |
| Visual & Performing Arts | 54 | 2.6% |
| Communications | 100 | 4.7% |
| Arts & Humanities | 236 | 11.2% |
| Total | 2,112 | 100.0% |
Transportation & Commute in Boone
Vehicle Availability by Sex in Boone
The most prevalent vehicle ownership categories in Boone are males with 2 vehicles (1,353, accounting for 36.0%) and females with 2 vehicles (1,182, making up 43.9%).
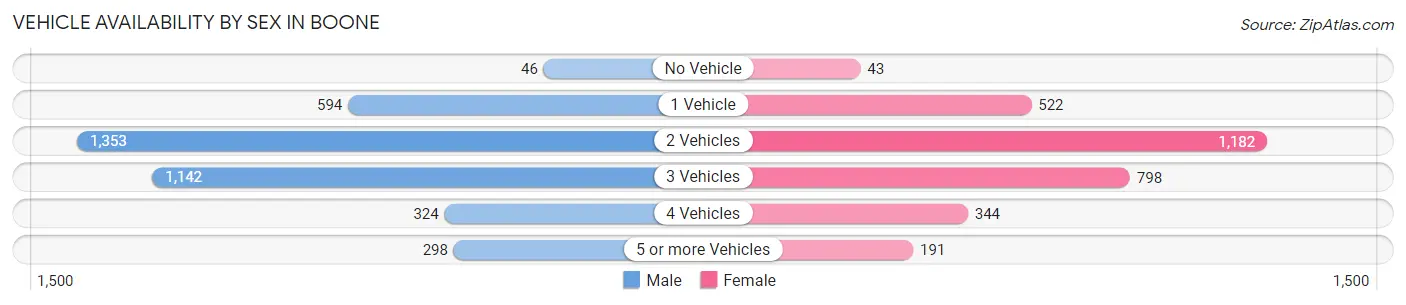
| Vehicles Available | Male | Female |
| No Vehicle | 46 (1.2%) | 43 (1.4%) |
| 1 Vehicle | 594 (15.8%) | 522 (17.0%) |
| 2 Vehicles | 1,353 (36.0%) | 1,182 (38.4%) |
| 3 Vehicles | 1,142 (30.4%) | 798 (25.9%) |
| 4 Vehicles | 324 (8.6%) | 344 (11.2%) |
| 5 or more Vehicles | 298 (7.9%) | 191 (6.2%) |
| Total | 3,757 (100.0%) | 3,080 (100.0%) |
Commute Time in Boone
The most frequently occuring commute durations in Boone are 5 to 9 minutes (1,651 commuters, 25.8%), 10 to 14 minutes (1,061 commuters, 16.6%), and 15 to 19 minutes (703 commuters, 11.0%).
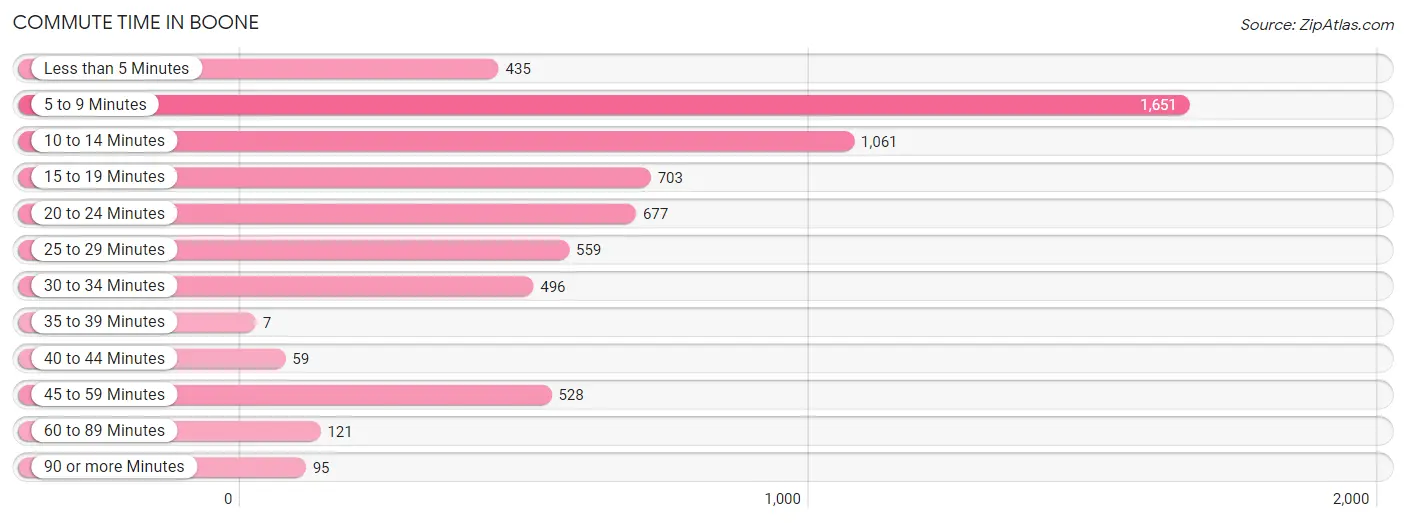
| Commute Time | # Commuters | % Commuters |
| Less than 5 Minutes | 435 | 6.8% |
| 5 to 9 Minutes | 1,651 | 25.8% |
| 10 to 14 Minutes | 1,061 | 16.6% |
| 15 to 19 Minutes | 703 | 11.0% |
| 20 to 24 Minutes | 677 | 10.6% |
| 25 to 29 Minutes | 559 | 8.7% |
| 30 to 34 Minutes | 496 | 7.8% |
| 35 to 39 Minutes | 7 | 0.1% |
| 40 to 44 Minutes | 59 | 0.9% |
| 45 to 59 Minutes | 528 | 8.3% |
| 60 to 89 Minutes | 121 | 1.9% |
| 90 or more Minutes | 95 | 1.5% |
Commute Time by Sex in Boone
The most common commute times in Boone are 5 to 9 minutes (1,010 commuters, 28.5%) for males and 5 to 9 minutes (641 commuters, 22.5%) for females.
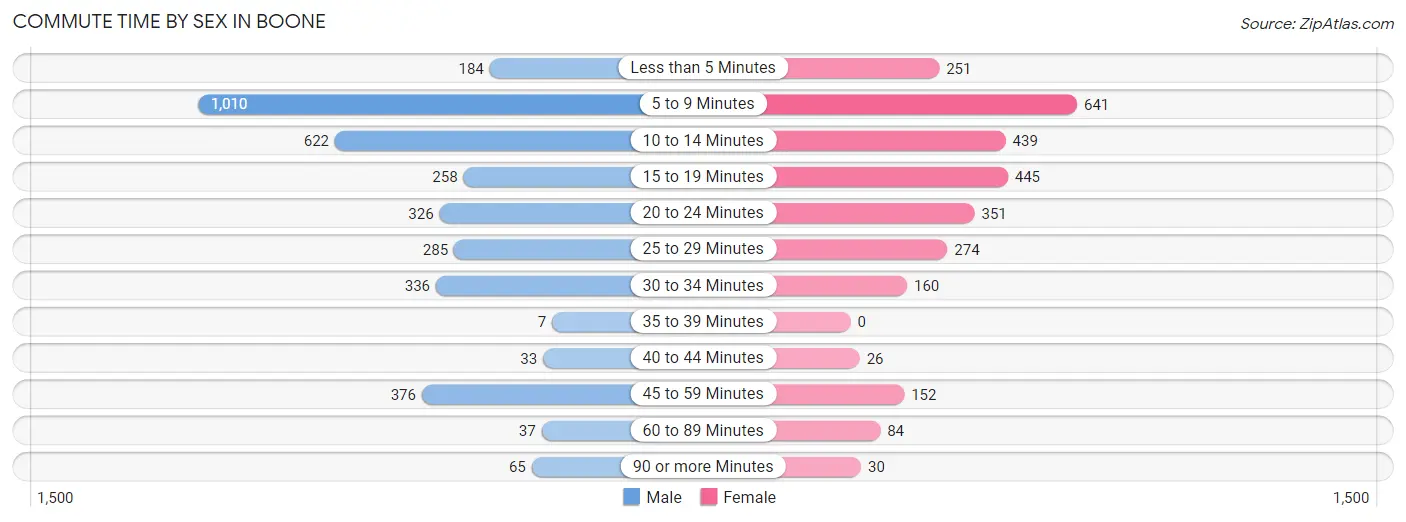
| Commute Time | Male | Female |
| Less than 5 Minutes | 184 (5.2%) | 251 (8.8%) |
| 5 to 9 Minutes | 1,010 (28.5%) | 641 (22.5%) |
| 10 to 14 Minutes | 622 (17.6%) | 439 (15.4%) |
| 15 to 19 Minutes | 258 (7.3%) | 445 (15.6%) |
| 20 to 24 Minutes | 326 (9.2%) | 351 (12.3%) |
| 25 to 29 Minutes | 285 (8.1%) | 274 (9.6%) |
| 30 to 34 Minutes | 336 (9.5%) | 160 (5.6%) |
| 35 to 39 Minutes | 7 (0.2%) | 0 (0.0%) |
| 40 to 44 Minutes | 33 (0.9%) | 26 (0.9%) |
| 45 to 59 Minutes | 376 (10.6%) | 152 (5.3%) |
| 60 to 89 Minutes | 37 (1.1%) | 84 (2.9%) |
| 90 or more Minutes | 65 (1.8%) | 30 (1.1%) |
Time of Departure to Work by Sex in Boone
The most frequent times of departure to work in Boone are 5:30 AM to 5:59 AM (486, 13.7%) for males and 7:30 AM to 7:59 AM (554, 19.4%) for females.
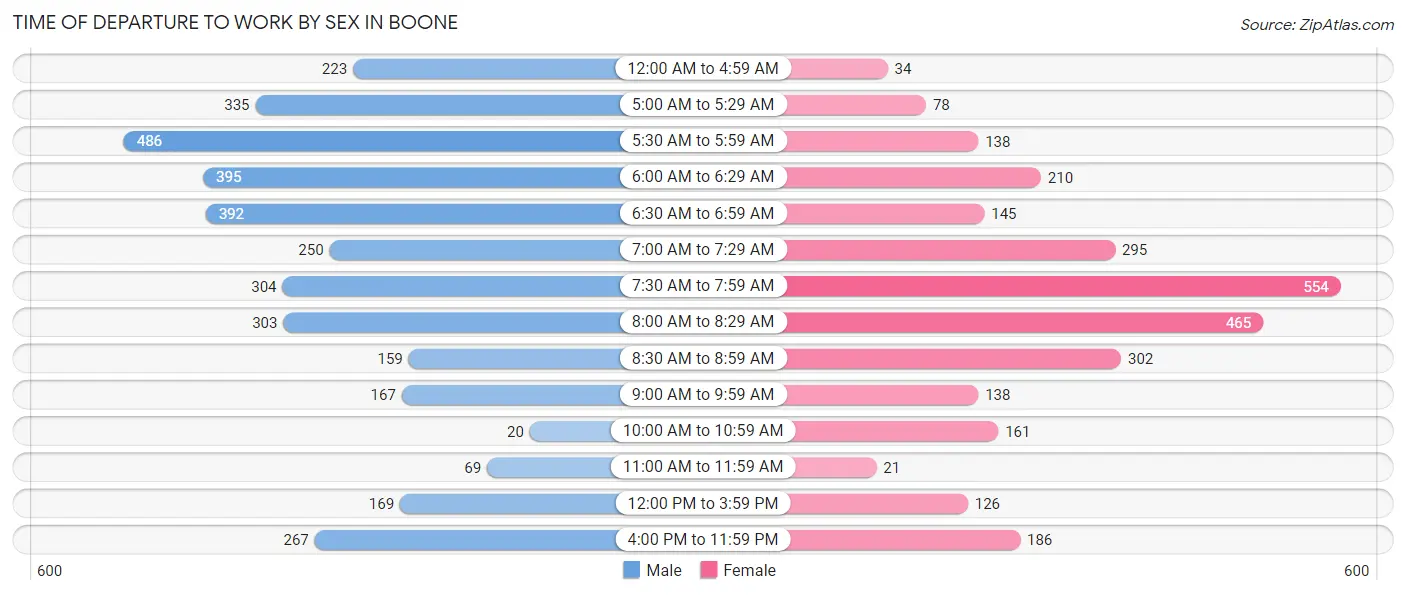
| Time of Departure | Male | Female |
| 12:00 AM to 4:59 AM | 223 (6.3%) | 34 (1.2%) |
| 5:00 AM to 5:29 AM | 335 (9.5%) | 78 (2.7%) |
| 5:30 AM to 5:59 AM | 486 (13.7%) | 138 (4.8%) |
| 6:00 AM to 6:29 AM | 395 (11.2%) | 210 (7.4%) |
| 6:30 AM to 6:59 AM | 392 (11.1%) | 145 (5.1%) |
| 7:00 AM to 7:29 AM | 250 (7.1%) | 295 (10.3%) |
| 7:30 AM to 7:59 AM | 304 (8.6%) | 554 (19.4%) |
| 8:00 AM to 8:29 AM | 303 (8.6%) | 465 (16.3%) |
| 8:30 AM to 8:59 AM | 159 (4.5%) | 302 (10.6%) |
| 9:00 AM to 9:59 AM | 167 (4.7%) | 138 (4.8%) |
| 10:00 AM to 10:59 AM | 20 (0.6%) | 161 (5.6%) |
| 11:00 AM to 11:59 AM | 69 (1.9%) | 21 (0.7%) |
| 12:00 PM to 3:59 PM | 169 (4.8%) | 126 (4.4%) |
| 4:00 PM to 11:59 PM | 267 (7.5%) | 186 (6.5%) |
| Total | 3,539 (100.0%) | 2,853 (100.0%) |
Housing Occupancy in Boone
Occupancy by Ownership in Boone
Of the total 5,135 dwellings in Boone, owner-occupied units account for 3,727 (72.6%), while renter-occupied units make up 1,408 (27.4%).
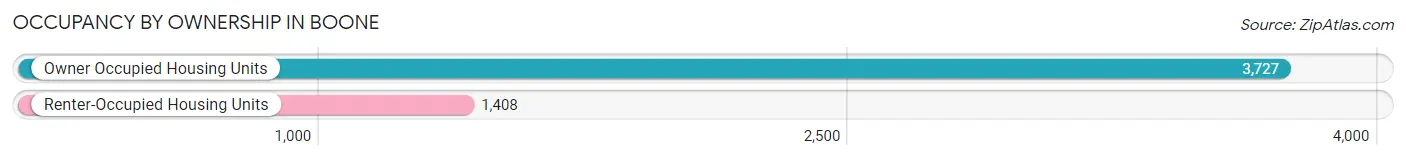
| Occupancy | # Housing Units | % Housing Units |
| Owner Occupied Housing Units | 3,727 | 72.6% |
| Renter-Occupied Housing Units | 1,408 | 27.4% |
| Total Occupied Housing Units | 5,135 | 100.0% |
Occupancy by Household Size in Boone
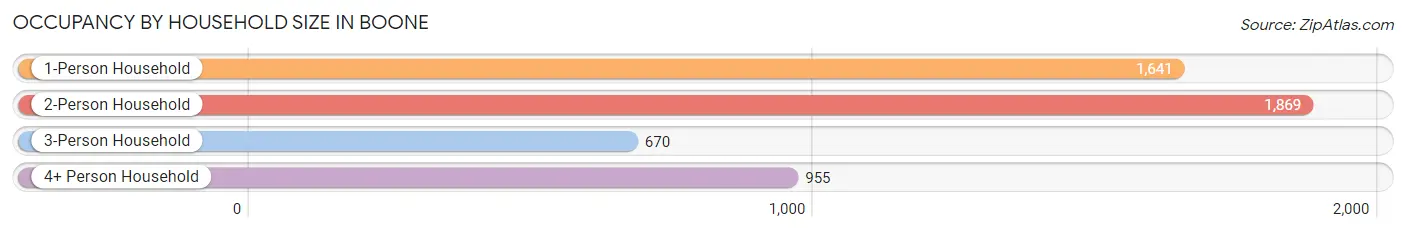
| Household Size | # Housing Units | % Housing Units |
| 1-Person Household | 1,641 | 32.0% |
| 2-Person Household | 1,869 | 36.4% |
| 3-Person Household | 670 | 13.1% |
| 4+ Person Household | 955 | 18.6% |
| Total Housing Units | 5,135 | 100.0% |
Occupancy by Ownership by Household Size in Boone
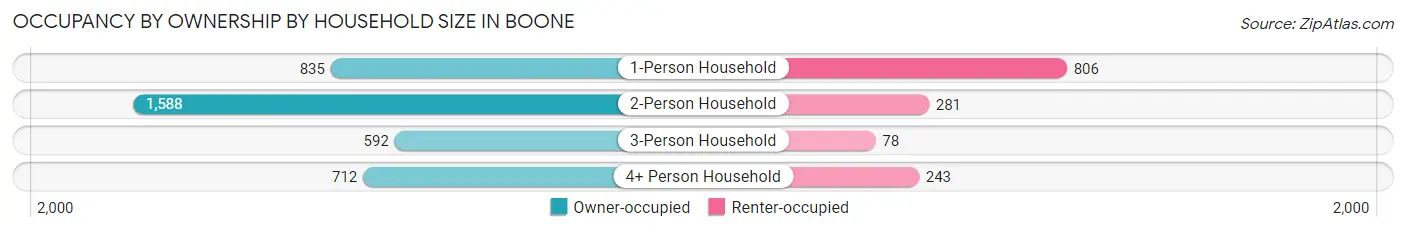
| Household Size | Owner-occupied | Renter-occupied |
| 1-Person Household | 835 (50.9%) | 806 (49.1%) |
| 2-Person Household | 1,588 (85.0%) | 281 (15.0%) |
| 3-Person Household | 592 (88.4%) | 78 (11.6%) |
| 4+ Person Household | 712 (74.6%) | 243 (25.5%) |
| Total Housing Units | 3,727 (72.6%) | 1,408 (27.4%) |
Occupancy by Educational Attainment in Boone
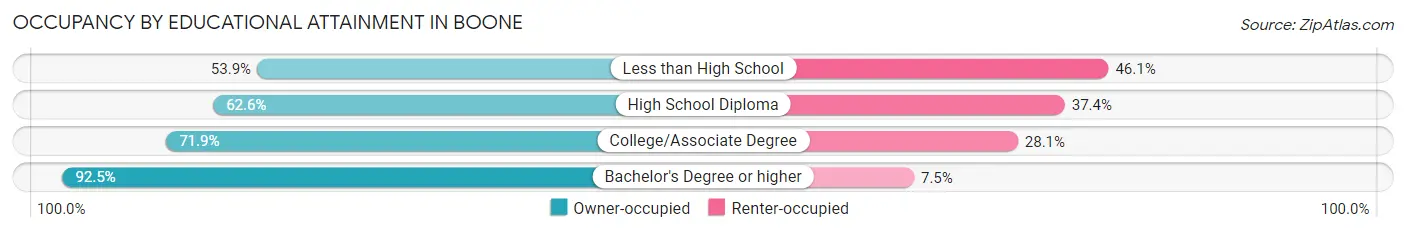
| Household Size | Owner-occupied | Renter-occupied |
| Less than High School | 137 (53.9%) | 117 (46.1%) |
| High School Diploma | 1,120 (62.6%) | 669 (37.4%) |
| College/Associate Degree | 1,362 (71.9%) | 532 (28.1%) |
| Bachelor's Degree or higher | 1,108 (92.5%) | 90 (7.5%) |
Occupancy by Age of Householder in Boone
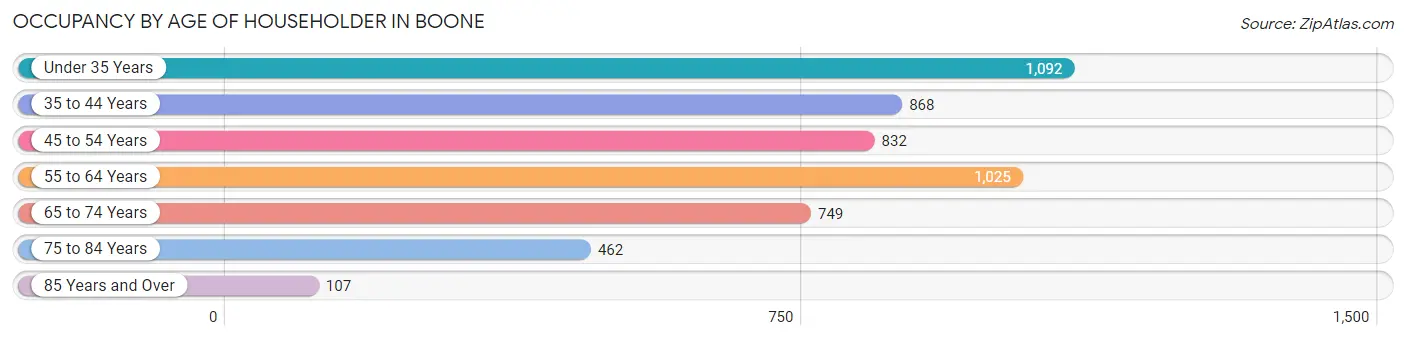
| Age Bracket | # Households | % Households |
| Under 35 Years | 1,092 | 21.3% |
| 35 to 44 Years | 868 | 16.9% |
| 45 to 54 Years | 832 | 16.2% |
| 55 to 64 Years | 1,025 | 20.0% |
| 65 to 74 Years | 749 | 14.6% |
| 75 to 84 Years | 462 | 9.0% |
| 85 Years and Over | 107 | 2.1% |
| Total | 5,135 | 100.0% |
Housing Finances in Boone
Median Income by Occupancy in Boone
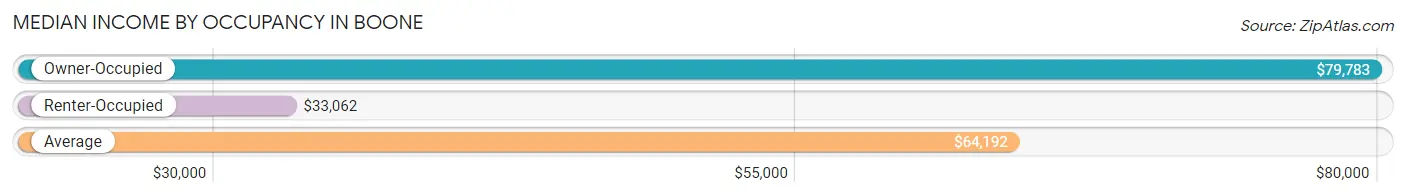
| Occupancy Type | # Households | Median Income |
| Owner-Occupied | 3,727 (72.6%) | $79,783 |
| Renter-Occupied | 1,408 (27.4%) | $33,062 |
| Average | 5,135 (100.0%) | $64,192 |
Occupancy by Householder Income Bracket in Boone
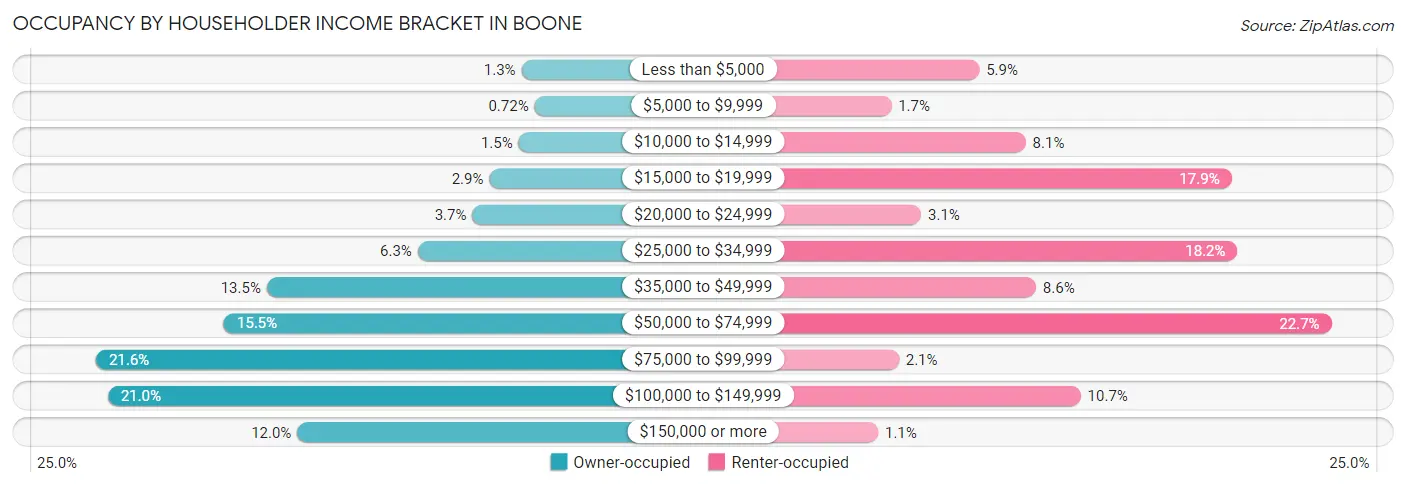
| Income Bracket | Owner-occupied | Renter-occupied |
| Less than $5,000 | 50 (1.3%) | 83 (5.9%) |
| $5,000 to $9,999 | 27 (0.7%) | 24 (1.7%) |
| $10,000 to $14,999 | 55 (1.5%) | 114 (8.1%) |
| $15,000 to $19,999 | 107 (2.9%) | 252 (17.9%) |
| $20,000 to $24,999 | 137 (3.7%) | 44 (3.1%) |
| $25,000 to $34,999 | 234 (6.3%) | 256 (18.2%) |
| $35,000 to $49,999 | 502 (13.5%) | 121 (8.6%) |
| $50,000 to $74,999 | 578 (15.5%) | 319 (22.7%) |
| $75,000 to $99,999 | 805 (21.6%) | 29 (2.1%) |
| $100,000 to $149,999 | 784 (21.0%) | 151 (10.7%) |
| $150,000 or more | 448 (12.0%) | 15 (1.1%) |
| Total | 3,727 (100.0%) | 1,408 (100.0%) |
Monthly Housing Cost Tiers in Boone
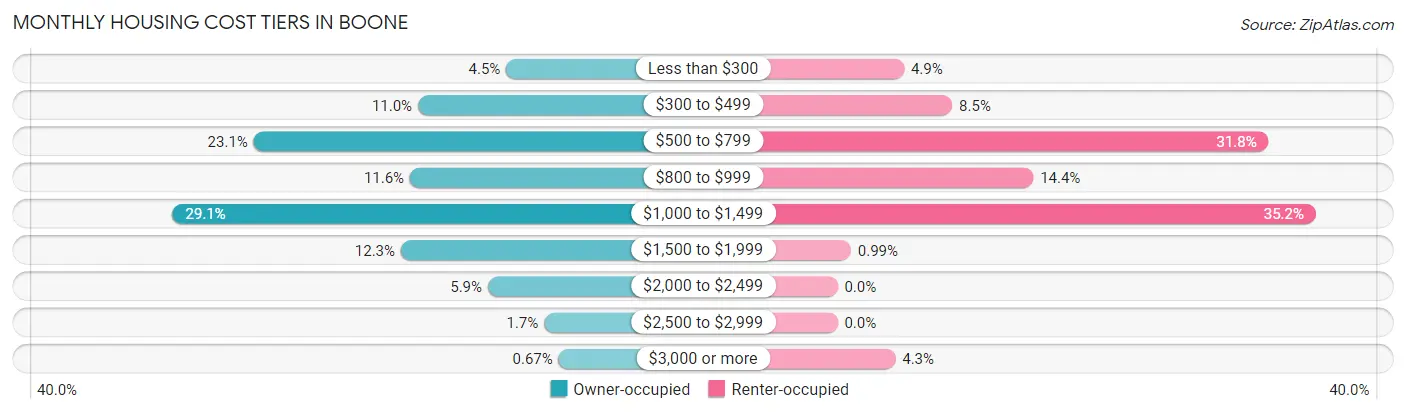
| Monthly Cost | Owner-occupied | Renter-occupied |
| Less than $300 | 169 (4.5%) | 69 (4.9%) |
| $300 to $499 | 411 (11.0%) | 119 (8.5%) |
| $500 to $799 | 862 (23.1%) | 447 (31.8%) |
| $800 to $999 | 433 (11.6%) | 203 (14.4%) |
| $1,000 to $1,499 | 1,085 (29.1%) | 496 (35.2%) |
| $1,500 to $1,999 | 458 (12.3%) | 14 (1.0%) |
| $2,000 to $2,499 | 219 (5.9%) | 0 (0.0%) |
| $2,500 to $2,999 | 65 (1.7%) | 0 (0.0%) |
| $3,000 or more | 25 (0.7%) | 60 (4.3%) |
| Total | 3,727 (100.0%) | 1,408 (100.0%) |
Physical Housing Characteristics in Boone
Housing Structures in Boone
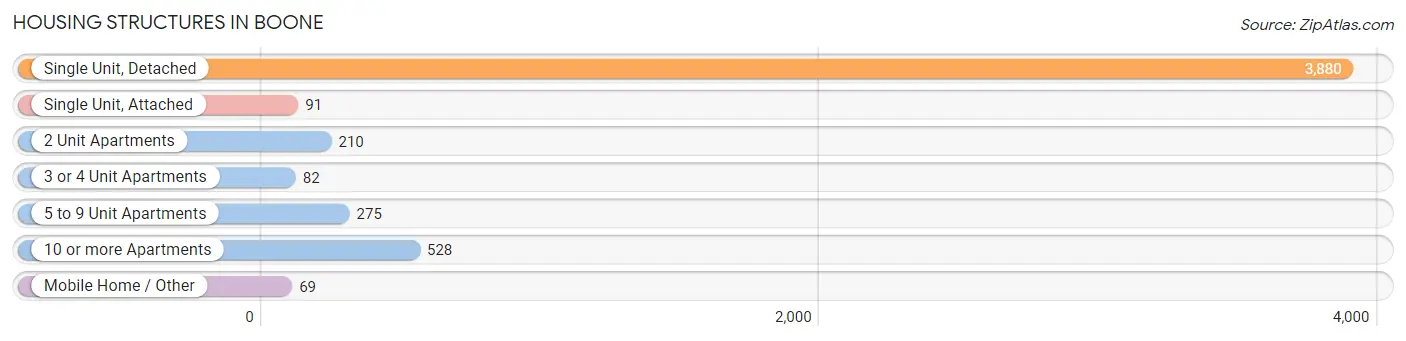
| Structure Type | # Housing Units | % Housing Units |
| Single Unit, Detached | 3,880 | 75.6% |
| Single Unit, Attached | 91 | 1.8% |
| 2 Unit Apartments | 210 | 4.1% |
| 3 or 4 Unit Apartments | 82 | 1.6% |
| 5 to 9 Unit Apartments | 275 | 5.4% |
| 10 or more Apartments | 528 | 10.3% |
| Mobile Home / Other | 69 | 1.3% |
| Total | 5,135 | 100.0% |
Housing Structures by Occupancy in Boone
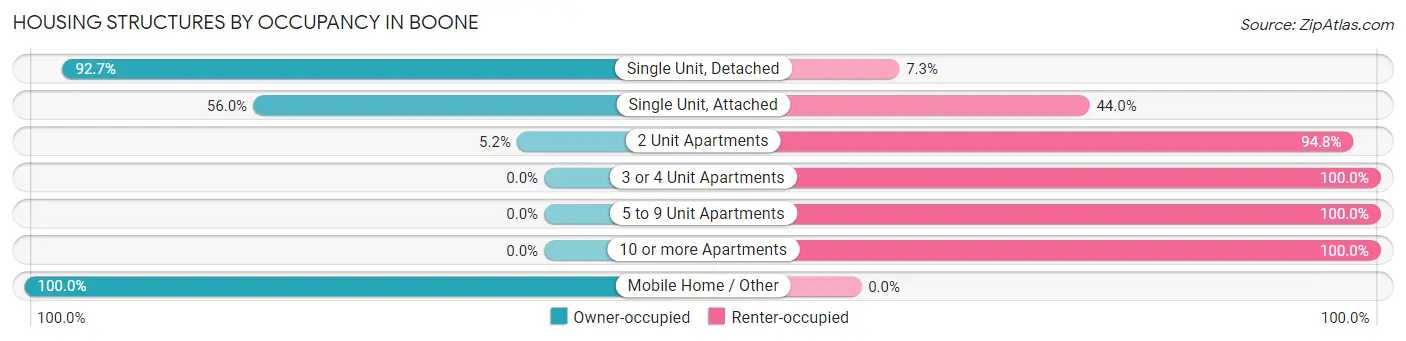
| Structure Type | Owner-occupied | Renter-occupied |
| Single Unit, Detached | 3,596 (92.7%) | 284 (7.3%) |
| Single Unit, Attached | 51 (56.0%) | 40 (44.0%) |
| 2 Unit Apartments | 11 (5.2%) | 199 (94.8%) |
| 3 or 4 Unit Apartments | 0 (0.0%) | 82 (100.0%) |
| 5 to 9 Unit Apartments | 0 (0.0%) | 275 (100.0%) |
| 10 or more Apartments | 0 (0.0%) | 528 (100.0%) |
| Mobile Home / Other | 69 (100.0%) | 0 (0.0%) |
| Total | 3,727 (72.6%) | 1,408 (27.4%) |
Housing Structures by Number of Rooms in Boone
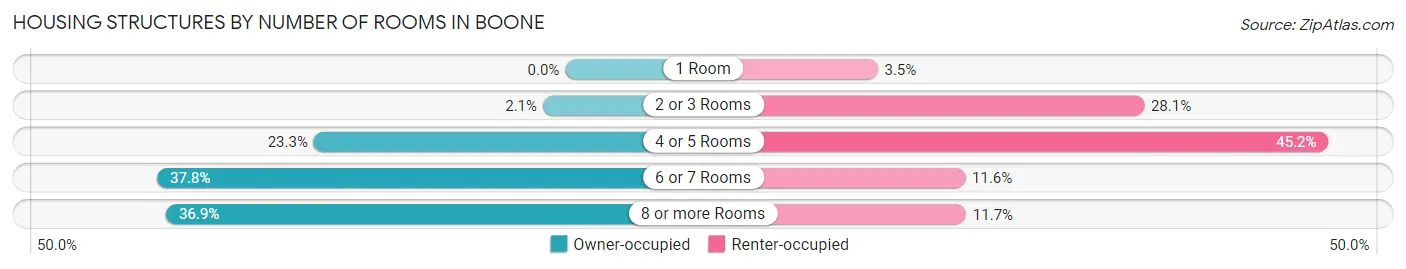
| Number of Rooms | Owner-occupied | Renter-occupied |
| 1 Room | 0 (0.0%) | 49 (3.5%) |
| 2 or 3 Rooms | 77 (2.1%) | 396 (28.1%) |
| 4 or 5 Rooms | 867 (23.3%) | 636 (45.2%) |
| 6 or 7 Rooms | 1,407 (37.8%) | 163 (11.6%) |
| 8 or more Rooms | 1,376 (36.9%) | 164 (11.7%) |
| Total | 3,727 (100.0%) | 1,408 (100.0%) |
Housing Structure by Heating Type in Boone
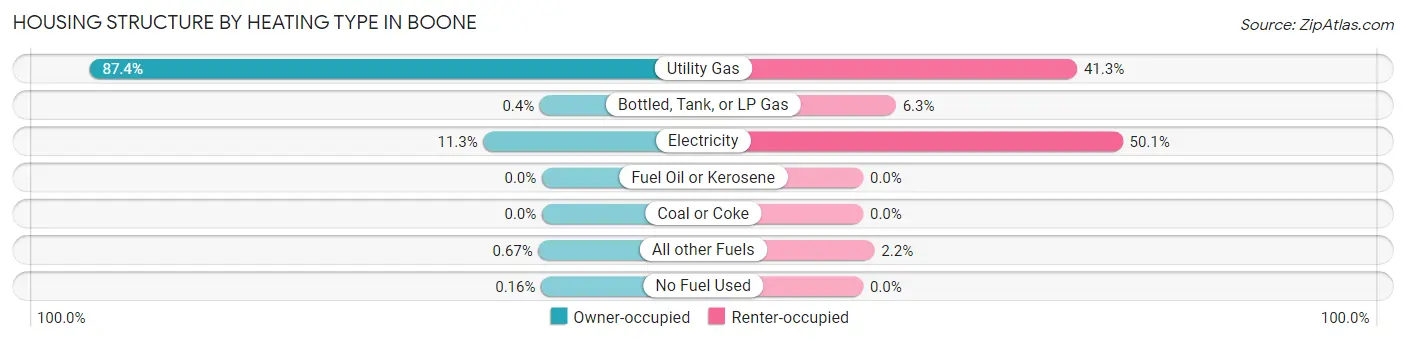
| Heating Type | Owner-occupied | Renter-occupied |
| Utility Gas | 3,259 (87.4%) | 582 (41.3%) |
| Bottled, Tank, or LP Gas | 15 (0.4%) | 89 (6.3%) |
| Electricity | 422 (11.3%) | 706 (50.1%) |
| Fuel Oil or Kerosene | 0 (0.0%) | 0 (0.0%) |
| Coal or Coke | 0 (0.0%) | 0 (0.0%) |
| All other Fuels | 25 (0.7%) | 31 (2.2%) |
| No Fuel Used | 6 (0.2%) | 0 (0.0%) |
| Total | 3,727 (100.0%) | 1,408 (100.0%) |
Household Vehicle Usage in Boone
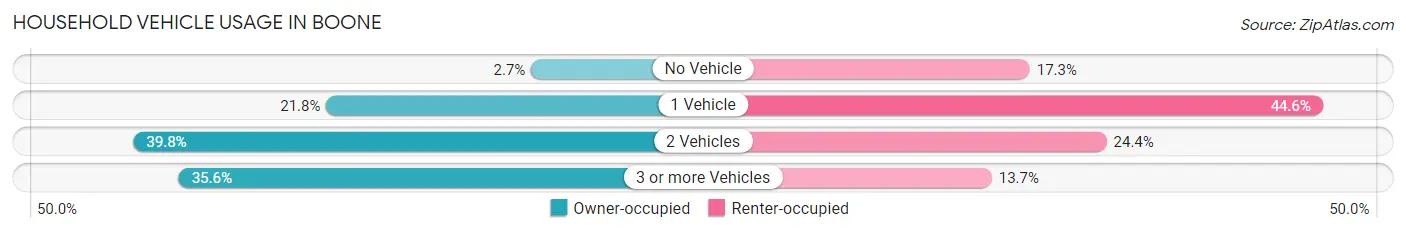
| Vehicles per Household | Owner-occupied | Renter-occupied |
| No Vehicle | 101 (2.7%) | 243 (17.3%) |
| 1 Vehicle | 814 (21.8%) | 628 (44.6%) |
| 2 Vehicles | 1,485 (39.8%) | 344 (24.4%) |
| 3 or more Vehicles | 1,327 (35.6%) | 193 (13.7%) |
| Total | 3,727 (100.0%) | 1,408 (100.0%) |
Real Estate & Mortgages in Boone
Real Estate and Mortgage Overview in Boone
| Characteristic | Without Mortgage | With Mortgage |
| Housing Units | 1,269 | 2,458 |
| Median Property Value | $135,500 | $144,700 |
| Median Household Income | $61,875 | $310 |
| Monthly Housing Costs | $540 | $25 |
| Real Estate Taxes | $2,523 | $93 |
Property Value by Mortgage Status in Boone
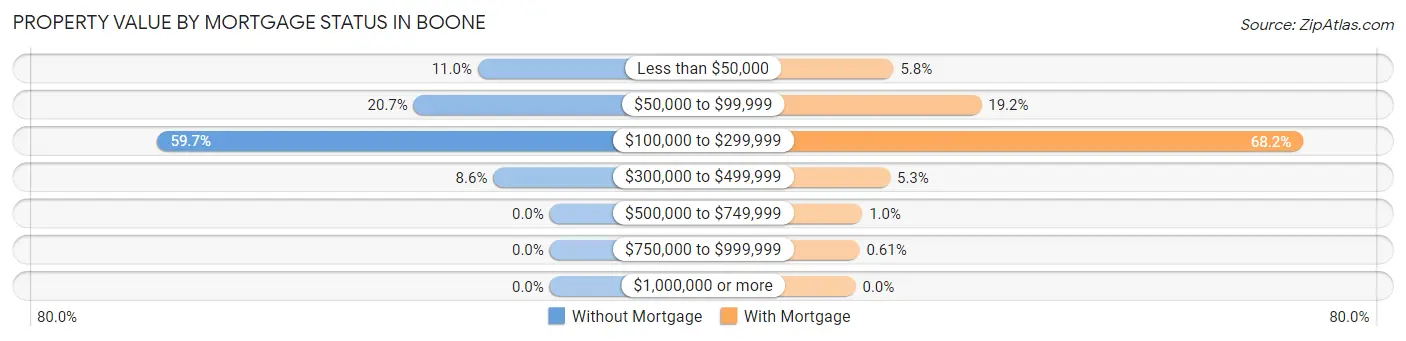
| Property Value | Without Mortgage | With Mortgage |
| Less than $50,000 | 139 (11.0%) | 142 (5.8%) |
| $50,000 to $99,999 | 263 (20.7%) | 471 (19.2%) |
| $100,000 to $299,999 | 758 (59.7%) | 1,676 (68.2%) |
| $300,000 to $499,999 | 109 (8.6%) | 129 (5.2%) |
| $500,000 to $749,999 | 0 (0.0%) | 25 (1.0%) |
| $750,000 to $999,999 | 0 (0.0%) | 15 (0.6%) |
| $1,000,000 or more | 0 (0.0%) | 0 (0.0%) |
| Total | 1,269 (100.0%) | 2,458 (100.0%) |
Household Income by Mortgage Status in Boone
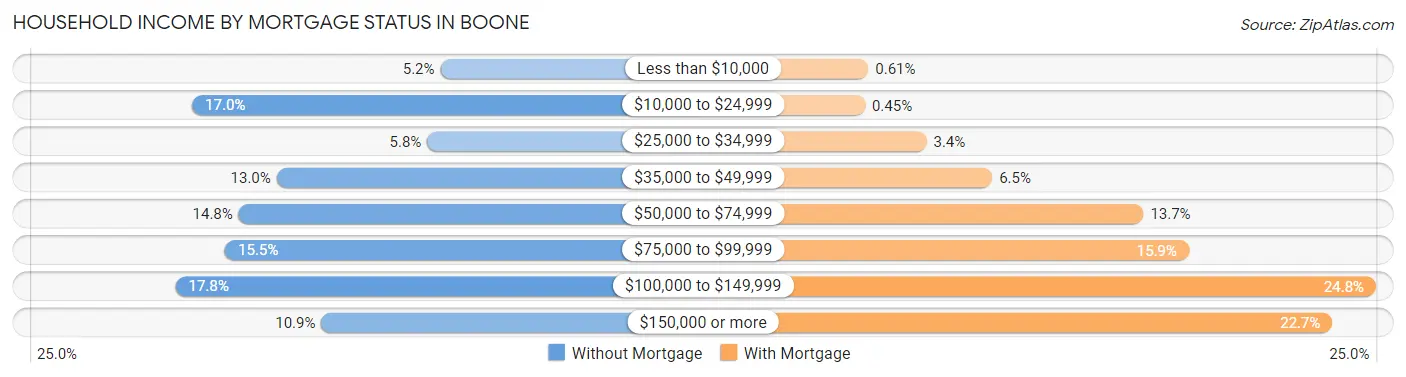
| Household Income | Without Mortgage | With Mortgage |
| Less than $10,000 | 66 (5.2%) | 15 (0.6%) |
| $10,000 to $24,999 | 216 (17.0%) | 11 (0.4%) |
| $25,000 to $34,999 | 74 (5.8%) | 83 (3.4%) |
| $35,000 to $49,999 | 165 (13.0%) | 160 (6.5%) |
| $50,000 to $74,999 | 188 (14.8%) | 337 (13.7%) |
| $75,000 to $99,999 | 196 (15.4%) | 390 (15.9%) |
| $100,000 to $149,999 | 226 (17.8%) | 609 (24.8%) |
| $150,000 or more | 138 (10.9%) | 558 (22.7%) |
| Total | 1,269 (100.0%) | 2,458 (100.0%) |
Property Value to Household Income Ratio in Boone
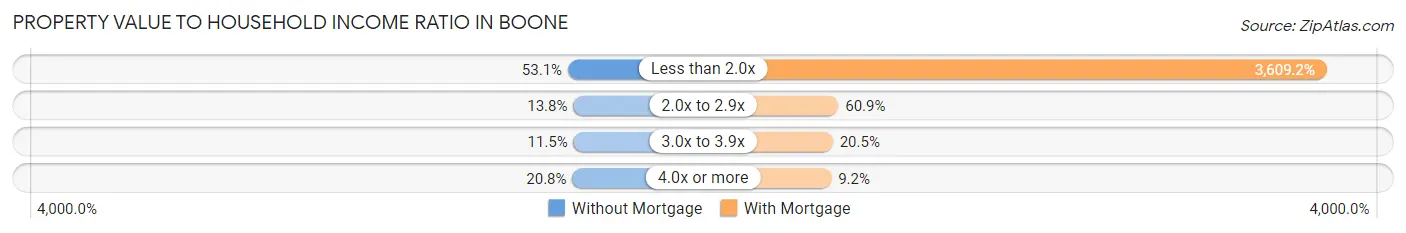
| Value-to-Income Ratio | Without Mortgage | With Mortgage |
| Less than 2.0x | 674 (53.1%) | 88,714 (3,609.2%) |
| 2.0x to 2.9x | 175 (13.8%) | 1,498 (60.9%) |
| 3.0x to 3.9x | 146 (11.5%) | 503 (20.5%) |
| 4.0x or more | 264 (20.8%) | 226 (9.2%) |
| Total | 1,269 (100.0%) | 2,458 (100.0%) |
Real Estate Taxes by Mortgage Status in Boone
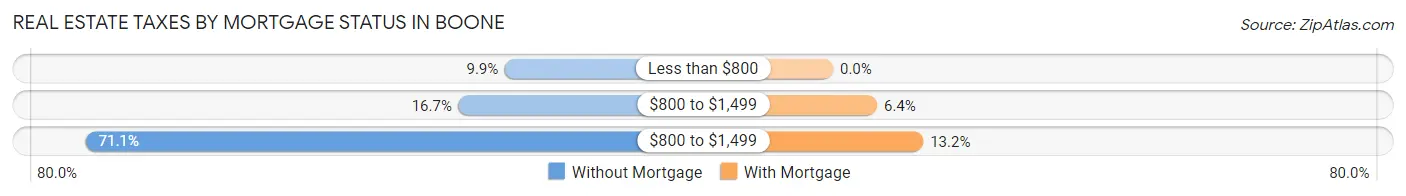
| Property Taxes | Without Mortgage | With Mortgage |
| Less than $800 | 126 (9.9%) | 0 (0.0%) |
| $800 to $1,499 | 212 (16.7%) | 158 (6.4%) |
| $800 to $1,499 | 902 (71.1%) | 324 (13.2%) |
| Total | 1,269 (100.0%) | 2,458 (100.0%) |
Health & Disability in Boone
Health Insurance Coverage by Age in Boone
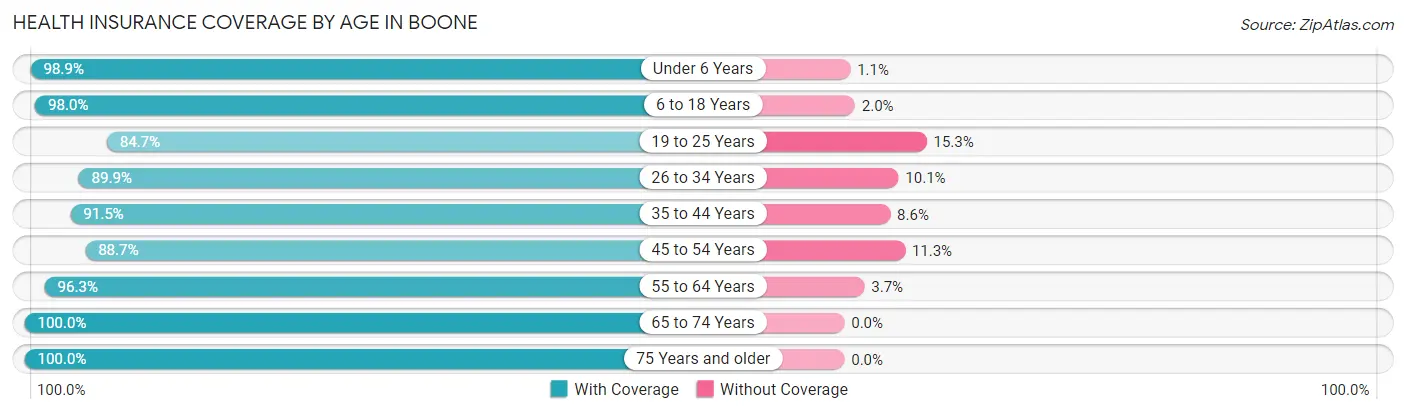
| Age Bracket | With Coverage | Without Coverage |
| Under 6 Years | 895 (98.9%) | 10 (1.1%) |
| 6 to 18 Years | 1,688 (98.0%) | 34 (2.0%) |
| 19 to 25 Years | 1,193 (84.7%) | 216 (15.3%) |
| 26 to 34 Years | 1,452 (89.9%) | 163 (10.1%) |
| 35 to 44 Years | 1,486 (91.4%) | 139 (8.6%) |
| 45 to 54 Years | 1,239 (88.7%) | 158 (11.3%) |
| 55 to 64 Years | 1,543 (96.3%) | 60 (3.7%) |
| 65 to 74 Years | 1,190 (100.0%) | 0 (0.0%) |
| 75 Years and older | 769 (100.0%) | 0 (0.0%) |
| Total | 11,455 (93.6%) | 780 (6.4%) |
Health Insurance Coverage by Citizenship Status in Boone
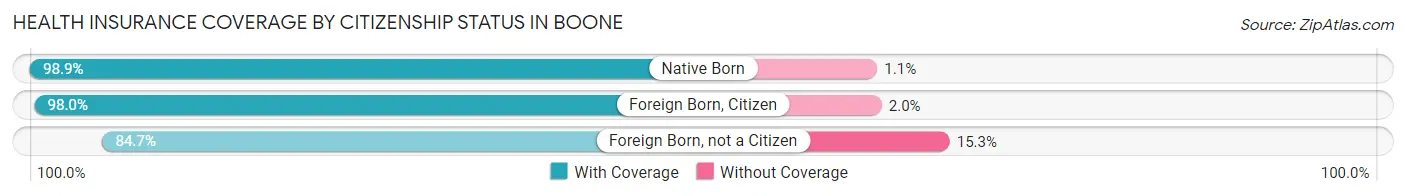
| Citizenship Status | With Coverage | Without Coverage |
| Native Born | 895 (98.9%) | 10 (1.1%) |
| Foreign Born, Citizen | 1,688 (98.0%) | 34 (2.0%) |
| Foreign Born, not a Citizen | 1,193 (84.7%) | 216 (15.3%) |
Health Insurance Coverage by Household Income in Boone
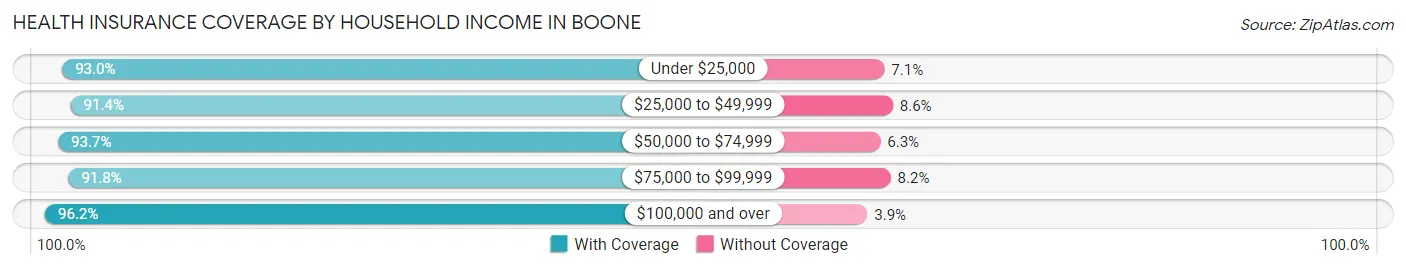
| Household Income | With Coverage | Without Coverage |
| Under $25,000 | 1,041 (92.9%) | 79 (7.0%) |
| $25,000 to $49,999 | 1,980 (91.4%) | 187 (8.6%) |
| $50,000 to $74,999 | 2,070 (93.7%) | 139 (6.3%) |
| $75,000 to $99,999 | 2,134 (91.8%) | 191 (8.2%) |
| $100,000 and over | 4,196 (96.2%) | 168 (3.8%) |
Public vs Private Health Insurance Coverage by Age in Boone
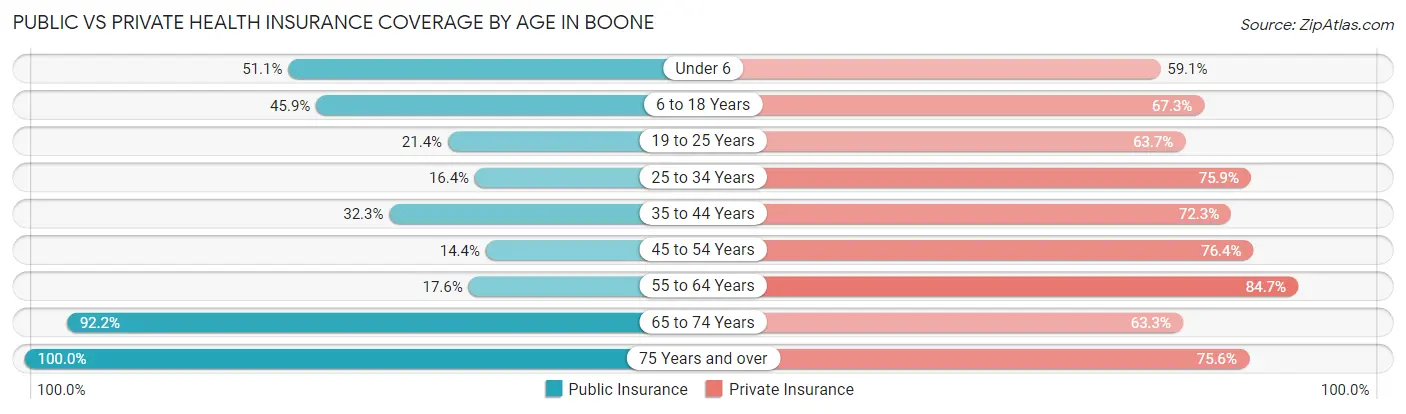
| Age Bracket | Public Insurance | Private Insurance |
| Under 6 | 462 (51.0%) | 535 (59.1%) |
| 6 to 18 Years | 790 (45.9%) | 1,158 (67.2%) |
| 19 to 25 Years | 302 (21.4%) | 898 (63.7%) |
| 25 to 34 Years | 265 (16.4%) | 1,226 (75.9%) |
| 35 to 44 Years | 525 (32.3%) | 1,174 (72.3%) |
| 45 to 54 Years | 201 (14.4%) | 1,067 (76.4%) |
| 55 to 64 Years | 282 (17.6%) | 1,357 (84.7%) |
| 65 to 74 Years | 1,097 (92.2%) | 753 (63.3%) |
| 75 Years and over | 769 (100.0%) | 581 (75.5%) |
| Total | 4,693 (38.4%) | 8,749 (71.5%) |
Disability Status by Sex by Age in Boone
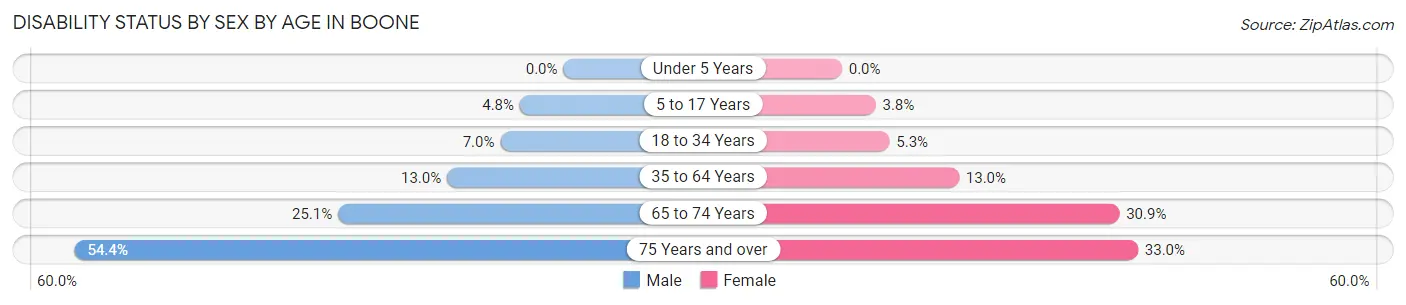
| Age Bracket | Male | Female |
| Under 5 Years | 0 (0.0%) | 0 (0.0%) |
| 5 to 17 Years | 45 (4.8%) | 31 (3.8%) |
| 18 to 34 Years | 113 (7.0%) | 81 (5.3%) |
| 35 to 64 Years | 304 (13.0%) | 297 (13.0%) |
| 65 to 74 Years | 137 (25.1%) | 199 (30.9%) |
| 75 Years and over | 166 (54.4%) | 153 (33.0%) |
Disability Class by Sex by Age in Boone
Disability Class: Hearing Difficulty
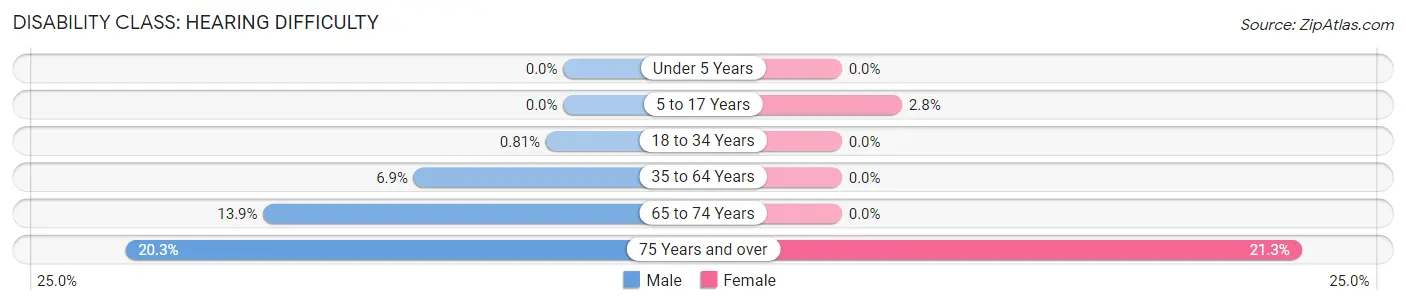
| Age Bracket | Male | Female |
| Under 5 Years | 0 (0.0%) | 0 (0.0%) |
| 5 to 17 Years | 0 (0.0%) | 23 (2.8%) |
| 18 to 34 Years | 13 (0.8%) | 0 (0.0%) |
| 35 to 64 Years | 163 (6.9%) | 0 (0.0%) |
| 65 to 74 Years | 76 (13.9%) | 0 (0.0%) |
| 75 Years and over | 62 (20.3%) | 99 (21.3%) |
Disability Class: Vision Difficulty
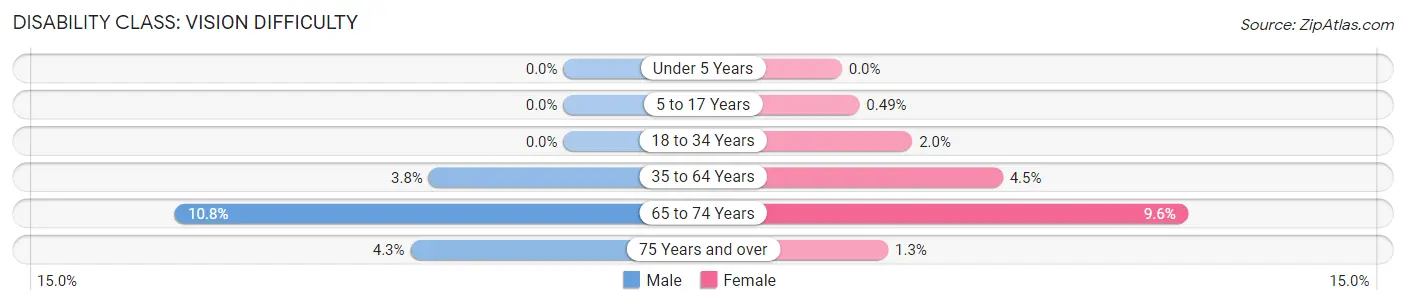
| Age Bracket | Male | Female |
| Under 5 Years | 0 (0.0%) | 0 (0.0%) |
| 5 to 17 Years | 0 (0.0%) | 4 (0.5%) |
| 18 to 34 Years | 0 (0.0%) | 30 (2.0%) |
| 35 to 64 Years | 88 (3.7%) | 102 (4.5%) |
| 65 to 74 Years | 59 (10.8%) | 62 (9.6%) |
| 75 Years and over | 13 (4.3%) | 6 (1.3%) |
Disability Class: Cognitive Difficulty
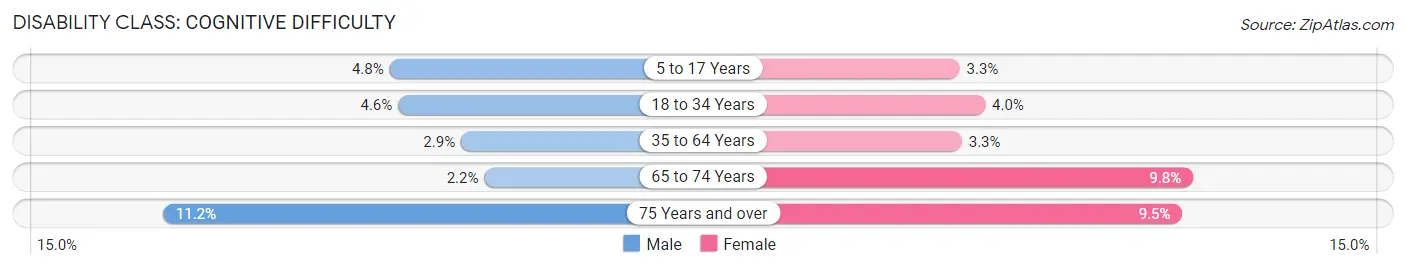
| Age Bracket | Male | Female |
| 5 to 17 Years | 45 (4.8%) | 27 (3.3%) |
| 18 to 34 Years | 74 (4.6%) | 61 (4.0%) |
| 35 to 64 Years | 67 (2.9%) | 76 (3.3%) |
| 65 to 74 Years | 12 (2.2%) | 63 (9.8%) |
| 75 Years and over | 34 (11.2%) | 44 (9.5%) |
Disability Class: Ambulatory Difficulty
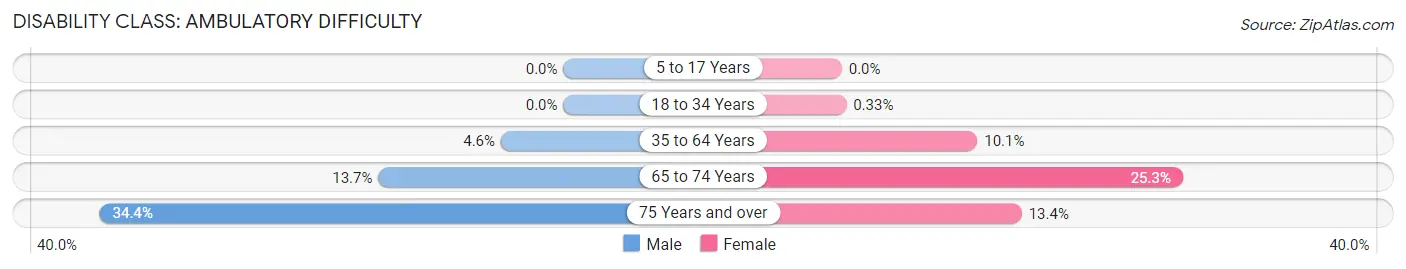
| Age Bracket | Male | Female |
| 5 to 17 Years | 0 (0.0%) | 0 (0.0%) |
| 18 to 34 Years | 0 (0.0%) | 5 (0.3%) |
| 35 to 64 Years | 109 (4.6%) | 229 (10.1%) |
| 65 to 74 Years | 75 (13.7%) | 163 (25.3%) |
| 75 Years and over | 105 (34.4%) | 62 (13.4%) |
Disability Class: Self-Care Difficulty
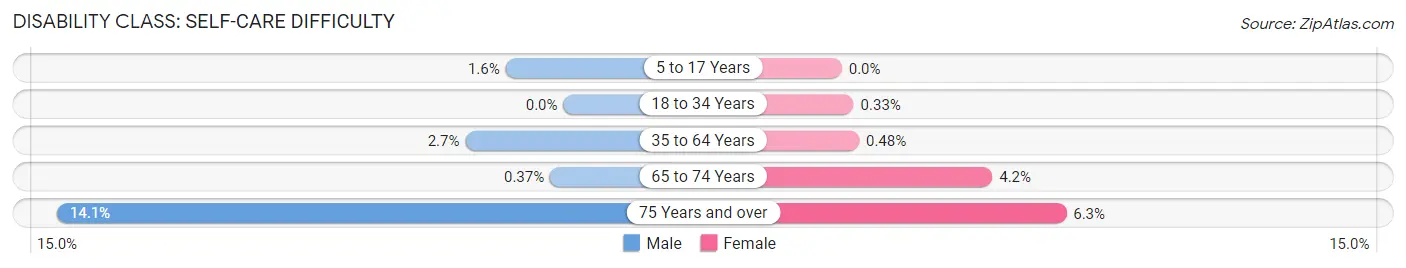
| Age Bracket | Male | Female |
| 5 to 17 Years | 15 (1.6%) | 0 (0.0%) |
| 18 to 34 Years | 0 (0.0%) | 5 (0.3%) |
| 35 to 64 Years | 64 (2.7%) | 11 (0.5%) |
| 65 to 74 Years | 2 (0.4%) | 27 (4.2%) |
| 75 Years and over | 43 (14.1%) | 29 (6.2%) |
Technology Access in Boone
Computing Device Access in Boone
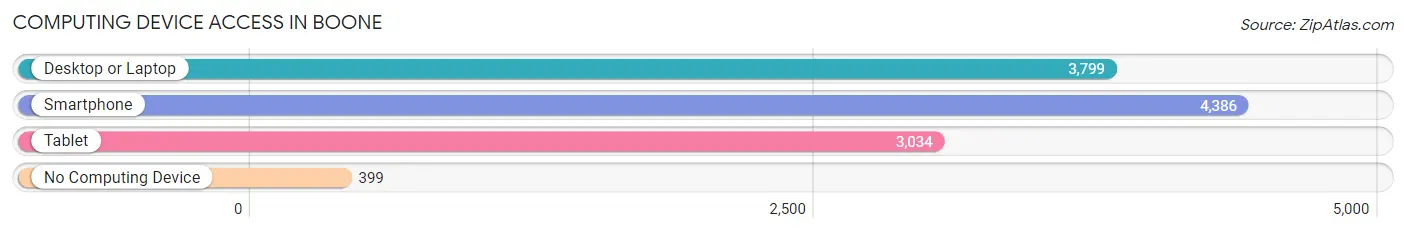
| Device Type | # Households | % Households |
| Desktop or Laptop | 3,799 | 74.0% |
| Smartphone | 4,386 | 85.4% |
| Tablet | 3,034 | 59.1% |
| No Computing Device | 399 | 7.8% |
| Total | 5,135 | 100.0% |
Internet Access in Boone
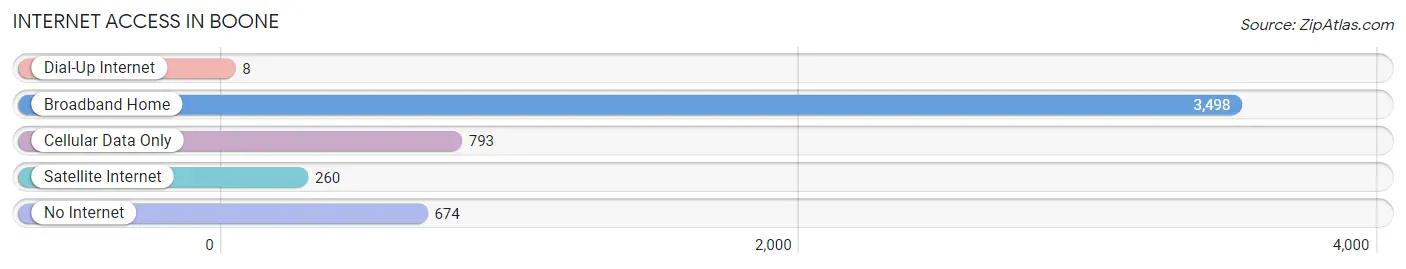
| Internet Type | # Households | % Households |
| Dial-Up Internet | 8 | 0.2% |
| Broadband Home | 3,498 | 68.1% |
| Cellular Data Only | 793 | 15.4% |
| Satellite Internet | 260 | 5.1% |
| No Internet | 674 | 13.1% |
| Total | 5,135 | 100.0% |
Boone Summary
Boone, Iowa is a city located in Boone County, Iowa, United States. It is the county seat of Boone County and is located in the north-central part of the state. The population was 12,661 at the 2010 census. It is part of the Des Moines–West Des Moines Metropolitan Statistical Area.
History
Boone was founded in 1865 by settlers from the East Coast. The city was named after the explorer Daniel Boone. The first settlers were mostly of English and German descent. The city was incorporated in 1871.
In the late 19th century, Boone was a major railroad hub, with the Chicago and North Western Railway and the Chicago, Milwaukee, St. Paul and Pacific Railroad both having lines running through the city. The city was also home to a large coal mining industry.
Geography
Boone is located at 42°02′N 93°50′W (42.03, -93.83). According to the United States Census Bureau, the city has a total area of 8.2 square miles (21.2 km2), of which 8.1 square miles (21.0 km2) is land and 0.1 square miles (0.2 km2) is water.
Economy
Boone's economy is largely based on agriculture and manufacturing. The city is home to several large employers, including the John Deere plant, which produces agricultural equipment, and the Iowa State University Research Park, which is home to several high-tech companies. The city also has a large retail sector, with several large shopping centers and a variety of restaurants and other businesses.
Demographics
As of the census of 2010, there were 12,661 people, 5,093 households, and 3,092 families residing in the city. The population density was 1,564.2 people per square mile (604.7/km2). There were 5,541 housing units at an average density of 683.3 per square mile (263.9/km2). The racial makeup of the city was 94.2% White, 1.2% African American, 0.3% Native American, 0.9% Asian, 0.1% Pacific Islander, 1.7% from other races, and 1.6% from two or more races. Hispanic or Latino of any race were 4.2% of the population.
There were 5,093 households, out of which 28.2% had children under the age of 18 living with them, 44.2% were married couples living together, 11.7% had a female householder with no husband present, and 39.3% were non-families. 32.2% of all households were made up of individuals, and 13.2% had someone living alone who was 65 years of age or older. The average household size was 2.35 and the average family size was 2.97.
In the city, the population was spread out, with 23.2% under the age of 18, 11.2% from 18 to 24, 25.7% from 25 to 44, 24.2% from 45 to 64, and 15.7% who were 65 years of age or older. The median age was 37 years. For every 100 females, there were 91.2 males. For every 100 females age 18 and over, there were 87.7 males.
The median income for a household in the city was $37,845, and the median income for a family was $45,945. Males had a median income of $32,917 versus $25,945 for females. The per capita income for the city was $19,945. About 8.2% of families and 11.2% of the population were below the poverty line, including 15.2% of those under age 18 and 8.2% of those age 65 or over.
Common Questions
What is Per Capita Income in Boone?
Per Capita income in Boone is $32,737.
What is the Median Family Income in Boone?
Median Family Income in Boone is $90,934.
What is the Median Household income in Boone?
Median Household Income in Boone is $64,192.
What is Income or Wage Gap in Boone?
Income or Wage Gap in Boone is 17.6%.
Women in Boone earn 82.4 cents for every dollar earned by a man.
What is Inequality or Gini Index in Boone?
Inequality or Gini Index in Boone is 0.39.
What is the Total Population of Boone?
Total Population of Boone is 12,482.
What is the Total Male Population of Boone?
Total Male Population of Boone is 6,225.
What is the Total Female Population of Boone?
Total Female Population of Boone is 6,257.
What is the Ratio of Males per 100 Females in Boone?
There are 99.49 Males per 100 Females in Boone.
What is the Ratio of Females per 100 Males in Boone?
There are 100.51 Females per 100 Males in Boone.
What is the Median Population Age in Boone?
Median Population Age in Boone is 38.5 Years.
What is the Average Family Size in Boone
Average Family Size in Boone is 3.0 People.
What is the Average Household Size in Boone
Average Household Size in Boone is 2.4 People.
How Large is the Labor Force in Boone?
There are 7,017 People in the Labor Forcein in Boone.
What is the Percentage of People in the Labor Force in Boone?
67.9% of People are in the Labor Force in Boone.
What is the Unemployment Rate in Boone?
Unemployment Rate in Boone is 0.8%.