Waverly, IA Map & Demographics
Waverly Map
Waverly Overview
$41,234
PER CAPITA INCOME
$97,188
AVG FAMILY INCOME
$78,278
AVG HOUSEHOLD INCOME
30.6%
WAGE / INCOME GAP [ % ]
69.4¢/ $1
WAGE / INCOME GAP [ $ ]
0.48
INEQUALITY / GINI INDEX
10,399
TOTAL POPULATION
4,916
MALE POPULATION
5,483
FEMALE POPULATION
89.66
MALES / 100 FEMALES
111.53
FEMALES / 100 MALES
33.5
MEDIAN AGE
2.8
AVG FAMILY SIZE
2.4
AVG HOUSEHOLD SIZE
5,567
LABOR FORCE [ PEOPLE ]
65.3%
PERCENT IN LABOR FORCE
2.7%
UNEMPLOYMENT RATE
Waverly Zip Codes
Waverly Area Codes
Income in Waverly
Income Overview in Waverly
Per Capita Income in Waverly is $41,234, while median incomes of families and households are $97,188 and $78,278 respectively.
| Characteristic | Number | Measure |
| Per Capita Income | 10,399 | $41,234 |
| Median Family Income | 2,522 | $97,188 |
| Mean Family Income | 2,522 | $134,849 |
| Median Household Income | 3,788 | $78,278 |
| Mean Household Income | 3,788 | $108,202 |
| Income Deficit | 2,522 | $0 |
| Wage / Income Gap (%) | 10,399 | 30.62% |
| Wage / Income Gap ($) | 10,399 | 69.38¢ per $1 |
| Gini / Inequality Index | 10,399 | 0.48 |
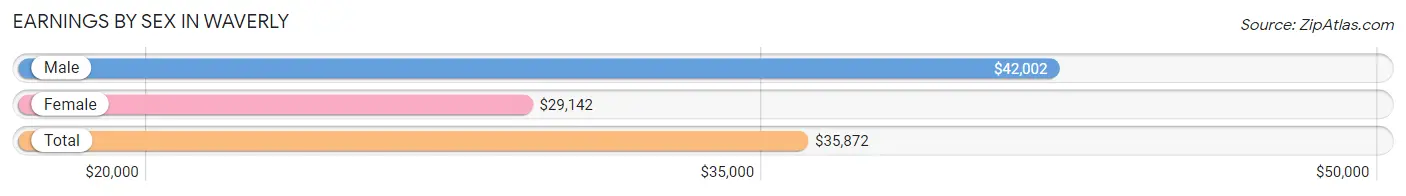
Earnings by Sex in Waverly
Average Earnings in Waverly are $35,872, $42,002 for men and $29,142 for women, a difference of 30.6%.
| Sex | Number | Average Earnings |
| Male | 3,051 (51.1%) | $42,002 |
| Female | 2,917 (48.9%) | $29,142 |
| Total | 5,968 (100.0%) | $35,872 |
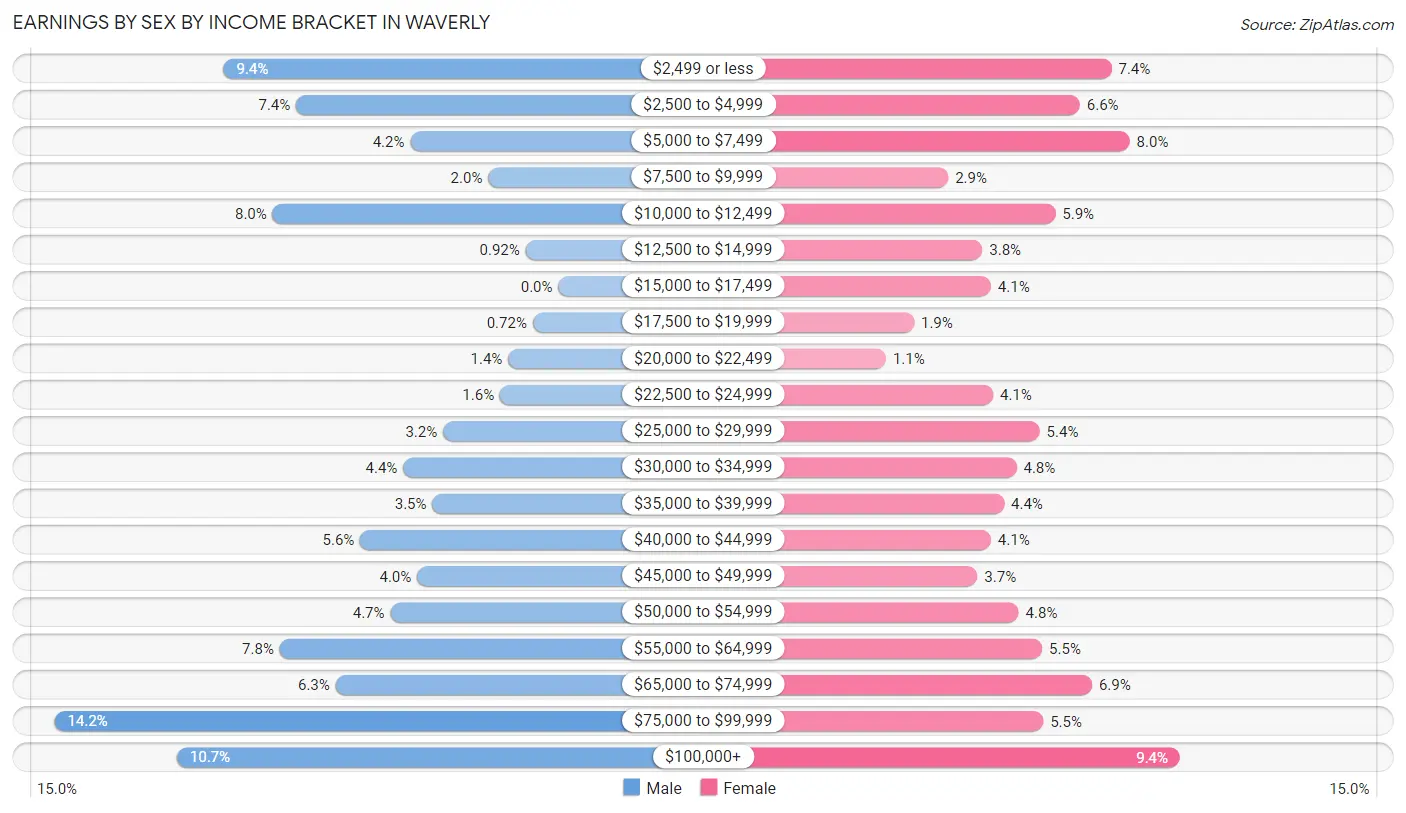
Earnings by Sex by Income Bracket in Waverly
The most common earnings brackets in Waverly are $75,000 to $99,999 for men (432 | 14.2%) and $100,000+ for women (273 | 9.4%).
| Income | Male | Female |
| $2,499 or less | 287 (9.4%) | 217 (7.4%) |
| $2,500 to $4,999 | 225 (7.4%) | 191 (6.6%) |
| $5,000 to $7,499 | 127 (4.2%) | 232 (8.0%) |
| $7,500 to $9,999 | 60 (2.0%) | 83 (2.9%) |
| $10,000 to $12,499 | 245 (8.0%) | 171 (5.9%) |
| $12,500 to $14,999 | 28 (0.9%) | 111 (3.8%) |
| $15,000 to $17,499 | 0 (0.0%) | 118 (4.1%) |
| $17,500 to $19,999 | 22 (0.7%) | 55 (1.9%) |
| $20,000 to $22,499 | 43 (1.4%) | 32 (1.1%) |
| $22,500 to $24,999 | 50 (1.6%) | 120 (4.1%) |
| $25,000 to $29,999 | 99 (3.2%) | 158 (5.4%) |
| $30,000 to $34,999 | 133 (4.4%) | 139 (4.8%) |
| $35,000 to $39,999 | 108 (3.5%) | 129 (4.4%) |
| $40,000 to $44,999 | 170 (5.6%) | 118 (4.1%) |
| $45,000 to $49,999 | 121 (4.0%) | 107 (3.7%) |
| $50,000 to $54,999 | 144 (4.7%) | 141 (4.8%) |
| $55,000 to $64,999 | 239 (7.8%) | 160 (5.5%) |
| $65,000 to $74,999 | 191 (6.3%) | 201 (6.9%) |
| $75,000 to $99,999 | 432 (14.2%) | 161 (5.5%) |
| $100,000+ | 327 (10.7%) | 273 (9.4%) |
| Total | 3,051 (100.0%) | 2,917 (100.0%) |
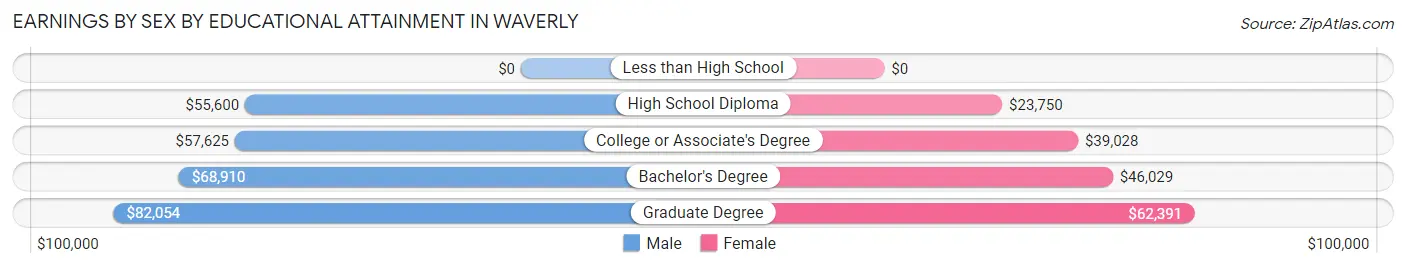
Earnings by Sex by Educational Attainment in Waverly
Average earnings in Waverly are $59,291 for men and $45,057 for women, a difference of 24.0%. Men with an educational attainment of graduate degree enjoy the highest average annual earnings of $82,054, while those with high school diploma education earn the least with $55,600. Women with an educational attainment of graduate degree earn the most with the average annual earnings of $62,391, while those with high school diploma education have the smallest earnings of $23,750.
| Educational Attainment | Male Income | Female Income |
| Less than High School | - | - |
| High School Diploma | $55,600 | $23,750 |
| College or Associate's Degree | $57,625 | $39,028 |
| Bachelor's Degree | $68,910 | $46,029 |
| Graduate Degree | $82,054 | $62,391 |
| Total | $59,291 | $45,057 |
Family Income in Waverly
Family Income Brackets in Waverly
According to the Waverly family income data, there are 676 families falling into the $100,000 to $149,999 income range, which is the most common income bracket and makes up 26.8% of all families. Conversely, the $10,000 to $14,999 income bracket is the least frequent group with only 33 families (1.3%) belonging to this category.
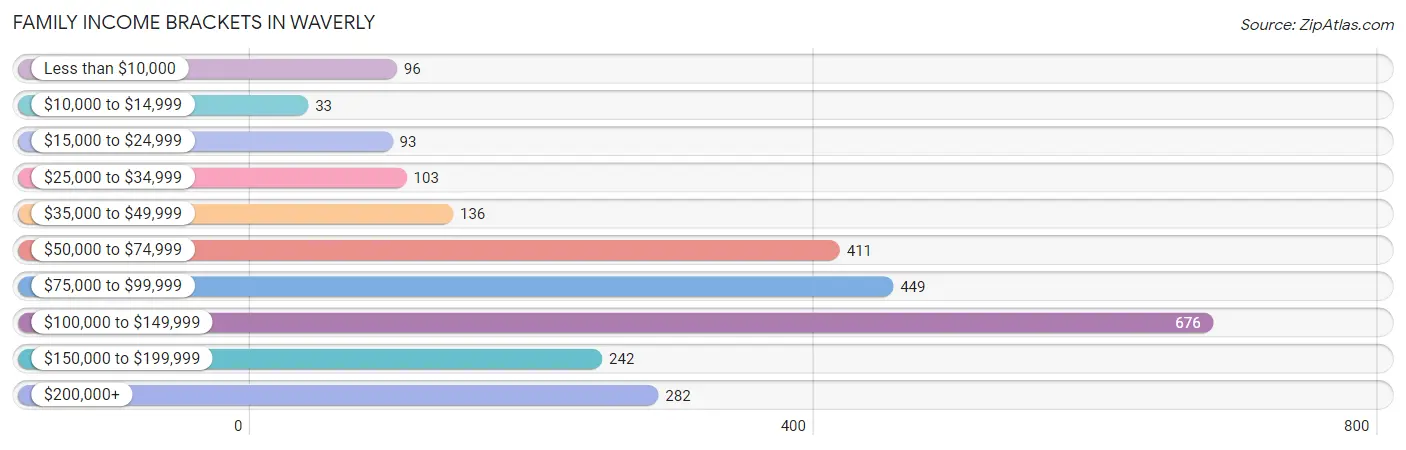
| Income Bracket | # Families | % Families |
| Less than $10,000 | 96 | 3.8% |
| $10,000 to $14,999 | 33 | 1.3% |
| $15,000 to $24,999 | 93 | 3.7% |
| $25,000 to $34,999 | 103 | 4.1% |
| $35,000 to $49,999 | 136 | 5.4% |
| $50,000 to $74,999 | 411 | 16.3% |
| $75,000 to $99,999 | 449 | 17.8% |
| $100,000 to $149,999 | 676 | 26.8% |
| $150,000 to $199,999 | 242 | 9.6% |
| $200,000+ | 282 | 11.2% |
Family Income by Famaliy Size in Waverly
5-person families (245 | 9.7%) account for the highest median family income in Waverly with $119,375 per family, while 2-person families (1,419 | 56.3%) have the highest median income of $42,930 per family member.
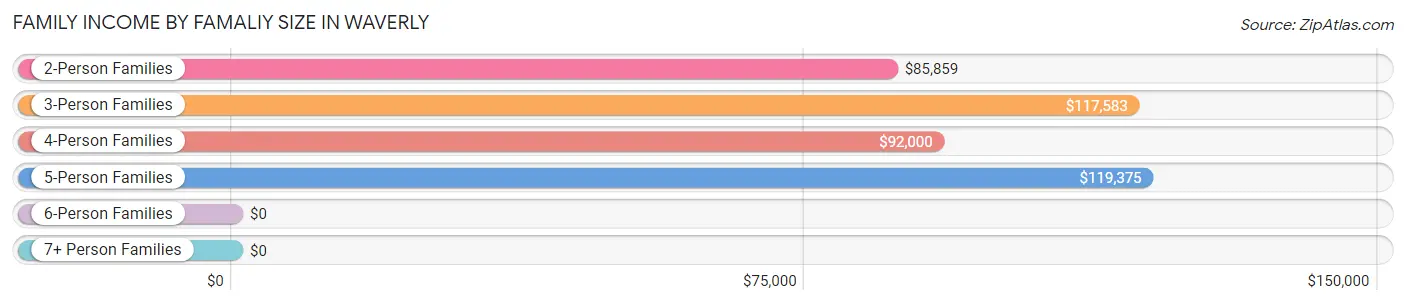
| Income Bracket | # Families | Median Income |
| 2-Person Families | 1,419 (56.3%) | $85,859 |
| 3-Person Families | 429 (17.0%) | $117,583 |
| 4-Person Families | 380 (15.1%) | $92,000 |
| 5-Person Families | 245 (9.7%) | $119,375 |
| 6-Person Families | 40 (1.6%) | $0 |
| 7+ Person Families | 9 (0.4%) | $0 |
| Total | 2,522 (100.0%) | $97,188 |
Family Income by Number of Earners in Waverly
The median family income in Waverly is $97,188, with families comprising 3+ earners (172) having the highest median family income of $147,000, while families with no earners (540) have the lowest median family income of $57,578, accounting for 6.8% and 21.4% of families, respectively.
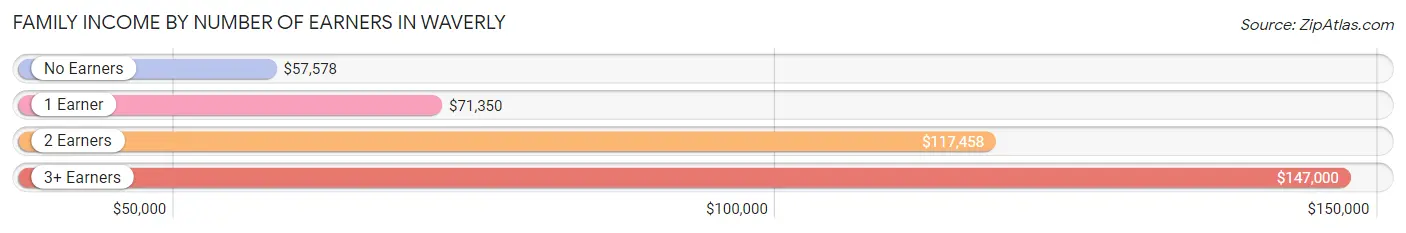
| Number of Earners | # Families | Median Income |
| No Earners | 540 (21.4%) | $57,578 |
| 1 Earner | 623 (24.7%) | $71,350 |
| 2 Earners | 1,187 (47.1%) | $117,458 |
| 3+ Earners | 172 (6.8%) | $147,000 |
| Total | 2,522 (100.0%) | $97,188 |
Household Income in Waverly
Household Income Brackets in Waverly
With 777 households falling in the category, the $100,000 to $149,999 income range is the most frequent in Waverly, accounting for 20.5% of all households. In contrast, only 76 households (2.0%) fall into the $10,000 to $14,999 income bracket, making it the least populous group.
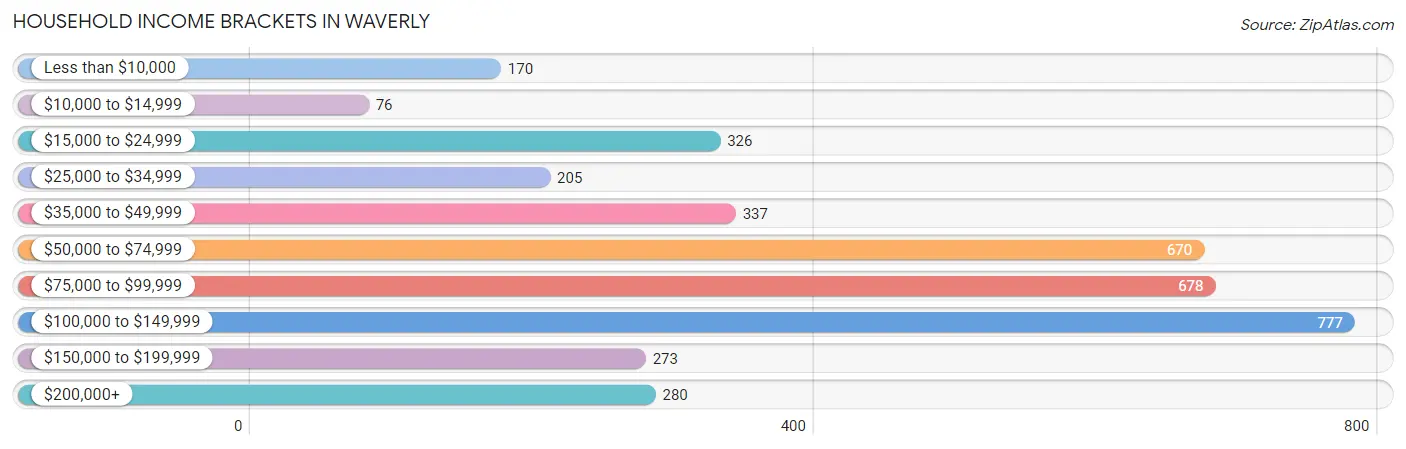
| Income Bracket | # Households | % Households |
| Less than $10,000 | 170 | 4.5% |
| $10,000 to $14,999 | 76 | 2.0% |
| $15,000 to $24,999 | 326 | 8.6% |
| $25,000 to $34,999 | 205 | 5.4% |
| $35,000 to $49,999 | 337 | 8.9% |
| $50,000 to $74,999 | 670 | 17.7% |
| $75,000 to $99,999 | 678 | 17.9% |
| $100,000 to $149,999 | 777 | 20.5% |
| $150,000 to $199,999 | 273 | 7.2% |
| $200,000+ | 280 | 7.4% |
Household Income by Householder Age in Waverly
The median household income in Waverly is $78,278, with the highest median household income of $105,000 found in the 45 to 64 years age bracket for the primary householder. A total of 1,102 households (29.1%) fall into this category. Meanwhile, the 15 to 24 years age bracket for the primary householder has the lowest median household income of $46,923, with 190 households (5.0%) in this group.
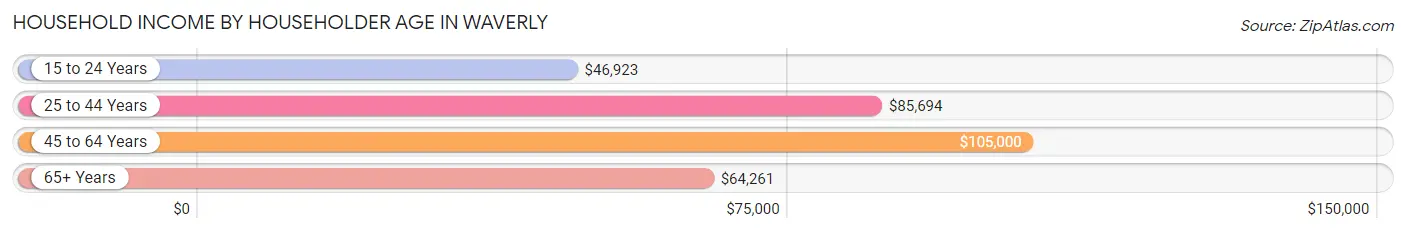
| Income Bracket | # Households | Median Income |
| 15 to 24 Years | 190 (5.0%) | $46,923 |
| 25 to 44 Years | 1,261 (33.3%) | $85,694 |
| 45 to 64 Years | 1,102 (29.1%) | $105,000 |
| 65+ Years | 1,235 (32.6%) | $64,261 |
| Total | 3,788 (100.0%) | $78,278 |
Poverty in Waverly
Income Below Poverty by Sex and Age in Waverly
With 7.1% poverty level for males and 11.9% for females among the residents of Waverly, 5 year old males and 18 to 24 year old females are the most vulnerable to poverty, with 28 males (66.7%) and 159 females (34.1%) in their respective age groups living below the poverty level.
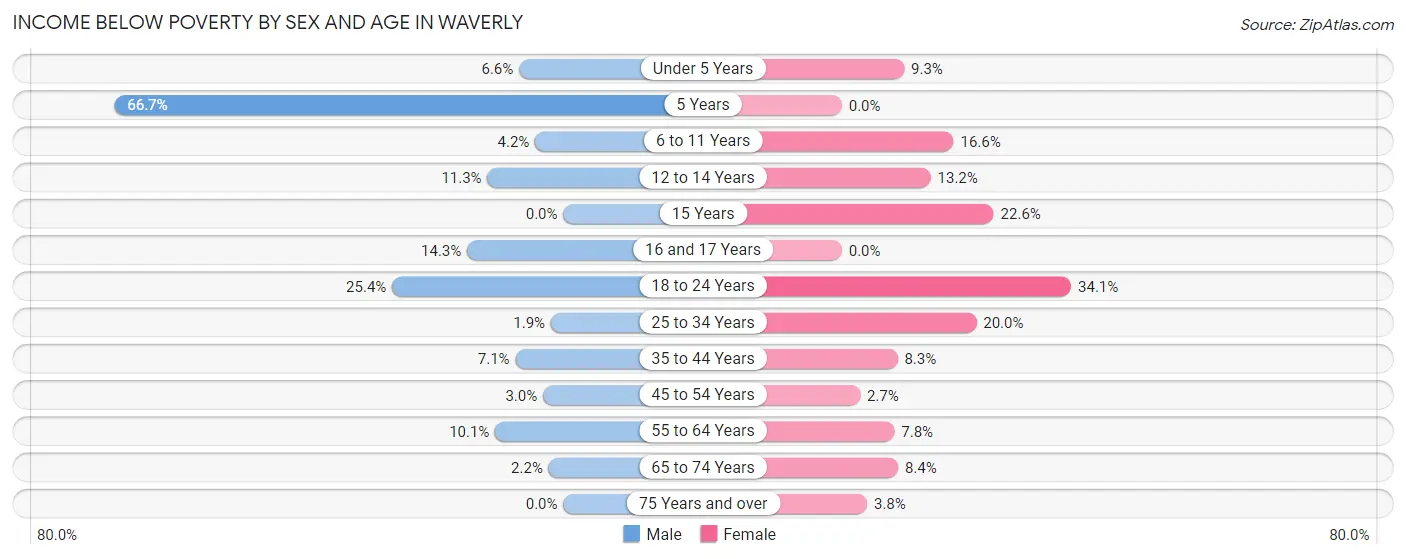
| Age Bracket | Male | Female |
| Under 5 Years | 18 (6.6%) | 26 (9.2%) |
| 5 Years | 28 (66.7%) | 0 (0.0%) |
| 6 to 11 Years | 13 (4.2%) | 69 (16.6%) |
| 12 to 14 Years | 16 (11.3%) | 24 (13.2%) |
| 15 Years | 0 (0.0%) | 23 (22.6%) |
| 16 and 17 Years | 16 (14.3%) | 0 (0.0%) |
| 18 to 24 Years | 75 (25.4%) | 159 (34.1%) |
| 25 to 34 Years | 11 (1.8%) | 116 (20.0%) |
| 35 to 44 Years | 43 (7.1%) | 47 (8.3%) |
| 45 to 54 Years | 10 (3.0%) | 14 (2.7%) |
| 55 to 64 Years | 49 (10.1%) | 43 (7.8%) |
| 65 to 74 Years | 10 (2.2%) | 45 (8.4%) |
| 75 Years and over | 0 (0.0%) | 21 (3.7%) |
| Total | 289 (7.1%) | 587 (11.9%) |
Income Above Poverty by Sex and Age in Waverly
According to the poverty statistics in Waverly, males aged 15 years and females aged 5 years are the age groups that are most secure financially, with 100.0% of males and 100.0% of females in these age groups living above the poverty line.
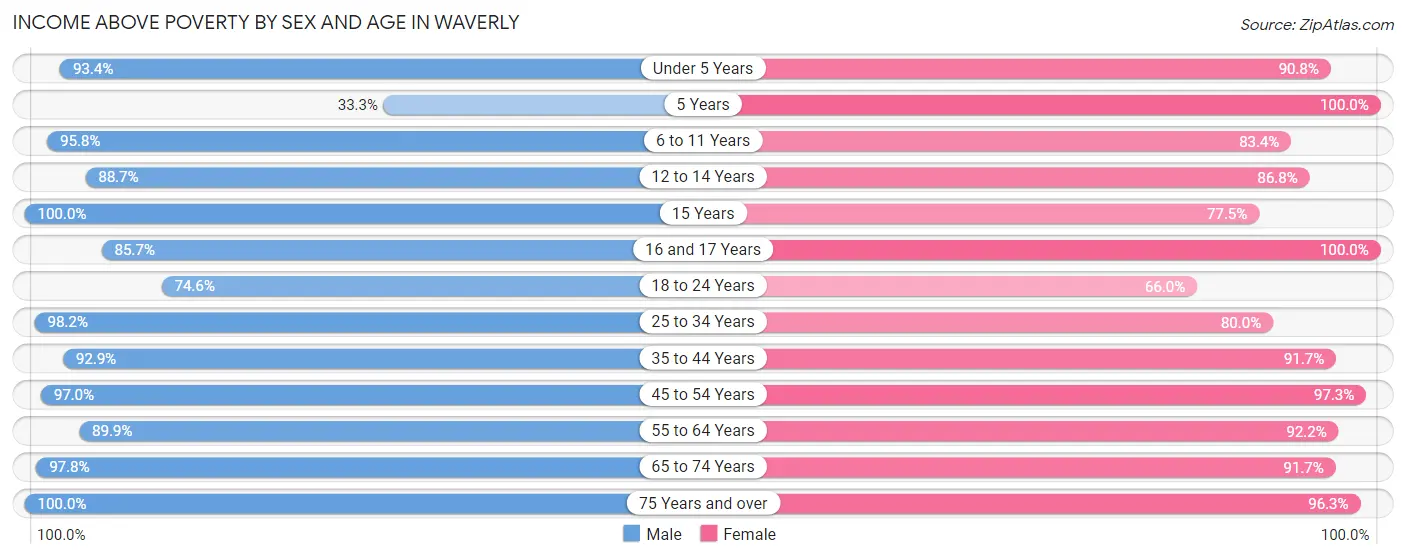
| Age Bracket | Male | Female |
| Under 5 Years | 256 (93.4%) | 255 (90.7%) |
| 5 Years | 14 (33.3%) | 75 (100.0%) |
| 6 to 11 Years | 298 (95.8%) | 347 (83.4%) |
| 12 to 14 Years | 126 (88.7%) | 158 (86.8%) |
| 15 Years | 45 (100.0%) | 79 (77.4%) |
| 16 and 17 Years | 96 (85.7%) | 103 (100.0%) |
| 18 to 24 Years | 220 (74.6%) | 308 (65.9%) |
| 25 to 34 Years | 582 (98.2%) | 465 (80.0%) |
| 35 to 44 Years | 561 (92.9%) | 522 (91.7%) |
| 45 to 54 Years | 322 (97.0%) | 504 (97.3%) |
| 55 to 64 Years | 435 (89.9%) | 508 (92.2%) |
| 65 to 74 Years | 450 (97.8%) | 494 (91.6%) |
| 75 Years and over | 351 (100.0%) | 539 (96.3%) |
| Total | 3,756 (92.9%) | 4,357 (88.1%) |
Income Below Poverty Among Married-Couple Families in Waverly
The poverty statistics for married-couple families in Waverly show that 1.4% or 29 of the total 2,049 families live below the poverty line. Families with 1 or 2 children have the highest poverty rate of 1.8%, comprising of 8 families. On the other hand, families with 3 or 4 children have the lowest poverty rate of 0.0%, which includes 0 families.
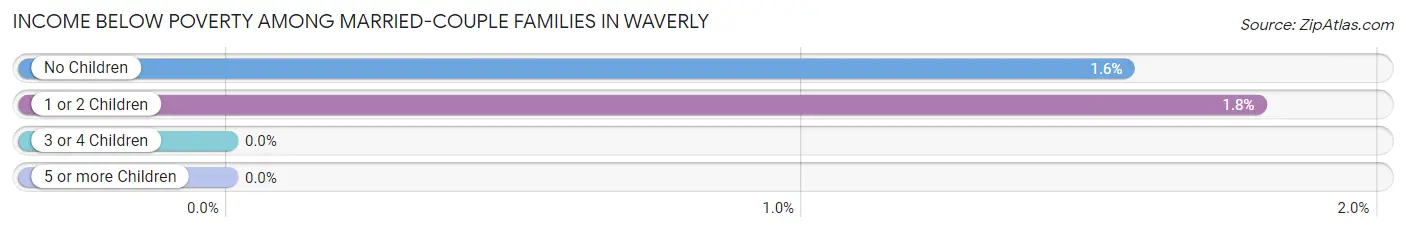
| Children | Above Poverty | Below Poverty |
| No Children | 1,326 (98.4%) | 21 (1.6%) |
| 1 or 2 Children | 439 (98.2%) | 8 (1.8%) |
| 3 or 4 Children | 246 (100.0%) | 0 (0.0%) |
| 5 or more Children | 9 (100.0%) | 0 (0.0%) |
| Total | 2,020 (98.6%) | 29 (1.4%) |
Income Below Poverty Among Single-Parent Households in Waverly
According to the poverty data in Waverly, 24.0% or 24 single-father households and 30.8% or 115 single-mother households are living below the poverty line. Among single-father households, those with no children have the highest poverty rate, with 13 households (37.1%) experiencing poverty. Likewise, among single-mother households, those with 3 or 4 children have the highest poverty rate, with 63 households (94.0%) falling below the poverty line.
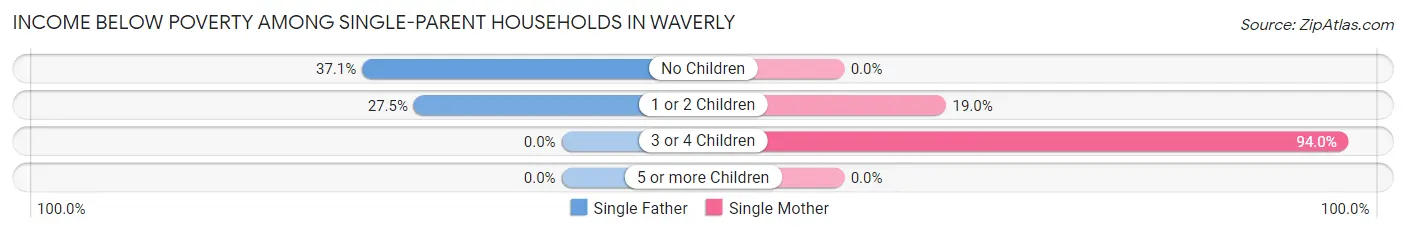
| Children | Single Father | Single Mother |
| No Children | 13 (37.1%) | 0 (0.0%) |
| 1 or 2 Children | 11 (27.5%) | 52 (19.0%) |
| 3 or 4 Children | 0 (0.0%) | 63 (94.0%) |
| 5 or more Children | 0 (0.0%) | 0 (0.0%) |
| Total | 24 (24.0%) | 115 (30.8%) |
Income Below Poverty Among Married-Couple vs Single-Parent Households in Waverly
The poverty data for Waverly shows that 29 of the married-couple family households (1.4%) and 139 of the single-parent households (29.4%) are living below the poverty level. Within the married-couple family households, those with 1 or 2 children have the highest poverty rate, with 8 households (1.8%) falling below the poverty line. Among the single-parent households, those with 3 or 4 children have the highest poverty rate, with 63 household (68.5%) living below poverty.
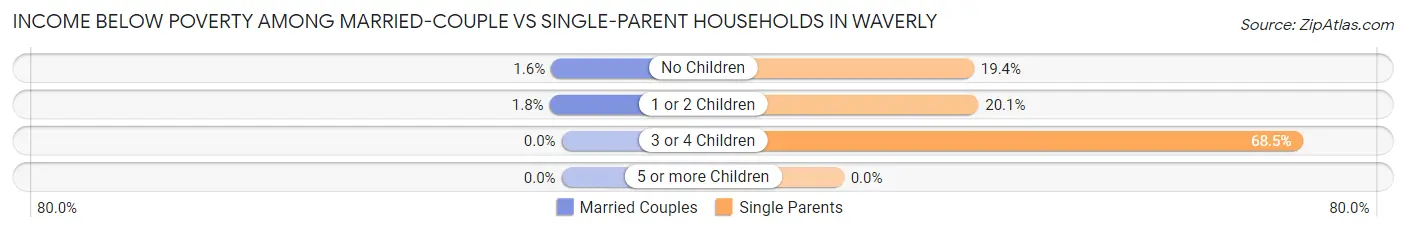
| Children | Married-Couple Families | Single-Parent Households |
| No Children | 21 (1.6%) | 13 (19.4%) |
| 1 or 2 Children | 8 (1.8%) | 63 (20.1%) |
| 3 or 4 Children | 0 (0.0%) | 63 (68.5%) |
| 5 or more Children | 0 (0.0%) | 0 (0.0%) |
| Total | 29 (1.4%) | 139 (29.4%) |
Race in Waverly
The most populous races in Waverly are White / Caucasian (9,361 | 90.0%), Two or more Races (420 | 4.0%), and Hispanic or Latino (357 | 3.4%).
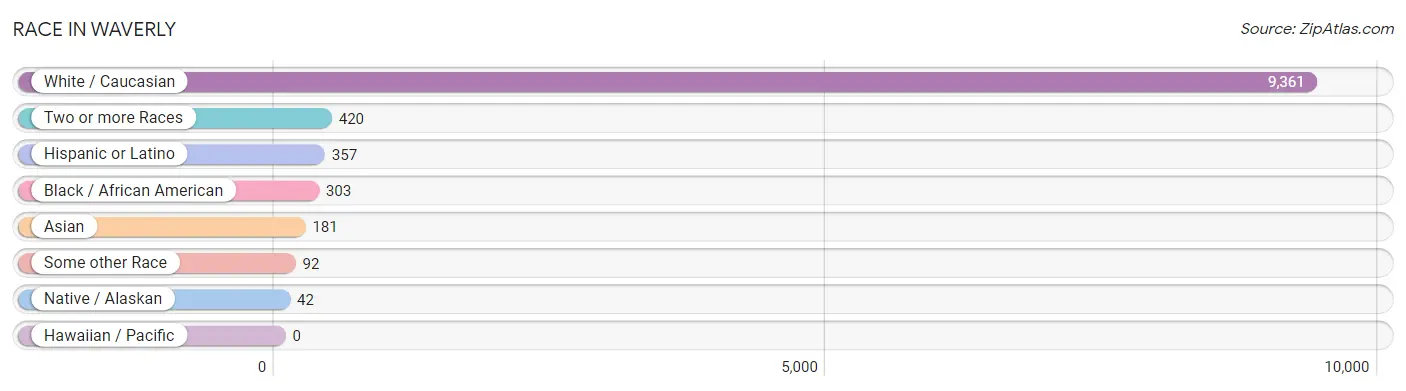
| Race | # Population | % Population |
| Asian | 181 | 1.7% |
| Black / African American | 303 | 2.9% |
| Hawaiian / Pacific | 0 | 0.0% |
| Hispanic or Latino | 357 | 3.4% |
| Native / Alaskan | 42 | 0.4% |
| White / Caucasian | 9,361 | 90.0% |
| Two or more Races | 420 | 4.0% |
| Some other Race | 92 | 0.9% |
| Total | 10,399 | 100.0% |
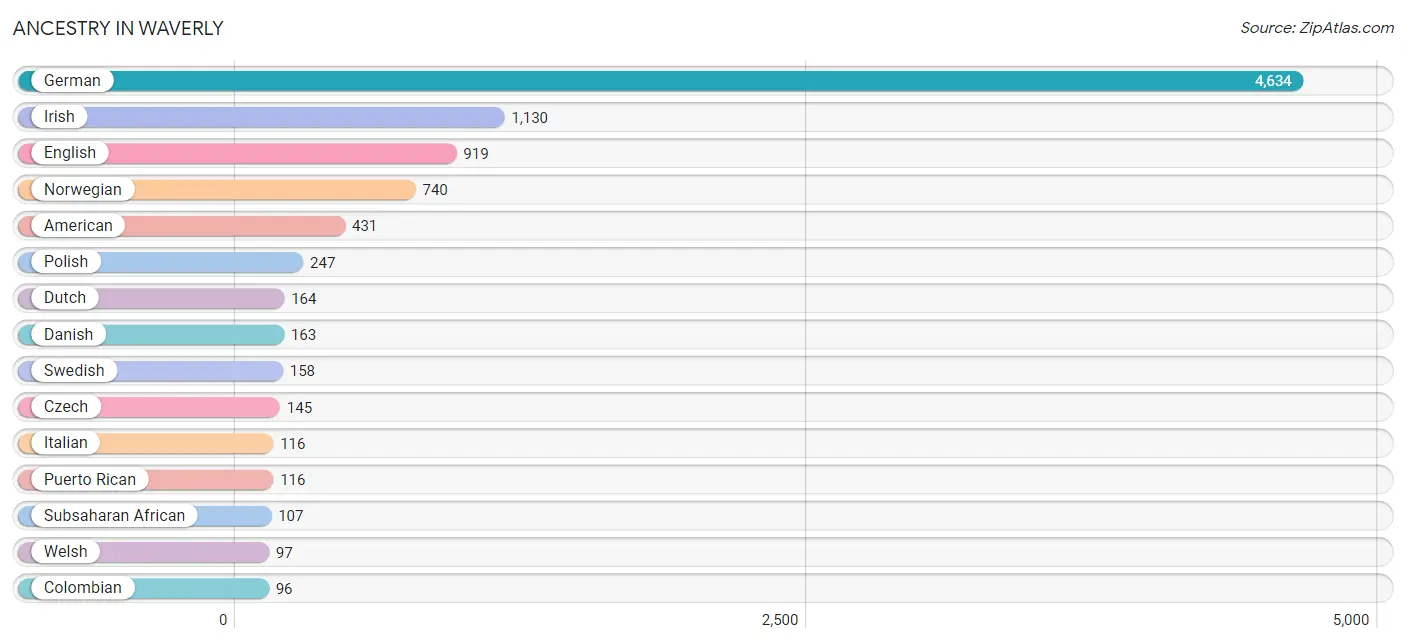
Ancestry in Waverly
The most populous ancestries reported in Waverly are German (4,634 | 44.6%), Irish (1,130 | 10.9%), English (919 | 8.8%), Norwegian (740 | 7.1%), and American (431 | 4.1%), together accounting for 75.5% of all Waverly residents.
| Ancestry | # Population | % Population |
| African | 87 | 0.8% |
| American | 431 | 4.1% |
| Arab | 18 | 0.2% |
| Austrian | 65 | 0.6% |
| Belgian | 16 | 0.2% |
| British | 23 | 0.2% |
| Burmese | 84 | 0.8% |
| Cambodian | 12 | 0.1% |
| Canadian | 6 | 0.1% |
| Central American | 26 | 0.3% |
| Chippewa | 6 | 0.1% |
| Colombian | 96 | 0.9% |
| Czech | 145 | 1.4% |
| Danish | 163 | 1.6% |
| Dominican | 31 | 0.3% |
| Dutch | 164 | 1.6% |
| Eastern European | 8 | 0.1% |
| English | 919 | 8.8% |
| Ethiopian | 3 | 0.0% |
| European | 36 | 0.4% |
| Finnish | 6 | 0.1% |
| French | 68 | 0.6% |
| French Canadian | 15 | 0.1% |
| German | 4,634 | 44.6% |
| Greek | 49 | 0.5% |
| Guatemalan | 26 | 0.3% |
| Hungarian | 20 | 0.2% |
| Indian (Asian) | 54 | 0.5% |
| Irish | 1,130 | 10.9% |
| Italian | 116 | 1.1% |
| Japanese | 33 | 0.3% |
| Kenyan | 2 | 0.0% |
| Lebanese | 6 | 0.1% |
| Luxembourger | 13 | 0.1% |
| Malaysian | 4 | 0.0% |
| Mexican | 72 | 0.7% |
| Nigerian | 2 | 0.0% |
| Norwegian | 740 | 7.1% |
| Pakistani | 38 | 0.4% |
| Polish | 247 | 2.4% |
| Portuguese | 21 | 0.2% |
| Puerto Rican | 116 | 1.1% |
| Romanian | 12 | 0.1% |
| Scandinavian | 55 | 0.5% |
| Scotch-Irish | 43 | 0.4% |
| Scottish | 90 | 0.9% |
| Seminole | 2 | 0.0% |
| Sioux | 42 | 0.4% |
| South American | 96 | 0.9% |
| Spanish | 8 | 0.1% |
| Sri Lankan | 2 | 0.0% |
| Subsaharan African | 107 | 1.0% |
| Swedish | 158 | 1.5% |
| Syrian | 6 | 0.1% |
| Welsh | 97 | 0.9% |
| Yugoslavian | 18 | 0.2% | View All 56 Rows |
Immigrants in Waverly
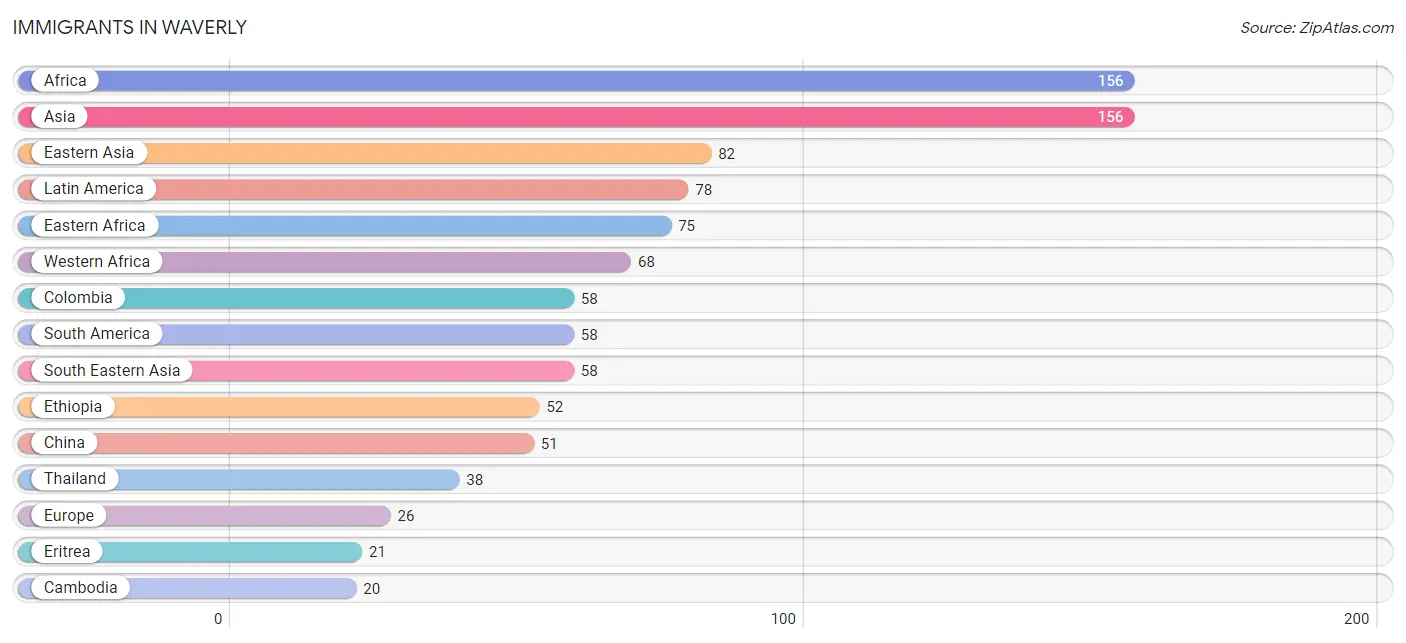
The most numerous immigrant groups reported in Waverly came from Africa (156 | 1.5%), Asia (156 | 1.5%), Eastern Asia (82 | 0.8%), Latin America (78 | 0.7%), and Eastern Africa (75 | 0.7%), together accounting for 5.3% of all Waverly residents.
| Immigration Origin | # Population | % Population |
| Africa | 156 | 1.5% |
| Asia | 156 | 1.5% |
| Bosnia and Herzegovina | 18 | 0.2% |
| Cambodia | 20 | 0.2% |
| Canada | 8 | 0.1% |
| Central America | 20 | 0.2% |
| China | 51 | 0.5% |
| Colombia | 58 | 0.6% |
| Congo | 7 | 0.1% |
| Eastern Africa | 75 | 0.7% |
| Eastern Asia | 82 | 0.8% |
| Eastern Europe | 18 | 0.2% |
| Eritrea | 21 | 0.2% |
| Ethiopia | 52 | 0.5% |
| Europe | 26 | 0.3% |
| Guatemala | 20 | 0.2% |
| India | 8 | 0.1% |
| Jordan | 6 | 0.1% |
| Kenya | 2 | 0.0% |
| Korea | 19 | 0.2% |
| Latin America | 78 | 0.7% |
| Lebanon | 2 | 0.0% |
| Middle Africa | 7 | 0.1% |
| Sierra Leone | 6 | 0.1% |
| South America | 58 | 0.6% |
| South Central Asia | 8 | 0.1% |
| South Eastern Asia | 58 | 0.6% |
| Switzerland | 8 | 0.1% |
| Thailand | 38 | 0.4% |
| Western Africa | 68 | 0.6% |
| Western Asia | 8 | 0.1% |
| Western Europe | 8 | 0.1% | View All 32 Rows |
Sex and Age in Waverly
Sex and Age in Waverly
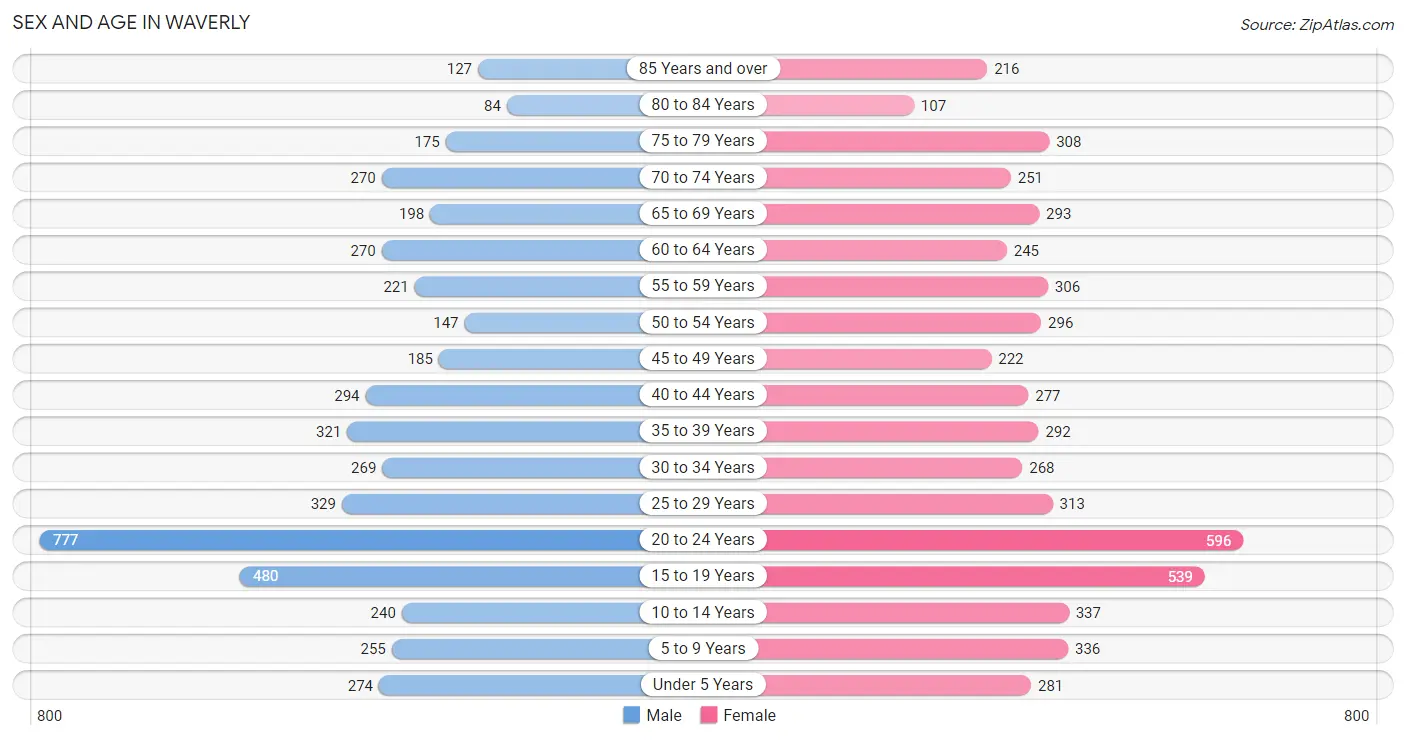
The most populous age groups in Waverly are 20 to 24 Years (777 | 15.8%) for men and 20 to 24 Years (596 | 10.9%) for women.
| Age Bracket | Male | Female |
| Under 5 Years | 274 (5.6%) | 281 (5.1%) |
| 5 to 9 Years | 255 (5.2%) | 336 (6.1%) |
| 10 to 14 Years | 240 (4.9%) | 337 (6.1%) |
| 15 to 19 Years | 480 (9.8%) | 539 (9.8%) |
| 20 to 24 Years | 777 (15.8%) | 596 (10.9%) |
| 25 to 29 Years | 329 (6.7%) | 313 (5.7%) |
| 30 to 34 Years | 269 (5.5%) | 268 (4.9%) |
| 35 to 39 Years | 321 (6.5%) | 292 (5.3%) |
| 40 to 44 Years | 294 (6.0%) | 277 (5.1%) |
| 45 to 49 Years | 185 (3.8%) | 222 (4.1%) |
| 50 to 54 Years | 147 (3.0%) | 296 (5.4%) |
| 55 to 59 Years | 221 (4.5%) | 306 (5.6%) |
| 60 to 64 Years | 270 (5.5%) | 245 (4.5%) |
| 65 to 69 Years | 198 (4.0%) | 293 (5.3%) |
| 70 to 74 Years | 270 (5.5%) | 251 (4.6%) |
| 75 to 79 Years | 175 (3.6%) | 308 (5.6%) |
| 80 to 84 Years | 84 (1.7%) | 107 (1.9%) |
| 85 Years and over | 127 (2.6%) | 216 (3.9%) |
| Total | 4,916 (100.0%) | 5,483 (100.0%) |
Families and Households in Waverly
Median Family Size in Waverly
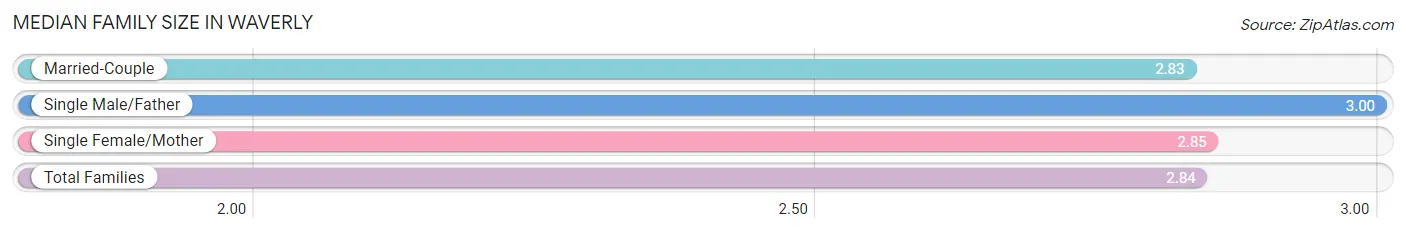
The median family size in Waverly is 2.84 persons per family, with single male/father families (100 | 4.0%) accounting for the largest median family size of 3 persons per family. On the other hand, married-couple families (2,049 | 81.2%) represent the smallest median family size with 2.83 persons per family.
| Family Type | # Families | Family Size |
| Married-Couple | 2,049 (81.2%) | 2.83 |
| Single Male/Father | 100 (4.0%) | 3.00 |
| Single Female/Mother | 373 (14.8%) | 2.85 |
| Total Families | 2,522 (100.0%) | 2.84 |
Median Household Size in Waverly
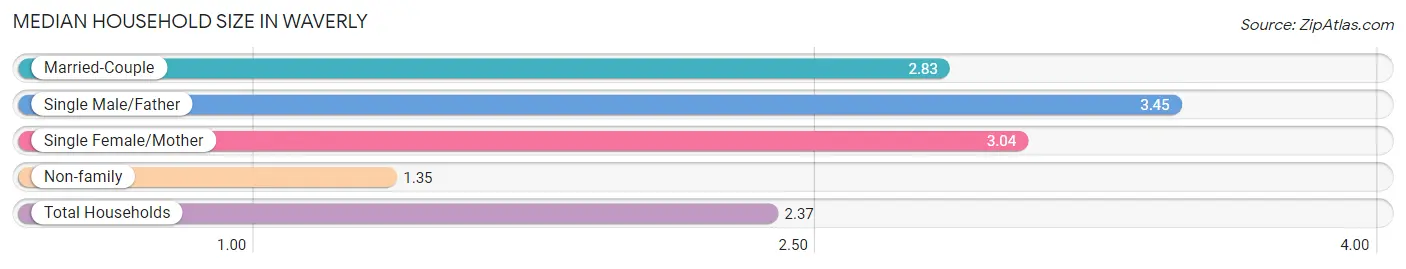
The median household size in Waverly is 2.37 persons per household, with single male/father households (100 | 2.6%) accounting for the largest median household size of 3.45 persons per household. non-family households (1,266 | 33.4%) represent the smallest median household size with 1.35 persons per household.
| Household Type | # Households | Household Size |
| Married-Couple | 2,049 (54.1%) | 2.83 |
| Single Male/Father | 100 (2.6%) | 3.45 |
| Single Female/Mother | 373 (9.9%) | 3.04 |
| Non-family | 1,266 (33.4%) | 1.35 |
| Total Households | 3,788 (100.0%) | 2.37 |
Household Size by Marriage Status in Waverly
Out of a total of 3,788 households in Waverly, 2,522 (66.6%) are family households, while 1,266 (33.4%) are nonfamily households. The most numerous type of family households are 2-person households, comprising 1,383, and the most common type of nonfamily households are 1-person households, comprising 1,005.
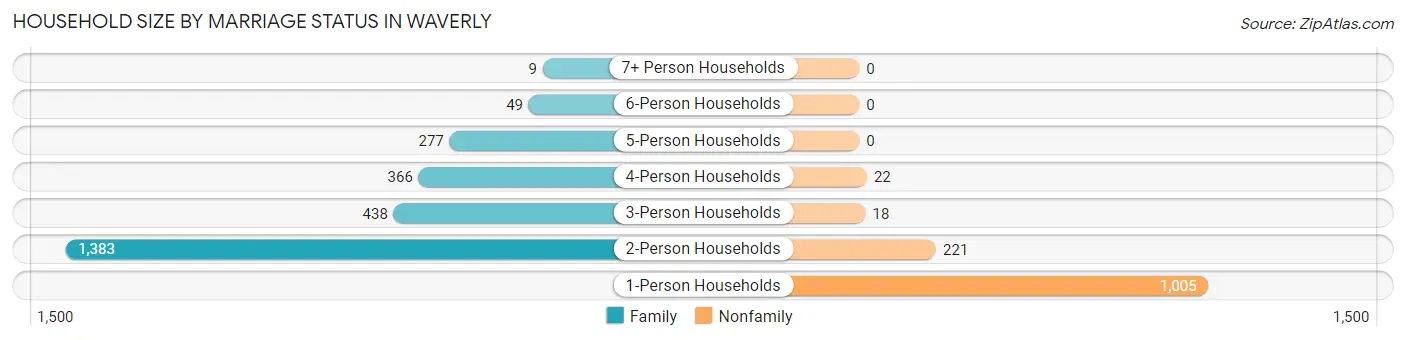
| Household Size | Family Households | Nonfamily Households |
| 1-Person Households | - | 1,005 (26.5%) |
| 2-Person Households | 1,383 (36.5%) | 221 (5.8%) |
| 3-Person Households | 438 (11.6%) | 18 (0.5%) |
| 4-Person Households | 366 (9.7%) | 22 (0.6%) |
| 5-Person Households | 277 (7.3%) | 0 (0.0%) |
| 6-Person Households | 49 (1.3%) | 0 (0.0%) |
| 7+ Person Households | 9 (0.2%) | 0 (0.0%) |
| Total | 2,522 (66.6%) | 1,266 (33.4%) |
Female Fertility in Waverly
Fertility by Age in Waverly
Average fertility rate in Waverly is 39.0 births per 1,000 women. Women in the age bracket of 20 to 34 years have the highest fertility rate with 65.0 births per 1,000 women. Women in the age bracket of 20 to 34 years acount for 76.0% of all women with births.
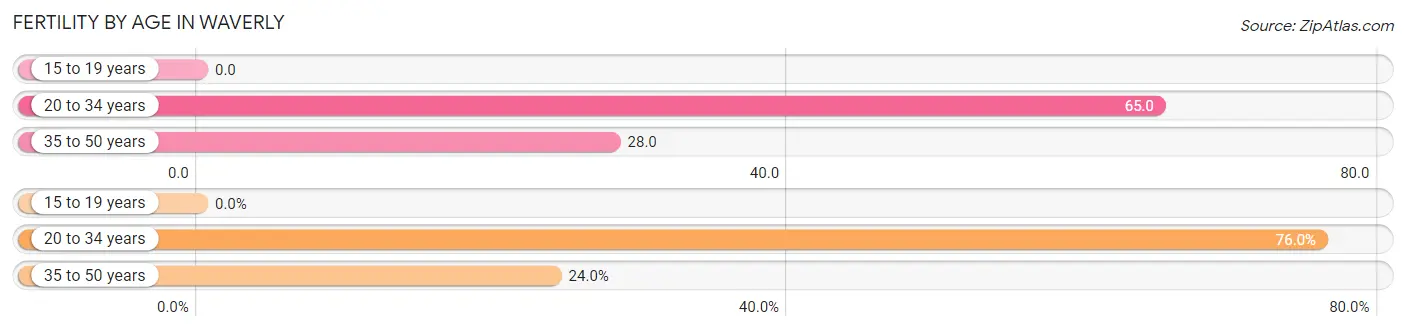
| Age Bracket | Women with Births | Births / 1,000 Women |
| 15 to 19 years | 0 (0.0%) | 0.0 |
| 20 to 34 years | 76 (76.0%) | 65.0 |
| 35 to 50 years | 24 (24.0%) | 28.0 |
| Total | 100 (100.0%) | 39.0 |
Fertility by Age by Marriage Status in Waverly
91.0% of women with births (100) in Waverly are married. The highest percentage of unmarried women with births falls into 20 to 34 years age bracket with 11.8% of them unmarried at the time of birth, while the lowest percentage of unmarried women with births belong to 35 to 50 years age bracket with 0.0% of them unmarried.
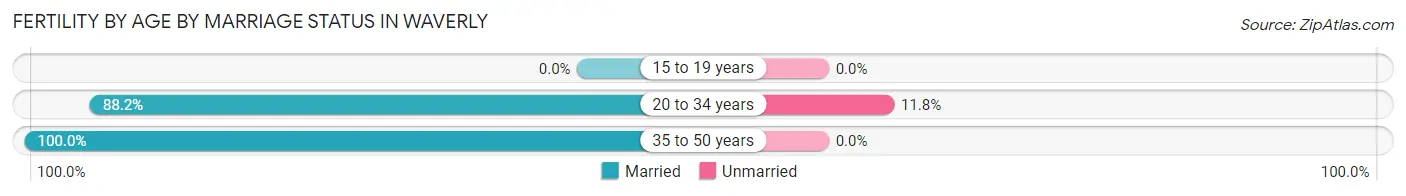
| Age Bracket | Married | Unmarried |
| 15 to 19 years | 0 (0.0%) | 0 (0.0%) |
| 20 to 34 years | 67 (88.2%) | 9 (11.8%) |
| 35 to 50 years | 24 (100.0%) | 0 (0.0%) |
| Total | 91 (91.0%) | 9 (9.0%) |
Fertility by Education in Waverly
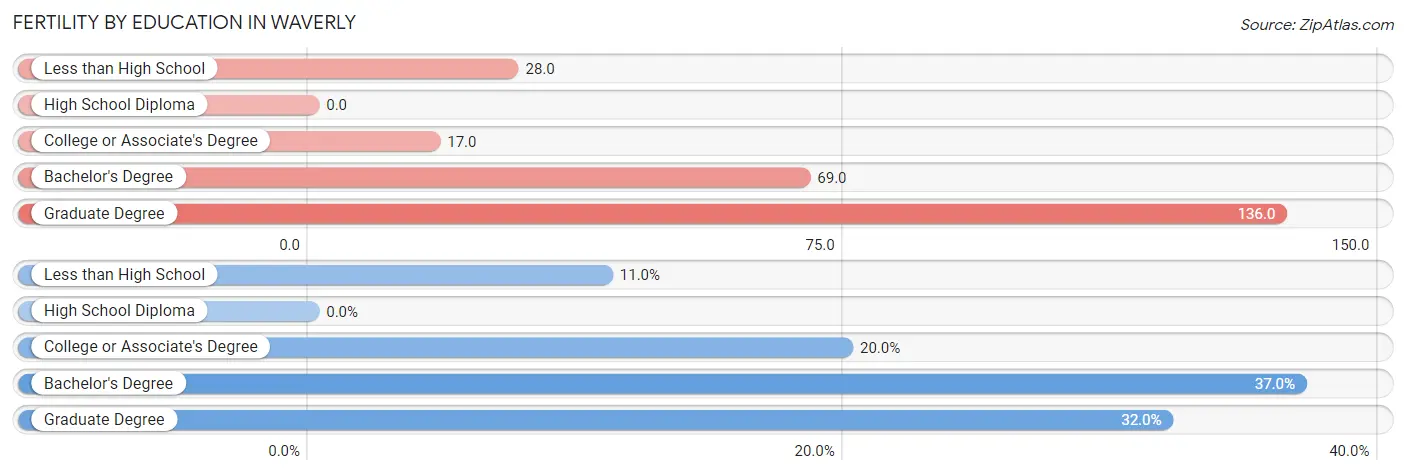
| Educational Attainment | Women with Births | Births / 1,000 Women |
| Less than High School | 11 (11.0%) | 28.0 |
| High School Diploma | 0 (0.0%) | 0.0 |
| College or Associate's Degree | 20 (20.0%) | 17.0 |
| Bachelor's Degree | 37 (37.0%) | 69.0 |
| Graduate Degree | 32 (32.0%) | 136.0 |
| Total | 100 (100.0%) | 39.0 |
Fertility by Education by Marriage Status in Waverly
9.0% of women with births in Waverly are unmarried. Women with the educational attainment of less than high school are most likely to be married with 100.0% of them married at childbirth, while women with the educational attainment of college or associate's degree are least likely to be married with 45.0% of them unmarried at childbirth.
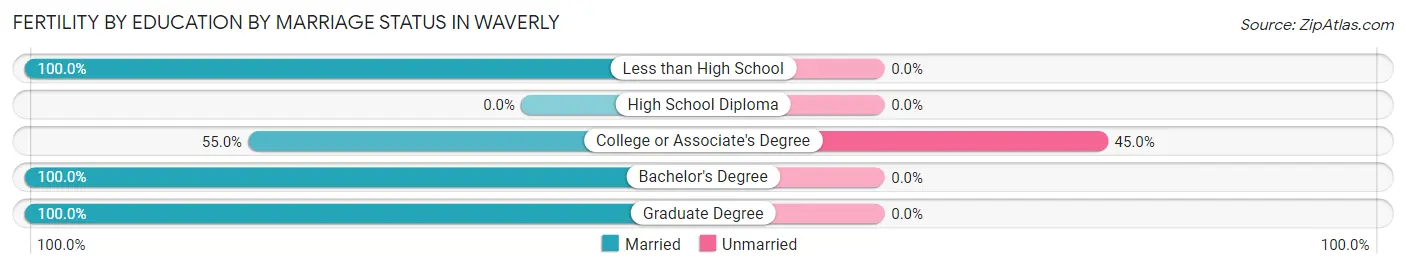
| Educational Attainment | Married | Unmarried |
| Less than High School | 11 (100.0%) | 0 (0.0%) |
| High School Diploma | 0 (0.0%) | 0 (0.0%) |
| College or Associate's Degree | 11 (55.0%) | 9 (45.0%) |
| Bachelor's Degree | 37 (100.0%) | 0 (0.0%) |
| Graduate Degree | 32 (100.0%) | 0 (0.0%) |
| Total | 91 (91.0%) | 9 (9.0%) |
Employment Characteristics in Waverly
Employment by Class of Employer in Waverly
Among the 5,136 employed individuals in Waverly, private company employees (3,194 | 62.2%), not-for-profit organizations (903 | 17.6%), and self-employed (not incorporated) (348 | 6.8%) make up the most common classes of employment.
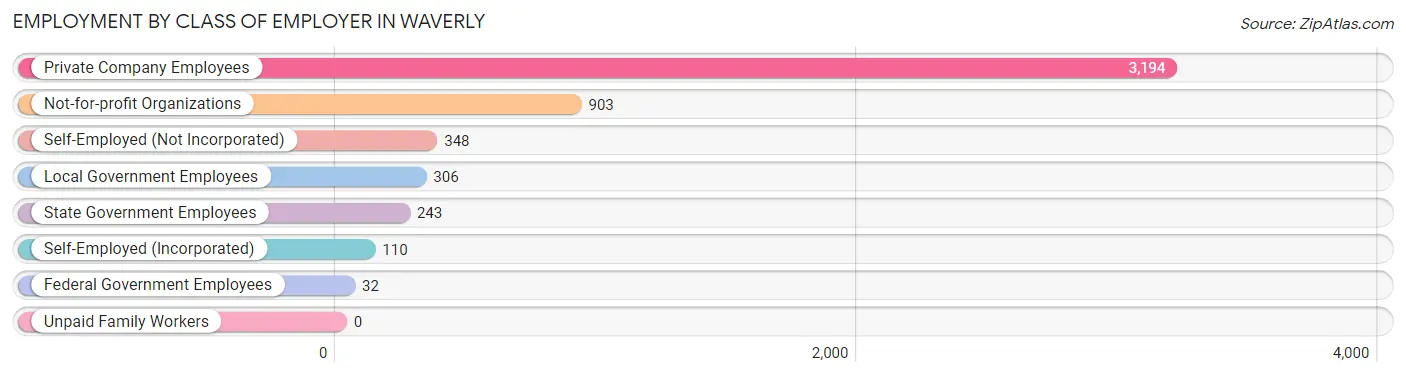
| Employer Class | # Employees | % Employees |
| Private Company Employees | 3,194 | 62.2% |
| Self-Employed (Incorporated) | 110 | 2.1% |
| Self-Employed (Not Incorporated) | 348 | 6.8% |
| Not-for-profit Organizations | 903 | 17.6% |
| Local Government Employees | 306 | 6.0% |
| State Government Employees | 243 | 4.7% |
| Federal Government Employees | 32 | 0.6% |
| Unpaid Family Workers | 0 | 0.0% |
| Total | 5,136 | 100.0% |
Employment Status by Age in Waverly
According to the labor force statistics for Waverly, out of the total population over 16 years of age (8,525), 65.3% or 5,567 individuals are in the labor force, with 2.7% or 150 of them unemployed. The age group with the highest labor force participation rate is 35 to 44 years, with 92.5% or 1,095 individuals in the labor force. Within the labor force, the 16 to 19 years age range has the highest percentage of unemployed individuals, with 10.1% or 45 of them being unemployed.
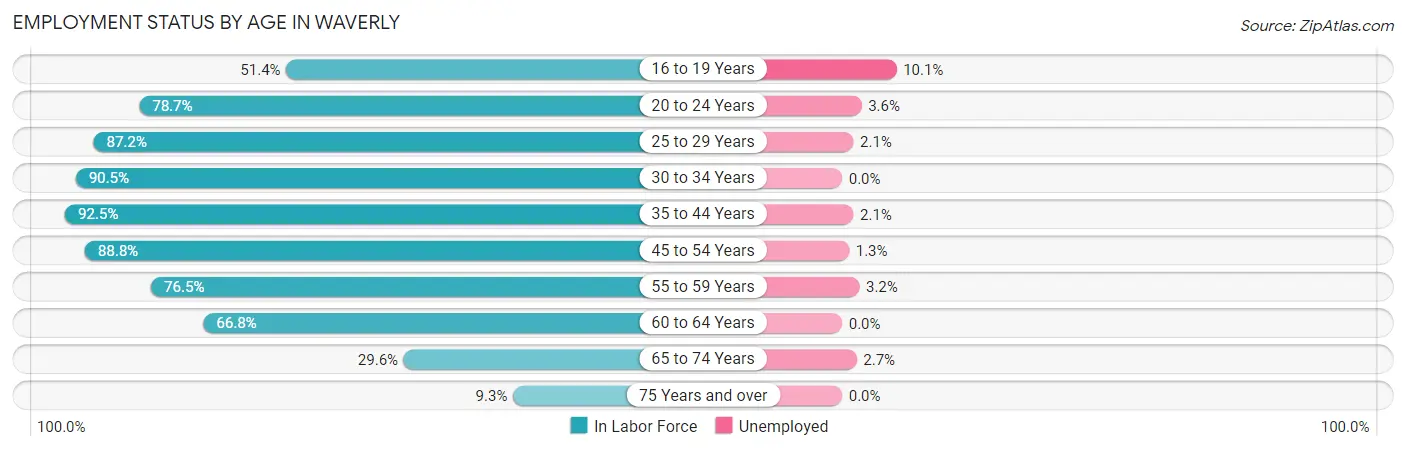
| Age Bracket | In Labor Force | Unemployed |
| 16 to 19 Years | 446 (51.4%) | 45 (10.1%) |
| 20 to 24 Years | 1,081 (78.7%) | 39 (3.6%) |
| 25 to 29 Years | 560 (87.2%) | 12 (2.1%) |
| 30 to 34 Years | 486 (90.5%) | 0 (0.0%) |
| 35 to 44 Years | 1,095 (92.5%) | 23 (2.1%) |
| 45 to 54 Years | 755 (88.8%) | 10 (1.3%) |
| 55 to 59 Years | 403 (76.5%) | 13 (3.2%) |
| 60 to 64 Years | 344 (66.8%) | 0 (0.0%) |
| 65 to 74 Years | 300 (29.6%) | 8 (2.7%) |
| 75 Years and over | 95 (9.3%) | 0 (0.0%) |
| Total | 5,567 (65.3%) | 150 (2.7%) |
Employment Status by Educational Attainment in Waverly
According to labor force statistics for Waverly, 85.6% of individuals (3,642) out of the total population between 25 and 64 years of age (4,255) are in the labor force, with 1.6% or 58 of them being unemployed. The group with the highest labor force participation rate are those with the educational attainment of college / associate degree, with 90.0% or 1,138 individuals in the labor force. Within the labor force, individuals with high school diploma education have the highest percentage of unemployment, with 6.0% or 35 of them being unemployed.
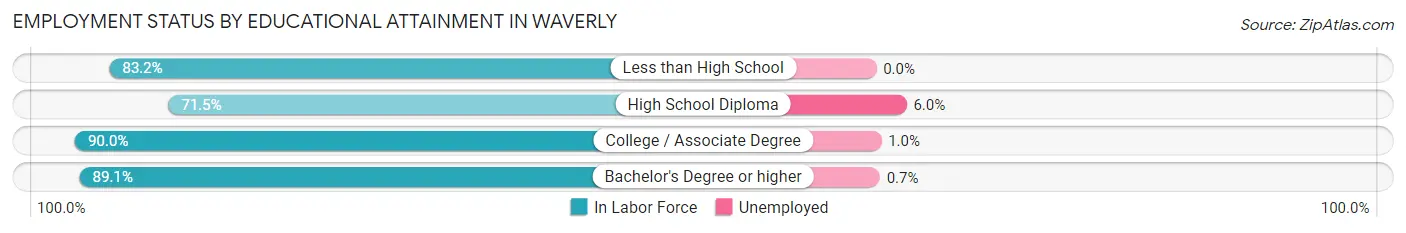
| Educational Attainment | In Labor Force | Unemployed |
| Less than High School | 193 (83.2%) | 0 (0.0%) |
| High School Diploma | 587 (71.5%) | 49 (6.0%) |
| College / Associate Degree | 1,138 (90.0%) | 13 (1.0%) |
| Bachelor's Degree or higher | 1,726 (89.1%) | 14 (0.7%) |
| Total | 3,642 (85.6%) | 68 (1.6%) |
Employment Occupations by Sex in Waverly
Management, Business, Science and Arts Occupations
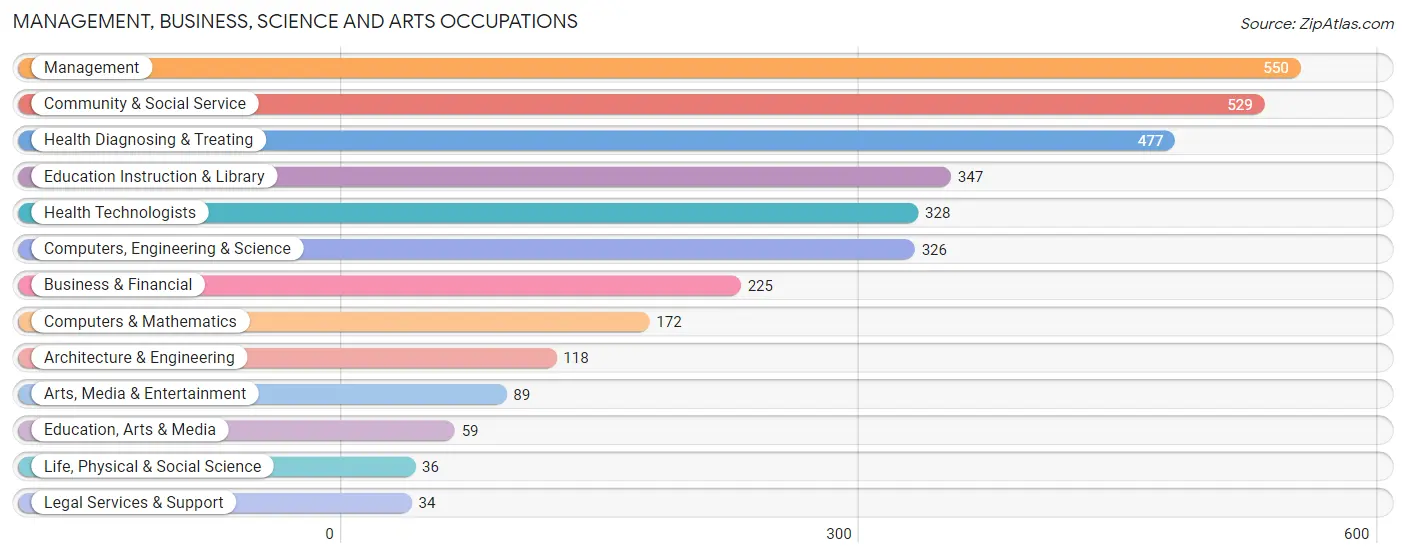
The most common Management, Business, Science and Arts occupations in Waverly are Management (550 | 10.2%), Community & Social Service (529 | 9.8%), Health Diagnosing & Treating (477 | 8.8%), Education Instruction & Library (347 | 6.4%), and Health Technologists (328 | 6.1%).
Management, Business, Science and Arts Occupations by Sex
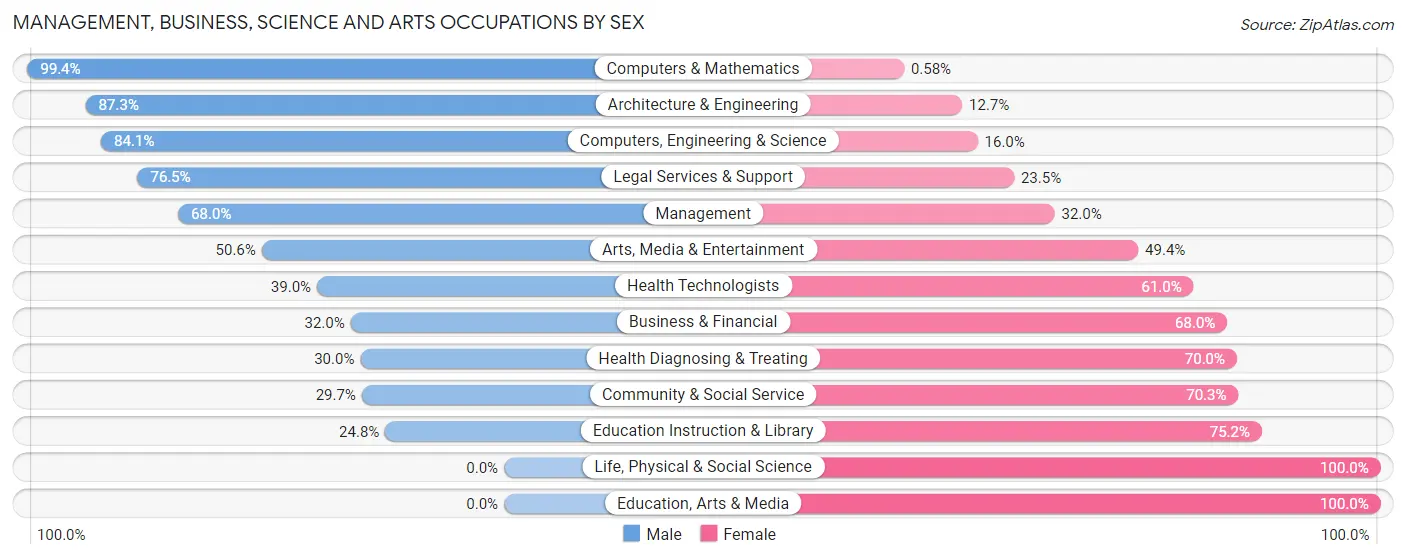
Within the Management, Business, Science and Arts occupations in Waverly, the most male-oriented occupations are Computers & Mathematics (99.4%), Architecture & Engineering (87.3%), and Computers, Engineering & Science (84.1%), while the most female-oriented occupations are Life, Physical & Social Science (100.0%), Education, Arts & Media (100.0%), and Education Instruction & Library (75.2%).
| Occupation | Male | Female |
| Management | 374 (68.0%) | 176 (32.0%) |
| Business & Financial | 72 (32.0%) | 153 (68.0%) |
| Computers, Engineering & Science | 274 (84.1%) | 52 (16.0%) |
| Computers & Mathematics | 171 (99.4%) | 1 (0.6%) |
| Architecture & Engineering | 103 (87.3%) | 15 (12.7%) |
| Life, Physical & Social Science | 0 (0.0%) | 36 (100.0%) |
| Community & Social Service | 157 (29.7%) | 372 (70.3%) |
| Education, Arts & Media | 0 (0.0%) | 59 (100.0%) |
| Legal Services & Support | 26 (76.5%) | 8 (23.5%) |
| Education Instruction & Library | 86 (24.8%) | 261 (75.2%) |
| Arts, Media & Entertainment | 45 (50.6%) | 44 (49.4%) |
| Health Diagnosing & Treating | 143 (30.0%) | 334 (70.0%) |
| Health Technologists | 128 (39.0%) | 200 (61.0%) |
| Total (Category) | 1,020 (48.4%) | 1,087 (51.6%) |
| Total (Overall) | 2,791 (51.5%) | 2,624 (48.5%) |
Services Occupations
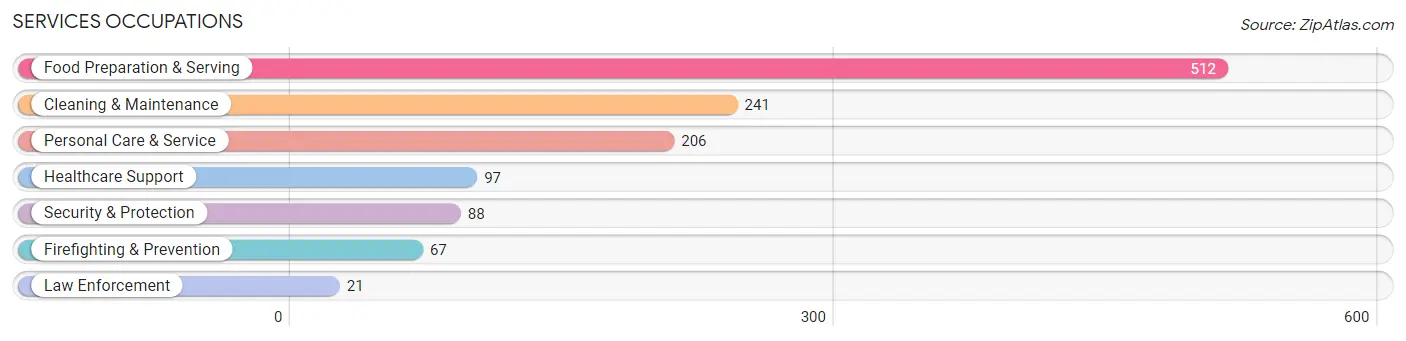
The most common Services occupations in Waverly are Food Preparation & Serving (512 | 9.5%), Cleaning & Maintenance (241 | 4.4%), Personal Care & Service (206 | 3.8%), Healthcare Support (97 | 1.8%), and Security & Protection (88 | 1.6%).
Services Occupations by Sex
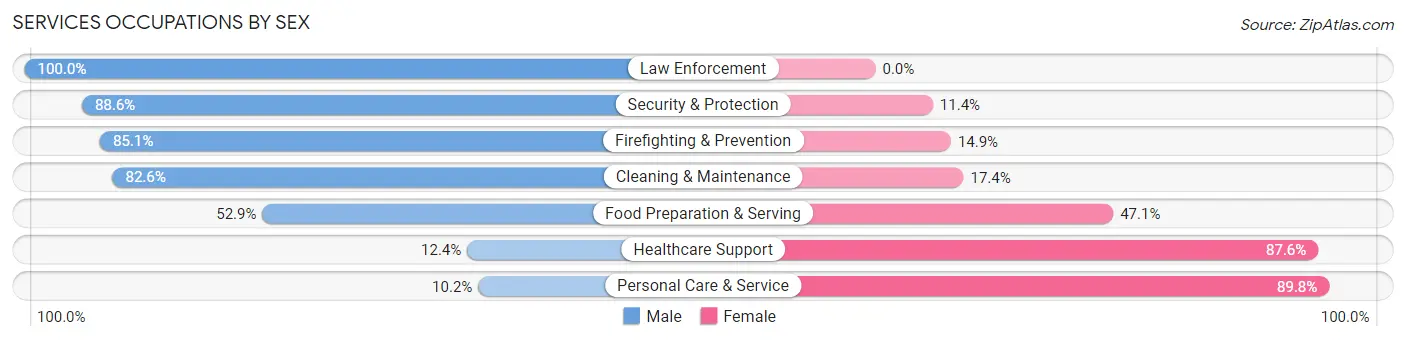
Within the Services occupations in Waverly, the most male-oriented occupations are Law Enforcement (100.0%), Security & Protection (88.6%), and Firefighting & Prevention (85.1%), while the most female-oriented occupations are Personal Care & Service (89.8%), Healthcare Support (87.6%), and Food Preparation & Serving (47.1%).
| Occupation | Male | Female |
| Healthcare Support | 12 (12.4%) | 85 (87.6%) |
| Security & Protection | 78 (88.6%) | 10 (11.4%) |
| Firefighting & Prevention | 57 (85.1%) | 10 (14.9%) |
| Law Enforcement | 21 (100.0%) | 0 (0.0%) |
| Food Preparation & Serving | 271 (52.9%) | 241 (47.1%) |
| Cleaning & Maintenance | 199 (82.6%) | 42 (17.4%) |
| Personal Care & Service | 21 (10.2%) | 185 (89.8%) |
| Total (Category) | 581 (50.8%) | 563 (49.2%) |
| Total (Overall) | 2,791 (51.5%) | 2,624 (48.5%) |
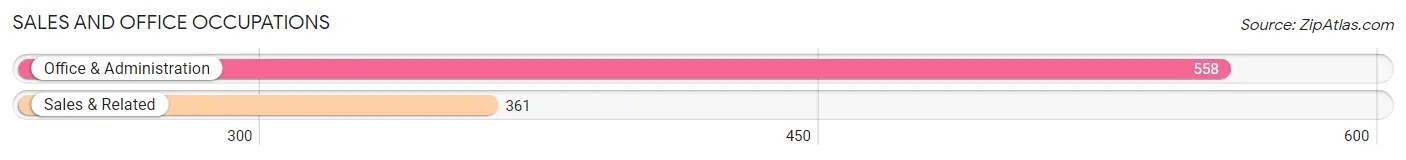
Sales and Office Occupations
The most common Sales and Office occupations in Waverly are Office & Administration (558 | 10.3%), and Sales & Related (361 | 6.7%).
Sales and Office Occupations by Sex
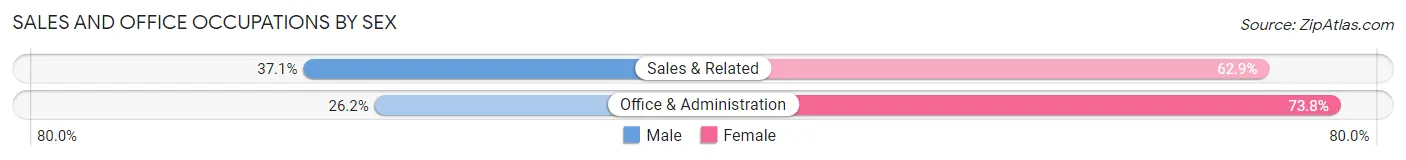
| Occupation | Male | Female |
| Sales & Related | 134 (37.1%) | 227 (62.9%) |
| Office & Administration | 146 (26.2%) | 412 (73.8%) |
| Total (Category) | 280 (30.5%) | 639 (69.5%) |
| Total (Overall) | 2,791 (51.5%) | 2,624 (48.5%) |
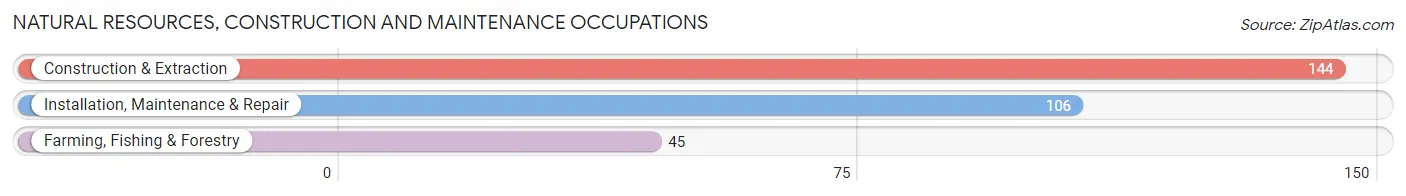
Natural Resources, Construction and Maintenance Occupations
The most common Natural Resources, Construction and Maintenance occupations in Waverly are Construction & Extraction (144 | 2.7%), Installation, Maintenance & Repair (106 | 2.0%), and Farming, Fishing & Forestry (45 | 0.8%).
Natural Resources, Construction and Maintenance Occupations by Sex
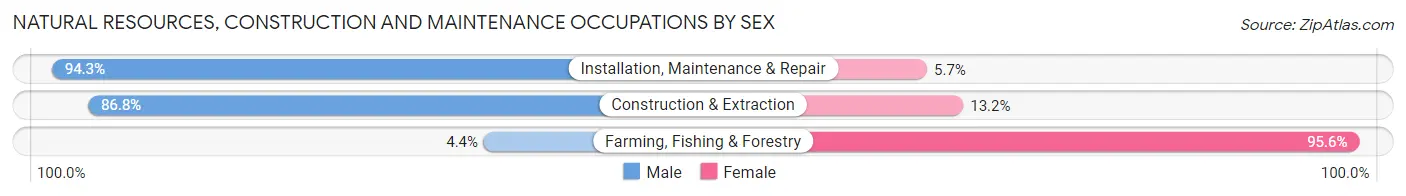
| Occupation | Male | Female |
| Farming, Fishing & Forestry | 2 (4.4%) | 43 (95.6%) |
| Construction & Extraction | 125 (86.8%) | 19 (13.2%) |
| Installation, Maintenance & Repair | 100 (94.3%) | 6 (5.7%) |
| Total (Category) | 227 (76.9%) | 68 (23.1%) |
| Total (Overall) | 2,791 (51.5%) | 2,624 (48.5%) |
Production, Transportation and Moving Occupations
The most common Production, Transportation and Moving occupations in Waverly are Production (398 | 7.3%), Transportation (325 | 6.0%), and Material Moving (227 | 4.2%).
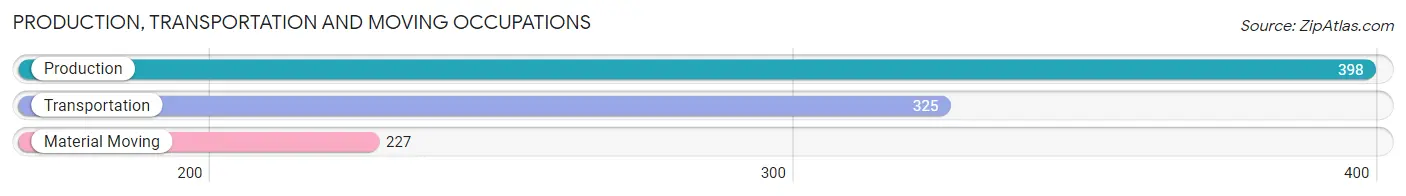
Production, Transportation and Moving Occupations by Sex
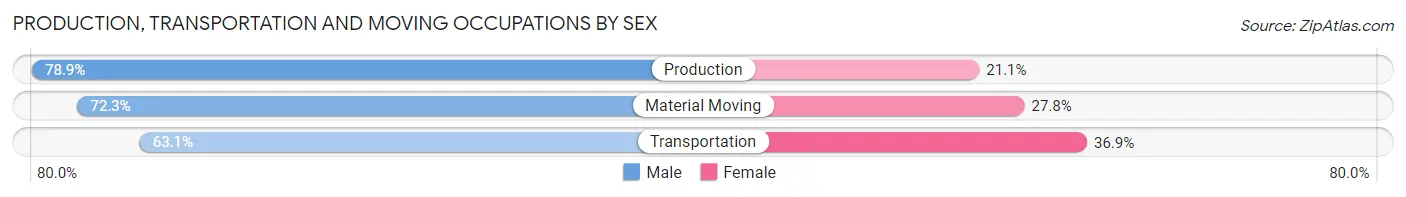
| Occupation | Male | Female |
| Production | 314 (78.9%) | 84 (21.1%) |
| Transportation | 205 (63.1%) | 120 (36.9%) |
| Material Moving | 164 (72.3%) | 63 (27.8%) |
| Total (Category) | 683 (71.9%) | 267 (28.1%) |
| Total (Overall) | 2,791 (51.5%) | 2,624 (48.5%) |
Employment Industries by Sex in Waverly
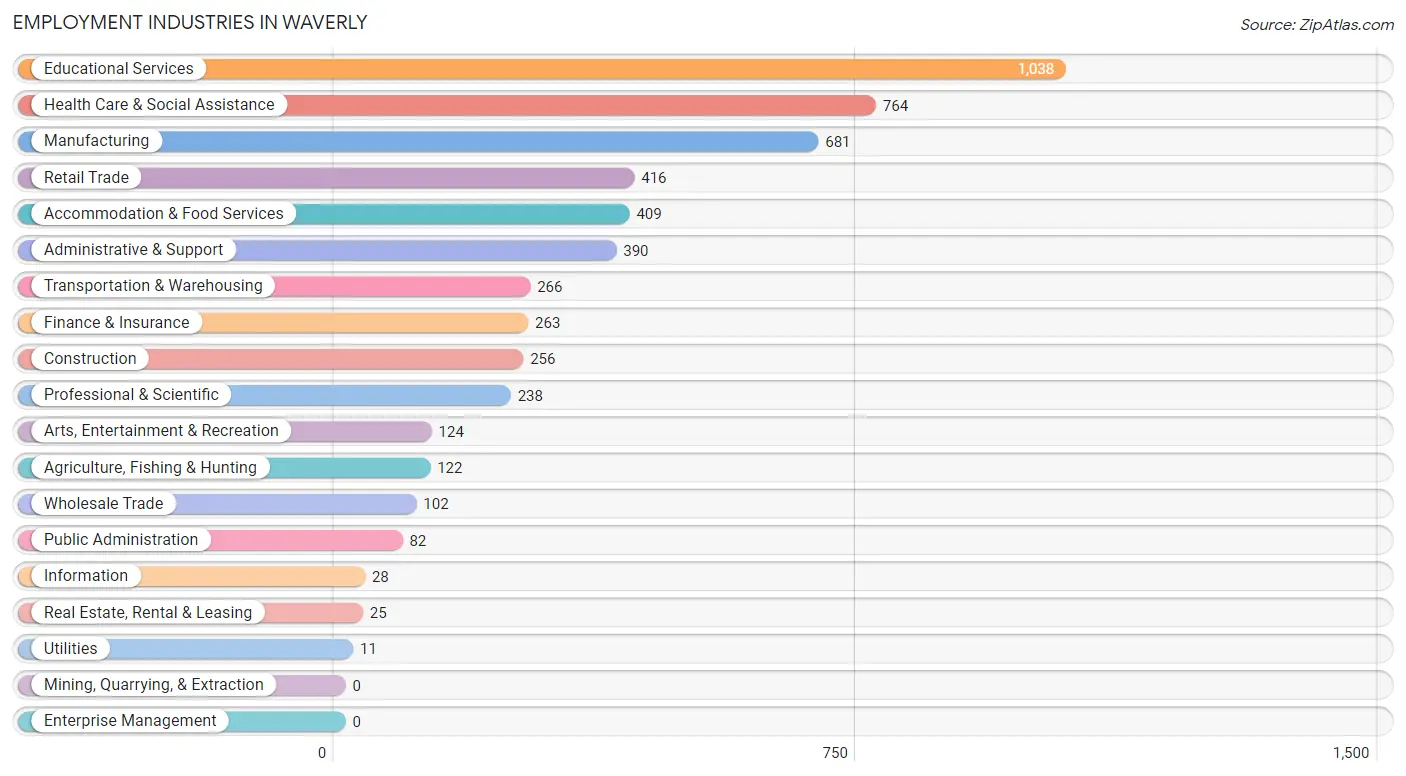
Employment Industries in Waverly
The major employment industries in Waverly include Educational Services (1,038 | 19.2%), Health Care & Social Assistance (764 | 14.1%), Manufacturing (681 | 12.6%), Retail Trade (416 | 7.7%), and Accommodation & Food Services (409 | 7.5%).
Employment Industries by Sex in Waverly
The Waverly industries that see more men than women are Utilities (100.0%), Arts, Entertainment & Recreation (95.2%), and Manufacturing (85.0%), whereas the industries that tend to have a higher number of women are Information (100.0%), Health Care & Social Assistance (81.1%), and Real Estate, Rental & Leasing (68.0%).
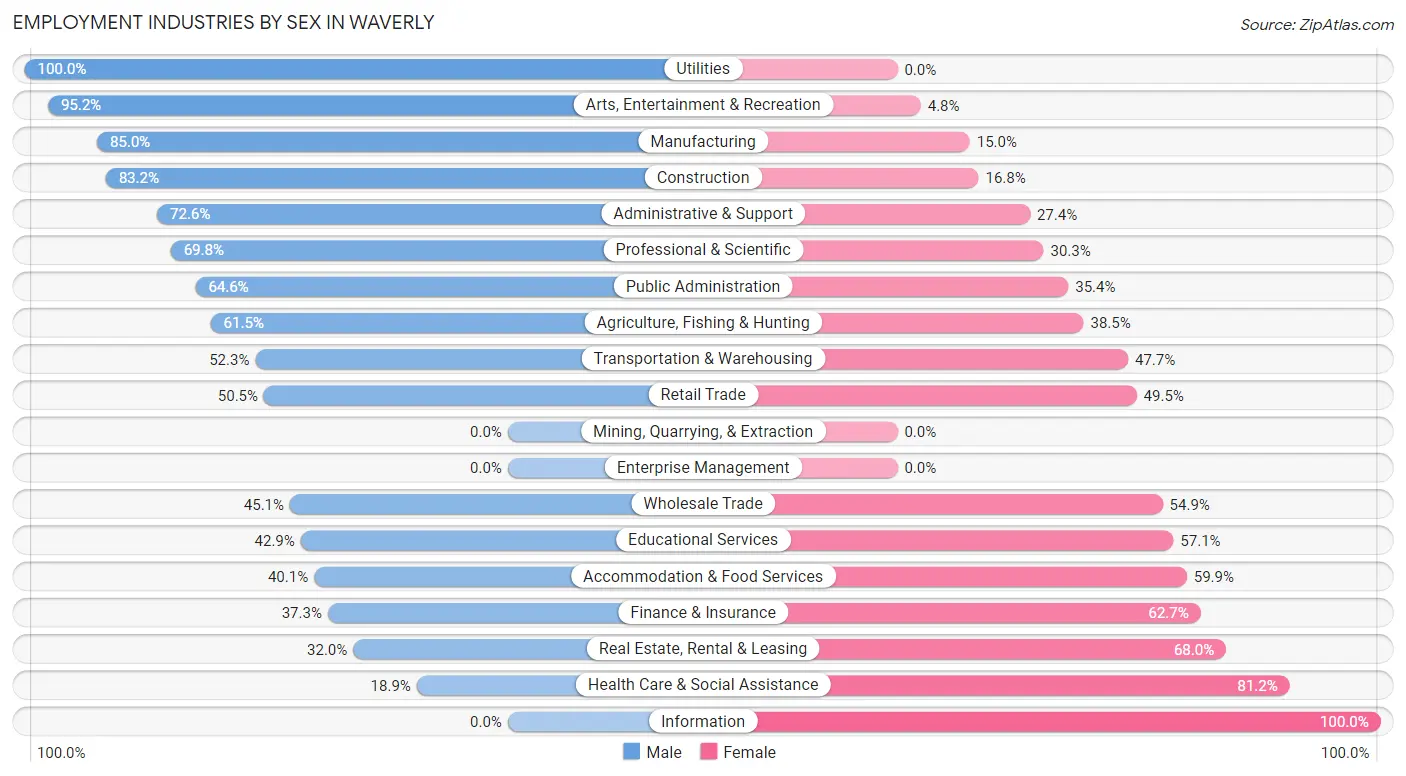
| Industry | Male | Female |
| Agriculture, Fishing & Hunting | 75 (61.5%) | 47 (38.5%) |
| Mining, Quarrying, & Extraction | 0 (0.0%) | 0 (0.0%) |
| Construction | 213 (83.2%) | 43 (16.8%) |
| Manufacturing | 579 (85.0%) | 102 (15.0%) |
| Wholesale Trade | 46 (45.1%) | 56 (54.9%) |
| Retail Trade | 210 (50.5%) | 206 (49.5%) |
| Transportation & Warehousing | 139 (52.3%) | 127 (47.7%) |
| Utilities | 11 (100.0%) | 0 (0.0%) |
| Information | 0 (0.0%) | 28 (100.0%) |
| Finance & Insurance | 98 (37.3%) | 165 (62.7%) |
| Real Estate, Rental & Leasing | 8 (32.0%) | 17 (68.0%) |
| Professional & Scientific | 166 (69.8%) | 72 (30.2%) |
| Enterprise Management | 0 (0.0%) | 0 (0.0%) |
| Administrative & Support | 283 (72.6%) | 107 (27.4%) |
| Educational Services | 445 (42.9%) | 593 (57.1%) |
| Health Care & Social Assistance | 144 (18.9%) | 620 (81.1%) |
| Arts, Entertainment & Recreation | 118 (95.2%) | 6 (4.8%) |
| Accommodation & Food Services | 164 (40.1%) | 245 (59.9%) |
| Public Administration | 53 (64.6%) | 29 (35.4%) |
| Total | 2,791 (51.5%) | 2,624 (48.5%) |
Education in Waverly
School Enrollment in Waverly
The most common levels of schooling among the 3,394 students in Waverly are college / undergraduate (1,606 | 47.3%), high school (474 | 14.0%), and middle school (449 | 13.2%).
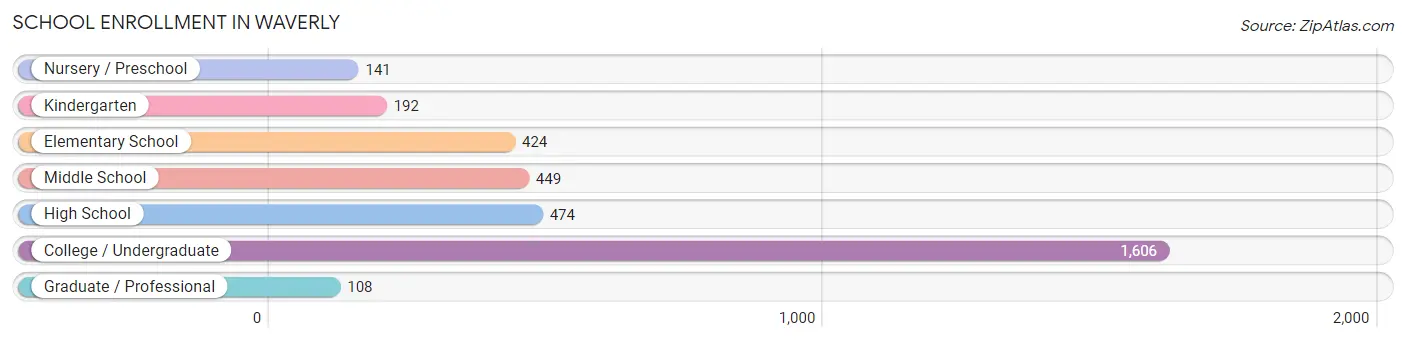
| School Level | # Students | % Students |
| Nursery / Preschool | 141 | 4.2% |
| Kindergarten | 192 | 5.7% |
| Elementary School | 424 | 12.5% |
| Middle School | 449 | 13.2% |
| High School | 474 | 14.0% |
| College / Undergraduate | 1,606 | 47.3% |
| Graduate / Professional | 108 | 3.2% |
| Total | 3,394 | 100.0% |
School Enrollment by Age by Funding Source in Waverly
Out of a total of 3,394 students who are enrolled in schools in Waverly, 1,683 (49.6%) attend a private institution, while the remaining 1,711 (50.4%) are enrolled in public schools. The age group of 20 to 24 year olds has the highest likelihood of being enrolled in private schools, with 882 (88.6% in the age bracket) enrolled. Conversely, the age group of 15 to 17 year olds has the lowest likelihood of being enrolled in a private school, with 368 (97.9% in the age bracket) attending a public institution.
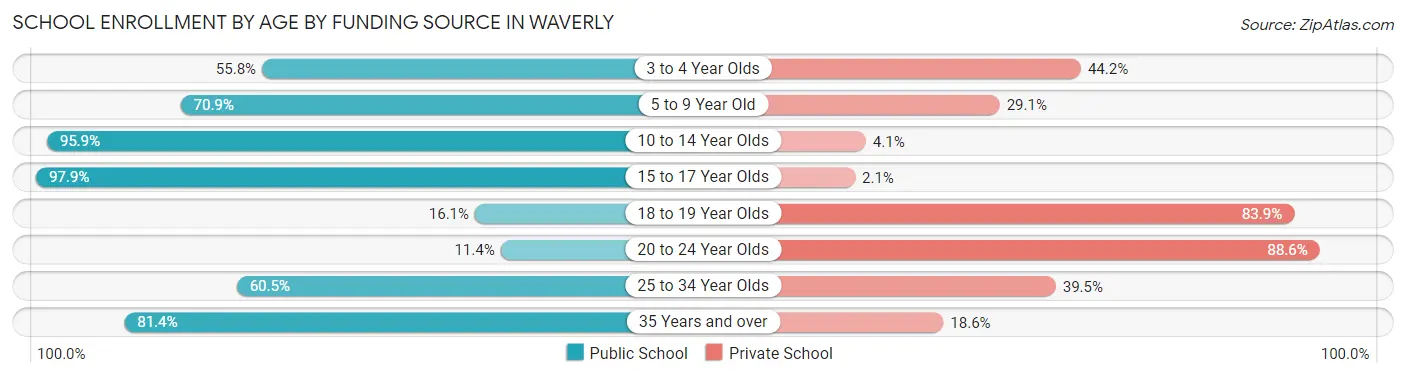
| Age Bracket | Public School | Private School |
| 3 to 4 Year Olds | 77 (55.8%) | 61 (44.2%) |
| 5 to 9 Year Old | 383 (70.9%) | 157 (29.1%) |
| 10 to 14 Year Olds | 533 (95.9%) | 23 (4.1%) |
| 15 to 17 Year Olds | 368 (97.9%) | 8 (2.1%) |
| 18 to 19 Year Olds | 96 (16.1%) | 499 (83.9%) |
| 20 to 24 Year Olds | 113 (11.4%) | 882 (88.6%) |
| 25 to 34 Year Olds | 49 (60.5%) | 32 (39.5%) |
| 35 Years and over | 92 (81.4%) | 21 (18.6%) |
| Total | 1,711 (50.4%) | 1,683 (49.6%) |
Educational Attainment by Field of Study in Waverly
Education (650 | 23.2%), business (424 | 15.1%), science & technology (341 | 12.2%), bio, nature & agricultural (291 | 10.4%), and communications (196 | 7.0%) are the most common fields of study among 2,804 individuals in Waverly who have obtained a bachelor's degree or higher.
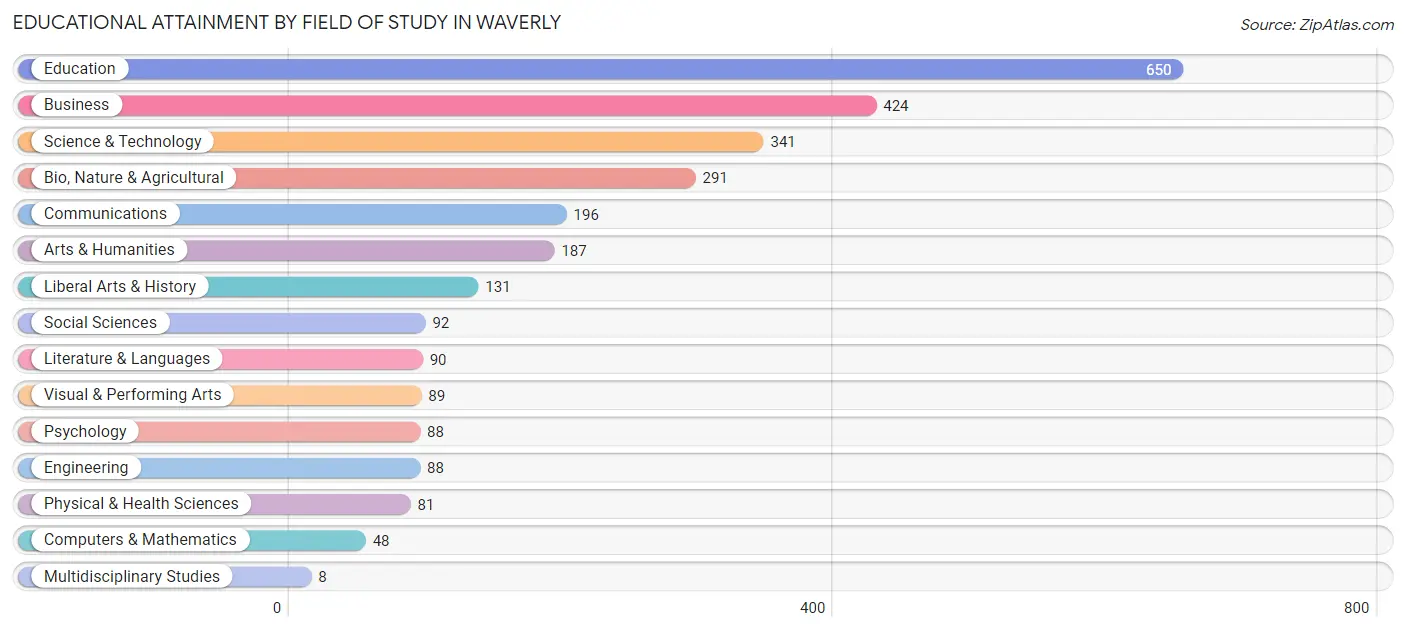
| Field of Study | # Graduates | % Graduates |
| Computers & Mathematics | 48 | 1.7% |
| Bio, Nature & Agricultural | 291 | 10.4% |
| Physical & Health Sciences | 81 | 2.9% |
| Psychology | 88 | 3.1% |
| Social Sciences | 92 | 3.3% |
| Engineering | 88 | 3.1% |
| Multidisciplinary Studies | 8 | 0.3% |
| Science & Technology | 341 | 12.2% |
| Business | 424 | 15.1% |
| Education | 650 | 23.2% |
| Literature & Languages | 90 | 3.2% |
| Liberal Arts & History | 131 | 4.7% |
| Visual & Performing Arts | 89 | 3.2% |
| Communications | 196 | 7.0% |
| Arts & Humanities | 187 | 6.7% |
| Total | 2,804 | 100.0% |
Transportation & Commute in Waverly
Vehicle Availability by Sex in Waverly
The most prevalent vehicle ownership categories in Waverly are males with 2 vehicles (1,159, accounting for 51.3%) and females with 2 vehicles (1,029, making up 51.4%).
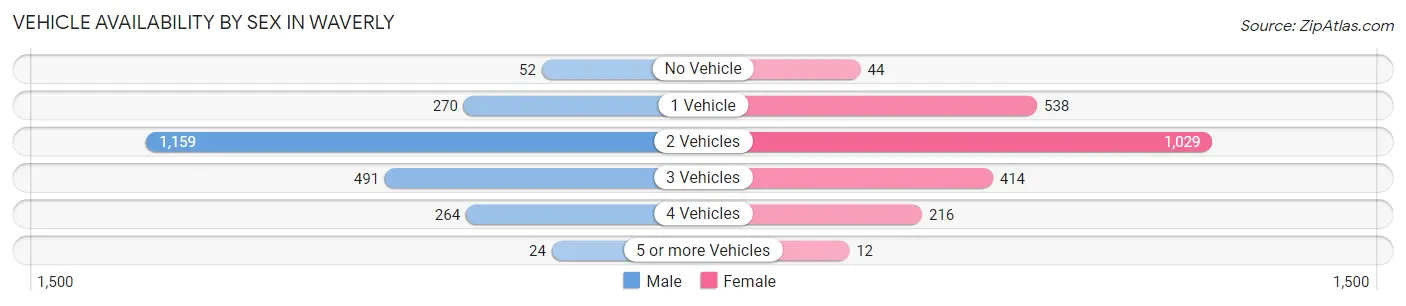
| Vehicles Available | Male | Female |
| No Vehicle | 52 (2.3%) | 44 (1.9%) |
| 1 Vehicle | 270 (11.9%) | 538 (23.9%) |
| 2 Vehicles | 1,159 (51.3%) | 1,029 (45.7%) |
| 3 Vehicles | 491 (21.7%) | 414 (18.4%) |
| 4 Vehicles | 264 (11.7%) | 216 (9.6%) |
| 5 or more Vehicles | 24 (1.1%) | 12 (0.5%) |
| Total | 2,260 (100.0%) | 2,253 (100.0%) |
Commute Time in Waverly
The most frequently occuring commute durations in Waverly are 5 to 9 minutes (1,212 commuters, 25.9%), less than 5 minutes (776 commuters, 16.6%), and 10 to 14 minutes (734 commuters, 15.7%).
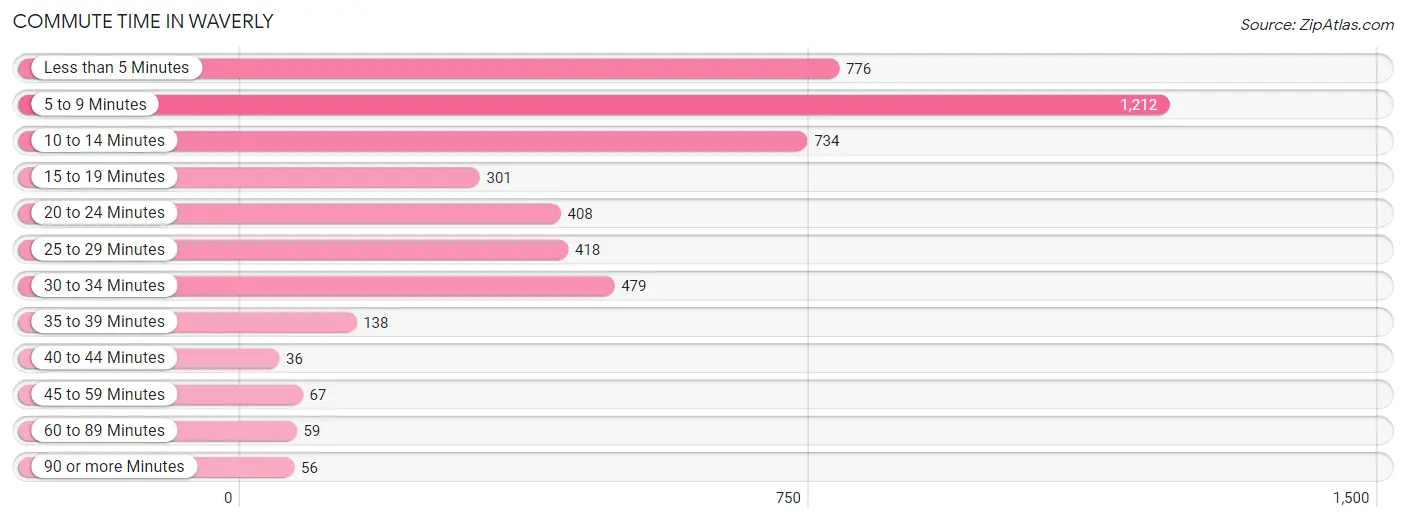
| Commute Time | # Commuters | % Commuters |
| Less than 5 Minutes | 776 | 16.6% |
| 5 to 9 Minutes | 1,212 | 25.9% |
| 10 to 14 Minutes | 734 | 15.7% |
| 15 to 19 Minutes | 301 | 6.4% |
| 20 to 24 Minutes | 408 | 8.7% |
| 25 to 29 Minutes | 418 | 8.9% |
| 30 to 34 Minutes | 479 | 10.2% |
| 35 to 39 Minutes | 138 | 2.9% |
| 40 to 44 Minutes | 36 | 0.8% |
| 45 to 59 Minutes | 67 | 1.4% |
| 60 to 89 Minutes | 59 | 1.3% |
| 90 or more Minutes | 56 | 1.2% |
Commute Time by Sex in Waverly
The most common commute times in Waverly are 5 to 9 minutes (634 commuters, 26.1%) for males and 5 to 9 minutes (578 commuters, 25.7%) for females.
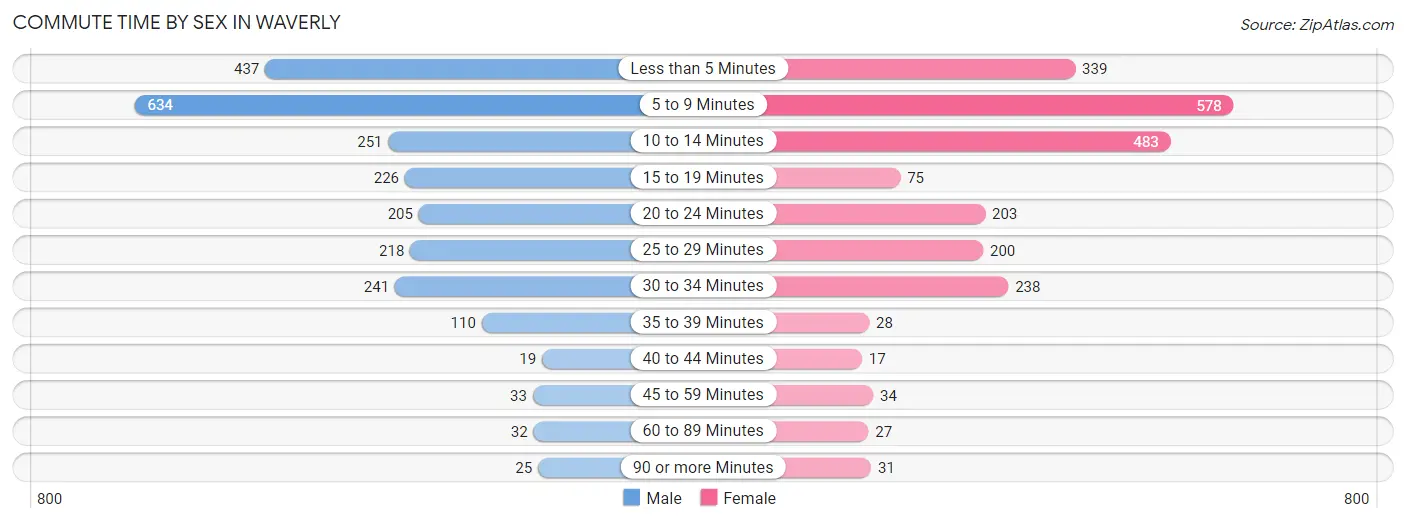
| Commute Time | Male | Female |
| Less than 5 Minutes | 437 (18.0%) | 339 (15.0%) |
| 5 to 9 Minutes | 634 (26.1%) | 578 (25.7%) |
| 10 to 14 Minutes | 251 (10.3%) | 483 (21.4%) |
| 15 to 19 Minutes | 226 (9.3%) | 75 (3.3%) |
| 20 to 24 Minutes | 205 (8.4%) | 203 (9.0%) |
| 25 to 29 Minutes | 218 (9.0%) | 200 (8.9%) |
| 30 to 34 Minutes | 241 (9.9%) | 238 (10.6%) |
| 35 to 39 Minutes | 110 (4.5%) | 28 (1.2%) |
| 40 to 44 Minutes | 19 (0.8%) | 17 (0.7%) |
| 45 to 59 Minutes | 33 (1.4%) | 34 (1.5%) |
| 60 to 89 Minutes | 32 (1.3%) | 27 (1.2%) |
| 90 or more Minutes | 25 (1.0%) | 31 (1.4%) |
Time of Departure to Work by Sex in Waverly
The most frequent times of departure to work in Waverly are 7:30 AM to 7:59 AM (345, 14.2%) for males and 7:30 AM to 7:59 AM (312, 13.9%) for females.
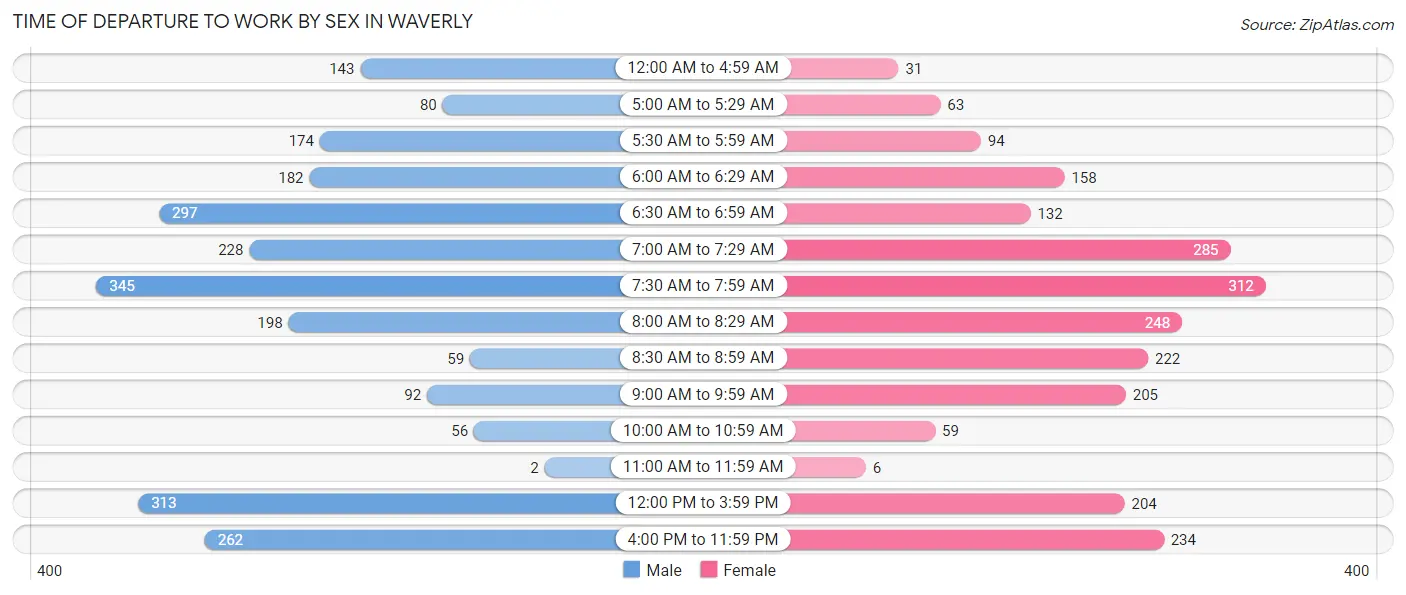
| Time of Departure | Male | Female |
| 12:00 AM to 4:59 AM | 143 (5.9%) | 31 (1.4%) |
| 5:00 AM to 5:29 AM | 80 (3.3%) | 63 (2.8%) |
| 5:30 AM to 5:59 AM | 174 (7.2%) | 94 (4.2%) |
| 6:00 AM to 6:29 AM | 182 (7.5%) | 158 (7.0%) |
| 6:30 AM to 6:59 AM | 297 (12.2%) | 132 (5.9%) |
| 7:00 AM to 7:29 AM | 228 (9.4%) | 285 (12.7%) |
| 7:30 AM to 7:59 AM | 345 (14.2%) | 312 (13.9%) |
| 8:00 AM to 8:29 AM | 198 (8.1%) | 248 (11.0%) |
| 8:30 AM to 8:59 AM | 59 (2.4%) | 222 (9.9%) |
| 9:00 AM to 9:59 AM | 92 (3.8%) | 205 (9.1%) |
| 10:00 AM to 10:59 AM | 56 (2.3%) | 59 (2.6%) |
| 11:00 AM to 11:59 AM | 2 (0.1%) | 6 (0.3%) |
| 12:00 PM to 3:59 PM | 313 (12.9%) | 204 (9.0%) |
| 4:00 PM to 11:59 PM | 262 (10.8%) | 234 (10.4%) |
| Total | 2,431 (100.0%) | 2,253 (100.0%) |
Housing Occupancy in Waverly
Occupancy by Ownership in Waverly
Of the total 3,788 dwellings in Waverly, owner-occupied units account for 2,894 (76.4%), while renter-occupied units make up 894 (23.6%).
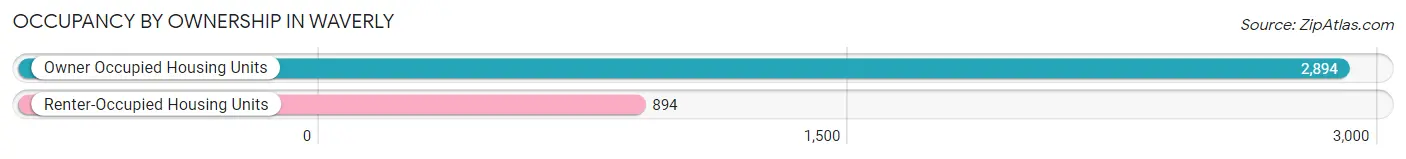
| Occupancy | # Housing Units | % Housing Units |
| Owner Occupied Housing Units | 2,894 | 76.4% |
| Renter-Occupied Housing Units | 894 | 23.6% |
| Total Occupied Housing Units | 3,788 | 100.0% |
Occupancy by Household Size in Waverly
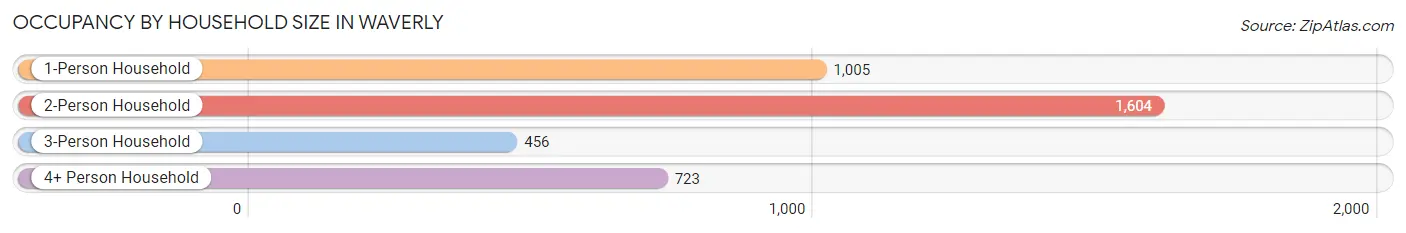
| Household Size | # Housing Units | % Housing Units |
| 1-Person Household | 1,005 | 26.5% |
| 2-Person Household | 1,604 | 42.3% |
| 3-Person Household | 456 | 12.0% |
| 4+ Person Household | 723 | 19.1% |
| Total Housing Units | 3,788 | 100.0% |
Occupancy by Ownership by Household Size in Waverly
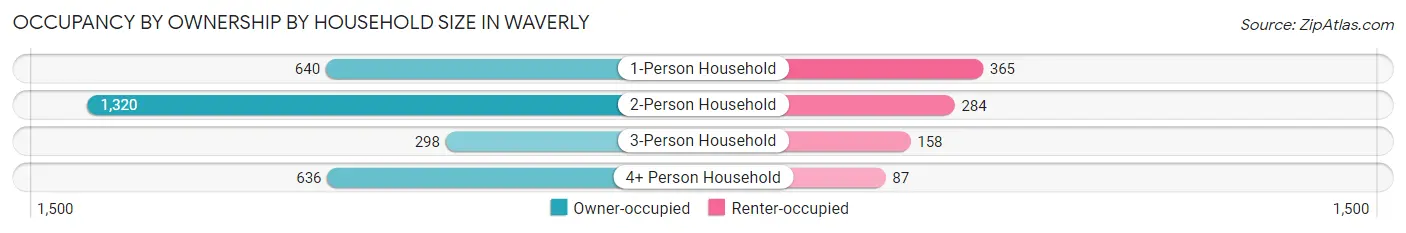
| Household Size | Owner-occupied | Renter-occupied |
| 1-Person Household | 640 (63.7%) | 365 (36.3%) |
| 2-Person Household | 1,320 (82.3%) | 284 (17.7%) |
| 3-Person Household | 298 (65.3%) | 158 (34.6%) |
| 4+ Person Household | 636 (88.0%) | 87 (12.0%) |
| Total Housing Units | 2,894 (76.4%) | 894 (23.6%) |
Occupancy by Educational Attainment in Waverly
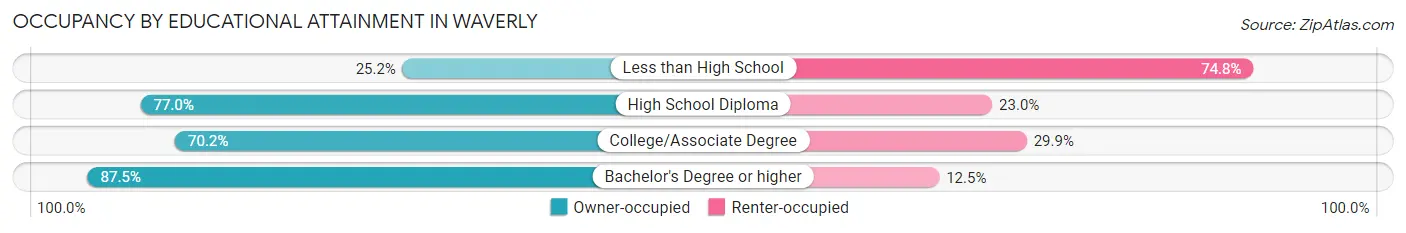
| Household Size | Owner-occupied | Renter-occupied |
| Less than High School | 53 (25.2%) | 157 (74.8%) |
| High School Diploma | 616 (77.0%) | 184 (23.0%) |
| College/Associate Degree | 832 (70.2%) | 354 (29.8%) |
| Bachelor's Degree or higher | 1,393 (87.5%) | 199 (12.5%) |
Occupancy by Age of Householder in Waverly
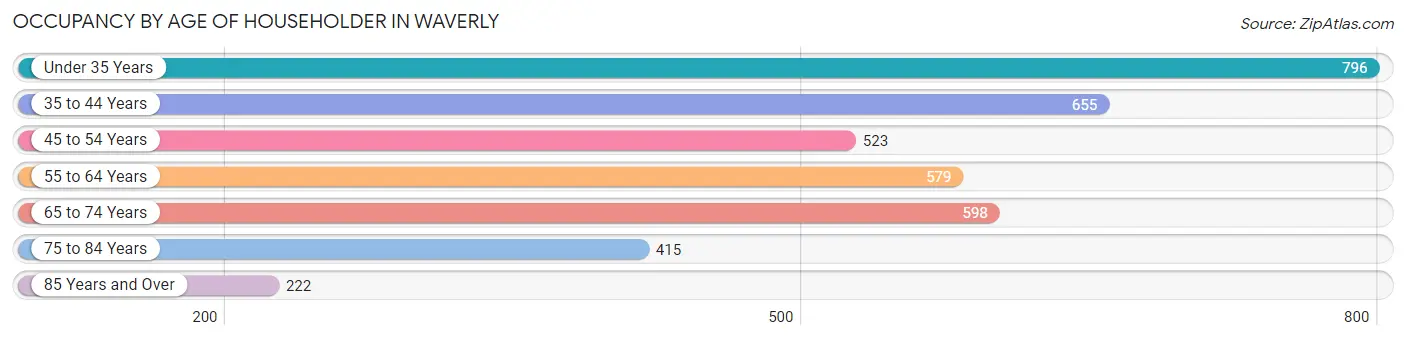
| Age Bracket | # Households | % Households |
| Under 35 Years | 796 | 21.0% |
| 35 to 44 Years | 655 | 17.3% |
| 45 to 54 Years | 523 | 13.8% |
| 55 to 64 Years | 579 | 15.3% |
| 65 to 74 Years | 598 | 15.8% |
| 75 to 84 Years | 415 | 11.0% |
| 85 Years and Over | 222 | 5.9% |
| Total | 3,788 | 100.0% |
Housing Finances in Waverly
Median Income by Occupancy in Waverly
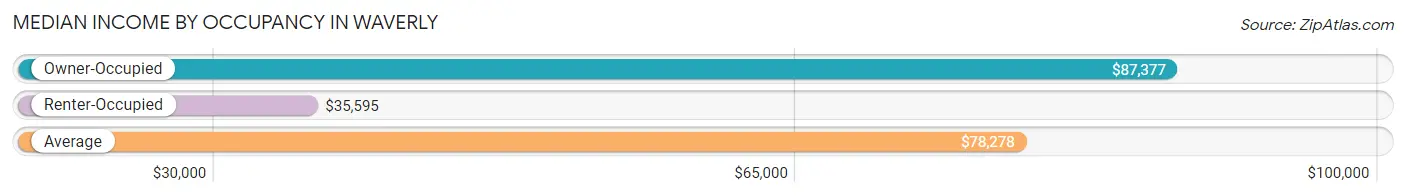
| Occupancy Type | # Households | Median Income |
| Owner-Occupied | 2,894 (76.4%) | $87,377 |
| Renter-Occupied | 894 (23.6%) | $35,595 |
| Average | 3,788 (100.0%) | $78,278 |
Occupancy by Householder Income Bracket in Waverly
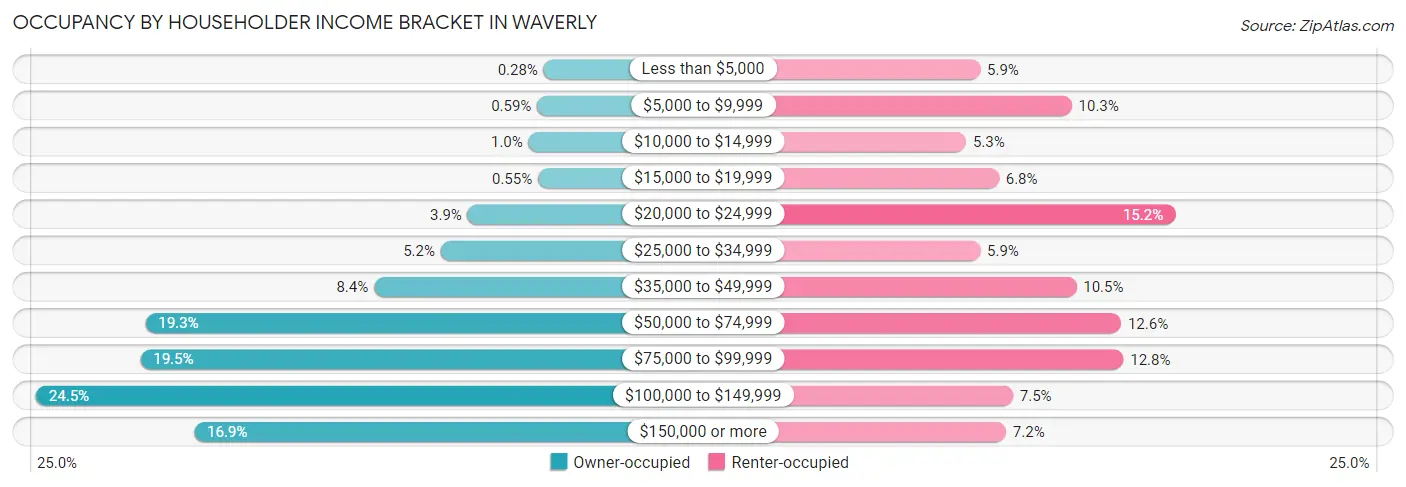
| Income Bracket | Owner-occupied | Renter-occupied |
| Less than $5,000 | 8 (0.3%) | 53 (5.9%) |
| $5,000 to $9,999 | 17 (0.6%) | 92 (10.3%) |
| $10,000 to $14,999 | 29 (1.0%) | 47 (5.3%) |
| $15,000 to $19,999 | 16 (0.5%) | 61 (6.8%) |
| $20,000 to $24,999 | 113 (3.9%) | 136 (15.2%) |
| $25,000 to $34,999 | 150 (5.2%) | 53 (5.9%) |
| $35,000 to $49,999 | 242 (8.4%) | 94 (10.5%) |
| $50,000 to $74,999 | 557 (19.3%) | 113 (12.6%) |
| $75,000 to $99,999 | 564 (19.5%) | 114 (12.8%) |
| $100,000 to $149,999 | 708 (24.5%) | 67 (7.5%) |
| $150,000 or more | 490 (16.9%) | 64 (7.2%) |
| Total | 2,894 (100.0%) | 894 (100.0%) |
Monthly Housing Cost Tiers in Waverly
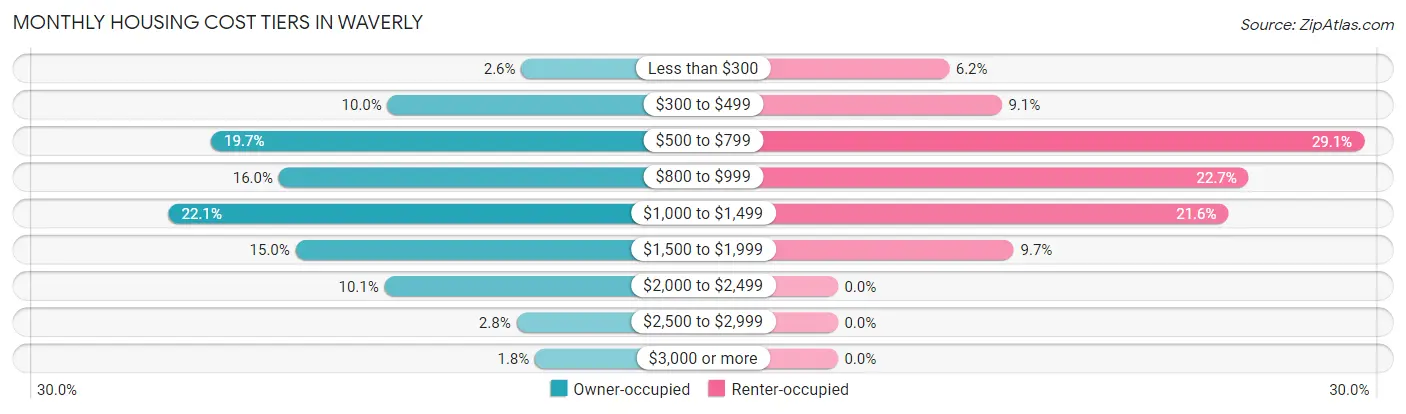
| Monthly Cost | Owner-occupied | Renter-occupied |
| Less than $300 | 74 (2.6%) | 55 (6.1%) |
| $300 to $499 | 288 (10.0%) | 81 (9.1%) |
| $500 to $799 | 570 (19.7%) | 260 (29.1%) |
| $800 to $999 | 462 (16.0%) | 203 (22.7%) |
| $1,000 to $1,499 | 638 (22.1%) | 193 (21.6%) |
| $1,500 to $1,999 | 435 (15.0%) | 87 (9.7%) |
| $2,000 to $2,499 | 293 (10.1%) | 0 (0.0%) |
| $2,500 to $2,999 | 82 (2.8%) | 0 (0.0%) |
| $3,000 or more | 52 (1.8%) | 0 (0.0%) |
| Total | 2,894 (100.0%) | 894 (100.0%) |
Physical Housing Characteristics in Waverly
Housing Structures in Waverly
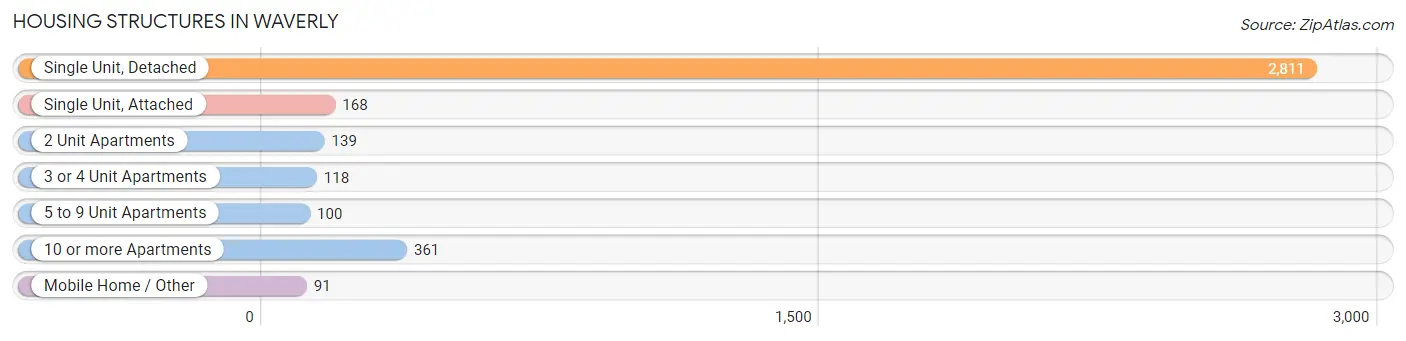
| Structure Type | # Housing Units | % Housing Units |
| Single Unit, Detached | 2,811 | 74.2% |
| Single Unit, Attached | 168 | 4.4% |
| 2 Unit Apartments | 139 | 3.7% |
| 3 or 4 Unit Apartments | 118 | 3.1% |
| 5 to 9 Unit Apartments | 100 | 2.6% |
| 10 or more Apartments | 361 | 9.5% |
| Mobile Home / Other | 91 | 2.4% |
| Total | 3,788 | 100.0% |
Housing Structures by Occupancy in Waverly
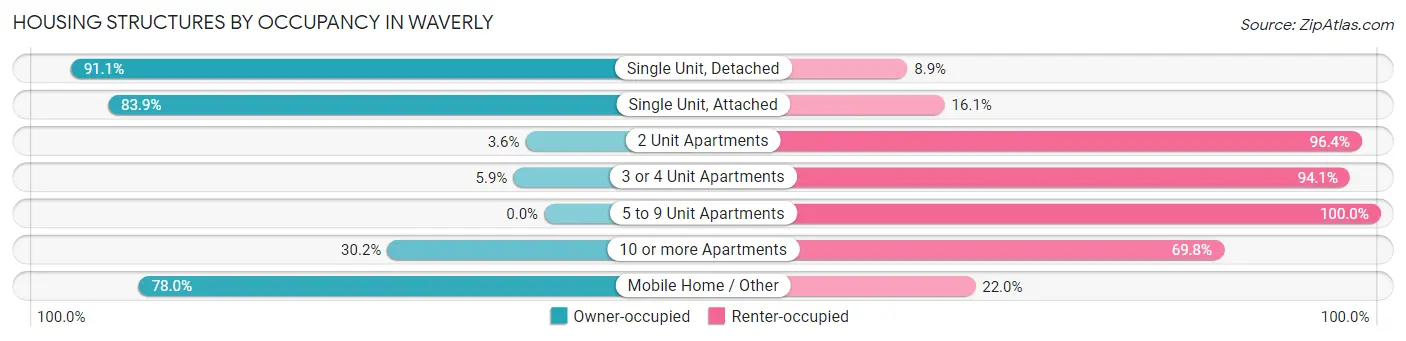
| Structure Type | Owner-occupied | Renter-occupied |
| Single Unit, Detached | 2,561 (91.1%) | 250 (8.9%) |
| Single Unit, Attached | 141 (83.9%) | 27 (16.1%) |
| 2 Unit Apartments | 5 (3.6%) | 134 (96.4%) |
| 3 or 4 Unit Apartments | 7 (5.9%) | 111 (94.1%) |
| 5 to 9 Unit Apartments | 0 (0.0%) | 100 (100.0%) |
| 10 or more Apartments | 109 (30.2%) | 252 (69.8%) |
| Mobile Home / Other | 71 (78.0%) | 20 (22.0%) |
| Total | 2,894 (76.4%) | 894 (23.6%) |
Housing Structures by Number of Rooms in Waverly
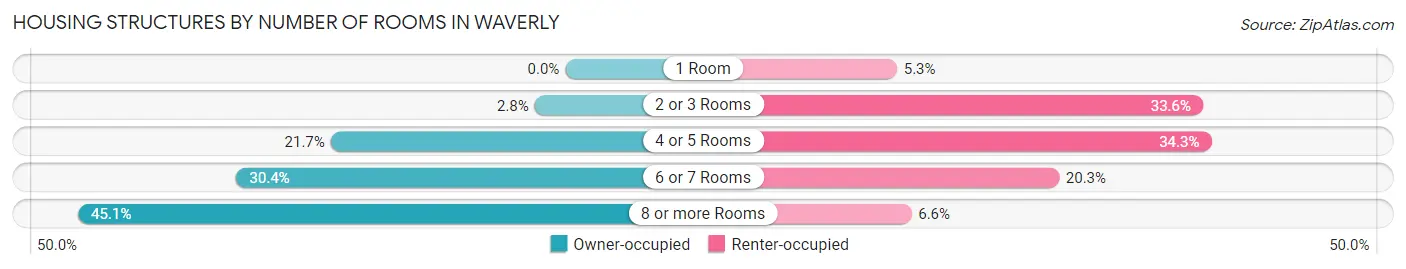
| Number of Rooms | Owner-occupied | Renter-occupied |
| 1 Room | 0 (0.0%) | 47 (5.3%) |
| 2 or 3 Rooms | 82 (2.8%) | 300 (33.6%) |
| 4 or 5 Rooms | 628 (21.7%) | 307 (34.3%) |
| 6 or 7 Rooms | 880 (30.4%) | 181 (20.3%) |
| 8 or more Rooms | 1,304 (45.1%) | 59 (6.6%) |
| Total | 2,894 (100.0%) | 894 (100.0%) |
Housing Structure by Heating Type in Waverly
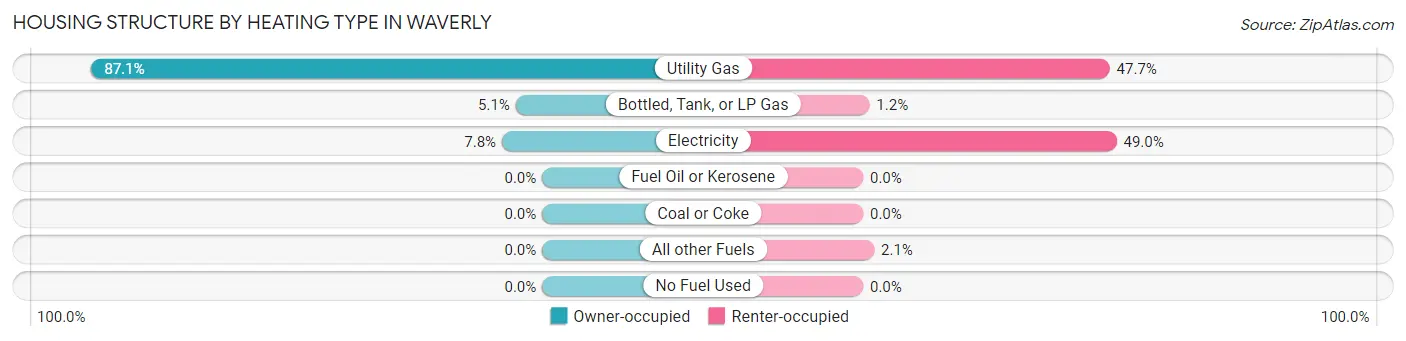
| Heating Type | Owner-occupied | Renter-occupied |
| Utility Gas | 2,521 (87.1%) | 426 (47.6%) |
| Bottled, Tank, or LP Gas | 148 (5.1%) | 11 (1.2%) |
| Electricity | 225 (7.8%) | 438 (49.0%) |
| Fuel Oil or Kerosene | 0 (0.0%) | 0 (0.0%) |
| Coal or Coke | 0 (0.0%) | 0 (0.0%) |
| All other Fuels | 0 (0.0%) | 19 (2.1%) |
| No Fuel Used | 0 (0.0%) | 0 (0.0%) |
| Total | 2,894 (100.0%) | 894 (100.0%) |
Household Vehicle Usage in Waverly
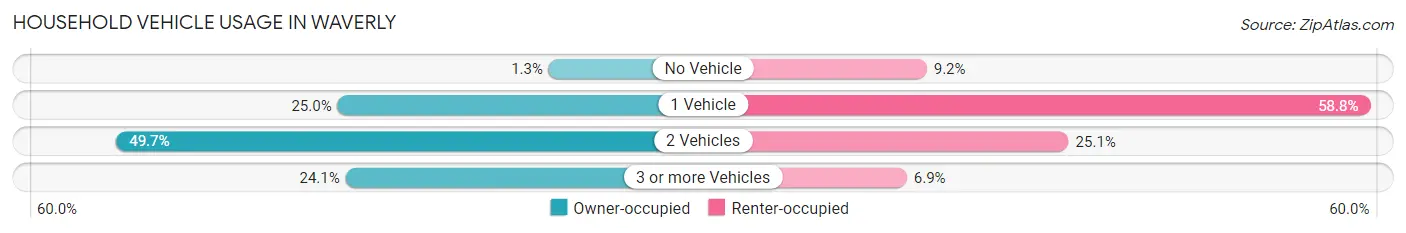
| Vehicles per Household | Owner-occupied | Renter-occupied |
| No Vehicle | 37 (1.3%) | 82 (9.2%) |
| 1 Vehicle | 722 (24.9%) | 526 (58.8%) |
| 2 Vehicles | 1,439 (49.7%) | 224 (25.1%) |
| 3 or more Vehicles | 696 (24.0%) | 62 (6.9%) |
| Total | 2,894 (100.0%) | 894 (100.0%) |
Real Estate & Mortgages in Waverly
Real Estate and Mortgage Overview in Waverly
| Characteristic | Without Mortgage | With Mortgage |
| Housing Units | 1,198 | 1,696 |
| Median Property Value | $211,100 | $210,800 |
| Median Household Income | $72,051 | $345 |
| Monthly Housing Costs | $635 | $52 |
| Real Estate Taxes | $3,500 | $16 |
Property Value by Mortgage Status in Waverly
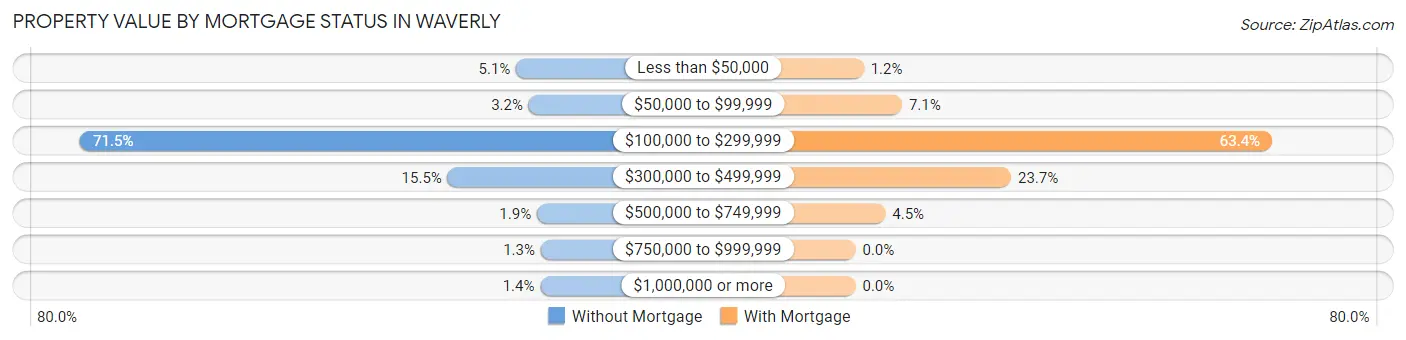
| Property Value | Without Mortgage | With Mortgage |
| Less than $50,000 | 61 (5.1%) | 21 (1.2%) |
| $50,000 to $99,999 | 38 (3.2%) | 120 (7.1%) |
| $100,000 to $299,999 | 857 (71.5%) | 1,076 (63.4%) |
| $300,000 to $499,999 | 186 (15.5%) | 402 (23.7%) |
| $500,000 to $749,999 | 23 (1.9%) | 77 (4.5%) |
| $750,000 to $999,999 | 16 (1.3%) | 0 (0.0%) |
| $1,000,000 or more | 17 (1.4%) | 0 (0.0%) |
| Total | 1,198 (100.0%) | 1,696 (100.0%) |
Household Income by Mortgage Status in Waverly
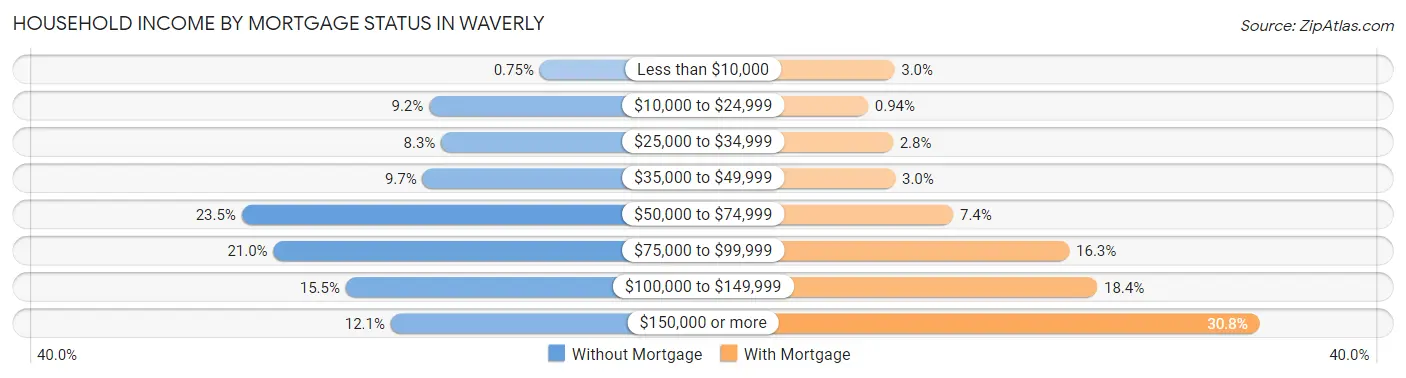
| Household Income | Without Mortgage | With Mortgage |
| Less than $10,000 | 9 (0.7%) | 50 (2.9%) |
| $10,000 to $24,999 | 110 (9.2%) | 16 (0.9%) |
| $25,000 to $34,999 | 99 (8.3%) | 48 (2.8%) |
| $35,000 to $49,999 | 116 (9.7%) | 51 (3.0%) |
| $50,000 to $74,999 | 281 (23.5%) | 126 (7.4%) |
| $75,000 to $99,999 | 252 (21.0%) | 276 (16.3%) |
| $100,000 to $149,999 | 186 (15.5%) | 312 (18.4%) |
| $150,000 or more | 145 (12.1%) | 522 (30.8%) |
| Total | 1,198 (100.0%) | 1,696 (100.0%) |
Property Value to Household Income Ratio in Waverly
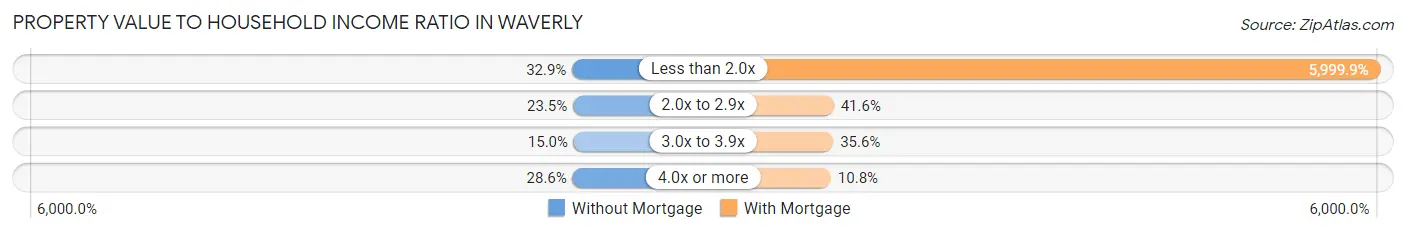
| Value-to-Income Ratio | Without Mortgage | With Mortgage |
| Less than 2.0x | 394 (32.9%) | 101,759 (5,999.9%) |
| 2.0x to 2.9x | 282 (23.5%) | 705 (41.6%) |
| 3.0x to 3.9x | 180 (15.0%) | 603 (35.5%) |
| 4.0x or more | 342 (28.5%) | 183 (10.8%) |
| Total | 1,198 (100.0%) | 1,696 (100.0%) |
Real Estate Taxes by Mortgage Status in Waverly
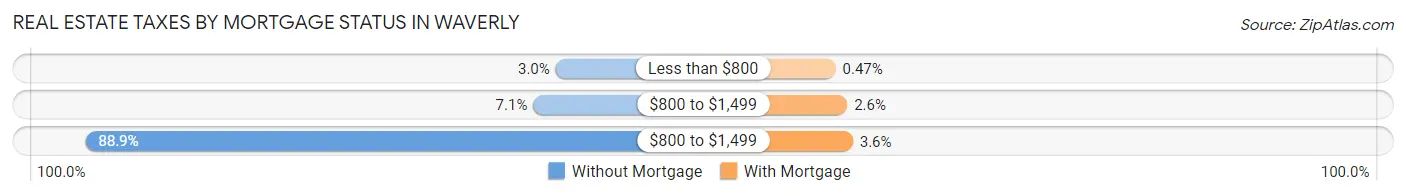
| Property Taxes | Without Mortgage | With Mortgage |
| Less than $800 | 36 (3.0%) | 8 (0.5%) |
| $800 to $1,499 | 85 (7.1%) | 44 (2.6%) |
| $800 to $1,499 | 1,065 (88.9%) | 61 (3.6%) |
| Total | 1,198 (100.0%) | 1,696 (100.0%) |
Health & Disability in Waverly
Health Insurance Coverage by Age in Waverly
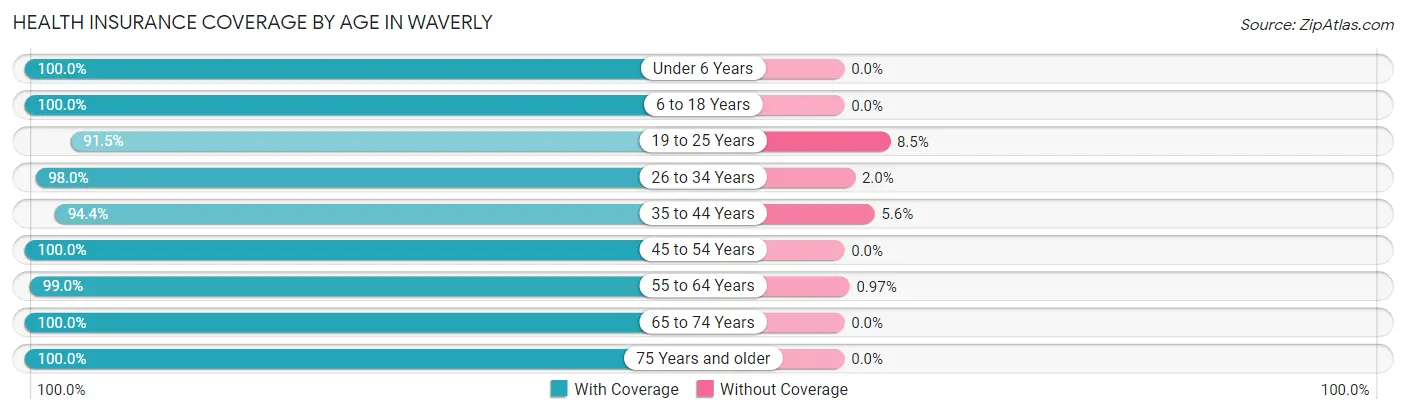
| Age Bracket | With Coverage | Without Coverage |
| Under 6 Years | 672 (100.0%) | 0 (0.0%) |
| 6 to 18 Years | 1,708 (100.0%) | 0 (0.0%) |
| 19 to 25 Years | 1,686 (91.5%) | 157 (8.5%) |
| 26 to 34 Years | 985 (98.0%) | 20 (2.0%) |
| 35 to 44 Years | 1,107 (94.4%) | 66 (5.6%) |
| 45 to 54 Years | 850 (100.0%) | 0 (0.0%) |
| 55 to 64 Years | 1,025 (99.0%) | 10 (1.0%) |
| 65 to 74 Years | 999 (100.0%) | 0 (0.0%) |
| 75 Years and older | 911 (100.0%) | 0 (0.0%) |
| Total | 9,943 (97.5%) | 253 (2.5%) |
Health Insurance Coverage by Citizenship Status in Waverly
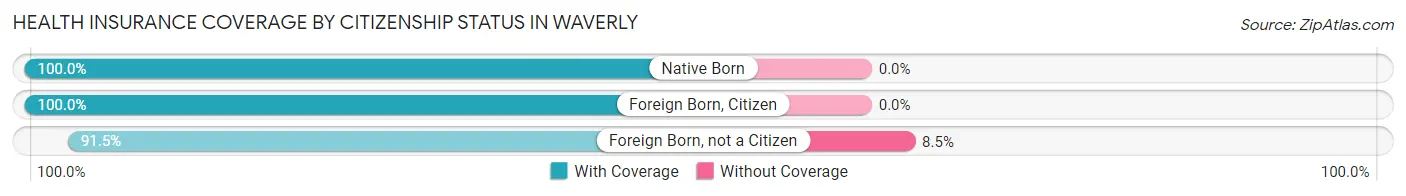
| Citizenship Status | With Coverage | Without Coverage |
| Native Born | 672 (100.0%) | 0 (0.0%) |
| Foreign Born, Citizen | 1,708 (100.0%) | 0 (0.0%) |
| Foreign Born, not a Citizen | 1,686 (91.5%) | 157 (8.5%) |
Health Insurance Coverage by Household Income in Waverly
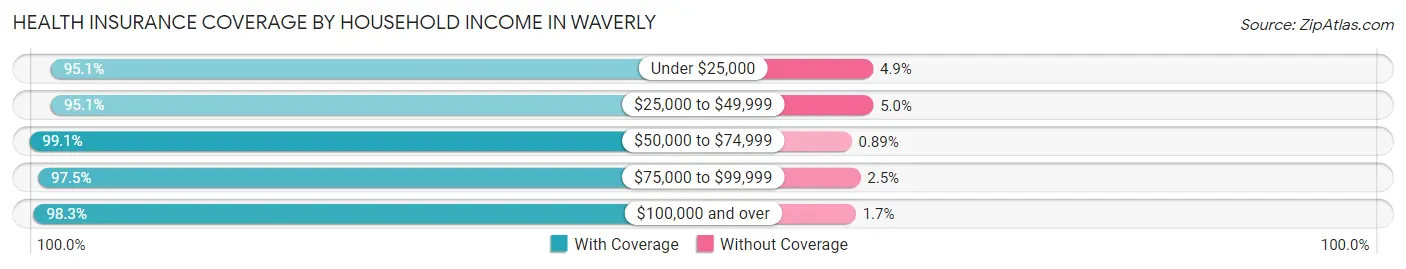
| Household Income | With Coverage | Without Coverage |
| Under $25,000 | 776 (95.1%) | 40 (4.9%) |
| $25,000 to $49,999 | 1,266 (95.1%) | 66 (5.0%) |
| $50,000 to $74,999 | 1,339 (99.1%) | 12 (0.9%) |
| $75,000 to $99,999 | 1,496 (97.5%) | 39 (2.5%) |
| $100,000 and over | 3,878 (98.3%) | 66 (1.7%) |
Public vs Private Health Insurance Coverage by Age in Waverly
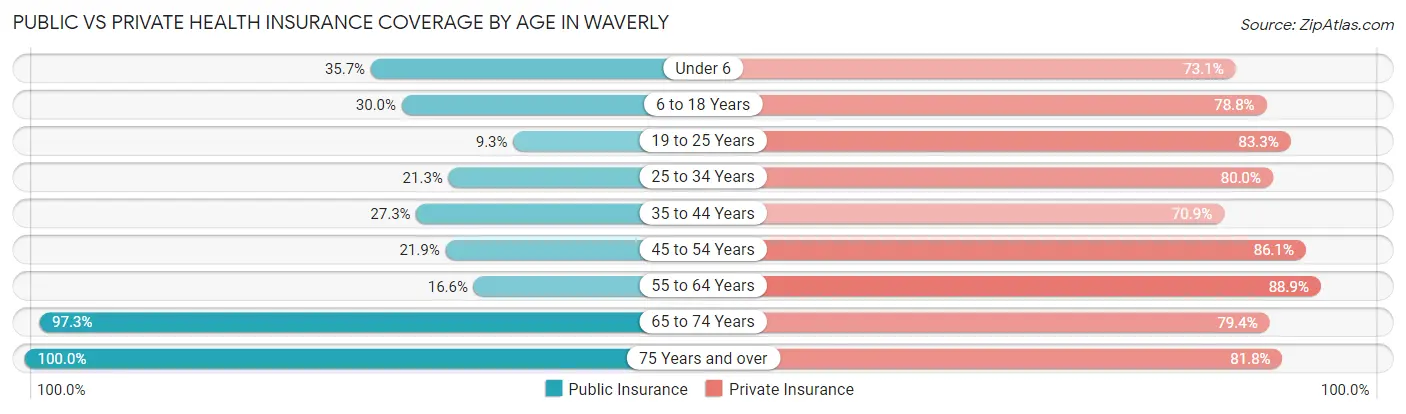
| Age Bracket | Public Insurance | Private Insurance |
| Under 6 | 240 (35.7%) | 491 (73.1%) |
| 6 to 18 Years | 512 (30.0%) | 1,346 (78.8%) |
| 19 to 25 Years | 171 (9.3%) | 1,535 (83.3%) |
| 25 to 34 Years | 214 (21.3%) | 804 (80.0%) |
| 35 to 44 Years | 320 (27.3%) | 832 (70.9%) |
| 45 to 54 Years | 186 (21.9%) | 732 (86.1%) |
| 55 to 64 Years | 172 (16.6%) | 920 (88.9%) |
| 65 to 74 Years | 972 (97.3%) | 793 (79.4%) |
| 75 Years and over | 911 (100.0%) | 745 (81.8%) |
| Total | 3,698 (36.3%) | 8,198 (80.4%) |
Disability Status by Sex by Age in Waverly
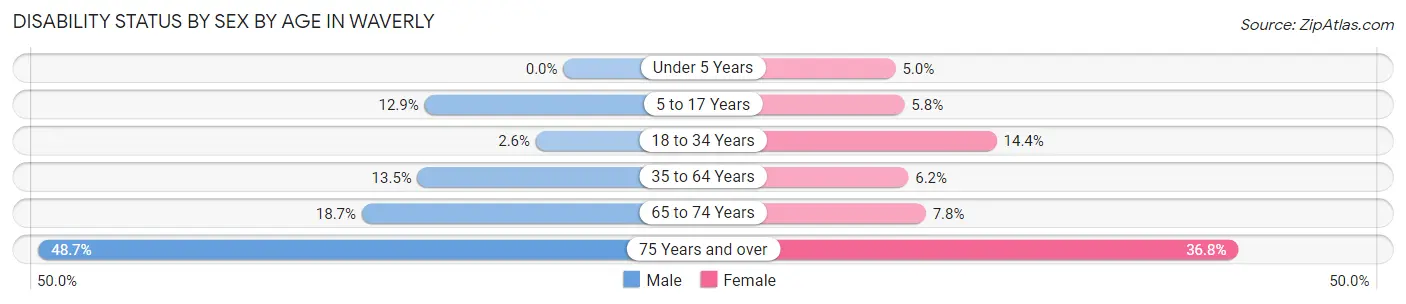
| Age Bracket | Male | Female |
| Under 5 Years | 0 (0.0%) | 14 (5.0%) |
| 5 to 17 Years | 84 (12.9%) | 51 (5.8%) |
| 18 to 34 Years | 42 (2.5%) | 215 (14.4%) |
| 35 to 64 Years | 192 (13.5%) | 101 (6.2%) |
| 65 to 74 Years | 86 (18.7%) | 42 (7.8%) |
| 75 Years and over | 171 (48.7%) | 206 (36.8%) |
Disability Class by Sex by Age in Waverly
Disability Class: Hearing Difficulty
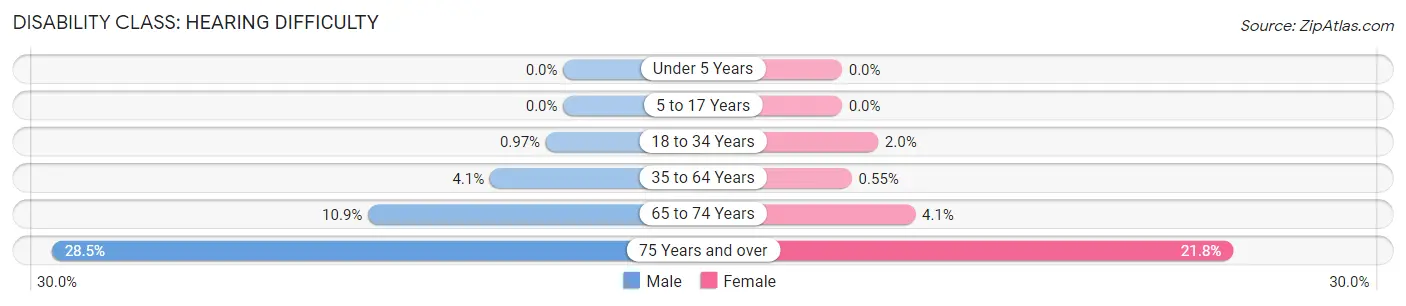
| Age Bracket | Male | Female |
| Under 5 Years | 0 (0.0%) | 0 (0.0%) |
| 5 to 17 Years | 0 (0.0%) | 0 (0.0%) |
| 18 to 34 Years | 16 (1.0%) | 30 (2.0%) |
| 35 to 64 Years | 58 (4.1%) | 9 (0.5%) |
| 65 to 74 Years | 50 (10.9%) | 22 (4.1%) |
| 75 Years and over | 100 (28.5%) | 122 (21.8%) |
Disability Class: Vision Difficulty
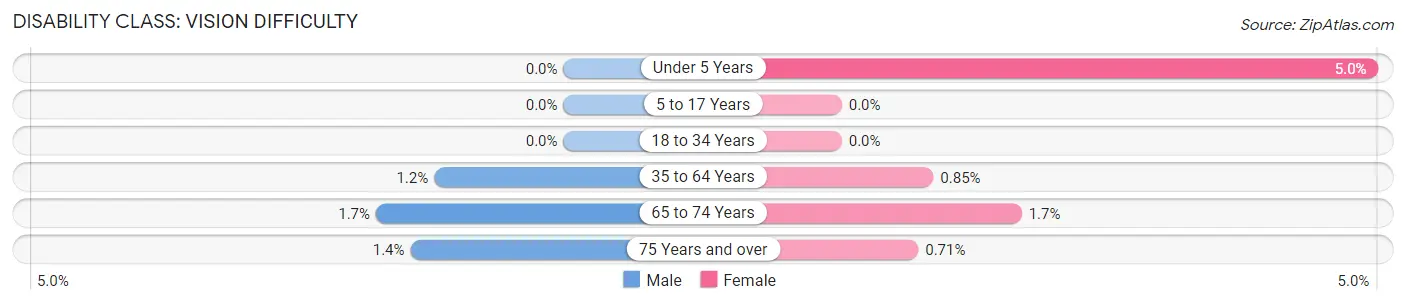
| Age Bracket | Male | Female |
| Under 5 Years | 0 (0.0%) | 14 (5.0%) |
| 5 to 17 Years | 0 (0.0%) | 0 (0.0%) |
| 18 to 34 Years | 0 (0.0%) | 0 (0.0%) |
| 35 to 64 Years | 17 (1.2%) | 14 (0.9%) |
| 65 to 74 Years | 8 (1.7%) | 9 (1.7%) |
| 75 Years and over | 5 (1.4%) | 4 (0.7%) |
Disability Class: Cognitive Difficulty
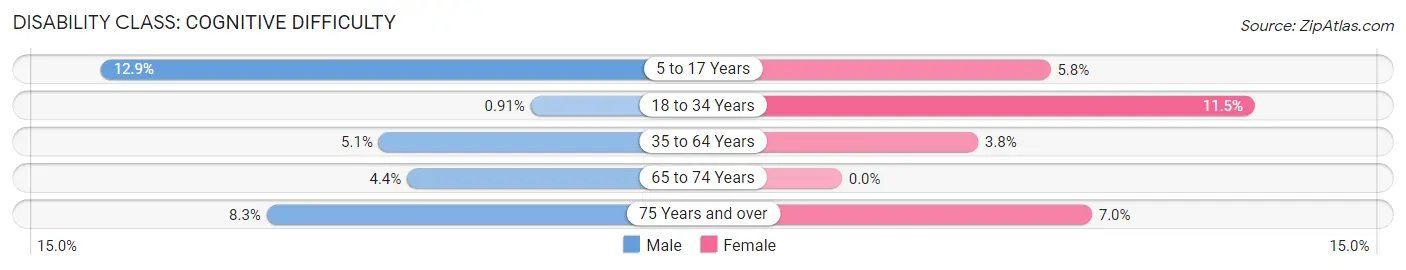
| Age Bracket | Male | Female |
| 5 to 17 Years | 84 (12.9%) | 51 (5.8%) |
| 18 to 34 Years | 15 (0.9%) | 172 (11.5%) |
| 35 to 64 Years | 73 (5.1%) | 62 (3.8%) |
| 65 to 74 Years | 20 (4.3%) | 0 (0.0%) |
| 75 Years and over | 29 (8.3%) | 39 (7.0%) |
Disability Class: Ambulatory Difficulty
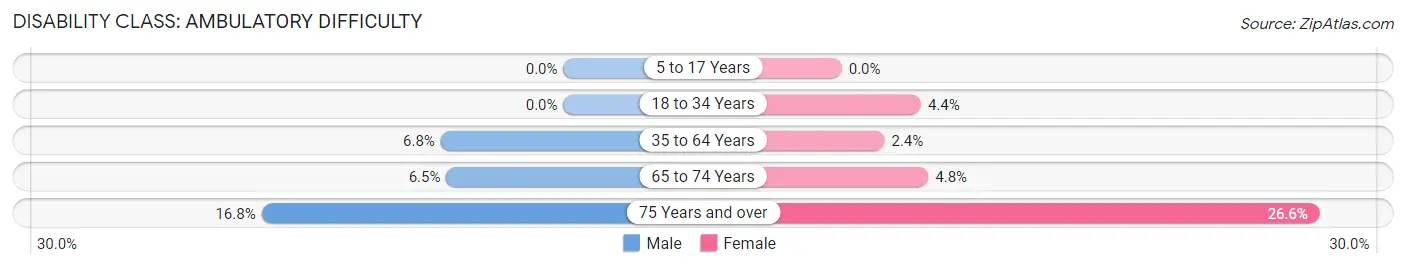
| Age Bracket | Male | Female |
| 5 to 17 Years | 0 (0.0%) | 0 (0.0%) |
| 18 to 34 Years | 0 (0.0%) | 66 (4.4%) |
| 35 to 64 Years | 97 (6.8%) | 39 (2.4%) |
| 65 to 74 Years | 30 (6.5%) | 26 (4.8%) |
| 75 Years and over | 59 (16.8%) | 149 (26.6%) |
Disability Class: Self-Care Difficulty
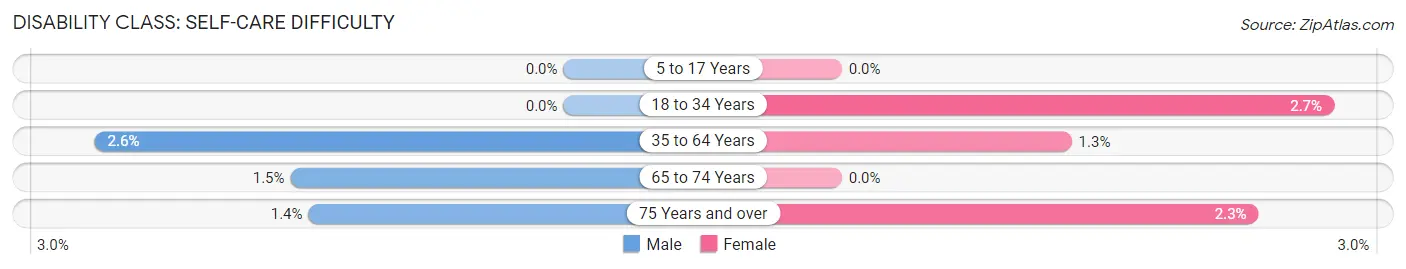
| Age Bracket | Male | Female |
| 5 to 17 Years | 0 (0.0%) | 0 (0.0%) |
| 18 to 34 Years | 0 (0.0%) | 41 (2.7%) |
| 35 to 64 Years | 37 (2.6%) | 21 (1.3%) |
| 65 to 74 Years | 7 (1.5%) | 0 (0.0%) |
| 75 Years and over | 5 (1.4%) | 13 (2.3%) |
Technology Access in Waverly
Computing Device Access in Waverly
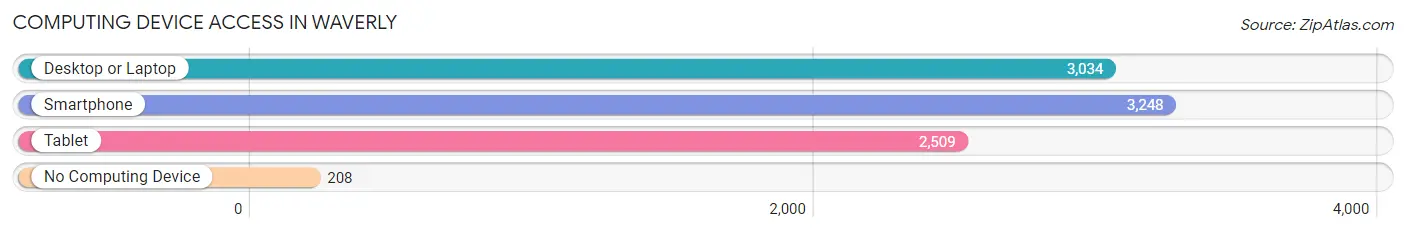
| Device Type | # Households | % Households |
| Desktop or Laptop | 3,034 | 80.1% |
| Smartphone | 3,248 | 85.7% |
| Tablet | 2,509 | 66.2% |
| No Computing Device | 208 | 5.5% |
| Total | 3,788 | 100.0% |
Internet Access in Waverly
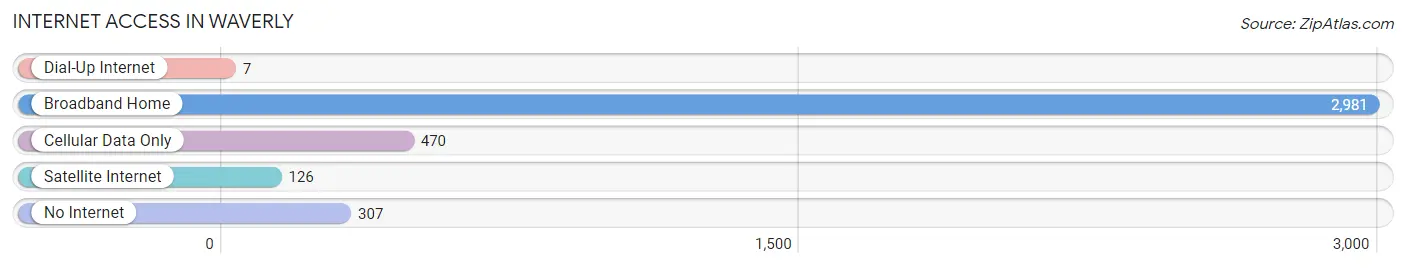
| Internet Type | # Households | % Households |
| Dial-Up Internet | 7 | 0.2% |
| Broadband Home | 2,981 | 78.7% |
| Cellular Data Only | 470 | 12.4% |
| Satellite Internet | 126 | 3.3% |
| No Internet | 307 | 8.1% |
| Total | 3,788 | 100.0% |
Waverly Summary
Waverly, Iowa is a city located in Bremer County, Iowa, United States. It is the county seat of Bremer County and is located along the Cedar River. The population was 9,874 at the 2010 census.
History
Waverly was founded in 1853 by a group of settlers from Waverly, New York. The city was named after the New York town, which was in turn named after Sir Walter Scott's novel Waverley. The first settlers arrived in the area in 1851 and the city was officially incorporated in 1857.
The city was a major stop on the Chicago, Milwaukee, St. Paul and Pacific Railroad, which was built in 1864. The railroad brought many new settlers to the area and helped to spur the growth of the city.
In the late 19th century, Waverly was a major center for the lumber industry. The city was home to several sawmills and lumber yards, which provided employment for many of the city's residents.
Geography
Waverly is located at 42°43'25" North, 92°25'45" West (42.723, -92.429). According to the United States Census Bureau, the city has a total area of 5.2 square miles (13.4 km2), all of it land.
The city is located along the Cedar River, which flows through the city and is a major source of recreation for the area. The city is also located near the Bremer County Fairgrounds, which hosts a variety of events throughout the year.
Economy
The economy of Waverly is largely based on agriculture and manufacturing. The city is home to several large manufacturing companies, including John Deere, Waverly Plastics, and Waverly Industries.
Agriculture is also an important part of the local economy. The city is home to several large farms, which produce a variety of crops, including corn, soybeans, and hay.
Demographics
As of the 2010 census, there were 9,874 people, 3,945 households, and 2,541 families residing in the city. The population density was 1,902.3 people per square mile (732.7/km2). There were 4,093 housing units at an average density of 793.3 per square mile (306.3/km2). The racial makeup of the city was 95.2% White, 0.7% African American, 0.3% Native American, 0.7% Asian, 0.1% Pacific Islander, 1.7% from other races, and 1.3% from two or more races. Hispanic or Latino of any race were 3.7% of the population.
There were 3,945 households, out of which 30.2% had children under the age of 18 living with them, 48.2% were married couples living together, 11.3% had a female householder with no husband present, and 36.2% were non-families. 30.7% of all households were made up of individuals, and 14.2% had someone living alone who was 65 years of age or older. The average household size was 2.41 and the average family size was 3.00.
In the city, the population was spread out, with 25.2% under the age of 18, 8.2% from 18 to 24, 26.2% from 25 to 44, 22.3% from 45 to 64, and 18.1% who were 65 years of age or older. The median age was 38 years. For every 100 females, there were 91.2 males. For every 100 females age 18 and over, there were 87.2 males.
The median income for a household in the city was $41,945, and the median income for a family was $51,945. Males had a median income of $36,945 versus $25,945 for females. The per capita income for the city was $20,945. About 5.2% of families and 7.2% of the population were below the poverty line, including 8.2% of those under age 18 and 6.2% of those age 65 or over.
Common Questions
What is Per Capita Income in Waverly?
Per Capita income in Waverly is $41,234.
What is the Median Family Income in Waverly?
Median Family Income in Waverly is $97,188.
What is the Median Household income in Waverly?
Median Household Income in Waverly is $78,278.
What is Income or Wage Gap in Waverly?
Income or Wage Gap in Waverly is 30.6%.
Women in Waverly earn 69.4 cents for every dollar earned by a man.
What is Inequality or Gini Index in Waverly?
Inequality or Gini Index in Waverly is 0.48.
What is the Total Population of Waverly?
Total Population of Waverly is 10,399.
What is the Total Male Population of Waverly?
Total Male Population of Waverly is 4,916.
What is the Total Female Population of Waverly?
Total Female Population of Waverly is 5,483.
What is the Ratio of Males per 100 Females in Waverly?
There are 89.66 Males per 100 Females in Waverly.
What is the Ratio of Females per 100 Males in Waverly?
There are 111.53 Females per 100 Males in Waverly.
What is the Median Population Age in Waverly?
Median Population Age in Waverly is 33.5 Years.
What is the Average Family Size in Waverly
Average Family Size in Waverly is 2.8 People.
What is the Average Household Size in Waverly
Average Household Size in Waverly is 2.4 People.
How Large is the Labor Force in Waverly?
There are 5,567 People in the Labor Forcein in Waverly.
What is the Percentage of People in the Labor Force in Waverly?
65.3% of People are in the Labor Force in Waverly.
What is the Unemployment Rate in Waverly?
Unemployment Rate in Waverly is 2.7%.